RAISING THE STANDARD: MINIMUM WAGES AND FIRM PRODUCTIVITY wages and... · 4 2. Theory and evidence...
36
0 RAISING THE STANDARD: MINIMUM WAGES AND FIRM PRODUCTIVITY REBECCA RILEY AND CHIARA ROSAZZA BONDIBENE NIESR DISCUSSION PAPER NO. 449
Transcript of RAISING THE STANDARD: MINIMUM WAGES AND FIRM PRODUCTIVITY wages and... · 4 2. Theory and evidence...

0
RAISING THE STANDARD:
MINIMUM WAGES AND FIRM PRODUCTIVITY
REBECCA RILEY AND CHIARA ROSAZZA BONDIBENE
NIESR DISCUSSION PAPER NO. 449
1
Raising the standard:
Minimum wages and firm productivity1
Rebecca Riley and Chiara Rosazza Bondibene
National Institute of Economic and Social Research and Centre For Macroeconomics
May 2015
Abstract
This paper exploits the introduction of the National Minimum Wage (NMW) in Britain and subsequent increases in the NMW to identify the effects of minimum wages on productivity. We find that the NMW increased average labour costs for companies that tend to employ low paid workers, both upon the introduction of the NMW and more recently following the Great Recession when many workers experienced pay freezes or wage cuts, but the NMW continued to rise. We find evidence to suggest that companies responded to these increases in labour costs by raising labour productivity. These labour productivity changes did not come about via a reduction in firms' workforce or via capital-labour substitution. Rather they were associated with increases in total factor productivity, consistent with organisational change, training and efficiency wage responses to increased labour costs from minimum wages.
Key words: minimum wage, labour costs, productivity, firm behaviour
JEL codes: J08, J31, J38, L25
1 Disclaimer: This work contains statistical data which is Crown Copyright; it has been made available by
the Office for National Statistics (ONS) through the Secure Data Service (SDS) and has been used by permission. Neither the ONS or SDS bear any responsibility for the analysis or interpretation of the data reported here. This work uses research datasets which may not exactly reproduce National Statistics aggregates.
Acknowledgements: The financial support of the Low Pay Commission and the Economic and Social Research Council grant reference ES/K00378X/1 is gratefully acknowledged. The authors thank Michele Bernini, Tim Butcher, Mirko Draca, Richard Dickens, Geraint Johnes, Stephen Machin, Tony Studd and participants at Low Pay Commission Research Workshops and the Work and Pensions Economics Group conference in Sheffield for comment and discussion; the UK Data Service Secure Access Team for support in using ONS business microdata; and Richard Harris for making available his ARD capital stock data. This paper is based on the authors' research report for the Low Pay Commission (2015).
Correspondence: National Institute of Economic and Social Research, 2 Dean Trench Street, Smith Square, London SW1P 3HE; Tel.: +44-207-222-7665; fax: +44-207-654-1900
E-mail: [email protected]; [email protected]

2
1. Introduction Standard neo-classical theory predicts that minimum wage floors will reduce labour
demand, but to date the empirical literature continues to debate whether in practice
this actually occurs (see e.g. Neumark, Salas and Wascher, 2014; Ropponen, 2011).
In the UK the large number of studies examining the employment impacts of the
National Minimum Wage (NMW) suggest that labour demand has remained broadly
unchanged despite this legislated rise in earnings for the lowest paid (see e.g.
Stewart, 2004a,b; Dickens, Riley and Wilkinson, 2012; Dolton, Rosazza Bondibene
and Wadsworth 2010, 2012; Dolton, Rosazza Bondibene and Stops, 2015).2 This
paper suggests that one of the reasons the employment impacts of the NMW have
been muted is that firms managed to contain unit labour costs through increases in
the efficiency of production.
There are several reasons to believe that minimum wages may increase labour
productivity (see e.g. Metcalf, 2008). Because minimum wages increase the cost of
labour, companies might move towards more capital-intensive forms of production
and may implement organisational changes or offer training in an attempt to
improve efficiency. Workers may exude more effort in return for a higher wage and
this higher wage might also reduce employee turnover. Regardless these potential
linkages and calls for research3, the productivity effects of minimum wages remain
relatively underexplored.
The effects of minimum wages on companies' productivity is now examined in this
paper. We find that the NMW increased average labour costs for companies that on
average paid low wages and that tended to employ low paid workers. These effects
were evident upon the introduction of the NMW in 1999, but also during the 2000s
when the NMW was rising faster than average wages and after the financial crisis of
2007/8, a time when many workers experienced nominal wage cuts (Gregg, Machin
and Fernández-Salgrado, 2014) and the NMW would have prevented downward
wage adjustments for some workers. Our analysis also finds a positive and
significant association between the NMW and firm productivity. We report evidence
that suggests increases in firms' average labour costs due to the NMW were
accompanied by increases in firm labour productivity and total factor productivity,
2 There is some evidence that the introduction of the NMW led to a reduction in the average hours worked
of the lowest paid, particularly for men (Stewart & Swaffield, 2008), and led to a small reduction in
employment retention for female part-time workers (Dickens, Riley and Wilkinson, forthcoming). 3 Card and Krueger (1995).

3
both when the NMW was introduced and later when the NMW sustained nominal
wages for low paid workers during and after the Great Recession.
In the period before the NMW was introduced we find no evidence of relative labour
cost or productivity increases for firms that paid low wages. Nor do we find
evidence of these effects for firms that paid better wages and that therefore should
have been less affected by the NMW. Our results are not driven by any effects of the
NMW on company exits. This paper therefore demonstrates a credible and
significant positive link between minimum wages and firm productivity. Our
findings are consistent with organisational change, efficiency wage and training
responses to increased labour costs from minimum wages. The effects we find
during and after the recession of 2008/9 underline the importance of downward
wage flexibility in allowing productivity growth to falter further than it might
otherwise have done.
We examine the impacts of the NMW following in broad terms the approach in
Draca et al. (2005, 2011). This is a difference-in-differences approach applied to
firm level data. The basic idea is to look at a group of firms that were more affected
by the introduction of the NMW and its subsequent up-ratings (treatment group)
than a comparison set of firms (control group). By more affected we mean where
labour costs rose by more due to the imposition of and increases in the wage floor.
Firms are allocated to treatment and control groups according to their average
labour costs before the policy change. This quasi-experimental setting enables us to
compare what happened to labour costs and productivity before and after the
introduction/uprating of the NMW in low wage firms to what happened to these
outcomes across the same period for a comparison group of firms whose labour
costs were not affected by the NMW.
The paper is structured as follows. Section 2 reviews theory and evidence
concerning minimum wages and productivity. Section 3 describes our research
methods. Section 4 details the data we use. Section 5 then explores the relationship
between the NMW and firms' average labour costs, which underpins our evaluation
methodology. Results are presented in section 6. Section 7 summarises and
concludes.

4
2. Theory and evidence on minimum wages and productivity
Minimum wages may increase labour productivity if they cause firms to substitute
away from labour towards other factors of production such as capital because the
relative cost of labour increases with the policy. They may also increase total factor
productivity (TFP) if they induce firms to invest in unmeasured intangible assets
such as training and organisational capital. For example, minimum wages may
create incentives for firms to offer more training for their employees, particularly in
monopsony labour markets where employers accrue rents from training provision
(see e.g. the discussion in Acemoglu and Pischke, 1999), and implement
organisational changes such as tighter human resource practices, increased
performance standards at work, and better management practices (e.g. as in Lester,
1964; and as in the institutional theory of Brosnan, 2003; Kaufman, 2010; and
Osterman, 2011). Alternatively, productivity increases may simply come about
through increased worker effort in response to receiving a better wage (e.g. as in the
shirking model of Shapiro & Stiglitz, 1984, or the gift exchange model of Akerlof,
1982).
A number of studies consider specific channels through which an increase in a
minimum wage might lead to an increase in labour productivity. In a small case
study of quick service restaurants in Georgia and Alabama, Hirsch, Kaufman and
Zelenska (2011) analyse detailed payroll data and also survey managers and
employees about human resource practices. The authors found no negative effect
from the minimum wage increase on employment or hours worked. Managers
reported that they could offset the labour cost increase through operational
efficiencies and human resource practices. There is some evidence to suggest
minimum wages might lead to increases in employer provided training.
Arulampalam et al. (2004), using a difference-in-difference technique with
longitudinal data found no indication that the introduction of the NMW in Britain
reduced the training of affected workers and some evidence that it rather increased
it. It is difficult to find direct evidence on the relationship between minimum wages
and worker effort. Using a standard natural experiment design Georgiadis (2013)
suggests that the NMW may have operated as an efficiency wage in the care homes
sector, leading to a reduction in the level of worker supervision required.
Experimental evidence (Owens and Kagel, 2010) points to a positive relationship
between worker effort and minimum wages. Other research finds that minimum
wages can reduce the high levels of job churning that characterize low-wage labour

5
markets. Dube, Lester and Reich (forthcoming) find that an increase in the minimum
wage results in a reduction in turnover for teens and restaurant workers in the US.
Also, Dube, Naidu and Reich (2007) find an increase in the average tenure of
workers in limited-service restaurants in San Francisco.
These studies provide some evidence in support of a positive link between
minimum wages and labour productivity, but fall short of demonstrating this link
explicitly. A few studies explore the link between productivity and minimum wages
directly using larger firm level datasets; the resulting evidence is not conclusive. In a
research report for the Low Pay Commission (LPC) Galindo-Rueda and Pereira
(2004) studied the impact of the introduction of the NMW on firms' productivity
using linked employee-employer data. They link employees in the Annual Survey of
Hours and Earnings (ASHE) (by firm identifier or by sector/region) to employers in
the Annual Respondents Database (ARD) and find some evidence that low-paying
service sector firms reduced hiring and increased labour productivity. A key
limitation of their study is that because the ASHE only ever represents 1% of a
particular firm's workers, it is only possible to derive meaningful indicators of
exposure to the NMW for very large firms. Linking the ASHE to the ARD by sector
and region instead allowed them to generate an indicator of exposure for the
business population more generally but, by construction, this cannot be a very
precise measure of a firm's exposure to the NMW.
Draca et al. (2005, 2011) got round this issue by using average labour costs to
differentiate between firms that were likely to be affected by the NMW and firms
that were not. Importantly, they (Draca et al., 2011) show a correlation between
average wages paid by the firm and the proportion of low-paid workers in a firm’s
workforce, suggesting that average wages are a means of identifying NMW
exposure. The Draca et al. papers looked at companies who filed consolidated
accounts to study the impact of the introduction of the NMW and very early
upratings on firms’ profits. They briefly consider other outcomes such as labour
productivity. They find a positive association between the policy and this variable,
although it is not significant.
In another research report to the LPC Rizov and Croucher (2011) use
unconsolidated company accounts data and, applying a similar methodology to that
in Draca et al. (2005, 2011), consider the entire period 1999-2009. They find that
labour costs and productivity increased substantially more amongst low paying

6
firms (widespread across size bands and low pay sectors) than other firms in the
post NMW period. However, they provide little supporting evidence to link these
effects to the NMW.
In contrast with some previous studies, our sample includes firms in the whole
market sector, comprising those most likely to be affected by the policy. We carry
out a number of falsification tests to evaluate the robustness of our results and
conduct sensitivity tests on alternate datasets. We consider the labour productivity
effects of the NMW but also test whether the positive effects are driven by
employment, capital labour substitution or total factor productivity changes. Finally,
we examine these effects around the introduction of the NMW, which provides a
useful experimental setting, but also examine whether firm behaviour in response to
the NMW changed with the onset of recession in 2008. This is of particular interest
as there is relatively little evidence available on the impact of the NMW on
companies during a period of general economic weakness.
3. Methodology
To estimate the impact of the NMW on firm productivity we follow previous work in
this area in applying a difference-in-differences estimator to firm-level data. This
involves selecting a set of companies that were likely to be affected by the NMW, i.e.
with a high share of low paid workers, from a period before the NMW change and
then tracking the outcomes of these companies in the period after the policy change.
The change over time in outcomes for companies in this treatment group is then
compared to the same for a different set of companies (the control group) who are
less likely to have been affected by the policy change. As in Draca et al. (2005, 2011)
we use average labour costs to distinguish between treatment and control firms.
Here it is crucial that average labour costs capture differences across firms in their
exposure to the NMW. We return to this in section 5.
More formally we estimate the impact of the NMW in a standard difference-in-
differences framework as shown in equation (1), where p=0 refers to the period
before the introduction/uprating of the NMW and p=1 refers to the period after the
introduction/uprating of the NMW.
(1)
7
In this set-up is the outcome of interest for firm i at time t. is a dummy
variable equal to one if the firm is in the treatment group and zero otherwise.
is a dummy variable equal to one if p=1, i.e. if the policy change has taken place, and
zero otherwise. The are controls for firm characteristics intended to net out
differences between firms unrelated to the NMW. is an error term and the rest
are parameters to be estimated. In this equation measures the impact of the
introduction/uprating of the NMW on outcome .
Crucial to the validity of this identification strategy is the underlying assumption
that labour costs or productivity would have changed in the same way over time for
the treatment and control firms in the absence of any NMW change. This is the
common trends assumption. To evaluate the likelihood that in equation (1) is not
picking up some other differential development in outcomes between the two
groups of firm, unrelated to the NMW, we carry out a number of falsification tests.
First, we estimate the same models on a pre-NMW period during the mid-1990s.4 If
we detect non-zero "policy effects" when the policy is not in place this casts doubt
on the validity of the identification strategy. We are unable to carry out this
falsification test with the ARD because these data are generally not available before
1997. Second, we choose two groups of firms from further up the distribution of
average labour costs. These are chosen to be sufficiently high up the distribution
that it is very unlikely that either group should be affected by the NMW. Again, if we
detect "policy effects" for these groups that should be unaffected by the NMW then
this casts doubt on the validity of the identification strategy.
We estimate the model in equation (1) using longitudinal information on companies
in FAME (company accounts data), but also consider longitudinal information on
enterprises in the ARD. The longitudinal information on firms is preferable to using
repeated cross sections of firms because of the substantial heterogeneity in
behaviour across firms and because selection for the treatment group after the
NMW change, necessary in repeated cross section models, will depend on the effect
of the NMW change on wages. We use a balanced panel as opposed to an unbalanced
panel so that we compare the same firms before and after the policy change. This
avoids biases arising from differences in business survival rates between the
treatment and control firms. It does not avoid biases associated with potential NMW
4 Draca et al. (2011) do this for wages and profits, but for a different sample of companies, a slightly
different estimator, and not for the productivity outcomes that we consider here.

8
effects on business survival rates, although these are likely to be less severe in a
balanced than an unbalanced panel. Therefore in assessing the robustness of our
findings we examine the effect of the NMW on business and sample exit rates.
We estimate equation (1) for three separate periods: the introduction of the NMW
up to 2002; an intermediate phase from 2003 to 2006 when annual increases in the
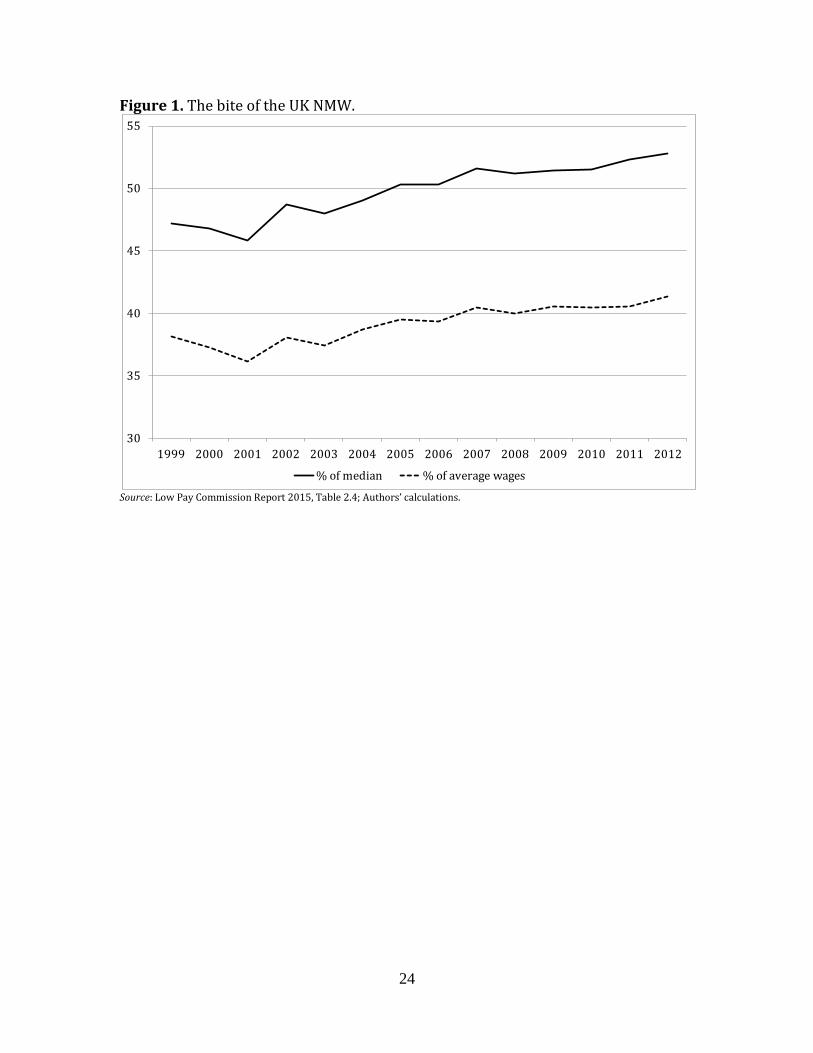
NMW were relatively generous so that the "bite" of the NMW was rising (see Figure
1); and the years after the financial crisis from 2009 to 2012 when UK economic
growth stagnated and nominal pay cuts and freezes became common. For the latter
two periods that we consider, outcomes in the pre-policy years used to benchmark
the difference in performance between the treatment and control groups after the
policy change may of course be affected by the fact that the NMW is already in place.
Therefore these impact estimates measure the effect on businesses of the change in
the NMW between the before and after periods, rather than the effect of the NMW
against a counterfactual of no NMW. During the recession period our impact
estimate might also be interpreted as the difference between the impact of a given
wage floor during a period of slow economic growth and its impact in a period of
stable economic growth.5
4. Data
We use two business datasets for our analysis: FAME, a UK wide commercial dataset
available from Bureau van Dijk, and the ARD for Great Britain, incorporating one of
the key Office for National Statistics (ONS) business surveys used to inform
aggregate estimates of production activity for the National Accounts. Here we
briefly describe these data. Detailed definitions of the proxies we use for the
outcomes of interest are reported in Appendix A.
Financial Analysis Made Easy (FAME)
FAME contains financial data on the population of UK registered companies. In
comparison to other commercial datasets and/or ONS datasets, the availability of
data covering the 1990s before the introduction of the NMW, which can be used to
5 An alternative to estimating the impacts of the NMW over distinct time periods is to estimate equation (1)
over a longer time period, tracking outcomes for the cohort of companies selected in the year prior to
introduction of the NMW over this longer period. But, there are several reasons why this seems
inappropriate. In particular, the sample will shrink substantially and will become less representative of the
group of firms that are affected by the policy.

9
test the validity of the identification strategy and sample selection issues, the
coverage of non-listed companies and longitudinal data for some small companies is
useful. Drawbacks are that for many companies data items are missing, because
there are no reporting requirements. Reporting requirements are particularly light
for small companies.
We extract data on all companies who at some point during April 1 1993 and 31
March 2013 filed an account with Companies House. We retain for our main sample
accounts that cover turnover, profits, employment, remuneration, and fixed capital;
all of which we use to construct average labour cost and productivity related
measures. In order to ensure that all active companies are included in the data at
each point in time we extract this information from historical discs.6
FAME company data has previously been used by Draca et al. (2005, 2011) to study
the impacts of the NMW on firm profitability (and other outcomes; in the 2011
version), using data to 2002; and by Rizov and Croucher (2011) to estimate the
impact of the NMW on sectoral productivity for firms in different size groups, using
data to 2009. Draca et al. (2005, 2011) focus on consolidated accounts only; Rizov
and Croucher (2011) focus on unconsolidated accounts only. Consolidated accounts
may be filed by companies that operate in a group. Stand-alone companies more
typically file unconsolidated accounts. Thus, focusing on consolidated accounts only
leaves out many of the smaller and medium size companies that tend to be more
affected by the NMW (see discussion in Riley & Rosazza Bondibene, 2013). We
include both consolidated and unconsolidated accounts in order to retain sufficient
numbers of smaller companies, and use information on historical ownership
structures to delete all subsidiary accounts (where a single parent has at least 50%
control) to avoid double counting.
We exclude companies with less than 10 employees.7 We focus on market sector
companies in the non-agriculture and non-financial industries. Businesses in "non-
market" service sectors such as education, health and social work are excluded. This
6 This is important. The current vintage of the FAME data includes accounting records for the last decade
for all companies that were active at some point during the last 4 years. Key company characteristics and
ownership structures are not provided on an annual basis, but are provided as a recent snapshot. This means
that the historical sample is biased towards surviving firms and makes it difficult to identify ownership
structures at each point in time. Historical ownership structures are necessary in order to avoid double
counting company activity (e.g. when companies file group accounts). 7 In part for comparability with the ARD longitudinal information; data for these companies is often
missing and particularly noisy.

10
is because inputs and outputs are thought not to be directly comparable in these
sectors, making productivity analysis difficult to undertake. We also exclude
businesses in the mining and quarrying, and utilities sectors (typically very large
businesses with erratic patterns of output) and in the real estate sector, where
output mostly reflects imputed housing rents.
Annual Respondents Database (ARD)
The Annual Respondents Database (ARD) is an establishment level business survey
(or set of surveys) conducted by the ONS that is widely used in the study of firm
behaviour and productivity analysis in the UK. It enables us to assess the robustness
of the impact estimates obtained using FAME.
The ARD holds information on the nature of production in British businesses and is
essentially a census of larger establishments and a stratified (by industry, region
and employment size) random sample of establishments with less than 250
employees (SMEs). It covers businesses in the non-financial non-agriculture market
sectors, including the service industries which include the main low-paying sectors,
back to 1997. It is possible to use the data at both the establishment level and the
enterprise level. We undertake our analysis at the level of the enterprise, which
corresponds to the smallest legal unit in the ARD and hence the smallest unit with a
decision making capacity. The enterprise is also more comparable than the
establishment to the concept of a company that we use in FAME.
The sampling frame is the Inter-Departmental Business Register, a list of all UK
incorporated businesses and other businesses registered for tax purposes
(employee or sales taxes). Sampling probabilities in the ARD vary by size of firm. We
focus on the sample of firms with 10 or more employees. Due to sampling rules
there are very few of these micro businesses in the longitudinal data, despite their
significant presence in the economy.
In using the longitudinal data we are unable to create a balanced panel of firms with
annual observations as we do with the FAME data (except for large firms), because
once surveyed (for two consecutive years) firms are excluded from the sample for at

11
least a year and may not be included thereafter. Instead, we create a panel of firms
observed for two years at four year intervals8.
Other data
The ARD and FAME financial information is published in current values. GVA
deflators published by the ONS are used to construct real labour productivity values;
these are available at the 2- and sometimes the 3-digit sector level. They are also
used to construct a measure of real producer wages. Separately, in order to allocate
firms to the treatment and control groups, we deflate average labour costs with the
average earnings index, benchmarking low pay against average wages in the
economy.
We use the Workplace Employment Relations Study (WERS) 1998, 2004 and 2011
to map the link between the proportion of NMW workers in the firm and the firm's
average labour costs. For consistency across years, and as with the analysis of other
datasets, we exclude all micro establishments.
We link the Annual Survey of Hours and Earnings (ASHE), which provides detailed
and precise information on employees' wages for a sample of 1% of employees, by
firm identifier to the ARD in order to evaluate the distribution of firm average
labour costs for NMW workers and other workers.
5. NMW workers and firms' average labour costs
One of the main difficulties with firm-level analysis of NMW impacts is defining a
suitable set of firms to allocate to the treatment group (and the control group). We
follow Draca et al. (2005, 2011) and distinguish treated from untreated firms using
firm average labour costs, exploiting the concentration of NMW workers in low
average labour cost firms. We assume that those firms at the bottom of the
distribution of average labour costs per employee are more exposed to the NMW
and assign these to the treatment group. The control group is made up of firms from
further up the distribution of average labour costs per employee.
While Draca et al. (2011) show that low paid workers were concentrated in firms
with low average labour costs in 1998, right before the NMW was introduced, there
8 We truncate the top and the bottom 1% of the labour productivity and total labour costs distribution within
1-digit industry sectors in each annual survey. We also truncate the longitudinal data to eliminate further
outlying observations.

12
has been no research to verify whether this is also the case in later years. This is
important in this paper, where we also wish to assess the productivity impacts of
the NMW in later periods. Therefore we examine the link between minimum wage
workers and workplace average labour costs in later cross sections of WERS.
Furthermore, the WERS data holds information on relatively few employees per
firm (up to 25 randomly selected employees), and so it is possible that some of the
correlation detected between the prevalence of low paid workers and firm average
labour costs, calculated from the sample of employees in the firm, arises by
construction. For this reason we also look at the distribution of firm average labour
costs for two groups of workers in the ASHE, employees paid the NMW and
employees paid more than the NMW. If the distribution of employer average labour
costs across NMW workers lies significantly to the left of the distribution of
employer average labour costs across workers that are paid more than the NMW,
then this further validates the use of firm average labour costs as a means of
distinguishing between treatment and control firms.
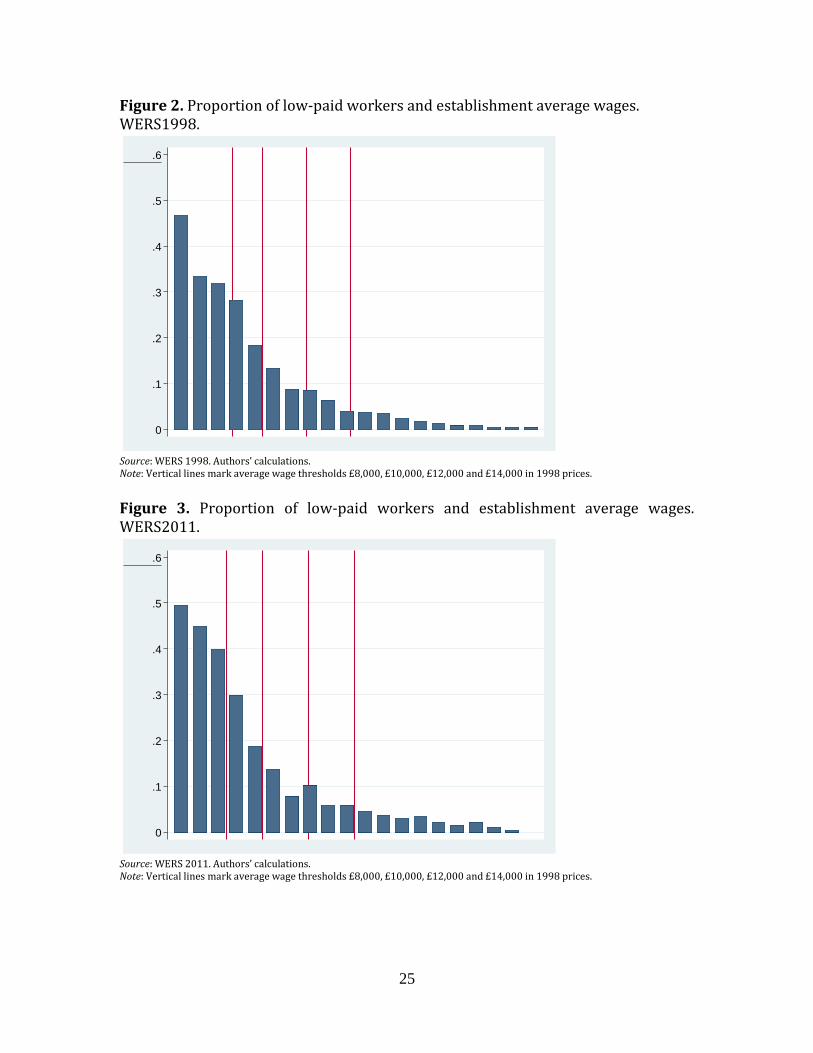
In Figures 2-3 we plot the proportion of workers paid the NMW against the
establishment's average annual wage in WERS 1998 and WERS 2011, illustrating
thresholds £8,000, £10,000, £12,000 and £14,000 with vertical lines9,10. The vertical
axis shows the proportion of workers paid below the NMW in the establishment.
The horizontal axis shows the average annual wage at the workplace. This is divided
in bins for 5 percentiles from lowest (left) to highest (right). These figures suggest
that when the NMW was introduced minimum wage workers were concentrated in
firms that paid low average wages and that this pattern has persisted over time.
They also suggest that all 4 cut-offs shown provide a reasonable distinction between
firms that are more or less likely to be affected by the NMW. In firms with average
labour costs above £14,000 (in 1998 prices) less than 5% of workers are paid
around the NMW. In what follows, we use £10,000, £12,000 and £14,000 thresholds
to separate treatment and control firms.11
9 In 2004 and 2011 we adjust the thresholds (£8,000, £10,000, £12,000 and £14,000) by the percentage
increase in the average earnings index from the year of introduction to the year of analysis (equivalent to
approximately £12,000, £15,000, £18,000 and £21,000 in 2008 prices). The Draca et al. papers use the
£12,000 threshold to distinguish treatment and control firms. 10
The 2004 figure is excluded for brevity. It looks very similar to the 1998 figure. 11
We do not consider the £8,000 threshold as there are relatively few such businesses in the FAME and
ARD panel data. This is due to light reporting requirements for small companies (defined as such by turnover, assets and/or employment) and the sampling stratification in the ARD.

13
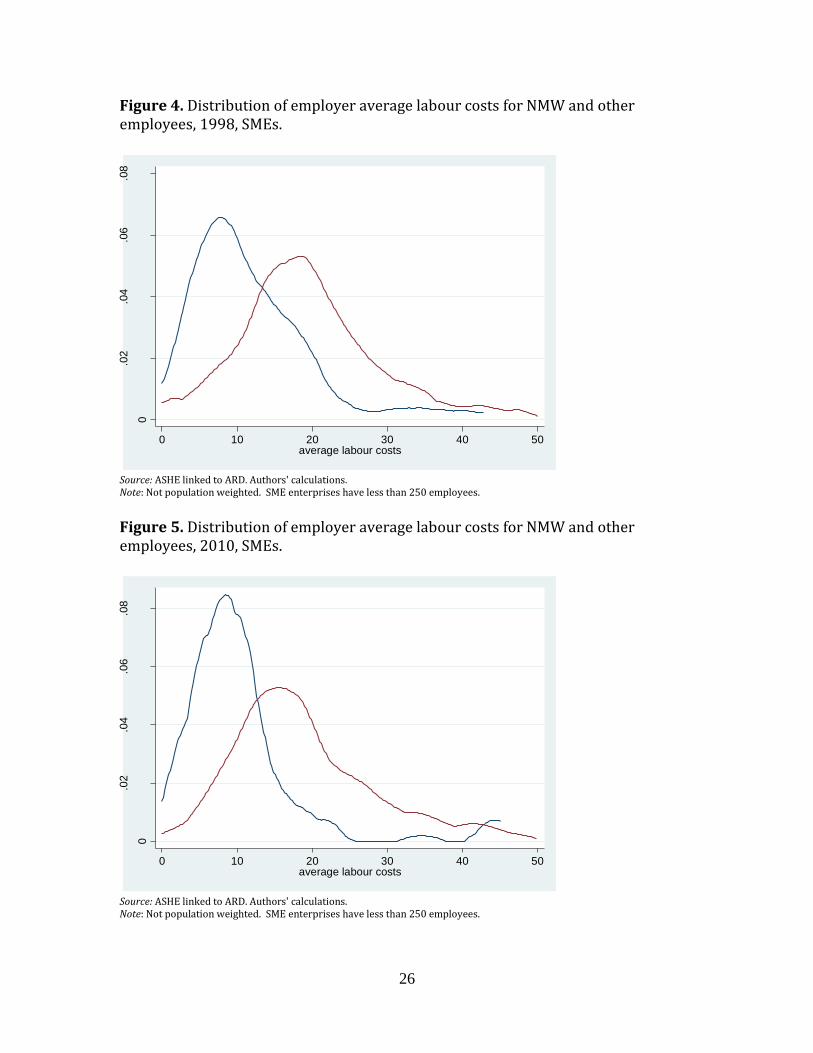
Figures 4-5 use the ASHE linked to the ARD to show the distribution of average
enterprise labour costs (deflated to 1998 values by annual changes in the National
Minimum Wage) for two groups: employees paid at or below the minimum wage
rate (blue line) and employees paid above the minimum wage rate (red line).
Figures are shown for 1998 and 2010 for SMEs, but are similar for other years and
the sample including larger employers.12 For each of these figures we do a
Kolmogorov-Smirnov test, which suggests that the distributions of average
enterprise labour costs are different for these two groups of employees. In line with
the WERS analysis, these figures confirm that workers paid at or below the NMW
are concentrated in establishments with low average labour costs. This pattern
again seems to persist over time.13
6. Results
Our main results are based on our analysis of FAME. These are reported for the
three periods we consider in Table 1 (NMW introduction), Table 2 (Intermediate
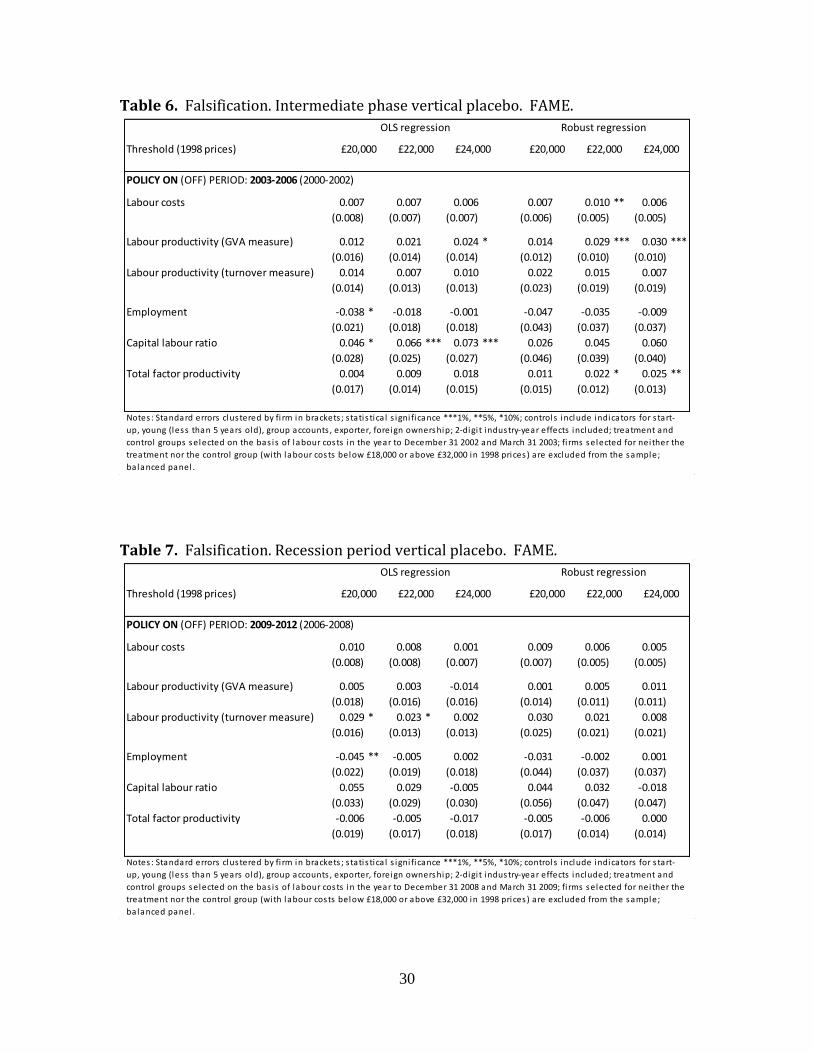
phase), and Table 3 (Recession period). We carry out falsification (placebo) tests
(Tables 4-7), which are crucial to the interpretation of our reported impact
estimates as being associated with the NMW. In Table 4 we report impact estimates
from a pre-NMW period (historical placebo) and in Tables 5-7 from groups of high-
paying firms that should largely be unaffected by the NMW (which we call the
vertical placebo).
The dependent variable is specified in logs so that coefficients can be interpreted as
the percentage change in the outcome of interest relative to the counterfactual (0.01
is equivalent to 1%). We report estimates based on OLS regression and robust
regression, the latter of which adds less weight to outlying observations.
We show results for different cut-offs to define treated and control firms: £10,000,
£12,000 and £14,000 per annum. These are then adjusted in line with the average
earnings index (or the NMW) as we move further away from NMW introduction. In
12
These figures are available in the research report upon which this paper is based (Riley & Rosazza
Bondibene, 2015). 13
We also run probit regressions looking at the probability of being an employee paid at or below the
minimum wage. We find a statistically significant negative association between average enterprise labour
costs and the probability of being a minimum wage worker. In other words, if a person works in an
enterprise that pays its employees on average a low wage, then it is more likely that this person is paid at or
below the NMW.

14
the FAME sample that we use these cut-offs correspond to broadly the 9th, 14th and
20th percentiles of the distribution of average labour costs, which at the lower end
is relatively stable over time. The estimation sample that we consider includes
treatment and control firms chosen in the year before the policy change (discussed
above) that we can observe in each of the 3 years before the policy change and in
each of the four years after.14 In the regressions we include firm level controls:
whether a firm is a start-up, young, files group accounts, exports, is foreign-owned.
We also include industry specific time dummies so that performance levels are
assessed relative to the industry-year mean. The number of firms in the treatment
and control samples are shown for each cut-off and time period in Appendix B.15
It is important that we observe an increase in average labour costs associated with
the NMW. If not, then there is no reason to associate any observed productivity
impacts with the NMW. Looking in Tables 1-3 we see that average labour costs rose
on average around 4% more for low-paying firms than for firms in the control
group. These effects are evident in all NMW periods, but do not appear in the data in
the period before the NMW (Table 4), nor do they appear between the groups
further up the distribution of average labour costs (vertical placebo; Tables 5-7). In
Tables 1-3 when we use robust regression it appears that the magnitude of the
increase in labour costs associated with the NMW is diminishing over time, with the
largest impacts upon introduction and the smallest impacts following the recession
of 2008. This is consistent with the profile for the bite of the NMW shown in Figure
1. These results suggest that the quasi-experimental setting constructed here is able
to capture NMW impacts on companies.
Productivity
We consider two measures of labour productivity: a (preferred) GVA based measure
and a turnover based measure. Looking at the introduction phase (1999-2002) in
Table 1 we find significant positive labour productivity impacts on both measures
when we use the £12,000 and £14,000 cut-offs. In falsification tests we find no
significant "policy effects" on labour productivity in the pre-NMW period (Table 4)
or in the vertical placebo upon introduction of the NMW in the full sample (Table 5).
These findings suggest that firms may have responded to the labour cost increases
associated with the introduction of the NMW by increasing labour productivity. In 14
We restrict the before period to 3 years because of data and policy constraints in the pre-NMW period.
Results are very similar when we include (where possible) in the before period 4 years of data. 15
Sample sizes are 7 times the number of treatment and control firms (because we track firms for 7 years).

15
the intermediate phase (Table 2), we observe significant positive effects on the GVA
measure, but not the turnover measure. These are not apparent when we use robust
regression. Moreover, we also find positive labour productivity effects further up
the wage distribution (Table 6), casting doubt on the interpretation of these positive
productivity effects as being related to the increases in the NMW over this period. In
the recession phase we find positive labour productivity impacts on the GVA based
measure of labour productivity; these are significant when we use robust regression
(Table 3). Vertical placebo tests for this period (Table 7) give us some confidence in
the identification strategy. We also find some evidence of labour productivity
increases following recession on the turnover based measure, but these are also
evident further up the wage distribution and therefore less easily interpreted as
NMW effects.
The results so far suggest that low-paying firms may have responded to increases in
labour costs that arose with the NMW by increasing labour productivity, upon
introduction and also after the financial crisis. By definition, increases in labour
productivity come about either from a rise in the capital intensity of production or
from a rise in total factor productivity (TFP). Therefore, we also estimate "treatment
effects" on capital labour ratios and total factor productivity. These are not
significant in the pre-NMW period in the full sample (Table 4) as we would expect if
our identification strategy is valid. When the NMW was introduced we find positive
effects on GVA per head (as discussed above), which appear to have come about due
to an increase in TFP rather than via an increase in the capital labour ratio (Table 1).
These effects are absent in the vertical placebo (Table 5). During the intermediate
phase the positive and significant treatment effects for GVA per head in some
models are mirrored in positive and significant treatment effects for TFP (Table 2).
But, as with GVA per head, we also find evidence of positive treatment effects for
TFP for firms that should not be affected by the NMW (Table 6). The positive labour
productivity effects that we find for the recession period (Table 3) are associated
with increases in TFP rather than capital labour substitution. As at introduction
falsification tests further up the distribution of labour costs (Table 7) support a
minimum wage interpretation.
WE also check whether the labour productivity effects that we find for low-paying
firms are associated with a reduction in employment. We do not find any
statistically significant employment effects for during any of the NMW periods of
interest (Tables 1-3). Falsification tests suggest that we are conducting a valid
16
experiment. We find no employment effects in the pre-NMW period (Table 4). We
find a negative employment effect in some vertical placebo models (Tables 5-7), but
generally these are not statistically significant.
Business exit rates and sample selection
In order to check whether the estimated productivity impacts are driven by a
possible effect of the NMW on company exit, we assess differences in business exit
rates between low- and less low-paying firms in Table 8. We also assess differences
in sample exit rates between low- and less low-paying firms. The concern is that
because reporting is related to business performance (e.g. size of turnover and
employment) the sample that we use to evaluate NMW impacts may depend on the
impacts of the NMW on business performance (in which case we would have a
sample selection issue). This is investigated in Table 9.
In Table 8, we show difference-in-differences estimates of the impact of the NMW on
company exit rates. In these models we compare four year exit rates for three
cohorts of firms (treatment and controls) selected right before the introduction of
the NMW (1998), before the generous increases of the mid-2000s (2002), or right at
the outset of recession and stagnation in UK economic performance (2008) to four
year exit rates for a cohort of firms selected in the pre-NMW period (1995). For each
cohort we restrict the sample to those firms that report financial variables in the
three years before the policy change (as in the analysis above).
We find no evidence of a change in exit rates for low-paying companies following the
introduction of the NMW for any of the cut-offs that we consider. This is generally
the case for later periods (the intermediate phase and recession period) too. There
is a negative and significant effect (at the 10 per cent level) when we use the
£14,000 threshold, but this disappears when we use alternative thresholds to define
treatment and control firms. There is in any case no evidence that the NMW should
have increased closure rates for low-paying (and low-productivity) companies,
suggesting the productivity impacts we detect do not arise because of any effect of
the NMW on firm exit.
In Table 9, we show difference-in-differences estimates of the impact of the NMW on
sample exit rates. Firms may exit the sample if they close or if they fail to report
financial information. Companies are not obliged to report all the information that
we use to study the NMW and business performance. This opens up the possibility
that selection for the sample for analysis is dependent on the impacts of the NMW,

17
which in turn could lead to biased estimates of NMW impacts on business outcomes.
To see this, note that in the regression results above we consider a (balanced) panel
of firms. This has the benefit of allowing us to compare the same set of firms before
and after the policy intervention, and thus our estimates are not affected by any
spurious changes in sample composition. This is generally useful given the
heterogeneity of firms' performance. But, if the NMW affects business (or, in
particular, sample) exit and entry rates, e.g. because of the link between reporting
and business scale, then our estimates in the previous section are calculated only for
the sample of firms that did not shrink/exit due to the NMW and that did not
expand/enter due to the NMW and that therefore we observe.16
The scenario that causes most concern is one where the NMW causes firm
performance to deteriorate and hence exit the sample. If this were the case then our
estimates of NMW effects on performance in the balanced sample of firms will be
biased upwards; i.e. it might look like the NMW improves performance in part
because we end up ignoring those firms whose performance worsened because of
the NMW. In Table 9, we do not find that sample exit rates increased following
changes in the NMW.
Robustness checks using the ARD
We check whether we also observe these effects on labour costs and productivity
associated with the NMW using other datasets. Our results based on the ARD are
reported in Table 10 for all three periods of interest. Vertical placebo tests are also
reported in this table (we are unable to estimate the historical placebo with the
ARD).
The nature of the ARD data is such that we have fewer years in our data panel. In
Table 11 we estimate these "ARD style" models using FAME and report in Table 12
the equivalent impact estimates from the pre-NMW period to check the validity of
this alternate model.
In Table10, we use the ARD to estimate equation (1) for the following year
combinations: (1997, 1998), (2001, 2002); (2001, 2002), (2005, 2006); (2007,
2008), (2011, 2012). For each pair the first two years refer to time p=0 in equation
(1) and the last two years refer to time p=1. This is by necessity slightly different to
the analysis of FAME where we observe firms for seven consecutive years. As in the 16
These issues also arise in an unbalanced panel, where we have the additional complexity that sample
composition is changing over time.

18
FAME analysis we use cut-offs at £10,000, £12,000 and £14,000 (1998 prices). In
the (unweighted) ARD sample that we use here these cut-offs correspond to broadly
the 14th, 20th and 27th percentiles of the distribution of average labour costs. Also
as in the previous analysis we include in the regressions 2-digit industry controls
interacted with year effects. Sample sizes are reported in Appendix B.
In Table10, we show that at the introduction of the NMW average labour costs
increased more amongst our treatment group of low pay firms relative to firms that
paid better wages. This pattern is evident for all thresholds and estimations
methods. This lends some credibility to the identification strategy used to examine
NMW impacts on other outcomes, which basically attributes the difference in
changes in outcomes over time between lower and higher average labour cost
businesses to the NMW. Although we include industry-year controls in the ARD
analysis, it is important to bear in mind that there could be other influences on
business outcomes over time that affect more and less low-pay companies
differently. When we are unable to take these into account in the analysis these can
bias our ARD estimates of NMW impacts. Indeed, vertical placebo tests (Table10)
suggest that our estimates of increases in labour costs may be biased upwards,
possibly due to some dynamic adjustment (mean reversion) effect (we cannot look
at the pre-NMW period with the ARD). Note also that the ARD labour cost estimates
are (in some cases substantially) larger in magnitude than the FAME estimates. This
is at least in part due to the fact that we can include only a few years in the ARD
panel. We illustrate this in Table 11 where we estimate these same "ARD style"
models using the FAME data. When we do this we generally get larger impact
estimates than when using the full longitudinal panel. Moreover, we do not pass
falsification tests further up the distribution of labour costs (also in Table 11) and in
the pre-NMW period (Table 12). We draw two conclusions. First, it is clearly
necessary to recalibrate falsification tests with (even relatively minor) changes to
the model (e.g. thresholds, controls, time periods covered) to check the validity of
the identification strategy. This phenomenon is also evident in employee-level
studies that consider the wage and employment effects of the NMW. Second, the
effects we find with the "ARD style" model do almost certainly capture some
element of dynamic adjustment and are likely biased upwards.
In Table 10 we also show ARD results for the intermediate and recession periods. As
expected, we generally find that average labour costs per head increased amongst

19
low-paying firms (the treatment group) compared to less low-paying firms (the
control group). The magnitude of these average labour cost effects is generally
greatest upon introduction of the NMW and smallest during the recession. This
pattern was also evident when we used robust regression on the FAME data in the
previous section and is in line with changes in the NMW over time giving us some
confidence that we are capturing some effects that are associated with the NMW.
We also estimate the difference in 4-year changes in labour productivity (GVA per
head), as well as capital labour ratios, TFP, and employment between lower and
higher average labour cost businesses, using the same methodology described
above. As in our FAME analysis, the impact estimates in Table 10 suggest that the
increases in labour costs associated with the NMW were associated with increases
in labour productivity in all three periods considered and that these arose due to
increases in efficiency (TFP) rather than capital labour substitution (capital labour
ratio). We find some negative and significant employment coefficients, but these are
not consistent across the specifications shown and are not statistically significant
when we use robust regression.
Thus, although we identify some upward biases in the analysis that is possible with
the ARD, the pattern and magnitude of the estimated impacts suggest that these
effects are not wholly attributable to factors unrelated to the NMW and generally
support the evidence obtained using FAME.
7. Conclusions
This paper contributes evidence to a much under-explored area of research on
minimum wages. We study the impact of minimum wages on firm productivity using
the natural experiment setting provided by the introduction and up-ratings to the
UK NMW.
Analysing company accounts data we find evidence to suggest that the NMW led to
increases in labour costs amongst low-paying firms upon introduction, but also with
the above average earnings increases of the mid-2000s and after the recession when
NMW upratings were modest but real average wages were falling and some workers
experienced nominal pay cuts. Our results suggest that these labour cost increases
amongst low-paying firms may have been met by increases in labour productivity.

20
Our findings do not suggest that these increases in labour productivity arose
because of reductions in employment or via capital labour substitution. The
evidence suggests that these labour productivity increases may have been
associated with increases in efficiency of production. This finding is consistent with
organisational change, training and efficiency wage responses to increased labour
costs from the NMW. This is also consistent with a decrease in employee turnover
from a rise in the minimum wage.
We provide a range of supportive evidence, which lends credibility to the
experimental setting we use and the robustness of our results; including analysis of
the location of low paid employees relative to firm average labour costs, falsification
tests, analysis of selection issues and sensitivity tests using alternate data sources.
We cannot rule out that the labour productivity increases we find are associated
with increases in average hours worked. This is because we cannot control for
average hours worked at the firm level (only at the industry level, which we do). The
available evidence is unclear about the effects of the NMW on average hours.
Dickens, Riley and Wilkinson (forthcoming) find that employers may have shifted
away from part-time workers towards full-time workers in response to the NMW,
which would tend to increase average hours worked. Stewart & Swaffield (2008)
find that minimum wage workers' hours decreased in response to the introduction
of the NMW, which would tend to reduce average hours worked. Connolly and
Gregory (2002) find no significant changes in hours worked by either full- or part-
time women. But, the labour productivity increases we find are associated with
increases in TFP rather than changes in the capital-labour ratio, which suggests that
our findings may not be driven by changes in average hours. Another issue is that
we do not have information on firm level prices, and thus it is possible that the
productivity effects we find reflect increases in prices rather than productivity.
However, the available evidence does not suggest that the price impacts of the NMW
have been very significant (Draca et al., 2005; Wadsworth, 2010). Thus we suggest
this paper provides an important contribution to the study of minimum wages and
labour market policy to support individuals in low paid work.
21
References
Acemoglu, D. and Pischke, J. (1999). ‘The Structure of Wages and Investment in General Training’. Journal of Political Economy, 107(3): 539-572.
Akerlof, G. (1982). ‘Labor Contracts as Partial Gift-Exchange’. Quarterly Journal of Economics, 97: 543-569.
Arulampalam, W., Booth, A. and Bryan, L. (2004). ‘Training and the New Minimum Wage’. Economic Journal 114(494): C87–C94.
Brosnan, P. (2003). ‘The Political Economy of the Minimum Wage’, in Burchell, B. Deakin, S. Michie,J. and Rubery, J. (ed.), Systems of Production: Markets, Organizations and Performance, Routledge, London: 192-212.
Card, D. and Krueger, A. (1995). ‘Myth and Measurement: the New Economics of the Minimum Wage’. Princeton University Press, Princeton.
Connolly, S., and Gregory, M. (2002). ‘The National Minimum Wage and Hours of Work: Implications for Low Paid Women’. Oxford Bulletin of Economics and Statistics, 64 (Supplement): 607-631.
Dickens, R., Riley, R. and Wilkinson, D. (forthcoming). ‘A re-examination of the impact of the National Minimum Wage on employment’. Economica.
Dickens, R., Riley, R. and Wilkinson, D. (2012). Re-examining the impact of the National Minimum Wage on earnings, employment and hours: The importance of recession and firm-size, Research Report for the Low Pay Commission.
Dolton, P., Rosazza Bondibene, C. and Wadsworth, J. (2010). ‘The UK National Minimum Wage in Retrospect’. Fiscal Studies, 31: 509-534.
Dolton, P., Rosazza Bondibene, C. and Wadsworth, J. (2012). ‘Employment, Inequality and the UK National Minimum Wage over the Medium-Term’, Oxford Bulletin of Economics, 74(1): 78-106.
Dolton, P., Rosazza Bondibene, C. and Stops, M. (2015). Identifying the Employment Effect of Invoking and Changing the Minimum Wage: A Spatial Analysis of the UK. Mimeo.
Draca, M., Machin, S., and Van Reenen, J. (2005). The Impact of the National Minimum Wage on Profits and Prices, Research Report for the Low Pay Commission.
Draca, M., Machin, S., and Van Reenen, J. (2011). ‘Minimum Wages and Firm Profitability’. American Economic Journal: Applied Economics, 3, 129-151.
Dube, A., Naidu, S. and Reich, M. (2007). ‘The Economic Effects of a Citywide Minimum Wage’. Industrial and Labor Relations Review, 60(4): 522-543.
Dube, A., Lester, W., Reich, M. (forthcoming). ‘Minimum Wage Shocks, Employment Flows and Labor Market Frictions‘. Journal of Labor Economics.
Elias, P. and Purcell, K. (2004) SOC(HE): a Classification of Occupations for Studying the Graduate Labour Market, Research Graduate Careers Seven Years On, Research paper n. 6.

22
Forth, J., Rincon-Aznar, A., Robinson, C. and Harris, R. (2009) The Impact of Recent Upratings of the National Minimum Wage on Competitiveness, Business Performance and Sector Dynamics, Research Report for the Low Pay Commission.
Galindo-Rueda, F. and Pereira, S. (2004). The Impact of the National Minimum Wage on British Firms, Research Report for the Low Pay Commission.
Georgiadis, A. (2013). ‘Efficiency Wages and the Economic Effects of the Minimum Wage: Evidence from a Low-Wage Labour Market’. Oxford Bulletin of Economics and Statistics, 75(6): 972-979.
Gregg, P. Machin, S. and Fernández-Salgrado, M. (2014). ‘The Squeeze in Real Wages and What it Might Take to End it’. National Institute Economic Review, 228(1): R3-R16.
Harris, R.I.D. (2005) ‘Economics of the Workplace: Special Issue Editorial’. Scottish Journal of Political Economy, 52(3): 323-343.
Hirsch, B., Kaufman, B. and Zelenska, T. (2011). Minimum Wage Channels of Adjustment, IZA Discussion paper n. 6132.
Kaufman, B.E. (2010). ‘Institutional Economics and the Minimum Wage: Broadening the Theoretical and Policy Debate’. Industrial & Labor Relations Review, 63: 427-453.
Lester, R. (1946). ‘The Economics of Labor’. Macmillan, New York.
Metcalf, D. (2008). ‘Why has the British National Minimum Wage had Little or No Impact on Employment?’. Journal of Industrial Relations, 50(3): 489-512
Neumark, D., Salas, I. and Wascher, W. (2014). ‘More on Recent Evidence on the Effects of Minimum Wages in the United States’. IZA Journal of Labor Policy, 3(24): 1-26.
Osterman, P. (2011). ‘Institutional Labor Economics, the New Personnel Economics, and Internal Labor Markets: A Reconsideration’, Industrial & Labor Relations Review, 64: 637-653.
Owens, F. and Kagel, J. (2010). ‘Minimum Wage Restrictions and Employee Effort in Incomplete Labor Markets: an Experimental Investigation’, Journal of Economic Behavior and Organization, 73: 317-326.
Riley, R. and Rosazza Bondibene, C. (2013) The Impact of the National Minimum Wage on Firm Behaviour during Recession, Research Report for the Low Pay Commission.
Riley, R. and Rosazza Bondibene, C. (2015) The Impact of the National Minimum Wage on UK Businesses, Research Report for the Low Pay Commission.
Rizov, M., and Croucher, R. (2011). The impact of the UK national minimum wage on productivity by low-paying sectors and firm-size groups, Research Report for the Low Pay Commission.

23
Ropponen, O. (2011). ‘Reconciling the evidence of Card and Krueger (1994) and
Neumark and Wascher (2000)’. Journal of Applied Econometrics, 26(6): 1051-1057.
Shapiro, C. and Stiglitz, J. (1984). ‘Equilibrium Unemployment as a Worker Discipline Device’, The American Economic Review, 74(3): 433-444.
Stewart, M. (2004a). ‘The Impact of the Introduction of the UK Minimum Wage on the Employment Probabilities of Low Wage Workers’, Journal of European Economic Association, 2: 67-97.
Stewart, M. (2004b). ‘The Employment Effects of the National Minimum Wage’, The Economic Journal, 114: C110-C116.
Stewart, M. and J. Swaffield (2008) ‘The other margin: do minimum wages cause working hours adjustments for low-wage workers?’, Economica, 75, 148-167.
Wadsworth, J. (2010). ‘Did the Minimum Wage Affect UK Prices?, Fiscal Studies, 31(1): 81-120.
24
Figure 1. The bite of the UK NMW.
Source: Low Pay Commission Report 2015, Table 2.4; Authors’ calculations.
30
35
40
45
50
55
1999 2000 2001 2002 2003 2004 2005 2006 2007 2008 2009 2010 2011 2012
% of median % of average wages
25
Figure 2. Proportion of low-paid workers and establishment average wages. WERS1998.
Source: WERS 1998. Authors’ calculations. Note: Vertical lines mark average wage thresholds £8,000, £10,000, £12,000 and £14,000 in 1998 prices.
Figure 3. Proportion of low-paid workers and establishment average wages. WERS2011.
Source: WERS 2011. Authors’ calculations. Note: Vertical lines mark average wage thresholds £8,000, £10,000, £12,000 and £14,000 in 1998 prices.
0
.1
.2
.3
.4
.5
.6
Pro
port
ion (
%)
Min
Wa
ge
Work
ers
0
.1
.2
.3
.4
.5
.6
Pro
port
ion (
%)
Min
Wa
ge
Work
ers
26
Figure 4. Distribution of employer average labour costs for NMW and other employees, 1998, SMEs.
Source: ASHE linked to ARD. Authors' calculations. Note: Not population weighted. SME enterprises have less than 250 employees.
Figure 5. Distribution of employer average labour costs for NMW and other employees, 2010, SMEs.
Source: ASHE linked to ARD. Authors' calculations. Note: Not population weighted. SME enterprises have less than 250 employees.
0
.02
.04
.06
.08
0 10 20 30 40 50average labour costs
0
.02
.04
.06
.08
0 10 20 30 40 50average labour costs

27
Table 1. NMW introduction. Longitudinal panel models using FAME.
Table 2. Intermediate phase. Longitudinal panel models using FAME.
Threshold (1998 prices)
POLICY ON (OFF) PERIOD: 1999-2002 (1996-1998)
Labour costs 0.039 *** 0.042 *** 0.036 *** 0.039 *** 0.036 *** 0.033 ***
(0.014) (0.011) (0.009) (0.010) (0.008) (0.007)
Labour productivity (GVA measure) 0.031 0.043 ** 0.042 *** 0.028 * 0.037 *** 0.040 ***
(0.022) (0.018) (0.014) (0.016) (0.013) (0.012)
Labour productivity (turnover measure) 0.018 0.041 ** 0.030 ** 0.018 0.042 * 0.025
(0.020) (0.016) (0.013) (0.026) (0.022) (0.020)
Employment 0.019 -0.006 0.002 0.046 0.011 0.013
(0.031) (0.026) (0.021) (0.056) (0.048) (0.042)
Capital labour ratio 0.044 0.025 0.016 0.029 0.021 0.013
(0.031) (0.026) (0.022) (0.043) (0.037) (0.032)
Total factor productivity 0.014 0.032 * 0.033 ** 0.018 0.027 * 0.032 ***
(0.021) (0.017) (0.014) (0.017) (0.014) (0.012)
Notes : Standard errors clustered by fi rm in brackets ; s tatis tica l s igni ficance ***1%, **5%, *10%; controls include indicators for s tart-
up, young (less than 5 years old), group accounts , exporter, foreign ownership; 2-digi t industry-year effects included; treatment and
control groups selected on the bas is of labour costs in the year to December 31 1998 and March 31 1999; fi rms selected for neither the
treatment nor the control group (with labour costs above £20,000 in 1998 prices) are excluded from the sample; ba lanced panel .
OLS regression Robust regression
£10,000 £12,000 £14,000 £10,000 £12,000 £14,000
Threshold (1998 prices)
POLICY ON (OFF) PERIOD: 2003-2006 (2000-2002)
Labour costs 0.048 *** 0.042 *** 0.036 *** 0.023 ** 0.021 ** 0.028 ***
(0.018) (0.014) (0.011) (0.011) (0.009) (0.008)
Labour productivity (GVA measure) 0.065 *** 0.046 ** 0.021 0.005 0.003 0.010
(0.025) (0.021) (0.017) (0.018) (0.015) (0.013)
Labour productivity (turnover measure) 0.008 0.023 -0.005 -0.004 0.009 -0.008
(0.020) (0.019) (0.016) (0.029) (0.025) (0.021)
Employment -0.018 -0.025 0.008 -0.031 -0.032 0.008
(0.030) (0.027) (0.024) (0.062) (0.053) (0.045)
Capital labour ratio -0.014 0.008 -0.007 0.004 0.073 0.029
(0.038) (0.033) (0.028) (0.055) (0.047) (0.041)
Total factor productivity 0.074 *** 0.048 ** 0.025 0.028 0.011 0.015
(0.027) (0.022) (0.018) (0.020) (0.017) (0.014)
Notes : Standard errors clustered by fi rm in brackets ; s tatis tica l s igni ficance ***1%, **5%, *10%; controls include indicators for s tart-
up, young (less than 5 years old), group accounts , exporter, foreign ownership; 2-digi t industry-year effects included; treatment and
control groups selected on the bas is of labour costs in the year to December 31 2002 and March 31 2003; fi rms selected for neither the
treatment nor the control group (with labour costs above £20,000 in 1998 prices) are excluded from the sample; ba lanced panel .
OLS regression Robust regression
£10,000 £12,000 £14,000 £10,000 £12,000 £14,000

28
Table 3. Recession period. Longitudinal panel models using FAME.
Threshold (1998 prices)
POLICY ON (OFF) PERIOD: 2009-2012 (2006-2008)
Labour costs 0.059 *** 0.043 *** 0.022 ** 0.028 ** 0.014 0.014 *
(0.017) (0.013) (0.010) (0.012) (0.009) (0.007)
Labour productivity (GVA measure) 0.013 0.030 0.021 0.031 * 0.027 * 0.028 **
(0.025) (0.019) (0.016) (0.019) (0.015) (0.013)
Labour productivity (turnover measure) 0.051 ** 0.033 * 0.013 0.034 0.017 -0.004
(0.023) (0.018) (0.015) (0.031) (0.025) (0.022)
Employment -0.005 0.016 0.001 -0.039 0.005 -0.012
(0.032) (0.027) (0.023) (0.064) (0.052) (0.046)
Capital labour ratio -0.030 -0.020 0.004 -0.019 -0.020 -0.004
(0.041) (0.036) (0.030) (0.059) (0.049) (0.042)
Total factor productivity 0.019 0.032 * 0.016 0.036 * 0.034 ** 0.030 **
(0.024) (0.020) (0.016) (0.021) (0.017) (0.015)
Notes : Standard errors clustered by fi rm in brackets ; s tatis tica l s igni ficance ***1%, **5%, *10%; controls include indicators for s tart-
up, young (less than 5 years old), group accounts , exporter, foreign ownership; 2-digi t industry-year effects included; treatment and
control groups selected on the bas is of labour costs in the year to December 31 2008 and March 31 2009; fi rms selected for neither the
treatment nor the control group (with labour costs above £20,000 in 1998 prices) are excluded from the sample; ba lanced panel .
OLS regression Robust regression
£10,000 £12,000 £14,000 £10,000 £12,000 £14,000

29
Table 4. Falsification. Pre-NMW phase. Longitudinal panel models using FAME.
Table 5. Falsification. NMW introduction vertical placebo. FAME.
Threshold (1998 prices)
POLICY ON (OFF) PERIOD: 1996-1999 (1993-1995)
Labour costs 0.005 -0.003 0.011 0.004 -0.008 0.008
(0.017) (0.013) (0.010) (0.011) (0.008) (0.007)
Labour productivity (GVA measure) 0.000 -0.002 0.001 0.021 0.004 0.014
(0.022) (0.017) (0.014) (0.017) (0.013) (0.011)
Labour productivity (turnover measure) -0.012 -0.005 0.005 -0.005 0.003 0.007
(0.017) (0.015) (0.013) (0.027) (0.023) (0.020)
Employment -0.009 -0.002 -0.005 -0.010 -0.019 -0.019
(0.025) (0.022) (0.018) (0.057) (0.048) (0.041)
Capital labour ratio -0.033 -0.034 -0.016 -0.014 -0.019 0.004
(0.032) (0.027) (0.023) (0.046) (0.038) (0.033)
Total factor productivity 0.009 0.007 0.004 0.016 0.010 0.014
(0.022) (0.017) (0.014) (0.017) (0.014) (0.012)
Notes : Standard errors clustered by fi rm in brackets ; s tatis tica l s igni ficance ***1%, **5%, *10%; controls include indicators for s tart-
up, young (less than 5 years old), group accounts , exporter, foreign ownership; 2-digi t industry-year effects included; treatment and
control groups selected on the bas is of labour costs in the year to December 31 1995 and March 31 1996; fi rms selected for neither the
treatment nor the control group (with labour costs above £20,000 in 1998 prices) are excluded from the sample; ba lanced panel .
OLS regression Robust regression
£10,000 £12,000 £14,000 £10,000 £12,000 £14,000
Threshold (1998 prices)
POLICY ON (OFF) PERIOD: 1999-2002 (1996-1998)
Labour costs -0.002 -0.005 -0.005 0.001 0.001 0.003
(0.006) (0.006) (0.006) (0.006) (0.004) (0.004)
Labour productivity (GVA measure) -0.001 0.002 -0.001 0.013 0.007 0.003
(0.011) (0.011) (0.012) (0.011) (0.009) (0.009)
Labour productivity (turnover measure) -0.001 0.000 0.001 0.009 0.003 0.001
(0.011) (0.009) (0.010) (0.020) (0.017) (0.017)
Employment -0.008 -0.018 -0.025 * -0.014 -0.027 -0.034
(0.015) (0.013) (0.014) (0.040) (0.033) (0.033)
Capital labour ratio 0.031 0.030 0.046 ** 0.030 0.034 0.047
(0.022) (0.020) (0.021) (0.035) (0.030) (0.030)
Total factor productivity -0.007 -0.005 -0.010 0.001 -0.006 -0.007
(0.012) (0.011) (0.012) (0.012) (0.010) (0.010)
Notes : Standard errors clustered by fi rm in brackets ; s tatis tica l s igni ficance ***1%, **5%, *10%; controls include indicators for s tart-
up, young (less than 5 years old), group accounts , exporter, foreign ownership; 2-digi t industry-year effects included; treatment and
control groups selected on the bas is of labour costs in the year to December 31 1998 and March 31 1999; fi rms selected for neither the
treatment nor the control group (with labour costs below £18,000 or above £32,000 in 1998 prices) are excluded from the sample;
ba lanced panel .
OLS regression Robust regression
£20,000 £22,000 £24,000 £20,000 £22,000 £24,000
30
Table 6. Falsification. Intermediate phase vertical placebo. FAME.
Table 7. Falsification. Recession period vertical placebo. FAME.
Threshold (1998 prices)
POLICY ON (OFF) PERIOD: 2003-2006 (2000-2002)
Labour costs 0.007 0.007 0.006 0.007 0.010 ** 0.006
(0.008) (0.007) (0.007) (0.006) (0.005) (0.005)
Labour productivity (GVA measure) 0.012 0.021 0.024 * 0.014 0.029 *** 0.030 ***
(0.016) (0.014) (0.014) (0.012) (0.010) (0.010)
Labour productivity (turnover measure) 0.014 0.007 0.010 0.022 0.015 0.007
(0.014) (0.013) (0.013) (0.023) (0.019) (0.019)
Employment -0.038 * -0.018 -0.001 -0.047 -0.035 -0.009
(0.021) (0.018) (0.018) (0.043) (0.037) (0.037)
Capital labour ratio 0.046 * 0.066 *** 0.073 *** 0.026 0.045 0.060
(0.028) (0.025) (0.027) (0.046) (0.039) (0.040)
Total factor productivity 0.004 0.009 0.018 0.011 0.022 * 0.025 **
(0.017) (0.014) (0.015) (0.015) (0.012) (0.013)
Notes : Standard errors clustered by fi rm in brackets ; s tatis tica l s igni ficance ***1%, **5%, *10%; controls include indicators for s tart-
up, young (less than 5 years old), group accounts , exporter, foreign ownership; 2-digi t industry-year effects included; treatment and
control groups selected on the bas is of labour costs in the year to December 31 2002 and March 31 2003; fi rms selected for neither the
treatment nor the control group (with labour costs below £18,000 or above £32,000 in 1998 prices) are excluded from the sample;
ba lanced panel .
OLS regression Robust regression
£20,000 £22,000 £24,000 £20,000 £22,000 £24,000
Threshold (1998 prices)
POLICY ON (OFF) PERIOD: 2009-2012 (2006-2008)
Labour costs 0.010 0.008 0.001 0.009 0.006 0.005
(0.008) (0.008) (0.007) (0.007) (0.005) (0.005)
Labour productivity (GVA measure) 0.005 0.003 -0.014 0.001 0.005 0.011
(0.018) (0.016) (0.016) (0.014) (0.011) (0.011)
Labour productivity (turnover measure) 0.029 * 0.023 * 0.002 0.030 0.021 0.008
(0.016) (0.013) (0.013) (0.025) (0.021) (0.021)
Employment -0.045 ** -0.005 0.002 -0.031 -0.002 0.001
(0.022) (0.019) (0.018) (0.044) (0.037) (0.037)
Capital labour ratio 0.055 0.029 -0.005 0.044 0.032 -0.018
(0.033) (0.029) (0.030) (0.056) (0.047) (0.047)
Total factor productivity -0.006 -0.005 -0.017 -0.005 -0.006 0.000
(0.019) (0.017) (0.018) (0.017) (0.014) (0.014)
Notes : Standard errors clustered by fi rm in brackets ; s tatis tica l s igni ficance ***1%, **5%, *10%; controls include indicators for s tart-
up, young (less than 5 years old), group accounts , exporter, foreign ownership; 2-digi t industry-year effects included; treatment and
control groups selected on the bas is of labour costs in the year to December 31 2008 and March 31 2009; fi rms selected for neither the
treatment nor the control group (with labour costs below £18,000 or above £32,000 in 1998 prices) are excluded from the sample;
ba lanced panel .
OLS regression Robust regression
£20,000 £22,000 £24,000 £20,000 £22,000 £24,000

31
Table 8. Difference-in-difference estimates of business exit rates. FAME.
Table 9. Difference-in-difference estimates of sample exit rates. FAME.
Threshold (1998 prices)
1998 -0.001 (0.015) -0.011 (0.012) -0.012 (0.010)
2002 0.003 (0.017) 0.006 (0.015) -0.001 (0.012)
2008 -0.012 (0.017) -0.019 (0.013) -0.020 * (0.012)
Probit regression
£10,000 £12,000 £14,000
Notes : Probabi l i ty of bus iness exi t within next 4 years ; marginal effects reported; s tandard errors
clustered by fi rm in brackets ; s tatis tica l s igni ficance ***1%, **5%, *10%; controls include indicators for
s tart-up, young (less than 5 years old), group accounts , exporter, foreign ownership; 2-digi t industry-year
effects included; treatment and control groups (as wel l as s ize or sector sub-group) selected on the bas is
of labour costs 1995, 1998, 2002 or 2008; fi rms selected for neither the treatment nor the control group
(with labour costs above £20,000 in 1998 prices) are excluded from the sample; ba lanced panel (fi rms
reporting accounts information in the year of selection and in the two years prior to selection); SMEs have
less than 250 employees ; low pay sectors (broadly) as defined by the Low pay Commiss ion.
Threshold (1998 prices)
1998 -0.026 (0.031) -0.013 (0.026) -0.044 * (0.023)
2002 -0.036 (0.034) 0.000 (0.028) -0.013 (0.025)
2008 0.046 (0.036) 0.014 (0.030) 0.002 (0.027)
Probit regression
£10,000 £12,000 £14,000
Notes : Probabi l i ty of sample exi t within next 4 years ; marginal effects reported; s tandard errors clustered
by fi rm in brackets ; s tatis tica l s igni ficance ***1%, **5%, *10%; controls include indicators for s tart-up,
young (less than 5 years old), group accounts , exporter, foreign ownership; 2-digi t industry-year effects
included; treatment and control groups (as wel l as s ize or sector sub-group) selected on the bas is of
labour costs 1995, 1998, 2002 or 2008; fi rms selected for neither the treatment nor the control group (with
labour costs above £20,000 in 1998 prices) are excluded from the sample; ba lanced panel (fi rms reporting
accounts information in the year of selection and in the two years prior to selection); SMEs have less
than 250 employees ; low pay sectors (broadly) as defined by the Low pay Commiss ion.

32
Table 10. Longitudinal panel models using the ARD.
Threshold (1998 prices)
POLICY ON (OFF) PERIOD: 2001-2002 (1997-1998)
Labour costs 0.106 *** 0.099 *** 0.098 *** 0.015 0.100 *** 0.088 *** 0.098 *** 0.022 *
Labour productivity (GVA measure) 0.079 ** 0.056 * 0.095 *** 0.046 0.084 ** 0.065 ** 0.092 *** 0.024
Employment -0.096 ** -0.127 *** -0.120 *** -0.049 * -0.119 -0.118 -0.099 -0.037
Capital labour ratio 0.052 0.087 0.026 0.162 *** 0.007 -0.028 -0.078 0.095
Total factor productivity 0.072 0.038 0.092 *** -0.009 0.087 ** 0.100 *** 0.115 *** -0.034
POLICY ON (OFF) PERIOD: 2005-2006 (2001-2002)
Labour costs 0.066 *** 0.070 *** 0.059 *** -0.003 0.074 *** 0.080 *** 0.064 *** 0.007
Labour productivity (GVA measure) 0.105 *** 0.077 ** 0.061 ** -0.005 0.074 ** 0.051 * 0.028 -0.007
Employment -0.108 *** -0.089 *** -0.104 *** 0.040 * -0.113 -0.110 -0.113 0.030
Capital labour ratio -0.020 -0.027 -0.011 0.010 -0.093 -0.061 -0.012 0.036
Total factor productivity 0.111 ** 0.085 ** 0.063 ** -0.012 0.083 ** 0.072 ** 0.038 -0.025
POLICY ON (OFF) PERIOD: 2011-2012 (2007-2008)
Labour costs 0.070 *** 0.071 *** 0.039 *** 0.000 0.088 *** 0.075 *** 0.033 ** 0.008
Labour productivity (GVA measure) 0.089 ** 0.091 ** 0.006 0.016 0.083 ** 0.122 *** 0.046 -0.007
Employment -0.012 -0.007 -0.021 -0.037 -0.035 -0.028 -0.030 -0.012
Capital labour ratio 0.081 0.063 0.003 -0.041 0.039 -0.007 -0.008 -0.020
Total factor productivity 0.053 0.064 0.004 0.029 0.076 * 0.085 ** 0.031 0.027
(VP) (VP)
Notes : (VP = vertica l placebo); s tandard errors clustered by fi rm; s tatis tica l s igni ficance ***1%, **5%, *10%; 2-digi t industry-year effects included; treatment
and control groups selected on the bas is of labour costs in 1998, 2002 or 2008; fi rms selected for neither the treatment nor the control group (with labour
costs above £20,000 in 1998 prices ; or in the case of the vertica l placebo with labour costs below £18,000 or above £32,000 in 1998 prices) are excluded from
the sample; ba lanced panel .
OLS regression Robust regression
£10,000 £12,000 £14,000 £10,000 £12,000 £20,000£20,000 £14,000

33
Table 11. Longitudinal panel models using FAME (similar to ARD model).
Table 12. Falsification. Pre-NMW phase. Longitudinal panel models using FAME (similar to ARD model).
Threshold (1998 prices)
POLICY ON (OFF) PERIOD: 2001-2002 (1997-1998)
Labour costs 0.080 *** 0.073 *** 0.059 *** 0.013 * 0.051 *** 0.047 *** 0.045 *** 0.018 **
Labour productivity (GVA measure) 0.089 *** 0.087 *** 0.072 *** 0.010 0.048 ** 0.062 *** 0.062 *** 0.034 **
Employment 0.000 -0.025 -0.015 -0.013 0.019 -0.013 -0.007 -0.016
Capital labour ratio 0.063 * 0.040 0.036 0.043 0.029 0.023 0.020 0.042
Total factor productivity 0.068 *** 0.072 *** 0.058 *** 0.002 0.034 0.046 ** 0.048 *** 0.019
POLICY ON (OFF) PERIOD: 2005-2006 (2001-2002)
Labour costs 0.098 *** 0.080 *** 0.067 *** 0.016 * 0.050 *** 0.041 *** 0.051 *** 0.018 **
Labour productivity (GVA measure) 0.100 *** 0.067 ** 0.048 ** 0.011 0.029 0.023 0.028 * 0.009
Employment -0.058 -0.042 -0.009 -0.052 ** -0.083 -0.054 -0.007 -0.067
Capital labour ratio 0.030 0.031 0.012 0.026 0.069 0.121 * 0.066 0.006
Total factor productivity 0.102 *** 0.067 ** 0.049 ** 0.003 0.041 0.014 0.020 0.001
POLICY ON (OFF) PERIOD: 2011-2012 (2007-2008)
Labour costs 0.095 *** 0.065 *** 0.041 *** 0.015 * 0.044 *** 0.019 * 0.025 *** 0.011
Labour productivity (GVA measure) 0.025 0.042 * 0.031 0.002 0.048 * 0.041 ** 0.041 ** 0.003
Employment 0.017 0.019 -0.013 -0.054 * -0.039 -0.011 -0.043 -0.028
Capital labour ratio 0.001 0.009 0.016 0.076 * 0.038 0.027 0.021 0.071
Total factor productivity 0.025 0.040 0.023 -0.012 0.030 0.039 * 0.037 * -0.004
(VP) (VP)
Notes : (VP = vertica l placebo); s tandard errors clustered by fi rm; s tatis tica l s igni ficance ***1%, **5%, *10%; 2-digi t industry-year effects included; treatment
and control groups selected on the bas is of labour costs in 1998, 2002 or 2008; fi rms selected for neither the treatment nor the control group (with labour
costs above £20,000 in 1998 prices ; or in the case of the vertica l placebo with labour costs below £18,000 or above £32,000 in 1998 prices) are excluded from
the sample; ba lanced panel .
OLS regression Robust regression
£10,000 £12,000 £14,000 £20,000 £10,000 £12,000 £14,000 £20,000
Threshold (1998 prices)
POLICY ON (OFF) PERIOD: 1996-1999 (1993-1995)
Labour costs 0.047 ** 0.035 ** 0.041 *** 0.040 *** 0.021 * 0.030 ***
Labour productivity (GVA measure) 0.036 0.044 ** 0.037 ** 0.057 *** 0.042 ** 0.044 ***
Employment -0.035 -0.028 -0.036 * -0.042 -0.045 -0.051
Capital labour ratio 0.002 -0.013 0.000 0.022 -0.002 0.019
Total factor productivity 0.036 0.048 ** 0.036 ** 0.043 * 0.044 ** 0.043 ***
Notes : Standard errors clustered by fi rm; s tatis tica l s igni ficance ***1%, **5%, *10%; 2-digi t industry-year effects included;
treatment and control groups selected on the bas is of labour costs in 1995; fi rms selected for neither the treatment nor the
control group (with labour costs above £20,000 in 1998 prices) are excluded from the sample; ba lanced panel .
OLS regression Robust regression
£10,000 £12,000 £14,000 £10,000 £12,000 £14,000

34
APPENDIX A: Proxies for the outcomes of interest FAME:
Average wages: remuneration/employment
Labour productivity: we examine two measures: turnover/employment and
(remuneration + profits)/employment; the latter of these is a proxy for a
gross-value added measure of labour productivity and is our preferred
measure; the turnover based measure is used for comparability to previous
studies that use FAME (turnover includes GVA and material costs).
Employment: number of employees
Capital labour ratio: fixed assets/employment
log TFP (total factor productivity): log ((remuneration +
profits)/employment) - (1-α)log (capital labour ratio), where α is the firm
average labour share over the relevant time period.
Company exit: exit dummy coded to unity for time periods after the last
observed filing date
ARD:
Average wages: total labour cost17 /employment
Labour productivity: GVA at factor costs/employment
Employment: number of employees18
Capital labour ratio: Plant & Machinery capital stock19/employment
log TFP (total factor productivity): log (labour productivity) - (1-α)log (capital
labour ratio), where α is the industry average labour share over the relevant
time period.
17 This represents amounts paid during the year to employees. This includes all overtime payments, bonuses, commissions, payments in kind, benefits in kind, holiday pay, employer’s national insurance contributions, payments into pension funds by employers and redundancy payments less any amount reimbursed for this purpose from government sources. No deduction is made for income tax or employee’s national insurance contributions etc. Payment to working proprietors, travelling expenses, lodging allowances, etc are excluded (ABI, Background Information, Archive Data). 18 We use indicative employment information available in the sampling frame as we do not have a consistent series of year average or point in time employment estimates for surveyed businesses. 19 These were made available by Richard Harris. The methodology underlying the construction of these is described in Harris (2005) "Deriving Measures of Plant-level Capital Stock in UK Manufacturing, 1973-2001", Report for the Department of Trade & Industry.

35
APPENDIX B: Sample sizes of the FAME and ARD regression analysis Table B1. Sample sizes FAME.
Table B2. Sample sizes FAME. Vertical placebo.
Table B3. Sample sizes ARD.
OFF ON T C T C T C
1993-1995 1996-1999 301 2057 513 1845 794 1564
1996-1998 1999-2002 352 2035 557 1830 845 1542
2000-2002 2003-2006 300 1724 470 1554 704 1320
2006-2008 2009-2012 267 1763 466 1564 726 1304
Note: These are the numbers of fi rms in each group. Fi rms are observed for 7 consecutive years and
hence the number of observations is 7 times large than the numbers reported here.
Threshold
Policy £10,000 £12,000 £14,000
OFF ON T C T C T C
1996-1998 1999-2002 592 2180 1118 1654 1606 1166
2000-2002 2003-2006 497 1847 955 1389 1401 943
2006-2008 2009-2012 483 1784 942 1325 1342 925
Note: These are the numbers of fi rms in each group. Fi rms are observed for 7 consecutive years and
hence the number of observations is 7 times large than the numbers reported here.
Threshold
Policy £20,000 £22,000 £24,000
OFF ON T C T C T C T C
1997-1998 2001-2002 356 1083 509 930 697 742 340 920
2001-2002 2005-2006 406 1339 597 1148 835 910 396 1006
2007-2008 2011-2012 406 967 555 818 741 632 281 750
(VP)
Note: These are the numbers of fi rms in each group. Fi rms are observed for 4 years and hence the number of observations is 4
times large than the numbers reported here.
Threshold
Policy £10,000 £12,000 £14,000 £20,000