Raising standards in American schools? Problems with improving teacher quality
13
Teaching and Teacher Education 24 (2008) 610–622 Raising standards in American schools? Problems with improving teacher quality Emma Smith School of Education, University of Birmingham, Birmingham, B15 2TT, UK Received 12 July 2006; received in revised form 9 May 2007; accepted 26 September 2007 Abstract The quality of the teacher workforce is a subject of perennial concern in many developed countries. In the United States, through the No Child Left Behind (NCLB) Act, the federal government has a mandate for reform of teacher education that is unprecedented in its scale. Essentially the Act demands that every teacher of core academic subjects must be deemed to be highly qualified in every subject they teach by the end of the 2005–2006 academic year. This paper considers the impact that NCLB’s teacher quality mandate is having in US schools. By drawing upon school-level data for the state of California, we examine the progress that this state is making towards meeting NCLB’s mandate and also the role that teacher quality can play as a determinant of school success. The findings suggest that overall California has a well-qualified and highly experienced teacher workforce which is relatively equitably distributed among the states’ institutions. On the other hand, the distribution of California’s students appears to be less fair, with students from poorer homes and certain ethnic backgrounds being disproportionately represented in the state’s least wealthy and least successful schools. In addition, the finding that it is student background factors rather than teacher quality characteristics that are the key determinants of school success, also brings into question the extent to which requiring teachers to improve their subject content skills will really help close the achievement gaps in California’s schools. r 2007 Elsevier Ltd. All rights reserved. Keywords: Teacher quality; No Child Left Behind; Educational standards 1. Introduction Over 20 years ago, the US government published a searing indictment of the state of the American public school system. The document was called A nation at risk and it forcefully condemned the ‘rising tide of mediocrity’ that was eroding the nation’s schools: If an unfriendly foreign power had attempted to impose on America the mediocre educational performance that exists today, we might well have viewed it as an act of war (NCEE, 1983). Although the ideology and evidence underpinning A nation at risk have proven to be controversial (Berliner & Biddle, 1995), it was to become the most important US education reform document of the twentieth century (Ravitch, 2003). Along with falling or stagnating levels of pupil performance in Amer- ican public schools, it was the quality of the teaching profession that excited the most attention. The authors of the report were particularly concerned ARTICLE IN PRESS www.elsevier.com/locate/tate 0742-051X/$ - see front matter r 2007 Elsevier Ltd. All rights reserved. doi:10.1016/j.tate.2007.09.013 E-mail address: [email protected]
-
Upload
emma-smith -
Category
Documents
-
view
214 -
download
1
Transcript of Raising standards in American schools? Problems with improving teacher quality
ARTICLE IN PRESS
0742-051X/$ - s
doi:10.1016/j.ta
E-mail addr
Teaching and Teacher Education 24 (2008) 610–622
www.elsevier.com/locate/tate
Raising standards in American schools? Problems withimproving teacher quality
Emma Smith
School of Education, University of Birmingham, Birmingham, B15 2TT, UK
Received 12 July 2006; received in revised form 9 May 2007; accepted 26 September 2007
Abstract
The quality of the teacher workforce is a subject of perennial concern in many developed countries. In the United States,
through the No Child Left Behind (NCLB) Act, the federal government has a mandate for reform of teacher education that
is unprecedented in its scale. Essentially the Act demands that every teacher of core academic subjects must be deemed to
be highly qualified in every subject they teach by the end of the 2005–2006 academic year. This paper considers the impact
that NCLB’s teacher quality mandate is having in US schools. By drawing upon school-level data for the state of
California, we examine the progress that this state is making towards meeting NCLB’s mandate and also the role that
teacher quality can play as a determinant of school success. The findings suggest that overall California has a well-qualified
and highly experienced teacher workforce which is relatively equitably distributed among the states’ institutions. On the
other hand, the distribution of California’s students appears to be less fair, with students from poorer homes and certain
ethnic backgrounds being disproportionately represented in the state’s least wealthy and least successful schools. In
addition, the finding that it is student background factors rather than teacher quality characteristics that are the key
determinants of school success, also brings into question the extent to which requiring teachers to improve their subject
content skills will really help close the achievement gaps in California’s schools.
r 2007 Elsevier Ltd. All rights reserved.
Keywords: Teacher quality; No Child Left Behind; Educational standards
1. Introduction
Over 20 years ago, the US government publisheda searing indictment of the state of the Americanpublic school system. The document was calledA nation at risk and it forcefully condemned the‘rising tide of mediocrity’ that was eroding thenation’s schools:
If an unfriendly foreign power had attempted toimpose on America the mediocre educational
ee front matter r 2007 Elsevier Ltd. All rights reserved.
te.2007.09.013
ess: [email protected]
performance that exists today, we might wellhave viewed it as an act of war (NCEE, 1983).
Although the ideology and evidence underpinningA nation at risk have proven to be controversial(Berliner & Biddle, 1995), it was to become the mostimportant US education reform document of thetwentieth century (Ravitch, 2003). Along with fallingor stagnating levels of pupil performance in Amer-ican public schools, it was the quality of the teachingprofession that excited the most attention. Theauthors of the report were particularly concerned
ARTICLE IN PRESS
1Core subjects are English, reading or language arts, mathe-
matics, science, foreign languages, civics and government,
economics, arts, history and geography.
E. Smith / Teaching and Teacher Education 24 (2008) 610–622 611
that teachers were being drawn disproportionatelyfrom the lowest quartile of graduating high schooland college students and that in certain shortagesubjects, such as mathematics, science and English,teachers were simply not qualified to teach (NCEE,1983). Among their recommendations was a call forstrengthening the teaching profession by raising itsstandards for training, entry and professional devel-opment, one aspect of this being the requirement thatprospective teachers take fewer courses in educationand more in the subjects they expect to teach.According to some commentators, in the twodecades following the publication of A nation at risk
little has changed (Koret Task Force on K-12Education, 2003). Teachers are still being drawnfrom the bottom ranks of college graduates, andwhile teacher salaries may have risen in real termssince the early 1980s, they still lag behind that ofother professions (Hanushek & Rivkin, 2004; Hoxby,2003; Manzo, 2005). Indeed the question of ‘how thenation’s teachers are recruited, prepared and trainedhas become the hottest topics in the public andacademic discourse regarding education’ (Cochrane-Smith, 2005b, p. 3).
In 2002, the US government passed into law No
Child Left Behind (NCLB): a piece of legislationthat has provided the federal government with amandate for education reform on an unprecedentedscale. For the nation’s public school teachers,NCLB means complex systems of performanceand accountability measures aimed at addressingconcerns over teacher quality and increasing thenumber of highly qualified teachers in America’sschools. NCLB is arguably the most important pieceof US educational legislation of the past 35 years.In broad terms, the Act links government fundingto strict improvement and accountability policiesfor America’s public schools. Much of the attentionalready given to NCLB has focused on its mandateto raise the achievement levels of all students(for example, Abedi, 2004; Linn, 2003; Smith,2005). However, it also legislates for reform inthe way in which teachers are trained and recruited.As it applies to teacher quality, NCLB has twokey objectives, the first is to ensure that everyteacher is highly qualified in the subjects theyteach and the second is to reduce the barriers tobecoming a teacher by ‘retooling’ traditionalteacher education programmes and opening upalternative routes into the profession (US Depart-ment of Education, 2004). Both have proven to becontroversial.
Through an examination of the early impact ofthis piece of legislation and an exploration of onestate’s efforts to fully comply with this new federalmandate, this paper considers how close theAmerican public school system will come to its goalof having every child taught by a highly qualifiedprofessional by the end of the 2005–2006 schoolyear. A key tenet behind this new piece of legislationis that teacher quality is central to school success.Using publicly available data for every school inCalifornia, this paper will test this assumption andconsider the role that ‘teacher quality’, as definedunder the aegis of NCLB, has on school outcomes.But first we begin by describing the key features ofNCLB.
2. No Child Left Behind in practice
According to NCLB, every teacher of coreacademic subjects1 must be highly qualified by theend of the 2005–2006 academic year. By the term‘highly qualified’, the legislation stipulates that theteacher must have obtained ‘full state certificationas a teacher or passed the State teacher licensingexamination, and hold a licence to teach in such aState’ (US Department of Education, 2002, p. 4).For new teachers (those employed after the start ofthe 2002–2003 academic year) this means that theymust posses at least a bachelor’s degree and passstate academic tests or must successfully complete,for each of their teaching areas, an academic major,or coursework equivalent or a graduate degree.Veteran teachers must meet the same criteria asnewly qualified teachers or must demonstratecompetence in all the subjects that they teachaccording to a High Objective Uniform StateStandard Evaluation, or HOUSSE (US Departmentof Education, 2002). Each State is free to developtheir own HOUSSE criteria but must addressteachers’ skills in both subject-matter knowledgeand teaching practice as well as provide coherentinformation about the teacher’s attainment ofcontent knowledge in the subjects that they teach(Centre on Educational Policy, 2005).
In addition to improving teacher quality, NCLB
mandates for improvement in the basic skills of allstudents. In order to determine whether a school ismeeting the requirements of NCLB for student

ARTICLE IN PRESSE. Smith / Teaching and Teacher Education 24 (2008) 610–622612
achievement, the Act requires that by 2005, statesassess performance annually in grades 3–82 inEnglish Language Arts and Mathematics, and inScience by 2007 (US Department of Education,2002). If students reach the required proficiencytargets in these tests then the school is considered tohave made Adequate Yearly Progress (AYP). If aschool fails to make AYP, a series of sanctions canbe administered by the school district, a situationakin to being on ‘special measures’ in England. Theform of these sanctions ranges from district-levelmonitoring through to giving parents the option totransfer their children out of ‘failing’ schools andproviding students who remain in the school withadditional tutoring. In more extreme cases, where aschool fails to make AYP for 4 or more consecutiveyears, that school can be faced with having toreplace staff, aspects of the curriculum or, at theextreme, be restructured as a Charter school or onerun by a private company. The AYP status of aschool is therefore crucial in determining theorganisation, funding and operation of a school.
That the federal government has sought to playsuch a large role in education through NCLB isunprecedented. Traditionally the US government,and Republican administrations in particular, haveplayed only a limited part in education policy(Rudalevige, 2003). This level of federal interven-tion in an area that has long been the domain of thestates has raised concerns about whether NCLB is infact constitutional (McColl, 2005). Indeed, from theperspective of many state and local educators, theNCLB provisions constitute an ‘unprecedentedfederal intrusion into their authority to establishpolicies and programmes appropriate to theirrespective communities’ (McDermott & Jensen,2005, p. 45). In the US, federal funds onlycontribute around 7–8% of total public schoolfunding; the remainder is split between the state(typically around 48%) and local taxes (around45%), although the proportions do vary (EducationTrust, 2002). With NCLB it is, according toMargaret Dayton, the Chairman of the UtahEducation Committee, a case of ‘7% of moneydictating 100% of policy’ (Dayton, 2005). Ofcourse, in theory, states could forgo their federalfunding and so be exempt from many of NCLB’smandates. While there is a suggestion that somestates and school districts are considering doingthis, it is likely that any shortfalls in this funding will
2National curriculum years 4–9.
have a disproportionate impact on disadvantagedstudents—the main recipients of these funds(McDermott & Jensen, 2005).
3. Producing high-quality teachers
No one denies the need for a good teacher. Someestimations of the value of having a good teachercan be quite staggering. For example, having 3consecutive years of good teachers (those placed inthe 85th percentile or above in terms of quality)could overcome the average achievement deficitbetween low-income students and others (Hanush-ek, 2002; Hanushek & Rivkin, 2004). Value-addedstudies in Tennessee have estimated that, at theextreme, 5th grade students who had experiencedhighly ineffective teachers for 3 years were likely toscore around 50 percentile points below their peersof comparable previous achievement who had beentaught to be highly effective teachers for the sameperiod (Rivers & Sanders, 2002). However, the keyissue is how to obtain good teachers, especiallywhen research does not find any ‘systematic linkbetween teacher characteristics and student out-comes’ (Hanushek & Rivkin, 2004, p. 7).
Uncertainty over the most effective way to trainthe teacher workforce underlies much of thecontroversy that has surrounded NCLB’s HighlyQualified teacher requirements, and no other areaseems to have excited such debate as the issue ofteacher certification. This key area has dividedopinion between those who favour a move towardsa decentralised teacher licensing system governed bychoice and market forces where prospective teacherscan enter the profession by a variety of pathways,and those who advocate that teacher preparationshould include training in teaching methods andpedagogy and should remain largely within theschools of education.
Proponents of the decentralised system favourpathways into teaching that are free from theeducation coursework requirements of many ofthe traditional routes (Walsh, 2001) and view thecurrent system whereby prospective teachers with-out undergraduate coursework in education have tocover additional education programmes beforebecoming eligible for state certification acts as adeterrent to highly able individuals who mightotherwise enter teaching (US Department of Educa-tion, 2002). They place the emphasis on teachershaving high verbal skills and subject expertise ratherthan the pedagogic skills taught in schools of
ARTICLE IN PRESSE. Smith / Teaching and Teacher Education 24 (2008) 610–622 613
education, and criticise traditional routes intoteaching for failing to provide teachers withsufficient subject knowledge to enable them to teachtheir subject effectively (Finn, 2003; Walsh, 2001).On the other hand, those that advocate the existingcentralised system contend that the current certifi-cation process already assesses prospective teachersfor their skills in content knowledge and verbalability, as well as their teaching ability, and thatstate tests are already effective in ensuring that onlyhigh-quality teachers are admitted to the profession(Darling-Hammond, 2000; Darling-Hammond &Younge, 2002). According to them, the policyobjectives of NCLB for improving teacher qualityessentially mean the ‘dismantling of teacher educa-tion systems and the redefinition of teacher quali-fications to include little preparation for teaching’(Darling-Hammond & Younge, 2002, p. 13). ThatNCLB’s focus is almost exclusively on subject-matter knowledge while appearing to sidelinepedagogy and other professional knowledge andskills excites particular concern: ‘we should notconfuse a highly qualified taker of tests aboutteaching with a highly qualified classroom teacher’(Berliner, 2005, p. 208, also Cochran-Smith, 2005a;Kaplan & Owings, 2003). Both of these perspectivescite a research base that provides the evidence fortheir preferred approach and both criticise eachother for the lack of scientific rigour in the studiesthey use to support their claims (Darling-Hammond& Younge, 2002; Walsh, 2001). However, overallthe evidence-base on which both sides base theirclaims does remain unclear (Archer, 2002). The lackof experimental studies and the use of differentoutcome measures and definitions of certification,coupled with selective citation of research findingscan make evidence that supports links betweenstudents’ achievement and teacher certification oralternative routes into the profession difficult todetermine (Hanushek & Rivkin, 2004).
Despite clear differences over how teachersshould be trained and certified, what both perspec-tives do share is the belief that teacher character-istics are one of the key determinants of schoolsuccess. Indeed, it is clear that with NCLB, whatwas once an academic debate now has a nationalfocus. This use of the term ‘teacher quality’ is notunproblematic. Under NCLB, teacher quality ismeasured not by observing practicing teachers, orby measuring the progress of their students; insteadteachers are expected to demonstrate their compe-tency through their subject knowledge skills, rather
than their pedagogic skills. Arguably this mightmake teacher quality easier to measure, as what weare assessing here are some of the measurablecharacteristics of teachers, such as whether theypossess a Masters degree and numbers of years ofservice, rather than the somewhat more problematicand arguably more subjective measure of what it isto be a good teacher. So in this sense, what we arelooking at are proxy measures of teacher quality.However, under NCLB, these are the characteristicsthat count, and it is on this basis, with appropriatecaveats about the meaning of the term teacherquality, that we proceed with the analysis.
The following section will explore some of thetensions and consequences of this new piece oflegislation by describing the progress that one casestudy state, California, is making towards fullcompliance with NCLB’s Highly Qualified Teachermandates.
4. No Child Left Behind in California
California is the most populous state in the US, ithas approximately 9000 public schools with around300,000 teachers teaching over 6 million students,almost a quarter of whom are English languagelearners (NCES, 2005). With its rising living costscontrasted against blighted urban schools and state-wide budget deficits—it is has been described as a‘poster state’ for many of the problems facing thosewho wish to train, recruit and retain good teachers(Quality Counts, 2003). A recent report by theRAND Co-operation charts the slow decline of thestate’s educational fortunes. Three decades agowhat was once regarded as one of the best educationsystems in the US now has among the lowestperforming students, the poorest school facilitiesand teacher salaries which have not increased in realterms since 1969 (Carroll, Krop, Arkes, Morrison,& Flanagan, 2005). The current struggle to supporteducation at the minimum levels mandated by thestate’s constitution points to a state requiring long-term solutions and ‘serious school finance reform’(Slack, 2005, p. 23).
This section begins by describing some of the keyfeatures of California’s school accountability systembefore providing a brief profile of the characteristicsof the state’s school teachers and students. It willconclude with an examination of the role thatteacher characteristics, and in particular those thatrelate to ‘teacher quality’, play in determining thesuccessful outcomes of schooling. The data used to
ARTICLE IN PRESS
3District poverty quartile levels are determined by the
proportion of students attending schools in the district who are
eligible for free school meals.
E. Smith / Teaching and Teacher Education 24 (2008) 610–622614
undertake this analysis was retrieved from thepublicly accessible databases of the CaliforniaDepartment of Education which provide school-level data on the achievement and characteristics ofall California’s public schools (California Depart-ment of Education, 2005c).
4.1. State testing and school accountability
Since 1999, California has adopted a growthmodel for monitoring school improvement. TheAcademic Performance Index (API) measures an-nual improvement and differs fundamentally fromNCLB’s status bar model, which assumes that allschools must meet common minimum academiclevels regardless of their starting point (CaliforniaDepartment of Education, 2005b). However, schoolperformance on both measures does differ signifi-cantly. For example, in California in 2004, around90% of schools met state API performance targets,while only around 65% of schools made AYP underNCLB (California Department of Education,2005c). Student progress in Californian schools ismeasured using a series of standardised tests thatare clustered together under the StandardisedTesting and Reporting Programme (STAR). Thesetests include the California Standards Tests which,for the purpose of NCLB, are used to assessstudents annually in English Language Arts ingrades 2–8 and in mathematics in grades 2–7. Since2005, students have also been tested in science ingrades 8 and 10 (California Department of Educa-tion, 2005a).
In order for a school to make AYP in California,it must meet each of the following requirements: atleast 95% of the student cohort must participate inthe STAR programme tests, all students must reachcertain minimum competency levels on these tests,high schools must achieve minimum graduationrates and all schools must demonstrate improve-ment or achieve minimum levels on the API(California Department of Education, 2005a).Schools that fail to make AYP for 2 consecutiveyears in the same areas are identified for pro-grammes of improvement. For example, a schoolthat failed to meet proficiency levels in EnglishLanguage Arts in Year 1 and in Year 2 would beidentified for improvement. On the other hand, aschool that failed to meet or exceed proficiencylevels in mathematics in Year 1, but in EnglishLanguage Arts in Year 2 would not be identified forimprovement (California Department of Education,
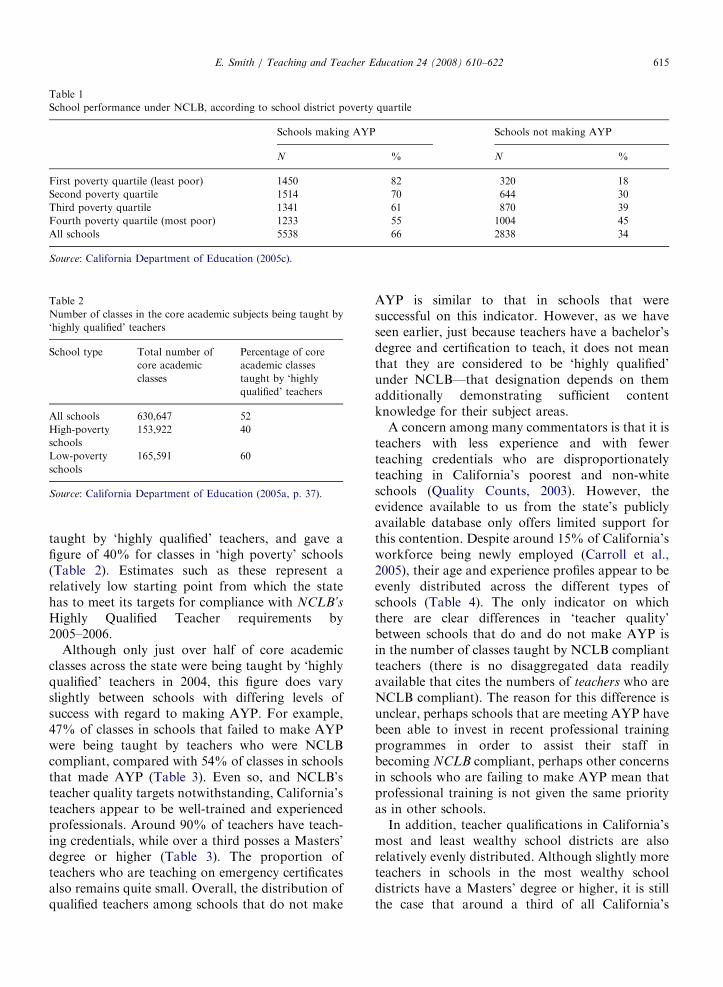
2005b). In 2003–2004, the consequences of severalconsecutive years of failure to meet AYP require-ments resulted in over 1 million students beingeligible to relocate to another school in their district,although only 3609 actually chose to do so(California Department of Education, 2005a). Aswe can see in Table 1, it is the schools in the poorestschool districts3 that are failing to make AYP. Forexample, 45% of the schools in the highest povertyschool districts did not make AYP in 2004,compared with only 18% of schools in low-povertydistricts (Table 1).
4.2. The characteristics of California’s teachers
In 1999 only 46% of California’s school districtsrequired teachers to hold full standard statecertification in their subjects, and only 30%required a subject major or minor (Carroll et al.,2005). However, under NCLB, to be termed ‘highlyqualified’ in California, a teacher of core academicsubjects must have a bachelor’s degree; a statecredential or have held an intern certificate/creden-tial for no more than 3 years and demonstrated coreacademic subject-matter competence (CaliforniaDepartment of Education, 2004). In 1996, Califor-nia implemented an ambitious $1.6 billion a yearprogramme to reduce class sizes from kindergartenthrough to the third grade from 30 students to 20.One consequence of the class size reductionprogramme was a dramatic increase in the recruit-ment of inexperienced and uncertified teachers,resulting in large gaps in the distribution of qualifiedteachers between schools attended by low-incomeand non-white students and others (Carroll et al.,2005; Jepsen & Rivkin, 2002). As a result, in 2000only 50% of grade 7–12 mathematics teachers hadboth a major in their field and state certification(Blank, Langesen, Laird, Toye, & de Mello, 2004).In order to meet the mandates of NCLB, Californiahas invested large sums in programmes to recruitand train teachers. In addition to a well-fundedteacher induction programme, the state has in-creased the amount it spends on programmes torecruit teachers from around $14 million in 1998 to$160 million 2 years later (Carroll et al., 2005).
In Spring 2004, California estimated that around52% of classes in core academic subjects were
ARTICLE IN PRESS
Table 2
Number of classes in the core academic subjects being taught by
‘highly qualified’ teachers
School type Total number of
core academic
classes
Percentage of core
academic classes
taught by ‘highly
qualified’ teachers
All schools 630,647 52
High-poverty
schools
153,922 40
Low-poverty
schools
165,591 60
Source: California Department of Education (2005a, p. 37).
Table 1
School performance under NCLB, according to school district poverty quartile
Schools making AYP Schools not making AYP
N % N %
First poverty quartile (least poor) 1450 82 320 18
Second poverty quartile 1514 70 644 30
Third poverty quartile 1341 61 870 39
Fourth poverty quartile (most poor) 1233 55 1004 45
All schools 5538 66 2838 34
Source: California Department of Education (2005c).
E. Smith / Teaching and Teacher Education 24 (2008) 610–622 615
taught by ‘highly qualified’ teachers, and gave afigure of 40% for classes in ‘high poverty’ schools(Table 2). Estimates such as these represent arelatively low starting point from which the statehas to meet its targets for compliance with NCLB’s
Highly Qualified Teacher requirements by2005–2006.
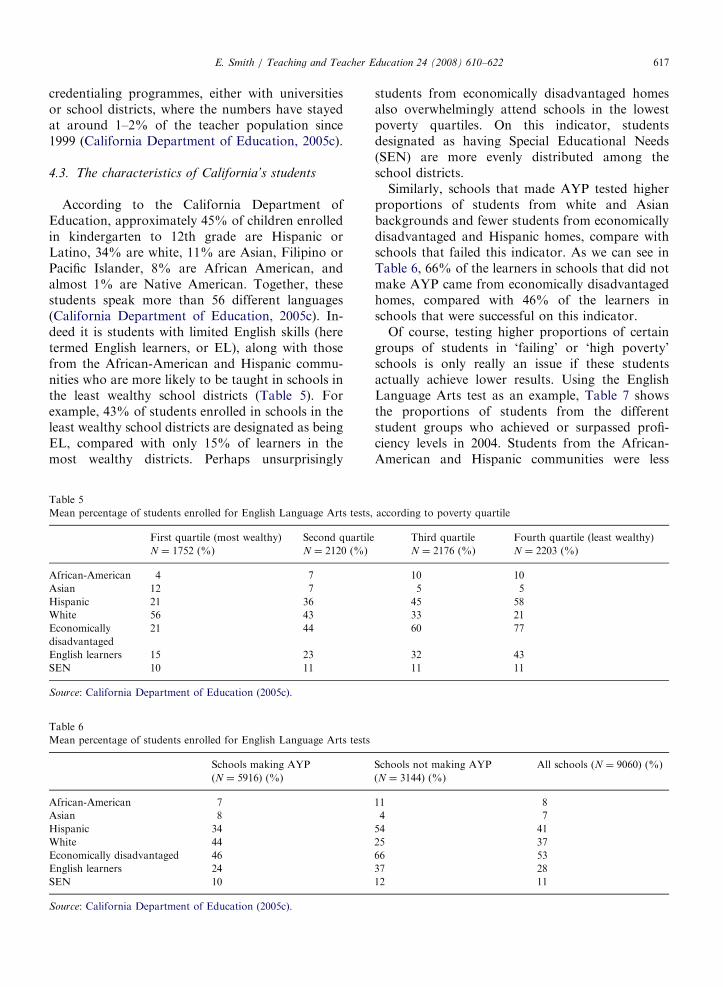
Although only just over half of core academicclasses across the state were being taught by ‘highlyqualified’ teachers in 2004, this figure does varyslightly between schools with differing levels ofsuccess with regard to making AYP. For example,47% of classes in schools that failed to make AYPwere being taught by teachers who were NCLBcompliant, compared with 54% of classes in schoolsthat made AYP (Table 3). Even so, and NCLB’steacher quality targets notwithstanding, California’steachers appear to be well-trained and experiencedprofessionals. Around 90% of teachers have teach-ing credentials, while over a third posses a Masters’degree or higher (Table 3). The proportion ofteachers who are teaching on emergency certificatesalso remains quite small. Overall, the distribution ofqualified teachers among schools that do not make
AYP is similar to that in schools that weresuccessful on this indicator. However, as we haveseen earlier, just because teachers have a bachelor’sdegree and certification to teach, it does not meanthat they are considered to be ‘highly qualified’under NCLB—that designation depends on themadditionally demonstrating sufficient contentknowledge for their subject areas.
A concern among many commentators is that it isteachers with less experience and with fewerteaching credentials who are disproportionatelyteaching in California’s poorest and non-whiteschools (Quality Counts, 2003). However, theevidence available to us from the state’s publiclyavailable database only offers limited support forthis contention. Despite around 15% of California’sworkforce being newly employed (Carroll et al.,2005), their age and experience profiles appear to beevenly distributed across the different types ofschools (Table 4). The only indicator on whichthere are clear differences in ‘teacher quality’between schools that do and do not make AYP isin the number of classes taught by NCLB compliantteachers (there is no disaggregated data readilyavailable that cites the numbers of teachers who areNCLB compliant). The reason for this difference isunclear, perhaps schools that are meeting AYP havebeen able to invest in recent professional trainingprogrammes in order to assist their staff inbecoming NCLB compliant, perhaps other concernsin schools who are failing to make AYP mean thatprofessional training is not given the same priorityas in other schools.
In addition, teacher qualifications in California’smost and least wealthy school districts are alsorelatively evenly distributed. Although slightly moreteachers in schools in the most wealthy schooldistricts have a Masters’ degree or higher, it is stillthe case that around a third of all California’s
ARTICLE IN PRESS
Table 3
Teacher qualifications in California, according to school type
Schools making AYP Schools not making AYP All schools
N Mean N Mean N Mean
Classes taught by NCLB compliant teachers (%) 5872 54 3048 47 8920 52
Completed a teacher preparation programme (%) 5969 94 3149 89 9118 92
Teaching with emergency credentials (%) 5969 4 3149 6 9118 4
Teachers with an MA degree or higher (%) 5974 35 3155 34 9129 35
Source: California Department of Education (2005c).
Table 4
Teacher experience in California, according to school type
Schools making AYP
(N ¼ 5999) (years)
Schools not making AYP
(N ¼ 3164) (years)
All schools (N ¼ 9163)
(years)
Mean teaching experience (district) 11 10 11
Mean teaching experience (total) 14 13 14
Mean age of teachers 44 44 44
Source: California Department of Education (2005c).
0
10
20
30
40
50
60
70
1994 1995 1996 1997 1998 1999 2000 2001 2002 2003
most wealthy least wealthy all schools
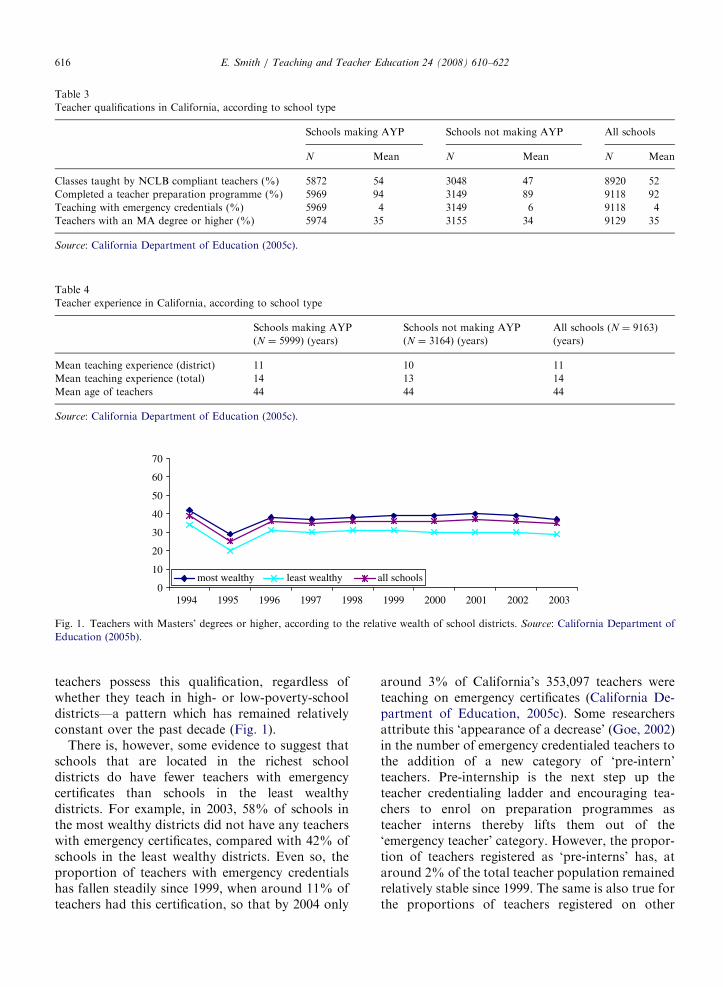
Fig. 1. Teachers with Masters’ degrees or higher, according to the relative wealth of school districts. Source: California Department of
Education (2005b).
E. Smith / Teaching and Teacher Education 24 (2008) 610–622616
teachers possess this qualification, regardless ofwhether they teach in high- or low-poverty-schooldistricts—a pattern which has remained relativelyconstant over the past decade (Fig. 1).
There is, however, some evidence to suggest thatschools that are located in the richest schooldistricts do have fewer teachers with emergencycertificates than schools in the least wealthydistricts. For example, in 2003, 58% of schools inthe most wealthy districts did not have any teacherswith emergency certificates, compared with 42% ofschools in the least wealthy districts. Even so, theproportion of teachers with emergency credentialshas fallen steadily since 1999, when around 11% ofteachers had this certification, so that by 2004 only
around 3% of California’s 353,097 teachers wereteaching on emergency certificates (California De-partment of Education, 2005c). Some researchersattribute this ‘appearance of a decrease’ (Goe, 2002)in the number of emergency credentialed teachers tothe addition of a new category of ‘pre-intern’teachers. Pre-internship is the next step up theteacher credentialing ladder and encouraging tea-chers to enrol on preparation programmes asteacher interns thereby lifts them out of the‘emergency teacher’ category. However, the propor-tion of teachers registered as ‘pre-interns’ has, ataround 2% of the total teacher population remainedrelatively stable since 1999. The same is also true forthe proportions of teachers registered on other
ARTICLE IN PRESSE. Smith / Teaching and Teacher Education 24 (2008) 610–622 617
credentialing programmes, either with universitiesor school districts, where the numbers have stayedat around 1–2% of the teacher population since1999 (California Department of Education, 2005c).
4.3. The characteristics of California’s students
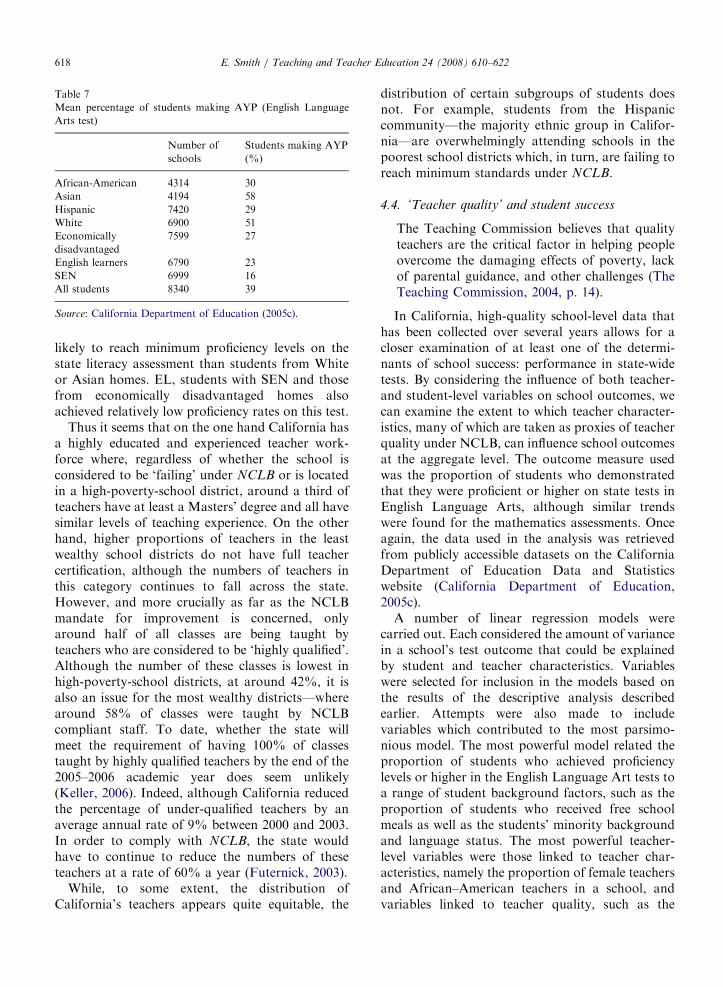
According to the California Department ofEducation, approximately 45% of children enrolledin kindergarten to 12th grade are Hispanic orLatino, 34% are white, 11% are Asian, Filipino orPacific Islander, 8% are African American, andalmost 1% are Native American. Together, thesestudents speak more than 56 different languages(California Department of Education, 2005c). In-deed it is students with limited English skills (heretermed English learners, or EL), along with thosefrom the African-American and Hispanic commu-nities who are more likely to be taught in schools inthe least wealthy school districts (Table 5). Forexample, 43% of students enrolled in schools in theleast wealthy school districts are designated as beingEL, compared with only 15% of learners in themost wealthy districts. Perhaps unsurprisingly
Table 5
Mean percentage of students enrolled for English Language Arts tests,
First quartile (most wealthy)
N ¼ 1752 (%)
Second quartile
N ¼ 2120 (%)
African-American 4 7
Asian 12 7
Hispanic 21 36
White 56 43
Economically
disadvantaged
21 44
English learners 15 23
SEN 10 11
Source: California Department of Education (2005c).
Table 6
Mean percentage of students enrolled for English Language Arts tests
Schools making AYP
(N ¼ 5916) (%)
African-American 7
Asian 8
Hispanic 34
White 44
Economically disadvantaged 46
English learners 24
SEN 10
Source: California Department of Education (2005c).
students from economically disadvantaged homesalso overwhelmingly attend schools in the lowestpoverty quartiles. On this indicator, studentsdesignated as having Special Educational Needs(SEN) are more evenly distributed among theschool districts.
Similarly, schools that made AYP tested higherproportions of students from white and Asianbackgrounds and fewer students from economicallydisadvantaged and Hispanic homes, compare withschools that failed this indicator. As we can see inTable 6, 66% of the learners in schools that did notmake AYP came from economically disadvantagedhomes, compared with 46% of the learners inschools that were successful on this indicator.
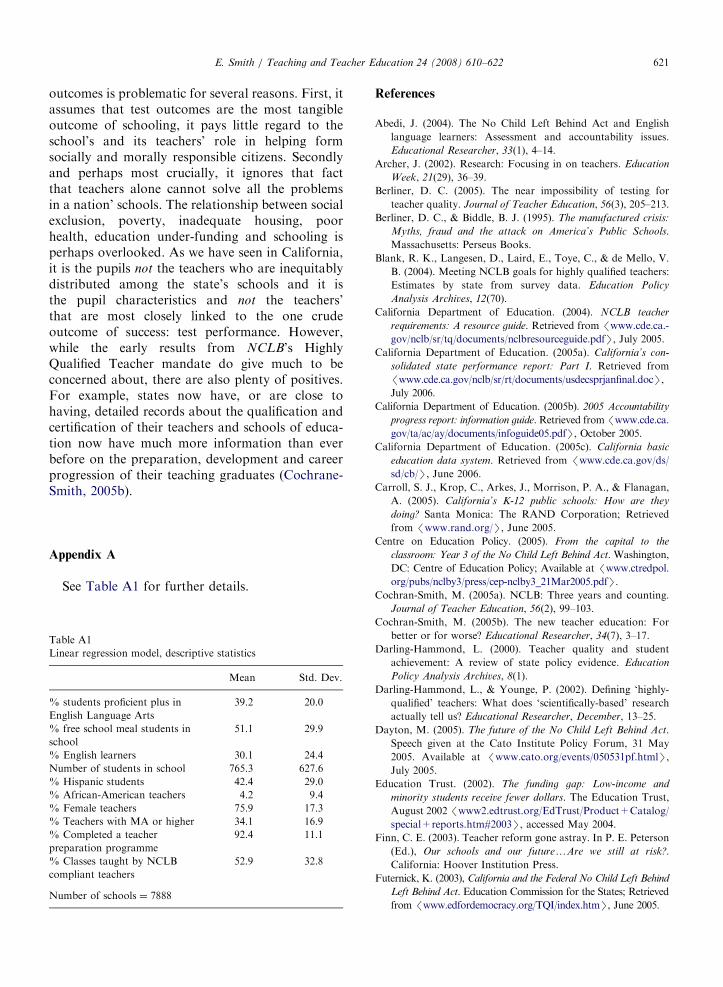
Of course, testing higher proportions of certaingroups of students in ‘failing’ or ‘high poverty’schools is only really an issue if these studentsactually achieve lower results. Using the EnglishLanguage Arts test as an example, Table 7 showsthe proportions of students from the differentstudent groups who achieved or surpassed profi-ciency levels in 2004. Students from the African-American and Hispanic communities were less
according to poverty quartile
Third quartile
N ¼ 2176 (%)
Fourth quartile (least wealthy)
N ¼ 2203 (%)
10 10
5 5
45 58
33 21
60 77
32 43
11 11
Schools not making AYP
(N ¼ 3144) (%)
All schools (N ¼ 9060) (%)
11 8
4 7
54 41
25 37
66 53
37 28
12 11
ARTICLE IN PRESS
Table 7
Mean percentage of students making AYP (English Language
Arts test)
Number of
schools
Students making AYP
(%)
African-American 4314 30
Asian 4194 58
Hispanic 7420 29
White 6900 51
Economically
disadvantaged
7599 27
English learners 6790 23
SEN 6999 16
All students 8340 39
Source: California Department of Education (2005c).
E. Smith / Teaching and Teacher Education 24 (2008) 610–622618
likely to reach minimum proficiency levels on thestate literacy assessment than students from Whiteor Asian homes. EL, students with SEN and thosefrom economically disadvantaged homes alsoachieved relatively low proficiency rates on this test.
Thus it seems that on the one hand California hasa highly educated and experienced teacher work-force where, regardless of whether the school isconsidered to be ‘failing’ under NCLB or is locatedin a high-poverty-school district, around a third ofteachers have at least a Masters’ degree and all havesimilar levels of teaching experience. On the otherhand, higher proportions of teachers in the leastwealthy school districts do not have full teachercertification, although the numbers of teachers inthis category continues to fall across the state.However, and more crucially as far as the NCLBmandate for improvement is concerned, onlyaround half of all classes are being taught byteachers who are considered to be ‘highly qualified’.Although the number of these classes is lowest inhigh-poverty-school districts, at around 42%, it isalso an issue for the most wealthy districts—wherearound 58% of classes were taught by NCLBcompliant staff. To date, whether the state willmeet the requirement of having 100% of classestaught by highly qualified teachers by the end of the2005–2006 academic year does seem unlikely(Keller, 2006). Indeed, although California reducedthe percentage of under-qualified teachers by anaverage annual rate of 9% between 2000 and 2003.In order to comply with NCLB, the state wouldhave to continue to reduce the numbers of theseteachers at a rate of 60% a year (Futernick, 2003).
While, to some extent, the distribution ofCalifornia’s teachers appears quite equitable, the
distribution of certain subgroups of students doesnot. For example, students from the Hispaniccommunity—the majority ethnic group in Califor-nia—are overwhelmingly attending schools in thepoorest school districts which, in turn, are failing toreach minimum standards under NCLB.
4.4. ‘Teacher quality’ and student success
The Teaching Commission believes that qualityteachers are the critical factor in helping peopleovercome the damaging effects of poverty, lackof parental guidance, and other challenges (TheTeaching Commission, 2004, p. 14).
In California, high-quality school-level data thathas been collected over several years allows for acloser examination of at least one of the determi-nants of school success: performance in state-widetests. By considering the influence of both teacher-and student-level variables on school outcomes, wecan examine the extent to which teacher character-istics, many of which are taken as proxies of teacherquality under NCLB, can influence school outcomesat the aggregate level. The outcome measure usedwas the proportion of students who demonstratedthat they were proficient or higher on state tests inEnglish Language Arts, although similar trendswere found for the mathematics assessments. Onceagain, the data used in the analysis was retrievedfrom publicly accessible datasets on the CaliforniaDepartment of Education Data and Statisticswebsite (California Department of Education,2005c).
A number of linear regression models werecarried out. Each considered the amount of variancein a school’s test outcome that could be explainedby student and teacher characteristics. Variableswere selected for inclusion in the models based onthe results of the descriptive analysis describedearlier. Attempts were also made to includevariables which contributed to the most parsimo-nious model. The most powerful model related theproportion of students who achieved proficiencylevels or higher in the English Language Art tests toa range of student background factors, such as theproportion of students who received free schoolmeals as well as the students’ minority backgroundand language status. The most powerful teacher-level variables were those linked to teacher char-acteristics, namely the proportion of female teachersand African–American teachers in a school, andvariables linked to teacher quality, such as the

ARTICLE IN PRESSE. Smith / Teaching and Teacher Education 24 (2008) 610–622 619
number of classes taught by NCLB compliantteachers, the number of teachers who were certifiedand the number who held a Masters’ qualificationor higher. In the final model the student- andteacher-level variables were entered as separateblocks. As our interest here was with students’ testoutcomes, it makes sense that the block containingstudent-level variables was entered into the modelfirst, followed by a second block of teacher-levelvariables. The amount of variance in schoolexamination outcomes that can be explained bythe student and teacher variables and the modelcoefficients for the multiple linear regression analy-sis are given in Table 8.
Table 8 shows that 69% of the variance in theEnglish Language Arts test outcomes can be
Table 8
Standardised beta coefficients for proficiency in English Lan-
guage Arts testsa
Standardized
beta coefficients
t Sig.
Block 1: Student characteristics
Constant 222.2 0.000
% Free school meal
students in school
�0.6 �66.2 0.000
% English learners 0.1 9.9 0.000
Number of students in
school
0.08 12.9 0.000
% Hispanic students �0.3 �28.1 0.000
Block 2: Teacher characteristics
Constant 38.5 0.000
% free school meal
students in school
�0.6 �56.9 0.000
% English learners 0.08 6.7 0.000
Number of students in
school
0.1 21.6 0.000
% Hispanic students �0.3 �29.9 0.000
% African-American
teachers
�0.1 �14.0 0.000
% Female teachers 0.1 21.1 0.000
% Teachers with MA
or higher
0.05 7.3 0.000
% Completed a
teacher preparation
programme
�0.01 �2.0 0.048
% Classes taught by
NCLB compliant
teachers
0.02 2.7 0.007
Block 1: Student variables only R2¼ 0.69
Block 2: Student and teacher variables R2¼ 0.72
aDescriptive statistics related to this model are presented in
Appendix A.
accounted for by student-level variables, with theteacher-level variables only explaining 3% of thevariance. The standardised b coefficients give us anidea of the strength of the relationship betweenthese variables and the test outcome. For example,the percentage of students in a school who receivefree school meals has a strong negative relationshipwith test outcomes. This relationship is so strongthat it suggests that if every other variable in thismodel remained the same, for every 1% increase inthe number of students with free school meals, theproportion of students achieving proficiency levelsor higher in the ELA test would go down by 0.6%.Similarly, for a school with a 10% increase in freeschool meal students, proficiency levels would fallby 6% and so on. It is also interesting to note thatthe teacher-level variables that have the strongestrelationship with test outcomes are related toteacher characteristics, the proportion of female orAfrican-American teachers in a school, and not toteacher quality, for example, the proportion ofteachers with Masters’ degrees. Variables relating tothe experience of teachers and the numbers teachingon emergency certificates had no impact on themodel and so were excluded from the analysis. It isimportant to remember that in this analysis severaldifferent models combining a range of teacher- andstudent-level characteristics were carried out. Ineach model the results consistently provided noevidence to support the contention that studentcharacteristics are ‘less influential in predictingachievement levels than variables assessing thequality of the teaching force’ (Darling-Hammond,2000). What the model does suggest is that teachercharacteristics, many of which are considered to beproxies for teacher quality under NCLB, are lessinfluential than student characteristics in predictingstudent academic outcomes.
5. Discussion
The NCLB Act is certainly equitable in its intentof ensuring that every student is taught by a ‘highlyqualified’ teacher. However, the definition of ‘highlyqualified’ is linked only to an individual’s knowl-edge of the subjects that they teach as defined bycontent tests that can be overly complicated andconfusing (Berliner, 2005). Of course, ‘teacherquality’ is an elusive measure and there is plentyof scope for arguing that holding a Masters’ degreedoes not necessarily confer quality. However, in thecontext of NCLB, these are the types of indicators

ARTICLE IN PRESSE. Smith / Teaching and Teacher Education 24 (2008) 610–622620
that count. There are no provisions under NCLB’shighly qualified teacher criteria to link teacherperformance directly to student achievement, or toassess classroom performance. Indeed some alter-native routes into teaching do not require thatprospective teachers spend any time in teachingpractice at all (US Department of Education, 2004).More fundamentally, the evidence base under-pinning many of the key aims of NCLB’s highlyqualified teacher provisions is unclear. It is not clearwhat qualities make a good teacher. High verbalskills and strong subject knowledge may be amongthem, but any list is unlikely to be exhaustive. Theresearch evidence is also unclear about the value ofa teaching certificate, or the effectiveness of alter-native routes into teaching.
In California, the teacher workforce largelycomprises well-qualified and highly experiencedprofessionals. Where differences do exist, theyindicate that schools that fail to make AYP haveslightly more teachers who have not completedteacher preparation programmes. But more worry-ingly perhaps for all schools, the number of coreacademic classes being taught by NCLB compliant‘highly qualified’ teachers, appears to fall short of its100% target. On other potential indicators ofquality, such as the number of experienced teachersor those with Masters’ degrees, the distribution ofteachers among the state’s schools seems reasonablyequitable. In contrast, the distribution of students
among the states’ ‘failing’ or high-poverty schoolsdoes appear to be less fair. Students from economic-ally disadvantaged homes along with those from theHispanic community are disproportionately attend-ing schools that are located in the highest povertyschool districts or are failing to reach minimumcompetency levels on state tests. This later findingwill, of course, come as no surprise to educators inthe US where the historical, economic, social andmoral consequences of the achievement gap are ofparamount concern (for example, Ladson-Billings,2006).
With regard to the determinants of schoolsuccess, here taken to be performance in high-stakestests, it is clear that the factors most closely linkedto school outcomes are not related to the quality ofteachers at all. Rather, it is the nature of the schoolstudent population that is most likely to determinehow a school performs on the state’s accountabilitytests and in turn makes AYP. This is not to say thatteachers cannot make a difference to individualstudents; however, as this analysis has shown, at
aggregate level, there is little evidence of a ‘teachereffect’.
In her Presidential Address to the 2005 meeting ofthe American Educational Research Association,Marilyn Cochrane-Smith drew attention on theemergence of a ‘new teacher education’ (Cochrane-Smith, 2005b), in which teacher education was beingconstructed as a policy problem, based on researchand evidence and driven by outcomes. Within eachof these three elements there are mixed opportu-nities and challenges for those involved in thetraining and development of practitioners. Withinthe policy context, she argues that teacher educationis considered by policymakers to be the key link toteacher quality. However, as we have seen in thediscussion above, there is little consensus andlimited research evidence to tell us what constitutesteacher quality and how to capture it when we findit. Certainly under NCLB, the key element ofteacher quality is subject competency. However, aswe have seen in California, around one third ofteachers possess a Masters’ degree qualification andthese teachers can be found equally among thestate’s schools—both high and low poverty.
Concerns about the quality of teaching professionare not confined to the United States. In Englandand Wales teacher training is now largely apostgraduate qualification that is undertaken fol-lowing a subject-specific 3 or 4-year undergraduatedegree programme. Of course, possessing a highlevel of subject knowledge is in itself no guarantee ofteaching quality and concerns about the quality ofteacher trainees do persist. One consequence of thisis that Initial Teacher Training programmes andteacher trainees in England are subjected to regularquality inspections by the schools inspectorate,Ofsted. However, even with such a closely regulatedsystem, there is still uncertainty that our teachersare of the ‘highest quality’. For example, in Englandstudents on Initial Teacher Training courses thathave been awarded the lowest grades for teachingquality by Ofsted Inspectors are just as likely asthose on higher performing courses to gain Quali-fied Teacher Status and a subsequent teaching post(Ref 2007).
Cochrane-Smith (2005b) goes on to argue thatprior to the mid-1990s, the emphasis in teachereducation was mainly about the pedagogical processand the inputs of education, whereas more recentlythe focus has shifted and is much more aboutoutcomes, and test outcomes in particular. Therelationship between teacher quality and test
ARTICLE IN PRESSE. Smith / Teaching and Teacher Education 24 (2008) 610–622 621
outcomes is problematic for several reasons. First, itassumes that test outcomes are the most tangibleoutcome of schooling, it pays little regard to theschool’s and its teachers’ role in helping formsocially and morally responsible citizens. Secondlyand perhaps most crucially, it ignores that factthat teachers alone cannot solve all the problemsin a nation’ schools. The relationship between socialexclusion, poverty, inadequate housing, poorhealth, education under-funding and schooling isperhaps overlooked. As we have seen in California,it is the pupils not the teachers who are inequitablydistributed among the state’s schools and it isthe pupil characteristics and not the teachers’that are most closely linked to the one crudeoutcome of success: test performance. However,while the early results from NCLB’s HighlyQualified Teacher mandate do give much to beconcerned about, there are also plenty of positives.For example, states now have, or are close tohaving, detailed records about the qualification andcertification of their teachers and schools of educa-tion now have much more information than everbefore on the preparation, development and careerprogression of their teaching graduates (Cochrane-Smith, 2005b).
Appendix A
See Table A1 for further details.
Table A1
Linear regression model, descriptive statistics
Mean Std. Dev.
% students proficient plus in
English Language Arts
39.2 20.0
% free school meal students in
school
51.1 29.9
% English learners 30.1 24.4
Number of students in school 765.3 627.6
% Hispanic students 42.4 29.0
% African-American teachers 4.2 9.4
% Female teachers 75.9 17.3
% Teachers with MA or higher 34.1 16.9
% Completed a teacher
preparation programme
92.4 11.1
% Classes taught by NCLB
compliant teachers
52.9 32.8
Number of schools ¼ 7888
References
Abedi, J. (2004). The No Child Left Behind Act and English
language learners: Assessment and accountability issues.
Educational Researcher, 33(1), 4–14.
Archer, J. (2002). Research: Focusing in on teachers. Education
Week, 21(29), 36–39.
Berliner, D. C. (2005). The near impossibility of testing for
teacher quality. Journal of Teacher Education, 56(3), 205–213.
Berliner, D. C., & Biddle, B. J. (1995). The manufactured crisis:
Myths, fraud and the attack on America’s Public Schools.
Massachusetts: Perseus Books.
Blank, R. K., Langesen, D., Laird, E., Toye, C., & de Mello, V.
B. (2004). Meeting NCLB goals for highly qualified teachers:
Estimates by state from survey data. Education Policy
Analysis Archives, 12(70).
California Department of Education. (2004). NCLB teacher
requirements: A resource guide. Retrieved from /www.cde.ca.-
gov/nclb/sr/tq/documents/nclbresourceguide.pdfS, July 2005.
California Department of Education. (2005a). California’s con-
solidated state performance report: Part I. Retrieved from
/www.cde.ca.gov/nclb/sr/rt/documents/usdecsprjanfinal.docS,July 2006.
California Department of Education. (2005b). 2005 Accountability
progress report: information guide. Retrieved from/www.cde.ca.
gov/ta/ac/ay/documents/infoguide05.pdfS, October 2005.California Department of Education. (2005c). California basic
education data system. Retrieved from /www.cde.ca.gov/ds/
sd/cb/S, June 2006.
Carroll, S. J., Krop, C., Arkes, J., Morrison, P. A., & Flanagan,
A. (2005). California’s K-12 public schools: How are they
doing? Santa Monica: The RAND Corporation; Retrieved
from /www.rand.org/S, June 2005.
Centre on Education Policy. (2005). From the capital to the
classroom: Year 3 of the No Child Left Behind Act. Washington,
DC: Centre of Education Policy; Available at /www.ctredpol.org/pubs/nclby3/press/cep-nclby3_21Mar2005.pdfS.
Cochran-Smith, M. (2005a). NCLB: Three years and counting.
Journal of Teacher Education, 56(2), 99–103.
Cochran-Smith, M. (2005b). The new teacher education: For
better or for worse? Educational Researcher, 34(7), 3–17.
Darling-Hammond, L. (2000). Teacher quality and student
achievement: A review of state policy evidence. Education
Policy Analysis Archives, 8(1).
Darling-Hammond, L., & Younge, P. (2002). Defining ‘highly-
qualified’ teachers: What does ‘scientifically-based’ research
actually tell us? Educational Researcher, December, 13–25.
Dayton, M. (2005). The future of the No Child Left Behind Act.
Speech given at the Cato Institute Policy Forum, 31 May
2005. Available at /www.cato.org/events/050531pf.htmlS,
July 2005.
Education Trust. (2002). The funding gap: Low-income and
minority students receive fewer dollars. The Education Trust,
August 2002 /www2.edtrust.org/EdTrust/Product+Catalog/
special+reports.htm#2003S, accessed May 2004.
Finn, C. E. (2003). Teacher reform gone astray. In P. E. Peterson
(Ed.), Our schools and our futureyAre we still at risk?.
California: Hoover Institution Press.
Futernick, K. (2003), California and the Federal No Child Left Behind
Left Behind Act. Education Commission for the States; Retrieved
from /www.edfordemocracy.org/TQI/index.htmS, June 2005.
ARTICLE IN PRESSE. Smith / Teaching and Teacher Education 24 (2008) 610–622622
Goe, L. (2002). Legislating equity: The distribution of emergency
permit teachers in California. Education Policy Analysis
Archives, 10(42); Retrieved November 2005 from /http://
www.epaa.asu.edu/epaa/v10n42/S.
Hanushek, E. A. (2002). Teacher quality. In L. T. Izumi, & W.
M. Evers (Eds.), Teacher quality. Hoover Institution Press
Publication No. 505.
Hanushek, E. A., & Rivkin, S. G. (2004). How to improve the
supply of high-quality teachers. In D. Ravitch (Ed.),
Brookings papers on education. Washington, DC: Brookings
Institution Press.
Hoxby, C. M. (2003). What has changed and what has not? In P.
Peterson (Ed.), Our schools and our futureyAre we still at
risk?. California: Hoover Institution Press.
Jepsen, C., & Rivkin, S. (2002). Class size reduction, teacher
quality and academic achievement in California Public Ele-
mentary Schools. San Francisco: The Public Policy Institute of
California.
Kaplan, L. S., & Owings, W. A. (2003). NCLB: The politics of
teacher quality. Phi Delta Kappan, 687–692.
Keller, B. (2006). No state meeting teacher provision of ‘no child’
law. Education Week, 24th May 2006.
Koret Task Force on K-12 Education. (2003). ‘y are we still at
risk?’, Findings and recommendations. In P. Peterson (Ed.),
Our schools and our futureyAre we still at risk?. California:
Hoover Institution Press.
Ladson-Billings, G. (2006). From the achievement gap to the
education debt: Understanding achievement in US Schools,
2006 Presidential Address to the American Educational
Research Association. Educational Researcher, 35(7), 3–12.
Linn, R. L. (2003). Accountability: Responsibility and reasonable
expectations. Educational Researcher, 32(7), 3–13.
Manzo, K. K. (2005). Study finds teachers are losing ground on
salary front. Education Week, 1 September 2005, p. 12.
McColl, A. (2005). Tough call: Is NCLB constitutional? Phi
Delta Kappan, 86, 604–610.
McDermott, K. A., & Jensen, L. S. (2005). Dubious sovereignty:
Federal conditions of aid and the NCLB act. Peabody Journal
of Education, 80(2), 39–56.
National Centre for Educational Statistics. (2005). The nation’s
report card: State profiles. Retrieved from /http://www.nce-
s.ed.gov/nationsreportcard/states/S, July 2005.
National Commission on Excellence in Education (NCEE).
(1983). A nation at risk. Washington, DC: US Department
of Education, US Printing Office.
Quality Counts. (2003). Quality counts: California. Education
Week, 22(17), 115–144.
Ravitch, D. (2003). A historic document. In P. E. Peterson (Ed.),
Our schools and our futureyAre we still at risk?. California:
Hoover Institution Press.
Rivers, J. C., & Sanders, W. L. (2002). Teacher quality and equity
in educational opportunity: Findings and policy implications.
In L. T. Izumi, & W. M. Evers (Eds.), Teacher quality.
Hoover Institution Press Publication No. 505.
Rudalevige, A. (2003). No Child Left Behind: Forging a
constitutional compromise. In P. Peterson, & M. West
(Eds.), No Child Left Behind? The politics and practice of
school accountability. Washington, DC: The Brookings
Institute.
Slack, J. L. (2005). New report details not-so-golden state
of California Education. Education Week, 12 January 2005,
pp. 1, 23.
Smith, E. (2005). Raising standards in American schools: The
case of No Child Left Behind. Journal of Education Policy,
20(4), 507–524.
The Teaching Commission. (2004). Teaching at risk: A call to action,
The Teaching Commission; Retrieved July 2006 from
/www.theteachingcommission.org/press/FINAL_Report.pdfS.US Department of Education. (2002), No Child Left Behind:
Executive summary. /www.ed.gov/nclb/overview/intro/presi-
dentplan/page_pg3.htmlS, accessed June 2004.
US Department of Education. (2004). Meeting the highly qualified
teachers challenge: The secretary’s second annual report on
teacher quality, Washington, DC.
Walsh, K. (2001). Teacher certification reconsidered: Stumbling
for quality. Maryland: The Abell Foundation Retrieved June
2006, from /www.educationnext.org/unabridged/20021/
walsh.pdfS.