
Raising Our Game · Raising Our Game. Original Brand Focus Contents 1 Message from the President 6...
31
ANNUAL REPORT 2017 For the year ended April 30, 2017 Raising Our Game
Transcript of Raising Our Game · Raising Our Game. Original Brand Focus Contents 1 Message from the President 6...

ANNUAL REPORT 2017For the year ended April 30, 2017
Raising Our Game

Original Brand
Focus
Contents
1 Message from the President
6 Growth Strategy 6 Dispensing Pharmacy Business 6 Main Characteristics of the Market 8 Pursuing of Top-line Growth 10 Responding to Changes in Business Environment 12 Committed to Quality Improvement 14 Drug and Cosmetic Store Business 14 Creating New Retail Formats 16 Building Brand Power
18 Corporate Governance
20 Board of Directors and Corporate Auditors
22 Financial Section 22 Management’s Discussion and Analysis of Financial Condition and Results of Operations 22 11-year Financial Summary 26 Consolidated Balance Sheet 28 Consolidated Statement of Income 28 Consolidated Statement of Comprehensive Income 29 Consolidated Statement of Changes in Net Assets 30 Consolidated Statement of Cash Flows 31 Notes to Consolidated Financial Statements 56 Independent Auditor’s Report
57 Investor Information
Forward-looking Statements
This annual report contains forecasts and projections concerning the plans, strategies and performance of AIN HOLDINGS INC. and its subsidiaries and affiliates. These forecasts and projections constitute forward-looking statements that are not historical facts, but are based on assumptions and beliefs in accordance with data currently available to management. These forward-looking statements are subject to a number of risks and uncertainties that include, but are not limited to, economic conditions, intense competition in the healthcare industry, demand, foreign exchange rates, tax systems, and laws and regulations. As such, AIN HOLDINGS INC. wishes to caution readers that actual results may differ materially from those projected.
Transforming the Drug and Cosmetic Store Business into the Group’s Second Earnings Pillar
Key Features of AIN HOLDINGS
AIN HOLDINGS ANNUAL REPORT 2017 1
The Leader in Japan’s Dispensing Pharmacy Sector
Fiscal 2016 (¥ million)
AIN HOLDINGS
Average of 3 competitors
Market capitalization 224,807 60,368
Cash on hand in banks 22,647 18,428
Interest-bearing debt 22,410 34,452
Net cash 236 (16,024)
Shareholders’ equity ratio 38.1% 30.0%
Fiscal 2017 (¥ million)
AIN HOLDINGS
Average of 3 competitors
Market capitalization 252,075 64,212
Cash on hand in banks 29,775 15,401
Interest-bearing debt 27,402 46,819
Net cash 2,371 (31,418)
Shareholders’ equity ratio 38.4% 28.1%
Notes:1. Market capitalization data are as of July 29, 2016 and July 31, 2017. 2. Interest-bearing debt = Short- and long-term debts + Corporate bond (excluding Lease obligations)3. Net cash = Cash on hand and in banks – Interest-bearing debt4. 3 competitors: NIHON CHOUZAI Co., Ltd., SOGO MEDICAL CO., LTD., Qol Co., Ltd.Source: Compiled by AIN HOLDINGS from the above companies’ financial results for fiscal 2016.
Sound Financial Structure
—Comparison of financial indexes among major companies operating dispensing pharmacies in Japan
Developing original brands, creating a distinctive product lineup
Raising the quality of dispensing pharmacies and pharmacists
Increasing brand visibility by opening stores in prime urban locations
Expanding the pharmacy network
Targeting young female shoppers
Focusing on dispensing pharmacies located near hospitals
Remain competitive after sector restructuring
Establish unique retail formats
Become the dominant player in the sector
Create a highly profitable business
» See pages 6-13 for more details
» See pages 14-17 for more details
History of Growth
250,000
200,000
150,000
100,000
50,000
0
(¥ million)
250,000
200,000
150,000
100,000
50,000
0
(¥ million)
2007/4 2008/4 2009/4 2010/4 2011/4 2012/4 2014/42013/4 2015/4 2016/4 2017/4
Revisionsto medical expenses
M&Adeals
1 M&A(18 stores)
2 M&As(91 stores)
1 M&A(3 stores)
—(3 stores)
6 M&As(35 stores)
9 M&As(28 stores)
11 M&As(38 stores)
13 M&As(26 stores)
15 M&As(119 stores)
23 M&As(110 stores)
38 M&As(182 stores)
Dispensing fees Drug prices
+0.22%
-2.65%
+0.17%
-7.77%
+0.17%
-5.20%
+0.46%
-6.0%
+0.52%
-5.75%
Net sales Dispensing pharmacy business Drug and cosmetic store business Other businesses Market capitalization (right scale)
Hokkaido 122
Kanto, Koshinetsu 456
Tohoku 143
HokurikuTokai, Kinki
260Chugoku, ShikokuKyushu, Okinawa
137
BranchesMajor group companies
Hokkaido 101
Kanto, Koshinetsu 432
Tohoku 142
HokurikuTokai, Kinki
254Chugoku, ShikokuKyushu, Okinawa
137
BranchesMajor group companies
—Our store network
1,118 stores nationwideDispensing pharmacy: 1,066 Drug and cosmetic store: 52(As of end-fiscal 2017)
Other Businesses ¥4,925 million
2.0%
Dispensing Pharmacy Business¥221,801 million 89.4%
Drug and CosmeticStore Business¥21,383 million 8.6%
Fiscal 2017 Consolidated
Net Sales¥248,110 million
Net Sales by Segment Scale of Business
Quality Scale
Focus

2 AIN HOLDINGS ANNUAL REPORT 2017 AIN HOLDINGS ANNUAL REPORT 2017 3
Message from the President
Given current conditions in Japan’s dispensing pharmacy sector » See pages 6-7 for more details , we believe
the key to growth lies in the pursuit of business scale. From that perspective, fiscal 2017, ended
April 30, 2017, marked a major milestone for the AIN Group. The number of dispensing pharmacies
in our network reached 1,066 (as of April 30, 2017), reinforcing our position as the largest company
in the sector.
For fiscal 2017, we reported net sales of ¥248,110 million, up 5.6% year on year, operating income
of ¥14,563 million, down 0.4%, and profit attributable to owners of parent of ¥7,949 million, up 0.4%.
Although sales rose year on year, they fell short of our start-of-year target. In the dispensing pharmacy
business, we projected sales of roughly ¥15 billion from individual drugs, but volumes were half the
level of our assumption. There was also a large impact on sales from drug price revisions. In the drug
and cosmetic store business, sales were affected by delays to the opening of ainz & tulpe stores and by
weak sales growth in the AYURA brand and online channels.
However, we made good progress on reinforcing our business base to support sustained growth.
In the dispensing pharmacy business, income from technical fees, an indicator of the strength of
dispensing pharmacies, exceeded our target three months ahead of schedule, highlighting how we
have reinforced frontline operations. We expect profits to grow steadily in fiscal 2018, ending April
30, 2018, when there are no scheduled revisions to dispensing fees and drug prices. In the drug and
cosmetic store business, we established a foothold to build our brands, opening ainz & tulpe stores in
retail facilities and in street-front locations, such as ainz & tulpe GINZA NAMIKIDORI, with a particular
focus on the Tokyo metropolitan area. » See pages 17 for more details
Number of AIN Group dispensing
pharmacies rises past 1,000.
Drug and cosmetic store business
starting to build brand power.
Kiichi Otani
President and Representative Director
Two businesses are supporting the Group’s stable growth
Some investors ask me why AIN HOLDINGS operates two businesses – dispensing pharmacies and drug
and cosmetic stores. The reasons are twofold: our presence in other fields enhances the diversity of our
business portfolio, and we believe it is important to explore promising opportunities in different fields
to support the Group’s sustained growth.
In the dispensing pharmacy business, the AIN Group is the leading player in Japan, but like any
company in the dispensing pharmacy sector, we are exposed to the impact of revisions to dispensing
fees and drug prices, which in principle are revised once every two years in line with government policy.
We therefore need multiple growth drivers to support long-term growth and generate stable earnings
on a Groupwide basis.
Steady growth in the dispensing pharmacy business has given us the scope to take on new
challenges with our drug and cosmetic store business, but dispensing pharmacies remain our core
business. Over the medium and long term, we expect the dispensing pharmacy business to continue
to account for roughly 90% of Group earnings. We are aiming to make the drug and cosmetic store
business profitable by the fiscal year ending April 30, 2019. By lifting the operating margin to 10%,
we aim to transform the drug and cosmetic store business into a second key source of earnings.
Continuing to grow our business to meet society’s expectations
Japan’s dispensing pharmacy market is worth ¥7.9 trillion, but it is projected to reach ¥10 trillion in the
medium to long term. The ratio of prescriptions filled outside hospitals (the non-hospital dispensing ratio)
now exceeds 71% and dispensing pharmacies are being called on to play a greater role in the provision
of local healthcare. On the other hand, the dispensing pharmacy sector is poised for a major realignment.
Some companies in the sector will probably fall by the wayside, but we view sector realignment as an
excellent opportunity for a new phase of growth. Until now, we have achieved sustained growth by
improving the quality of services and pursuing business scale. During that process, attracting and training
personnel has become one of the Group’s strengths, feeding into a positive cycle of service quality
improvement and rising earnings. Our operating environment is likely to become even more challenging,
but that will be the ideal opportunity to prove our business strategy is on the right track.
In Hokkaido, the AIN Group’s original market, conditions were not necessarily conducive to business
expansion, including from the standpoint of attracting pharmacists. We therefore adopted an M&A
strategy to grow our business and increase earnings. Ultimately, that has proven to be the best
approach. We plan to continue actively using M&A deals to drive growth in our business. With M&A
deals, we carefully narrow down acquisition targets based on the size of sales and by negotiating a fair
price in line with changing conditions in the sector. After rigorous due diligence, dispensing pharmacies
that become part of the AIN Group are rapidly integrated into our network and systems, helping them
to make a positive contribution to earnings as soon as possible. That process is another one of our
strengths as a Group.
We are channeling business resources into opening dispensing pharmacies located near hospitals.
Those pharmacies offer greater convenience for patients due to their close links with local hospitals
and accessibility, making them ideal centers for the provision of local healthcare. Profitability is also
higher than at pharmacies in other locations. » See pages 8-9 for more details We plan to expand our
network of dispensing pharmacies located near hospitals while closing locations with poor profitability
to create a leaner chain of pharmacies.

Message from the President
Providing full support to pharmacists and upgrading pharmacy operations
Pharmacists are the lifeblood of our dispensing pharmacy business. From the earliest days of the
Company, we have consistently focused on hiring and training pharmacists as a matter of priority. In
the fiscal year ended April 30, 2017, we hired 307 pharmacists, or roughly 10% of all newly graduated
pharmacists recruited in the sector. Approximately 4,500 pharmacists now work for the AIN Group. Our
hiring record and approach to recruitment is highly regarded by university and college students, which
has a significant positive knock-on effect in recruiting and training the next generation of pharmacists.
The government is promoting its vision for patient-focused dispensing pharmacies. In May 2017, to
address new demands on the sector arising from that policy, we integrated our personnel recruitment,
training and management systems, which had been separate until that point. The government’s vision
calls for dispensing pharmacies with primary care functions and advanced pharmaceutical management
capabilities. In response, we are implementing a range of initiatives to enhance the skills of our
pharmacists, including teaming up with university hospitals and social medical corporations to develop
and implement sophisticated healthcare simulation training programs. We are also recruiting local
pharmacy staff in each area and increasing the number of regular employees on our main career track
who can be assigned to posts nationwide, ensuring the optimal use of human resources.
In the AIN Group, a large number of our regular employees, myself included, are qualified as
pharmacists. In conjunction with efforts to improve pharmacy chain operations, we are continuing to
implement our pharmacy-led project aimed at increasing operational efficiency at existing pharmacies,
which encourages frontline pharmacists to identify areas for improvement at each pharmacy, backed by
support from head office. The project has helped us optimize inventories and find efficiencies in other
areas, making a significant contribution to earnings.
The pharmacy-led project has also been successful in encouraging frontline pharmacists to think
for themselves, which partly reflects my own background as a pharmacist, allowing me to oversee the
project from the standpoint of frontline staff. One of the most important jobs of senior management is
to create a working environment that motivates employees. Our goal at AIN HOLDINGS is to make sure,
first and foremost, that employees are happy working for us. We have built a reputation as a Company
that looks after its employees by providing maternity and childcare leave and an extensive package of
other benefits, resulting in a low employee turnover rate and stable business operations.
Creating Systems and Products to Build Brand Power
The drug and cosmetic store business is narrowing its target customer group to women in their
20s and 30s and accelerating efforts to establish new retail formats. By creating completely new
formats, our strategy is to avoid the impact of price competition and the narrowing quality gap in
the retail market. We continue to focus on building brands
and opening stores in carefully selected prime locations. For
example, in November 2016, we opened a new standalone
store in Tokyo’s Ginza shopping district to target both local
demand and inbound demand from overseas visitors.
We also need to launch hit products that help build
our brands. In autumn 2017, we plan to release a new
beauty serum marketed under our AYURA brand, and
we will recruit personnel to lead the development of new
products in apparel accessories. Our goal is to grow the
strong-performing LIPS and HIPS range and other original
4 AIN HOLDINGS ANNUAL REPORT 2017 AIN HOLDINGS ANNUAL REPORT 2017 5
July 31, 2017
Kiichi OtaniPresident and Representative Director
brands to lift the proprietary brand sales ratio.
As part of those efforts, we overhauled our organization in May 2017 to create a more
effective product branding process. The result is a new Design and Sales Promotion Division that
brings together all aspects of brand building into a single team under my direct supervision. I will
head up the team as it sets out and works toward clear objectives.
The AIN Group contains a large number of people who have studied pharmacology, so our
drug and cosmetic store business is in a relatively strong position when it comes to product
ingredients and functionality. We are also working to win and retain the trust of customers by
reducing the ratio of part-time staff in our stores and by ensuring well-trained employees carefully
communicate product efficacy and functions to customers. That approach sits at the heart of our
strategy. Just like our dispensing pharmacy business, our employees hold the key to growth in the
drug and cosmetic store business.
Taking the Group to a new level, backed by our strong financial position
On the financial side, we are focusing on operating income, ordinary income and the balance
sheet. In particular, we are keeping a close eye on the Group’s debt ratio. Learning from past issues
with cash flow, we now put great emphasis on ensuring the Group has a stable financial position.
Compared with peers, the AIN Group has very healthy finances with no net debt, making it easy for
us to secure funding for M&A deals or other moves if needed. However, based on the current size
and pace of our M&A strategy, we intend to fund acquisitions using cash flow alone. If we do take
on more debt, we plan to maintain the shareholders’ equity ratio at 40%. Our aim is to ensure our
financial position matches our position as the leading company in the dispensing pharmacy sector.
In the fiscal year ended April 30, 2017, we raised the full-year dividend to ¥50 per share, an
increase of ¥10 from the previous fiscal year. We have set a dividend payout ratio of 20%, as we
are currently putting priority on investing in growth, such as opening new pharmacies and stores.
We are aggressively acquiring other companies because we view current conditions in the sector
as a good opportunity to go on the offensive. As a result, goodwill amortization costs are rising
but not at a pace that undermines our financial position. We want to reward shareholders for
their support by increasing the share price. We continue to target ROE of 15%. The Group’s net
assets are also growing, so we want to increase earnings at an even faster pace. Our goal is to
generate consolidated net sales of more than ¥300 billion as soon as possible, leading to a higher
operating margin.
Business expansion has enhanced the Group’s ability to generate earnings. At the same time,
our employees are growing as individuals and developing their skills, setting the stage for an
exciting new phase in the company’s development as we take on new challenges. Going forward,
we plan to extend our network of dispensing pharmacies to all areas of Japan to play a key role in
all the local communities we serve. In the drug and cosmetic store business, we will expand new
retail formats and build ainz & tulpe into a powerful brand.
I hope we can count on your understanding and support as we roll out this strategy over the
medium and long term.

6 AIN HOLDINGS ANNUAL REPORT 2017 AIN HOLDINGS ANNUAL REPORT 2017 7
Growth Strategy
Q: What are the main characteristics of Japan’s dispensing pharmacy market?
A: The dispensing pharmacy sector is closely regulated but is one of Japan’s few growth markets. It is about to enter a period of consolidation.
Source: AIN HOLDINGS estimates, based on data from the Japan Pharmaceutical Association, dispensing cost trends issued by the Ministry of Health, Labour and Welfare, Population Estimates of the Ministry of Internal Affairs and Communications Statistical Bureau, and Cabinet Office White Paper on the Aging Society.
1989 1990 1995 20062000 2015 20162010 2025 (April to March year)
0
20
40
60
80
(%)
0
2
4
6
8
10
12
(¥ trillion)
2006-2015: annualized growth of 5.8%
2016 onwards: annualized growth of 3.0–5.0%
27.3%
7.9
20.8%
4.730.3%
80.0%
11.0%11.5%
0.47
Dispensing pharmacy market value Non-hospital dispensing ratio Ratio of elderly people
71.7%
55.8%
Top 50 major companies25.2%
Top 5 major companies*9.8%
Others74.8%
*Top 5 major companies: AIN HOLDINGS INC., NIHON CHOUZAI Co., Ltd., KRAFT Inc., Qol Co., Ltd., WELCIA HOLDINGS CO., LTD.
Source: AIN HOLDINGS estimates, based on data from DRUG Magazine (July 1,2017) and FY2016 dispensing fee statistics released by the Ministry of Health, Labour and Welfare.
Dispensing pharmacy company market share (Fiscal 2017)
Market growth
The dispensing pharmacy sector is one of only a few markets in Japan with prospects for growth over the medium to long term. However, companies operate under a number of restrictions, as the government determines drug prices and dispensing fees through adjustments once every two years*. * Drug prices and dispensing fees are revised regularly, usually once every two
years. However, the operating environment is likely to become even more challenging due to government plans for three successive years of revisions: April 2018 (regular revision), October 2019 (adjustments related to an increase in consumption tax) and April 2020 (regular revision).
Japan’s dispensing pharmacy market has developed in unique ways, supported by factors such as the government’s efforts to promote non-hospital dispensing services under a policy launched in 1994. We expect the market to continue expanding, driven by Japan’s super aging society, the ongoing shift to non-hospital dispensing services and the launch of new drugs. National healthcare policy is focused on disease prevention, but as society ages and medical treatments become more advanced, we are seeing a clear increase in healthcare costs per person. Also, hospitals still fill around
30% of prescriptions, which equates to around ¥2 trillion in prescription value. More prescriptions are likely to be filled outside hospitals as the government works to curb national medical expenses. The dispensing pharmacy market in Japan was worth roughly ¥7.9 trillion in fiscal 2015, but we expect those underlying trends to spur sustained annual growth of 3 to 5%, putting the market on track to reach ¥10 trillion over the medium term. The dispensing pharmacy sector is fragmented, with the top five companies accounting for only around 10% of the market, including the AIN Group’s leading share of roughly 3%. As of March 31, 2016, there were approximately 58,000 pharmacies in Japan, but most are run by small-scale family businesses. We believe the sector is about to enter a major phase of consolidation, with the severe shortage of pharmacists, tough new requirements on dispensing pharmacies and other changes in the operating environment spurring M&A deals or forcing smaller companies out of business. As more hospitals are rebuilt and relocated, we also see scope for further
growth in dispensing pharmacies located near hospitals, an area where we are targeting management resources. » See pages 8-9 for more details That offers the AIN Group
significant potential to increase market share. Meanwhile, the government is changing the direction of its social insurance policy as part of wider efforts to curb the continued rise in national medical expenses. As part of those changes, it has adjusted the reimbursement point system for dispensing fees to encourage growth in primary care dispensing pharmacies, which are being given a greater role to play in local healthcare provision. » See pages 10-11 for more details The government i s a l so
actively promoting wider use of generic drugs. As of February 28, 2017, generic drugs accounted for an average of 68.5% of all prescriptions in Japan. The government aims to increase that ratio to 80.0% by September 2020 by awarding dispensing pharmacies additional reimbursement points (premiums) for generic drug dispensing. The future of dispensing pharmacies will partly depend on their ability to contribute to this policy by increasing the generic drug
dispensing ratio, and on whether they can build operating structures that are resilient to declines in earnings caused by factors such as lower generic drug price margins.
» See pages 10-11 for more details
After implementing strategies that anticipated these developments in our operating environment, we view current conditions in the sector as a business opportunity.
Dispensing Pharmacy Business Main Characteristics of the Market
Q
A
Dispensing pharmacy market value
in 2025
¥10 trillion(Estimate)
Note: AIN HOLDINGS estimates based on data from a random survey conducted by the Ministry of Health, Labour and Welfare in August 2016 (1,000 dispensing pharmacies surveyed, 46.7% response rate).
Source: Report on Creating Dispensing Pharmacies for Patients, Ministry of Health, Labour and Welfare, March 31, 2017
Breakdown of the market
10-19: 8.8%
20-49: 9.4%
50-99: 3.6%
100-199: 3.2%
200-499: 3.0%
500 or more: 6.4%
By size of dispensing pharmacy group (Number of pharmacies)
By annual sales per dispensing pharmacy
1: 27.6%
2-9: 36.2%
¥0-59million:16.4%
¥120-179 million: 22.9%
¥180-239 million: 14.3%
¥240-299 million: 6.4%
¥300-359 millon: 3.6%
¥360 million or more: 6.2%No responsegiven: 1.7%
No responsegiven: 1.9%
¥60-119million:28.1%
Quality Scale
Focus

Drug stores with dispensing pharmacy functions (payout period: seven years)
Japan US
Medical insurance (patient cost)
Universal healthcare (10-30%)
Private health insurance (depends on contract terms)
Freedom to select hospitals / pharmacies
No restrictions Affiliated service providers
Non-hospital dispensing ratio
70% 100%
Drug prescriptions Refills × Mail order ×
Refills Mail order
Drug prices Set by the government (Usually revised once every two years)
Market price
Differences between Japan and the US
Comparison of earnings model
Dispensing pharmacies located near hospitals (payout period: four years)
Advantages of dispensing pharmacies located near hospitals
AIN HOLDINGS ANNUAL REPORT 2017 9
Growth Strategy
8 AIN HOLDINGS ANNUAL REPORT 2017
For patients For dispensing pharmacies
Convenient High marginsRegular visitors to hospitals, such as the elderly and patients with chronic disorders, tend to use dispensing pharmacies near hospitals because of the convenience
Margins tend to be high due to a large, steady volume of prescriptions and a large number of complex prescriptions
Well stocked Efficient inventory managementDrugs usually in stock Close links with local hospitals enable
efficient inventory management
Safe and reassuring Increase in specializationRegular information sharing with local hospitals mitigates risk related to inappropriate combinations of prescribed drugs and dispensing errors, supporting a high level of safety and peace of mind for patients.
Higher volume of prescriptions than drugstores with dispensing pharmacy functions, giving pharmacists more experience and greater specialization.
In simple terms, the outlook for our dispensing pharmacy business depends on how well it can adjust to changes in government policy. Our ability to adapt relies on two key factors: the location of our pharmacies and pharmacist
recruitment » See pages 12-13 for more details . About 99% of our dispensing pharmacies are located near hospitals, the result of a conscious strategy to select and channel management resources into those locations. Our approach reflects realities in Japan’s social environment and systems that make dispensing pharmacies located near hospitals the best option for patients, and for the AIN Group. Conditions in Japan’s dispensing pharmacy sector are very different to those in the US and other countries due to contrasting social environments and systems. Japan has a system of universal healthcare. The system does not restrict treatment or drug dispensing to certain hospitals or pharmacies based on the type of medical insurance held by patients or other criteria, allowing them to choose when and where they want their illness or injury to be treated.
Japan also has three main types of dispensing pharmacy: pharmacies located near hospitals, pharmacies not located near hospitals and drug stores with dispensing pharmacy functions. Patients are free to choose any type of pharmacy, but in urban markets in Japan, where cars are not used widely for daily errands, most patients tend to visit dispensing pharmacies located near hospitals immediately after their visit to the doctor. That reflects the significant benefits for patients who use those pharmacies and a sense of familiarity, because local hospitals dispensed drugs to patients before the non-hospital dispensing system was introduced. We expect this format to remain popular over the medium and long term, as many pharmacies near hospitals satisfy the government’s conditions for primary
care dispensing pharmacies, » See pages 10-11 for more details rather than drugstores with dispensing pharmacy functions. Dispensing pharmacies near hospitals also offer significant merits for our business, such as much higher average prescription prices and prescription volumes than
other types of pharmacy, supporting higher margins. Other merits include close links with local hospitals, helping pharmacies manage onsite drug inventories more efficiently. Pharmacists also gain experience and improve their skills, as they have to handle a high volume of complex prescriptions. By focusing on dispensing pharmacies located near hospitals, we can fully leverage our competitive advantages as a Group that recruits large numbers of skilled pharmacists and operates a nationwide pharmacy chain. Over the medium and long term, we will continue to channel management resources into dispensing pharmacies located near hospitals through new pharmacy openings and M&A deals, as we believe they are the best format to develop our dispensing pharmacy business. We will also continue to focus on developing medical malls, aiming to open them near stations and other urban areas with high customer traffic.
Q: Why does the AIN Group focus on dispensing pharmacies located near hospitals?
A: Pharmacies near hospitals are more convenient for patients and generate higher margins than other types of pharmacies.
Q
A
Dispensing Pharmacy Business Pursuing of Top-line Growth
AIN Pharmacy EBETSU
150
50
-100
-50
100
0
1 2 3 4 5 6 10987
(¥ million)
Out In
-58.4
-36.9
5.9
48.8
Net cash
Elapsed years
134.6 150
50
-100
-50
100
0
1 2 3 4 5 6 10987
(¥ million)
Out In
-31.0 -27.8 -16.20
Net cash
Elapsed years
30.1
Dispensing pharmacies located
near hospitals in the Group
About 99%
AIN Pharmacy Fujisawa SST
AIN Pharmacy NEWoMan SHINJUKU

we have narrowed down our suppliers to only a few firms, further strengthening our buying power. That helps us secure large drug price margins for generic drugs, which is one of the AIN Group’s competitive advantages. With dispensing fees, the government is using revisions as a tool to push through its vision for a new role for dispensing pharmacies, aiming to address issues such as Japan’s aging society and rising national medical expenses. Those revisions are having a large impact on our operations. Dispensing fee revisions since April 2014 clearly reflect the government’s policy of favoring dispensing pharmacies that can help curb national medical expenses and support community-based healthcare. Criteria for securing additional reimbursement points were adjusted in line with that policy. Dispensing pharmacies now have to offer higher quality services, such as management of left over prescription medicines, patient health management, cooperation with local healthcare providers, 24-hour dispensing services and home-based healthcare, in addition to their traditional role of drug dispensing.
Dispensing fees are gradually being revised so that only dispensing pharmacies that provide these services will be able to generate profits. Conditions for companies in the sector are therefore likely to become even more challenging as it becomes harder to secure technical fees. Against that backdrop, the ability to attract pharmacists and provide high-quality training will create a gap in competitiveness between companies in the sector. To respond to the impact of rev is ions, we are encouraging pharmacists at each pharmacy to identify areas for improvement in frontline operations. By taking on-board their ideas, we are optimizing inventories, enhancing the working environment for pharmacists and improving staff retention rates as part of sustained efforts to boost earnings and increase corporate value.
10 AIN HOLDINGS ANNUAL REPORT 2017 AIN HOLDINGS ANNUAL REPORT 2017 11
Growth Strategy
Q: What factors affect profitability in the dispensing pharmacy sector?
A: The ability to respond to challenges in the operating environment, such as continuous revisions to dispensing fees and drug prices and a shortage of trained pharmacists, has a large impact on profitability.
Revisions to dispensing fees and drug prices, usually implemented once every two years, lead to lower drug prices and tighter standards for dispensing fees. To remain competitive in the face of those changes, we need a strategy that mitigates the impact of revisions to both drug prices and dispensing fees. Profits in the dispensing pharmacy business tend to decline temporarily in the fiscal year when the review is carried out, followed by a large recovery in earnings in the following fiscal year when there are no changes to drug prices or dispensing fees. The entire dispensing pharmacy sector is at the mercy of this cycle. However, profits are increasingly under pressure at dispensing pharmacies that cannot respond to those changes. Profits at dispensing pharmacies are derived from two main sources: drug price margins and dispensing fees. The drug price margin is dictated by price negotiations with drug wholesalers. Under current conditions in the sector, companies will struggle to increase sales per pharmacy due to continuous revisions to drug prices and limited prospects for significant growth in the number of
patients using dispensing pharmacies located near hospitals. That is why we need to expand our business through M&A deals and other means. The AIN Group sources original drugs from major wholesalers, but in the case of generic drugs, we negotiate prices and procure products directly from manufacturers through our own dedicated generic drug wholesaler, WHOLESALE STARS Co., Ltd. (WSS). We established WSS in 2006, when the government started actively promoting wider use of generic drugs. We procure more generic drugs than any other company in Japan and
The changing role of dispensing pharmacies
Factors that affect dispensing pharmacy profitability Dispensing Pharmacy Business
Q
A
Guidance for drug usage
(criteria for primary care dispensing pharmacies)
Integrated management of drug usage and other treatments
Pre-avoid activities
Management of leftover medicines
24-hour support
Support for home-based healthcareand nursing care
Promote generic drugs
Dispensing drugs
From now onIn the past
Focused on dispensing drug
Trends in Dispensing Fees
Conventionaldispensing services
receive lessreimbursement points
Primary care services receive
more reimbursement points
Guidance for drug usage
Dispensing drugs
Earnings=
Drug price margins
+
Technical fees
Maintains genericdrug pricemargins
Negotiates withand buys directly
from genericdrug makers
Selects preferred
generic drugs
Monitors andmanages total
generic drug usage across the Group
Genericdrug
makers
AINGroup
dispensing pharmacies
WSSLinks with Group’s dispensing pharmacies Generic drug procurement
Roles and merits of WSS
Responding to Changes in Business Environment
Note: Graph shows year-on-year change in operating income from fiscal 2015 to fiscal 2018. For fiscal 2018, comparison is based on our operating income forecasts for 1H and 2H.
Impact of drug price and dispensing fee revisions on profits
60
20
-40
0
40
-20
(%)
15-1Q 2Q
3Q
4Q
16-1Q
2Q
3Q
4Q
17-1Q
2Q
3Q
4Q
18-2Q
(Estimate)
4Q
(Estimate)
Fiscal year after revisionFiscal year with revision Fiscal year after revision Fiscal year with revision
Government policies Management capabilities
Drug price revisions • Case by case ....................
Drug procurement • Low cost, high volume ....... • High cost, low volume .......
Scale (number of prescriptions and pharmacies) • Increase ............................ • Decrease ...........................
Dispensing fee revisions (criteria for additional reimbursement points) • Looser .............................. • Tighter ..............................
Hiring and training pharmacists • Higher quality (secure premiums) . • Lower quality ..............................
Inventory management • Optimized inventories .................. • Excess inventories .......................
Productivity at pharmacies • Improvement: lower personnel costs ................. • Deterioration: higher personnel costs ................
Head of�ce costs • Consolidation and streamlining.... • Uncontrolled increase ..................
Purchasing cost of drugs
Drug price margin Store operation costs + Store labor costs
Operating income
SG&A expenses
Total store sales*1
Dispensing pharmacy earning model
Gro
ss p
ro�t
Pharmaceutical management fees
Technical fees(includes premiums for generic drug dispensing) Increase earnings Decrease earnings
Sale
s fr
om d
rugs
Dis
pens
ing
fees
*2
*1: Dispensing pharmacies receive 0-30% of medical expenses depending on the type of insurance of customers. Dispensing pharmacies then charge the remainder of medical expenses to health insurance bodies such as national health insurance.*2: Dispensing fees comprise pharmaceutical management fees and technical fees for pharmacists.
These fees are added depending on the services at pharmacies.

Our pharmacy-led project to improve efficiency and services is also enhancing the skills of our staffWhen we launched our dispensing pharmacy business, our aim was to become the industry standard in Japan. That is why we focused on developing systemized manual-based dispensing pharmacy operations. However, as our focus on safety intensified and the business expanded, the number of operational manuals increased. That led to longer wait times for patients, resulting in lower-quality services. To address that issue, we launched a pharmacy-led project in 2012 to radically overhaul dispensing pharmacy operations. We asked our pharmacy staff to explore ways of improving efficiency and providing the best-possible services to patients
by identifying, acting on and then revisiting the most important aspects of pharmacy operations, while also ensuring compliance with all laws and regulations. Efficiency gains in operations naturally feed through to improvements in profitability, but the “Think, Act and Think Again” cycle is also accelerating the personal growth and development of our dispensing pharmacy staff, translating into improvements that go beyond what we could achieve by simply following operational manuals. The main job of dispensing pharmacists is to deal with patients. They have to decide the best course of action through their interactions with those patients. That it is an integral part of a pharmacist’s job, but it is also one way that patients, the government and other stakeholders assess the quality of services we provide to the local community. The government is calling on the dispensing pharmacy sector to raise the level of service provision. Through our pharmacy-led project, we are working to raise the quality of dispensing pharmacist activities and provide services to patients nationwide as a key part of Japan’s healthcare infrastructure.
12 AIN HOLDINGS ANNUAL REPORT 2017 AIN HOLDINGS ANNUAL REPORT 2017 13
Growth Strategy
600
400
500
100
200
300
0 2006/4 2007/4 2009/42008/4 2010/4 2011/4 2013/42012/4 2014/4 2015/4 2016/4 2018/4(plan)
2017/4
12
6
4
2
8
10
0
(%)
Company's share of new pharmacists that joined dispensing pharmacies after graduationPharmacists General positions
307
174
350
160
9.5
11.7
8.08.07.58.8
7.07.0 7.05.7
New graduates from six-year pharmacy college courses (new curriculum)No new graduates from pharmacy college courses
Increase in number of pharmacists hired
(persons)
Number of new pharmacist graduates hired
New store openings, pharmacies acquired through M&A deals and EV/EBITDA multiples
We anticipate a further increase in M&A activity as conditions in the dispensing pharmacy sector become tougher. The AIN Group has been actively opening new pharmacies and using M&A to expand its dispensing pharmacy network for some time. That track record, along with the trust we have built up as the leading company in the sector, as well as our strong financial position and high-quality training programs for pharmacists, means we are often given first refusal on a large number of potential M&A deals. Using those opportunities, we plan to further step up M&A activity to accelerate business expansion, while taking into account investment efficiency. We will also extend our competitive lead in the sector by recruiting large numbers of high-quality pharmacists and by raising the quality of pharmacy operations. To ensure our dispensing pharmacies fulfill their role as primary care pharmacies supporting the provision of local healthcare services, our pharmacists need to have more expertise and experience and better communication skills. We also need to hire more pharmacists to deliver the higher level
of service provision. Japan is currently facing a shortage of pharmacists, making it hard for dispensing pharmacies to secure the staff they need. This problem is particularly acute for small and medium-size companies. However, thanks to our track record in the sector and growing awareness of our high-quality training system, we have been able to hire enough staff. Our pharmacists undergo an extensive and sustained training program tailored to the current stage in their careers. They also have opportunities to build up their experience because the AIN Group has many dispensing pharmacies that handle a large number of complex prescriptions. In this way, we can attract large numbers of high-quality pharmacists, allowing us to contribute to the government’s policy of community healthcare while also boosting profits by securing more reimbursement points. The entire sector is facing headwinds, but we expect tougher conditions in the operating environment to trigger a wave of restructuring. Sector restructuring will be a major growth driver for our business, and we are ready to capitalize on any opportunity that arises.
Q: What is the AIN Group doing to stay competitive in the dispensing pharmacy business?
A: We are expanding the business and raising operational quality, giving us the ability to respond to any change in our operating environment.
Q
A
Company’s share of new pharmacists that
joined dispensing pharmacies after
graduation
9.5%(As of Apr. 2017)
Dispensing Pharmacy Business
A Message from Managing Director
Miya Oishi Managing Director and Senior General Manager, Operations Department
220
200
160
180
100
60
80
120
140
20
40
0 2008/4 2009/4 2010/4 2011/4 2012/4 2013/4 2014/4 2015/4 2016/4 2017/4
6.0
3.0
2.0
1.0
4.0
5.0
0
(times)
Num
ber o
f pha
rmac
ies EV/EBITDA m
ultiples
EV/EBITDA multiplesNew store openings Pharmacies acquired through M&A deals
182
32
5.50
Notes: 1. EV/EBITDA multiples = EV (M&A: acquisition price) / EBITDA (Operating income + Depreciation and amortization) 2. From fiscal 2011, number of pharmacies includes pharmacies that were subsequently closed.
Committed to Quality Improvement
2017 AIN Group’s initiation ceremony

The AIN Group started actively rolling out new retail formats in fiscal 2016. We stepped up our store opening program with two new flagship ainz & tulpe stores: SHINJUKU HIGASHIGUCHI (Shinjuku, Tokyo; retail space: 1,290m2) and Le trois (Sapporo, Hokkaido; retail space: 1,490m2). After clearly setting out our strategic direction, we are now channeling management resources into urban ainz & tulpe drug and cosmetics stores and rapidly developing new retail formats. Over the last few years, we have also exited suburban store locations, where a narrowing quality gap in retailing has put pressure on margins. The main target of our new retail format strategy is women in their 20s and 30s with a strong curiosity in the latest trends. We are also aiming to use our product lineup to stand out in the market. Our goal is to create a unique range of merchandise with high margins by creating original brands that eventually account for a high ratio of store sales. Conventional drugstores in Japan typically sell a mix of pharmaceuticals, food and daily necessities at discounted
prices, but at ainz & tulpe, cosmetics account for over 70% of products on sale, with accessories and other beauty products making up the remainder. In other words, ainz & tulpe is not competing directly with drugstores. To encourage female customers to spend one or two hours in our stores, we are expanding our range of beauty supplies and accessories to complement the existing cosmetics lineup. Another strength of our retail formats is that we have better access to tenant opportunities in fashion retail malls and department stores than conventional drugstores. To coincide with the roll out of the retail formats, we launched a new original cosmetics brand called LIPS and HIPS and a new beauty supply brand called cocodecica. We also acquired the AYURA cosmetics brand. We continue to develop new products in all three brands, leading to changes in the product mix that are lifting the gross margin. Demand for LIPS and HIPS products is especially strong. In response, we started sales of branded lounge outfits and opened a standalone LIPS and HIPS store in fiscal 2017.
Going forward, we plan to leverage the expertise and experience of our pharmacists to develop highly functional products to increase the number of product categories sold under our original brands. Our goal is to rapidly expand the product lineup, build powerful brands and create popular hit products to lift the gross margin and attract even more shoppers to our drug and cosmetic stores. In the fiscal year ended April 30, 2017, we sold 1,600 SKUs (Stock Keeping Units) of our new brands, accounting for 6.7% of sales in the drug and cosmetic store business. Our goal is to increase the gross margin further by raising the visibility of our original brands and growing sales.
Growth Strategy
AIN HOLDINGS ANNUAL REPORT 2017 15
ainz & tulpe Colette Mare SAKURAGICHO
2.9%4.6%
Beauty products
ainz & tulpe General drugstore
79.6%
13.1%14.9%
29.7%
27.8%
27.6%
Drugs and sanitary productsFoods and health foods Daily necessities
Beauty products
ainz & tulpe General drugstore
76.5%
14.6%
3.6%5.4%
15.1%
29.4%
28.5%
27.0%
Drugs and sanitary productsFoods and health foods Daily necessities
Comparison of ainz & tulpe and general drugstores: product mix and target
Source: Monthly Report on the Current Survey of Commerce (May 2017), Ministry of Economy, Trade and Industry
Q: How are the AIN Group’s new retail formats different to those of other companies?
A: Our stores stand out in the market by targeting female customers with a unique lineup of original products.
Drug and Cosmetic Store Business
Q
A
Beauty products sales ratio
79.6%
Original Brand
Focus
14 AIN HOLDINGS ANNUAL REPORT 2017
Creating New Retail Formats
LIPS and HIPS
LIPS and HIPS ROOM LIPS and HIPS sales area in ainz & tulpe Colette Mare SAKURAGICHO
cocodecica
AYURA

LIPS and HIPS SHINSAPPORO sunpiazza opened in November 2016
ainz & tulpe CHIKAGAI
ainz & tulpe Le trois
ainz & tulpe SAPPORO paseo
7
5
ainz & tulpe MARRONNIER GATE GINZANAMIKIDORI opened in March 20173
6
ainz & tulpe Colette Mare SAKURAGICHOopened in December 2016
ainz & tulpe KEIO DEPARTMENT STORE SHINJUKU opened in March 2017
2
4
1
Odori
Sapporo
Susukino
ainz & tulpe TSUKISAMU CHUO
ainz & tulpe SUSUKIO LAFILER
ainz & tulpe POLE TOWN
ainz & tulpe ODORI BISSE
ainz & tulpe SHINSAPPORO duo
ainz & tulpe Ario SAPPORO
ainz & tulpe HIGASHI KUYAKUSHOMAE
ainz & tulpe MIYANOSAWAEKI
ainz & tulpe KOTONI
ainz & tulpe maruyama class
ainz & tulpe ASABU
Shin-Sapporo7
4
5 6
Shinjuku
Tokyo
Shibuya
Yokohama
Ikebukuro
3
1
2
ainz & tulpe KITASENJU MARUI opened in December 2016
ainz & tulpe MARUI KINSICHO
ainz & tulpe frente MINAMIOSAWA
ainz & tulpe IKEBUKURO SEIBU
ainz & tulpe CHOFU
ainz & tulpe TOKYOEKI
ainz & tulpe GINZA NAMIKIDORI opened in November 2016
ainz & tulpe SHIBUYA CENTER-GAIainz & tulpe JIYUGAOKA
ainz & tulpe OMIYA MARUI ainz & tulpe KAWAGUCHI CASTYainz & tulpe TOKOROZAWA STATION
ainz & tulpe YOKOHAMA PORTAainz & tulpe MARUI CITY YOKOHAMA ainz & tulpe YOKOHAMA JOINUS opened April 2017
ainz & tulpe SHINJUKU HIGASIGUCHI
ainz & tulpe HARAJUKU QUEST
LIPS and HIPS TOKYU PLAZA OMOTESANDO HARAJUKU opened in April 2017
: Stores opend in FY 2017
Our product development strategy for proprietary merchandise brandsWe started developing proprietary brands in the fiscal year ended April 2015. Our initial plan was to create new brands to coincide with the opening of our Le trois beauty retail complex in September 2015, but we made rapid progress and launched the brands two months early in July 2015. One of the brands, LIPS and HIPS, has seen a steady improvement in visibility over the last two years. The next step is to create highly functional LIPS and HIPS products that are also a hit with customers. We plan to use those products to further raise brand visibility, helping to drive growth in sales volume for other LIPS and HIPS product lines and proprietary brands.
As a company that operates a chain of dispensing pharmacies, functionality is very important to us. The value of our proprietary brands is derived from the input of AIN Group pharmacists, who ensure our products use only high-grade ingredients and demonstrate clear efficacy. To help us accelerate in-house development, we are hiring people who have experience in product development at manufacturing companies. Going forward, we plan to step up efforts to create products that customers really want by bringing full-time store staff onto our product development teams to use their direct feedback from customers. We will also train human resources to reinforce in-house development capabilities. My mission is to increase the gross margin in the drug and cosmetic store business and rapidly put the business on a profitable footing. I will not be able to achieve my mission if focus only on developing new original brands. Brand development is important, but we also need to tackle other areas, such as raising the visibility of the ainz & tulpe brand in order to reinforce our negotiating position in product procurement and develop collaborative relationships with external brands.
Growth Strategy
16 AIN HOLDINGS ANNUAL REPORT 2017 AIN HOLDINGS ANNUAL REPORT 2017 17
The SHINJUKU HIGASHIGUCHI store boosted the visibility of our ainz & tulpe brand in one stroke. We have since received a large number of requests to open new stores in urban retail facilities, station shopping centers and other prime locations, as ainz & tulpe is now seen as attractive brand for young shoppers. That has given us more power in rent negotiations with property owners, which along with strong demand for our original brands, is supporting an improvement in the gross margin. In the fiscal year ended April 30, 2017, we focused on the Sapporo and Tokyo metropolitan areas, opening nine new stores in those markets, including the ainz & tulpe MARRONNIER GATE GINZA store (Ginza, Tokyo; retail space: 400m2). We now operate a total of 52 stores in our drug and cosmetic store business.
We will continue to open new stores in prime locations in Tokyo to raise brand visibility, while also creating new original products and retail areas to build a distinct position in the market that does not put us in direct competition with other retailers or cosmetics companies. By steadily increasing sales through our ainz & tulpe stores, we expect leading makers of cosmetics brands to request retail space in our stores. We are aiming to make the drug and cosmetic stores business profitable in the fiscal year ending April 30, 2019. Looking further ahead, we plan to continue actively developing the business to grow it into a second key source of earnings for the Group. We plan to roll out new formats and raise brand visibility so that in the long term our ainz & tulpe retail format and original brands are recognized in their own right. Everyone in the business is pushing themselves to achieve those objectives.
Q: What is the AIN Group doing to stay competitive in the drug and cosmetic store business?
A: We are opening stores in prime locations in urban markets and reinforcing our brands.
Q
A
Store opening program focused on the Tokyo metropolitan and Sapporo areas Drug and Cosmetic Store Business
Kaori Ishikawa Division Manager, Drug and Cosmetic Store Operations Division
Building Brand Power
ainz & tulpe GINZA NAMIKIDORI
Store ratio located in Tokyo and Sapporo
areas
71.2%Store opening
in FY 2018 (Plan)
6stores
[Tokyo metropolitan area]
[Sapporo area]
A Message from Division Manager

REMUNERATION FOR DIRECTORS AND AUDITORS
The maximum total amount of remuneration for directors was determined by a resolution at the 44th Ordinary General Meeting of Shareholders held on July 30, 2013 to be ¥300 million annually (does not include payments made to directors for their duties as employees; the maximum total amount for outside directors was determined to be ¥50 million annually). The maximum total amount of remuneration for corporate auditors was set at ¥30 million annually at the 22nd Ordinary General Meeting of Shareholders held on July 30, 1991.The actual amount each year is determined within this limit via discussions among the corporate auditors. The amount of remuneration for directors and corporate auditors for the year ended April 2017 is as follows:
STATUS OF ACCOUNTING AUDITS
Three certified public accountants from ERNST & YOUNG SHINNIHON LLC conducted the accounting audits of AIN HOLDINGS based on the Companies Act and Financial Instruments and Exchange Act. Audit fees for the year ended April 2017 are as follows:
OUTSIDE DIRECTORS AND OUTSIDE CORPORATE AUDITORS
The Board of Directors is comprised of nine members, including three outside directors. Two of the Company’s three corporate auditors are outside corporate auditors. There are no conflicts of interest between the Company and its outside directors and outside corporate auditors. The outside directors and outside corporate auditors have a number of functions and roles to fulfill in the Group’s corporate governance system. Drawing on their specialist knowledge and experience, they contribute to the Group’s business strategy, discussions on board resolutions, and internal control mainly by monitoring business execution and providing input at meetings of the Board of Directors from a neutral, independent and objective standpoint. The Company has no specific standards in place at the moment, but the basic policy for appointing outside directors and outside corporate auditors is to ensure they can effectively fulfill the above roles. Three outside directors and one outside corporate auditor have been designated as independent officers in accordance with the provisions of the Tokyo Stock Exchange.
ItemTotal
remuneration(¥ million)
Remuneration by type (¥ million) Number
of eligible individualsBasic
remuneration Bonus
Directors (excluding outside directors)
181 152 28 7
Corporate auditors (excluding outside corporate auditors)
6 6 – 1
Outside directors and outside corporate auditors
19 19 – 5
AIN HOLDINGS assumes responsibility for people’s health and the well-being of the wider community through its business activities. We promote a highly efficient and transparent management system and implement ongoing initiatives toward enhancement of corporate governance.
Dispensing pharmacies and drug and cosmetic store chains are the key business areas being developed by AIN HOLDINGS. Both of these businesses are characterized by a responsibility towards people’s health, and as such, we recognize the indispensability of continuing with sound and transparent business activities that prioritize compliance. We have adopted a corporate auditor system to oversee not only key management decisions and the business execution of directors, but also general corporate management. In order to ensure the effective mutual management oversight of directors, the Board of Directors convenes more than once a
month, while a management meeting is held for directors and the standing corporate auditor on a weekly basis. To minimize potential risks, the Internal Audit Office ensures comprehensive compliance with basic pharmacy regulations, while the Safety Policy Office conducts analysis and implements measures to prevent drug dispensing errors. As part of efforts to enhance corporate governance, we have established a Compliance Committee to promote and embed systems that ensure compliance with business ethics, laws and regulations. The committee is made up of all the Company’s directors and auditors and legal advisors.
18 AIN HOLDINGS ANNUAL REPORT 2017 AIN HOLDINGS ANNUAL REPORT 2017 19
Board of DirectorsOutside Directors
Board ofManaging Directors
ManagementMeeting
Group Companies
Board ofCorporate Auditors Accounting Auditors
AppointmentAppointment
Audit Audit
AuditOperational Support
DivisionOperating Management
DivisionStore Development Division
Appointment
Reporting Cooperation
Reporting
Internal Audit Of�ce
Appointment Appointment Appointment
Reporting
ComplianceCommittee
RepresentativeDirectors
Business executionExecutive Of�cers
Guidance Reporting
General Meeting of Shareholders
(¥ thousand)
Compensation paid for audit certification activities
Compensation paid for * non-audit activities
The Company 36,200 –Consolidated subsidiaries 7,500 –
Total 43,700 –
Corporate Governance
(As of July 28, 2017)
Corporate governance structure Corporate Auditor System
Chairman of the Board Kiichi Otani
Number of directors 9 (including 3 outside directors)
Number of corporate auditors 3 (including 2 outside corporate auditors)
Board of Directors meetings in fiscal 2017 Number of meetings: 12Examples of resolutions: Annual budget, issues related to new businesses, store openings
Outside Director attendance at Board of Directors meetings: 97%
Outside Corporate Auditor attendance at Board of Directors meetings: 100%
Board of Corporate Auditor meetings in fiscal 2017
Number of meetings: 12Examples of resolutions: Audit policy, audit plans and business division audits
Management meetings in fiscal 2017 52
Key meetings attended by corporate auditors Board of Directors meetings, Board of Corporate Auditor meetings, Management meetings
Independent director appointment Outside directors Ko Mori, Yasuyuki Hamada and Shigeki Kimura and outside corporate auditor Osamu Muramatsu have all been designated as independent officers in accordance with the provisions of the Tokyo Stock Exchange.
Systems to strengthen and promote Group management Group management meetings (weekly)
Accounting auditor ERNST & YOUNG SHINNIHON LLC
Reasons for selection of outside directors
Ko Mori
Mr. Mori was appointed as an outside director to broadly contribute to the Company’s activities by providing advice to the Board of Directors and other bodies and by monitoring business execution, drawing on his extensive knowledge and experience as the manager of a major trading company. Mr. Mori is judged to be a highly independent and objective appointment, as he has no affiliation with the parent company, its subsidiaries, major corporate shareholders or key customers of the Group.
Yasuyuki Hamada
Mr. Hamada was appointed as an outside director to broadly contribute to the Company’s activities by providing advice to the Board of Directors and other bodies and by monitoring business execution. Although Mr. Hamada has no experience of business management, he is able to draw on his specialist knowledge and experience as an academic, particularly in the field of economics and finance. Since April 2010, Mr. Hamada has been an emeritus professor at Hokkaido University, which has received donations from the Company in the past. However, he is judged to be a sufficiently independent appointment, as the purpose of the donations was limited and they were not directly related to Mr. Hamada’s research activities.
Shigeki Kimura
Mr. Kimura was appointed as an outside director to broadly contribute to the Company’s activities by providing advice to the Board of Directors and other bodies and by monitoring business execution, drawing on his specialist knowledge and experience from working in the accounting department of a major retailer. Mr. Sato works for Seven-Eleven Japan Co., Ltd., which has a business relationship and lease contracts with the Company. However, he is judged to be a sufficiently independent appointment, as the interdependence of Seven-Eleven Japan Co., Ltd. And the Company is low due to a minimal level of business between the two companies. He has no special interest in the Company.
Reasons for selection of outside corporate auditors
Akira Ibayashi
A k i r a I b a y a s h i w a s a p p o i n t e d a s a n outside corporate auditor to contribute to improvements in sound and efficient business management, drawing on his special ist knowledge f rom work ing at f inanc ia l institutions and his experience in business management.
Osamu Muramatsu
Osamu Muramatsu was appointed as an outside corporate auditor to contribute to improvements in sound and efficient business management, drawing on his special ist knowledge from working at a major securities firm, experience in business management and track record as an outside auditor for the Group.
OUTLINE OF CORPORATE GOVERNANCE
BASIC POLICY FOR CORPORATE GOVERNANCE

Board of Directors and Corporate Auditors
(As of July 28, 2017)
20 AIN HOLDINGS ANNUAL REPORT 2017 AIN HOLDINGS ANNUAL REPORT 2017 21
Kiichi OtaniPresident and Representative Director (3,238,400 shares)
July 1980 President and Representative Director of Otani Corporation (now AIN HOLDINGS INC.)
November 1981 Director of newly established Daiichi Medical Testing Laboratories Co., Ltd. (Asahikawa, now AIN HOLDINGS INC.)
July 1983 President and Representative Director of Daiichi Medical Testing Laboratories Co., Ltd.
May 1985 Managing Director of the CompanyMay 1988 President and Representative Director
(current post)June 2009 Director of Seven Health Care Co., Ltd.
Masahito SakuraiRepresentative Senior Managing Director (1,000 shares)
April 1972 Joined Ministry of Health and Welfare (now Ministry of Health, Labour and Welfare)
April 1987 Head of Administration Section, Fund for Drug ADR Relief
July 1996 Head of Air Protection Section, Japan Environment Agency
July 1998 Head of Regional Medical Affairs Office for Tokai Hokuriku
January 2001 Retired from Ministry of Health and WelfareFebruary 2001 Commissioner of All-Japan Federation of
National Health Insurance OrganizationsOctober 2008 Joined the CompanyJuly 2009 Senior Managing DirectorNovember 2015 Senior Managing Director and
Representative Director (current post)
Rieko KimeiDirector Head of Personnel Department (6,000 shares)
April 1986 Joined The Daiei, Inc. December 1995 Joined Daiichi Medical Testing
Laboratories Co., Ltd. (now AIN HOLDINGS INC.)
May 2003 General Manager of Drug and Cosmetic Store Business, Merchandising Business
May 2004 General Manager of Personnel Department
August 2009 Executive OfficerJuly 2014 Director (current post)July 2016 President and Representative Director of
AYURA LABORATORIES INC. (current post)
Ko MoriDirector Outside Independent (- shares)
April 1971 Joined Marubeni Corporation April 2002 Executive Officer and General Manger
of Chemicals DivisionApril 2004 Managing Executive OfficerJune 2006 Representative Director and Senior
Managing Executive Officer, Materials Division
June 2007 President and Representative Director of Marubeni Safenet Co., Ltd.
July 2012 Director of the Company (current post)
Shigeki KimuraDirector Outside Independent (- shares)
March 1986 Joined Seven-Eleven Japan Co., Ltd. March 2014 Executive Officer, Manager of Accounting Management
Department, Manager of Corporate Policy
DepartmentDecember 2016 Executive Officer,
Senior Officer of Corporate Development Office of Seven & i Holdings Co., Ltd. (current post)
December 2016 Executive Officer, Manager of Secretarial Office of Seven-
Eleven Japan Co., Ltd. (current post)July 2017 Outside Director of the Company
(current post)
Yasuyuki HamadaDirector Outside Independent (2,000 shares)
April 1991 Professor of Faculty of Economics, Hokkaido University
April 1997 Special Assistant for the president of same university
April 2003 Professor of Advanced Scientific Research Center, Hokkaido University (concurrent post)
April 2010 President of Sapporo International University
Emeritus Professor of Hokkaido University
April 2014 President and Charman of Dohto University
December 2014 President of Hamanasu Foundation (current post)
July 2015 Outside Director of the Company (current post)
Shoichi ShudoRepresentative Senior Managing Director In charge of development (10,400 shares)
April 1978 Joined Sapporo Medical Testing Laboratories Co., Ltd.
March 1982 Joined Daiichi Medical Testing Laboratories Co., Ltd. (Asahikawa, now AIN HOLDINGS INC.)
May 1993 Head of Corporate Planning Division July 2000 DirectorMay 2003 Managing DirectorMay 2004 General Manager of Dispensing
Pharmacy BusinessMay 2012 Senior Managing DirectorNovember 2015 Senior Managing Director and
Representative Director (current post)
Toshihide MizushimaRepresentative Senior Managing Director In charge of business operations and business support (27,600 shares)
April 1982 Joined SSP Co., Ltd. April 1986 Joined Otani Corporation (now AIN
HOLDINGS INC.)July 2000 DirectorFebruary 2001 General Manager of Drug and
Cosmetic Store BusinessMay 2003 Managing DirectorJune 2009 President and Representative Director
of Seven Health Care Co., Ltd.May 2012 Senior Managing Director of the
Company, Director of Seven Bi no Garden Co., Ltd. (former Seven Health Care Co., Ltd.)
November 2015 Senior Managing Director and Representative Director of the Company (current post)
Miya OishiManaging Director Senior General Manager, Operations Department (1,000 shares)
September 1990 Joined KYOEIDO Co., Ltd. July 1993 Director of DAICHIKU Co., Ltd. (current
post)July 2008 Representative Director of same
companyApril 2011 Vice President and Representative
Director of AIN MEDICAL SYSTEMS INC. (now AIN HOLDINGS INC.)
February 2012 President and Representative Director of same company
July 2012 Director of the CompanyJuly 2014 Managing Director (current post)November 2015 President and Representative Director
of AIN PHARMACIEZ INC. (current post)
Koichi KawamuraCorporate Auditor (full-time) (5,000 shares)
October 1985 Joined Daiichi Medical Testing Laboratories Co., Ltd. (now AIN HOLDINGS INC.)
July 1997 AuditorMay 2003 General Manager of Administrative
DepartmentJuly 2012 Corporate Auditor (current post)
Akira IbayashiCorporate Auditor Outside (- shares)
April 1963 Joined The Hokkaido Bank, Ltd. June 2001 Director, Executive Officer and Deputy
President June 2003 Retired from The Hokkaido Bank, Ltd.July 2012 Outside Corporate Auditor of the
Company (current post)
Osamu MuramatsuCorporate Auditor Outside Independent (- shares)
April 1972 Joined Nomura Securities Co., Ltd. June 1994 Head of Sapporo BranchJune 1996 DirectorOctober 2007 Retired from Nomura Securities Co., Ltd. August 2011 President and Representative Director
of Executive Partners, Inc.June 2012 Outside Corporate Auditor of Asahi
Pharmacy Co., Ltd. (current post)
*Figures in brackets show the number of AIN HOLDINGS shares held as of April 30, 2016.
BOARD OF DIRECTORS CORPORATE AUDITORS

22 AIN HOLDINGS ANNUAL REPORT 2017 AIN HOLDINGS ANNUAL REPORT 2017 23
Financial Section
Management’s Discussion and Analysis of Financial Condition and Results of Operations
BUSINESS ENVIRONMENT SURROUNDING THE AIN HOLDINGS GROUP
The core business of the AIN HOLDINGS Group (the Group) is the dispensing pharmacy business that includes preparing and dispensing drugs based on prescriptions. Drug prices and dispensing fees* are stipulated by the Ministry of Health, Labour and Welfare. The Japanese government is progressively revising drug prices and dispensing fees as part of its policy to curb national medical expenses. Earnings at dispensing pharmacies are the total of dispensing fees and sales of drugs, so earnings are affected by these revisions. Under drug price revisions in April 2016, the average drug price was reduced by 5.57%. Including special reductions for high-cost drugs, the average drug price was cut by 7.77%. Also, under dispensing fee revisions, the role of pharmacies located near hospitals was reevaluated, but in order to realize patient-focused non-hospital dispensing services, pharmacists and dispensing pharmacies are now being required to play a primary care role in healthcare provision. The gap in performance is widening between companies in the industry, which are struggling with changes to their profit structures resulting from revisions to dispensing fees. However, the Group regards these changes in the operating environment as a perfect opportunity to push ahead with its strategy of further increasing profitability.* Dispensing fees comprise pharmaceutical management fees and technical fees
for pharmacists.
BUSINESS OVERVIEW FOR THE FISCAL YEAR UNDER REVIEW
During the fiscal year ended April 30, 2017, consumer spending in the Japanese economy picked up overall against a backdrop of improving employment conditions, and corporate earnings improved amid an upturn in production and capital investment. In this economic environment, the AIN HOLDINGS Group (the Group) worked to expand its business and increase earnings. Specifically, the Group opened new dispensing pharmacies and used M&A to expand the business. It also developed its urban drug and cosmetic store business. For the fiscal year under review, net sales rose 5.6% year on year to ¥248,110 million, operating income decreased 0.4% to ¥14,563 million, ordinary income decline 0.5% to ¥15,080 million and profit attributable to owners of the parent increased 0.4% year on year to ¥7,949 million. As of the end of the fiscal year, the number of stores in the Group totaled 1,118, a net increase of 185 stores from the end of the previous fiscal year.
BUSINESS RESULTS BY SEGMENT
Dispensing Pharmacy BusinessIn drug price and dispensing fee revisions in April 2016, the role of pharmacies located near hospitals was reevaluated, but in order to realize patient-focused non-hospital dispensing services,
pharmacists and dispensing pharmacies are now being required to play a key role at the heart of local communities. To ensure our pharmacists and dispensing pharmacies fulfill their role at the heart of local communities, the Group continues to build links with local healthcare service providers, mainly in the area of home-based dispensing, step up the integration and continuous management of drug information using patient medication notebooks and other means, and promote wider use of generic drugs. The shortage of pharmacists in the healthcare sector is becoming more serious. To address this issue, the Group is working to attract new graduates, with 307 new pharmacist graduates joining the Group in April 2017. The Group is also upgrading pharmacist training programs to enhance their capabilities so that they can fill their role as pharmacists at the heart of the community. In business development, the Group pushed ahead with business expansion by opening new dispensing pharmacies and using M&A deals. In December 2016, AOI Pharmacy Corporation (Sendai-shi, Miyagi Prefecture), which operates a total of 115 dispensing pharmacies across Japan, became a subsidiary of the Group. As a result, the Group now operates a network of more than 1,000 dispensing pharmacies in Japan’s 47 prefectures. The Group intends to use the acquisition of the company to further strengthen its network of dispensing pharmacies to support local healthcare provision. During the fiscal year under review, the Group opened 209 dispensing pharmacies, including pharmacies acquired from AOI Pharmacy Corporation and other M&A deals, and closed 24, resulting in a total of 1,066. As a result, the dispensing pharmacy business reported sales of ¥221,801 million, up 5.1% year on year, and segment income of ¥19,110 million, down 0.6% year on year.
Drug and Cosmetic Store BusinessIn the drug and cosmetic store business, the market environment remained challenging due to a narrowing competitive gap between
companies in the sector and the emergence of new competitors from sector consolidation and realignment that also extends to other business sectors. Against this backdrop, the Group continued to open ainz & tulpe urban drug stores and worked to make stores more appealing by refurbishing existing stores and strengthening merchandise lineups, particularly drug and cosmetics products. We also actively developed proprietary merchandise brands such as LIPS and HIPS and cocodecica, leading to an increase in profit margins. For the fiscal year under review, the drug and cosmetic store business reported an increase in sales of 2.4% year on year to ¥21,383 million. However, segment loss was ¥866 million, compared with segment loss of ¥459 million a year earlier. During the fiscal year under review, the Group opened ainz & tulpe Colette Mare SAKURAGICHO-B1 (Naka Ward, Yokohama), ainz & tulpe GINZA NAMIKIDORI (Chuo Ward, Tokyo), ainz & tulpe KITASENJU MARUI (Adachi Ward, Tokyo), ainz & tulpe Colette Mare SAKURAGICHO (Naka Ward, Yokohama), ainz & tulpe MARRONNIER GATE GINZA (Chuo Ward, Tokyo), ainz & tulpe KEIO DEPARTMENT STORE SHINJUKU (Shinjuku Ward, Tokyo) and ainz & tulpe YOKOHAMA JOINUS (Nishi Ward, Yokohama), as well as LIPS and HIPS Style Store SHINSAPPORO Sunpiazza (Atsubetsu Ward, Sapporo) and LIPS and HIPS TOKYU PLAZA OMOTESANDO HARAJUKU (Shibuya Ward, Tokyo), which mainly sells original brands. Nine stores were also closed, resulting in a total of 52 cosmetic and drugs stores at the end of the fiscal year.
Other BusinessesNet sales from other businesses rose 67.0% year on year to ¥4,925 million and segment loss was ¥1,496 million compared with the loss of ¥1,142 million a year earlier.
2007/4 2008/4 2009/4 2010/4 2011/4 2012/4 2013/4 2014/4 2015/4 2016/4 2017/4For the year:
Net sales 81,307 106,231 115,387 125,495 129,387 142,790 154,560 170,225 187,904 234,843 248,110Selling, general and administrative expenses 7,970 9,203 9,948 10,744 11,981 12,839 14,740 15,635 17,509 23,915 27,529Operating income 2,888 4,444 5,296 6,492 8,107 10,253 9,701 10,113 11,452 14,619 14,563Profit attributable to owners of parent 1,010 1,615 2,127 3,131 3,916 4,899 5,075 5,259 6,197 7,917 7,949Capital expenditures*1 1,620 1,914 2,891 2,573 2,750 5,870 7,235 6,328 6,413 11,209 4,786Depreciation and amortization*1 773 968 1,119 1,286 1,560 1,749 2,212 2,258 2,553 3,259 3,687
At the end of the year:Equity capital*2 10,710 12,040 16,071 21,445 29,450 33,695 38,312 42,122 47,928 53,258 60,105Total net assets 11,326 12,707 16,109 21,492 29,498 33,745 38,356 42,240 48,046 53,324 60,178Total assets 49,849 57,546 62,032 65,898 76,940 85,908 95,839 101,382 114,149 139,888 156,323Number of shares outstanding (shares) 11,320,000 11,361,000 12,831,376 14,101,164 15,941,004 15,940,790 15,940,740 15,854,190 31,707,617 31,707,617 31,707,568Number of employees (persons) 1,947 2,582 2,741 2,918 3,104 3,326 3,551 3,806 4,429 5,511 6,469Number of stores: Dispensing pharmacy business 247 356 375 397 448 494 560 616 754 881 1,066Number of stores: Drug and cosmetic store business 43 45 46 49 53 56 61 59 56 52 52
Per share information (¥):Net income*3 44.67 71.18 85.37 114.04 127.83 153.67 159.18 165.04 195.45 249.69 250.71Net assets*3 473.08 529.89 626.27 760.40 923.73 1,056.89 1,201.71 1,328.43 1,511.57 1,679.69 1,895.63Cash dividends*3 9.0 10.0 15.0 20.0 22.5 25.0 30.0 30.0 30.0 40.0 50.0
Stock information (based on the closing price as of April 30) (¥):Stock price 1,500 1,490 1,481 2,920 3,115 4,290 4,765 4,495 4,245 5,340 7,720
Ratios (%):Operating margin 3.6 4.2 4.6 5.2 6.3 7.2 6.3 5.9 6.1 6.2 5.9Return on sales*4 1.2 1.5 1.8 2.5 3.0 3.4 3.3 3.1 3.3 3.4 3.2Return on assets (ROA)*5 2.2 3.0 3.6 4.9 5.5 6.0 5.6 5.3 5.8 6.2 5.4Return on equity (ROE)*6 9.6 14.2 15.1 16.7 15.4 15.5 14.1 13.1 13.8 15.6 14.0Shareholders’ equity ratio 21.5 20.9 25.9 32.5 38.3 39.2 40.0 41.5 42.0 38.1 38.4
11-YEAR FINANCIAL SUMMARY
Note: Amounts of less than one million yen were rounded down.
*1: The amounts of capital expenditures and depreciation and amortization prior to the fiscal year ended April 30, 2007 are on a non-consolidated basis.
*2: Equity capital = Total net assets – Non-controlling interests
*3: The Company conducted a 2-for-1 stock split of common shares with an effective date of October 1, 2014. Net income per share, net assets per share and cash dividends per share have been adjusted retroactively to reflect the impact of the stock split.
*4: Return on sales = Profit attributable to owners of parent / Net sales × 100
*5: Return on assets = Profit attributable to owners of parent / Total assets (yearly average) × 100
*6: Return on equity = Profit attributable to owners of parent / Equity capital (yearly average) × 100
(¥ million)

24 AIN HOLDINGS ANNUAL REPORT 2017 AIN HOLDINGS ANNUAL REPORT 2017 25
Financial Section
FINANCIAL POSITION
The balance of total assets at the end of the fiscal year under review increased by ¥16,435 million to ¥156,323 million. This mainly reflected increases in cash on hand and in banks and increases in property, plant and equipment such as land, buildings and structures, and goodwill due to the Group’s business expansion through new store openings and M&A. Consolidated current assets at the end of the fiscal year under review increased by ¥8,827 million to ¥65,420 million compared to ¥56,593 million at the end of the previous fiscal year. This mainly reflected cash on hand and in banks of ¥29,775 million, an increase of ¥7,127million compared with the previous fiscal year and inventories of ¥11,668 million, an increase of ¥683 million due to business expansion. Fixed assets at the end of the fiscal year under review increased by ¥7,607 million to ¥90,902 million compared to ¥83,294 million at the end of the previous fiscal year. This was mainly due to an increase in fixed assets related to investment in new stores and expansion in the asset base at consolidated subsidiaries that became part of the Group through M&A deals. Property, plant and equipment, mainly buildings and structures, increased by ¥310 million to ¥28,464 million, while goodwill rose ¥7,602 million to ¥40,939 million. Liabilities increased by ¥9,580 million to ¥96,144 million, compared with ¥86,563 million at the end of the previous fiscal year. This is primarily due to an increase in short-term loans of ¥7,596 million (up ¥1,906 million year on year) and an increase in long-term debt of ¥ 18,254 million (up ¥34 million year on year). The balance of current liabilities increased by ¥6,210 million from the previous year-end balance of ¥66,744 million to ¥72,955 million, and the balance of long-term liabilities increased by ¥3,370 million from the previous year-end balance of ¥19,818 million to ¥23,188 million. Net assets increased by ¥6,854 million to ¥60,178 million compared to ¥53,324 million at the end of the previous fiscal year. As a result of the above factors, the shareholders’ equity ratio increased 0.3 percentage points to 38.4%, compared with 38.1% at the end of the previous fiscal year. ROA decreased 0.8 percentage points to 5.4%, while ROE decreased 1.6 percentage points to 14.0%.
BASIC POLICIES FOR PROFIT DISTRIBUTION
The Company considers the return of profits to shareholders as an important management issue. Our basic policy is to repay our investors proportionate to the profit we make, and to maintain these payments at stable levels. Internal reserves are held to strengthen the corporate structure and in preparation for new store openings and future development of the business. We will make effective use of these funds to generate profits to be returned to shareholders in the future. The Company’s basic policy is to pay dividends from retained earnings once per year at the end of the fiscal year. For the fiscal year under review, the Company paid a dividend from retained earnings of ¥50 per share, compared with the previous fiscal year’s ordinary dividend of ¥40. In view of our profit forecasts, plans for investment and other factors, we intend to pay an ordinary dividend from retained earnings of ¥50 per share in the fiscal year ending April 30, 2018.
CASH FLOWS
In the fiscal year under review, cash and cash equivalents (“cash”) increased ¥7,342 million (33.5%) year on year to ¥29,234 million. This reflected operating cash flow generated by dispensing pharmacy and drug and cosmetic store businesses, which was mainly used to actively invest in new store openings and M&A. Some cash was also retained to provide constant access to a certain level of funds. Cash flows from each category and their relevant factors are as follows:
Cash Flows from Operating ActivitiesNet cash provided by operating activities was ¥18,409 million, a decrease of 13.8% year on year. The main items that were positive for cash flow were profit before income taxes of ¥14,307 million, as well as depreciation and amortization of ¥3,687 million, amortization of goodwill of ¥3,654 million, and a decrease in accounts receivable of ¥5,369 million related to business expansion through new store openings and M&A. The main items that were negative for cash flow was income taxes paid of ¥7,695 million.
Cash Flows from Investing ActivitiesNet cash used in investing activities totaled ¥11,183 million, a decrease of 46.4% year on year. This mainly reflected payments of ¥2,415 million for purchases of property, plant and equipment related to the opening of new urban drug stores and dispensing pharmacies, and ¥9,697 million for purchases of subsidiaries’ shares resulting in obtaining controls related to shares acquired in 40 companies through M&A deals.
Cash Flows from Financing ActivitiesNet cash provided by financing activities decreased 94.2% year on year to ¥116 million. This was mainly attributable to net repayments from short-term debts of ¥391 million and net long-term debt procurement of ¥2,512 million. Cash dividends paid of ¥1,268 million also had a negative impact on cash flows from financing activities.
BUSINESS AND OTHER RISKS
The following factors may affect the Group’s operating results and financial position. Statements in the text referring to the future reflect the judgment of the Group at the end of the fiscal year under review.
1. Laws and regulations a. Regulations under the Law for Ensuring the Quality, Efficacy, and Safety of Pharmaceuticals and Medical Devices We operate dispensing pharmacy business under various permits, licenses, registrations and notifications including those set forth by the Law for Ensuring the Quality, Efficacy, and Safety of Pharmaceuticals and Medical Devices (the Pharmaceutical and Medical Device Law), the Health Insurance Law, and the Pharmacists Law, under the supervision of the Ministry of Health, Labour and Welfare, and of prefectural health and welfare departments. The drugstore business in our drug and cosmetic store business also involves drug sales, which are similarly regulated under the Pharmaceutical and Medical Device Law.
b. Easing of drug sales regulationsIn sales of over-the-counter (OTC) drugs, the Pharmaceutical and Medical Device Law classifies drugs into different categories based on risk. Only qualified pharmacists are permitted to sell drugs requiring guidance and category 1 drugs, while registered sellers, as well as pharmacists, are permitted to sell category 2 and category 3 drugs. In addition, the “Law for Partial Revision of the Pharmaceutical Affairs Law” (enacted June 12, 2014) ended restrictions on the sale of OTC drugs online. Factors such as the entry into the market of firms from other industries as a result of a continuing trend in the future to deregulate drug sales may affect the Group’s performance.
2. Details of businessThe Group’s dispensing pharmacy business operates a chain of dispensing pharmacies. As the dispensing pharmacy business accounted for 89.4% of net sales in the fiscal year under review, we plan to continue the multi-store operation mainly based on dispensing pharmacies. Accordingly, the Group’s operating results may be affected by the success or failure of the store opening policies including M&A and by trends in store openings by competitors in the same industry. Furthermore, sales of dispensing pharmacies significantly depend on the medical institutions that write prescriptions. Therefore, uncertainties such as the issuance of non-hospital prescriptions by the medical institutions or suspension/discontinuation of operations thereof may affect the Group’s performance. In addition, due to seasonal outbreaks of influenza and other conditions, the number of prescriptions filled may be affected by seasonal trends.
3. Industry trendsThe revenues in our dispensing pharmacy business come from pharmacy operations involving the dispensing and supplying of drugs based on prescriptions. The drug prices and dispensing fees are set by the Ministry of Health, Labour and Welfare. As a way to contract medical expenses, both medical treatment fees and drug prices are being revised incrementally. In the future as well, changes in profit structure resulting from factors such as revisions in the medical treatment fee system could continue to affect the Group’s performance and financial position.
4. Securing qualified staffDispensing pharmacies and drugstores (Stores for Category 1 Drugs) are required by the Pharmaceutical and Medical Device Law to have a pharmacist on site; the Pharmacists Law stipulates that the dispensing of drugs must be handled by a pharmacist. The Group continues to have a policy of expansion by aggressively opening new stores, but if it becomes difficult to secure qualified pharmacists, this could affect our store openings and the Group’s performance.
5. Risks of loss of trust in the Companya. Dispensing operationIn our dispensing pharmacy business, pharmacists dispense and supply prescription drugs that affect the human body. This business carries the risk that medical accidents might be caused through dispensing errors. The Group recognizes that any medical accidents could have a severely damaging effect on society’s confidence in the Group, and we place the highest priority on measures to avoid the risk from all aspects.
b. Protection of personal dataWe possess patient data in the dispensing pharmacy business, including medical histories and prescription information, and we possess personal data in the drug and cosmetic store business obtained from the ainz & tulpe Point Card and Tulpe Mobile Club. The Group takes all possible steps to protect personal data through personal information protection systems and the rigorous enforcement of rules on the handling of such information. Also, key subsidiary AIN PHARMACIEZ INC. has acquired Privacy Mark accreditation in the healthcare, medical and social service fields. However, we believe it is possible that any accidental or illegal leakage of personal data may not only affect the Group’s performance but also lead to a loss of society’s confidence in the Group.
6. Risk in business strategyThe Group has promoted the expansion of the business scale of dispensing pharmacies through actively promoting new store openings and M&A. Our basic policies regarding M&A strategy require us to carefully examine target companies and determine the amount to be paid for acquisitions thereof in order to stably secure a profitability level that exceeds the amortization of goodwill to be incurred. If matters do not go as planned, however, we may incur losses on valuation of shares in subsidiaries and impairment losses on goodwill, which may have an adverse impact on the Group’s operating results and financial position.
7. Interest rate risksIn the Group’s promotion of business expansion based on actively promoting new store openings and M&A, costs for ordinary store openings are covered by internal funds within the range of operating cash flow, while in large-scale M&A, costs are sometimes financed by borrowings from financial institutions. In order to ensure flexible access to funds to support these activities, the Group maintains a certain level of liquidity on its balance sheet. As of the end of the fiscal year under review, cash on hand and in banks totaled ¥29,475 million, compared with a total balance of short- and long-term debt of ¥25,851 million. We focus on the possibility of return on investment and seek to reduce interest-bearing debt through efficient investment in implementing M&A deals. However, if the Group fails to secure an adequate return on its M&A investment, or due to interest rate fluctuations associated with conditions in financial markets, the Group’s financial position and operating results including interest payable may be affected.
8. Impact of consumption taxUnder Japan’s Consumption Tax Act, dispensing sales in the dispensing pharmacy business related to social insurance medical examinations are exempt from consumption tax. However, the business is required to pay consumption tax on pharmaceutical and other products that it procures. As a result, consumption tax borne by the Group is booked under cost of sales in the dispensing pharmacy business. In the past, when consumption tax was introduced and dispensing fees were revised, the government took into account the higher rate of consumption tax when it set drug prices. However, future revisions to the rate of consumption tax may not be reflected in drug prices, which could have an impact on the Group’s operating results.

AIN HOLDINGS ANNUAL REPORT 2017 2726 AIN HOLDINGS ANNUAL REPORT 2017
ASSETS 2017 2016 2017 LIABILITIES AND NET ASSETS 2017 2016 2017
Current assets: Current liabilities:¥ 29,775 ¥ 22,647 $ 267,544 Accounts payable (Note 4) ¥ 39,325 ¥ 39,987 $ 353,356
Notes and accounts receivable (Note 4) 9,990 12,385 89,765 Short-term debt (Notes 4 and 7) 7,596 5,690 68,254Other accounts receivable 9,402 5,983 84,481 Accrued income taxes 2,898 4,448 26,040Inventories (Note 3) 11,668 10,984 104,843 Deposits received 14,223 10,112 127,801Deferred tax assets (Note 10) 1,166 1,149 10,477 Allowance for bonuses to employees 1,903 1,633 17,099Short-term loans 632 639 5,678 Allowance for bonuses to directors 16 13 143Other current assets 2,829 2,806 25,420 Reserve for reward obligations 410 390 3,684Allowance for doubtful accounts (44) (3) (395) Provision for sales returns 14 15 125 Total current assets 65,420 56,593 587,833 Other current liabilities 6,566 4,452 58,999
Total current liabilities 72,955 66,744 655,539
Property, plant and equipment (Note 6): Buildings and structures, net 15,365 14,694 138,062 Long-term liabilities:Land 9,958 9,537 89,477 Long-term debt (Notes 4 and 7) 18,254 14,854 164,021Construction in progress 316 813 2,839 Lease obligations 958 1,198 8,608
2,823 3,108 25,366 Net defined benefit liability (Note 9) 2,331 2,228 20,945 Total property, plant and equipment 28,464 28,153 255,764 Other long-term liabilities 1,644 1,537 14,772
Total long-term liabilities 23,188 19,818 208,356
Investments and other assets:Investment securities (Notes 4 and 5) 2,435 2,677 21,879 Net Assets: (Note 11) Deferred tax assets (Note 10) 2,167 2,038 19,471 Shareholders’ equity Net defined benefit asset (Note 9) 22 174 197 Common stock (Note 14) 8,682 8,682 78,012Long-term loans 1,194 1,801 10,728 Authorized - 44,000,000 shares in 2017 and 2016Deposits and guarantees 10,443 10,013 93,835 Issued - 31,888,212 shares in 2017 and 2016Goodwill 40,939 33,337 367,858 Capital surplus 6,367 6,367 57,210Other intangible fixed assets 2,170 2,248 19,498 Retained earnings 45,286 38,605 406,918Other investments and other assets 3,378 4,086 30,353 Treasury stock (180,644 shares in 2017 and 180,595 shares in 2016) (419) (419) (3,764)Allowance for doubtful accounts (312) (1,237) (2,803) Total shareholders’ equity 59,918 53,237 538,395 Total investments and other assets 62,438 55,141 561,038 Accumulated other comprehensive income: Total assets ¥ 156,323 ¥ 139,888 $ 1,404,645 Unrealized holding gains (losses) on securities 86 (63) 772
Remeasurments of defined benefit plans 101 84 907 Total accumulated other comprehensive income 187 21 1,680Non-controlling interests 73 65 655 Total net assets 60,178 53,324 540,731 Total liabilities and net assets ¥ 156,323 ¥ 139,888 $ 1,404,645
See accompanying notes.
Thousands of Thousands of
AIN HOLDINGS INC. CONSOLIDATED BALANCE SHEET
AS OF APRIL 30, 2017
Cash on hand and in banks (Notes 2 and 4)
Other property, plant and equipment, net
U.S. dollars U.S. dollars Millions of yen (Note 1(1)) Millions of yen (Note 1(1))

AIN HOLDINGS ANNUAL REPORT 2017 2928 AIN HOLDINGS ANNUAL REPORT 2017
2017 2016 2017Net sales (Note 15) ¥ 248,110 ¥ 234,843 $ 2,229,400Cost of sales 206,017 196,308 1,851,172
Gross profit 42,092 38,535 378,219Selling, general and administrative expenses 27,529 23,915 247,362
Operating income (Note 15) 14,563 14,619 130,856Other income (expense):
Interest and dividend income 108 94 970Gains on investments in partnership 63 143 566Commissions received 44 72 395Real estate rental revenue 193 186 1,734Consignment income 149 189 1,338Technical advisory fee 62 63 557Co-sponsor fee - 157 -Gain on sales of investment securities 264 - 2,372Penalty income - 68 -Gain on bargain purchase - 58 -Refund of premium for cancelled insurance 63 13 566Interest expenses (143) (96) (1,284)Losses on sales of accounts receivables (67) (78) (602)Rent expenses on real estates (89) (87) (799)Provision of allowance for doubtful accounts - (282) -Losses on disposal and sales of fixed assets (488) (409) (4,384)Impairment losses on fixed assets (453) (856) (4,070)Bad debts written off (216) - (1,940)Other, net 252 94 2,264
(255) (669) (2,291)Profit before income taxes 14,307 13,949 128,556Income taxes (Note 10):
Current 6,040 6,698 54,272Deferred 310 (710) 2,785
6,350 5,987 57,058Profit 7,956 7,961 71,488Profit attributable to non-controlling interests 7 44 62Profit attributable to owners of parent ¥ 7,949 ¥ 7,917 $ 71,426
2017 2016 2017Profit ¥ 7,956 ¥ 7,961 $ 71,488Other comprehensive income:
Unrealized holding gains (losses) on securities 149 (290) 1,338Remeasurements of defined benefit plans, net of tax 16 160 143Total other comprehensive income (loss) 166 (130) 1,491
Total comprehensive income 8,122 7,831 72,980
Comprehensive income attributable to owners of parent 8,115 7,786 72,917Comprehensive income attributable to non-controlling interests 7 44 62
See accompanying notes.
Millions of yenU.S. dollars(Note 1(1))
Thousands of
Thousands of U.S. dollars
Millions of yen (Note 1(1))
Millions of yen
AIN HOLDINGS INC.CONSOLIDATED STATEMENT OF INCOME
AIN HOLDINGS INC.CONSOLIDATED STATEMENT OF COMPREHENSIVE INCOME
YEAR ENDED APRIL 30, 2017
YEAR ENDED APRIL 30, 2017Thousands of
shares
Number ofshares of
common stockCommon stock Capital surplus Retained
earnings Treasury stockTotal
shareholders’equity
Unrealizedholding gains(losses) onsecurities
Remeasurmentsof defined
benefit plans
Total accumulatedother
comprehensiveincome (loss)
Non-controllinginterests Total net assets
Balance at April 30, 2015 31,888 8,682 7,872 31,639 (419) 47,776 227 (75) ¥ 151 ¥ 118 ¥ 48,046Profit attributable to owners of parent - - - 7,917 - 7,917 - - - - 7,917Cash dividends paid - - - (951) - (951) - - - - (951)Acquisition of treasury stock - - - - - - - - - - -Purchase of shares of consolidated subsidiaries - - (1,505) - - (1,505) - - - - (1,505)Net change in items other than those in shareholders’ equity - - - - - - (290) 160 (130) (52) (182)Net changes during the year - - (1,505) 6,965 - 5,460 (290) 160 (130) (52) 5,278
Balance at April 30, 2016 31,888 8,682 6,367 38,605 (419) 53,237 (63) 84 21 65 53,324Profit attributable to owners of parent - - - 7,949 - 7,949 - - - - 7,949Cash dividends paid - - - (1,268) - (1,268) - - - - (1,268)Acquisition of treasury stock - - - - (0) (0) - - - - (0)Net change in items other than those in shareholders’ equity - - - - - - 149 16 166 7 173Net changes during the year - - - 6,681 (0) 6,680 149 16 166 7 6,854
Balance at April 30, 2017 31,888 ¥ 8,682 ¥ 6,367 ¥ 45,286 ¥ (419) ¥ 59,918 ¥ 86 ¥ 101 ¥ 187 ¥ 73 ¥ 60,178
Common stock Capital surplus Retainedearnings Treasury stock
Totalshareholders’
equity
Unrealizedholding gains(losses) onsecurities
Remeasurmentsof defined
benefit plans
Total accumulatedother
comprehensiveincome (loss)
Non-controllinginterests Total net assets
Balance at April 30, 2016 $ 78,012 $ 57,210 $ 346,886 $ (3,764) $ 478,362 $ (566) $ 754 $ 188 $ 584 $ 479,144Profit attributable to owners of parent - - 71,426 - 71,426 - - - - 71,426Cash dividends paid - - (11,393) - (11,393) - - - - (11,393)Acquisition of treasury stock - - - (0) (0) - - - - (0)Net change in items other than those in shareholders’ equity - - - - - 1,338 143 1,491 62 1,554Net changes during the year - - 60,032 (0) 60,023 1,338 143 1,491 62 61,586
Balance at April 30, 2017 $ 78,012 $ 57,210 $ 406,918 $ (3,764) $ 538,395 $ 772 $ 907 $ 1,680 $ 655 $ 540,731
See accompanying notes.
Thousands of U.S. dollars (Note 1(1))Shareholders' equity Accumulated other comprehensive income (loss)
AIN HOLDINGS INC.
YEAR ENDED APRIL 30, 2017
Millions of yenShareholders' equity Accumulated other comprehensive income (loss)
CONSOLIDATED STATEMENT OF CHANGES IN NET ASSETS
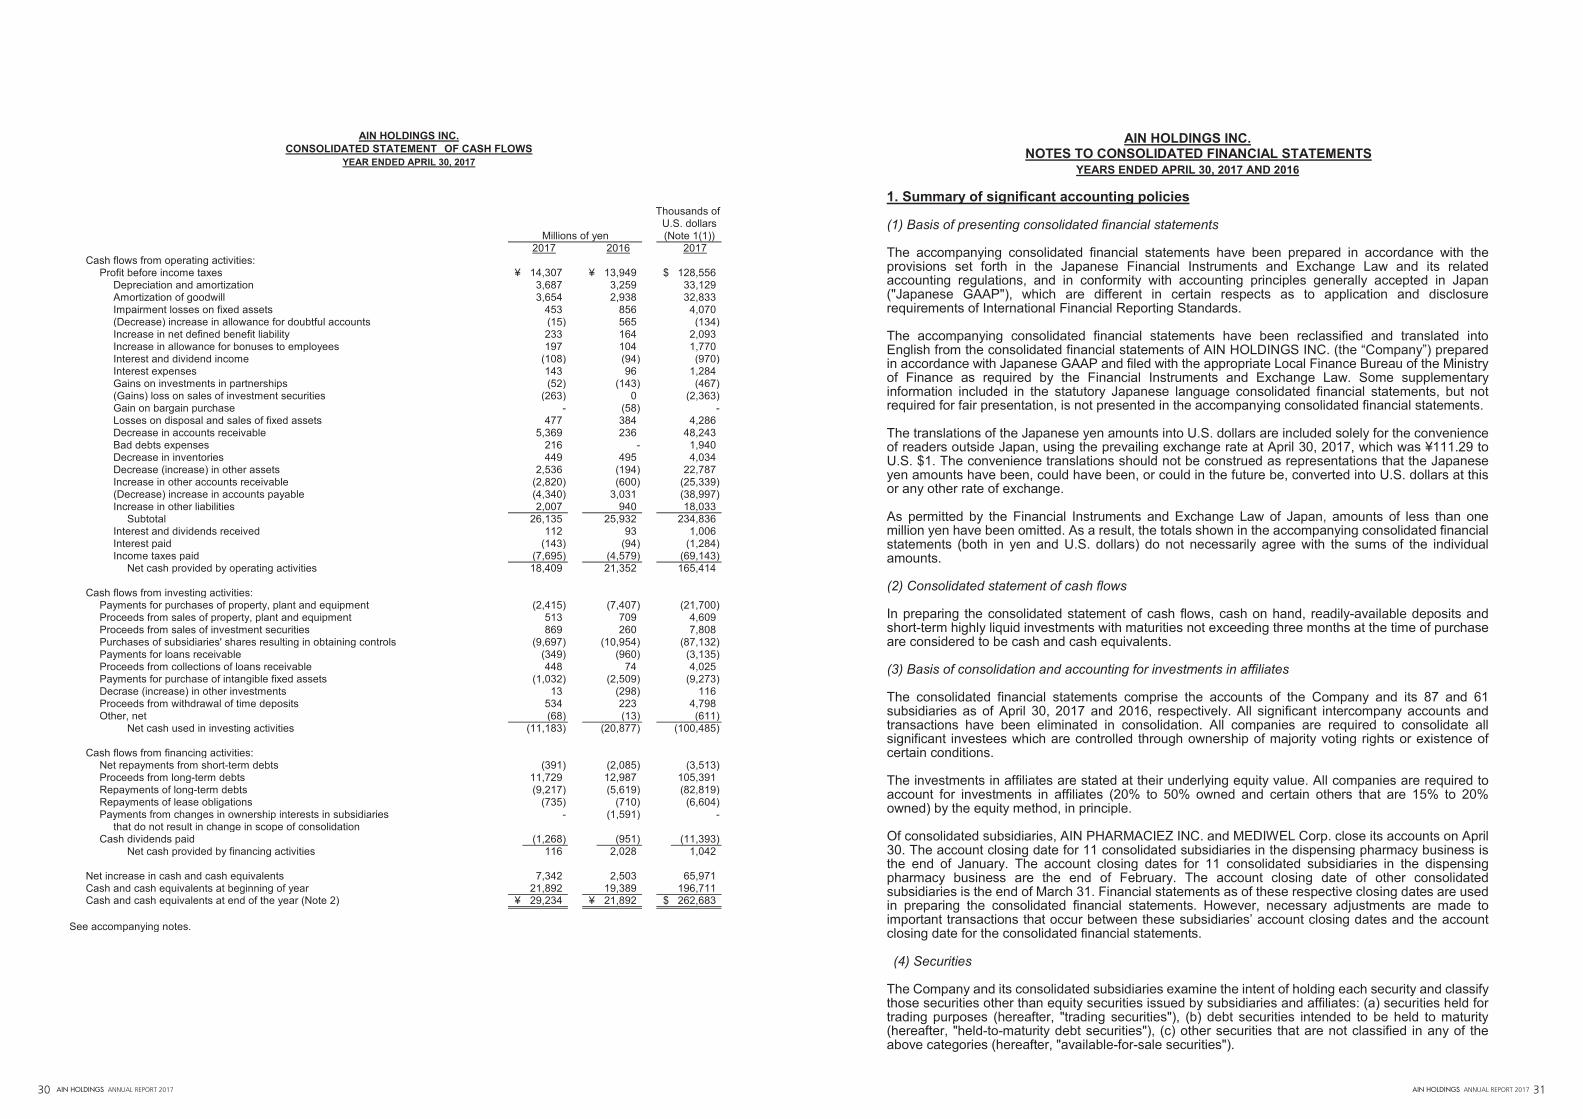
AIN HOLDINGS ANNUAL REPORT 2017 3130 AIN HOLDINGS ANNUAL REPORT 2017
AIN HOLDINGS INC.CONSOLIDATED STATEMENT OF CASH FLOWS
YEAR ENDED APRIL 30, 2017
2017 2016 2017Cash flows from operating activities:
Profit before income taxes ¥ 14,307 ¥ 13,949 $ 128,556Depreciation and amortization 3,687 3,259 33,129Amortization of goodwill 3,654 2,938 32,833Impairment losses on fixed assets 453 856 4,070(Decrease) increase in allowance for doubtful accounts (15) 565 (134)Increase in net defined benefit liability 233 164 2,093Increase in allowance for bonuses to employees 197 104 1,770Interest and dividend income (108) (94) (970)Interest expenses 143 96 1,284Gains on investments in partnerships (52) (143) (467)(Gains) loss on sales of investment securities (263) 0 (2,363)Gain on bargain purchase - (58) -Losses on disposal and sales of fixed assets 477 384 4,286Decrease in accounts receivable 5,369 236 48,243Bad debts expenses 216 - 1,940Decrease in inventories 449 495 4,034Decrease (increase) in other assets 2,536 (194) 22,787Increase in other accounts receivable (2,820) (600) (25,339)(Decrease) increase in accounts payable (4,340) 3,031 (38,997)Increase in other liabilities 2,007 940 18,033
Subtotal 26,135 25,932 234,836Interest and dividends received 112 93 1,006Interest paid (143) (94) (1,284)Income taxes paid (7,695) (4,579) (69,143)
Net cash provided by operating activities 18,409 21,352 165,414
Cash flows from investing activities: Payments for purchases of property, plant and equipment (2,415) (7,407) (21,700)Proceeds from sales of property, plant and equipment 513 709 4,609Proceeds from sales of investment securities 869 260 7,808Purchases of subsidiaries' shares resulting in obtaining controls (9,697) (10,954) (87,132)Payments for loans receivable (349) (960) (3,135)Proceeds from collections of loans receivable 448 74 4,025Payments for purchase of intangible fixed assets (1,032) (2,509) (9,273)Decrase (increase) in other investments 13 (298) 116Proceeds from withdrawal of time deposits 534 223 4,798Other, net (68) (13) (611)
Net cash used in investing activities (11,183) (20,877) (100,485)
Cash flows from financing activities: Net repayments from short-term debts (391) (2,085) (3,513)Proceeds from long-term debts 11,729 12,987 105,391Repayments of long-term debts (9,217) (5,619) (82,819)Repayments of lease obligations (735) (710) (6,604)Payments from changes in ownership interests in subsidiaries - (1,591) -
that do not result in change in scope of consolidationCash dividends paid (1,268) (951) (11,393)
Net cash provided by financing activities 116 2,028 1,042
Net increase in cash and cash equivalents 7,342 2,503 65,971Cash and cash equivalents at beginning of year 21,892 19,389 196,711Cash and cash equivalents at end of the year (Note 2) ¥ 29,234 ¥ 21,892 $ 262,683
See accompanying notes.
Thousands of U.S. dollars
Millions of yen (Note 1(1))
AIN HOLDINGS INC. NOTES TO CONSOLIDATED FINANCIAL STATEMENTS
YEARS ENDED APRIL 30, 2017 AND 2016 1. Summary of significant accounting policies (1) Basis of presenting consolidated financial statements The accompanying consolidated financial statements have been prepared in accordance with the provisions set forth in the Japanese Financial Instruments and Exchange Law and its related accounting regulations, and in conformity with accounting principles generally accepted in Japan ("Japanese GAAP"), which are different in certain respects as to application and disclosure requirements of International Financial Reporting Standards. The accompanying consolidated financial statements have been reclassified and translated into English from the consolidated financial statements of AIN HOLDINGS INC. (the “Company”) prepared in accordance with Japanese GAAP and filed with the appropriate Local Finance Bureau of the Ministry of Finance as required by the Financial Instruments and Exchange Law. Some supplementary information included in the statutory Japanese language consolidated financial statements, but not required for fair presentation, is not presented in the accompanying consolidated financial statements. The translations of the Japanese yen amounts into U.S. dollars are included solely for the convenience of readers outside Japan, using the prevailing exchange rate at April 30, 2017, which was ¥111.29 to U.S. $1. The convenience translations should not be construed as representations that the Japanese yen amounts have been, could have been, or could in the future be, converted into U.S. dollars at this or any other rate of exchange. As permitted by the Financial Instruments and Exchange Law of Japan, amounts of less than one million yen have been omitted. As a result, the totals shown in the accompanying consolidated financial statements (both in yen and U.S. dollars) do not necessarily agree with the sums of the individual amounts. (2) Consolidated statement of cash flows In preparing the consolidated statement of cash flows, cash on hand, readily-available deposits and short-term highly liquid investments with maturities not exceeding three months at the time of purchase are considered to be cash and cash equivalents. (3) Basis of consolidation and accounting for investments in affiliates The consolidated financial statements comprise the accounts of the Company and its 87 and 61 subsidiaries as of April 30, 2017 and 2016, respectively. All significant intercompany accounts and transactions have been eliminated in consolidation. All companies are required to consolidate all significant investees which are controlled through ownership of majority voting rights or existence of certain conditions. The investments in affiliates are stated at their underlying equity value. All companies are required to account for investments in affiliates (20% to 50% owned and certain others that are 15% to 20% owned) by the equity method, in principle. Of consolidated subsidiaries, AIN PHARMACIEZ INC. and MEDIWEL Corp. close its accounts on April 30. The account closing date for 11 consolidated subsidiaries in the dispensing pharmacy business is the end of January. The account closing dates for 11 consolidated subsidiaries in the dispensing pharmacy business are the end of February. The account closing date of other consolidated subsidiaries is the end of March 31. Financial statements as of these respective closing dates are used in preparing the consolidated financial statements. However, necessary adjustments are made to important transactions that occur between these subsidiaries’ account closing dates and the account closing date for the consolidated financial statements. (4) Securities The Company and its consolidated subsidiaries examine the intent of holding each security and classify those securities other than equity securities issued by subsidiaries and affiliates: (a) securities held for trading purposes (hereafter, "trading securities"), (b) debt securities intended to be held to maturity (hereafter, "held-to-maturity debt securities"), (c) other securities that are not classified in any of the above categories (hereafter, "available-for-sale securities").

AIN HOLDINGS ANNUAL REPORT 2017 3332 AIN HOLDINGS ANNUAL REPORT 2017
Trading securities are carried at fair value and held-to-maturity debt securities are carried at amortized cost. Marketable securities classified as available-for-sale securities are carried at fair value with changes in unrealized holding gains or losses, net of the applicable income taxes, included directly in net assets. Non-marketable securities classified as available-for-sale securities are carried at cost. Cost of securities sold is determined by the moving average method. (5) Inventories Dispensed drugs were stated at lower of cost or market, cost being determined using the gross average method. Merchandise was stated at lower of cost or market, cost being determined using the retail method. Supplies were stated at cost determined using the last purchase method. (6) Depreciation and amortization Depreciation of property, plant and equipment other than leased assets is computed by the declining-balance method at rates based on the useful lives, except that the straight-line method is applied to buildings acquired on or after April 1, 1998 and to facilities attached to buildings and structures acquired on or after April 1, 2016. The useful lives of major property, plant and equipment are summarized as follows: Buildings and structures: 10 to 50 years The straight-line method is applied over a three-year period for assets with an acquisition price of ¥100,000 or more and less than ¥200,000. Amortization of software other than leased assets used by the Company and its consolidated subsidiaries is computed by the straight-line method over the useful lives, five years. Amortization of long-term prepaid expenses is computed by the straight-line method. Amortization of goodwill is computed by the straight-line method over a period (5 to 20 years). Leased assets capitalized under finance leases are depreciated over the lease terms of the respective assets with no residual value. Finance lease transactions that do not transfer ownership that commenced prior to April 1, 2008, are accounted for under methods pertaining to standard lease transactions. (7) Impairment of fixed assets Fixed assets are reviewed for impairment whenever events or changes in circumstances indicate that the carrying amount may not be recoverable. When amounts of undiscounted future cash flows of fixed assets are less than the carrying amounts, the fixed assets are determined to be impaired. Then, an amount by which the carrying amount exceeds the recoverable amount is recognized as an impairment loss. The Company and its consolidated subsidiaries identify group of assets by store as the smallest identifiable group of assets that generates cash inflows from continuing use that are largely independent of the cash inflows from other assets or groups of assets. With respect to non-performing assets, real estate is regarded as an independent asset group. The recoverable amount of the asset group is measured by the respective net selling prices. The land is assessed based on the appraisal value by an independent real estate appraiser. The fair value of construction in progress and store facilities is the disposal value from which costs of disposal are deducted. (8) Allowance for doubtful accounts The Company and its consolidated subsidiaries provide an allowance for doubtful accounts for probable collection losses by applying the actual rate of bad debt losses experienced in a past reference period for normal receivables and by individual assessment of collectability for doubtful receivables. (9) Bonuses to employees Allowance for bonus to employees is provided for payments to employees of the Company and its consolidated subsidiaries at the amount expected to be paid in respect of the calculation period ended on the balance sheet date.
(10) Bonuses to directors Allowance for bonus to directors is provided for payments to directors of the Company and its consolidated subsidiaries at the amount expected to be paid in respect of the calculation period ended on the balance sheet date. (11) Reserve for reward obligations In terms of the estimated redeemable amount of the purchase points given in the parent company’s Drug and Cosmetic Store Business, the Company sets a reserve based on actual redemptions in the past. (12) Provision for sales returns As a provision for losses associated with sales returns, the Company and its consolidated subsidiaries record an estimated loss amount considering past return rates and distribution in the market. (13) Retirement benefits Retirement benefits covering all employees are provided through two plans: a lump-sum benefit plan and a defined-benefit pension plan. Upon retirement or termination of employment, employees are generally entitled to lump-sum or annuity payments based on their current rate of pay, length of service and cause of termination. The Company and some of its consolidated subsidiaries employ the simplified method when computing retirement benefit obligations. In calculating the retirement benefit obligation, the benefit formula basis is used to attribute the expected benefit attributable to the respective fiscal year. Unrecognized prior service cost is amortized on a straight-line basis over a period (six years) within the employees’ average remaining service period at incurrence. Unrecognized actuarial gains and losses are recognized in expenses using the declining-balance method over a period (six years) within the average of the estimated remaining service period, commencing from the year after the year in which they are incurred. (14) Income taxes Deferred tax assets and liabilities are determined based on the differences between financial reporting and the tax bases of the assets and liabilities and are measured using the enacted tax rates and laws which will be in effect when the differences are expected to reverse. (15) Amounts per share of common stock Basic earnings per share is computed based on the weighted average number of shares of common stock outstanding during the year. Diluted earnings per share is computed based on the weighted average number of shares of common stock outstanding each year after giving effect to the dilutive potential of common shares to be issued upon conversion of the convertible bonds. Net assets per share are computed based on the net assets excluding non-controlling interests, and the number of common stock outstanding at the year end. Cash dividends per share represent the actual amount declared as applicable to the respective years. (16) Consumption taxes The Company and its consolidated subsidiaries are accounted for using the tax excluded method. With regard to consumption taxes and other taxes that are not subject to deduction, the related expenses are reported in the fiscal year in which they are incurred. However, consumption taxes and other taxes that are not subject to deduction but related to fixed assets are recorded in “Other investments and other assets” within “Investments and other assets” and amortized using the straight-line method. Accrued consumption taxes are indicated in the corresponding “other” sections within current assets

AIN HOLDINGS ANNUAL REPORT 2017 3534 AIN HOLDINGS ANNUAL REPORT 2017
and current liabilities. (17) Recoverability of deferred tax assets The Company and its consolidated subsidiaries have applied “Revised Implementation Guidance on Recoverability of Deferred Tax Assets” (ASBJ Guidance No. 26 revised on March 28, 2016) from the beginning of the fiscal year ended April 30, 2017. (18) Reclassification and restatement Certain prior year amounts have been reclassified to conform to the current year presentation. These reclassifications and restatement had no impact on previously reported results of operations.
2. Cash and cash equivalents (1) Reconciliations of cash on hand and in banks shown in the consolidated balance sheet and cash
and cash equivalents shown in the consolidated statement of cash flows as of and for the years ended April 30, 2017 and 2016 are as follows:
Thousands of Millions of yen U.S. dollars 2017 2016 2017 Cash on hand and in banks ¥ 29,775 ¥ 22,647 $ 267,544 Less: Time deposits with maturities
exceeding three months (540) (755) (4,852) Cash and cash equivalents ¥ 29,234 ¥ 21,892 $ 262,683
(2) The following table summarizes assets acquired and liabilities assumed through the acquisition of
shares of the companies relating acquisition cost and net disbursement:
(a) Major breakdown of assets and liabilities of companies newly included in the consolidated financial statements for the years ended April 30, 2017 and 2016 due to the acquisition of shares
(i) Acquisition of shares of 38 companies in the dispensing pharmacy business and one other
company for the year ended April 30, 2017
The following is the summary of assets acquired and liabilities assumed through the acquisition of shares of the companies relating acquisition cost and net disbursement.
Thousands of Millions of yen U.S. dollars 2017 2017 Current assets ¥ 9,019 $ 81,040 Fixed assets 2,767 24,862 Goodwill 10,967 98,544 Current liabilities (8,332) (74,867) Long-term liabilities (3,347) (30,074) Acquisition cost of the companies 11,074 99,505
Cash and cash equivalents held by the companies
(1,377)
(12,373)
Net disbursement due to the acquisition
¥ 9,697
$ 87,132
(ii) Acquisition of shares of 24 companies in the dispensing pharmacy business and four other
companies for the year ended April 30, 2016
The following is the summary of assets acquired and liabilities assumed through the acquisition of shares of the companies relating acquisition cost and net disbursement.
Millions of yen 2016 Current assets ¥ 11,344 Fixed assets 3,315 Goodwill 9,190 Current liabilities (8,155) Long-term liabilities (1,668) Acquisition cost of the companies 14,026
Cash and cash equivalents held by the companies
(3,071)
Net disbursement due to the acquisition
¥ 10,954
3. Inventories Inventories at April 30, 2017 and 2016 consisted of the following:
Thousands of Millions of yen U.S. dollars 2017 2016 2017 Merchandise ¥ 11,402 ¥ 10,661 $ 102,453 Supplies 266 323 2,390 ¥ 11,668 ¥ 10,984 $ 104,843
4. Financial instruments (1) Qualitative information on financial instruments
(a) Policies for using financial instruments The Company and its consolidated subsidiaries have expanded business by opening dispensing pharmacies and drug and cosmetic stores and through M&A activities. Operating cash flows provide the majority of the funds the Company and its consolidated subsidiaries require to fund its shop openings. The Company and its consolidated subsidiaries secure additional funding as needed for M&A activities through bank borrowings and issuance of new shares and invests in highly liquid financial assets.
(b) Details of financial instruments used and the exposures to risk and how they arise
Notes and accounts receivable, which relate to trade receivables, are mostly composed of prescription dispensing fees receivable from National Health Insurance associations and the Social Insurance Medical Care Fee Payment Fund. In addition, most of other accounts receivable are collected in a short period. Therefore, these do not entail any risk.
Investment securities, which are principally equity securities held for the purpose of maintaining operating relationships with other companies, involve the risk of market price fluctuations.
Lease deposits and guarantee deposits are primarily deposits placed with the owners of properties that the Company leases for the operation of dispensing pharmacies and drugstores. Such deposits involve lessor credit risk.
Notes and accounts payable, which relate to purchases, are payable within three months.
With respect to borrowings, the Company raises funds primarily as working capital or in relation to capital expenditures. Redemption periods on such debts are typically eight years from the date of borrowing, at the longest.
(c) Policies and systems for risk management Management of credit risk (the risk that a business partner will default on its business transactions)
As the Company’s notes and accounts receivable, which relate to sales, are mostly composed of prescription dispensing fees receivable from National Health Insurance associations and the Social Insurance Medical Care Fee Payment Fund, and most of other accounts receivable are also

AIN HOLDINGS ANNUAL REPORT 2017 3736 AIN HOLDINGS ANNUAL REPORT 2017
collected in a short period, no particular risk management is employed.
Securities held to maturity are based on the Company’s Marketable Securities Investment Standards. Such investments are based on careful decisions, following internal screenings of investees and investment amounts. Furthermore, such investments are monitored regularly, determining the investee’s financial status throughout the investment period to quickly determine and minimize potential repayment difficulties.
The Company manages default risk on lease deposits and guarantee deposits through the credit control upon making contract periods and regular credit screening.
Management of market risk (the risk of exchange and interest rate fluctuations) The Company and its consolidated subsidiaries raise funds mainly through long-term debt. With regard to investment securities, the Company and its consolidated subsidiaries regularly check the financial conditions of the issuers of unlisted securities. The Company and its consolidated subsidiaries review on an ongoing basis the status of their holdings of listed securities, taking into consideration market conditions and their relationships with the issuing companies.
Management of liquidity risk associated with fund procurement (the risk of being unable to execute payments when due) To manage liquidity risk, the Company and its consolidated subsidiaries create cash flow plans based on annual capital expenditures forecasts. These plans are updated each month, based on revised operating performance and forecast figures. To ensure the Company’s ability to respond flexibly to sudden demands for funding in relation to M&A activities, the Company maintains a certain level of liquidity, including through issuance of new shares.
(2) Fair values of financial instruments Carrying values and fair values of the financial instruments on the consolidated balance sheet at April 30, 2017 and 2016 are summarized in the following table:
Assets Millions of yen
Thousands of U.S. dollars
2017 2016 2017 Carrying value
Cash on hand and in banks ¥ 29,775 ¥ 22,647 $ 267,544 Notes and accounts receivable 9,990 12,385 89,765 Other accounts receivable 9,402 5,983 84,481 Investment securities 1,542 1,408 13,855
Deposits and guarantees 10,386 9,956 93,323 Total 61,096 52,382 548,980
Fair value Cash on hand and in banks 29,775 22,647 267,544 Notes and accounts receivable 9,990 12,385 89,765 Other accounts receivable 9,402 5,983 84,481 Investment securities 1,545 1,438 13,882
Deposits and guarantees 10,353 9,970 93,027 Total 61,066 52,425 548,710
Difference Cash on hand and in banks - - - Notes and accounts receivable - - - Other accounts receivable - - - Investment securities 2 29 17
Deposits and guarantees (32) 14 (287) Total ¥ (30) ¥ 43 $ (269)
Liabilities
Millions of yen Thousands of
U.S. dollars 2017 2016 2017 Carrying value
Accounts payable ¥ 39,325 ¥ 39,987 $ 353,356 Short-term debt including current portion of long-term debt
7,596
5,690
68,254
Deposits received 14,223 10,112 127,801 Long-term debt 18,254 14,854 164,021
Total 79,400 70,644 713,451 Fair value
Accounts payable 39,325 39,987 353,356 Short-term debt including current portion of long-term debt
7,606
5,696
68,343
Deposits received 14,223 10,112 127,801 Long-term debt 18,288 14,894 164,327
Total 79,444 70,691 713,846 Difference
Accounts payable - - - Short-term debt including current portion of long-term debt
9
6
80
Deposits received - - - Long-term debt 34 40 305
Total ¥ 43 ¥ 47 $ 386 Method of calculating the fair value of financial instruments and matters related to available-for-sale securities and derivative transactions: Assets: (a) Cash on hand and in banks, notes and accounts receivable, and other accounts receivable
As these instruments are settled in the short term, their carrying value approximates fair value. (b) Investment securities
The fair values of equity securities are determined by their prices on stock exchanges. The fair values of bonds are determined by the prices indicated by the counterparty financial institutions, or the Company determines credit risk from the standpoint of credit management, according to repayment amount and contract period, and these amounts are discounted to their present value using appropriate rates of interest.
(c) Deposits and guarantees The Company determines credit risk from the standpoint of credit management, according to repayment amount and contract period. These amounts are discounted to their present value using appropriate rates of interest.
Liabilities: (a) Accounts payable, short-term debt and deposits received
As these instruments are settled in the short term, their carrying value approximates fair value. The fair value of current portion of long-term debt included in short-term debt is determined by discounting the total amount of principal and interest by the assumed interest rate on new borrowings of the same type.
(b) Long-term debt
The fair value of long-term debt is determined by discounting the total amount of principal and interest by the assumed interest rate on new borrowings of the same type.
Financial instruments for which fair value is not readily determinable: The fair values of unlisted equity securities with carrying amounts of ¥892 million ($8,015 thousand) and ¥1,268 million as of April 30, 2017 and 2016, respectively, are not readily determinable.

AIN HOLDINGS ANNUAL REPORT 2017 3938 AIN HOLDINGS ANNUAL REPORT 2017
The redemption schedule for monetary claims and securities with maturity dates as of April 30, 2017 and 2016 are summarized as follows:
Millions of yen 2017
1 year or less
More than 1
year but less than 5 years
More than 5
years but less than 10 years
More than 10 years
Cash on hand and in banks ¥ 29,295 ¥ - ¥ - ¥ - Notes and accounts receivable 9,990 - - - Other accounts receivable 9,402 - - - Investment securities
Debt securities 179 10 - - Deposits received 2,086 3,735 2,518 2,102
Total ¥ 50,953 ¥ 3,745 ¥ 2,518 ¥ 2,102
Thousands of U.S. dollars
2017
1 year or less
More than 1
year but less than 5 years
More than 5
years but less than 10 years
More than 10 years
Cash on hand and in banks $ 263,231 $ - $ - $ - Notes and accounts receivable 89,765 - - - Other accounts receivable 84,481 - - - Investment securities
Debt securities 1,608 89 - - Deposits received 18,743 33,560 22,625 18,887
Total $ 457,839 $ 33,650 $ 22,625 $ 18,887
Millions of yen 2016
1 year or less
More than 1
year but less than 5 years
More than 5
years but less than 10 years
More than 10 years
Cash on hand and in banks ¥ 21,687 ¥ - ¥ - ¥ - Notes and accounts receivable 12,385 - - - Other accounts receivable 5,983 - - - Investment securities
Debt securities 179 39 100 - Deposits received 1,671 3,511 2,751 2,078
Total ¥ 41,907 ¥ 3,551 ¥ 2,851 ¥ 2,078
5. Securities (1) The following tables summarize acquisition costs, carrying values and differences of securities with
available fair values as of April 30, 2017 and 2016:
Other securities:
Securities with carrying values exceeding acquisition costs Thousands of
Millions of yen U.S. dollars 2017 2016 2017 Acquisition cost
Equity securities ¥ 367 ¥ 147 $ 3,297 Bonds - - - Limited partnerships and similar investments
17
29
152
Other - - - Total 384 177 3,450
Carrying value Equity securities 562 223 5,049 Bonds - - - Limited partnerships and similar investments
26
35
233
Other - - - Total 588 259 5,283
Difference
Equity securities 195 75 1,752 Bonds - - - Limited partnerships and similar investments
9
5
80
Other - - - Total ¥ 204 ¥ 81 $ 1,833

AIN HOLDINGS ANNUAL REPORT 2017 4140 AIN HOLDINGS ANNUAL REPORT 2017
Other securities:
Securities with carrying values not exceeding acquisition costs
Thousands of Millions of yen U.S. dollars
2017 2016 2017 Acquisition cost
Equity securities ¥ 412 ¥ 605 $ 3,702 Bonds 189 319 1,698 Limited partnerships and similar investments
411
379
3,693
Other 19 19 170 Total 1,034 1,324 9,291
Carrying value Equity securities 333 431 2,992 Bonds 189 319 1,698 Limited partnerships and similar investments
411
379
3,693
Other 19 19 170 Total 954 1,149 8,572
Difference
Equity securities (79) (174) (709) Bonds - - - Limited partnerships and similar investments
-
-
-
Other (0) (0) (0) Total ¥ (80) ¥ (174) $ (718)
Equity securities included stocks of non-consolidated subsidiaries and affiliates of ¥115 million ($1,033 thousand) and ¥114 million at April 30, 2017 and 2016, respectively.
(2) The following table summarizes total sales amounts of other securities sold, and amounts of the
related gains and losses in the years ended April 30, 2017 and 2016: Thousands of
Millions of yen U.S. dollars 2017 2016 2017 Total sales of
other securities sold ¥ 869 ¥ 0 $ 7,808 Related gains 264 - 2,372 Related losses 1 0 8
(3) The following table summarizes impairment losses on other securities in the years ended April 30,
2017 and 2016: Thousands of
Millions of yen U.S. dollars 2017 2016 2017 Other securities with fair value ¥ - ¥ - $ - Other securities without fair value - 0 -
6. Leases The following pro forma amounts represent the acquisition costs, accumulated depreciation, impairment losses and net balance of leased assets as of April 30, 2017 and 2016, which would have been reflected in the consolidated balance sheets if finance lease accounting had been applied to the finance leases currently accounted for as operating leases as allowed under Japanese GAAP.
Thousands of Millions of yen U.S. dollars
2017 2016 2017 Acquisition cost
Buildings ¥ - ¥ 68 $ - Other fixed assets - - - Intangible fixed assets - - -
Total - 68 - Accumulated depreciation
Buildings - 64 - Other fixed assets - - - Intangible fixed assets - - -
Total - 64 - Impairment losses
Buildings - - - Other fixed assets - - - Intangible fixed assets - - -
Total - - - Net balance
Buildings - 4 - Other fixed assets - - - Intangible fixed assets - - -
Total ¥ - ¥ 4 $ - Future minimum lease payments as of April 30, 2017 and 2016 for finance leases currently accounted for as operating leases are summarized as follows:
Thousands of Millions of yen U.S. dollars
2017 2016 2017 Due within one year ¥ - ¥ 11 $ - Due after one year - 1 - Total ¥ - ¥ 12 $ -
The following table summarizes details of lease expenses, reversal of impairment losses for leased assets, depreciation, interest expense and impairment losses, if they had been capitalized:
Thousands of Millions of yen U.S. dollars
2017 2016 2017 Lease expense ¥ 1 ¥ 13 $ 8 Reversal of impairment losses for leased assets
-
-
-
Depreciation 0 3 0 Interest expense 0 3 0 Impairment losses - - -
Equivalent interest is calculated by applying the interest method to allocate for each fiscal year over the term of the lease the difference between the total lease amount and the equivalent acquisition price of the leased asset.

AIN HOLDINGS ANNUAL REPORT 2017 4342 AIN HOLDINGS ANNUAL REPORT 2017
Remaining lease expenses for non-cancellable operating lease transactions are as follows: Thousands of
Millions of yen U.S. dollars 2017 2016 2017 Due within one year ¥ 1,508 ¥ 1,293 $ 13,550 Due after one year 9,955 10,244 89,450 Total ¥ 11,463 ¥ 11,538 $ 103,001
7. Short-term debt and long-term debt Short-term debt and long-term debt at April 30, 2017 and 2016 consisted of the following:
Thousands of Millions of yen U.S. dollars 2017 2016 2017 Short-term bank loans with a weighted-average interest rate of 0.6%
¥ 151
¥ 77
$ 1,356
Current portion of long-term debt with a weighted-average interest rate of 0.3%
7,445
5,612
66,897
Current portion of lease obligation with a weighted-average interest rate of 1.1%
594
668
5,337
Long-term debt (2018-2034) with a weighted-average interest rate of 0.3%
18,254
14,854
164,021
Lease obligation (2018-2022) with a weighted-average interest rate of 1.2%
958
1,198
8,608
Total ¥ 27,403 ¥ 22,410 $ 246,230 At April 30, 2017 and 2016, the carrying amounts of assets pledged as collateral for long-term debt are as follows:
Assets pledged as collateral: Thousands of Millions of yen U.S. dollars 2017 2016 2017
Buildings ¥ - ¥ 56 $ - Land - 23 - Investment securities 5 5 44
Total ¥ 5 ¥ 85 $ 44
Liabilities corresponding to collateral: Thousands of
Millions of yen U.S. dollars 2017 2016 2017
Accounts payable ¥ 1 ¥ 0 $ 8 Long-term debt - 39 -
Total ¥ 1 ¥ 40 $ 8
The aggregate annual maturities of long-term debt at April 30, 2017 are as follows: Thousands of
Year ending April 30, Millions of yen U.S. dollars 2018 ¥ 7,445 $ 66,897 2019 6,721 60,391 2020 5,220 46,904 2021 3,704 33,282 2022 1,902 17,090
The aggregate annual maturities of lease obligations at April 30, 2017 are as follows:
Thousands of Year ending April 30, Millions of yen U.S. dollars
2018 ¥ 594 $ 5,337 2019 426 3,827 2020 298 2,677 2021 159 1,428 2022 63 566
8. Sales, disposal and impairment of fixed assets (1) Gains and losses on sales of fixed assets for the years ended April 30, 2017 and 2016 are as
follows: Gains on sales of fixed assets: Thousands of Millions of yen U.S. dollars 2017 2016 2017
Buildings and structures ¥ 2 ¥ 17 $ 17 Land 1 4 8 Other property, plant and equipment
8
1
71
Total ¥ 11 ¥ 24 $ 98
Losses on sales of fixed assets: Thousands of Millions of yen U.S. dollars 2017 2016 2017
Buildings and structures ¥ 21 ¥ 0 $ 188 Land 4 107 35 Construction in progress - 1 - Other property, plant and equipment
10
9
89
Other intangible fixed assets 3 - 26 Total ¥ 39 ¥ 119 $ 350
(2) Losses on disposal of fixed assets for the years ended April 30, 2017 and 2016 are as follows:
Thousands of
Millions of yen U.S. dollars 2017 2016 2017 Buildings and structures ¥ 155 ¥ 192 $ 1,392 Construction in progress - 6 - Other property, plant and equipment
23
14
206
Goodwill 158 - 1,419 Other intangible fixed assets 6 2 53 Deposits and guarantees 67 42 602 Other investments and other assets
3
5
26
Disposal cost 34 25 305 Total ¥ 449 ¥ 290 $ 4,034

AIN HOLDINGS ANNUAL REPORT 2017 4544 AIN HOLDINGS ANNUAL REPORT 2017
(3) For the years ended April 30, 2017 and 2016, the Company recognized impairment losses for the following property groups:
Thousands of Millions of yen U.S. dollars 2017 2016 2017 Property group Description of assets Stores Store facilities ¥ 453 ¥ 641 $ 4,070 Real estate Land - 47 - Stores and real estate Store facilities and land - 167 -
Total ¥ 453 ¥ 856 $ 4,070 9. Retirement benefits Defined-benefit pension plan (1) Reconciliation of the beginning and the ending balance of retirement benefit obligation (excluding
the amount of the simplified method)
Thousands of Millions of yen U.S. dollars 2017 2017 Balance as of May 1, 2016 ¥ 2,300 $ 20,666 Service costs 339 3,046 Interest cost on retirement benefit obligation 7 62 Actuarial gains incurred (93) (835) Pension and severance payments (113) (1,015) Other 21 188 Balance as of April 30, 2017 ¥ 2,462 $ 22,122
Millions of yen 2016 Balance as of May 1, 2015 ¥ 1,724 Service costs 282 Interest cost on retirement benefit obligation 11 Actuarial gains incurred (101) Pension and severance payments (85) Increases due to a newly consolidated subsidiary
469
Other (0) Balance as of April 30, 2016 ¥ 2,300
(2) Reconciliation of the beginning and the ending balance of plan assets (excluding the amount of the
simplified method)
Thousands of Millions of yen U.S. dollars 2017 2017 Balance as of May 1, 2016 ¥ 772 $ 6,936 Expected return on plan assets 5 44 Actuarial losses incurred (16) (143) Business owner’s contribution 85 763 Pension and severance payments (38) (341) Balance as of April 30, 2017 ¥ 808 $ 7,260
Millions of yen 2016 Balance as of May 1, 2015 ¥ 493 Expected return on plan assets 6 7,26Actuarial losses incurred (32) Business owner’s contribution 102 Pension and severance payments (11) Increases due to a newly consolidated subsidiary
213
Balance as of April 30, 2016 ¥ 772
(3) Reconciliation of the beginning and the ending balance of liabilities of the simplified method
Thousands of Millions of yen U.S. dollars 2017 2017 Balance as of May 1, 2016 ¥ 525 $ 4,717 Retirement benefit expenses 149 1,338 Business owner’s contribution (18) (161) Pension and severance payments (71) (637) Increases due to a newly consolidated subsidiary
5
44
Other 64 575 Balance as of April 30, 2017 ¥ 655 $ 5,885
Millions of yen 2016 Balance as of May 1, 2015 ¥ 392 Retirement benefit expenses 135 Business owner’s contribution (27) Pension and severance payments (71) Other 96 Balance as of April 30, 2016 ¥ 525
(4) Reconciliation of the retirement benefit obligation and plan assets to net defined benefit liability and
net defined benefit asset reported on the consolidated balance sheet
Thousands of Millions of yen U.S. dollars 2017 2016 2017 Funded retirement benefit obligation ¥ 1,190 ¥ 969 $ 10,692 Plan assets (952) (895) (8,554)
Subtotal 237 73 2,129 Unfunded retirement benefit obligation 2,071 1,981 18,609 Net of liability and asset reported on the consolidated balance sheet
2,309
2,054
20,747
Net defined benefit liability 2,331 2,228 20,945 Net defined benefit asset (22) (174) (197) Net of liability and asset reported on the consolidated balance sheet
¥ 2,309
¥ 2,054
$ 20,747

AIN HOLDINGS ANNUAL REPORT 2017 4746 AIN HOLDINGS ANNUAL REPORT 2017
(5) Retirement benefit expenses for the years ended April 30, 2017 and 2016 comprised the following:
Thousands of Millions of yen U.S. dollars 2017 2016 2017 Service costs ¥ 339 ¥ 282 $ 3,046 Interest cost on retirement benefit obligation
7
11
62
Expected return on plan assets (5) (6) (44) Amortization of actuarial losses 28 69 251 Amortization of prior service costs (34) (34) (305) Retirement benefit expenses calculated under the simplified method
149
135
1,338
Other - 3 - Retirement benefit expenses
¥ 484
¥ 461
$ 4,348 (6) Remeasurements of defined benefit plans
The breakdown of remeasurements of defined benefit plans (before deducting tax effect) is as shown below:
(a) Current Thousands of Millions of yen U.S. dollars 2017 2016 2017 Unrecognized actuarial gains ¥ (77) ¥ (72) $ (691)
Total ¥ (77) ¥ (72) $ (691) (b) Accumulated
Thousands of Millions of yen U.S. dollars 2017 2016 2017 Unrecognized prior service costs ¥ (48) ¥ (82) $ (431) Unrecognized actuarial (losses) gains (16) 89 (143)
Total ¥ (64) ¥ 6 $ (575) (7) Plan assets
(a) Percentages for major categories within total plan assets are as follows:
2017 2016 Bonds 7% 7% Stocks 4% 4% General account 47% 63% Other 42% 26%
Total 100% 100% (b) Method of establishing the long-term expected return on plan assets
The long-term expected return on plan assets is determined by taking into consideration current and expected allocation of plan assets, as well as the current and future long-term expected profitability of the diverse assets that constitute the plan assets.
(8) Actuarial assumptions used in accounting for the Company’s plans as of April 30, 2017 and 2016 are principally as follows:
2017 2016 Weighted average discount rate 0.64% 0.46% Weighted average expected rate of return on plan assets
0.75%
0.75%
Expected rates of salary increase 1.00%-4.24% 1.00%-4.24%
10. Income taxes The aggregate statutory income tax rates used for calculation of deferred income tax assets and liabilities for the years ended April 30, 2017 and 2016 were 30.6% and 31.7%, respectively. (1) The following table summarizes the significant differences between the statutory tax rate and the
effective tax rates for consolidated financial statement purposes for the years ended April 30, 2017 and 2016:
2017 2016 Statutory tax rate 30.6% 31.7%
Non-deductible expenses 1.0 0.5 Per capita inhabitant tax 0.7 1.0 Amortization of goodwill 6.6 5.4 Valuation allowance 0.4 0.5 Tax credits on tax system to expand income
(1.0)
(0.5)
Tax credits on tax system for promoting equipments and investment to improve productivity
(0.1)
(0.5) Different tax rates applied to consolidated subsidiaries
3.9
3.9
Other 2.4 0.9 Effective tax rates 44.4% 42.9%
(2) Significant components of deferred tax assets and liabilities as of April 30, 2017 and 2016 are as
follows: Thousands of Millions of yen U.S. dollars 2017 2016 2017 Deferred tax assets:
Impairment losses ¥ 330 ¥ 291 $ 2,965 Excess of depreciation 485 442 4,357 Excess of allowance for bonuses 596 510 5,355 Excess of reserve for rewards obligation 140 133 1,257 Net defined benefit liabilities 741 558 6,658 Other 1,690 1,773 15,185
Sub-total deferred tax assets 3,985 3,708 35,807 Valuation allowance 442 383 3,971
Total deferred tax assets 3,542 3,324 31,826 Deferred tax liabilities:
Capitalized removal costs (160) (131) (1,437) Net unrealized holding gains on securities (37) (0) (332) Other (347) (125) (3,117)
Total deferred tax liabilities (545) (257) (4,897) Net deferred tax assets ¥ 2,997 ¥ 3,067 $ 26,929
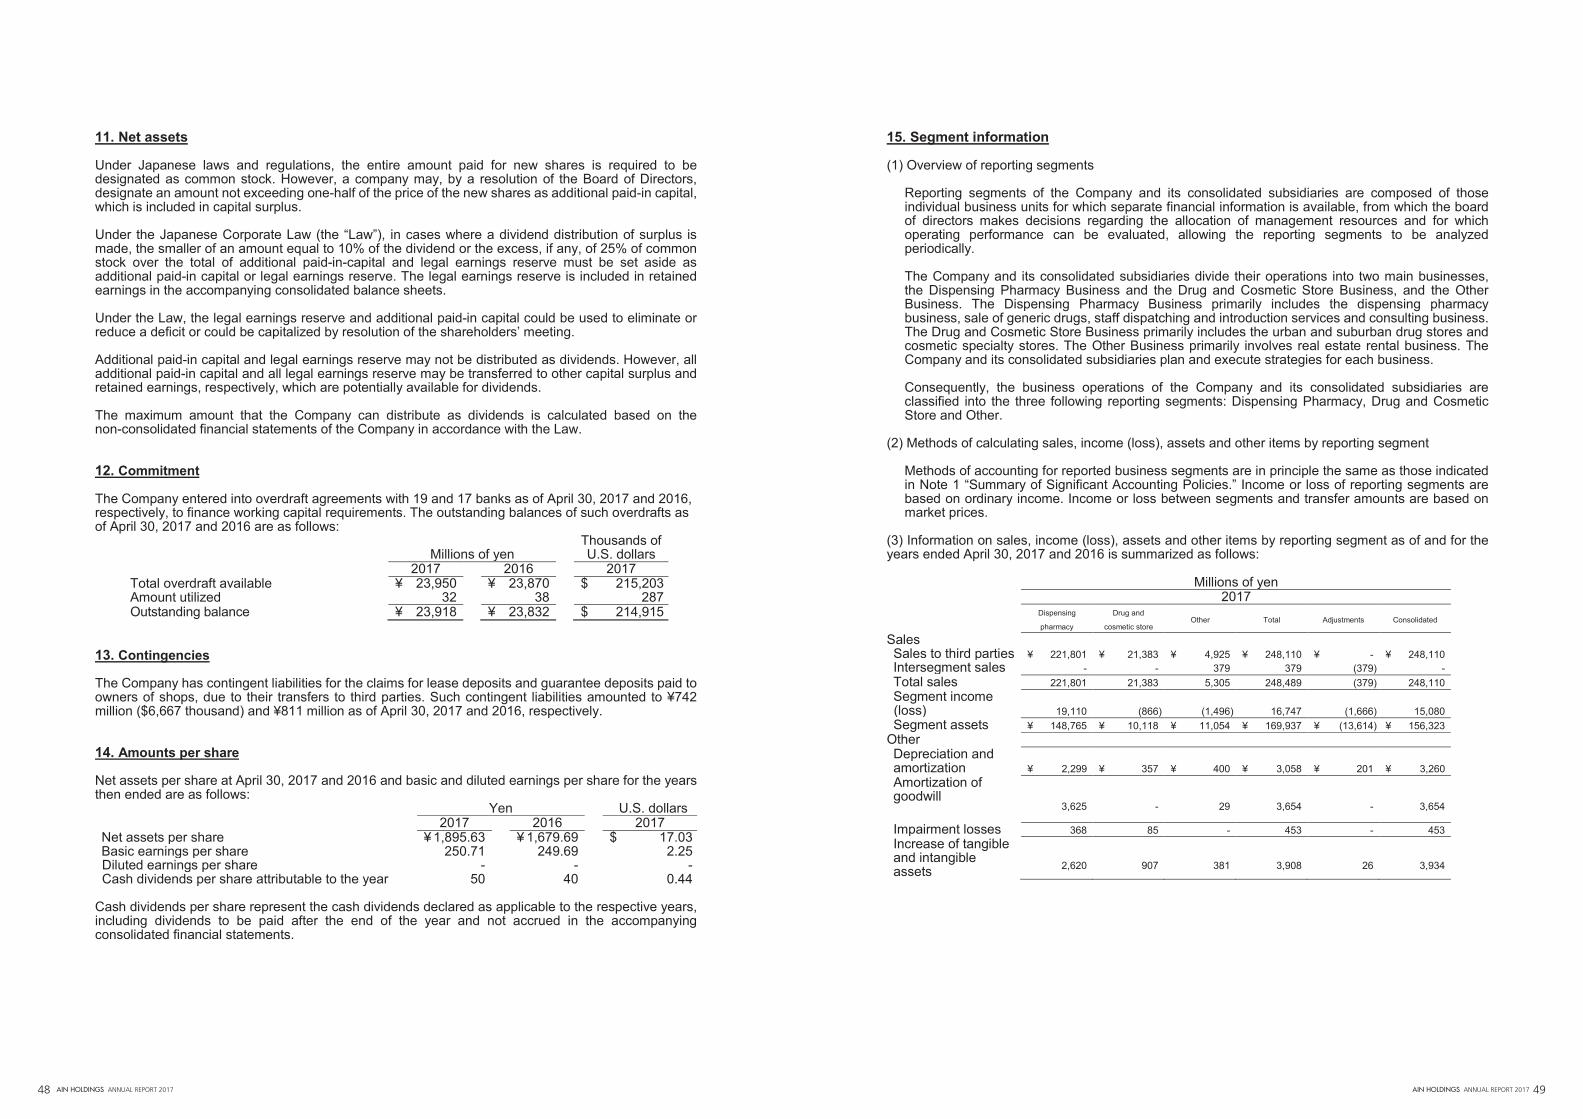
AIN HOLDINGS ANNUAL REPORT 2017 4948 AIN HOLDINGS ANNUAL REPORT 2017
11. Net assets Under Japanese laws and regulations, the entire amount paid for new shares is required to be designated as common stock. However, a company may, by a resolution of the Board of Directors, designate an amount not exceeding one-half of the price of the new shares as additional paid-in capital, which is included in capital surplus. Under the Japanese Corporate Law (the “Law”), in cases where a dividend distribution of surplus is made, the smaller of an amount equal to 10% of the dividend or the excess, if any, of 25% of common stock over the total of additional paid-in-capital and legal earnings reserve must be set aside as additional paid-in capital or legal earnings reserve. The legal earnings reserve is included in retained earnings in the accompanying consolidated balance sheets. Under the Law, the legal earnings reserve and additional paid-in capital could be used to eliminate or reduce a deficit or could be capitalized by resolution of the shareholders’ meeting. Additional paid-in capital and legal earnings reserve may not be distributed as dividends. However, all additional paid-in capital and all legal earnings reserve may be transferred to other capital surplus and retained earnings, respectively, which are potentially available for dividends. The maximum amount that the Company can distribute as dividends is calculated based on the non-consolidated financial statements of the Company in accordance with the Law. 12. Commitment The Company entered into overdraft agreements with 19 and 17 banks as of April 30, 2017 and 2016, respectively, to finance working capital requirements. The outstanding balances of such overdrafts as of April 30, 2017 and 2016 are as follows:
Thousands of Millions of yen U.S. dollars 2017 2016 2017 Total overdraft available ¥ 23,950 ¥ 23,870 $ 215,203 Amount utilized 32 38 287 Outstanding balance ¥ 23,918 ¥ 23,832 $ 214,915
13. Contingencies The Company has contingent liabilities for the claims for lease deposits and guarantee deposits paid to owners of shops, due to their transfers to third parties. Such contingent liabilities amounted to ¥742 million ($6,667 thousand) and ¥811 million as of April 30, 2017 and 2016, respectively. 14. Amounts per share Net assets per share at April 30, 2017 and 2016 and basic and diluted earnings per share for the years then ended are as follows: Yen U.S. dollars 2017 2016 2017 Net assets per share ¥ 1,895.63 ¥ 1,679.69 $ 17.03 Basic earnings per share 250.71 249.69 2.25 Diluted earnings per share - - - Cash dividends per share attributable to the year 50 40 0.44
Cash dividends per share represent the cash dividends declared as applicable to the respective years, including dividends to be paid after the end of the year and not accrued in the accompanying consolidated financial statements.
15. Segment information (1) Overview of reporting segments
Reporting segments of the Company and its consolidated subsidiaries are composed of those individual business units for which separate financial information is available, from which the board of directors makes decisions regarding the allocation of management resources and for which operating performance can be evaluated, allowing the reporting segments to be analyzed periodically. The Company and its consolidated subsidiaries divide their operations into two main businesses, the Dispensing Pharmacy Business and the Drug and Cosmetic Store Business, and the Other Business. The Dispensing Pharmacy Business primarily includes the dispensing pharmacy business, sale of generic drugs, staff dispatching and introduction services and consulting business. The Drug and Cosmetic Store Business primarily includes the urban and suburban drug stores and cosmetic specialty stores. The Other Business primarily involves real estate rental business. The Company and its consolidated subsidiaries plan and execute strategies for each business. Consequently, the business operations of the Company and its consolidated subsidiaries are classified into the three following reporting segments: Dispensing Pharmacy, Drug and Cosmetic Store and Other.
(2) Methods of calculating sales, income (loss), assets and other items by reporting segment
Methods of accounting for reported business segments are in principle the same as those indicated in Note 1 “Summary of Significant Accounting Policies.” Income or loss of reporting segments are based on ordinary income. Income or loss between segments and transfer amounts are based on market prices.
(3) Information on sales, income (loss), assets and other items by reporting segment as of and for the years ended April 30, 2017 and 2016 is summarized as follows: Millions of yen 2017 Dispensing
pharmacy
Drug and
cosmetic store Other Total Adjustments Consolidated
Sales Sales to third parties ¥ 221,801 ¥ 21,383 ¥ 4,925 ¥ 248,110 ¥ - ¥ 248,110 Intersegment sales - - 379 379 (379) - Total sales 221,801 21,383 5,305 248,489 (379) 248,110 Segment income (loss)
19,110
(866)
(1,496)
16,747
(1,666)
15,080
Segment assets ¥ 148,765 ¥ 10,118 ¥ 11,054 ¥ 169,937 ¥ (13,614) ¥ 156,323 Other Depreciation and amortization
¥ 2,299
¥ 357
¥ 400
¥ 3,058
¥ 201
¥ 3,260
Amortization of goodwill
3,625 -
29
3,654
-
3,654
Impairment losses 368 85 - 453 - 453 Increase of tangible and intangible assets
2,620
907
381
3,908
26
3,934
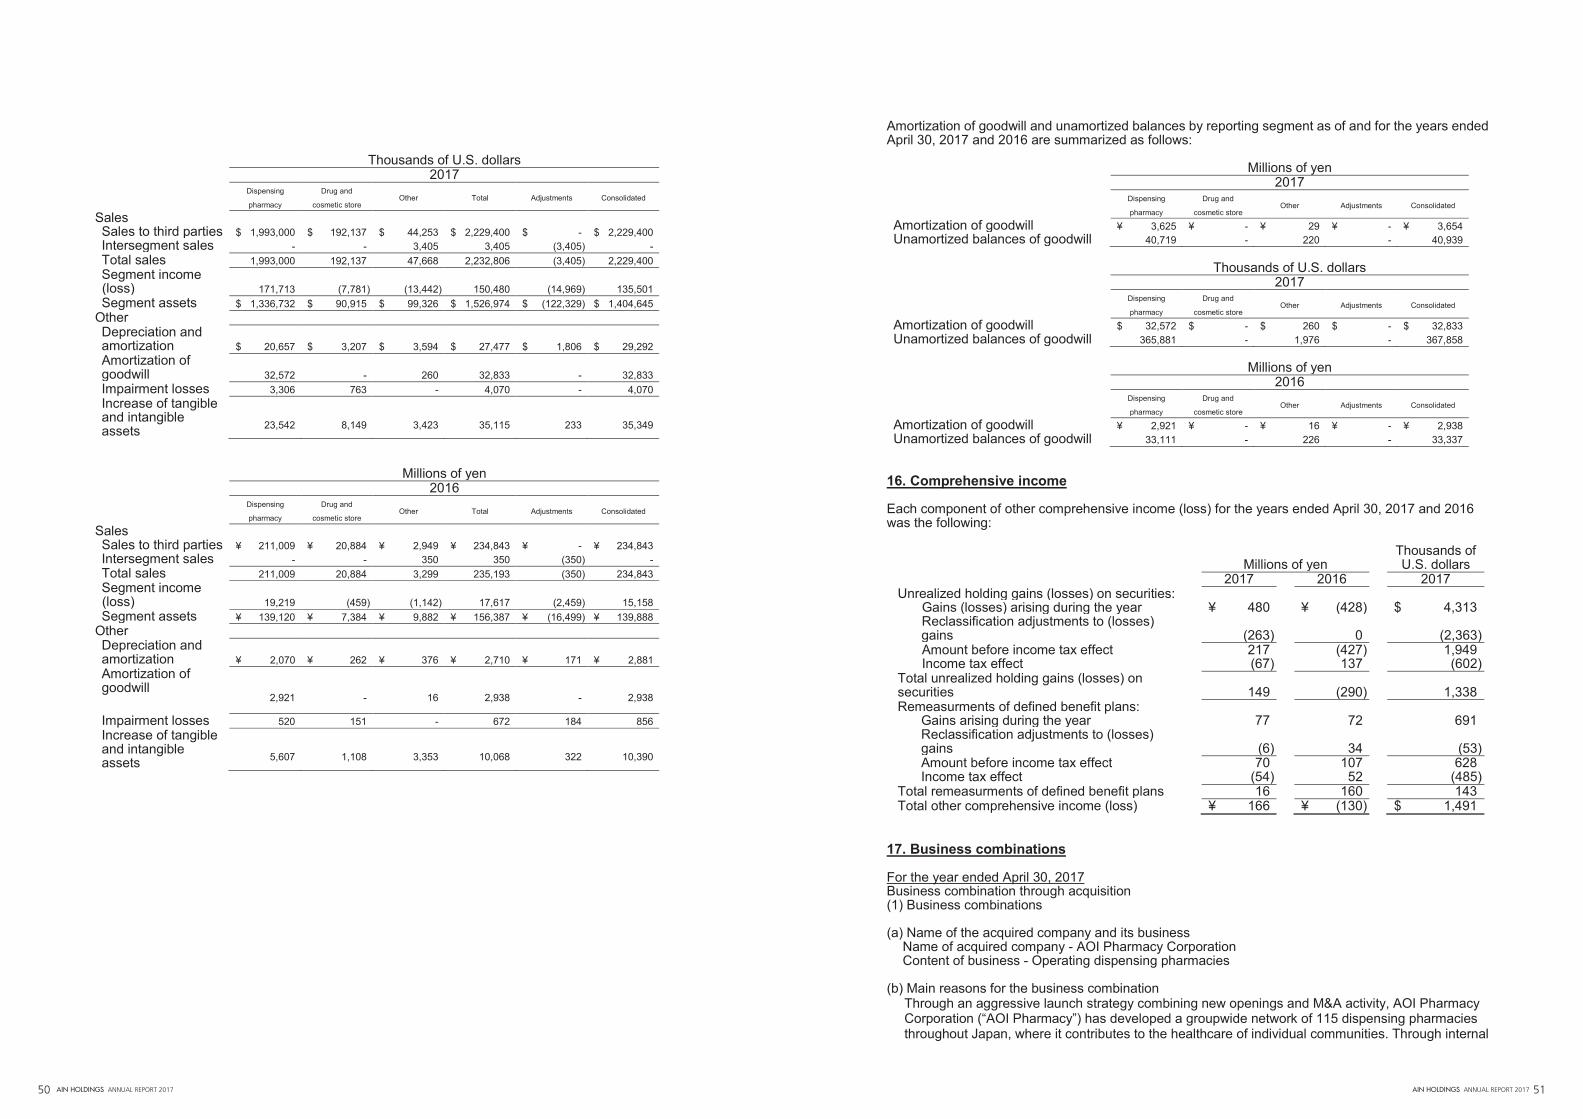
AIN HOLDINGS ANNUAL REPORT 2017 5150 AIN HOLDINGS ANNUAL REPORT 2017
Thousands of U.S. dollars 2017 Dispensing
pharmacy
Drug and
cosmetic store Other Total Adjustments Consolidated
Sales Sales to third parties $ 1,993,000 $ 192,137 $ 44,253 $ 2,229,400 $ - $ 2,229,400 Intersegment sales - - 3,405 3,405 (3,405) - Total sales 1,993,000 192,137 47,668 2,232,806 (3,405) 2,229,400 Segment income (loss)
171,713
(7,781)
(13,442)
150,480
(14,969)
135,501
Segment assets $ 1,336,732 $ 90,915 $ 99,326 $ 1,526,974 $ (122,329) $ 1,404,645 Other Depreciation and amortization
$ 20,657
$ 3,207
$ 3,594
$ 27,477
$ 1,806
$ 29,292
Amortization of goodwill
32,572
-
260
32,833
-
32,833
Impairment losses 3,306 763 - 4,070 - 4,070 Increase of tangible and intangible assets
23,542
8,149
3,423
35,115
233
35,349
Millions of yen 2016 Dispensing
pharmacy
Drug and
cosmetic store Other Total Adjustments Consolidated
Sales Sales to third parties ¥ 211,009 ¥ 20,884 ¥ 2,949 ¥ 234,843 ¥ - ¥ 234,843 Intersegment sales - - 350 350 (350) - Total sales 211,009 20,884 3,299 235,193 (350) 234,843 Segment income (loss)
19,219
(459)
(1,142)
17,617
(2,459)
15,158
Segment assets ¥ 139,120 ¥ 7,384 ¥ 9,882 ¥ 156,387 ¥ (16,499) ¥ 139,888 Other Depreciation and amortization
¥ 2,070
¥ 262
¥ 376
¥ 2,710
¥ 171
¥ 2,881
Amortization of goodwill
2,921 -
16
2,938
-
2,938
Impairment losses 520 151 - 672 184 856 Increase of tangible and intangible assets
5,607
1,108
3,353
10,068
322
10,390
Amortization of goodwill and unamortized balances by reporting segment as of and for the years ended April 30, 2017 and 2016 are summarized as follows: Millions of yen
2017 Dispensing
pharmacy
Drug and
cosmetic store Other Adjustments Consolidated
Amortization of goodwill ¥ 3,625 ¥ - ¥ 29 ¥ - ¥ 3,654 Unamortized balances of goodwill 40,719 - 220 - 40,939
Thousands of U.S. dollars
2017
Dispensing
pharmacy
Drug and
cosmetic store Other Adjustments Consolidated
Amortization of goodwill $ 32,572 $ - $ 260 $ - $ 32,833 Unamortized balances of goodwill 365,881 - 1,976 - 367,858
Millions of yen
2016 Dispensing
pharmacy
Drug and
cosmetic store Other Adjustments Consolidated
Amortization of goodwill ¥ 2,921 ¥ - ¥ 16 ¥ - ¥ 2,938 Unamortized balances of goodwill 33,111 - 226 - 33,337
16. Comprehensive income Each component of other comprehensive income (loss) for the years ended April 30, 2017 and 2016 was the following:
Thousands of Millions of yen U.S. dollars 2017 2016 2017 Unrealized holding gains (losses) on securities:
Gains (losses) arising during the year ¥ 480 ¥ (428) $ 4,313 Reclassification adjustments to (losses) gains
(263)
0
(2,363)
Amount before income tax effect 217 (427) 1,949 Income tax effect (67) 137 (602)
Total unrealized holding gains (losses) on securities
149
(290)
1,338
Remeasurments of defined benefit plans: Gains arising during the year 77 72 691 Reclassification adjustments to (losses) gains
(6)
34
(53)
Amount before income tax effect 70 107 628 Income tax effect (54) 52 (485)
Total remeasurments of defined benefit plans 16 160 143 Total other comprehensive income (loss) ¥ 166 ¥ (130) $ 1,491
17. Business combinations For the year ended April 30, 2017 Business combination through acquisition (1) Business combinations (a) Name of the acquired company and its business
Name of acquired company - AOI Pharmacy Corporation Content of business - Operating dispensing pharmacies
(b) Main reasons for the business combination
Through an aggressive launch strategy combining new openings and M&A activity, AOI Pharmacy Corporation (“AOI Pharmacy”) has developed a groupwide network of 115 dispensing pharmacies throughout Japan, where it contributes to the healthcare of individual communities. Through internal

training and study sessions, the company is working to reinforce its functionality as “primary care pharmacists and pharmacies.” In this and its initiatives to enhance patient services, AOI Pharmacy shares our business policy in many respects. By welcoming AOI Pharmacy to the AIN HOLDINGS Group (“the Group”), our dispensing pharmacies now number more than 1,000. We aim to expand our pharmacy network still further, and at the same time, by combining our mutual business experience and enhancing patient services, we intend to enhance the corporate value of the Group by providing a nationwide regional healthcare infrastructure.
(c) Date of the business combination
December 26, 2016 (d) Legal form of the business combination
Acquisition of shares for cash consideration (e) Name of the entity after the business combination
No changes were made to the name of AOI Pharmacy Corporation (f) Share of voting rights acquired
100% (g) Main grounds for determining the acquiring company
The Company acquired shares in AOI Pharmacy Corporation for cash consideration. (2) Period of operations of the acquired company included in the consolidated financial statements
From October 1, 2016 to March 31, 2017 (3) Acquisition cost and consideration of the acquired business
Cash consideration for acquisition ¥5,210 million ($46,814 thousand) Cost of acquisition ¥5,210 million ($46,814 thousand)
(4) Major acquisition-related costs
Advisory fees ¥171 million ($1,536 thousand) (5) Amount of goodwill generated, its sources, and its amortization method and term (a) Amount of goodwill generated
¥6,271 million ($56,348 thousand)
(b) Sources of goodwill Goodwill is the cost amount paid over the fair value of asset acquired and liabilities assumed and recoverable through the future operation by utilizing the AIN HOLDINGS Group’s management resources and economies of scale.
(c) Goodwill amortization method and term Straight-line method over 15 years
(6) Amounts of assets and liabilities acquired on the date of the business combination
Current assets ¥5,444 million ($48,917 thousand) Fixed assets ¥1,623 million ($14,583 thousand) Total assets ¥7,068 million ($63,509 thousand) Current liabilities ¥5,111 million ($45,925 thousand) Fixed liabilities ¥3,018 million ($27,118 thousand) Total liabilities ¥8,130 million ($73,052 thousand)
For the year ended April 30, 2016 (1) Transaction under common control (a) Overview of transaction (i) Names and details of businesses subject to the business combination
All business units with the exception of the Company’s Group management (ii) Date of the business combination November 1, 2015 (iii) Legal form of the business combination
An absorption-type split, with the Company as the Splitting Company and Ain Company Split Preparation Co., Ltd., a 100% subsidiary of the Company, as the Split Preparation Company
(iv) Name of the entity after the business combination AIN PHARMACIEZ INC. (v) Background of and objective of the business combination
In the dispensing pharmacy business, the AIN HOLDINGS Group is accelerating its business development through new store launches and M&A activity. In addition, the Group is enhancing its drugstore function through “family pharmacies” and expanding the scale of its urban drugstores. To achieve further growth, the Group has decided to transition to a holding company system in order to clarify authority and responsibility of Group company in each segment, to promote management autonomy and to bolster corporate competitiveness as a group. In addition, separating group management and administration from business execution, we intend to enhance corporate governance, and we believe the holding company structure is best suited to realizing continual increases in corporate value in this manner.
(b) Outline of accounting method used
In accordance with "Accounting Standard for Business Combinations" and " Guidance on Accounting Standard for Business Combinations and Accounting Standard for Business Divestitures, we treated the merger as a transaction under common control.
(2) Business combination through acquisition (a) Business combinations (i) Name of the acquired company and its business
Name of acquired company - NP HOLDINGS Co., Ltd. Content of business - Group management and real estate leasing business
(ii) Main reasons for the business combination
Nishinihon Pharmacy Co., Ltd., and Setouchi Pharmacy Co., Ltd., subsidiaries of NP HOLDINGS Co., Ltd., operate 41 dispensing pharmacies centered on Kagawa Prefecture, solidly dominating that region.
In addition to internal workshops and study sessions, departmental meetings are held regularly for each specialized department. The company’s business policies have many points in common with those of AIN HOLDINGS INC., such as contributing to regional healthcare through “dispensing pharmacies at the heart of local communities” and expanding patient services.
We welcome the NP HOLDINGS Group, Shikoku’s leading dispensing pharmacy chain, into the AIN HOLDINGS Group. The addition enables us to strengthen our operations in the Shikoku region, where we have few pharmacies, as well as promoting the development of more pharmacies in the region than before. By also combining our mutual business expertise and enhancing patient services, we expect to augment the corporate value of the Group.
(iii) Date of the business combination
November 2, 2015 (iv) Legal form of the business combination
Acquisition of shares for cash consideration (v) Name of the entity after the business combination
No changes were made to the name of NP HOLDINGS Co., Ltd. (vi) Share of voting rights acquired
100% (vii) Main grounds for determining the acquiring company
The Company acquired shares in NP HOLDINGS Co., Ltd. for cash consideration. (b) Period of operations of the acquired company included in the consolidated financial statements
From October 1, 2015 to March 31, 2016 (c) Acquisition cost and consideration of the acquired business
Cash consideration for acquisition ¥5,400 million Cost of acquisition ¥5,400 million
(d) Major acquisition-related costs
Advisory fees ¥201 million
AIN HOLDINGS ANNUAL REPORT 2017 5352 AIN HOLDINGS ANNUAL REPORT 2017

AIN HOLDINGS ANNUAL REPORT 2017 5554 AIN HOLDINGS ANNUAL REPORT 2017
(e) Amount of goodwill generated, its sources, and its amortization method and term (i) Amount of goodwill generated
¥3,356 million
(ii) Sources of goodwill Goodwill is the cost amount paid over the fair value of asset acquired and liabilities assumed and recoverable through the future operation by utilizing the AIN HOLDINGS Group’s management resources and economies of scale.
(iii) Goodwill amortization method and term Straight-line method over 15 years
(f) Amounts of assets and liabilities acquired on the date of the business combination
Current assets ¥3,038 million Fixed assets ¥973 million Total assets ¥4,011 million Current liabilities ¥1,609 million Fixed liabilities ¥358 million Total liabilities ¥1,968 million
18. Quarterly Information (1) Quarterly net sales for the year ended April 30, 2017 are as follows: Thousands of Millions of yen U.S. dollars 2017 2017 Three months ended July 31, 2016 ¥ 57,819 $ 519,534 Six months ended October 31, 2016 116,844 1,049,905 Nine months ended January 31, 2017 182,100 1,636,265 Twelve months ended April 30, 2017 248,110 2,229,400
(2) Quarterly income before income taxes and non-controlling interests for the year ended April 30,
2017 is as follows: Thousands of Millions of yen U.S. dollars 2017 2017 Three months ended July 31, 2016 ¥ 2,482 $ 22,302 Six months ended October 31, 2016 5,298 47,605 Nine months ended January 31, 2017 9,896 88,920 Twelve months ended April 30, 2017 14,307 128,556
(3) Quarterly profit attributable to owners of parent for the year ended April 30, 2017 is as follows: Thousands of Millions of yen U.S. dollars 2017 2017 Three months ended July 31, 2016 ¥ 1,371 $ 12,319 Six months ended October 31, 2016 2,855 25,653 Nine months ended January 31, 2017 5,438 48,863 Twelve months ended April 30, 2017 7,949 71,426
(4) Quarterly earnings per share for the year ended April 30, 2017 is as follows: Yen U.S. dollars 2017 2017 Three months ended July 31, 2016 ¥ 43.25 $ 0.38 Six months ended October 31, 2016 90.07 0.80 Nine months ended January 31, 2017 171.53 1.54 Twelve months ended April 30, 2017 250.71 2.25
(5) Quarterly earnings per share for each accounting period of the year ended April 30, 2017 is as
follows: Yen U.S. dollars 2017 2017 Three months ended July 31, 2016 ¥ 43.25 $ 0.38 Three months ended October 31, 2016 46.82 0.42 Three months ended January 31, 2017 81.46 0.73 Three months ended April 30, 2017 79.18 0.71

56 AIN HOLDINGS ANNUAL REPORT 2017
CORPORATE DATA(Fiscal 2017)
Corporate NameAIN HOLDINGS INC.
Head Office5-2-4-30, Higashisapporo, Shiroishi-ku, Sapporo, Hokkaido 003-0005, Japan
EstablishedAugust 1969
Paid-in Capital¥8,682 million
Number of EmployeesConsolidated: 6,469Non-consolidated: 142
Business LinesPlanning, management and operation of the corporate Group, focused on dispensing pharmacy and drugstore operation, generic drug wholesaling, sales of cosmetics, and the Group’s other businesses
STOCK INFORMATION(Fiscal 2017)
Transfer Agent Mizuho Trust & Banking Co., Ltd.
Stock ListingsFirst Section of the Tokyo Stock Exchange and Sapporo Securities Exchange
Securities Code Number9627
Fiscal Year May 1 to April 30 of the following year
Ordinary General Meeting of ShareholdersJuly
Date of RecordApril 30(The Company will announce other dates as and when required.)
Number of Shares Outstanding31,888,212 shares(including treasury stock)* The Company conducted a 2-for-1 stock split
of common shares with an effective date of October 1, 2014.
Number of Shareholders3,450
Major Shareholders (As of April 30, 2017)
Shareholders
Number of shares held (thousand
shares)
Share-holding ratio (%)
Kiichi Otani 3,238 10.16
Seven & i Holdings Co., Ltd. 2,480 7.78
Retirement Benefit Trust managed by Mizuho Trust & Banking Co., Ltd. (Marubeni Corporation account)*2; Trust & Custody Services Bank, Ltd. as a Trustee of Retrust
1,594 5.00
The Hokkaido Bank, Ltd. 1,472 4.62
JPMC OPPENHEIMER JASDEC LENDING ACCOUNT 1,163 3.65
North Pacific Bank, LTD. 1,085 3.40
Japan Trustee Services Bank, Ltd. (Trust Account) 1,016 3.19
ML PRO SEGREGATION ACCOUNT 945 2.97
MSIP CLIENT SECURITIES 846 2.66
GOLDMAN SACHS INTERNATIONAL 842 2.64
Notes: 1. The figure excludes 180,644 shares of the treasury stock owned by the Company. 2. Shares held in the Retirement Benefit Trust managed by Mizuho Trust & Banking Co., Ltd. (Marubeni
Corporation account) are part of Marubeni Corporation’s retirement benefit trust. 3. All shares held in Japan Trustee Services Bank, Ltd. (Trust Account) are related to trust services.
Investor Information
AIN HOLDINGS ANNUAL REPORT 2017 57

ANNUAL REPORT 2017For the year ended April 30, 2017


![[Dragon atlas game Strategy]-Things Need to Know When Raising Dragon](https://static.fdocuments.in/doc/165x107/55c44e39bb61eb181b8b46de/dragon-atlas-game-strategy-things-need-to-know-when-raising-dragon.jpg)


