Raising Confidence in the Analysis of Environmental...
67
Copyright 2012 Bruker Corporation. All Rights Reserved. Chemical and Applied Markets Raising Confidence in the Analysis of Environmental Samples with Tandem Mass Spectrometry Bruker Daltonics Chemical and Applied Markets Fremont, CA Ed George
Transcript of Raising Confidence in the Analysis of Environmental...

Copyright 2012 Bruker Corporation. All Rights Reserved.
C h e m i c a l a n d A p p l i e d M a r k e t s
Raising Confidence in the Analysis of Environmental
Samples with Tandem Mass Spectrometry
Bruker Daltonics Chemical and Applied Markets
Fremont, CA Ed George

Copyright 2012 Bruker Corporation. All Rights Reserved.
C h e m i c a l a n d A p p l i e d M a r k e t s
Bruker’s Portfolio of Chromatography and Mass Spectrometry Solutions
GC/MS SQ GC GC/MS/MS TQ LC/MS/MS TQ
LC/MS Ion Trap LC/MS
TOF/QTOF MALDI TOF
TOF/TOF FTMS ICP MS
Copyright 2012 Bruker Corporation. All Rights Reserved.
C h e m i c a l a n d A p p l i e d M a r k e t s
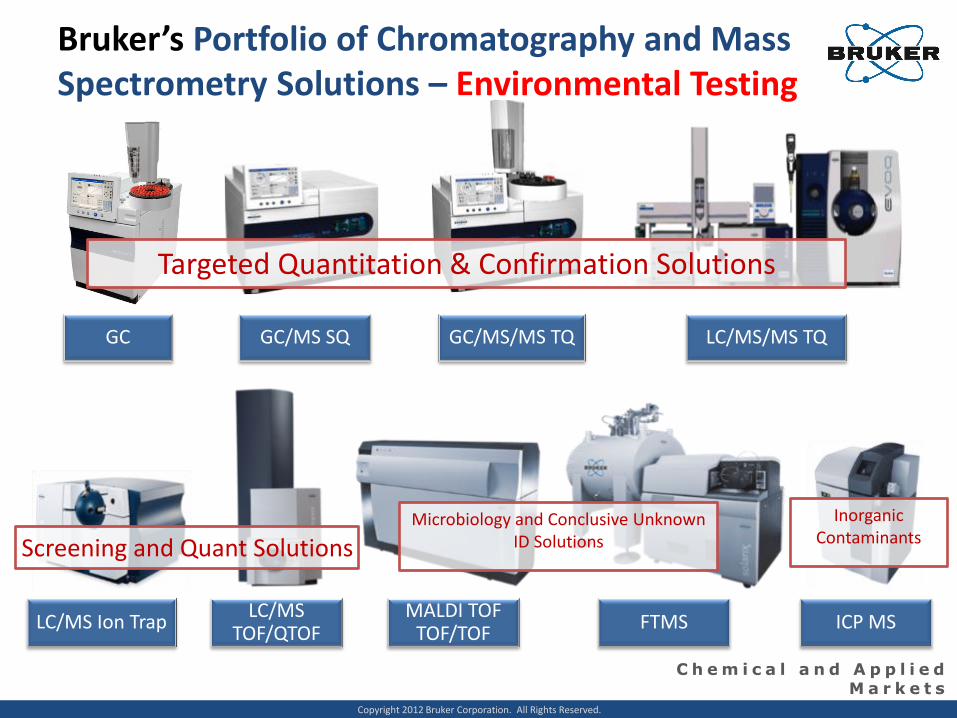
Bruker’s Portfolio of Chromatography and Mass Spectrometry Solutions – Environmental Testing
GC/MS SQ GC GC/MS/MS TQ LC/MS/MS TQ
LC/MS Ion Trap LC/MS
TOF/QTOF MALDI TOF
TOF/TOF FTMS ICP MS
Targeted Quantitation & Confirmation Solutions
Screening and Quant Solutions Microbiology and Conclusive Unknown
ID Solutions
Inorganic Contaminants

Copyright 2012 Bruker Corporation. All Rights Reserved.
C h e m i c a l a n d A p p l i e d M a r k e t s
Agenda
• The Process and Power of Multiple Reaction Monitoring (MRM)
• Key Applications for Tandem MS in Environmental Monitoring
• Pyrethroid Insecticides by EI and NCI with Tandem Mass Spectrometry
• PBDE Flame Retardants in Sewage and Ocean Sediments
• EPA Methods 8270 and 525: Raising Confidence in Results with MRM
• Analysis of PCPPs by LC/MS/MS
4

Copyright 2012 Bruker Corporation. All Rights Reserved.
C h e m i c a l a n d A p p l i e d M a r k e t s
Environmental Monitoring: The Instrument Challenge
• Performance - Must meet performance requirements
• Sensitivity to meet regulatory limits
• Reality: Labs want to exceed those requirements
• Reliability – Must be designed for Production Labs
• Data quality must be impeccable
• Consumer safety and profitability is at stake with every sample
• Robustness – Withstand the Abuse of complex samples
• QuEChERs/8270 sludge extracts
• Hundreds of samples before required maintenance
• Ion source in LC-MS and GC-MS require reduced maintenance

Copyright 2012 Bruker Corporation. All Rights Reserved.
C h e m i c a l a n d A p p l i e d M a r k e t s
Power of MRM in Environmental Matrices
(mainlib) Parathion
10 20 30 40 50 60 70 80 90 100 110 120 130 140 150 160 170 180 190 200 210 220 230 240 250 260 270 280 290 3000
50
100
15
29
3945
65
75
81
97109
125
139
150
155
172
186
201
218
235
246
263
275
291
N
O
OO
P
O
SO
Parathion-Ethyl
Precursor ion
m/z 291
MRM Transition
Product ion
m/z 109

Copyright 2012 Bruker Corporation. All Rights Reserved.
C h e m i c a l a n d A p p l i e d M a r k e t s
Q1
Q3
q2
291
291
Parathion
Matrix Interference
Isobaric Interferences: Parathion Example
109

Copyright 2012 Bruker Corporation. All Rights Reserved.
C h e m i c a l a n d A p p l i e d M a r k e t s
8 © Copyright 2011 Bruker Corporation. All Rights Reserved.
Demeton-S-methyl
Trifluralin
Diazinon
Heptachlor epoxide
Paclobutrazol
Endosulfan-sulfate
Iprodione Halfenprox
Full Scan Scan range: 80Da to 400Da
Pumpkin matrix with 1ppb pesticide spike
SIM @ 263 Da
? ? ?
Extracted @ 263 Da, search for halfenprox
MRM 263 > 235 Da
Copyright 2012 Bruker Corporation. All Rights Reserved.
C h e m i c a l a n d A p p l i e d M a r k e t s
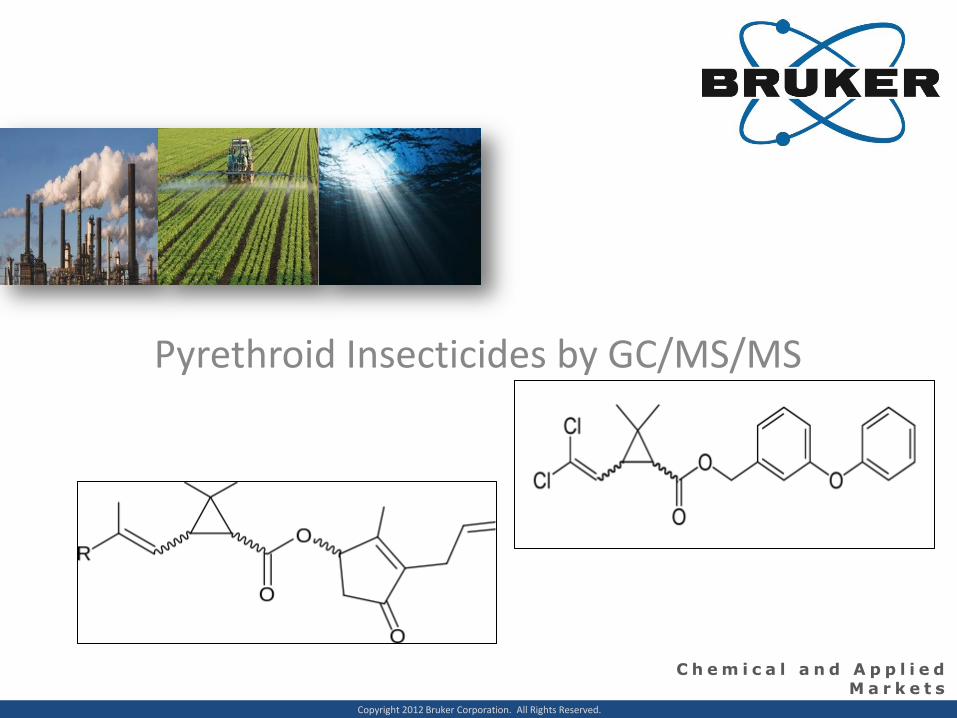
Pyrethroid Insecticides by GC/MS/MS

Copyright 2012 Bruker Corporation. All Rights Reserved.
C h e m i c a l a n d A p p l i e d M a r k e t s
Pyrethroid Facts • Pyrethroids are used in household
insecticides/repellents
• Are synthetic compounds based on structure of natural pyrethrins produced by the flowers of pyrethrums (Chrysanthemum cinerariaefolium and C. coccineum).
• Pyrethroids are toxic to fish and other aquatic organisms
• At extremely low levels, such as 2 parts per trillion, pyrethroids are lethal to mayflies, gadflies, and invertebrates that constitute the base of many aquatic and terrestrial food chains.
• Pyrethroids have been found to be unaffected by secondary treatment systems at municipal wastewater treatment facilities in California. They appear in the effluent, usually at levels lethal to invertebrates
• Therefore very low levels of detection are required in complex sediment and waste water effluent extracts
Copyright 2012 Bruker Corporation. All Rights Reserved.
C h e m i c a l a n d A p p l i e d M a r k e t s
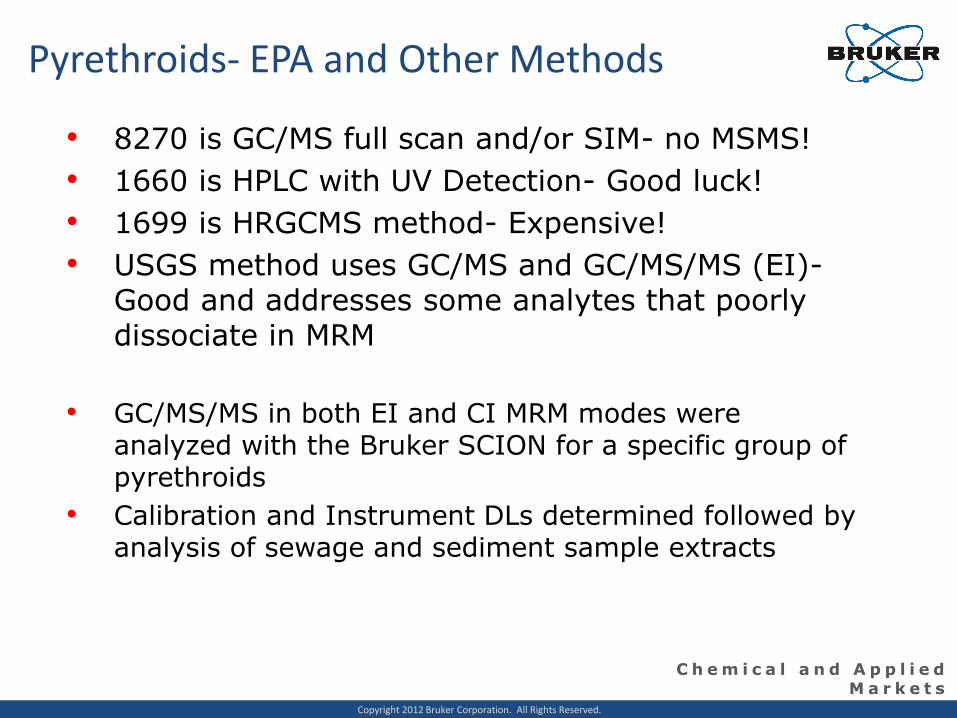
Pyrethroids- EPA and Other Methods
• 8270 is GC/MS full scan and/or SIM- no MSMS!
• 1660 is HPLC with UV Detection- Good luck!
• 1699 is HRGCMS method- Expensive!
• USGS method uses GC/MS and GC/MS/MS (EI)- Good and addresses some analytes that poorly dissociate in MRM
• GC/MS/MS in both EI and CI MRM modes were analyzed with the Bruker SCION for a specific group of pyrethroids
• Calibration and Instrument DLs determined followed by analysis of sewage and sediment sample extracts
Copyright 2012 Bruker Corporation. All Rights Reserved.
C h e m i c a l a n d A p p l i e d M a r k e t s
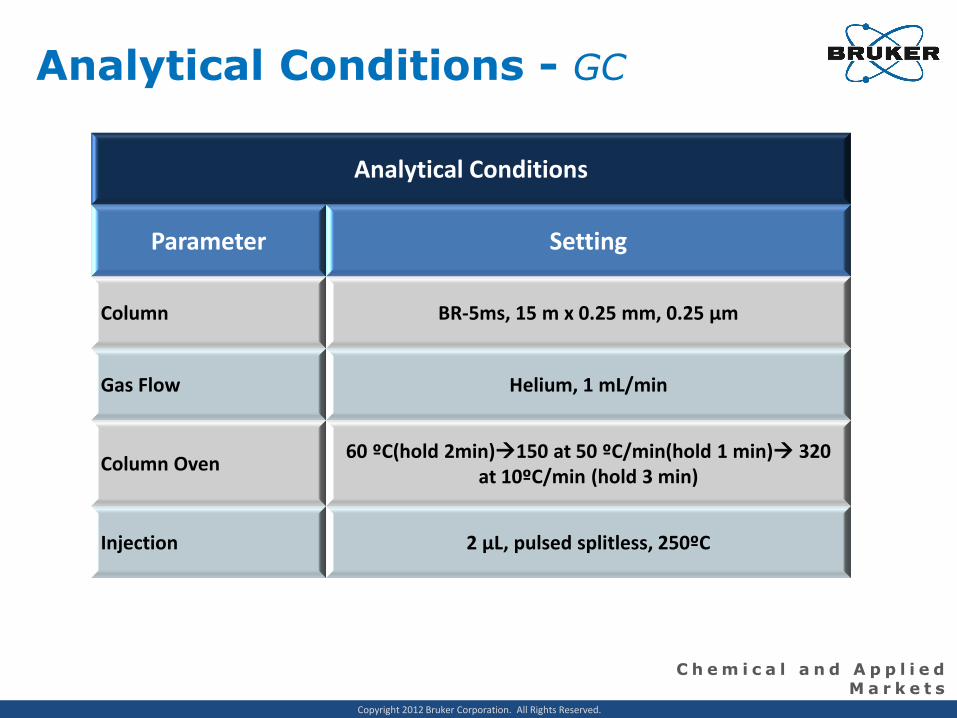
Analytical Conditions - GC
Analytical Conditions
Parameter Setting
Column BR-5ms, 15 m x 0.25 mm, 0.25 µm
Gas Flow Helium, 1 mL/min
Column Oven 60 ºC(hold 2min)150 at 50 ºC/min(hold 1 min) 320
at 10ºC/min (hold 3 min)
Injection 2 µL, pulsed splitless, 250ºC
Copyright 2012 Bruker Corporation. All Rights Reserved.
C h e m i c a l a n d A p p l i e d M a r k e t s
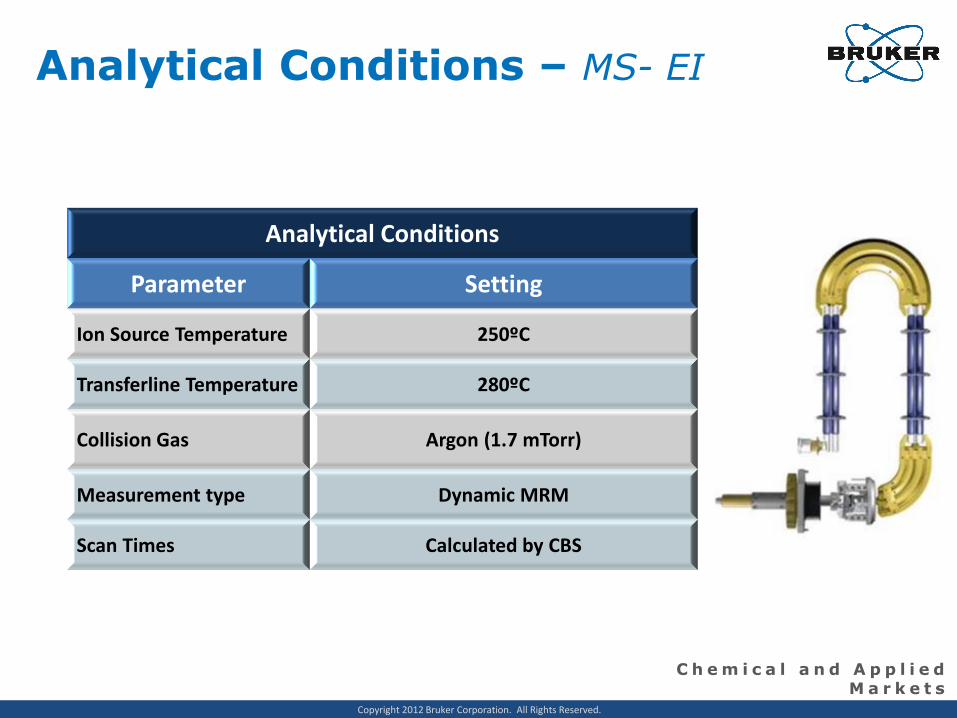
Analytical Conditions – MS- EI
Analytical Conditions
Parameter Setting
Ion Source Temperature 250ºC
Transferline Temperature 280ºC
Collision Gas Argon (1.7 mTorr)
Measurement type Dynamic MRM
Scan Times Calculated by CBS
Copyright 2012 Bruker Corporation. All Rights Reserved.
C h e m i c a l a n d A p p l i e d M a r k e t s
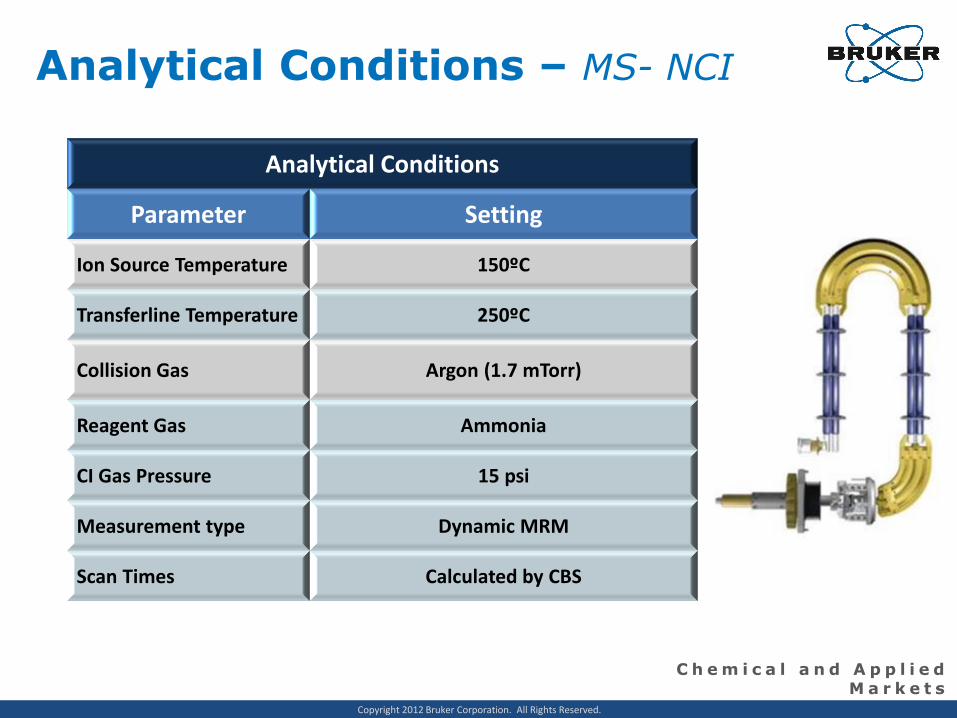
Analytical Conditions – MS- NCI
Analytical Conditions
Parameter Setting
Ion Source Temperature 150ºC
Transferline Temperature 250ºC
Collision Gas Argon (1.7 mTorr)
Reagent Gas Ammonia
CI Gas Pressure 15 psi
Measurement type Dynamic MRM
Scan Times Calculated by CBS

Copyright 2012 Bruker Corporation. All Rights Reserved.
C h e m i c a l a n d A p p l i e d M a r k e t s
EI MRM Transitions Compound Name Q1
Mass Q3 Mass
Collision Energy
trans-Permethrin 183 128 -20
trans-Permethrin 183 152 -20
trans-Permethrin 183 168 -18
Prallethrin 123 81 -15
Prallethrin 123 79 -15
Fipronil Sulfide 351 255 -20
Esfenvalerate-B 225 91 -25
Esfenvalerate-B 225 119 -18
Esfenvalerate-B 225 147 -10
Allethrin 123 81 -15
Allethrin 123 95 -10
Fipronil-sulfone 383 255 -20
Fipronil-sulfone 383 335 -10
Danitol 181 152 -25
Danitol 181 127 -30
Bifenthrin 181 115 -40
Bifenthrin 181 165 -18
Bifenthrin 181 166 -10
Cyfluthrin isomers 206 151 -15
Cyfluthrin isomers 206 179 -20
Cyfluthrin isomers 226 206 -10
Cypermethrin isomers
181 127 -30
Cypermethrin isomers
181 152 -20
Deltamethrin 253 172 -10
Deltamethrin 253 199 -25
Deltamethrin 253 174 -10
Esfenvalerate-A 225 91 -25
Esfenvalerate-A 225 119 -18
Esfenvalerate-A 225 147 -10
Fipronil 367 178 -40
Fipronil 367 213 -30
Fipronil 367 255 -15
cis-Permethrin 183 128 -20
cis-Permethrin 183 152 -20
cis-Permethrin 183 168 -18
Piperonylbutoxide 176 131 -10
Piperonylbutoxide 176 117 -18
Piperonylbutoxide 176 103 -25
Cyhalothrin 208 181 -10
Cyhalothrin 181 152 -20

Copyright 2012 Bruker Corporation. All Rights Reserved.
C h e m i c a l a n d A p p l i e d M a r k e t s
NCI MRM Transitions
Compound Name Q1 Mass Q3 Mass Collision Energy
cis-Permethrin 207.2 35.3 10
cis-Permethrin 209.2 37.2 10
trans-Permethrin 207.2 35.2 10
trans-Permethrin 209.2 37.2 10
Fipronyl sulfide 384 314.9 20
Fipronyl sulfide 384 248 25
Fipronyl sulfide 384 244 25
Esfenvalerate-B 211.2 35.2 20
Esfenvalerate-B 211.2 167.2 10
Fipronyl sulfone 415.9 282.9 25
Fipronyl sulfone 415.9 243.9 30
Bifenthrin 386 205 5
Bifenthrin 386 161 15
Cypermethrin isomers 207.2 35.2 20
Cypermethrin isomers 171.2 35.2 20
Deltamethrin 296.9 79 2
Deltamethrin 296.9 81 2
Deltamethrin 81.4 81.4 1
Deltamethrin 79.4 79.4 1
Allethrin 167.4 167.4 1
Danitol 141.4 141.4 1
Cyfluthrin isomers 207.2 35.2 20
Cyfluthrin isomers 171.2 35.2 20
Esfenvalerate-A 211.2 167.2 10
Esfenvalerate-A 211.2 35.2 20
Pallethrin 167.4 167.4 1

Copyright 2012 Bruker Corporation. All Rights Reserved.
C h e m i c a l a n d A p p l i e d M a r k e t s
Good Isomer Separation on 15 M column
EI
CI
Copyright 2012 Bruker Corporation. All Rights Reserved.
C h e m i c a l a n d A p p l i e d M a r k e t s
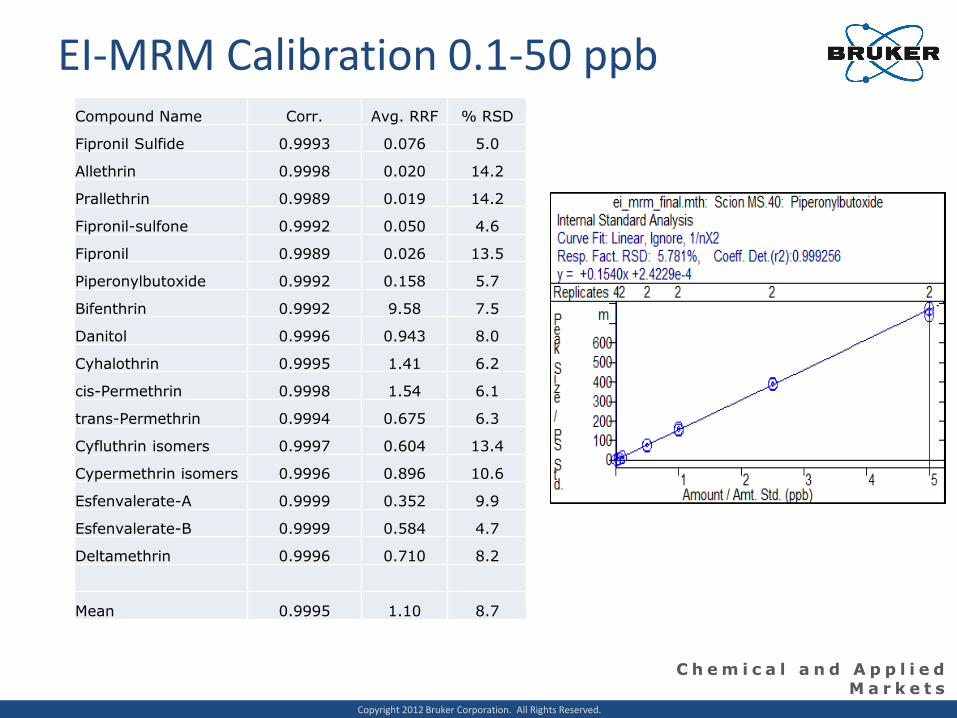
EI-MRM Calibration 0.1-50 ppb Compound Name Corr. Avg. RRF % RSD
Fipronil Sulfide 0.9993 0.076 5.0
Allethrin 0.9998 0.020 14.2
Prallethrin 0.9989 0.019 14.2
Fipronil-sulfone 0.9992 0.050 4.6
Fipronil 0.9989 0.026 13.5
Piperonylbutoxide 0.9992 0.158 5.7
Bifenthrin 0.9992 9.58 7.5
Danitol 0.9996 0.943 8.0
Cyhalothrin 0.9995 1.41 6.2
cis-Permethrin 0.9998 1.54 6.1
trans-Permethrin 0.9994 0.675 6.3
Cyfluthrin isomers 0.9997 0.604 13.4
Cypermethrin isomers 0.9996 0.896 10.6
Esfenvalerate-A 0.9999 0.352 9.9
Esfenvalerate-B 0.9999 0.584 4.7
Deltamethrin 0.9996 0.710 8.2
Mean 0.9995 1.10 8.7

Copyright 2012 Bruker Corporation. All Rights Reserved.
C h e m i c a l a n d A p p l i e d M a r k e t s
EI-MRM IDLs
Parameter Rep 1 Rep 2 Rep 3 Rep 4 Rep 5 Rep 6 Rep 7 mean sd Calculated
IDL Target
concentration % RSD
Fipronil Sulfide 0.078 0.08 0.077 0.074 0.075 0.075 0.076 0.076429 0.00207 0.01 0.1 2.7
Allethrin 0.525 0.574 0.576 0.584 0.608 0.565 0.498 0.561429 0.03744 0.12 0.5 6.7
Prallethrin 0.953 1.018 1.084 1.077 0.93 1.011 1.127 1.028571 0.07183 0.23 1 7.0
Fipronil-sulfone 0.098 0.088 0.074 0.107 0.091 0.089 0.074 0.088714 0.01197 0.03 0.1 13.5
Fipronil 0.514 0.524 0.499 0.551 0.501 0.486 0.449 0.503429 0.03186 0.10 0.5 6.3
Piperonylbutoxide 0.092 0.09 0.094 0.083 0.097 0.094 0.081 0.090143 0.00598 0.02 0.1 6.6
Bifenthrin 0.087 0.09 0.081 0.094 0.084 0.075 0.096 0.086714 0.00739 0.02 0.1 8.5
Danitol 0.075 0.083 0.099 0.091 0.081 0.069 0.085 0.083286 0.00989 0.03 0.1 11.9
Cyhalothrin 0.1 0.091 0.1 0.081 0.09 0.08 0.115 0.093857 0.01227 0.04 0.1 13.1
cis-Permethrin 0.081 0.091 0.1 0.071 0.084 0.074 0.121 0.088857 0.01726 0.05 0.1 19.4
trans-Permethrin 0.519 0.662 0.413 0.555 0.503 0.649 0.492 0.541857 0.0887 0.28 0.5 16.4
Cyfluthrin isomers 1.078 1.101 1.183 1.178 1.222 1.314 1.302 1.196857 0.09062 0.28 1 7.6
Cypermethrin isomers 0.524 0.552 0.553 0.476 0.553 0.481 0.406 0.506429 0.05535 0.17 0.5 10.9
Esfenvalerate-A 0.459 0.593 0.528 0.455 0.622 0.565 0.426 0.521143 0.07593 0.24 0.5 14.6
Esfenvalerate-B 0.101 0.1 0.108 0.1 0.083 0.066 0.123 0.097286 0.0182 0.06 0.1 18.7
Deltamethrin 0.489 0.525 0.556 0.482 0.503 0.548 0.491 0.513429 0.02983 0.09 0.5 5.8
Mean 0.11 10.6

Copyright 2012 Bruker Corporation. All Rights Reserved.
C h e m i c a l a n d A p p l i e d M a r k e t s
NCI-MRM Calibration 0.1-50 ppb
Compound Name Corr. Avg. RRF % RSD
Fipronyl sulfide 0.9987 54.5 14.1
Allethrin 0.9983 12.7 11.2
Pallethrin 0.9988 8.38 8.0
Fipronyl sulfone 0.9995 2.86 5.3
Fipronil 0.9982 4.83 17.2
Bifenthrin 0.9963 14.1 12.5
Danitol 0.9991 17.0 9.3
Cyhalothrin 0.9997 0.12 2.3
cis-Permethrin 0.9994 0.12 11.0
trans-Permethrin 0.9990 0.01 9.6
Cyfluthrin isomers 0.9988 0.10 11.2
Cypermethrin isomers 0.9991 0.08 6.5
Esfenvalerate-A 0.9997 2.08 7.4
Esfenvalerate-B 0.9997 3.34 9.5
Deltamethrin 0.9997 7.01 11.9
Average 0.9989 8.49 9.8

Copyright 2012 Bruker Corporation. All Rights Reserved.
C h e m i c a l a n d A p p l i e d M a r k e t s
NCI-MRM Low Calibration 1-5000 ppt
Compound Name Corr. Avg. Resp % RSD
Fipronyl sulfide 0.9995 2202 18.8
Fipronyl sulfone 0.9997 139 27.2
Bifenthrin 0.9998 590 14.7
Danitol 0.9998 801 21.9
Esfenvalerate-A 0.9998 1166 8.0
Esfenvalerate-B 0.9995 1993 18.6
Deltamethrin 0.9985 4881 17.9
Average 0.9995 1682 18.1

Copyright 2012 Bruker Corporation. All Rights Reserved.
C h e m i c a l a n d A p p l i e d M a r k e t s
NCI-MRM IDLs
Parameter Rep 1 Rep 2 Rep 3 Rep 4 Rep 5 Rep 6 Rep 7 mean sd Calculated
IDL Target
concentration % RSD
Fipronil Sulfide 0.112 0.106 0.112 0.112 0.106 0.102 0.108 0.11 0.0039 0.01 0.1 3.6
Allethrin 0.104 0.123 0.116 0.115 0.111 0.102 0.116 0.11 0.00737 0.02 0.1 6.6
Prallethrin 0.082 0.092 0.092 0.097 0.094 0.084 0.092 0.09 0.00541 0.02 0.1 6.0
Fipronil-sulfone 0.105 0.101 0.104 0.107 0.098 0.096 0.103 0.10 0.00392 0.01 0.1 3.8
Bifenthrin 0.113 0.11 0.116 0.114 0.107 0.1 0.11 0.11 0.00532 0.02 0.1 4.8
Danitol 0.113 0.102 0.111 0.112 0.108 0.106 0.119 0.11 0.00546 0.02 0.1 5.0
Cyhalothrin 0.106 0.106 0.109 0.095 0.091 0.088 0.112 0.10 0.00949 0.03 0.1 9.4
cis-Permethrin 0.127 0.119 0.126 0.124 0.118 0.108 0.128 0.12 0.00707 0.02 0.1 5.8
trans-Permethrin 0.437 0.618 0.654 0.58 0.588 0.757 0.608 0.61 0.09558 0.30 0.5 15.8
Cyfluthrin isomers 0.144 0.133 0.155 0.141 0.14 0.129 0.136 0.14 0.00844 0.03 0.1 6.0
Cypermethrin isomers 0.101 0.087 0.096 0.108 0.099 0.09 0.092 0.10 0.0072 0.02 0.1 7.5
Esfenvalerate-A 0.11 0.105 0.111 0.106 0.103 0.098 0.107 0.11 0.00439 0.01 0.1 4.1
Esfenvalerate-B 0.111 0.109 0.114 0.111 0.106 0.1 0.108 0.11 0.0045 0.01 0.1 4.2
Deltamethrin 0.105 0.103 0.098 0.098 0.094 0.109 0.103 0.10 0.00506 0.02 0.1 5.0
Fipronil 0.103 0.098 0.102 0.104 0.098 0.104 0.109 0.10 0.00382 0.01 0.1 3.7
Mean 0.04 6.1
Copyright 2012 Bruker Corporation. All Rights Reserved.
C h e m i c a l a n d A p p l i e d M a r k e t s
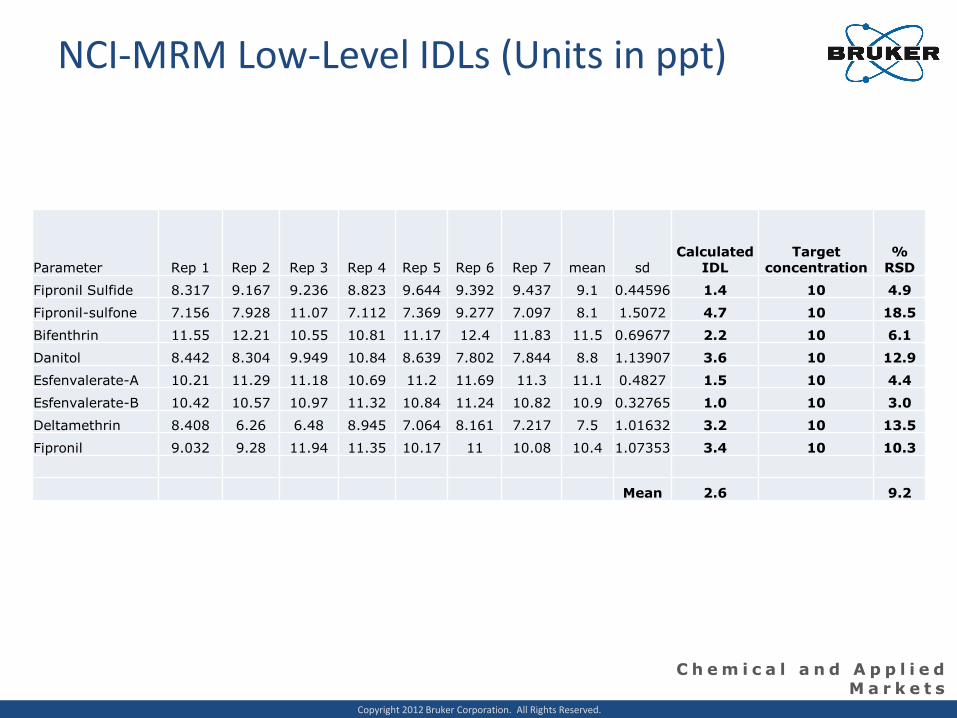
NCI-MRM Low-Level IDLs (Units in ppt)
Parameter Rep 1 Rep 2 Rep 3 Rep 4 Rep 5 Rep 6 Rep 7 mean sd Calculated
IDL Target
concentration %
RSD
Fipronil Sulfide 8.317 9.167 9.236 8.823 9.644 9.392 9.437 9.1 0.44596 1.4 10 4.9
Fipronil-sulfone 7.156 7.928 11.07 7.112 7.369 9.277 7.097 8.1 1.5072 4.7 10 18.5
Bifenthrin 11.55 12.21 10.55 10.81 11.17 12.4 11.83 11.5 0.69677 2.2 10 6.1
Danitol 8.442 8.304 9.949 10.84 8.639 7.802 7.844 8.8 1.13907 3.6 10 12.9
Esfenvalerate-A 10.21 11.29 11.18 10.69 11.2 11.69 11.3 11.1 0.4827 1.5 10 4.4
Esfenvalerate-B 10.42 10.57 10.97 11.32 10.84 11.24 10.82 10.9 0.32765 1.0 10 3.0
Deltamethrin 8.408 6.26 6.48 8.945 7.064 8.161 7.217 7.5 1.01632 3.2 10 13.5
Fipronil 9.032 9.28 11.94 11.35 10.17 11 10.08 10.4 1.07353 3.4 10 10.3
Mean 2.6 9.2

Copyright 2012 Bruker Corporation. All Rights Reserved.
C h e m i c a l a n d A p p l i e d M a r k e t s
NCI Sensitivity Excellent for Select Cmpds
1 ppt Fipronyl Sulfide 10 ppt Bifenthrin

Copyright 2012 Bruker Corporation. All Rights Reserved.
C h e m i c a l a n d A p p l i e d M a r k e t s
NCI-MRM: Excellent vs. Matrix
Ocean Sediment Spike
Sewage Effluent Spike
Cal Standard

Copyright 2012 Bruker Corporation. All Rights Reserved.
C h e m i c a l a n d A p p l i e d M a r k e t s
EI-MRM: Matrix effects results
Ocean Sediment
Sewage Effluent
Cal Standard

Copyright 2012 Bruker Corporation. All Rights Reserved.
C h e m i c a l a n d A p p l i e d M a r k e t s
EI-MRM: Matrix Closer Look
Ocean Sediment
Ocean Sediment
Sewage
Sewage
Cal standard
Cal standard
Copyright 2012 Bruker Corporation. All Rights Reserved.
C h e m i c a l a n d A p p l i e d M a r k e t s
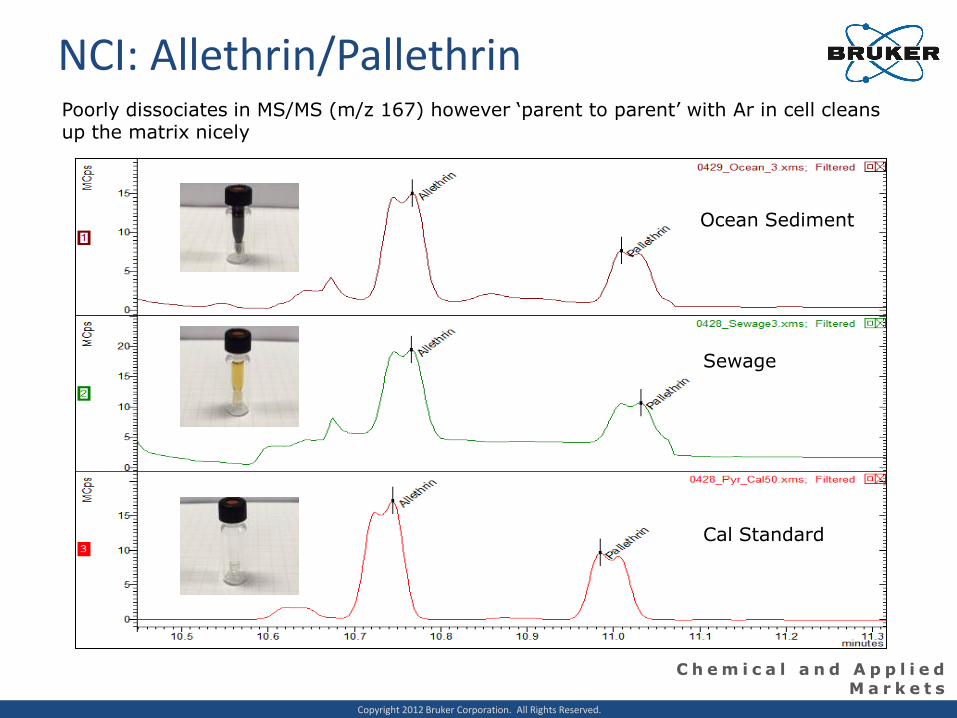
NCI: Allethrin/Pallethrin
Ocean Sediment
Sewage
Cal Standard
Poorly dissociates in MS/MS (m/z 167) however ‘parent to parent’ with Ar in cell cleans up the matrix nicely

Copyright 2012 Bruker Corporation. All Rights Reserved.
C h e m i c a l a n d A p p l i e d M a r k e t s
EI-MRM: Allethrin/Pallethrin Extreme matrix interference at MRM transitions studied!
Ocean Sediment
Sewage
Cal Std
Copyright 2012 Bruker Corporation. All Rights Reserved.
C h e m i c a l a n d A p p l i e d M a r k e t s
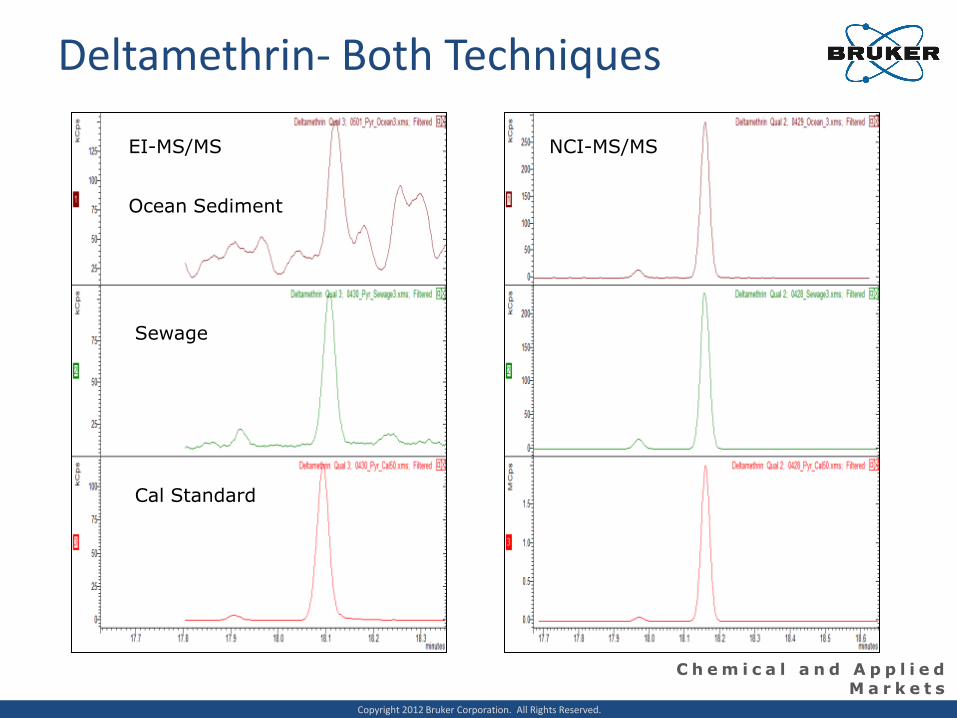
Deltamethrin- Both Techniques
EI-MS/MS NCI-MS/MS
Ocean Sediment
Sewage
Cal Standard

Copyright 2012 Bruker Corporation. All Rights Reserved.
C h e m i c a l a n d A p p l i e d M a r k e t s
Pyrethroid Analysis- Lessons Learned
• MS/MS will provide good confidence in your data, at extreme low levels, however…. • Consider your test matrix and added discrimination
using NCI, especially approaching sub ppb levels and very dirty extracts
• Poorly dissociated cmpds can still benefit ‘parent-to-parent ‘ transitions vs. SIM alone!
• Not all cmpds will work well by NCI, look at structure and optimize conditions
• Watch out for ‘matrix enhanced chromatographic response’ high bias NOT due to detection technique but rather matrix shielding of active sites in injection and chromatographic pathway

Copyright 2012 Bruker Corporation. All Rights Reserved.
C h e m i c a l a n d A p p l i e d M a r k e t s
Brominated Flame Retardants by GC/MS/MS
Copyright 2012 Bruker Corporation. All Rights Reserved.
C h e m i c a l a n d A p p l i e d M a r k e t s
PBDE Facts
• Used as flame retardants in a variety of products
• Tend to bio-accumulate in tissues, breast milk
• Shown to be related to increased infertility rates in humans at levels that are normally found in US households
• Studies in Canada have found significant concentrations of PBDEs in common foods such as salmon, ground beef, butter, and cheese
• PBDEs have also been found at high levels in indoor dust, sewage sludge, and effluents from wastewater treatment plants. Increasing PBDE levels have been detected in the blood of marine mammals such as harbor seals.

Copyright 2012 Bruker Corporation. All Rights Reserved.
C h e m i c a l a n d A p p l i e d M a r k e t s
PBDEs- Method Considerations
• EPA 1614A is HRGCMS- Expensive!
• EPA 8081 is GC with ECD Detection- Background!
• EPA 527 is GCMS method- No MSMS!
• USGS method uses GC/MS and GC/MS/MS (EI)
• GC/MS/MS in EI MRM mode was analyzed with the Bruker SCION for a specific group of PBDEs
• Calibration and Instrument DLs determined followed by analysis of sewage and sediment sample extracts

Copyright 2012 Bruker Corporation. All Rights Reserved.
C h e m i c a l a n d A p p l i e d M a r k e t s
Analytical Conditions - GC
Analytical Conditions
Parameter Setting
Column BR-5ms, 15 m x 0.25 mm, 0.25 µm
Gas Flow Helium, 1 mL/min
Column Oven 60 ºC(hold 2min)150 at 50 ºC/min(hold 1 min) 325
at 10ºC/min (hold 8 min)
Injection 2 µL, pulsed splitless, 290ºC

Copyright 2012 Bruker Corporation. All Rights Reserved.
C h e m i c a l a n d A p p l i e d M a r k e t s
Analytical Conditions – MS- EI
Analytical Conditions
Parameter Setting
Ion Source Temperature 250ºC
Transferline Temperature 280ºC
Collision Gas Argon (1.7 mTorr)
Measurement type Dynamic MRM
Scan Times Calculated by CBS
Copyright 2012 Bruker Corporation. All Rights Reserved.
C h e m i c a l a n d A p p l i e d M a r k e t s
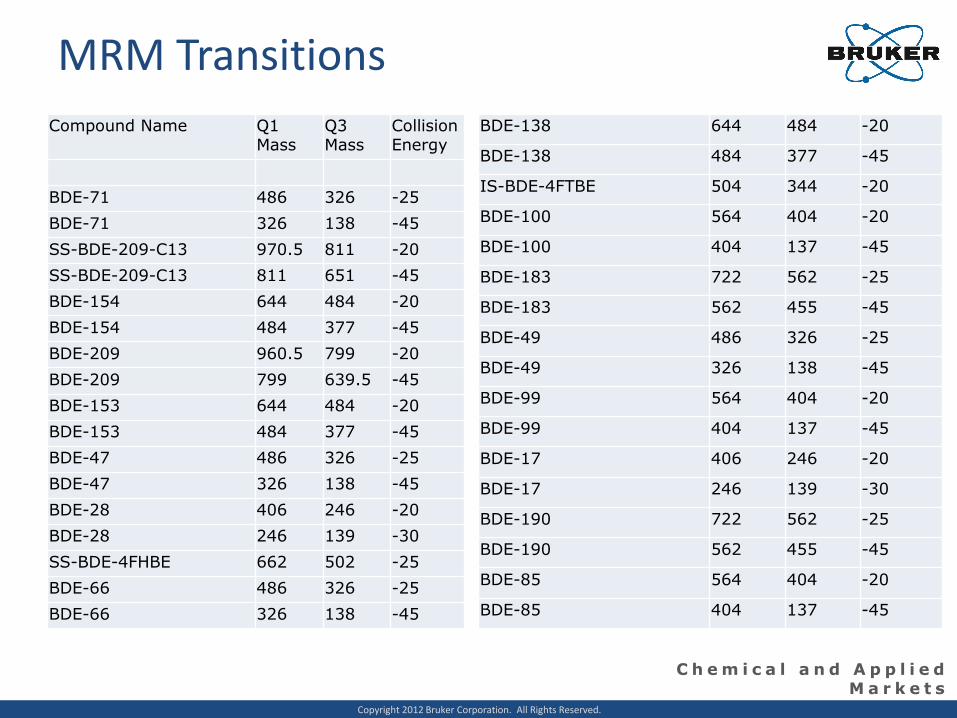
MRM Transitions
Compound Name Q1 Mass
Q3 Mass
Collision Energy
BDE-71 486 326 -25
BDE-71 326 138 -45
SS-BDE-209-C13 970.5 811 -20
SS-BDE-209-C13 811 651 -45
BDE-154 644 484 -20
BDE-154 484 377 -45
BDE-209 960.5 799 -20
BDE-209 799 639.5 -45
BDE-153 644 484 -20
BDE-153 484 377 -45
BDE-47 486 326 -25
BDE-47 326 138 -45
BDE-28 406 246 -20
BDE-28 246 139 -30
SS-BDE-4FHBE 662 502 -25
BDE-66 486 326 -25
BDE-66 326 138 -45
BDE-138 644 484 -20
BDE-138 484 377 -45
IS-BDE-4FTBE 504 344 -20
BDE-100 564 404 -20
BDE-100 404 137 -45
BDE-183 722 562 -25
BDE-183 562 455 -45
BDE-49 486 326 -25
BDE-49 326 138 -45
BDE-99 564 404 -20
BDE-99 404 137 -45
BDE-17 406 246 -20
BDE-17 246 139 -30
BDE-190 722 562 -25
BDE-190 562 455 -45
BDE-85 564 404 -20
BDE-85 404 137 -45

Copyright 2012 Bruker Corporation. All Rights Reserved.
C h e m i c a l a n d A p p l i e d M a r k e t s
TIC MRM Chromatogram- 50 ppb std

Copyright 2012 Bruker Corporation. All Rights Reserved.
C h e m i c a l a n d A p p l i e d M a r k e t s
MRM Calibration 0.1-50 ppb Compound Name Corr. Avg. RRF % RSD
BDE-17 0.9997 2.04 6.7
BDE-28 0.9986 5.26 5.0
BDE-49 0.9990 2.64 8.7
BDE-71 0.9985 2.70 8.0
BDE-47 0.9989 2.48 5.6
BDE-66 0.9988 1.86 6.3
BDE-100 0.9988 1.00 4.9
BDE-99 0.9989 0.87 8.0
BDE-85 0.9960 0.72 6.4
BDE-154 0.9990 0.55 7.8
BDE-153 0.9985 0.40 5.8
SS-BDE-4FHBE 0.9977 0.21 11.0
BDE-138 0.9985 0.39 8.7
BDE-183 0.9983 0.31 17.2
BDE-190 0.9965 0.28 15.0
SS-BDE-209-C13 0.9981 0.07 17.5
BDE-209 0.9989 0.08 11.2
Mean 0.9984 1.29 9.1
Copyright 2012 Bruker Corporation. All Rights Reserved.
C h e m i c a l a n d A p p l i e d M a r k e t s
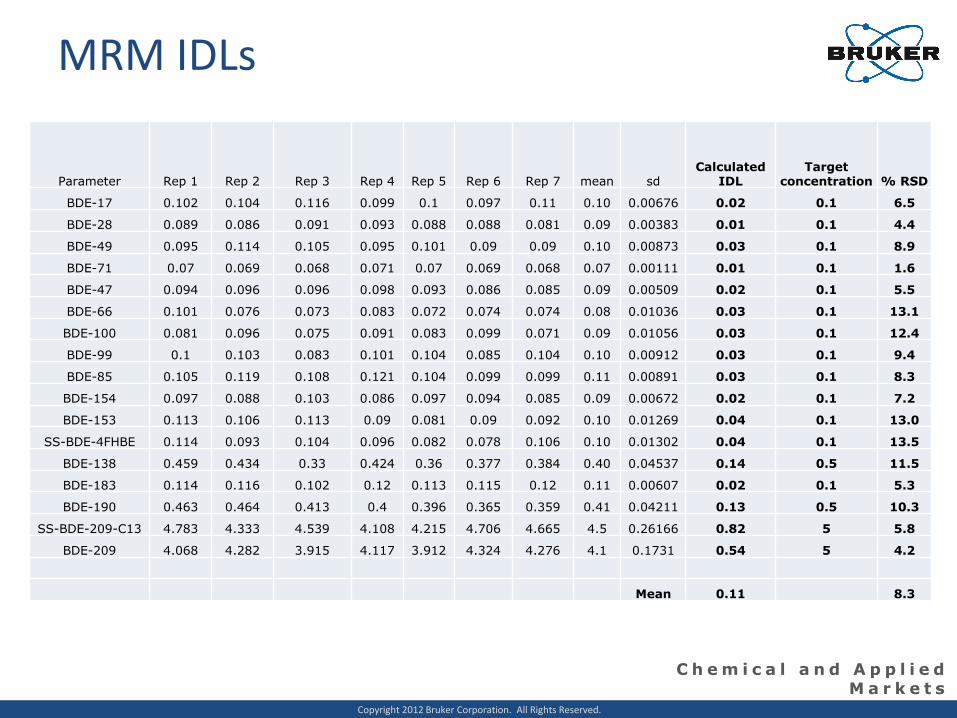
MRM IDLs
Parameter Rep 1 Rep 2 Rep 3 Rep 4 Rep 5 Rep 6 Rep 7 mean sd Calculated
IDL Target
concentration % RSD
BDE-17 0.102 0.104 0.116 0.099 0.1 0.097 0.11 0.10 0.00676 0.02 0.1 6.5
BDE-28 0.089 0.086 0.091 0.093 0.088 0.088 0.081 0.09 0.00383 0.01 0.1 4.4
BDE-49 0.095 0.114 0.105 0.095 0.101 0.09 0.09 0.10 0.00873 0.03 0.1 8.9
BDE-71 0.07 0.069 0.068 0.071 0.07 0.069 0.068 0.07 0.00111 0.01 0.1 1.6
BDE-47 0.094 0.096 0.096 0.098 0.093 0.086 0.085 0.09 0.00509 0.02 0.1 5.5
BDE-66 0.101 0.076 0.073 0.083 0.072 0.074 0.074 0.08 0.01036 0.03 0.1 13.1
BDE-100 0.081 0.096 0.075 0.091 0.083 0.099 0.071 0.09 0.01056 0.03 0.1 12.4
BDE-99 0.1 0.103 0.083 0.101 0.104 0.085 0.104 0.10 0.00912 0.03 0.1 9.4
BDE-85 0.105 0.119 0.108 0.121 0.104 0.099 0.099 0.11 0.00891 0.03 0.1 8.3
BDE-154 0.097 0.088 0.103 0.086 0.097 0.094 0.085 0.09 0.00672 0.02 0.1 7.2
BDE-153 0.113 0.106 0.113 0.09 0.081 0.09 0.092 0.10 0.01269 0.04 0.1 13.0
SS-BDE-4FHBE 0.114 0.093 0.104 0.096 0.082 0.078 0.106 0.10 0.01302 0.04 0.1 13.5
BDE-138 0.459 0.434 0.33 0.424 0.36 0.377 0.384 0.40 0.04537 0.14 0.5 11.5
BDE-183 0.114 0.116 0.102 0.12 0.113 0.115 0.12 0.11 0.00607 0.02 0.1 5.3
BDE-190 0.463 0.464 0.413 0.4 0.396 0.365 0.359 0.41 0.04211 0.13 0.5 10.3
SS-BDE-209-C13 4.783 4.333 4.539 4.108 4.215 4.706 4.665 4.5 0.26166 0.82 5 5.8
BDE-209 4.068 4.282 3.915 4.117 3.912 4.324 4.276 4.1 0.1731 0.54 5 4.2
Mean 0.11 8.3

Copyright 2012 Bruker Corporation. All Rights Reserved.
C h e m i c a l a n d A p p l i e d M a r k e t s
TIC MRM in Matrix-1
Ocean Sediment
Sewage extract
CAL Standard

Copyright 2012 Bruker Corporation. All Rights Reserved.
C h e m i c a l a n d A p p l i e d M a r k e t s
TIC MRM in Matrix-2
Ocean Sediment
CAL Standard
Sewage Extract
Copyright 2012 Bruker Corporation. All Rights Reserved.
C h e m i c a l a n d A p p l i e d M a r k e t s
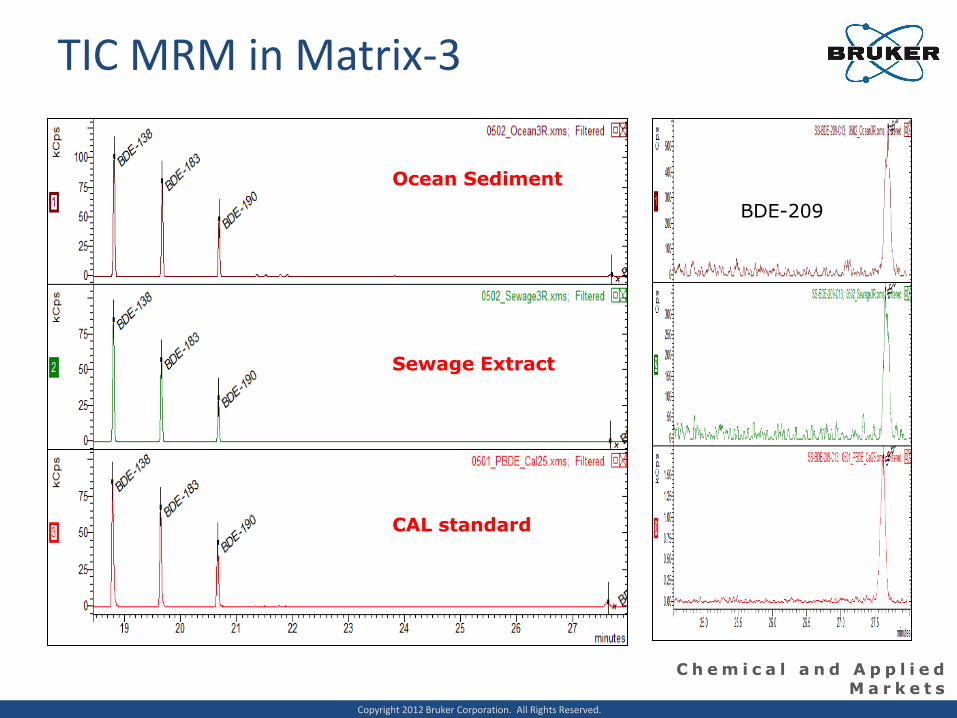
TIC MRM in Matrix-3
Ocean Sediment
Sewage Extract
CAL standard
BDE-209

Copyright 2012 Bruker Corporation. All Rights Reserved.
C h e m i c a l a n d A p p l i e d M a r k e t s
PBDE Analysis by GC/MS/MS
• MS/MS provides excellent discrimination against the matrices studied to provide good confidence in your data
• Be aware however of ‘matrix enhanced chromatographic response’
• BDE-209 sensitivity can be improved with thinner phase and even shorter column to reduce elution temperature by minimizing thermal degradation

Copyright 2012 Bruker Corporation. All Rights Reserved.
C h e m i c a l a n d A p p l i e d M a r k e t s
EPA Methods 8270 and 525: Raising Confidence in Results with Tandem Mass Spectrometry
Copyright 2012 Bruker Corporation. All Rights Reserved.
C h e m i c a l a n d A p p l i e d M a r k e t s
Method 8270: Want Lower Detection Levels?
• Method is for a wide variety of compounds in complex matrices
• Contractors and labs may want lower reporting limits than method was validated for
• Labs can use SIM, but what if isobaric interferences in heavy matrix?
• MS/MS can give added specificity and confidence in results at low levels of detection

Copyright 2012 Bruker Corporation. All Rights Reserved.
C h e m i c a l a n d A p p l i e d M a r k e t s
8270 Test Sludge Extract
PCP injection 1
PCP injection after 35
Left- Blank Extract; Right-Sludge Extract
Copyright 2012 Bruker Corporation. All Rights Reserved.
C h e m i c a l a n d A p p l i e d M a r k e t s
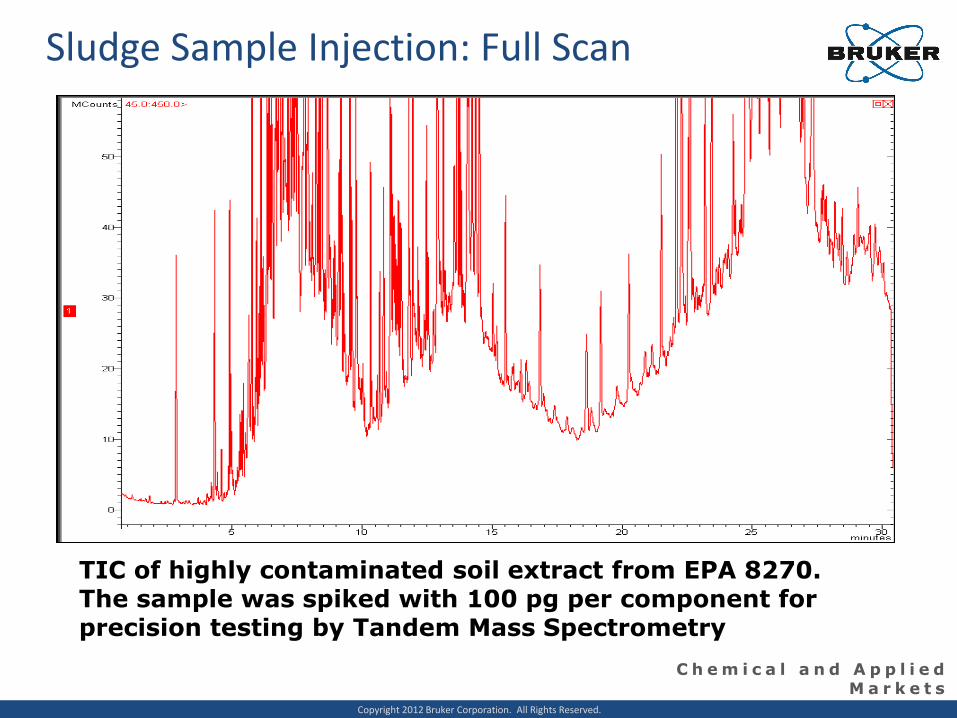
Sludge Sample Injection: Full Scan
TIC of highly contaminated soil extract from EPA 8270. The sample was spiked with 100 pg per component for precision testing by Tandem Mass Spectrometry

Copyright 2012 Bruker Corporation. All Rights Reserved.
C h e m i c a l a n d A p p l i e d M a r k e t s
MS/MS to Find Needles in the Haystack
MS/MS on SCION in soil extract, 15-20 pg injected on column – pulsed-split injection
MS/MS on same Extract Previous Slide

Copyright 2012 Bruker Corporation. All Rights Reserved.
C h e m i c a l a n d A p p l i e d M a r k e t s
Method Precision Examples: 100 Injections at 100 ppb in Sludge Extract
1-Chloronaphthalene
%RSD = 5.7%
0
10000
20000
30000
40000
50000
60000
70000
0 20 40 60 80 100 120
Injection Number
Raw
Peak A
rea
Series1
2,4-Dichlorophenol
%RSD = 4.7%
0
1000
2000
3000
4000
5000
6000
7000
8000
9000
10000
0 20 40 60 80 100 120
Injection Number
Raw
Peak A
rea
Series1
4-Bromophenoxy Ether
%RSD = 6.6%
0
2000
4000
6000
8000
10000
12000
14000
16000
18000
20000
0 20 40 60 80 100 120
Injection Number
Raw
Peak A
rea
Series1

Copyright 2012 Bruker Corporation. All Rights Reserved.
C h e m i c a l a n d A p p l i e d M a r k e t s
Method 525: Drinking Water (DW) Method
• Method covers wide variety of pesticides and industrial pollutants
• Current version written as Full Scan with SIM target analytes for lower reporting limits
• Method applies to finished DW; however, often used to test source waters as in past method version (525.2) (ie. Surface and Ground Waters)
• Method concentrates analytes (and matrix) by SPE and inject 1-2 uL into GC/MS
• MS/MS can give better specificity and confidence in results at low levels of detection

Copyright 2012 Bruker Corporation. All Rights Reserved.
C h e m i c a l a n d A p p l i e d M a r k e t s
Tandem MS and SIM in STD Look the Same…
B
A
TIC of over one hundred compounds in EPA 525.2 in MS/MS (A) and SIM (B) acquisition modes at concentration of 500 ng/mL in a pure solvent.

Copyright 2012 Bruker Corporation. All Rights Reserved.
C h e m i c a l a n d A p p l i e d M a r k e t s
But in Surface Water Extracts…
Actual surface water source sample submitted for Method 525 analysis. Many water treatment plants are required to monitor source waters for regulated and unregulated contaminants.
FULL SCAN

Copyright 2012 Bruker Corporation. All Rights Reserved.
C h e m i c a l a n d A p p l i e d M a r k e t s
Chromatograms Showing d-BHC in Surface Water Extract
MRM mode in solvent
MRM mode In matrix
SIM mode in solvent
SIM mode in matrix

Copyright 2012 Bruker Corporation. All Rights Reserved.
C h e m i c a l a n d A p p l i e d M a r k e t s
Chromatograms Showing Triademefon in Surface Water Extract
SIM mode in solvent
MRM mode in solvent
SIM mode in matrix
MRM mode In matrix
Copyright 2012 Bruker Corporation. All Rights Reserved.
C h e m i c a l a n d A p p l i e d M a r k e t s
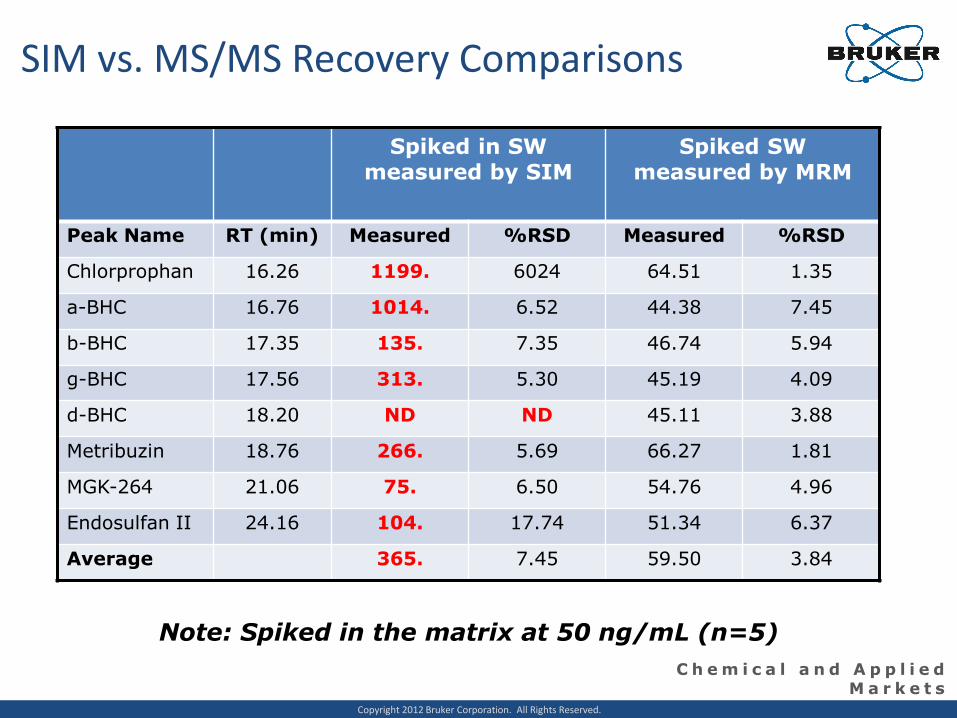
SIM vs. MS/MS Recovery Comparisons
Note: Spiked in the matrix at 50 ng/mL (n=5)
Spiked in SW measured by SIM
Spiked SW measured by MRM
Peak Name RT (min) Measured %RSD Measured %RSD
Chlorprophan 16.26 1199. 6024 64.51 1.35
a-BHC 16.76 1014. 6.52 44.38 7.45
b-BHC 17.35 135. 7.35 46.74 5.94
g-BHC 17.56 313. 5.30 45.19 4.09
d-BHC 18.20 ND ND 45.11 3.88
Metribuzin 18.76 266. 5.69 66.27 1.81
MGK-264 21.06 75. 6.50 54.76 4.96
Endosulfan II 24.16 104. 17.74 51.34 6.37
Average 365. 7.45 59.50 3.84

Copyright 2012 Bruker Corporation. All Rights Reserved.
C h e m i c a l a n d A p p l i e d M a r k e t s
Conclusions
• Full Scan and SIM are techniques required in Methods 8270 and 525
• However, lower reporting limits and heavy matrix challenge this requirement
• Tandem MS provides lower detection limits and confidence in results, eliminating isobaric interferences and potential erroneous reporting (high-biased)

Copyright 2012 Bruker Corporation. All Rights Reserved.
C h e m i c a l a n d A p p l i e d M a r k e t s
Analysis of Trace PPCPs in Water Using The EVOQ™ TQ LC-MS/MS System with OLE
Copyright 2012 Bruker Corporation. All Rights Reserved.
C h e m i c a l a n d A p p l i e d M a r k e t s
Bruker EVOQ™ With OLE for PPCPs in Water
• PPCPs refers to a broad group of chemical substances used for health or cosmetic
reasons, or used by agribusiness to boost growth or health of livestock
• PPCPs= Pharmaceuticals and Personal Care Product
• Wastewater from households and industrial sources contains multiple PPCPs of various combinations, concentrations and relative toxicologies
• PPCPs are bioactive, they do not dissolve easily or evaporate at normal temperatures or pressures, so can easily enter the soil and aquatic environments via sewage, biosolids and irrigation
• Evidence suggests PPCPs are linked to some ecological damage such as the delayed development in fish and delayed metamorphosis in frogs
• Conventional methods of PPCP detection requires the pre-concentration of large volume water samples and tedious solid phase extraction (SPE) clean up to achieve the low ng/L (ppt) level detection
• This study demonstrates how using UHPLC with an integrated on-line extraction (OLE) option coupled to LC-MS/MS can be used for the detection of PPCPs
• The on-line extraction module enables convenient method-driven on-line sample cleanup or sample pre-concentration

Copyright 2012 Bruker Corporation. All Rights Reserved.
C h e m i c a l a n d A p p l i e d M a r k e t s
Bruker EVOQ™ With OLE for PPCPs in Water Experimental Conditions
Chromatography parameters (Advance UHPLC OLE)
Trap column YMC-Pack ODS-AQ, 3µm,
35 mm x 2.0 mm I.D.
Column temperature 40°C
Injection volume 400 µL
Flow rate 400 µL/min
Solvent A 2 mM ammonium
formate, 0.1% FA in water
Solvent B 2 mM ammonium
formate, 0.1% FA in MeOH
Solvent C 2 mM ammonium
formate, 0.1% FA in water
Gradient conditions 0.0 min, 10% B
0.2 min, 10% B
0.8 min, 25% B
8.0 min, 95% B
9.0 min, 95% B
9.1 min, 10% B
12.0 min, 10% B
Mass spectrometer parameters (EVOQ Elite)
HV 4000 V
Cone gas flow 15 units
Cone gas temperature 300°C
Heated probe gas flow 40 units
Heated probe temperature 450°C
Nebulizer gas flow 50 units
Exhaust gas On
Q2 pressure 1.5 mTorr (Argon)
Sample Preparation: • Water sample acidified with
0.1% FA and filtered (0.45um)
Copyright 2012 Bruker Corporation. All Rights Reserved.
C h e m i c a l a n d A p p l i e d M a r k e t s
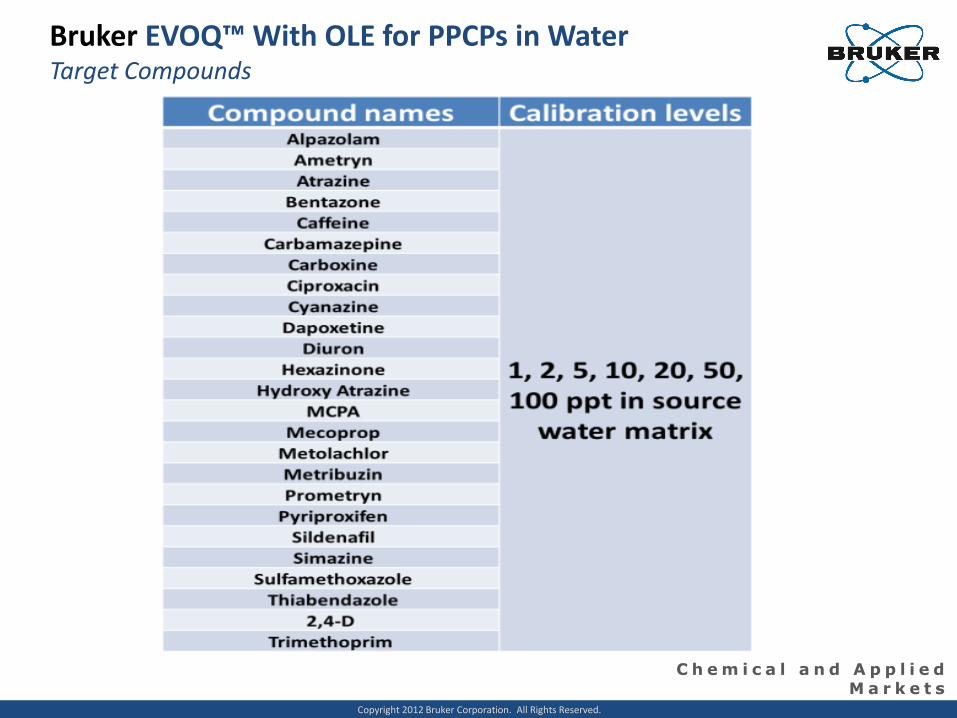
Bruker EVOQ™ With OLE for PPCPs in Water Target Compounds

Copyright 2012 Bruker Corporation. All Rights Reserved.
C h e m i c a l a n d A p p l i e d M a r k e t s
Bruker EVOQ™ With OLE for PPCPs in Water Selected PPCPs at 2 ppt

Copyright 2012 Bruker Corporation. All Rights Reserved.
C h e m i c a l a n d A p p l i e d M a r k e t s
Bruker EVOQ™ With OLE for PPCPs in Water Linearity, 1 ppt – 100 ppt
Trimethoprim
R2=0.999
Carbamazepine
R2=0.999
Naproxen
R2=0.999
Triclosan
R2=0.998
Gemfibrozil
R2=0.997
Sulfamethoxazole
R2=0.999

Copyright 2012 Bruker Corporation. All Rights Reserved.
C h e m i c a l a n d A p p l i e d M a r k e t s
Bruker EVOQ™ With OLE for PPCPs in Water Summary of PPCPs Calibration Curves
Compound Name
RT (min)
ESI R2
S/N (p/p) 2 ppt
RSD n=10
(5ppt)
Trimethoprim 1.66 + 0.994 389 5.80% Hydroxy Atrazine 1.88 + 0.997 61 9.20%
Thiabendazole 1.93 + 0.996 408 8.70% Ciproxacin 2.03 + 0.999 25 4.90%
Caffeine 2.19 + 0.995 68 8.00% Sildenafil 2.33 + 0.998 132 6.60%
Sulfamethoxazole 2.51 + 1 68 5.00% Cyanazine 4.1 + 0.998 201 8.70% Simazine 4.38 + 1 56 9.40%
Metribuzin 4.39 + 0.999 26 12.50% Hexazinone 4.42 + 0.997 553 4.90% Dapoxetine 4.62 + 0.999 268 6.00% Bentazone 4.69 - 0.999 360 6.20% Ametryn 4.73 + 0.997 404 5.70%
Carboxine 4.8 + 0.999 217 6.20% Carbamazepine 4.85 + 0.999 485 4.50%
Atrazine 5.2 + 0.996 39 6.90% Alpazolam 5.38 + 0.998 178 5.90%
Diuron 5.54 + 0.999 56 3.60% Prometryn 5.56 + 0.994 376 8.40%
2,4-D 5.7 - 1 26 5.60% MCPA 5.81 - 1 56 3.80%
Mecoprop 6.39 - 1 27 2.90% Metolachlor 6.76 + 0.996 177 9.20% Pyriproxifen 8.36 + 1 23 3.50%
Copyright 2012 Bruker Corporation. All Rights Reserved.
C h e m i c a l a n d A p p l i e d M a r k e t s
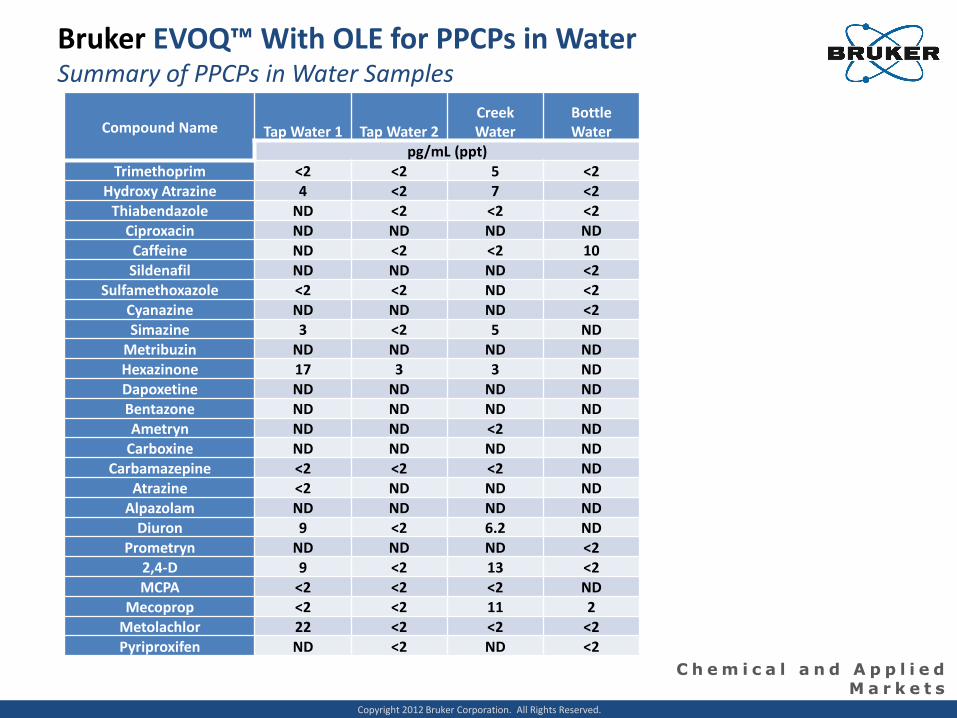
Bruker EVOQ™ With OLE for PPCPs in Water Summary of PPCPs in Water Samples
Compound Name Tap Water 1 Tap Water 2 Creek Water
Bottle Water
pg/mL (ppt) Trimethoprim <2 <2 5 <2
Hydroxy Atrazine 4 <2 7 <2 Thiabendazole ND <2 <2 <2
Ciproxacin ND ND ND ND Caffeine ND <2 <2 10 Sildenafil ND ND ND <2
Sulfamethoxazole <2 <2 ND <2 Cyanazine ND ND ND <2 Simazine 3 <2 5 ND
Metribuzin ND ND ND ND Hexazinone 17 3 3 ND Dapoxetine ND ND ND ND Bentazone ND ND ND ND Ametryn ND ND <2 ND
Carboxine ND ND ND ND Carbamazepine <2 <2 <2 ND
Atrazine <2 ND ND ND Alpazolam ND ND ND ND
Diuron 9 <2 6.2 ND Prometryn ND ND ND <2
2,4-D 9 <2 13 <2 MCPA <2 <2 <2 ND
Mecoprop <2 <2 11 2 Metolachlor 22 <2 <2 <2 Pyriproxifen ND <2 ND <2

Copyright 2012 Bruker Corporation. All Rights Reserved.
C h e m i c a l a n d A p p l i e d M a r k e t s
Bruker EVOQ™ With OLE for PPCPs in Water Summary
• All of the PPCPs studied were detected at 2 ppt or better with an injection of 400 uL water samples, with a linear response range up to 200 or 500 ppt. • Replicate injections with 5 ppt level spiked in tap water
demonstrated excellent robustness
• This new method illustrates how modern UHPLC with
OLE and LC-MS/MS can provide the sensitivity demanded by regulatory bodies, even with challenging ranges of samples at various concentrations
• The technique also presents a more convenient and simpler approach to the analysis of PPCPs compared to traditional solid phase extraction techniques
Copyright 2012 Bruker Corporation. All Rights Reserved.
C h e m i c a l a n d A p p l i e d M a r k e t s
Conclusions
• The power of Multiple Reaction Monitoring (MRM) in Environmental Samples • Can reduce detection/reporting limits and
provide more confidence in your data
• Enables matrix discrimination in samples against isobaric interferences that will occur with SIM alone
• Other techniques such as NCI as shown in pyrethroids may be required to eliminate matrix interferences
• Keep in mind that your matrix needs some study for optimized MRM transitions and/or ionization techniques for best results
67