Diurnal Circulations and Rainfall in Taiwan during SoWMEX ...

Prepared in cooperation with the State of Hawaii Department of Transportation
Rainfall, Streamflow, and Water-Quality Data During Stormwater Monitoring, Halawa Stream Drainage Basin, Oahu, Hawaii, July 1, 2004 to June 30, 2005
U.S. Department of the InteriorU.S. Geological Survey
Open-File Report 2005-1280

Report Documentation Page Form ApprovedOMB No. 0704-0188
Public reporting burden for the collection of information is estimated to average 1 hour per response, including the time for reviewing instructions, searching existing data sources, gathering andmaintaining the data needed, and completing and reviewing the collection of information. Send comments regarding this burden estimate or any other aspect of this collection of information,including suggestions for reducing this burden, to Washington Headquarters Services, Directorate for Information Operations and Reports, 1215 Jefferson Davis Highway, Suite 1204, ArlingtonVA 22202-4302. Respondents should be aware that notwithstanding any other provision of law, no person shall be subject to a penalty for failing to comply with a collection of information if itdoes not display a currently valid OMB control number.
1. REPORT DATE 2005
2. REPORT TYPE N/A
3. DATES COVERED -
4. TITLE AND SUBTITLE Rainfall, Streamflow, and Water-Quality Data During StormwaterMonitoring, Halawa Stream Drainage Basin, Oahu, Hawaii, July 1, 2004to June 30, 2005
5a. CONTRACT NUMBER
5b. GRANT NUMBER
5c. PROGRAM ELEMENT NUMBER
6. AUTHOR(S) 5d. PROJECT NUMBER
5e. TASK NUMBER
5f. WORK UNIT NUMBER
7. PERFORMING ORGANIZATION NAME(S) AND ADDRESS(ES) U.S. Department of the Interior U.S. Geological Survey 1849 C Street,NW Washington, DC 20240
8. PERFORMING ORGANIZATIONREPORT NUMBER
9. SPONSORING/MONITORING AGENCY NAME(S) AND ADDRESS(ES) 10. SPONSOR/MONITOR’S ACRONYM(S)
11. SPONSOR/MONITOR’S REPORT NUMBER(S)
12. DISTRIBUTION/AVAILABILITY STATEMENT Approved for public release, distribution unlimited
13. SUPPLEMENTARY NOTES
14. ABSTRACT
15. SUBJECT TERMS
16. SECURITY CLASSIFICATION OF: 17. LIMITATION OF ABSTRACT
UU
18. NUMBEROF PAGES
18
19a. NAME OFRESPONSIBLE PERSON
a. REPORT unclassified
b. ABSTRACT unclassified
c. THIS PAGE unclassified
Standard Form 298 (Rev. 8-98) Prescribed by ANSI Std Z39-18

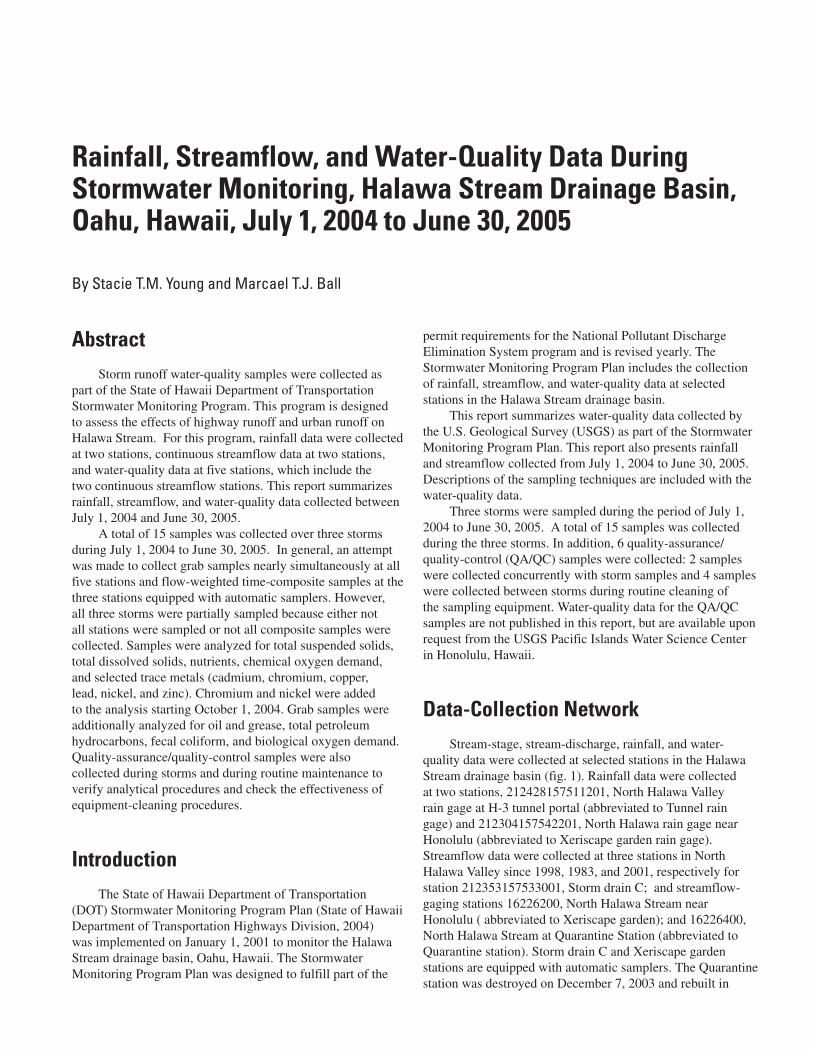
Rainfall, Streamflow, and Water-Quality Data During Stormwater Monitoring, Halawa Stream Drainage Basin, Oahu, Hawaii, July 1, 2004 to June 30, 2005
By Stacie T.M. Young and Marcael T.J. Ball
Prepared in cooperation with theSTATE OF HAWAII DEPARTMENT OF TRANSPORTATION
Open-File Report 2005-1280
U.S. Department of the InteriorU.S. Geological Survey

U.S. Department of the InteriorGale A. Norton, Secretary
U.S. Geological SurveyP. Patrick Leahy, Acting Director
U.S. Geological Survey, Reston, Virginia: 2005
For sale by U.S. Geological Survey, Information Services Box 25286, Denver Federal Center Denver, CO 80225
For more information about the USGS and its products: Telephone: 1-888-ASK-USGS World Wide Web: http://www.usgs.gov/
Any use of trade, product, or firm names in this publication is for descriptive purposes only and does not imply endorsement by the U.S. Government.
Although this report is in the public domain, permission must be secured from the individual copyright owners to reproduce any copyrighted materials contained within this report.

iii
Contents
Abstract ……………………………………………………………………………………… 1Introduction …………………………………………………………………………………… 1Data-Collection Network ……………………………………………………………………… 1Water-Quality Sampling Techniques ………………………………………………………… 2Rainfall and Streamflow Data ………………………………………………………………… 5Stormwater Sampling: Conditions and Results ……………………………………………… 7
Third Quarter 2004 – July 1 to September 30, 2004 ……………………………………… 7Storm of August 3-4, 2004 ………………………………………………………… 7
Fourth Quarter 2004 – October 1 to December 31, 2004 ………………………………… 7Storm of October 30-31, 2004 ……………………………………………………… 9Storm of December 27, 2004 ……………………………………………………… 9
First Quarter 2005 – January 1 to March 31, 2005 ……………………………………… 14Second Quarter 2004 – April 1 to June 30, 2005 ………………………………………… 14
Quality Assurance …………………………………………………………………………… 14References Cited ……………………………………………………………………………… 14Appendix A: Discharge-Reporting and Load-Calculation Methods ………………………… 18Appendix B: Physical properties, concentrations, and loads for all samples collected from
Halawa Stream drainage basin during the period from July 1, 2004 to June 30, 2005 …………………………………… provided as Excel file
Figures Figure 1. Stream-gaging stations, rain gages, and water-quality sampling stations in the Halawa
drainage basin, Oahu, Hawaii. ……………………………………………………… 3 Figure 2. Rainfall and discharge for stations within the Halawa Stream drainage basin for
July 1, 2004 to June 30, 2005. ……………………………………………………… 6 Figure 3. Discharge at Storm drain C station (212353157533001) for July 1 to September 30,
2004; detail of the 2-day period of August 3-4, 2004; and detail of the 18-hour period from 18:00 August 3, 2004 to 12:00 August 4, 2004 …………………………………… 8
Figure 4. Stream discharge at Xeriscape garden station (16226200) for July 1 to September 30, 2004 ……………………………………………………………………………… 9
Figure 5. Discharge at Storm drain C station (212353157533001) for October 1 to December 31, 2004; detail of the 1-day period of October 30, 2004; and detail of the 3-hour period from 17:00 to 20:00 October 30, 2004 ………………………………………… 10
Figure 6. Stream discharge at Xeriscape garden station (16226200) for October 1 to December 31, 2004; detail of the 1-day period of October 31, 2004; and detail of the 12-hour period from 00:00 to 12:00 October 31, 2004 ………………………………… 11
Figure 7. Discharge at Storm drain C station (212353157533001) for the 1-day period of December 27, 2004; and detail of the 12-hour period from 00:00 to 12:00 December 27, 2004 ……………………………………………………………………………… 12
Figure 8. Stream discharge at Xeriscape garden station (16226200) for 1-day period of December 27, 2004; and detail of the 16-hour period from 00:00 to 16:00 December 27, 2004 ……………………………………………………………………………… 13

iv
Conversion Factors, Datums, and Abbreviations
Multiply By To obtainLength
inch (in.) 2.54 centimeter (cm)foot (ft) 0.3048 meter (m)mile (mi) 1.609 kilometer (km)
Dischargecubic foot per second (ft3/s) 0.02832 cubic meter per second (m3/sec)
Temperature in degrees Celsius (°C) may be converted to degrees Fahrenheit (°F) as follows:
°F=(1.8×°C)+32
Temperature in degrees Fahrenheit (°F) may be converted to degrees Celsius (°C) as follows:
°C=(°F-32)/1.8
Vertical coordinate information is referenced relative to mean sea level.
Horizontal coordinate information is referenced to Old Hawaiian Datum.
Specific conductance is given in microsiemens per centimeter at 25 degrees Celsius (µS/cm at 25°C).
Concentrations of chemical constituents in water are given either in milligrams per liter (mg/L) or micrograms per liter (µg/L).
Figure 9. Discharge at Stor m drain C (212353157533001) and Xeriscape garden (16226200) stations for January 1 to March 31, 2005 …………………………………………… 15
Figure 10. Stream discharge at Storm drain C (212353157533001) and Xeriscape garden (16226200) stations for April 1 to June 30, 2005 ……………………………………… 16
Tables Table 1. Minimum reporting levels of properties and constituents for all samples collected
from Halawa Stream drainage basin from July 1, 2004 to June 30, 2005 …………… 5 Table 2. Significant figures and rounding limits for measured, streamflow-rating, and
averaged discharges ……………………………………………………………… 18 Table 3. Conversion factors for computing daily loads from constituent concentration and
discharge …………………………………………………………………………… 18
AbstractStorm runoff water-quality samples were collected as
part of the State of Hawaii Department of Transportation Stormwater Monitoring Program. This program is designed to assess the effects of highway runoff and urban runoff on Halawa Stream. For this program, rainfall data were collected at two stations, continuous streamflow data at two stations, and water-quality data at five stations, which include the two continuous streamflow stations. This report summarizes rainfall, streamflow, and water-quality data collected between July 1, 2004 and June 30, 2005.
A total of 15 samples was collected over three storms during July 1, 2004 to June 30, 2005. In general, an attempt was made to collect grab samples nearly simultaneously at all five stations and flow-weighted time-composite samples at the three stations equipped with automatic samplers. However, all three storms were partially sampled because either not all stations were sampled or not all composite samples were collected. Samples were analyzed for total suspended solids, total dissolved solids, nutrients, chemical oxygen demand, and selected trace metals (cadmium, chromium, copper, lead, nickel, and zinc). Chromium and nickel were added to the analysis starting October 1, 2004. Grab samples were additionally analyzed for oil and grease, total petroleum hydrocarbons, fecal coliform, and biological oxygen demand. Quality-assurance/quality-control samples were also collected during storms and during routine maintenance to verify analytical procedures and check the effectiveness of equipment-cleaning procedures.
IntroductionThe State of Hawaii Department of Transportation
(DOT) Stormwater Monitoring Program Plan (State of Hawaii Department of Transportation Highways Division, 2004) was implemented on January 1, 2001 to monitor the Halawa Stream drainage basin, Oahu, Hawaii. The Stormwater Monitoring Program Plan was designed to fulfill part of the
permit requirements for the National Pollutant Discharge Elimination System program and is revised yearly. The Stormwater Monitoring Program Plan includes the collection of rainfall, streamflow, and water-quality data at selected stations in the Halawa Stream drainage basin.
This report summarizes water-quality data collected by the U.S. Geological Survey (USGS) as part of the Stormwater Monitoring Program Plan. This report also presents rainfall and streamflow collected from July 1, 2004 to June 30, 2005. Descriptions of the sampling techniques are included with the water-quality data.
Three storms were sampled during the period of July 1, 2004 to June 30, 2005. A total of 15 samples was collected during the three storms. In addition, 6 quality-assurance/quality-control (QA/QC) samples were collected: 2 samples were collected concurrently with storm samples and 4 samples were collected between storms during routine cleaning of the sampling equipment. Water-quality data for the QA/QC samples are not published in this report, but are available upon request from the USGS Pacific Islands Water Science Center in Honolulu, Hawaii.
Data-Collection NetworkStream-stage, stream-discharge, rainfall, and water-
quality data were collected at selected stations in the Halawa Stream drainage basin (fig. 1). Rainfall data were collected at two stations, 212428157511201, North Halawa Valley rain gage at H-3 tunnel portal (abbreviated to Tunnel rain gage) and 212304157542201, North Halawa rain gage near Honolulu (abbreviated to Xeriscape garden rain gage). Streamflow data were collected at three stations in North Halawa Valley since 1998, 1983, and 2001, respectively for station 212353157533001, Storm drain C; and streamflow-gaging stations 16226200, North Halawa Stream near Honolulu ( abbreviated to Xeriscape garden); and 16226400, North Halawa Stream at Quarantine Station (abbreviated to Quarantine station). Storm drain C and Xeriscape garden stations are equipped with automatic samplers. The Quarantine station was destroyed on December 7, 2003 and rebuilt in
Rainfall, Streamflow, and Water-Quality Data During Stormwater Monitoring, Halawa Stream Drainage Basin, Oahu, Hawaii, July 1, 2004 to June 30, 2005
By Stacie T.M. Young and Marcael T.J. Ball

June 2005. Rainfall and streamflow data were collected using variable sampling intervals depending on rainfall or streamflow rates. Data from the two rain gages and the two streamflow-gaging stations are transferred daily to the USGS National Water Information System (NWIS) database using cellular-phone telemetry and can be viewed at http://hi.water.usgs.gov/ by selecting the appropriate USGS station numbers.
Water-quality data were collected at five stations (fig. 1): 212356157531801, North Halawa Stream at Bridge 8 near Halawa (abbreviated to Bridge 8); Storm drain C; Xeriscape garden; Quarantine station; and 16227100, Halawa Stream below H-1 (abbreviated to Stadium). The Bridge 8 station is about 0.75 mi upstream from the discharge point of Storm drain C on North Halawa Stream. Storm drain C collects runoff from an approximately 4-mi length of freeway starting at the leeward tunnel portal and extending to mid-valley and discharges directly to North Halawa Stream (fig. 1). The Xeriscape garden station is directly upstream from a light-industrial area near North Halawa Stream, and about 0.75 mi downstream of the discharge point of Storm drain C. The Quarantine station is about 1 mi downstream of Xeriscape garden and near the downstream end of the light-industrial area that borders the North Halawa Stream. The Stadium station is about 1.5 mi downstream of the Quarantine station, below the confluence of North and South Halawa Streams, downstream from the crossing of H-1 freeway, and directly upstream from the mouth at Pearl Harbor. Water-quality data have been previously collected at Storm drain C (1998-present), Xeriscape garden (1983-present), and Stadium (1988-present) by the USGS as part of the H-3 freeway construction monitoring study and can be viewed at http://waterdata.usgs.gov/hi/nwis/qwdata by selecting the appropriate USGS station numbers.
Water-Quality Sampling TechniquesWater-quality samples include grab samples collected
manually; grab samples collected by an automatic sampler, and flow-weighted time-composite samples collected by an automatic sampler.
Sampling requirements.--The DOT Stormwater Monitoring Program Plan states that water-quality samples will be collected at least once per quarter during periods of storm runoff from each of the five water-quality monitoring stations (fig. 1). The plan also states that efforts will be made to sample all five water-quality monitoring stations during the same storm, and if a storm does not occur during a quarter, no samples will be collected.
A complete set of samples for a storm consists of five grab samples (one from each of the five stations), three flow-weighted time-composite samples, and one QA/QC sample. However, some storms are brief and do not produce adequate runoff to sample all five stations and collect all samples. In
practice, these storms have been sampled as thoroughly as possible and analyzed for as many constituents as practical. In previous years, three QA/QC samples were collected and considered part of a complete storm sample, although the DOT Stormwater Monitoring Program Plan required only one QA/QC sample to be collected per storm. Since December 2003, the number of QA/QC samples was reduced to the required one sample per storm because of increased laboratory costs.
Storm criteria.--The U.S. Environmental Protection Agency’s (USEPA) Storm Water Sampling Guidance Manual (U.S. Environmental Protection Agency, Office of Water, 1993) provides guidelines for stormwater-sampling criteria. The first criterion requires at least 0.1 in. of accumulated rainfall. Rainfall accumulations have exceeded 0.1 in. at the Tunnel rain gage and Xeriscape garden rain gage when stormwater sampling was conducted. The second criterion requires that samples be collected only for storms preceded by at least 72 hours of dry weather. The second criterion would prevent sampling of most storms on North Halawa Stream because the Halawa Stream drainage basin, as well as many other parts of Oahu, receives tradewind showers almost daily.
In practice, criteria used to initiate sampling of the stream and storm drain were based on the rate of rainfall accumulation and the rise of stage in Storm drain C and at Xeriscape garden stations. Each automatic sampler is triggered at predetermined station specific stream-stage thresholds. The automatic samplers at Storm drain C and Xeriscape garden station collect samples at stages that correspond to discharges greater than 3 and 40 ft3/s, respectively.
Sample collection.-- In general, grab samples were collected manually using isokinetic, depth-integrating samplers and equal-width increment (EWI) sampling techniques (Wilde and others, 1998). Samplers are made of high-density polyethylene (HDPE) that collect water in an isokinetic manner, in which water enters the sampler at the same velocity as the stream at the sampling point. The EWI sampling technique utilizes evenly spaced sampling increments along the cross section of the stream. The volume of sample collected at each increment is proportional to the discharge at that increment. Samples collected at each increment are combined in an HDPE churn.
An EWI sample is practical when depths are greater than 0.5 ft and the stream is wadeable. During high-discharge storms, streams were not waded for safety reasons. However, the stream appeared to be sufficiently well mixed during high-discharge storms at each station, therefore the EWI method was not necessary. At such times, the grab sample was collected with the isokinetic sampler at the estimated centroid of flow of a single vertical section in the stream. Sub-samples from the single-vertical technique were combined in a HDPE churn.
A flow-weighted, time-composite sample is created by combining, in a HDPE churn, all or part of the samples collected by the automatic sampler. The desired volume of water from each sample is proportional to the stream-discharge volume between sample-collection times. Composite samples
2 Rainfall, Streamflow, and Water-Quality Data, Halawa Stream Drainage Basin, July 1, 2004 to June 30, 2005

Figu
re 1
. St
ream
-gag
ing
stat
ions
, rai
n ga
ges,
and
wat
er-q
ualit
y sa
mpl
ing
stat
ions
in th
e Ha
law
a dr
aina
ge b
asin
, Oah
u, H
awai
i.
����
��
����
���
�
���
���
���
�����
���
���
���
���
����
���
�
���
����
�
����
��
�����
��
��
��
�
��
�
����
����
����
���
����
���
�����
����
����
����
���� ��
����
����
����
����
����
���
����
����
����
���
����
���
���
�
����
����
����
���
����
���
����
����
�����
����
����
��
����
����
����
���
����
����
����
����
����
��
���
��
����
��
��
���
��
��
��
���
����
����
����
���
����
���
�����
����
����
����
���� ��
����
����
����
����
����
���
����
����
����
���
����
���
���
�
����
����
����
���
����
���
����
��
����
��
����
���
����
���
����
���
� �
��
����
�
��
����
���
���
�
�
���
���
���
��
���
��
���
��
��
��
��
���
��
���
���
���
��
���
���
��
��
��
���
��
��
��
��
���
��
��
��
����
���
����
����
���
����
���
����
��
��
���
��
���
��
���
��
��
��
��
���
��
��
��
��
��
���
��
��
��
��
���
��
��
��
��
��
���
��
���
���
��
���
���
��
���
��
��
��
���
��
��
��
���
��
��
��
���
����
����
���
����
��
����
����
����
���
���
�����
�
����
�
��
��
��
��
���
���������� ���
���
���
���
����
�
���
�����
���
���
������
�
����
����
��
����
����
�����
����
����
��
����
����
����
���
����
����
�����
����
����
��
����
����
����
���
����
����
����
����
����
����
����
����
���
����
����
����
����
����
����
����
����
���
����
���
��
���
���
���
��
����
��
��
���
��
��
��
���
���
���
���
��
��
��
��
���
���
����
���
��
Water-Quality Sampling Techniques 3

were collected over a time period that sometimes lasted several hours using an automatic sampler
Automatic samplers collect water from a fixed point in the stream channel after pre-determined stage thresholds are met. The automatic samplers have a capacity of 24, 1-liter bottles. When the first threshold was met, the automatic samplers were programmed to sample water every 2 minutes for the first five samples, and then every 15 minutes. When a higher, second threshold was met, the automatic samplers were programmed to sample water every 7 minutes.
The first five samples from the automatic sampler were sometimes combined and analyzed as a grab sample when grab samples could not be collected manually. The first three of these five samples were collected in teflon bags. In the event that a manual grab sample could not be collected, the samples in teflon bags were sometimes used for oil and grease (O+G) and total petroleum hydrocarbon (TPH) analyses. The remaining 21 samples were collected in low density polyethylene (LDPE) bags.
The main limitation associated with using samples from the automatic sampler is that some constituents require the sample to be chilled prior to analysis or analyzed within a certain time after collection, known as the holding time. The automatic samplers were not equipped with refrigeration units, and thus holding times for selected constituents may have been exceeded.
Samples collected by the automatic sampler (automatic samples) may be used in lieu of or in addition to manual grab samples. Thus, there may be more than five grab samples in a sample set or more than one grab sample at a station. Automatic samples were used in lieu of a manual grab sample when a manual grab sample could not be collected because of insufficient runoff at the time of the station visit. Automatic samples were used in addition to a manual grab sample when the automatic samples were collected during the first peak or first flush of the storm. When a few hours separated the times at which the automatic samples were collected, only those automatic samples corresponding to the first flush of the storm were used to form a composite sample.
If the first five automatic samples were collected from the same peak, these samples would be representative of a first flush sample and sometimes would be analyzed as a grab sample. The first samples, collected in teflon bags, would be for O+G analysis and the second sample bottle for TPH analysis. The entire contents of the other three sample bottles would be combined and analyzed for total suspended solids (TSS), total dissolved solids (TDS), nutrients, chemical oxygen demand (COD), and selected trace metals (cadmium, chromium, copper, lead, nickel, and zinc). Fecal coliform (FC) and biological oxygen demand (BOD) would not be analyzed in this case because the holding times for these constituents would likely be exceeded.
Determination of discharge.--At the Bridge 8, Storm drain C, Xeriscape garden, and Quarantine stations, discharge associated with each sample was determined using a streamflow rating, created for the station, or by direct
measurement using a current meter. Streamflow ratings were developed using measurements and results from computer models that were verified by subsequent measurements. At the Stadium station, the wide and curving concrete-lined channel and shallow and swift streamflow preclude development of an accurate streamflow rating. When possible discharge at this station was measured using a current meter. At higher flows, discharge was measured either by using float-measurement techniques or a radar gun. The float-measurement technique involves timing floating bottles over a known distance to determine water velocity. The radar gun measures surface velocity at multiple points in the cross section. In both techniques, the area of the cross section was estimated using measured water depths and surveyed dimensions of the channel. USGS practices for making discharge measurements and streamflow ratings can be found in Rantz and others (1982).
An average-discharge value was calculated for each composite sample. The average-discharge value was equal to the total volume of water that flowed by the gaging station during sample collection, divided by the total elapsed time required to collect the automatic samples. To determine the volume of water that passed the station for each sample, the discharge at the time of sample collection was multiplied by the elapsed time. The elapsed time is computed by taking the difference between the times of the samples taken before and after the sample in questions and dividing by two. To compute the elapsed time of the first and last samples, the difference between the time of the sample and next/previous sample is divided by two. These volumes were summed, and the total volume was divided by the sum of all the time increments. A similar method, the mid-section method, is used when computing the width between sections in discharge measurments is described in Rants and others (1982).
Measured, streamflow-rating, and averaged discharge values are reported to appropriate number of significant figures. These discharge values and the corresponding values of constituent concentration are used to compute loads. Reported discharge values and the calculation of loads are discussed in appendix A.
Sample processing, analysis, and quality assurance/quality control.--USGS water-quality sampling methods (Wilde and others, 1998) were followed to prevent possible contamination during sample processing. Both grab and composite samples were processed using churns to mix and suspend sediment while delivering the sample to specific bottles for the various constituent analyses. The time assigned to each grab and composite sample is the median time of the sample collection.
As required by the DOT Stormwater Sampling Program Plan, each composite and grab sample was analyzed for temperature, pH, specific conductance, TSS, TDS, nutrients, COD, and selected trace metals (cadmium, chromium, copper, lead, nickel, and zinc). Each grab sample was also analyzed for O+G, TPH, FC, and BOD. USGS personnel made field measurements of temperature, pH, and specific conductance.
4 Rainfall, Streamflow, and Water-Quality Data, Halawa Stream Drainage Basin, July 1, 2004 to June 30, 2005

The minimum reporting levels for each of the analyzed properties and constituents are listed in table 1 and are based on values published by the USGS National Water Quality Laboratory (NWQL). Calculated values, organic nitrogen and total nitrogen, do not have minimum reporting levels. More information about minimum reporting levels and how they are determined by NWQL can be found in Childress and others (1999).
FC and BOD analyses were performed by Aecos Incorporated, a private laboratory on Oahu. QA/QC practices at Aecos Incorporated are conducted, but are not published. For storm-sample events that occurred on a weekend or holiday, no FC or BOD samples were collected because Aecos Incorporated was closed and holding times for these constituents would be exceeded.
All other analyses were performed at the USGS NWQL, in Denver, Colorado. The methods used for analyses of all water-quality constituents and quality-control practices at NWQL are documented in Friedman and Erdmann (1982), Fishman and Friedman (1989), Pritt and Raese (1992), Patton and Truitt (1992), and Fishman (1993).
A duplicate sample, field or laboratory, is required by the Stormwater Sampling Program Plan for each storm sample. A field duplicate is a sample that is collected concurrently with a grab sample and the analytical results are used to verify the sampling method. A laboratory duplicate is a sample that is split into two equal parts during sample processing and the
results are used to verify the precision of the laboratory. Field duplicate QA/QC samples were collected at Xeriscape garden during each storm, except for the storm of December 27, 2004 when no QA/QC sample was collected.
During the period between storms, non-dedicated and non-disposable equipment, such as churns, isokinetic samplers, automatic-sampler-intake lines, and teflon automatic-sampler bottle liners, were cleaned following procedures in Wilde and others (1998). Field-blank samples were collected once per quarter. Inorganic blank water (IBW), free of inorganic constituents, was passed through the automatic sampler and collected. The IBW field-blank samples were analyzed for the same inorganic constituents as the storm samples.
Data presented in this report are provisional and subject to revision.
Rainfall and Streamflow DataHydrographs of daily rainfall and daily mean streamflow
for the period of July 1, 2004 through June 30, 2005 are shown in figure 2. A total of 143.4 in. of rain was recorded at the Tunnel rain gage and 54.2 in. of rain was recorded at Xeriscape garden rain gage during this period.
Table 1. Minimum reporting levels of properties and constituents for all samples collected from Halawa Stream drainage basin from July 1, 2004 to June 30, 2005, Oahu, Hawaii
[std., standard; μS/cm, microsiemens per centimeter at 25oC; mg/L, milligrams per liter; oC, degrees Celsius; μg/L, micrograms per liter; --, no minimum reporting level, computed value; MPN/100mL, most probable number (of colonies) per 100 milliliters]
Property or constituent Minimum reporting levelspH 0.1 std. unitsSpecific conductance 2.6 µS/cmTemperature 0.5˚CTotal suspended solids 10 mg/LTotal dissolved solids 10 mg/LTotal nitrogena --Organic nitrogenb --Nitrogen ammonia dissolved 0.04 mg/LNitrogen, total organic + ammonia 0.10 mg/LNitrogen, nitrite + nitrate dissolved 0.060 mg/LPhosphorus dissolved 0.04 mg/LTotal phosphorus 0.040 mg/LChemical oxygen demand 10 mg/LTotal cadmium 0.04 µg/LTotal chromium 2 µg/LTotal copper 0.6 µg/LTotal lead 0.06 µg/LTotal nickel 0.16 µg/LTotal zinc 2 µg/LOil and grease 7 mg/LTotal petroleum hydrocarbons 2 mg/LBiological oxygen demand 1 mg/LFecal coliform 2MPN/100mL
aTotal nitrogen is calculated by adding nitrogen, total organic+ammonia (Kjeldahl) to nitrogen, nitrite+nitrate, dissolved.bOrganic nitrogen is calculated by subtracting nitrogen ammonia, dissolved, from nitrogen, total organic+ammonia (Kjeldahl).
Rainfall and Streamflow Data 5
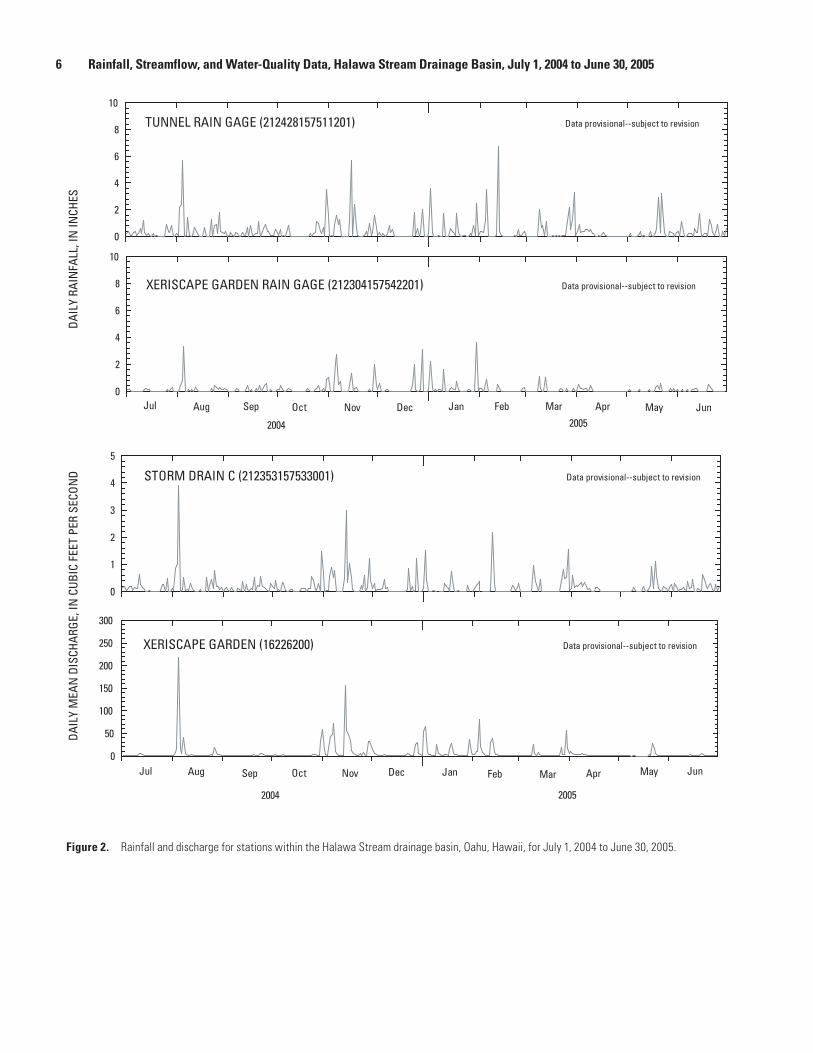
Figure 2. Rainfall and discharge for stations within the Halawa Stream drainage basin, Oahu, Hawaii, for July 1, 2004 to June 30, 2005.
�
�
�
�
�
��
��� ��� ���
����
����������������������������������������������������������������������������� �������������������������������������
�
�
�
�
�
��
����
���
���
����
����
���
�����
����
����
����
����
���
�
���������������������������������������������������������������� �������������������������������������
����
����
����
�����
����
����
��� ��� ��� ��� ��� ��� ��� ��� �������
�
�
�
�
�
�
��������������������������������������������������������������������������������� �������������������������������������
�
��
���
���
���
���
���
���������������������������������������������������������������������������������� �������������������������������������
��� ��� ��� ��� ��� ��� ��� ��� ��� ��� ��� ���
���� ����
6 Rainfall, Streamflow, and Water-Quality Data, Halawa Stream Drainage Basin, July 1, 2004 to June 30, 2005

Days with daily rainfall values greater than 1.6 in. at the Tunnel rain gage and daily rainfall values greater than 0.8 in. at the Xeriscape garden rain gage resulted in sufficient runoff for collection of a storm sample. The highest recorded daily rainfall at the Tunnel rain gage was 6.7 in. on February 11, 2005. The highest recorded daily rainfall at the Xeriscape garden rain gage was 3.6 in. on January 29, 2005.
Halawa Stream is an intermittent stream. At Xeriscape garden streamflow-gaging station, the highest daily mean discharge was 217 ft3/s on August 4, 2004. The longest period of zero daily mean discharge at this station was from May 11-18, 2005. For Storm drain C, the highest daily mean discharge was 3.9 ft3/s on August 4, 2004. The longest period of zero daily mean discharge at this station was from April 21 to May 1, 2005.
Stormwater Sampling: Conditions and Results
During the period July 1, 2004 through June 30, 2005, six storms occurred with sufficient runoff to trigger the automatic samplers at the predetermined thresholds at Xeriscape garden and Storm drain C stations. Of these storms, three were sampled: August 3-4, 2004, October 30-31, 2004, and December 27, 2004. Complete storm samples were not collected for this year because of the destruction of Quarantine station on December 7, 2003 and not rebuilt until June 2005.
Third Quarter 2004 – July 1 to September 30, 2004
Storm of August 3-4, 2004During third quarter 2004, the August 3-4, 2004 storm
was sampled. Hydrographs of discharge at Storm drain C and Xerscape garden stations during July 1 to September 30, 2004 are shown in figure 3 and 4, respectively. Due to recording equipment malfunction, detailed hydrographs for Xeriscape garden for the storm of August 3-4, 2004 are not available. Grab sample-collection time and beginning and ending composite-sample collection times are displayed on the hydrographs for Storm drain C station (fig 3). Discharges and analyzed constituents are shown in appendix B.
One composite sample was collected from Storm drain C. Manual grab samples were collected from each station. Samples were analyzed for all constituents listed in the Stormwater Monitoring Program Plan (State of Hawaii Department of Transportation Highways Division, 2004), although FC was not analyzed at Quarantine station and BOD was not analyzed at Stadium.
Bridge 8.--The grab sample was collected by dipping the churn at the centroid of flow from the left bank. At the
time of sample collection, the stream was unsafe to wade and appeared to be well mixed. Discharge was measured concurrently with the sample collection using a current meter and was 245 ft3/s.
Storm drain C.--A grab sample was collected at the centroid of flow in the storm drain by directly submersing the churn. At the time of the maual-grab sample, the discharge was 1.7 ft3/s (fig. 3). Discharge associated with the grab sample was determined using the stage at the median time of the grab-sample collection and the streamflow rating for this gage.
The automatic sampler collected a total of 24 samples during a 9-hour period. One flow-weighted time-composite sample was created using the first 9 samples. The first 9 samples were chosen because they represented the first flush and included a discharge peak. The average discharge for the composite-sample collection was 19 ft3/s (fig. 3). The peak discharge during the storm was 41 ft3/s (05:43 hours) on August 4, 2004.
Xeriscape garden.-- The grab sample was collected using the EWI method at 5 sampling points distributed every foot starting from the right bank. At the time of sampling the stream was 26 ft wide and unsafe to cross to sample the entire cross section and appeared to be well mixed. Discharge measured from the cableway was made concurrently with sample collection and was 131 ft3/s (fig. 4). Automatic samples were triggered, but were not collected because a large boulder was found on the bubble and sampler orifices that may have hindered the collection of the automatic samples. No composite sample was analyzed at this station. A field duplicate was collected at this station. The peak discharge was 2,030 ft3/s on August 4, 2004.
Quarantine station.--The grab sample was collected using the EWI method at 5 sampling points distributed every foot starting from the left bank. At the time of sampling the stream was 20 ft wide and unsafe to cross to sample the entire cross section and appeared to be well mixed. At the time of the grab sample, the discharge was measured to be 284 ft3/s using the float method.
Stadium.--A grab sample was collected by dipping the churn at the centroid of a single vertical 2 ft from the right edge of the channel. Two sampling points, 1 and 2 ft from the right edge of the channel, were taken for the O+G and TPH samples. The stream was unsafe to wade during the time of sampling and the stream appeared to be well mixed. Discharge was measured by float method and was 401 ft3/s.
Fourth Quarter 2004 – October 1 to December 31, 2004
During this quarter, two storms were sampled. The first storm, October 30-31, 2004, was a partial storm sampling at all five stations. The second storm, December 27, 2004, was a partial storm sampling at Storm drain C, Xeriscape garden, and Quarantine station.
Stormwater Sampling: Conditions and Results 7

Figure 3. Discharge at Storm drain C station (212353157533001) for July 1 to September 30, 2004; detail of the 2-day period of August 3-4, 2004; and detail of the 18-hour period from 18:00 August 3, 2004 to 12:00 August 4, 2004, Oahu, Hawaii.
�
��
��
��
��
��
��
��������� ����������� ��������������
����������������������������������������������������������������������������������� �������������������������������������
����������������������������
������� ������� ������� ������� ������� ������� ������� ������� ������� �������������� ������� �������
�
��
��
��
��
��
��
����������������������������������������������������������������������������������������������������������������������������
������������������������������������������������������������������������������� �������������������������������������
�������������������������
����������
����
����
�����
����
����
����
����
����
��
������� ������� ������� ������� ������� ������� ������� ������� ���������������
��
��
��
��
��
��
������������������������������������������������������������������������������� �������������������������������������
�������������������������
�������������������������������������������������������������
����������������������������������������������
����������
���������� ����������
8 Rainfall, Streamflow, and Water-Quality Data, Halawa Stream Drainage Basin, July 1, 2004 to June 30, 2005

Figure 4. Stream discharge at Xeriscape garden station (16226200) for July 1 to September 30, 2004, Oahu, Hawaii.
�
��
��
��
��
���
���
��������� ����������� ��������������
�������������������������������������������������������������������������������������� �������������������������������������
������������������������������������������������������������������
����
����
�����
����
����
����
����
����
��
Storm of October 30-31, 2004During fourth quarter 2004, the October 30-31, 2004
storm was sampled. Hydrographs of discharge at Storm drain C and Xeriscape garden during the storm are shown in figures 5 and 6, respectively. Beginning and ending times for composite-sample collection at Storm drain C and the grab sample-collection time at Xeriscape garden are displayed on the hydrographs. No FC or BOD samples were collected during this storm.
One composite sample was collected from Storm drain C. Four manual grab samples were collected during this storm. Samples were analyzed for all constituents, except for FC and BOD samples, listed in the Stormwater Monitoring Program Plan (State of Hawaii Department of Transportation Highways Division, 2004). Discharge, temperature, pH, and specific-conductance values from field and laboratory measurements and constituent concentrations and average loads for the grab and composite samples are shown in appendix B.
Bridge 8.--The grab sample was collected using the EWI method at 7 sampling points spaced every 3 ft along a cross section of the stream. The stream width was about 20 ft. Discharge associated with the grab sample was determined using the stage at the mean time of the grab-sample collection and the streamflow rating for this station and was 28 ft3/s.
Storm drain C.--No grab sample was collected. Seven automatic samples, used to create a flow-weighted, time-composite sample, were collected near the peak discharge (fig 5). The peak discharge was 32 ft3/s on October 30, 2004 at 19:06. The average discharge was 13 ft3/s.
Xeriscape garden.--One grab sample was collected using the EWI method at 7 sampling points distributed every 2 ft. The stream width was about 15 ft. The discharge of 26 ft3/s (fig. 6) was determined using the stage at the time the sample was taken and the streamflow rating for this gage. A field
duplicate was collected at this station. No automatic sample was collected due to sampler malfunction.
Quarantine station.-- One grab sample was collected using the EWI method at 11 sampling points distributed every 2 ft across the stream. The stream width was about 21 ft. Discharge was measured concurrently with the sample collection using a current meter and was 28.8 ft3/s
Stadium.--A grab sample was collected by dipping the churn at the deepest part of the channel at the centroid of flow at 3 sampling points. The 3 sampling points were spaced 2 ft apart. Discharge was measured by current meter and was 28.9 ft3/s.
Storm of December 27, 2004The December 27, 2004 storm was of short duration and
magnitude, and only Storm drain C, Xeriscape garden and Quarantine station had sufficient flow to sample. Hydrographs of streamflow at Storm drain C (fig. 7) and Xeriscape garden (fig. 8) illustrate the small flow volumes. Grab-sample-collection times are displayed on the hydrographs. No FC or BOD samples were collected during this storm.
Two manual grab samples, one each at Xeriscape garden and Quarantine station, and two grab samples from the automatic samplers, one each at Storm drain C and Xeriscape garden, were collected during this storm. Samples were analyzed for all constituents, except for FC and BOD, listed in the Stormwater Monitoring Program Plan (State of Hawaii Department of Transportation Highways Division, 2004). Discharge, temperature, pH, and specific-conductance values from field and laboratory measurements and constituent concentrations and average loads for the grab and composite samples are shown in appendix B.
Storm drain C.--Three automatic samples were collected by the sampler and were not enough to create a flow-weighted,
Stormwater Sampling: Conditions and Results 9
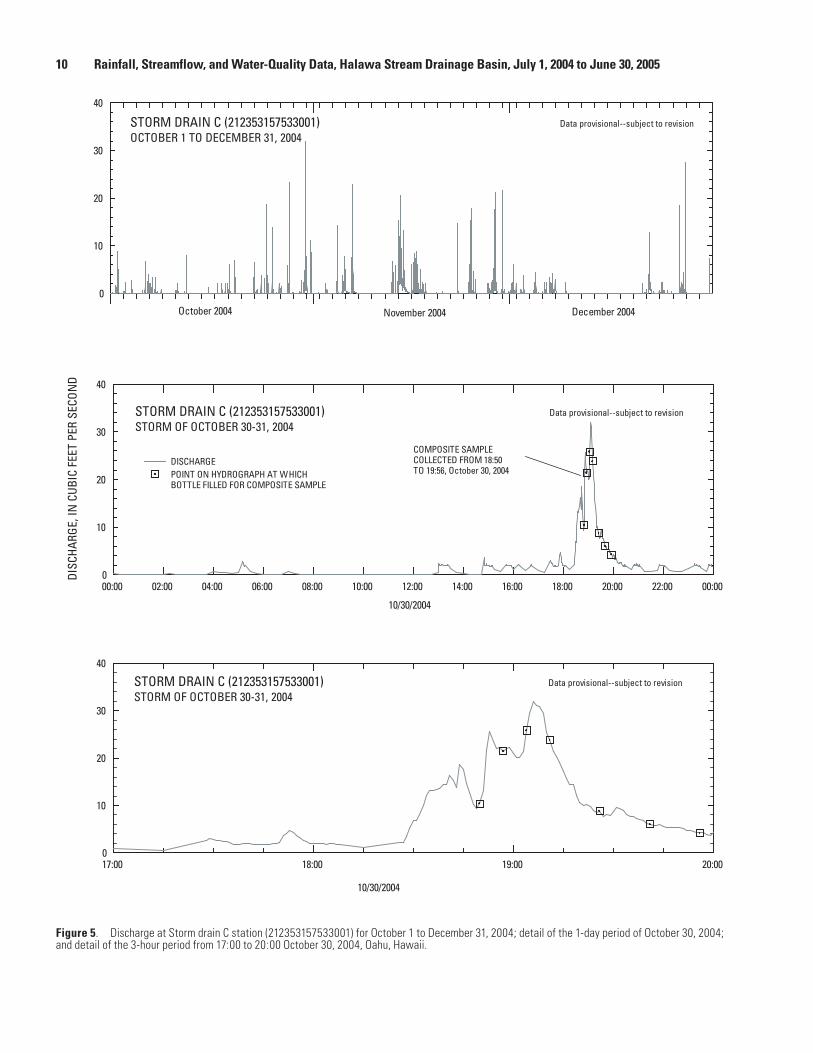
Figure 5. Discharge at Storm drain C station (212353157533001) for October 1 to December 31, 2004; detail of the 1-day period of October 30, 2004; and detail of the 3-hour period from 17:00 to 20:00 October 30, 2004, Oahu, Hawaii.
�
��
��
��
��
������������ ������������� �������������
����������������������������������������������������������������������������������� �������������������������������������
������������������������������
������� ������� ������� ������� ������� ������� ������� ������� ������� ������� ������� ������� ��������
��
��
��
��
�����������������������������������������������������������������������
������������������������������������������������������������������������������� �������������������������������������
����������������������������
����������
����
����
�����
����
����
����
����
����
��
����������
������� ������� ������� ��������
��
��
��
��
������������������������������������������������������������������������������� �������������������������������������
����������������������������
����������������������������������������������������������������
10 Rainfall, Streamflow, and Water-Quality Data, Halawa Stream Drainage Basin, July 1, 2004 to June 30, 2005

Figure 6. Stream discharge at Xeriscape garden station (16226200) for October 1 to December 31, 2004; detail of the 1-day period of October 31, 2004; and detail of the 12-hour period from 00:00 to 12:00 October 31, 2004, Oahu, Hawaii.
�
���
���
���
���
������������ ������������� �������������
������������������������������������������������������������������������������ �������������������������������������
������������������������������
������� ������� ������� ������� ������� ������� ������� ������� ������� ������� ������� ������� ��������
���
���
���
���
��������������������������������������������������������������
��������������
����
�����
����
����
����
����
����
��
����������
������� ������� ������� ������� ������� ������� ������� ������� ������� ������� ������� ������� ��������
���
���
���
���
�����������������������������������������������
������������������������������������������������������������������������������� �������������������������������������
����������������������������
����������������������������������������������������������������������������������� �������������������������������������
����������������������������
Stormwater Sampling: Conditions and Results 11

Figure 7. Discharge at Storm drain C station (212353157533001) for the 1-day period of December 27, 2004; and detail of the 12-hour period from 00:00 to 12:00 December 27, 2004, Oahu, Hawaii.
��������������������������
������� ������� ������� ������� ������� ������� ������� ������� ������� ������� �������������� �������
����
����
�����
����
����
����
����
����
��
�
��
��
��
��
��������������������������������������������������������������
������������������������������� �������������������������������������
��������������������������
������� ������� ������� ������� ������� �������������� ������� ������� ������� ������� ������� ��������
��
��
��
��
����������
�������������������������������
����������
�������������������������������������
�������������������������������
�����������������
12 Rainfall, Streamflow, and Water-Quality Data, Halawa Stream Drainage Basin, July 1, 2004 to June 30, 2005

Figure 8. Stream discharge at Xeriscape garden station (16226200) for 1-day period of December 27, 2004; and detail of the 16-hour period from 00:00 to 16:00 December 27, 2004, Oahu, Hawaii.
������� ������� ������� ������� ������� ������� ������� ������� ������� ������� ������� ��������������
����
����
�����
����
����
����
����
����
��
�
��
���
���
���
��������������������������������������������������������������������������������������������������������������������������
���������������������������
����������
�������������������������������������
��� ��� ��� ��� ��� ��� ��� ���������� ������� ������� ������� ������� ������� ������� ������� ��������
��
���
���
���
��������������������������� �������������������������������������
��������������������������
��������������������������
������������������������������������������������
����������
������������������������������������������������
Stormwater Sampling: Conditions and Results 13

time-composite sample. The entire contents of the 3 automatic samples were combined for a grab sample. O+G and TPH samples were not analyzed. The grab sample from the automatic sampler was analyzed for trace metals and nutrients only. The average discharge was 9.0 ft3/s (fig. 7).
Xeriscape garden.--A grab sample from the automatic sampler and a manual grab sample were collected. For the grab sample from the automatic sampler, a total of 4 automatic samples were collected and all 4 samples, representing the first flush, were combined in a churn and analyzed as the first grab sample. O+G and TPH samples were not analyzed. The average discharge was 58 ft3/s. The second grab sample was collected by dipping the churn at the deepest and fastest section of the sampling cross section. The discharge of 9.2 ft3/s (fig. 8) was determined using the stage at the time the sample was taken and the streamflow rating from this gage.
Quarantine station.-- One grab sample was collected using the EWI method at 12 sampling points distributed every foot across the stream. The stream width was about 15 ft. Discharge was measured concurrently with the sample collection using a current meter and was 22.0 ft3/s
First Quarter 2005 – January 1 to March 31, 2005
Hydrographs of discharge at Storm drain C and Xeriscape garden for the period of January 1 to March 31, 2005 are shown in figure 9. During this period, automatic-sampler thresholds at Storm drain C and Xeriscape garden stations were exceeded on January 1-2 and9, February 4 and 11, and March 8-9, 26, and 29. However, rainfall did not generate enough flow at Storm drain C and Xeriscape garden to collect a sufficient number of samples for analysis during this quarter.
Second Quarter 2004 – April 1 to June 30, 2005
Hydrographs of discharge at Storm drain C and Xeriscape garden for the period of April 1 to June 30, 2005 are shown in figure 10. During this period, automatic-sampler thresholds at Storm drain C and Xeriscape garden stations were exceeded on May 21. However, rainfall did not generate enough flow at Storm drain C and Xeriscape garden to collect a sufficient number of samples for analysis during this quarter.
Quality AssuranceField and laboratory quality-assurance procedures
were implemented as described in the DOT Storm Water Monitoring Program Plan (State of Hawaii Department of Transportation Highways Division, 2004). Six quality-assurance samples were collected: 2 samples were collected concurrently with storm samples during two of the three of the storms, and 4 samples were collected between storms during routine cleaning of the sampling equipment. During storm sampling, field-duplicate samples were collected at designated
sampling stations for two of the three storms. Results are not published in this report, but are available upon request.
All grab-sample-collection equipment was cleaned before each storm and sampling. The automatic-sampler intake line from Storm drain C was cleaned 4 times during the year. However, due to the pattern of discharge in Storm drain C, the sampler was triggered occasionally and samples were collected during brief rain showers. The intake line at Storm drain C was potentially contaminated in this manner prior to the October 30-31, 2004 sampling, although the potential for contamination is reduced because the automatic sampler conducts a rinse cycle prior to every sample collected.
The rinse cycle routine is as follows: 1) sample line is first purged by air, 2) water is pumped up the line to a sensor located before the pump, 3) water is purged out, and 4) the sample is then collected. The rinse cycle reduces possible contamination from water pumped during earlier storms and from previously pumped samples during the same storm, and conditions the intake lines with sample water prior to collection.
IBW field-blank samples from the automatic samplers were collected at Storm drain C on December 2, 2004, January 26, 2005, and June 28, 2005 and at Xeriscape garden on September 8, 2004. Intake lines were cleaned prior to the collection of IBW field-blank samples. These field-blank samples were analyzed for only inorganic constituents, which consists of nutrients, cadmium, copper, lead, and zinc prior to October 1, 2004. Field-blank samples after October 1, 2004 were additionally analyzed for chromium and nickel. Inorganic constituents were detected at levels at or below the minimum reporting levels, which are listed in Table 1, in all the blank samples.
References CitedChildress, C.J.O., Foreman, W.T., Connor, B.F., and Maloney,
T.J., 1999, New reporting procedures based on long-term method detection levels and some considerations for interpretations of water-quality data provided by the U.S. Geological Survey National Water Quality Laboratory: U.S. Geological Survey Open-File Report 99-193, 19p.
Fishman, M.J., and Friedman, L.C., eds., 1989, Methods for determination of inorganic substances in water and fluvial sediments (3d ed.): U.S. Geological Survey Techniques of Water-Resources Investigations, book 5, chap. A1, 545 p.
Fishman, M.J., ed., 1993, Methods of analysis by the U.S. Geological Survey National Water Quality Laboratory--Determination of inorganic and organic constituents in water and fluvial sediments: U.S. Geological Survey Open-File Report 93-125, 217 p.
Friedman, L.C., and Erdmann, D.E., 1982, Quality assurance practices for the chemical and biological analyses of water and fluvial sediments: U.S. Geological Survey Techniques of Water-Resources Investigations, book 5, chap. A6, 181 p.
14 Rainfall, Streamflow, and Water-Quality Data, Halawa Stream Drainage Basin, July 1, 2004 to June 30, 2005
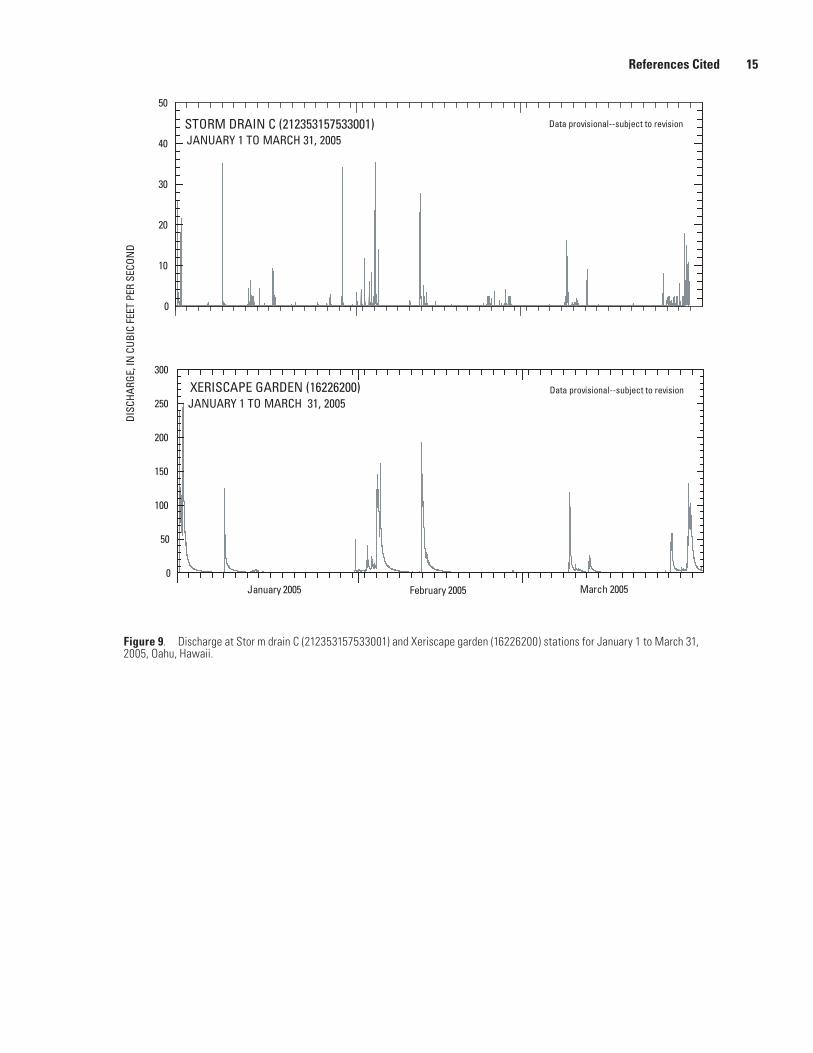
Figure 9. Discharge at Stor m drain C (212353157533001) and Xeriscape garden (16226200) stations for January 1 to March 31, 2005, Oahu, Hawaii.
����������������������������
��� ��� ���
����
����
�����
����
����
����
����
����
��
�
��
���
���
���
���
���
��������������������������� �������������������������������������
���������������������� �������������
��� ��� ���
�
��
��
��
��
��
����������������������������������������������������������
�������������������������������������
References Cited 15
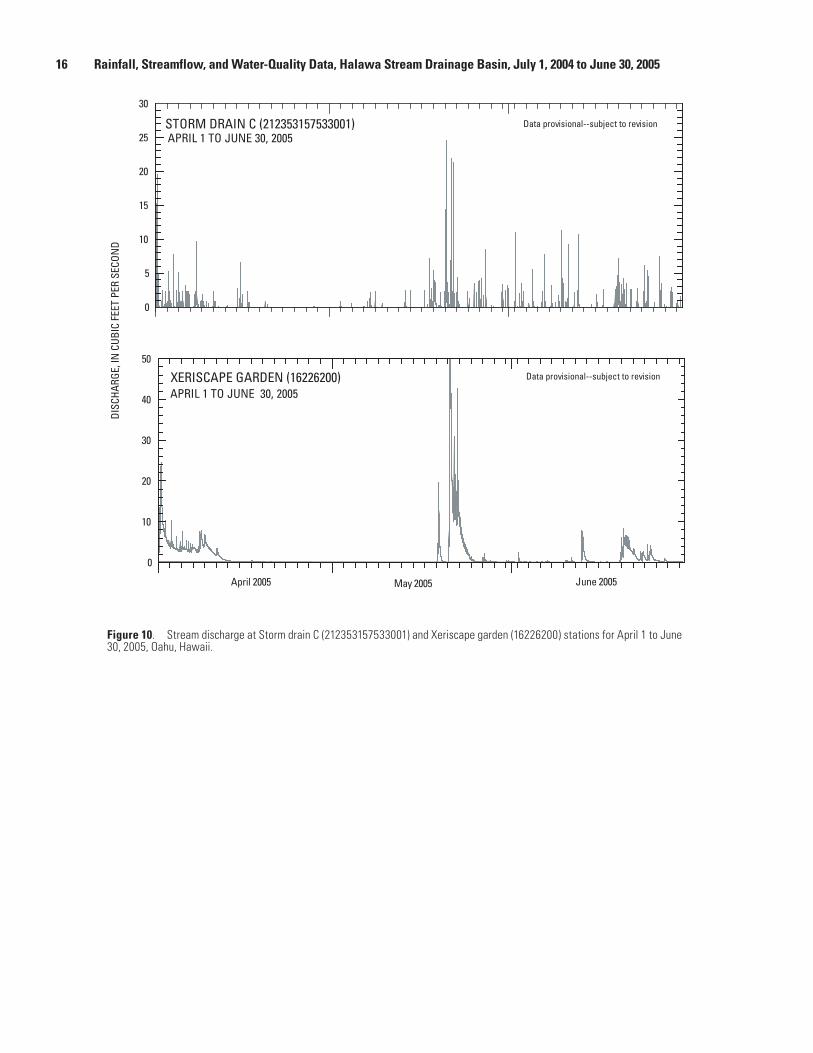
Figure 10. Stream discharge at Storm drain C (212353157533001) and Xeriscape garden (16226200) stations for April 1 to June 30, 2005, Oahu, Hawaii.
�������������������������
��� ��� ���
����
����
�����
����
����
����
����
����
��
�
��
��
��
��
��
��������������������������� �������������������������������������
���������� ��������
��� ��� ���
�
�
��
��
��
��
��
�������������������������������������������������������
�������������������������������������
���������
16 Rainfall, Streamflow, and Water-Quality Data, Halawa Stream Drainage Basin, July 1, 2004 to June 30, 2005

Patton, C.J., and Truitt, E.P., 1992, Methods of analysis by the U.S. Geological Survey National Water Quality Laboratory--Determination of total phosphorus by a Kjedahl digestion method and an automated colorimetric finish that include dialysis: U.S. Geological Survey Open-File Report 94-455, 42 p.
Pritt, J.W., and Raese, J.W., eds., 1992, Quality assurance/quality control manual National Water Quality Laboratory: U.S. Geological Survey Open-File Report 94-708, 26 p.
Rantz, S.E., and others, 1982, Measurement and computation of streamflow: Volume 1. Measurement of stage and discharge, Volume 2. Computation of discharge: U.S. Geological Survey Water-Supply Paper 2175, 284 p. and 346 p.
Sauer, V.B., 2002, Standards for the analysis and processing of surface-water data and information using electronic methods: U.S. Geological Survey Water-Resources Investigations Report 01-4044, 92 p.
State of Hawaii Department of Transportation Highways Division, 2004, Annual storm water monitoring program plan 2004-2005, 20 p. + ap.
U.S. Environmental Protection Agency, Office of Water, 1993, NPDES Storm water sampling guidance manual, prepared by C.K. Smoley, CRC Press, Inc., 165 p.
U.S. Geological Survey, 2004a, Real-time data, http://hi.water.usgs.gov/, accessed on July 18, 2005.
U.S. Geological Survey, 2004b, Water-quality data for Hawaii, http://waterdata.usgs.gov/hi/nwis/qwdata, accessed on July 18, 2005.
Wilde, F.D., Radtke, D.B., Gibs, Jacob, and Iwatsubo, R.T., 1998, National field manual for the collection of water-quality data: U.S. Geological Survey Techniques of Water-Resources Investigations, book 9, chap. A4, 114 p.
References Cited 17

Appendix A: Discharge-Reporting and Load-Calculation MethodsThis appendix further defines the methods used for reporting discharge data and constituent concentration data and the
methods for calculating constituent loads. To adequately qualify the quality of discharge and water-quality data, values are rounded off to the number of significant figures that best describe the precision of the measurement.
Discharge data.--Table 2 shows the number of significant figures and rounding limits for the range of discharges used in this study. Discharges measured by current meter or float-measurement techniques follow guidelines for measured discharges. Discharges determined by streamflow rating or by averaging follow guidelines for daily mean discharges (Sauer, 2002). Measured discharges may have more significant figures because they are considered more precise than averaged discharges.
Table 2. Significant figures and rounding limits for measured, streamflow-rating, and averaged discharges
[ft3/s, cubic feet per second; <, actual value is less than shown; ≥, actual value is greater than or equal to value shown]
Measured discharge Streamflow-rating and averaged discharges
Range of discharge (ft3/s)
Significant figures Rounding limit Significant figures Rounding limit
<0.10 2 thousandths 1 hundredths
≥0.10 and <1.0 2 hundredths 2 hundredths
≥1.0 and < 10 3 hundredths 2 tenths
≥10 and < 100 3 tenths 2 units
≥100 3 variable 3 variable
Calculation of loads.--Table 3 shows the conversion factors used for determining constituent loads. Constituent loads for all analyses are reported as pounds per day (lbs/day) except for fecal coliform, which is reported as billion colonies per day. All loads are the product of constituent concentration multiplied by associated discharge and the appropriate conversion factor (equation 1). Concentrations are reported in milligrams per liter (mg/L) or micrograms per liter (μg/L), except for fecal coliform, which is reported in most probable number (of colonies) per 100 milliliters (MPN/100 ml). Four significant figures are used for the conversion factors; however, the load value is reported with the lesser number of significant figures of the values of concentration and discharge.
Q(C)K = L (1)
Where Q = discharge (ft3/s) C = constituent concentration (mg/L, µg/L, or MPN/100 ml) K = conversion factor L = constituent load (lbs/day or billion colonies per day)
Table 3. Conversion factors for computing daily loads from constituent concentration and discharge
[mg/L, milligrams per liter; μg/L, micrograms per liter; MPN/100mL, most probable number (of colonies) per 100 milliliters; lbs/day, pounds per day]
Unit of concentration Conversion factora Load unit
mg/L 5.394 lbs/day
µg/L 0.005394 lbs/day
MPN/100mL 0.02447 billion colonies per day
aAll conversion factors are based on discharge in cubic feet per second.
18 Rainfall, Streamflow, and Water-Quality Data, Halawa Stream Drainage Basin, July 1, 2004 to June 30, 2005