Railway Ecology - Springer · · 2017-09-18wrote four pages with 46 references to railway...
336
Luís Borda-de-Água · Rafael Barrientos Pedro Beja · Henrique M. Pereira Editors Railway Ecology
Transcript of Railway Ecology - Springer · · 2017-09-18wrote four pages with 46 references to railway...

Luís Borda-de-Água · Rafael BarrientosPedro Beja · Henrique M. Pereira Editors
Railway Ecology

Railway Ecology

Luís Borda-de-Água • Rafael BarrientosPedro Beja • Henrique M. PereiraEditors
Railway Ecology

EditorsLuís Borda-de-ÁguaCIBIO/InBIO, Centro de Investigação em Biodiversidade e
Recursos GenéticosUniversidade do PortoVairãoPortugal
and
CEABN/InBIO, Centro de Ecologia Aplicada “Professor BaetaNeves”, Instituto Superior de Agronomia
Universidade de LisboaLisboaPortugal
Rafael BarrientosCIBIO/InBIO, Centro de Investigação em Biodiversidade e
Recursos GenéticosUniversidade do PortoVairãoPortugal
and
CEABN/InBIO, Centro de Ecologia Aplicada “Professor BaetaNeves”, Instituto Superior de Agronomia
Universidade de LisboaLisboaPortugal
Pedro BejaCIBIO/InBIO, Centro de Investigação em Biodiversidade e
Recursos GenéticosUniversidade do PortoVairãoPortugal
and
CEABN/InBIO, Centro de Ecologia Aplicada “Professor BaetaNeves”, Instituto Superior de Agronomia
Universidade de LisboaLisboaPortugal
Henrique M. PereiraGerman Centre for Integrative Biodiversity Research (iDiv)
Halle-Jena-LeipzigLeipzigGermany
and
CIBIO/InBIO, Centro de Investigação em Biodiversidade eRecursos Genéticos
Universidade do PortoVairãoPortugal
and
CEABN/InBIO, Centro de Ecologia Aplicada “Professor BaetaNeves”, Instituto Superior de Agronomia
Universidade de LisboaLisboaPortugal
ISBN 978-3-319-57495-0 ISBN 978-3-319-57496-7 (eBook)DOI 10.1007/978-3-319-57496-7
Library of Congress Control Number: 2017938143
© The Editor(s) (if applicable) and The Author(s) 2017. This book is an open access publication.Open Access This book is licensed under the terms of the Creative Commons Attribution 4.0International License (http://creativecommons.org/licenses/by/4.0/), which permits use, sharing, adap-tation, distribution and reproduction in any medium or format, as long as you give appropriate credit tothe original author(s) and the source, provide a link to the Creative Commons license and indicate ifchanges were made.The images or other third party material in this book are included in the book’s Creative Commonslicense, unless indicated otherwise in a credit line to the material. If material is not included in the book’sCreative Commons license and your intended use is not permitted by statutory regulation or exceeds thepermitted use, you will need to obtain permission directly from the copyright holder.The use of general descriptive names, registered names, trademarks, service marks, etc. in this publi-cation does not imply, even in the absence of a specific statement, that such names are exempt from therelevant protective laws and regulations and therefore free for general use.The publisher, the authors and the editors are safe to assume that the advice and information in thisbook are believed to be true and accurate at the date of publication. Neither the publisher nor theauthors or the editors give a warranty, express or implied, with respect to the material contained herein orfor any errors or omissions that may have been made. The publisher remains neutral with regard tojurisdictional claims in published maps and institutional affiliations.
Printed on acid-free paper
This Springer imprint is published by Springer NatureThe registered company is Springer International Publishing AGThe registered company address is: Gewerbestrasse 11, 6330 Cham, Switzerland

Foreword
Eureka! The first book on railway ecology has arrived. This pioneering editedvolume, written by an international cast, brings together and synthesizes today’s“state-of-the-science and application.” Building on the diverse European railwaynetwork, the approach is global, with work also from North America, SouthAmerica, and Asia. The ecological effects of railways are central, while the miti-gation of effects appears throughout the book.
Rich scientific highlights are compelling: wildlife mortality patterns; effects onbiodiversity; the barrier effect; lots on ungulates, bears, bats, songbirds, andwaterbirds. But there is also information on plants, elephants, amphibians, kites,gazelles, and many more, e.g., detecting mortality “hotspots,” and rail-side (verge)habitats, as well as case studies worldwide.
Mitigations to minimize impacts emerge as a motif: wildlife crossing approa-ches; noise reduction; reducing outward noise propagation; alerting wildlife >2seconds before an expected animal-train collision; reducing avian collisions andelectrocution by the elevated net of wires; restricting access; and decreasingvibrations are also discussed in detail.
Many nations are actively adding track, while high-speed trains are spreading…for good reason. Rail transport is more efficient than road traffic at moving peopleand goods, and there is more fuel efficiency; less greenhouse gas emission; lessunhealthful air pollution; less traffic congestion; and less land consumed. Mostimportantly, it is also safer.
Furthermore, people personally depend on, and are affected by, trains. Trains takecommuters to work daily. Every day we depend on long freight trains successfullycarrying coal and oil. Many of us ride trains to other cities. Small towns often witherwithout trains stopping at their stations. Industry and jobs depend on trains bringing heavyresources, such as grain, coal, andminerals.We also buy heavy products, including autos,brought by train from factories. Train noise and their vibrations degrade our neighbor-hoods near the tracks. Infrequent chemical spills pollute water bodies and neighborhoods.Children wave at the engineer, and gleefully count the wagons/cars of long freight trains.
Railway ecology really differs from road ecology. Thus much wildlife movesalong rail corridors. At any location, noise from the trains is usually infrequent, loud,
v

and at high-and-low frequencies. Wildlife collisions are invisible to passengers. Therail corridor is typically narrow. Its linear and gentle-curve route repeatedly slicesthrough landscape patterns. Persistent herbicides are widely and intensively used.Considerable vibrations alter soil structure and fauna. Little-used rail sidings andshort stretches connected to local industries support successional vegetation andanimals. Trains go faster, but stopping requires a long time and distance.
Yet road ecology concepts developed in the past three decades apply to manyaspects of railway systems. The first major road-ecology conference took place inOrlando, Florida, in 1995, the same year that my book, Land Mosaics, appeared,with 12 pages on road ecology, but only about seven sentences and seven refer-ences to railway ecology. Two decades later, in Urban Ecology: Science of Cities, Iwrote four pages with 46 references to railway ecology. Meanwhile, in 1998 wewrote a 24-page Annual Review of Ecology and Systematics article on road ecology,followed in 2003 by the first relatively comprehensive book (481 pages and 1,078references), Road Ecology: Science and Solutions, written by 14 co-authors.Twelve years later (2015), R. van der Ree, co-editors, and international leaders inthe field produced an updated synthesis, Handbook of Road Ecology, withnumerous mitigation and planning solutions.
Road ecology became mainstream for both scientists and government in onlythree decades. The International Conference of Ecology and Transportation(ICOET) and InfraEco Network Europe (IENE) provide a home base for both roadecology and railway ecology. And today railway ecology is on a roll. Many earlypapers appeared in the 1990s, but the most recent (in the last 5-10 years) show animpressive increase in quality research articles published. This book, RailwayEcology, is poised to spark the next growth phase.
Also, the book highlights and suggests many of the ecological research frontiersawaiting us. Think of the role of rail corridors in urban areas, and in intensiveagricultural land: distinctive and predominant railway species; heterogeneous rail-side habitats; vegetation and fauna; railyards; freight trains and rails linked to localindustries; pollutant distributions from diesel, steam, and electric engines; trainnoise and wildlife; interactions between the rail corridor and the sequence ofadjoining habitats/land uses; species movement and dispersal along railways; thebarrier effect and genetic variation on opposite sides of railways; diverse effects onair, soil, and water; railway impacts on populations; and, finally, regional railwaynetworks rather than rail locations or segments.
This book will catalyze new ecological research, new mitigations, and betterplanning, construction, and maintenance. Better government policies and companypractices will evolve.
Railway Ecology is a treasure chest, bulging with insights, many of them pre-viously unseen. Relish the pages ahead, jump into the field, and increase the bodyof research. Become part of the solution: put the mitigations to work for ecologicalrailways and for our land.
February 2017 Richard T.T. FormanHarvard University
vi Foreword

Preface
(….)Past cotton-grass and moorland boulderShovelling white steam over her shoulder,Snorting noisily as she passesSilent miles of wind-bent grasses.Birds turn their heads as she approaches,Stare from bushes at her blank-faced coaches.(….)
Night Mail, W.H. Audin (1907–1973)
Rationale and Purpose
The transportation of people and goods is a critical part of the economy. However, ajudicious choice of the means of transportation can ameliorate the impacts ofeconomic activities on the environment. In this respect, railways can play a majorrole, as they provide far more cost-effective and energetically efficient ways oftransporting passengers and freight than motor vehicles and airplanes. Hence,railways can contribute to the global efforts for curbing the emission of greenhousegases and thus help achieve the goals set by the Convention on Climate Change,and the recent Paris Agreement to reduce the forecasted rise in global temperaturesin the twenty-first century. Calls have thus been made to consider railways as thebackbone of sustainable transportation and to increase their share in relation to morepolluting modes of transport.1 However, as with many other economic endeavors,railways have environmental impacts ranging from several forms of pollution to
1Sadler, K., 2015. Rail to play key role in strategy for tackling climate change. http://www.europeanrailwayreview.com/24816/rail-industry-news/rail-to-play-key-role-in-strategy-for-tackling-climate-change/.
vii
wildlife mortality. Therefore, a careful assessment of railways’ impacts on natureand of mitigation measures is in order.
Trains are not cars, and railway tracks are not roads. These assertions areobvious, but they are often ignored when assessing the potential and actual bio-diversity impacts of railways, which are normally equated to those of roads. This isregrettable because roads and railways differ in many respects, which can stronglyinfluence their impacts. For instance, traffic on railways tends to be less intense thanon roads, but trains often travel at higher speeds than cars. Roads and railways alsohave different physical structures, especially in the case of electrified railways,where overhead lines along the rail tracks can represent an additional source ofimpacts. All these differences are likely to affect wildlife responses to roads andrailways, and hence their impacts on, for example, animals’ behavior, mortality, andlandscape connectivity.
A quick survey of the literature shows that studies on the biodiversity impacts ofrailways have greatly lagged behind those of roads. This is probably because the roadnetwork is much larger than the railway network, but probably also because theimpacts of roads are more easily observed by ecologists and the general public. Forinstance, the safety and economic costs associatedwith the risk of collisionwith awildor domesticated animal is more easily perceived in a road than in a railway, althoughthe latter are also very significant: an accident with an animal is likely to go unnoticedby passengers in a train, with the remarkable exception of the train driver, but the samewill not happen so easily in a car. Even the legal frameworks under which roads andrailways operate can be different, conditioning theway the environment in the vicinitycan be protected and which mitigation measures can be applied.
All these differences add to a number of specificities that clearly set railwaysapart from roads, and thus a paradigm shift is needed whereby the impacts ofrailways on biodiversity are considered on their own. This book aims at con-tributing to this shift, filling a gap in the literature about the impacts of trans-portation on biodiversity. We have brought together 44 researchers from 12countries, from North and South America to Asia and Europe. We aimed atcombining—in a single volume—the most relevant information that has beenproduced on the interactions between railways and wildlife, and to illustrate suchinteractions with a set of carefully chosen case studies from around the world. Wehave tried to produce a comprehensive volume that should be of interest toresearchers and practitioners alike, including the staff of railway and consultancycompanies that deal with the environmental challenges of railway planning, con-struction, and operation every day.
Although this book addresses several environmental problems raised by rail-ways, we would like its main message to be one of hope. Indeed, while we expectsocieties to keep looking for more efficient means of transportation, we also expectthat efficiency to become ever more synonymous with environmental efficiency, associeties seek to mitigate impacts or even improve biodiversity. We hope that ourbook can help achieve this goal, contributing to the mitigation of the negativeimpacts of railways on biodiversity, thereby improving the sustainability andenvironmental benefits of this mode of transportation.
viii Preface

Organization
We have divided the book into two parts. The first aims at reviewing the main ideasand methods related to the identification, monitoring, and mitigation of railwayimpacts on biodiversity, with emphasis on wildlife mortality, barrier effects, bio-logical invasions, and the effects of other railway environmental impacts such asnoise and chemical pollution. We begin by setting the scene (Chap. 1–RailwayEcology), framing railways in their economic context, and providing severalexamples of how railways can impact biodiversity. In Chap. 2 (Wildlife Mortalityon Railways), Sara Santos and her colleagues provide a comprehensive review ofmortality rates on railways, paying particular attention to the sources of bias whenestimating mortality rates. In Chap. 3 (Methods for Monitoring and MitigatingWildlife Mortality on Railways), Filipe Carvalho and his colleagues have furtherdeveloped the theme of wildlife mortality, focusing on monitoring and mitigation.They discuss the application to railways of mitigation procedures routinely used inroad ecology, and provide an overview of wildlife crossing structures and their rolein reducing mortality and barrier effects. In Chap. 4 (Railways as Barriers forWildlife: Current Knowledge and Future Steps), Rafael Barrientos and LuísBorda-de-Água examine the barrier effects of railways, reviewing the evidence andproviding an overview on procedures used to quantify barrier effects, with emphasison genetic methods and individual-based computer simulations. They then discussmitigation measures and their effectiveness, providing guidelines for monitoringand mitigation. In Chap. 5 (Aliens on the Move: Transportation Networks andNon-native Species), Fernando Ascensão and César Capinha examine the role ofrailways in the spread of invasive species, showing that land transportation systemshave greatly contributed to species introductions with high economic and envi-ronmental costs. They discuss measures to decrease the risk of alien speciesintroductions, paying special attention to verges and associated vegetation corri-dors. In Chap. 6 (Railway Disturbances: Types, Effects on Wildlife and MitigationMeasures), Silva Lucas and her colleagues look at biodiversity impacts caused byrailways due to noise, air, soil and water pollution, as well as soil erosion. Theyconclude that impacts are species-specific, depending largely on species traits, andthat impacts can be minimized through improvements in the railway structure andthe implementation of mitigation measures.
The second part of the book provides a set of case studies from around the worldthat illustrate the impacts of railways on wildlife and ways to reduce those impacts.Reflecting the strong interest in the topic of wildlife mortality, four chapters focuson the patterns of mortality resulting from collisions with trains and railwaystructures, each of which suggests several mitigation measures to reduce suchmortality. In Chap. 7 (Bird Collisions in a Railway Crossing a Wetland ofInternational Importance − Sado Estuary, Portugal), Carlos Godinho and colleaguesexamine the risk of aquatic bird mortality due to railway bridge crossing wetlandhabitats, by combining data from surveys on carcasses and the observation of birdmovements. They have found that this bridge had a low risk for aquatic birds, as
Preface ix

only a few dead birds were found. In addition, less than 1% of 27,000 birdmovements observed over 400 hours crossed the area of collision risk. In Chap. 8(Cross-scale Changes in Bird Behavior around a High-speed Railway: fromLandscape Occupation to Infrastructure Use and Collision Risk), Malo and col-leagues examine bird mortality on a high-speed railway line crossing a rurallandscape in central Spain. They found that the species commonly associated withrural and open spaces tended to avoid the railway, while those that are alreadyassociated with man-made structures were attracted by the railway. The latterspecies were those most exposed to train collisions; indeed, using video cameras inthe trains’ cockpits to analyze birds’ responses to incoming trains, they observedthat birds become habituated to the presence of trains, a behavior that leads toincreased mortality.
Collision with large mammals is also a matter of concern in railway ecology, andthis is dealt with in the two following chapters. In Chap. 9 (Relative Risk andVariables Associated with Bear and Ungulate Mortalities Along a Railroad in theCanadian Rocky Mountains), Dorsey and colleagues report the findings from a21-year data set of train crashes with elk (Cervus elaphus), deer (Odocoileus spp.),American black bears (Ursus americanus) and grizzly bears (U. arctos) in Banffand Yoho National Parks, Canada. They found that mortality hotspots were affectedby species abundances, train speed and the characteristics of the infrastructure. InChap. 10 (Railways and Wildlife: a Case Study of Train-Elephant Collisions inNorthern West Bengal, India), Roy and Sukumar report on the problems of elephantcollision with trains in India, describing the spatial and temporal variations inmortality and relating these to elephant behavior. They found that mortality occurmainly at night and in well-defined hotspots, that males are the most susceptible totrain collisions, and that mortality seems to be associated with the periods ofelephants raiding of crops.
The next four chapters deal with problems related to habitat loss due to therailway infrastructure and its impacts, and the loss of connectivity due to barriereffects. In Chap. 11 (Assessing Bird Exclusion Effects in a Wetland Crossed by aRailway), Carlos Godinho and colleagues examined the extent to which aquaticbirds were excluded from wetland habitats close to a railway bridge. They foundthat bird densities were similar in areas both close to and far from the bridge, andthus there were no noticeable exclusion effects on the wetland bird community. InChap. 12 (Evaluating the Impacts of a New Railway on Shorebirds: a Case Study inCentral Portugal), Tiago Múrias and colleagues addressed a similar problem, usingcomprehensive monitoring of data on bird numbers, behavior and breeding duringthe pre-construction, construction, and post-construction phases of a new railwayline. Using a Before-After-Control-Impact (BACI) design, they found that theabundance of breeding and wintering shorebirds was reduced in saltpans close tothe railway in the post-construction phase. In Chap. 14 (Fragmentation of UngulateHabitat and Great Migrations by Railways in Mongolia), Ito and colleagues eval-uate the impact of the Ulaanbaatar-Beijing Railway on the great migrations ofungulates in the largest grassland in the world − Mongolia’s Gobi-steppe ecosys-tem. They found that fencing along the railway represents a source of mortality and
x Preface

a barrier to ungulate movement that prevent the long-distance movements requiredto find food during the harsh winters of Mongolia.
The final four chapters describe novel approaches to reduce and mitigate thebiodiversity impacts of railways and also some positive impacts of railways onbiodiversity. In Chap. 15 (Railway Ecology − Experiences and Examples in theCzech Republic), Keken and Kušta provide an overview of the impacts and man-agement policies of railways in the Czech Republic. They describe the currentCzech railway network and the plans for future expansion, discussing severalmanagement options for preventing accidents with animals and mitigating otherenvironmental impacts. In Chap. 16 (Ecological Roles of Railway Verges inAnthropogenic Landscapes: a Synthesis of Five Case Studies in Northern France),Vandevelde and Penone focus on railway verges and their potential positiveimpacts on the environment. They show that verges may provide habitats for grassplants, bats, and orthopteran, as well as functional connectivity to plants, therebycounteracting some of the negative effects of large-scale urbanization. In Chap. 17(Wildlife Deterrent Methods for Railways – an Experimental Study), Seiler andOlsson discuss management options for reducing ungulate collisions with trains inSweden. They review trends in ungulate collisions with trains since 1970 and theireconomic costs, and then introduce and discuss a new crosswalk design with adeterrent system, where animals are encouraged to leave the railway shortly beforetrains arrive. Finally, in Chap. 18 (Commerce and Conservation in the Crown of theContinent), Waller describes how a partnership between a railway company, thegovernment and public stakeholders allowed the recovery of the grizzly bear (Ursusarctos) in Glacier National Park in the U.S. They describe the mortality problemthat resulted from grizzly bears feeding on grain spilled from derailed cars andbecoming habituated to the presence of trains, and how this was dealt with throughthe partnership of a range of stakeholders.
In the final Chap. 19, we wrap up the key messages of the book. We brieflyconsider the future of railway ecology and give several recommendations on how tomitigate their impacts on the environment.
We hope this book inspires scientists and practitioners to develop approaches tomake railways increasingly biodiversity-friendly. But we would also like to dedi-cate this book to those working for railway companies that have done their best toameliorate the impacts of railways on the environment and made railways oneof the most sustainable modes of transportation.
Lisboa, Portugal Luís Borda-de-ÁguaLisboa, Portugal Rafael BarrientosLisboa, Portugal Pedro BejaHalle, Germany Henrique M. Pereira
Preface xi
Acknowledgements
We would like to thank Infraestruturas de Portugal, and in particular João MoraisSarmento, Ana Cristina Martins, Cândida Osório de Castro, Graça Garcia and LuísaVales de Almeida without whom this book would not have been possible. Wewould also like to thank Sasha Vasconcelos for her willingness to help with ourconstant questions about English. Finally, we would like to thank MargaretDeignan at Springer for her invaluable help in putting this book together.
xiii

Contents
Part I Review
1 Railway Ecology . . . . . . . . . . . . . . . . . . . . . . . . . . . . . . . . . . . . . . . . . 3Luís Borda-de-Água, Rafael Barrientos, Pedro Bejaand Henrique M. Pereira
2 Current Knowledge on Wildlife Mortality in Railways . . . . . . . . . . 11Sara M. Santos, Filipe Carvalho and António Mira
3 Methods to Monitor and Mitigate WildlifeMortality in Railways . . . . . . . . . . . . . . . . . . . . . . . . . . . . . . . . . . . . . 23Filipe Carvalho, Sara M. Santos, António Mira and Rui Lourenço
4 Railways as Barriers for Wildlife: Current Knowledge . . . . . . . . . . 43Rafael Barrientos and Luís Borda-de-Água
5 Aliens on the Move: Transportation Networksand Non-native Species . . . . . . . . . . . . . . . . . . . . . . . . . . . . . . . . . . . . 65Fernando Ascensão and César Capinha
6 Railway Disturbances on Wildlife: Types,Effects, and Mitigation Measures . . . . . . . . . . . . . . . . . . . . . . . . . . . . 81Priscila Silva Lucas, Ramon Gomes de Carvalho and Clara Grilo
Part II Case Studies
7 Bird Collisions in a Railway Crossing a Wetlandof International Importance (Sado Estuary, Portugal) . . . . . . . . . . . 103Carlos Godinho, João T. Marques, Pedro Salgueiro, Luísa Catarino,Cândida Osório de Castro, António Mira and Pedro Beja
xv

8 Cross-scale Changes in Bird Behavior Around a High SpeedRailway: From Landscape Occupation to Infrastructure Useand Collision Risk . . . . . . . . . . . . . . . . . . . . . . . . . . . . . . . . . . . . . . . . 117Juan E. Malo, Eladio L. García de la Morena, Israel Hervás,Cristina Mata and Jesús Herranz
9 Relative Risk and Variables Associated with Bearand Ungulate Mortalities Along a Railroadin the Canadian Rocky Mountains. . . . . . . . . . . . . . . . . . . . . . . . . . . 135Benjamin P. Dorsey, Anthony Clevenger and Lisa J. Rew
10 Railways and Wildlife: A Case Study of Train-ElephantCollisions in Northern West Bengal, India . . . . . . . . . . . . . . . . . . . . 157Mukti Roy and Raman Sukumar
11 Assessing Bird Exclusion Effects in a Wetland Crossedby a Railway (Sado Estuary, Portugal) . . . . . . . . . . . . . . . . . . . . . . . 179Carlos Godinho, Luísa Catarino, João T. Marques, António Miraand Pedro Beja
12 Evaluating the Impacts of a New Railway on Shorebirds:A Case Study in Central Portugal (Aveiro Lagoon) . . . . . . . . . . . . . 197Tiago Múrias, David Gonçalves and Ricardo Jorge Lopes
13 Evaluating and Mitigating the Impact of a High-Speed Railwayon Connectivity: A Case Study with an Amphibian Speciesin France . . . . . . . . . . . . . . . . . . . . . . . . . . . . . . . . . . . . . . . . . . . . . . . 215Céline Clauzel
14 Habitat Fragmentation by Railways as a Barrierto Great Migrations of Ungulates in Mongolia . . . . . . . . . . . . . . . . . 229Takehiko Y. Ito, Badamjav Lhagvasuren, Atsushi Tsunekawaand Masato Shinoda
15 Railway Ecology—Experiences and Examplesin the Czech Republic . . . . . . . . . . . . . . . . . . . . . . . . . . . . . . . . . . . . . 247Z. Keken and T. Kušta
16 Ecological Roles of Railway Verges in AnthropogenicLandscapes: A Synthesis of Five Case Studiesin Northern France . . . . . . . . . . . . . . . . . . . . . . . . . . . . . . . . . . . . . . . 261J.-C. Vandevelde and C. Penone
17 Wildlife Deterrent Methods for Railways—An ExperimentalStudy . . . . . . . . . . . . . . . . . . . . . . . . . . . . . . . . . . . . . . . . . . . . . . . . . . 277Andreas Seiler and Mattias Olsson
xvi Contents

18 Commerce and Conservation in the Crown of the Continent . . . . . 293John S. Waller
Part III Conclusion
19 What’s Next? Railway Ecology in the 21st Century . . . . . . . . . . . . . 311Rafael Barrientos, Luís Borda-de-Água, Pedro Brum, Pedro Bejaand Henrique M. Pereira
Glossary . . . . . . . . . . . . . . . . . . . . . . . . . . . . . . . . . . . . . . . . . . . . . . . . . . . . 319
Contents xvii

Editors and Contributors
About the EditorsLuís Borda-de-Água is a researcher in ecology and conservation biology at CIBIO-InBIO,University of Porto (Portugal) collaborating with the Infraestructuras de Portugal BiodiversityChair. He took his Ph.D. in ecology at Imperial College, London, UK, having studied beforeelectrical engineering and physics. His background had led him to work mainly on theoretical andcomputational aspects of ecology. Presently he divides his research activity between studies onglobal biodiversity patterns and the impacts of linear infrastructures on wildlife.
Rafael Barrientos is a conservation biologist who received his Ph.D. in 2009. He has a back-groundon the impacts of linear infrastructures onwildlife, including road-kills, collisionwith power lines or thegenetics of fragmented populations. He has participated in several management projects, for instancefrom the Spanish National Parks Autonomous Agency, OAPN. Also, he has participated in purelyresearch projects inSpanish institutions like theAridZonesExperimental Station, theNationalMuseumofNaturalHistory or theCastilla-LaManchaUniversity. Since2015 hehas a postdoctoral position at theInfraestructuras de Portugal Biodiversity Chair at CIBIO-InBIO, Universidade do Porto (Portugal).
Pedro Beja is a senior researcher in ecology and conservation biology at CIBIO-InBIO,University of Porto (Portugal), where he holds since 2012 the EDP Chair in Biodiversity and leadsthe ApplEcol—Applied Population and Community Ecology research group. He has over 25 yearsof professional experience, with work carried out in the public administration, private environ-mental consultancy, academia, and research institutions. His main research interests are in the areaof biodiversity conservation in human-dominated landscapes, including agricultural, forest andfreshwater systems. He has published over one hundred scientific papers on a variety of topicsrelated to the conservation and management of biodiversity in Europe, Africa and South America.
Henrique M. Pereira is a leading expert on global biodiversity change. He has worked both as aresearcher and as a practitioner, having served as the Director of Peneda-Gerês National Park and as thecoordinator of the Portugal Millennium Ecosystem Assessment. Since 2013, he is the Professor ofBiodiversity Conservation at iDiv—German Center for Integrative Biodiversity Research of the MartinLuther University Halle-Wittenberg and holds since 2015 the Infraestruturas de Portugal BiodiversityChair at CIBIO-InBIO,Universidade doPorto (Portugal).He is theChair of theBiodiversityObservationNetwork of theGroup on Earth Observations and co-chair of the Expert Group on Scenarios andModelsfrom the Intergovernmental PlatformonBiodiversity andEcosystemServices.Hehaspublishedover onehundred scientific papers and reports on biodiversity issues.
xix

Contributors
Fernando Ascensão CIBIO/InBIO, Centro de Investigação em Biodiversidade eRecursos Genéticos, Universidade do Porto, Vairão, Portugal; CEABN/InBIO,Centro de Ecologia Aplicada “Professor Baeta Neves”, Instituto Superior deAgronomia, Universidade de Lisboa, Lisboa, Portugal
Rafael Barrientos CIBIO/InBIO, Centro de Investigação em Biodiversidade eRecursos Genéticos, Universidade do Porto, Vairão, Portugal; CEABN/InBIO,Centro de Ecologia Aplicada “Professor Baeta Neves”, Instituto Superior deAgronomia, Universidade de Lisboa, Lisboa, Portugal
Pedro Beja CIBIO/InBIO, Centro de Investigação em Biodiversidade e RecursosGenéticos, Universidade do Porto, Vairão, Portugal; CEABN/InBIO, Centro deEcologia Aplicada “Professor Baeta Neves”, Instituto Superior de Agronomia,Universidade de Lisboa, Lisboa, Portugal
Luís Borda-de-Água CIBIO/InBIO, Centro de Investigação em Biodiversidade eRecursos Genéticos, Universidade do Porto, Vairão, Portugal; CEABN/InBIO,Centro de Ecologia Aplicada “Professor Baeta Neves”, Instituto Superior deAgronomia, Universidade de Lisboa, Lisboa, Portugal
Pedro Brum Faculdade de Ciências Socias e Humanas da Universidade Nova deLisboa, Lisboa, Portugal
César Capinha Global Health and Tropical Medicine Centre (GHTM), Institutode Higiene e Medicina Tropical (IHMT), Universidade Nova de Lisboa, Lisboa,Portugal
Filipe Carvalho CIBIO/InBIO, Centro de Investigação em Biodiversidade eRecursos Genéticos, Universidade de Évora, Évora, Portugal; Department ofZoology and Entomology, School of Biological and Environmental Sciences,University of Fort Hare, Alice, South Africa
Ramon Gomes de Carvalho Centro Brasileiro de Estudos em Ecologia deEstradas, Universidade Federal de Lavras, Lavras, Brazil
Cândida Osório de Castro Direção de Engenharia e Ambiente, Infraestruturas dePortugal, Almada, Portugal
Luísa Catarino LabOr—Laboratory of Ornithology, ICAAM—Instituto deCiências Agrárias e Ambientais Mediterrânicas, University of Évora, Évora,Portugal
Céline Clauzel LADYSS, UMR 7533 CNRS, Sorbonne Paris Cité, UniversityParis-Diderot, Paris, France; TheMA, CNRS, University BourgogneFranche-Comté, Besançon Cedex, France
Anthony Clevenger Western Transportation Institute/College of Engineering,Montana State University, Bozeman, MT, USA
xx Editors and Contributors

Benjamin P. Dorsey Parks Canada, Revelstoke, BC, Canada
Eladio L. García de la Morena SECIM, Servicios Especializados de Consultoríae Investigación Medioambiental, Madrid, Spain
Carlos Godinho LabOr—Laboratory of Ornithology, ICAAM—Instituto deCiências Agrárias e Ambientais Mediterrânicas, Universidade de Évora, Évora,Portugal
David Gonçalves CIBIO/InBIO, Centro de Investigação em Biodiversidade eRecursos Genéticos, Universidade do Porto, Vairão, Portugal; Departamento deBiologia, Faculdade de Ciências, Universidade do Porto, Vairão, Portugal
Clara Grilo Centro Brasileiro de Estudos em Ecologia de Estradas, UniversidadeFederal de Lavras, Lavras, Brazil; Setor Ecologia, Departamento Biologia,Universidade Federal de Lavras, Lavras, Brazil
Jesús Herranz Terrestrial Ecology Group, Departamento de Ecología,Universidad Autónoma de Madrid, Madrid, Spain
Israel Hervás Terrestrial Ecology Group, Departamento de Ecología, UniversidadAutónoma de Madrid, Madrid, Spain
Takehiko Y. Ito Arid Land Research Center, Tottori University, Tottori, Japan
Z. Keken Department of Applied Ecology, Faculty of Environmental Sciences,Czech University of Life Sciences Prague, Suchdol, Czech Republic
T. Kušta Department of Game Management and Wildlife Biology, Faculty ofForestry and Wood Sciences, Czech University of Life Sciences Prague, Suchdol,Czech Republic
Badamjav Lhagvasuren Institute of General and Experimental Biology,Mongolian Academy of Sciences, Ulaanbaatar, Mongolia
Ricardo Jorge Lopes CIBIO/InBIO, Centro de Investigação em Biodiversidade eRecursos Genéticos, Universidade do Porto, Vairão, Portugal
Rui Lourenço LabOr—Laboratory of Ornithology, ICAAM—Instituto deCiências Agrárias e Ambientais Mediterrânicas, Universidade de Évora, Évora,Portugal
Priscila Silva Lucas Centro Brasileiro de Estudos em Ecologia de Estradas,Universidade Federal de Lavras, Lavras, Brazil
Juan E. Malo Terrestrial Ecology Group, Departamento de Ecología, UniversidadAutónoma de Madrid, Madrid, Spain
João T. Marques Unidade de Biologia da Conservação, Departamento deBiologia, Universidade de Évora, Évora, Portugal; CIBIO/InBIO, Centro deInvestigação em Biodiversidade e Recursos Genéticos, Universidade de Évora,Évora, Portugal
Editors and Contributors xxi
Cristina Mata Terrestrial Ecology Group, Departamento de Ecología,Universidad Autónoma de Madrid, Madrid, Spain
António Mira Unidade de Biologia da Conservação, Departamento de Biologia,Universidade de Évora, Évora, Portugal; CIBIO/InBIO, Centro de Investigação emBiodiversidade e Recursos Genéticos, Universidade de Évora, Évora, Portugal
Tiago Múrias CIBIO/InBIO, Centro de Investigação em Biodiversidade eRecursos Genéticos, Universidade do Porto, Vairão, Portugal
Mattias Olsson EnviroPlanning AB, Gothenburg, Sweden
C. Penone Institute of Plant Sciences, University of Bern, Bern, Switzerland
Henrique M. Pereira CIBIO/InBIO, Centro de Investigação em Biodiversidade eRecursos Genéticos, Universidade do Porto, Vairão, Portugal; CEABN/InBIO,Centro de Ecologia Aplicada “Professor Baeta Neves”, Instituto Superior deAgronomia, Universidade de Lisboa, Lisboa, Portugal; German Centre forIntegrative Biodiversity Research (iDiv) Halle-Jena-Leipzig, Leipzig, Germany
Lisa J. Rew Land Resources and Environmental Sciences, Montana StateUniversity, Bozeman, MT, USA
Mukti Roy Asian Nature Conservation Foundation, c/o Centre for EcologicalSciences, Indian Institute of Science, Bangalore, Karnataka, India
Pedro Salgueiro Unidade de Biologia da Conservação, Departamento deBiologia, Universidade de Évora, Évora, Portugal; CIBIO/InBIO, Centro deInvestigação em Biodiversidade e Recursos Genéticos, Universidade de Évora,Évora, Portugal
Sara M. Santos CIBIO/InBIO, Centro de Investigação em Biodiversidade eRecursos Genéticos, Universidade de Évora, Évora, Portugal
Andreas Seiler Department of Ecology, Swedish University of AgriculturalSciences, SLU, Riddarhyttan, Sweden
Masato Shinoda Graduate School of Environmental Studies, Nagoya University,Nagoya, Japan
Raman Sukumar Centre for Ecological Sciences, Indian Institute of Science,Bangalore, Karnataka, India
Atsushi Tsunekawa Arid Land Research Center, Tottori University, Tottori,Japan
J.-C. Vandevelde UMR 7204 (MNHN-CNRS-UPMC), Centre d’Ecologie et deSciences de la Conservation (CESCO), Paris, France
John S. Waller Glacier National Park, West Glacier, MT, USA
xxii Editors and Contributors

List of Figures
Fig. 4.1 Ideal protocol for mitigating railway barrier effects . . . . . . . . . . 57Fig. 6.1 Schematic drawing of a railway showing some measures
to minimize noise and vibration: rail fastenings; rail dampers;under-sleepers pads and noise barriers (not at scale) . . . . . . . . . 89
Fig. 6.2 Spatial responses of wildlife to railway disturbances:the length of the white bars are proportional to thedistances up to which the railway has an effect on a giventaxon while short and black bars correspond to speciesoccurrence in the railway verges . . . . . . . . . . . . . . . . . . . . . . . . 92
Fig. 7.1 Location of the Sado estuary in Portugal (a), mapof the study area showing the location of the three sectionssurveyed for bird mortality in the Variante de Alcácer”railway line (b), and detail of the section 1 crossing the Sadoriver, with the location of the three bird counting points (c) . . . 106
Fig. 7.2 Photographs illustrating aspects of the study area. Upperpanel railway crossing rice fields (São Martinho stream);middle panel bowstring railway bridge crossing the riverSado; lower panel flock of flamingos flying closeto the Sado railway bridge. . . . . . . . . . . . . . . . . . . . . . . . . . . . . 107
Fig. 7.3 Monthly number of aquatic birds observed crossing therailway bridge over the Sado River, between November 2012and September 2013. Numbers are presented separatelyfor the three sampling points covering the main habitatsavailable in the area: North (forested areas); Central (riverand wetland habitats); South (forest and wetland habitats). . . . . 110
xxiii

Fig. 7.4 Schematic drawing of the bowstring railway bridgeacross the Sado River, showing the proportion of bird crossesat different heights during one annual cycle (November 2012to September 2013). The grey section indicates the birdsflying at the heights of collision risk with circulating trains . . . 112
Fig. 8.1 Location of study site along the Madrid-Albacete HSR.Inset image shows a magnified view of the study area(boxed in main image) . . . . . . . . . . . . . . . . . . . . . . . . . . . . . . . . 119
Fig. 9.1 Map of the 134 km of the Canadian Pacific Railroad studyarea that traverses through Banff and Yoho National Parks inthe Canadian Rocky Mountains. Each analysis segment (4.86km) is shown denoted by a small perpendicular bar along therailroad. Segments with high strike risk are labeled for (E) elk,(D) deer, and (B) bears during the 21-year period (1989–2009)along the Canadian Pacific Railroad through Banff and YohoNational Parks . . . . . . . . . . . . . . . . . . . . . . . . . . . . . . . . . . . . . . 138
Fig. 9.2 Grain spill sampling method used on the rail bed. Thesampling frame (10 � 10 cm2), was randomly thrownthree times to estimate the mean density of wheat andbarley seeds within a 5 m zone . . . . . . . . . . . . . . . . . . . . . . . . . 141
Fig. 9.3 The number of train strikes (white bars) for a elk, bdeer and c bear compared to the expected number ofstrikes (grey bars a positive value) based on the abundanceof wildlife sign along each 4.86 km segment usingperpendicular transects; d compares on-track relativeabundance for bears to number of strikes. Hotspots aresegments with a strike count above the 95% confidenceinterval (grey dashed line) and high risk segments are thosewith a risk estimate significantly above 1.0 (black points anderror bars). Grey points are risk estimates not significantlydifferent from 1.0 (the number killed was close to the numberexpected based on wildlife abundance). Segments proceedwest to east, where 0 is the first 4.86 km inside the westboundary of Yoho National Park. The Field town site islocated at segment 6, the Lake Louise town site correspondsto segment 13 and the Banff town site segment 24 . . . . . . . . . . 145
Fig. 9.4 Annual train strikes for a elk, b deer and c bear along 134 kmof the Canadian Pacific Railroad through Banff and YohoNational Parks, 1989–2009 . . . . . . . . . . . . . . . . . . . . . . . . . . . . 147
xxiv List of Figures

Fig. 10.1 Temporal variation between 1974 and 2015 in the numberof train–elephant collision accidents (No inc) and in thenumber of elephants killed (ele killed) per 5-year period,in the Siliguri–Alipurduar railway, northern West Bengal,India . . . . . . . . . . . . . . . . . . . . . . . . . . . . . . . . . . . . . . . . . . . . . 163
Fig. 10.2 Temporal distribution of train–elephant collisions duringthe daily cycle in the period 2004 and 2015 (after broad gaugeconversion), in the Siliguri–Alipurduar railway, northern WestBengal, India . . . . . . . . . . . . . . . . . . . . . . . . . . . . . . . . . . . . . . . 164
Fig. 10.3 Variation in relation to season in the number of accidents(InC no) and number of elephants killed (Ele No) in collisionswith trains during 2004–2015 (after broad gauge conversion)in the Siliguri–Alipurduar railway, northern West Bengal,India . . . . . . . . . . . . . . . . . . . . . . . . . . . . . . . . . . . . . . . . . . . . . 165
Fig. 10.4 Monthly variation of railway elephant accidents(REA) between 2004 and 2015 (after broad gaugeconversion), in the Siliguri–Alipurduar railway, and in thefrequency of crop raiding (FCR) by elephants in villages. Dataon crop raiding are based on Sukumar et al. (2003) and Roy(2010) . . . . . . . . . . . . . . . . . . . . . . . . . . . . . . . . . . . . . . . . . . . . 165
Fig. 10.5 Locations of elephant–train accidents in northern West Bengalduring 1974–2002 (upper panel, a) when meter gauge was inoperation (pink stars indicate locations where accidentsoccurred) and during 2004–2015 (lower panel, b) after broadgauge conversion (red stars indicate locations whereaccidents occurred) . . . . . . . . . . . . . . . . . . . . . . . . . . . . . . . . . . 167
Fig. 10.6 Maps estimating the spatial variation in the risk of collision ofelephants with trains along the railway track in northern WestBengal based on point densities (“Susceptibility Map”; upperpanel, a) and kernel densities (lower panel, b) . . . . . . . . . . . . . 168
Fig. 10.7 Suggestions for realignment of the existing railway track fromSiliguri Junction to Alipurduar Junction to reduce the riskof train–elephant collisions in northern West Bengal. #Redline Northern sector railway track (Siliguri Junction–Alipurduar Junction). #Green line Southern sector railwaytrack (New Jalpaiguri–New Alipurduar Junction) that does notpass through any forest. #Pink lines Possible realignmentof track (Dalgaon- Falakata (A-1), Madarihat–Falakata (A-2)).#Blue dotted lines Possible realignment of proposed track(Madarihat–Alipurduar Junction (A-3) and Hamlitonganj–Damanpur (A-4)) . . . . . . . . . . . . . . . . . . . . . . . . . . . . . . . . . . . . 173
Fig. 11.1 Map of the study area in the Sado Estuary (Portugal), showingthe location of the sectors close (0–500 m) and far (500–1500m) from the railway, where wetland birds were countedbetween December 2012 and October 2015. . . . . . . . . . . . . . . . 183
List of Figures xxv

Fig. 11.2 Variation in mean densities (birds/ha) of the mostabundant wetland birds counted in sectors close (<500 m)and far (>500 m) from the railway line, in relation to seasonand level of the tidal cycle . . . . . . . . . . . . . . . . . . . . . . . . . . . . 186
Fig. 12.1 a Map of the study area in Ria de Aveiro (Portugal), showingthe location of the new railway line and the saltpans that wereimpacted by the construction and functioning of the railway(blue) and the saltpans that were used as control samplingunits (green). b Timeline of the different phases, with photosof the same railway viaduct section, also showing oneof the impacted saltpans . . . . . . . . . . . . . . . . . . . . . . . . . . . . . . 200
Fig. 12.2 Outline of the sampling rationale and parameters collectedto test for the impacts of a new railway on shorebirds breedingand wintering in saltpans of Ria de Aveiro (Portugal) . . . . . . . . 202
Fig. 12.3 Number of nests per week of Black-winged Stilt in impactedand control saltpans of Ria de Aveiro (Portugal), before(2006), during (2008–2009), and after (2011) the constructionof a new railway in the study area. . . . . . . . . . . . . . . . . . . . . . . 208
Fig. 12.4 Boxplots showing variation in the number of Black-wingedStilt nests, and nest and fledging success, in impacted andcontrol saltpans of Ria de Aveiro (Portugal), before (2006),during (2008–2009), and after (2011) the constructionof a new railway in the study area. . . . . . . . . . . . . . . . . . . . . . . 209
Fig. 13.1 Landscape (a) and ecological network of the tree frog(b) in the Burgundy-Franche-Comté region . . . . . . . . . . . . . . . . 218
Fig. 13.2 Rate of variation of the PCflux values (%) dueto the implementation of the HSR line . . . . . . . . . . . . . . . . . . . 222
Fig. 13.3 Location of ten new wildlife crossing structures maximizingconnectivity. The top left inset shows the curve of the increasein connectivity provided by new amphibian passes. Thenumbers 1–10 refer to the rank of crossings accordingto the gain in connectivity they provide. . . . . . . . . . . . . . . . . . . 223
Fig. 14.1 A herd of Mongolian gazelles moving along the Ulaanbaatar–Beijing Railway . . . . . . . . . . . . . . . . . . . . . . . . . . . . . . . . . . . . . 230
Fig. 14.2 Existing and planned railways in Mongolia and thedistributions of the Mongolian gazelle, goitered gazelle,and Asiatic wild ass. Data of the wildlife distribution weredownloaded from the IUCN red list website (http://www.iucnredlist.org). . . . . . . . . . . . . . . . . . . . . . . . . . . . . . . . . . . . . . 230
Fig. 14.3 Locations of two tracked Mongolian gazelles from 2002to 2003 in Mongolia, and the zones in which thenormalized-difference vegetation index (NDVI) was analyzed.Zones W30, W60, and W90 are 0–30, 30–60, and 60–90 kmnorthwest of the railway, respectively, and zones E30, E60,
xxvi List of Figures

and E90 are 0–30, 30–60, and 60–90 km southeastof the railway, respectively. The hatched line representsthe railway (from Ito et al. 2005) . . . . . . . . . . . . . . . . . . . . . . . 235
Fig. 14.4 Underpasses on the Ulaanbaatar–Beijing Railway . . . . . . . . . . . 236Fig. 14.5 Average normalized-difference vegetation index (NDVI) in
each zone adjacent to the railway from 17 November to 2December 2002. Error bars represent 95% confidenceintervals. See Fig. 14.3 for explanation of zone names(from Ito et al. 2005) . . . . . . . . . . . . . . . . . . . . . . . . . . . . . . . . . 237
Fig. 14.6 Movements of the tracked Mongolian gazelles: a gazellescaptured on the southwestern side of the Ulaanbaatar–BeijingRailway in 2007, and b gazelles captured on the northeasternside from 2003. The tracking continued until 2012 (from Itoet al. 2013a). . . . . . . . . . . . . . . . . . . . . . . . . . . . . . . . . . . . . . . . 238
Fig. 14.7 Monthly ratio (mean + SE) of location data within 10 kmof the anthropogenic barriers (the railway and the internationalborder fence) to all monthly location data for trackedMongolian gazelles that used areas within 10 km of thebarriers at least once during the tracking periods (n = 16;from Ito et al. 2013a) . . . . . . . . . . . . . . . . . . . . . . . . . . . . . . . . 239
Fig. 14.8 a Study area of a Mongolian gazelle carcass census conductedalong the Ulaanbaatar–Beijing Railway in June 2005 andranges of each zone. Open squares are locations of majortowns and the start- and end-points of the carcass census.The hatched line represents the railway. b Carcass numbersof Mongolian gazelles on the southwestern and northeasternsides of the Ulaanbaatar–Beijing Railway in each zone.We categorized carcasses according to whether we foundthem outside or inside railway fences (from Ito et al. 2008) . . . 240
Fig. 14.9 Carcass of a Mongolian gazelle entangled in a railway fenceof the Ulaanbaatar–Beijing Railway. . . . . . . . . . . . . . . . . . . . . . 242
Fig. 15.1 Road and railway and wildlife, overview of implicationand general way of solution. . . . . . . . . . . . . . . . . . . . . . . . . . . . 249
Fig. 15.2 Categorization of railways in the Czech Republic (locationin Europe in inset) by maximal speed . . . . . . . . . . . . . . . . . . . . 250
Fig. 15.3 Road versus railway infrastructure in the Czech Republic . . . . . 251Fig. 16.1 Location of study sites in France (left panel) and in the Paris
region (right panel) . . . . . . . . . . . . . . . . . . . . . . . . . . . . . . . . . . 262Fig. 16.2 Functional connectivity of railway verges for semi-natural
plant species. Green patches represent railway verges. Arrowsrepresent propagules movement. Circles with symbolsrepresent plant communities with highly (black), moderately(dark grey) and poorly (light grey) mobile species . . . . . . . . . . 268
List of Figures xxvii

Fig. 17.1 Trends in moose and roe deer reportedly killed on roads,on railways and through hunting. Traffic accounts forabout 10–15% of all human-caused mortality, and theproportion is increasing. Updated from Seiler et al. (2011) . . . . 278
Fig. 17.2 Reported wildlife-train collisions in Sweden during2001–2010. Source Seiler et al. (2011) . . . . . . . . . . . . . . . . . . . 280
Fig. 17.3 Annual frequencies of reported and positioned train collisionswith moose and roe deer per km of railway in Sweden during2001–2009. From Seiler et al. (2011) . . . . . . . . . . . . . . . . . . . . 282
Fig. 17.4 Upper picture train driver’s view of a fleeing moose shortlybefore collision. The picture was taken with a video dashcammounted inside the driver’s cabin. Lower picture the damagedfront of the X2000 train engine after the moose collision.Photos Jimmy Nilsson, Swedish Railways. . . . . . . . . . . . . . . . . 284
Fig. 17.5 Conceptual sketch of an experimental crosswalk: standardexclusion fences lead animals towards an opening of about 50m in width where movement detectors, thermal cameras andvideo cameras monitor the presence and behaviour of animalsand trigger the warning system when trains approach. Crushedstone or cattle guards will discourage ungulates from enteringthe fenced area. Human access to the crosswalk is prohibited.Drawing Lars Jäderberg. . . . . . . . . . . . . . . . . . . . . . . . . . . . . . . 286
Fig. 18.1 The Great Northern Environmental Stewardship Area betweenWest Glacier and East Glacier, Montana, USA . . . . . . . . . . . . . 295
Fig. 18.2 A westbound Burlington-Northern Santa Fe freight traincrossing Marias Pass . . . . . . . . . . . . . . . . . . . . . . . . . . . . . . . . . 296
Fig. 18.3 Spilled corn covers the slopes below the tracks duringcleanup of a freight train derailment near Marias Pass,Montana, USA. . . . . . . . . . . . . . . . . . . . . . . . . . . . . . . . . . . . . . 298
Fig. 18.4 A Burlington-Northern Santa Fe freight train crossesthe Sheep Cr. Trestle . . . . . . . . . . . . . . . . . . . . . . . . . . . . . . . . . 299
Fig. 18.5 An avalanche partially buries a snow shed on theBurlington-Northern Santa Fe railroad in the John F. Stevenscanyon . . . . . . . . . . . . . . . . . . . . . . . . . . . . . . . . . . . . . . . . . . . . 303
Fig. 18.6 A large cut-and-fill railroad bed completely obstructsa natural drainage in Glacier National Park . . . . . . . . . . . . . . . . 305
xxviii List of Figures

List of Tables
Table 7.1 Summary results of vertebrate mortality detectedin the “Variante de Alcácer” railway (southern Portugal),between November 2012 and October 2013 . . . . . . . . . . . . . . . 108
Table 7.2 Aquatic bird species observed most frequently crossingthe railway bridge over the Sado River, indicating the totalnumber of birds crossing and the number of crosses withinthe train collision risk zone (between the deck andthe catenary lines) . . . . . . . . . . . . . . . . . . . . . . . . . . . . . . . . . . . 111
Table 8.1 Trends in bird densities in the area traversed by the HSR,2011–2015. . . . . . . . . . . . . . . . . . . . . . . . . . . . . . . . . . . . . . . . . 122
Table 8.2 Species found making use of railway elements categorizedby registered intensity of use . . . . . . . . . . . . . . . . . . . . . . . . . . . 123
Table 8.3 Birds’ use of HSR structural elements . . . . . . . . . . . . . . . . . . . . 124Table 8.4 Species for which it was possible to define flight behavior
patterns regarding to the collision risk area of the HSR(i.e. under or between the wires of the catenary) . . . . . . . . . . . . 127
Table 8.5 Flight initiation distance (mean ± SD) of birds facingand approaching high speed trains . . . . . . . . . . . . . . . . . . . . . . . 130
Table 9.1 Description of field collected and GIS derived spatiallyvarying train and railroad design variables and thehypothesized correlation to strike rates . . . . . . . . . . . . . . . . . . . 144
Table 9.2 Variation between years and railroad segments for (a) elk,(b) deer and (c) bear along the Canadian Pacific Railroadwithin Banff and Yoho National Parks, 1989–2009. . . . . . . . . . 148
Table 9.3 Significant (p < 0.05) parameter estimates explaining trainstrike rates with elk, deer and bear . . . . . . . . . . . . . . . . . . . . . . 148
Table 10.1 Number of elephant signs (see text for list) recordedin different sectors along the railway track in northernWest Bengal (Siliguri Junction–Alipurduar Junction;see Fig. 10.7 for locations of stations) . . . . . . . . . . . . . . . . . . . . 162
xxix

Table 10.2 Age structure of the elephant population in northern WestBengal (based on Sukumar et al. 2003) and those killed intrain–elephant collisions in the Siliguri–Alipurduar railwaybetween 2004 and 2015. . . . . . . . . . . . . . . . . . . . . . . . . . . . . . . 164
Table 11.1 Number (N) and area (ha) of habitat types in relation todistance categories (<500 and >500 m) from a railway bridge,which were sampled to estimate the exclusion effects onaquatic birds in the Sado Estuary, Portugal . . . . . . . . . . . . . . . . 182
Table 11.2 Summary results of generalized mixed models (GLMM)relating bird species richness and abundances to distance(Dist) to the railway (<500 vs. >500 m) and tidal cycle(low vs. high tide), while controlling for the random effectsof sampling month and sector . . . . . . . . . . . . . . . . . . . . . . . . . . 185
Table 12.1 Summary table of the results of generalized linear mixedmodels (GLMM) used to evaluate the impact of a railwayon breeding and wintering shorebirds in saltpans of Ria deAveiro (Portugal) . . . . . . . . . . . . . . . . . . . . . . . . . . . . . . . . . . . . 206
Table 13.1 Landscape categories and cost values . . . . . . . . . . . . . . . . . . . . 219Table 16.1 The three roles of railway verges studied on selected taxa . . . . 272
xxx List of Tables

Part IReview

Chapter 1Railway Ecology
Luís Borda-de-Água, Rafael Barrientos, Pedro Bejaand Henrique M. Pereira
Abstract Railways play a major role in the global transportation system.Furthermore, railways are presently being promoted by several governments thanksto their economic and environmental advantages relative to other means of trans-portation. Although railways have clear advantages, they are not free of environ-mental problems. The objective of this book is to review, assess, and providesolutions to the impacts of railways on wildlife. We have divided the impacts ofrailways on biodiversity into four main topics: mortality, barrier effects, speciesinvasions, and environmental disturbances, with the latter ranging from noise tochemical pollution. Railways share several characteristics with roads and withpower lines when the trains are electric. Therefore, much can be learned fromstudies on the impacts of roads and power lines, taking into account, however, thatin railways, the two are often combined. Besides the similarities with roads andpower lines, railways have specific characteristics. For instance, railways havelower traffic intensity but trains usually have much higher speeds than road vehi-cles, and the electric structures in railways are typically lower than in most powerlines. Thus, railways pose specific challenges and require specific mitigationmeasures, justifying calling the study of its impacts on biodiversity “railwayecology.”
Keywords Barrier effects � Disturbances � Invasions � Linear infrastructures �Mortality � Railway ecology
L. Borda-de-Água (&) � R. Barrientos � P. Beja � H.M. PereiraCIBIO/InBIO, Centro de Investigação em Biodiversidade e Recursos Genéticos,Universidade do Porto, Campus Agrário de Vairão, Rua Padre Armando Quintas,4485-661 Vairão, Portugale-mail: [email protected]
L. Borda-de-Água � R. Barrientos � P. Beja � H.M. PereiraCEABN/InBIO, Centro de Ecologia Aplicada “Professor Baeta Neves”, Instituto Superior deAgronomia, Universidade de Lisboa, Tapada da Ajuda, 1349-017 Lisboa, Portugal
H.M. PereiraGerman Centre for Integrative Biodiversity Research (iDiv) Halle-Jena-Leipzig, DeutscherPlatz 5e, 04103 Leipzig, Germany
© The Author(s) 2017L. Borda-de-Água et al. (eds.), Railway Ecology,DOI 10.1007/978-3-319-57496-7_1
3

Introduction
The most basic definition of a railway is “a prepared track which so guides thevehicles running on it that they cannot leave the track” (Lewis 2001). According tothis definition, railways were already used by the Greeks and Romans. However,the concept of railway as we know it today—that is, rails made of iron, with trainscomposed of several wagons pulled by one or more locomotives running onspecified timetables, forming nationwide or international networks—is an inventionof the early nineteenth century (Lewis 2001).
Since its inception, the technology of rails and trains has evolved considerably.Two main forces have driven this evolution: the reduction of costs and the increasein safety (Shabana et al. 2008; Flammini 2012; Profillidis 2014). The reduction ofcosts has been achieved by increasing energy efficiency and, simultaneously,increasing the speed and size of the trains. According to the International EnergyAgency and the International Union of Railways, from 1975 until 2012, the energyused by passenger/km decreased by 62%, while the energy to transport cargo bytonne-km decreased by 46% (Railway Handbook 2015). This increase in energyefficiency was accompanied by a 60% reduction in CO2 emissions for passengerand 41% for freight transportation (Railway Handbook 2015). Three countries—China, India, and Russia, with extensive railway networks, and where associatedenvironmental impacts are likely to be important—exemplify these achievements.China boasts 60% (27,000 km) of the total high-speed lines in the world and has thelowest rate of energy consumption per passenger-km (67 kJ/passenger-km). Indiahas the lowest CO2 emissions per passenger-km (10 g CO2/passenger-km) and thelowest rate of energy consumption per tonne of goods transported(102 kJ/tonne-km). Russia has the lowest CO2 emissions per tonne of goodstransported (9 g CO2/tonne-km) (Railway Handbook 2015).
Increases in railway safety have also been substantial, not only for passengers,railway workers and freight, but also for the human populations living in thevicinity of the railways (Shabana et al. 2008; Flammini 2012; Profillidis 2014). Thesafety achieved in the railway sector is particularly impressive when compared toroad safety. According to a report by the European Railway Agency (2013), thefatality risk in the period 2008–2010 measured as the number of fatalities per billionpassenger-km is 0.156 to railway passengers and 4.450 for car occupants. In fact,following the same report, transport safety is only surpassed by the airline industrywith 0.101 fatalities per billion passenger-km.
Besides economic and safety advantages, there is general agreement that rail-ways have several environmental advantages relative to roads. We highlight two ofthem: Firstly, railways are less pollutant than roads because the metal-to-metalcontact characteristic of railways considerably reduces rolling resistance; thus, adiesel-powered train is more energy efficient than the equivalent number of roadvehicles. In addition, an electric-powered train is not a source of direct emissions ofgreenhouse gases and other air pollutants, and even indirect emissions can benegligible when the electricity is cleanly produced (Chandra and Agarwal 2007;
4 L. Borda-de-Água et al.

Profillidis 2014). Secondly, railways require less land occupancy than other meansof transportation, and land use is perhaps the main driver of biodiversity lossglobally (Pereira et al. 2012). For example, Profillidis (2014) notices that the“high-speed Paris–Lyon line (a distance of 427 km) occupies as much space as theParis airport at Roissy.” This is not a mere detail; it is already an important issue inhighly human-populated areas, and it is becoming important globally as the humanpopulation grows and pressure on available arable land increases (Profillidis 2014).
More recently, the protection of the habitats crossed by railways and theirwildlife has become a main factor to be taken into consideration when designingnew railways or maintaining existing ones (Clauzel et al. 2013; Profillidis 2014),associated with an increased societal awareness of the importance of biodiversity(Pereira et al. 2012). However, compared to other transportation systems, such asroads, less is known about the impact of railways on wildlife, as well as itsspecificities. Whereas there is a large body of research on road ecology, much lessexists on railway ecology (Popp and Boyle 2017). Therefore, as the global railwaynetwork increases, and more countries promote railways over road or air trans-portation of people and goods, we feel that a review of the state-of-knowledge inrailway ecology is needed. Railway ecology is an emerging field, but with scarce(and scattered) information about its effects on biodiversity (e.g., Dorsey et al.2015; Popp and Boyle 2017). This present book deals with the impacts of railwayson biodiversity along four main topics: wildlife mortality; habitat loss and exclusionof species from their habitats; barrier effects; and exotic species invasions andimpacts of other environmental disturbances caused by railways.
Although railway ecology shares several characteristics with road ecology, it alsohas some specificities. For instance, traffic on railways tends to be lower than onroads, but the speed of the vehicles can be much greater. Railway ecology can alsobenefit from studies on the impacts of power lines, these are present in railways whentrains are powered by electricity, but their height is usually lower than that of otherpower lines. Therefore, although railways share some characteristics with otherlinear infrastructures, they also have some particularities that warrant independentconsideration. In this book we highlight the characteristics that railways share withother linear infrastructures, identify which measures can be applied to railways, andshow what makes the impacts of railways unique, as well as the required mitigationmeasures.
The impacts of railways on wildlife have received less attention than those ofroads probably because one of its major impacts, vehicle-animal collisions, is notvisible to the general public (Wells et al. 1999; Cserkész and Farkas 2015).Ordinarily, only the train crews are aware of the animal mortality caused by col-lisions, as railway right-of-ways have typically restricted access (Wells et al. 1999).In some cases, researchers have studied the impacts caused by railways combinedwith those of roads (e.g., Vos et al. 2001; Ray et al. 2002; Proctor et al. 2005; Arenset al. 2007; Li et al. 2010), and some studies have found similar impacts of bothnetworks, namely, wildlife collisions (e.g., Cserkész and Farkas 2015). However,often only the road impacts are highlighted, probably because the road networktends to be more spatially developed than the railway network.
1 Railway Ecology 5

Frequently, roads and railways are co‐aligned along the same corridor (e.g., Proctoret al. 2005; Li et al. 2010). In fact, the co-occurrence of roads and railways is animportant aspect to have in consideration, aswildlife response to one infrastructure cancondition the response to the other. For example, in a study in the USA, Waller andServheen (2005), found that radio-collared grizzly bears (Ursus arctos) crossed ahighway-railway corridor at night, presumably to avoid high diurnal highway traffic,but when railway traffic was heavier, there was a behavior that led to higher mortalityrates on the railway thanon the road. In another study inCanada,Clevenger andWaltho(2005) found that black bears (U. americanus) and cougars (Puma concolor) tended tocross a highway along wildlife passes far from railway tracks, while wolves (Canislupus) preferred to use crossing structures close to the railway.
It is important to acknowledge the different ways that roads and railways impactwildlife. We consider the following five to be the most relevant: First (1) Trafficflow is much lower on railways, with several case studies showing that the numberof trains moving through railways per unit of time are about 0.2–1.6% of thenumber of cars moving through nearby roads (Gerlach and Musolf 2000; Wallerand Servheen 2005; Xia et al. 2007; Kušta et al. 2015); (2) railway traffic flow ischaracterized by long traffic-free intervals—in some cases there is no nighttimerailway traffic (e.g., Rodríguez et al. 1997; Pérez-Espona et al. 2008)—althoughnoise and vibrations produced by trains are higher than those produced by cars(Dorsey et al. 2015; Kociolek et al. 2011); (3) railways have lower wildlife mor-tality, possibly because of lower traffic flow (Cserkész and Farkas 2015; Kušta et al.2015), but this assertion should be taken carefully, because figures for roads may beinflated as they are far more widespread than railways (Pérez-Espona et al. 2008;Yang et al. 2011) (4) railway corridors are narrower than those of roads, whichimply lower loss of habitats when a new line is built (e.g., Gerlach and Musolf2000; Tremblay and St. Clair 2009); finally, although some maintenance practicesthat use pollutants (potential disturbers) are shared by railways and roads, likede-icing or the application of herbicides on verges, the impact of vehicles, the mostimportant source of chemical pollutants (Forman et al. 2003), is lower in railwaysbecause many trains have electric engines.
Especially interesting for our purposes are the studies comparing railway impactswith those of roads, as they highlight their similarities and differences. These dif-ferences and similarities, however, tend to be species-specific. For instance, Gerlachand Musolf (2000) found that in Germany and Switzerland, a 25-year-old highwaycontributed to genetic substructuring in bank voles (Clethrionomys glareolus), whilea 40-year-old railway and a 25-year-old country road did not. In a similar vein,railways seemed to have no strong effects on the red deer (Cervus elaphus) popu-lation’s genetic differentiation in the UK, as differentiation was the same with orwithout railways, while roads were identified as gene-flow barriers to this species(Pérez-Espona et al. 2008). Railways had a low impact is the latter example probablybecause they were not parallel to orographic barriers, they were relatively sparse, andthey had a low traffic flow (Pérez-Espona et al. 2008). In tune with the previouswork, Yang et al. (2011) found that roads contributed to the genetic isolation ofChinese populations of Przewalski’s gazelles (Procapra przewalskii), but railways
6 L. Borda-de-Água et al.
had no influence on genetic differentiation, probably because of their low traffic flowand the presence of wildlife passes. A similar result was found for roe deer(Capreolus capreolus) in Switzerland, although in this case, the authors suggestedthat the differences could be due to highways being fenced and railways not, as trafficflow was similar (Hepenstrick et al. 2012). In Canada, Tremblay and St. Clair (2009)showed that railways were more permeable to forest song bird movements than wereroads, likely due to their narrower width and lower traffic. Indeed, the authors foundthat the gap size in the vegetation was the most important factor constraining forestbird movement, especially when the gap was larger than 30 m. As a final example, intheir study of New England cottontails (Sylvilagus transitionalis) in the USA,Fenderson et al. (2014) concluded that major highways limited dispersal, whereasrailways and power lines corridors acted as dispersal facilitators.
Railways are more environmentally friendly than road vehicle transportation, butthis does not mean that their negative impacts should be ignored. Therefore, whileacknowledging that there is a wide range of situations where priority should begiven to the development of railways, or to the maintenance of existing ones, it isalso crucial to take into account the impacts on the habitats transversed by theseinfrastructures, and on the wildlife populations occurring therein. However, webelieve that these impacts can be considerably reduced once they are identified, andonce the decision-makers are willing to pursue the required mitigation measures. Inthe next chapters, we will first review the impacts of railways on biodiversity(mortality, exclusion and barrier effects, introduction and dispersal of exotic speciesand pollution) and then present several case studies with a view to identifyingproblems and proposing strategies to mitigate railways negative effects.
References
Arens, P., van der Sluis, T., van’t Westende, W. P. C., Vosman, B., Vos, C. C., & Smulders,M. J. M. (2007). Genetic population differentiation and connectivity among fragmented Moorfrog (Rana arvalis) populations in The Netherlands. Landscape Ecology, 22, 1489–1500.
Chandra, S., & Agarwal, M. M. (2007). Railway engineering. New Delhi: Oxford UniversityPress.
Clauzel, C., Girardet, X., & Foltête, J.-C. (2013). Impact assessment of a high-speed railway lineon species distribution: Application to the European tree frog (Hyla arborea) inFranche-Comté. Journal of Environmental Management, 127, 125–134.
Clevenger, A. P., & Waltho, N. (2005). Performance indices to identify attributes of highwaycrossing structures facilitating movement of large mammals. Biological Conservation, 121,453–464.
Cserkész, T., & Farkas, J. (2015). Annual trends in the number of wildlife-vehicle collisions on themain linear transport corridors (highway and railway) of Hungary. North-Western Journal ofZoology, 11, 41–50.
Dorsey, B., Olsson, M., & Rew, L. J. (2015). Ecological effects of railways on wildlife. In R. vander Ree, D. J. Smith, & C. Grilo (Eds.), Handbook of Road ecology (pp. 219–227). WestSussex: Wiley.
1 Railway Ecology 7

European Railway Agency. (2013). Intermediate report on the development of railway safety inthe European Union. http://www.era.europa.eu/document-register/documents/spr%202013%20final%20for%20web.pdf
Fenderson, L. E., Kovach, A. I., Litvaitis, J. A., O’Brien, K. M., Boland, K. M., & Jakuba, W. J.(2014). A multiscale analysis of gene flow for the New England cottontail, an imperiled habitatspecialist in a fragmented landscape. Ecology and Evolution, 4, 1853–1875.
Flammini, F. (Ed.). (2012). Railway safety, reliability, and security: Technologies and systemsengineering: Technologies and systems engineering. IGI Global.
Forman, R. T. T., Sperling, D., Bissonette, J. A., Clevenger, A. P., Cutshall, C. D., Dale, V. H.,et al. (2003). Road ecology, science and solutions. Washington, DC: Island Press.
Gerlach, G., & Musolf, K. (2000). Fragmentation of landscape as a cause for genetic subdivision inbank voles. Conservation Biology, 14, 1066–1074.
Hepenstrick, D., Thiel, D., Holderegger, R., & Gugerli, F. (2012). Genetic discontinuities in roedeer (Capreolus capreolus) coincide with fenced transportation infrastructure. Basic andApplied Ecology, 13, 631–638.
Kociolek, A. V., Clevenger, A. P., St. Clair, C. C., & Proppe, D. S. (2011). Effects of roadnetworks on bird populations. Conservation Biology, 25, 241–249.
Kušta, T., Keken, Z., Ježek, M., & Kůta, Z. (2015). Effectiveness and costs of odor repellents inwildlife-vehicle collisions: A case study in Central Bohemia, Czech Republic. TransportationResearch Part D, 38, 1–5.
Lewis, M. J. T. (2001). Railways in the Greek and Roman world. In Early railways. A selection ofpapers from the first international early railways conference (pp. 8–19).
Li, Z., Ge, Ch., Li, J., Li, Y., Xu, A., Zhou, K., et al. (2010). Ground-dwelling birds near theQinghai-Tibet highway and railway. Transportation Research Part D, 15, 525–528.
Pereira, H. M., Navarro, L. M., & Martins, I. S. (2012). Global biodiversity change: The bad, thegood, and the unknown. Annual Review of Environment and Resources, 37, 25–50.
Pérez-Espona, S., Pérez-Barbería, F. J., Mcleod, J. E., Jiggins, C. D., Gordon, I. J., & Pemberton,J. M. (2008). Landscape features affect gene flow of Scottish Highland red deer (Cervuselaphus). Molecular Ecology, 17, 981–996.
Popp, J. N., & Boyle, S. P. (2017). Railway ecology: Underrepresented in science? Basic andApplied Ecology, 19, 84–93.
Proctor, M. F., McLellan, B. N., Strobeck, C., & Barclay, R. M. R. (2005). Genetic analysisreveals demographic fragmentation of grizzly bears yielding vulnerably small populations.Proceedings of the Royal Society of London. Series B, 272, 2409–2416.
Profillidis, V. A. (2014). Railway Management and Engineering. Burlington, VT: AshgatePublishing Ltd.
Railway Handbook. (2015). Energy consumption and CO2 emissions. http://www.uic.org/IMG/pdf/iea-uic_2015-2.pdf
Ray, N., Lehmann, A., & Joly, P. (2002). Modeling spatial distribution of amphibian populations:A GIS approach based on habitat matrix permeability. Biodiversity and Conservation, 11,2143–2165.
Rodríguez, A., Crema, G., & Delibes, M. (1997). Factors affecting crossing of red foxes andwildcats through non-wildlife passages across a high-speed railway. Ecography, 20, 287–294.
Shabana, A. A., Zaazaa, K. E., & Sugiyama, H. (2008). Railroad vehicle dynamics: Acomputational approach. Boca Raton, FL: CRC Press.
Tremblay, M. A., & St. Clair, C. C. (2009). Factors affecting the permeability of transportation andriparian corridors to the movements of songbirds in an urban landscape. Journal of AppliedEcology, 46, 1314–1322.
Vos, C. C., Antonisse-De Jong, A. G., Geodharts, P. W., & Smulders, M. J. M. (2001). Geneticsimilarity as a measure for connectivity between fragmented populations of the moor frog(Rana arvalis). Heredity, 86, 598–608.
8 L. Borda-de-Água et al.

Waller, J. S., & Servheen, C. (2005). Effects of transportation infrastructure on grizzly bears innorthwestern Montana. Journal of Wildlife Management, 69, 985–1000.
Wells, P., Woods, J. G., Bridgewater, G., & Morrison, H. (1999). Wildlife mortalities on railways;Monitoring methods and mitigation strategies. In G. Evink, P. Garrett, & D. Zeigler (Eds.),Proceedings of the third international conference on wildlife ecology and transportation(pp. 237–246). Tallahassee, FL: Florida Department of Transportation.
Xia, L., Yang, Q., Li, Z., Wu, Y., & Feng, Z. (2007). The effect of the Qinghai-Tibet railway onthe migration of Tibetan antelope Pantholops hodgsonii in Hoh-xil National Nature Reserve,China. Oryx, 41, 352–357.
Yang, J., Jiang, Z., Zeng, Y., Turghan, M., Fang, H., & Li, C. (2011). Effect of anthropogeniclandscape features on population genetic differentiation of Przewalski’s Gazelle: Main role ofhuman settlement. PLoS ONE, 6, e20144.
Open Access This chapter is licensed under the terms of the Creative Commons Attribution 4.0International License (http://creativecommons.org/licenses/by/4.0/), which permits use, sharing,adaptation, distribution and reproduction in any medium or format, as long as you give appropriatecredit to the original author(s) and the source, provide a link to the Creative Commons license andindicate if changes were made.The images or other third party material in this chapter are included in the chapter’s Creative
Commons license, unless indicated otherwise in a credit line to the material. If material is notincluded in the chapter’s Creative Commons license and your intended use is not permitted bystatutory regulation or exceeds the permitted use, you will need to obtain permission directly fromthe copyright holder.
1 Railway Ecology 9

Chapter 2Current Knowledge on Wildlife Mortalityin Railways
Sara M. Santos, Filipe Carvalho and António Mira
Abstract Wildlife mortality on roads has received considerable attention in thepast years, allowing the collection of abundant data for a wide range of taxonomicgroups. On the contrary, studies of wildlife mortality on railway tracks are scarceand have focused primarily on a few large mammals, such as moose and bears.Nevertheless, many species are found as victims of collisions with trains, althoughcertain taxonomic groups, such as amphibians and reptiles, and/or small bodiedspecies are reported infrequently and their mortality is probably underestimated.However, no assessment of population impacts is known for railways.
Keywords Wildlife mortality � Railway collisions � Collision risk
Introduction
One of the most obvious impacts of railways on wildlife is direct mortality fromcollisions with trains (Davenport and Davenport 2006; Dorsey et al. 2015; Formanet al. 2003; van der Grift 1999). In addition to collisions, mortality can also occurdue to electrocution, wire strikes and rail entrapment (Dorsey et al. 2015; SCV1996). In fact, some species of small body size can become trapped between therails and die from dehydration or hunger (Budzic and Budzic 2014; Kornilev et al.
S.M. Santos (&) � F. Carvalho � A. MiraCIBIO/InBIO, Centro de Investigação em Biodiversidade e Recursos Genéticos,Universidade de Évora, Pólo de Évora, Casa do Cordovil 2º Andar,7000-890 Évora, Portugale-mail: [email protected]
A. MiraUnidade de Biologia da Conservação, Departamento de Biologia,Universidade de Évora, Mitra, 7002-554 Évora, Portugal
F. CarvalhoDepartment of Zoology and Entomology, School of Biological and Environmental Sciences,University of Fort Hare, Private Bag X1314, Alice 5700, South Africa
© The Author(s) 2017L. Borda-de-Água et al. (eds.), Railway Ecology,DOI 10.1007/978-3-319-57496-7_2
11

2006). Nevertheless, collisions are the most common cause of railway mortality(Dorsey et al. 2015).
Wildlife mortality on roads has received considerable attention thanks to abun-dant data for a wide range of taxonomic groups and different continents. By contrast,studies on wildlife mortality on railway tracks are scarce, have focused primarily onlarge mammals, and are concentrated on a few countries, such as Canada andNorway (Dorsey et al. 2015; Gundersen and Andreassen. 1998; Seiler and Helldin2006; van der Grift 1999). The mammal species receiving the most attention arefrequently the larger ones, such as moose, bears or elephants as they cause moredamage to trains, disrupt the normal operation of the train network, or hold higherconservation and economic status (Huijser et al. 2012; Rausch 1958; van der Grift1999). Here we review and discuss the mortality impacts on different taxa.
Mammal Mortality
Mortality of mammals due to train collisions can be of considerable importance. Inmultispecies surveys (Heske 2015; SCV 1996; van der Grift 1999) of all vertebraterecorded, the approximate proportion of mammals found dead on rail tracks rangesfrom 26% (Netherlands), to 36% (USA) and 38% (Spain).
Train mortality can have large impacts on mammal populations, particularly forspecies that are already endangered, species with large home ranges and low densitypopulations, and species with low reproductive rate (van der Grift and Kuijsters1998; van der Grift 1999). The highest mortality numbers are usually found atsections where rail lines intersect important mammal habitats or migration routes(Child 1983; Gundersen and Andreassen 1998; van der Grift 1999).
Many species are victims of collisions. The body size of the mammal species thatare killed varies greatly, ranging from small insectivores (as the hedgehog Erinaceuseuropaeus) and small carnivores (such as the Virginia opossum Didelphis virgini-ana), to large carnivores (such as the grizzly and brown bear Ursus arctos and theAmerican lynx Lynx canadensis), to ungulates (such as moose Alces alces and deerCervus elaphus), and even elephants (Elephas maximus) (Child 1983; Gibeau andHerrero 1998; Gibeau and Heuer 1996; Gundersen et al. 1998; Gundersen andAndreassen 1998; Heske 2015; Krofel et al. 2012; Rausch 1958; Singh et al. 2001;van der Grift and Kuijsters 1998). Still, most existing studies focus on large ungulatesand carnivores, and most lack quantitative data (van der Grift 1999).
The High Frequency of Collision with Ungulates
Train accidents with ungulates are common worldwide. From Canada and Alaska toNorway and Sweden, moose commonly intercept and travel along the rails, beingfrequently killed (Child 1983; Eriksson 2014; Gundersen and Andreassen 1998;Huijser et al. 2012; Modafferi and Becker 1997). In British Columbia, Canada, the
12 S.M. Santos et al.

annual loss of moose to train collisions in the winters between 1969 and 1982 wasestimated to range from several hundred to more than 1000 animals (Child 1983).In Norway, the number of moose killed in train collisions has increased fromca. 50 moose per year in the 1950s to a yearly average of 676 during 1990–1996.This has resulted in economic costs due to material damages and loss of income dueto the lower number of hunting licenses issued (Gundersen and Andreassen 1998).Jaren et al. (1991) estimated these costs at around $2900 per train-killed moose inNorway. On average, 87 moose are killed along the Rørosbanen railway (Norway)each year, which sums to a socio-economic loss of ca. $250,000 (Jaren et al. 1991).
Although in Alaska moose are considered common species within their range,train kills accounted for 24% of known deaths, being the second cause of death in astudied population (Modafferi and Becker 1997). During the winter of 1989–1990there was a 35% reduction of the moose population in lower Susitna Valley,Alaska, due to a combined effect of non-natural mortality and poor winter survival.Although train collisions alone were not the only reason for that reduction, theywere the main cause of non-natural mortality (61.5%; 351 individuals). There was areduction of about 70% of moose numbers along this railway between 1984 and1991, presumably due to high mortality on both the railway and the highway(Modafferi and Becker 1997).
Some behaviours can contribute to this high mortality rate on railways. Mooseannually migrate from traditional summer areas to lower elevation winter areas withsnowfall determining the onset of these seasonal movements (Child 1983).Wherever railways intercept and/or are parallel to areas occupied by moose, largeconcentrations of animals may use the right-of-way of rails. Moreover, in winterswith above average snowfall, moose use the railways as travelling routes moreoften, being more vulnerable to collisions (Child 1983; Gundersen et al. 1998;Gundersen and Andreassen 1998; Rausch 1958). About 79% of moose trainaccidents in Norway occurred from December to March, possibly due to theirmigratory behaviour (Gundersen and Andreassen 1998).
As observed by Child (1983), moose can return rapidly to train tracks even aftera collision experience. A typical fatal event occurs when the animal attempts toleave the tracks, but rapidly returns to the rail, probably because it is free of snow,and then try to escape the approaching train by running on the rail. Sometimesmoose show an aggressive behaviour, standing in front of the train and attacking thelocomotive, with fatal consequences (Child 1983).
The factors influencing moose collision risk were studied by Gundersen andAndreassen (1998) who found that trains running at night, in the morning or in theevening had a higher risk of moose collision than daytime trains. The probability ofcollision was also higher during nights of full moon. This could be partiallyexplained by the higher moose activity in those periods (Gundersen and Andreassen1998). In a parallel study, it was found that the collisions increased in winter withincreasing snow depth and ambient temperatures below 0 °C, and were located inthe outlets of side valleys (Gundersen et al. 1998). The increase in the foodavailability close to the railways due to logging activities also increased the numberof moose collisions (Gundersen et al. 1998).
2 Current Knowledge on Wildlife Mortality in Railways 13

Other ungulates are also killed frequently by trains. The elk (C. canadensis) andthe bighorn sheep (Ovis canadensis) were the most frequent victims in JasperNational Park, Canada, while deer (Odocoileus virginianus) was the most commoncasualty in Mount Robson Provincial Park, Canada (Huijser et al. 2012).In Norway, although moose is the most reported victim of railway traffic, the roedeer (Capreolus capreolus) is also a common one with 12.4% of all mammalsrecorded from 1993 to 1996, while reindeer (Rangifer tarandus) and muskox(Ovibus moshatus) are killed more infrequently, with 2.8% and 0.17% respectively(Gundersen et al. 1998). The roe deer was particularly affected in the CzechRepublic with 0.8 kills/km in 2009 (Kušta et al. 2014). In the Iberian Peninsula,although some deer and roe deer are reported to be killed by trains, the wild boar(Sus scrofa) is the most common ungulate victim (SCV 1996).
In addition, besides possible population decreases, railway kills may cause shiftsin the age structure of populations. Huggard (1993) showed that American elks inBanff National Park, Canada, whose ranges overlap roads or railways are less likelyto reach old age than animals away from these infrastructures. Additionally,Huggard (1993) also found differences in body condition of American elk predatedby wolves and animals killed on the road or railway: elks killed by wolves were insignificantly poorer condition than those killed on road or railways, suggesting anon-natural selection by trains and cars (Huggard 1993).
Train Accidents with Bears
Bears are often the most frequently reported carnivore killed by trains in CentralEurope and North America. In Montana, USA, 29 grizzly bears were killed on109 km section of a railway track between 1980 and 2002 (Waller and Servheen2005), while nine brown bears were killed on the Ljubljana–Trieste railway,Slovenia, between 1992 and 1999 (Kaczensky et al. 2003). Train accidents withbears were also reported in the Abruzzo mountains, Italy (Boscagli 1987), and inCroatia, where 70% of all traffic killed bears occurred along the Zagreb–Rijekarailway (Huber et al. 1998). In Mount Robson Provincial Park, Canada, the blackbear (U. americanus) was the carnivore with the highest mortality caused by trains,with a higher number of collisions in railways than on the highways (Huijser et al.2012). In British Columbia, Canada, 13 black bears were killed on a 15 km railwaysection between 1994 and 1996 (Munro 1997; Wells et al. 1999).
Why are so many bears killed by trains? Historically, grizzly bears have beenattracted to railways by grain leaked from trains along the tracks or that accumu-lated at sites of repeated derailments. Such concentration of food led grizzly bearsbeing struck and killed by trains at these sites (Waller and Servheen 2005).However, grain spills have been reduced through the years and recent researchsuggests that most bears struck by trains are young individuals, which are unlikelyto have acquired the behaviour of feeding on spilled grains (Kaczensky et al. 2003;Krofel et al. 2012). Some collisions happened because bears had used the railway as
14 S.M. Santos et al.

a movement route (Kaczensky et al. 2003), or were attracted by food resources inrailway verges (Gibeau and Herrero 1998; Waller and Servheen 2005). When bothrailways and highways are present, however, bears seem to cross railways mostly atnight, when highway traffic volume decreases, but when railway traffic volumeincreases (Waller and Servheen 2005). Apparently, bears have learned to avoid theperiods of higher risk in highways but in the process have become more exposed torailway collisions, as suggested by different mortality rates between the twoinfrastructures (Waller and Servheen 2005).
Even though the railways may pose significant mortality risks for bears, not allpopulations are threatened by train accidents. This is the case of Slovenian bearpopulation that appears to be increasing in spite of 6.6% of annual bear mortalitybeing caused by railway collisions (Krofel et al. 2012).
The Case of Asian Elephants
In India the railway is quite extensive and train collisions with elephants have beenidentified as a conservation concern (Deka and Sarma 2012; Singh et al. 2001).From 1987 to 2001, 18 elephants were killed in train accidents in a section of23 km of rail in the Rajaji National Park, India (Singh et al. 2001). These numbersaccounted for 45% of total elephant mortality in the studied area for the same period(Singh et al. 2001). In addition, the Indian Forest Department records show thatrailway trains were responsible for killing at least 35 elephants in the Assam regionbetween 1990 and 2006 (Deka and Sarma 2012).
Maximum elephant mortality occurred during the summer months of high tem-peratures and low rainfall. The high temperatures andwater scarcity appeared to be thedeciding factors forcing elephants to cross the rail tracks during the late dry seasonwhen water sources on the southern side of rail had dried up (Singh et al. 2001).
What About the Collisions with Other Mammal Species?
For most European countries most mammals killed in train collisions are of smallsize and efforts have been made to document all species accidents (SCV 1996; vander Grift 1999). In Netherlands, 38% of collisions comprises lagomorphs (Lepuseuropaeus and Oryctolagus cuniculus), and 30% carnivores (including the badgerMeles meles, red fox Vulpes vulpes and stoat Mustela erminea). Small percentageswere registered for ungulates (roe deer and wild boar: 9%), small insectivores(hedgehog and mole Talpa europaea: 6%) and rodents (red squirrel Sciurus vul-garis, muskrat Ondatra zibethicus and brown rat Rattus norvegicus: 4%) (van derGrift 1999). In the Czech Republic, 73.5% of the recorded collisions include roedeer, 20.4% European hare (Lepus europaeus), 4.1% wild boar and 2% red fox(Kušta et al. 2011).
2 Current Knowledge on Wildlife Mortality in Railways 15

In Spain, 18.4% of mammal casualties from trains were carnivores (excludingdomestic species), mainly fox and stone marten (Martes foina). Ungulates (mostlywild boar) and lagomorphs were also frequently killed by trains, 14.4% each (SCV1996). Bats may be also killed by trains, especially on railway tunnels and sectionsclose to old buildings, but no data are available to document this for railways (SCV1996). Information for roads indicates that bats are very difficult to detect (Santoset al. 2011). Thus, bat mortality on railways can be high but have been ignored.
In general, most reported mammal victims are common species, which suggeststhat the effects on population levels should be small for species with large andwidespread populations (van der Grift and Kuijsters 1998). However, the death of afew individuals of a rare or endangered species may further increase speciesextinction risk (van der Grift 1999).
Bird Mortality
From the assessment of bird carcasses found on railway tracks, it has been fre-quently deduced from monitoring studies that the cause of mortality was due tocollisions (Peña and Llama 1997), although collisions with the catenary, electro-cution and barotrauma induced by the train movement are also possible birdmortality causes related to the railways (SCV 1996).
The frequency of bird mortality by trains when compared to other taxonomicgroups varies from 11% (USA), to 55% (Spain) and 57% (Netherlands) (Heske2015; SCV 1996; van der Grift and Kuijsters 1998). In Chicago state, USA, mostfrequent victims were mallard duck (Anas platyrhynchos), common grackle(Quicalus quiscula) and sora (Porzana carolina), while songbirds were infrequent(Heske 2015). In the Netherlands, accidents concerned mostly swans (Cygnus spp.),ducks (family Anatidae) and coots (Fulica spp.). Gulls (family Laridae) and raptorssuch as hawks and owls were also reported frequently (van der Grift and Kuijsters1998). In Guadarrama (Spain), Peña and Llama (1997) monitored for two years thebird mortality in 8 km of railways. The tawny owl (Strix aluco) was the mostfrequent bird victim (18%), followed by the carrion crow (Corvus corone; 16%)and the little owl (Athene noctua; 9.6%). Nearly half (46.8%) of this mortalityoccurred in the summer, while much lower values (13.8 and 16%) occurred in thewinter and spring, respectively. Another report for Spanish railways (SCV 1996)also found that owls were the most common victims (22.5% of all birds). Barn owl(Tyto alba), tawny owl and little owl were the main victims, although there werealso records of eagle owl (Bubo bubo), long-eared owl (Asio otus) and scops owl(Otus scops). As in road-related night mortality, train lights are likely responsiblefor the majority of owl kills. It was observed that little owls when perched on thetrain catenary, became disoriented with the approaching train, hence increasing thelikelihood of being killed (Peña and Llama 1997; SCV 1996).
Birds of prey were also frequently registered as train casualties in Spanishrailways being 19.2% of all birds killed (SCV 1996). The most recorded species
16 S.M. Santos et al.

were the buzzard (Buteo buteo), black kite (Milvus migrans) and griffon vulture(Gyps fulvus). One possible explanation is the attractiveness of perches along thetrails and of railway verges as a hunting ground for birds of prey and owls (SCV1996; van der Grift and Kuijsters 1998). Moreover, all three species scavengeregularly the trails for food carcasses, increasing their vulnerability to collisions(SCV 1996).
In some areas, train drivers observed several partridges (Alectoris rufa) using thegravel from the track ballast or within the train track on rainy days, being thus killedaltogether (Peña and Llama 1997). This last behaviour of galliforme birds, seekingrefuge on the train tracks, has also been referred by Havlin (1987) for the commonpheasant (Phasianus colchicus).
As is often the case, for small or isolated populations the death of a few indi-viduals represents a serious risk to population decline (van der Grift and Kuijsters1998). In particular, birds of prey and owls are sensitive in this respect, even thoughsome species may be considered common. Railway traffic is the second cause ofmortality in the Netherlands for the buzzard and the kestrel (Falco tinnunculus),with 7.1 and 4.6%, respectively, of all dead birds found (van der Grift and Kuijsters1998 and references therein). For the barn owl, railway traffic is a genuine danger,as 16% of mortality in Brittany (France) was caused by trains (SCV 1996). Also, forthe little owl, 3.6% of deaths result from train accidents (van der Grift and Kuijsters1998 and references therein).
Concerning the mortality of protected birds, the Spanish train personnel referredone fatal collision with one young imperial eagle (Aquila adalberti) in a rail sectionclose to the nest, and collisions with several black vultures (Aegypius monachus)when feeding on carcasses on the rail (Peña and Llama 1997). Also, in the SwissAlps, the collisions with trains or cars were the third cause of mortality among eagleowls, accounting for 30% of the anthropogenic mortality (Schaub et al. 2010).
Not all deaths in railways are caused by train collisions. Some of the mortalityarises from the collision with the rail electric lines. This has been clearly observedin Spain for the buzzard, barn owl, eagle owl, lesser kestrel (Falco naumanni),sparrowhawk (Accipiter nisus), song thrush (Turdus philomelos), and starlings(Sturnus sp). But, still, the most frequent cause of death was train collisions (SCV1996).
Amphibian and Reptile Mortality
As stated before, most railway studies focus only on the mortality of large species(van der Grift 1999). In addition, reports on train-collisions often underestimate thetrue number of collisions, as detectability and persistence rates of carcasses arerarely estimated (see Chap. 3, and van der Grift 1999), problems that affect mainlysmall body size species (SCV 1996). Thus, there is still an important differencebetween the abundance of amphibian and reptile mortality in roads and in railways.While there are plenty of data on mortality of these taxa on roads (Beebee 2013;
2 Current Knowledge on Wildlife Mortality in Railways 17

Hels and Buchwald 2001; Carvalho and Mira 2011), records for railways are muchrarer (van der Grift and Kuijsters 1998). Unfortunately, there are no studies thatcompare detectability and persistence rates of carcasses between road and railwaysurveys, so the difference in numbers remains an open question.
Considering only the studies that aimed to survey train casualties of all species,the frequency of amphibians can reach up to 47% of all vertebrate records (Heske2015), while the records of reptiles represent ca. 4% (Spain) and 6% (USA) ofcarcasses (Heske 2015; SCV 1996). In Netherlands, for example, no carcasses ofamphibians or reptiles were ever found (van der Grift and Kuijsters 1998), while inSpain, only reptiles were recorded (SCV 1996).
In Chicago state, USA, amphibians were the most abundant taxonomic grouprecorded in train collisions (Heske 2015), mainly northern leopard frogs (Lithobatespipiens) and American toads (Bufo americanus), common species in the region.Mortalities of amphibians were particularly high after rain events, when these spe-cies are most active and are also frequently found dead on the roads (Heske 2015).
Budzic and Budzic (2014) conducted a survey specifically aimed to estimateamphibian mortality on 34 km of Polish railways. They found that three specieswere most affected by train accidents: the common toad (Bufo bufo), the commonfrog (Rana temporaria) and the green frog (Pelophylax kl. esculentus), and most ofdead individuals (77%) were adult common toads. Although mortality rates can behigh, all three species are considered common in Europe. In fact, two of the speciesaffected by railway mortality (common toad and common frog), are among the mostcommon European amphibians, for which there is also evidence of highroad-mortality (Hels and Buchwald 2001; Matos et al. 2012; Orłowski 2007).
As in roads, the spring migration (or autumn migration, in some regions) seemsto be the period of highest amphibian mortality on railway tracks, as 87% of allaccidents occurred in that season (Budzic and Budzic 2014). Yet, railway mortalityof amphibians seems to depend on animals’ physical features (such as body sizeand limb length) and should be associated with the agility of the species (Budzicand Budzic 2014). While in the case of roads, the velocity of individuals is used asa proxy for agility (Hels and Buchwald 2001), in the case of railway tracks, agilityrelates mainly to the ability to overcome obstacles (Budzic and Budzic 2014; SCV1996). Due to its physical features, the common toad was more likely to becometrapped between rails, indicating that this species (and others with similar physicalfeatures) may be more vulnerable to railway mortality (Budzic and Budzic 2014).Some species of small size may be less vulnerable because they cannot cross the railtrack (Heske 2015). However, they may be affected by railways at the level of geneflow due to barrier effects (Holderegger and Di Giulio 2010), which may be also aconservation problem.
Concerning reptile mortality, 13 snakes (4%) were recorded across the wholeSpanish railway network between 1990 and 1995. Only two species were identified:the ladder snake (Elaphe scalaris) and the Montpellier snake (Malpolon mon-spessulanus), both common reptiles in the country (SCV 1996).
The railway bed may be lethal itself for smaller animals that can become trappedbetween the rails, where they may be susceptible to predation or physiological
18 S.M. Santos et al.

stress. This is the case of railway-induced mortality of Eastern box turtles(Terrapene carolina), in the USA, that often cannot escape when trapped betweenrailway tracks. In a controlled experiment with 12 turtles, Kornilev et al. (2006)showed that most turtles clearly have the ability to escape at railway crossings,although mortality rates within the railway were still high. Notice, as well, thatwhen between railway tracks, turtles can quickly reach critically high body tem-peratures, even on relatively mild days (Kornilev et al. 2006).
How Different Is Mortality in Railways and Roads?
Only a few studies have directly compared railway and road mortality, a comparisonthat is not easy because railway impacts are more difficult to detect (SCV 1996).Considering the diversity of taxonomic groups that are frequently killed on railways,it may be surprising that trains can cause such high mortality among some species(see ungulates, for example), because, compared to cars, trains are often less fre-quent, noisier, larger and, most of the times, travel at low to medium speeds (Heske2015; Morelli et al. 2014). However, even freight trains can sometimes reach speedsclose to 200 km/h and cannot stop quickly when encountering animals on the rails.This obviously leads to high mortality numbers on railways that could be avoidedmore easily on roads (Dorsey et al. 2015; Heske 2015). Accordingly, the number ofdead bears and moose along railways often exceed death rates along roads (Belant1995; Boscagli 1987; Modafferi and Becker 1997; Waller and Servheen 2005). Onthe other hand, for other species the railways may lead to lower mortality. Forinstance, the vibrations of approaching trains can be felt along the rails and this maygive warning to some terrestrial vertebrates. This seems to be the case of snakes thatmay be warned of approaching trains by vibrations transmitted through the rails orthe ballast (Heske 2015). In addition, while the traffic on roads can be simultaneouslytwo-way, trains approach from one direction at a time, and the width of a road isgreater than the width of a railway, decreasing the vulnerability of vertebrates thatcross railways (Heske 2015). In a study that compared mortality rates between roadsand railways, it was found that railways had notably lower mortalities of songbirds,small mammals, and turtles when compared to those of roads (Heske 2015), sug-gesting that diurnal and vagile species may be more efficient at avoiding trains thanavoiding cars and trucks on busy two-way roads (Heske 2015).
Future Directions
In Spain, estimates of vertebrate mortality due to train collisions averages36.5 vertebrates/km/year (not including high speed trains; SCV 1996). Inhigh-speed railways, this estimate grows to, at least, 92 vertebrates/km/year (SCV1996). Nevertheless, in general, most of the species recorded as train casualties are
2 Current Knowledge on Wildlife Mortality in Railways 19

considered common within the adjacent natural areas (Budzic and Budzic 2014;Heske 2015; van der Grift and Kuijsters 1998). However, determining the impactsof high-speed railways is crucial because this type of railway is expanding rapidlyacross the world. We expect that the differences in noise levels, speed and thecommon fencing practices in high-speed lines promotes different impacts betweenthese and the traditional rails (Dorsey et al. 2015).
Acknowledgements We would like to thank Infraestruturas de Portugal, and in particular JoãoMorais Sarmento, Ana Cristina Martins, Cândida Osório de Castro and Graça Garcia, withoutwhich this book would not have been possible.We also would like to thank Sasha Vasconcelos for her willingness to help with our constant
questions on English.Finally, we would like to thank Margaret Deignan at Springer for her invaluable help in putting
together this book.
References
Beebee, T. J. C. (2013). Effects of road mortality and mitigation measures on amphibianpopulations: Amphibians and roads. Conservation Biology, 27, 657–668.
Belant, J. L. (1995). Moose collisions with vehicles and trains in Northeastern Minnesota. Alces,31, 1–8.
Boscagli, G. (1987). Brown bear mortality in central Italy from 1970 to 1984. InternationalConference on Bear Research and Management, 7, 97–98.
Budzic, K. A., & Budzic, K. M. (2014). A preliminary report of amphibian mortality patterns onrailways. Acta Herpetologica, 9, 103–107.
Carvalho, F., & Mira, A. (2011). Comparing annual vertebrate road kills over two time periods,9 years apart: A case study in Mediterranean farmland. European Journal Wildlife Research,57, 157–174.
Child, K. (1983). Railways and moose in the central interior of BC: A recurrent managementproblem. Alces, 19, 118–135.
Davenport, J., & Davenport, J. L. (Eds.). (2006). The ecology of transportation: Managingmobility for the environment. Dordrecht: Springer.
Deka, R. N., & Sarma, K. K. (2012). Pattern recognition based anti collision device optimized forelephant-train confrontation. IRNet Transactions on Electrical and Electronics Engineering, 1(2), 92–97.
Dorsey, B., Olsson, M., & Rew, L. J. (2015). Ecological effects of railways on wildlife. In R. vander Ree, D. J. Smith, & C. Grilo (Eds.), Handbook of road ecology (pp. 219–227). WestSussex: Wiley.
Eriksson, C. (2014). Does tree removal along railroads in Sweden influence the risk of trainaccidents with moose and roe deer? Dissertation, Second cycle, A2E. Grimsö och Uppsala:SLU, Dept. of Ecology, Grimsö Wildlife Research Station.
Forman, R. T. T., Sperling, D., Bissonette, J. A., Clevenger, A. P., Cutshall, C. D., Dale, V. H.,et al. (2003). Road ecology: Science and solutions. Washington, DC: Island Press.
Gibeau, M. L., & Herrero, S. (1998). Roads, rails and Grizzly bears in the Bow River Valley,Alberta. In G. L. Evink, P. Garrett, D. Zeigler, & J. Berry (Eds.), Proceedings of theinternational conference on wildlife ecology and transportation (pp. 104–108). FloridaDepartment of Transportation, Tallahassee, Florida, USA.
Gibeau, M. L., & Heuer, K. (1996). Effects of transportation corridors on large carnivores in theBow River Valley, Alberta. In G. L. Evink, P. Garrett, D. Zeigler, & J. Berry (Eds.),
20 S.M. Santos et al.

Proceedings of the international conference on wildlife ecology and transportation (pp. 67–79). Florida Department of Transportation, Tallahassee, Florida, USA.
Gundersen, H., & Andreassen, H. P. (1998). The risk of moose Alces alces collision: A predictivelogistic model for moose-train accidents. Wildlife Biology, 4, 103–110.
Gundersen, H., Andreassen, H. P., & Storaas, T. (1998). Spatial and temporal correlates toNorwegian moose-train collisions. Alces, 34, 385–394.
Havlin, J. (1987). On the importance of railway lines for the life of avifauna in agrocoenoses. FoliaZoologica, 36, 345–358.
Hels, T., & Buchwald, E. (2001). The effect of road kills on amphibian populations. BiologicalConservation, 99, 331–340.
Heske, E. J. (2015). Blood on the tracks: Track mortality and scavenging rate in urban naturepreserves. Urban Naturalist, 4, 1–13.
Holderegger, R., & Di Giulio, M. (2010). The genetic effects of roads: A review of empiricalevidence. Basic and Applied Ecology, 11, 522–531.
Huber, D., Kusak, J., & Frikovic, A. (1998). Traffic kills of brown bears in Gorski Kotar, Croatia.Ursus, 10, 167–171.
Huggard, D. J. (1993). Prey selectivity of wolves in Banff National Park. II. Age, sex andcondition of elk. Canadian Journal of Zoology, 71, 140–147.
Huijser, M. P., Begley, J. S., & van der Grift, E. A. (2012). Mortality and live observations ofwildlife on and along the yellowhead highway and the railroad through Jasper National Parkand Mount Robson Provincial Park, Canada. Calgary, Canada: Salmo Consulting Inc., Onbehalf of Kinder Morgan Canada.
Jaren, V., Andersen, R., Ulleberg, M., Pedersen, P., & Wiseth, B. (1991). Moose-train collisions:The effects of vegetation removal with a cost-benefit analysis. Alces, 27, 93–99.
Kaczensky, P., Knauer, F., Krze, B., Jonozovic, M., Adamic, M., & Gossow, H. (2003). Theimpact of high speed, high volume traffic axes on brown bears in Slovenia. BiologicalConservation, 111, 191–204.
Kornilev, Y., Price, S., & Dorcas, M. (2006). Between a rock and a hard place: Responses ofeastern box turtles (Terrapene carolina) when trapped between railroad tracks. HerpetologicalReviews, 37, 145–148.
Krofel, M., Jonozovič, M., & Jerina, K. (2012). Demography and mortality patterns of removedbrown bears in a heavily exploited population. Ursus, 23, 91–103.
Kušta, T., Ježek, M., & Keken, Z. (2011). Mortality of large mammals on railway tracks. ScientiaAgriculturae Bohemica, 42, 12–18.
Kušta, T., Holá, M., Keken, Z., Ježek, M., Zíka, T., & Hart, V. (2014). Deer on the railway line:Spatiotemporal trends in mortality patterns of roe deer. Turkish Journal of Zoology, 38, 479–485.
Matos, C., Sillero, N., & Argaña, E. (2012). Spatial analysis of amphibian road mortality levels innorthern Portugal country roads. Amphibia-Reptilia, 33, 469–483.
Modafferi, R. D., & Becker, E. F. (1997). Survival of radiocollared adult moose in lower Susitnariver valley, southcentral Alaska. Journal of Wildlife Management, 61, 540–549.
Morelli, F., Beim, M., Jerzak, L., Jones, D., & Tryjanowski, P. (2014). Can roads, railways andrelated structures have positive effects on birds? A review. Transportation Research Part D,30, 21–31.
Munro, R. (1997). Assessing the impact of the Trans-Canada Highway and the Canadian PacificRailway on bear movements and habitat use patterns in the Beaver Valley, British Columbia.In A. P. Clevenger & K. Wells (Eds.), Proceedings of the second roads, rails and theenvironment workshop (pp. 8–13). Parks Canada, Banff National Park, Alberta & ColumbiaMountains Institute of Applied Ecology, Revelstoke, British Coliumbia, Canada.
Orłowski, G. (2007). Spatial distribution and seasonal pattern in road mortality of the commontoad Bufo bufo in an agricultural landscape of south-western Poland. Amphibia-Reptilia, 28,25–31.
Peña, O. L., & Llama, O. P. (1997). Mortalidad de aves en un tramo de linea de ferrocarril (32pp.). Grupo Local SEO-Sierra de Guadarrama, Spain.
2 Current Knowledge on Wildlife Mortality in Railways 21

Rausch, R. A. (1958). The problem of railroad-moose conflicts in the Susitna valley. Federal aid inwildlife restoration completion reports (Vol. 12, no. 1). Alaska Resources Library &Information Services, Anchorage, Alaska, USA.
Santos, S. M., Carvalho, F., & Mira, A. (2011). How long do the dead survive on the Road?Carcass persistence probability and implications for road-kill monitoring surveys. PLoS ONE,6, e25383.
S. C. V. (1996). Mortalidad de vertebrados en líneas de ferrocarril. Documentos Técnicos deConservacion SCV 1, Sociedad Conservación Vertebrados, Madrid.
Schaub, M., Aebischer, A., Gimenez, O., Berger, S., & Arlettaz, R. (2010). Massive immigrationbalances high anthropogenic mortality in a stable eagle owl population: Lessons forconservation. Biological Conservation, 143, 1911–1918.
Seiler, A., & Helldin, J.-O. (2006). Mortality in wildlife due to transportation. In J. Davenport &J. L. Davenport (Eds.), The ecology of transportation: Managing mobility for the environment(pp. 165–189). Dordrecht: Springer.
Singh, A. K., Kumar, A., Mookerjee, A., & Menon, V. (2001). A scientific approach tounderstanding and mitigating elephant mortality due to train accidents in Rajaji NationalPark. An occasional report no 3 by Wildlife Trust of India and the International Fund forAnimal Welfare of a Rapid Action Project on understanding and mitigating the problem ofelephant mortality due to train hits.
van der Grift, E. A. (1999). Mammals and railroads: Impacts and management implications. Lutra,42, 77–98.
van der Grift, E. A., & Kuijsters, H. M. J. (1998). Mitigation measures to reduce habitatfragmentation by railway lines in the Netherlands. In G. L. Evink, P. Garrett, D. Zeigler, &J. Berry (Eds.), Proceedings of the international conference on wildlife ecology andtransportation (pp. 166–170). Florida Department of Transportation, Tallahassee, Florida,USA.
Waller, J. S., & Servheen, C. (2005). Effects of transportation infrastructure on grizzly bears innorthwestern Montana. Journal of Wildlife Management, 69, 985–1000.
Wells, P., Woods, J. G., Bridgewater, G., & Morrison, H. (1999). Wildlife mortalities on railways:Monitoring methods and mitigation strategies. Revelstoke, British Columbia. Unpublishedreport.
Open Access This chapter is licensed under the terms of the Creative Commons Attribution 4.0International License (http://creativecommons.org/licenses/by/4.0/), which permits use, sharing,adaptation, distribution and reproduction in any medium or format, as long as you give appropriatecredit to the original author(s) and the source, provide a link to the Creative Commons license andindicate if changes were made.The images or other third party material in this chapter are included in the chapter’s Creative
Commons license, unless indicated otherwise in a credit line to the material. If material is notincluded in the chapter’s Creative Commons license and your intended use is not permitted bystatutory regulation or exceeds the permitted use, you will need to obtain permission directly fromthe copyright holder.
22 S.M. Santos et al.

Chapter 3Methods to Monitor and Mitigate WildlifeMortality in Railways
Filipe Carvalho, Sara M. Santos, António Mira and Rui Lourenço
Abstract Recording wildlife mortality on railways is challenging as they havenarrow corridors and lower accessibility. To improve mitigation measures, surveysmust be systematic and their frequency depending on the targeted species traits andbiology. To obtain unbiased estimates in diverse contexts, the data should becorrected using mortality estimators. Mitigation measures must avoid that animalsremain on the tracks, as trains cannot be instantly stopped. Box culverts, amphibiantunnels, and under- or overpasses allow a safe crossing, whereas exclusion fences,olfactory repellents, sound signals and sound barriers prevent the crossing of rail-ways. Habitat management in railway verges improves the animal capability toevade trains.
Keywords Bias sources � Mitigation � Monitoring methods � Monitoring plan �Mortality estimators
Filipe Carvalho and Rui Lourenço have contributed equally to this chapter.
F. Carvalho (&) � S.M. Santos � A. MiraCIBIO/InBIO, Centro de Investigação em Biodiversidade e Recursos Genéticos,Universidade de Évora, Pólo de Évora, Casa do Cordovil 2º Andar,7000-890 Évora, Portugale-mail: [email protected]
F. CarvalhoDepartment of Zoology and Entomology, School of Biological and Environmental Sciences,University of Fort Hare, Private Bag X1314, Alice 5700, South Africa
A. MiraUnidade de Biologia da Conservação, Departamento de Biologia,Universidade de Évora, Mitra, 7002-554 Évora, Portugal
R. LourençoLabOr – Laboratório de Ornitologia, ICAAM—Instituto de Ciências Agrárias e AmbientaisMediterrânicas, Universidade de Évora, Pólo da Mitra, 7002-554 Évora, Portugal
© The Author(s) 2017L. Borda-de-Água et al. (eds.), Railway Ecology,DOI 10.1007/978-3-319-57496-7_3
23

Monitoring Wildlife Mortality in Railways: GeneralApproaches
Railway mortality can negatively affect some species. It is, therefore, crucial toaccurately monitor casualties that will reveal areas of high killing rates (i.e., hot-spots). This will allow a correct assessment of environmental factors influencinghigher mortality rates and the application of proper mitigation measures (Gunsonet al. 2011). However, most of our understanding on railway impacts comes from asmall number of studies in North America and Europe on a few species, primarilylarge mammals, such as moose and bears (e.g., Dorsey et al. 2015).
Why Is Monitoring Important?
Ideally, before implementing any linear infrastructure, it is advisable to assess itspossible impacts (e.g., vegetation removal, soil movement, noise, light pollution,etc.) in adjacent areas. In addition, species richness and abundance must berecorded to establish a baseline to identify possible conservation concerns (e.g.,extinction risk of rarer species) (van der Grift et al. 2013). This is especiallyrelevant when the infrastructure is to be placed across a natural protected area,encompassing several ecosystems (Dorsey et al. 2015). Then, during and afterconstruction, a monitoring plan aiming to measure the impact of collisions, elec-trocution, rail entrapment, use of culverts, and other aspects of the railway, iscrucial for forecasting and understanding the behavioral responses of animals livingin the vicinity (Iuell et al. 2003; van der Grift et al. 2013). Therefore, based on theresults obtained, we endeavor to set up the best mitigation solutions for eachsituation.
So far, most research and monitoring studies have assessed the use and effec-tiveness of wildlife crossing structures (Hunt et al. 1987; Rodríguez et al. 1996). Tocounteract this, we focus on the monitoring of wildlife mortality, as it is the mostvisible direct impact of linear infrastructures (van der Grift et al. 2013). Someimpacts of railways differ from those of roads for example, the casualties fromelectrocution, rail entrapment and wire strikes (Dorsey et al. 2015), which suggeststhe need for specific monitoring programs.
Designing a Wildlife Mortality Monitoring Plan for Railways
Monitoring is limited by practical considerations of cost and feasibility, so a surveyof all species is unrealistic (Rytwinski et al. 2015; van der Grift et al. 2013). In fact,costs are one of the main reasons that the state of the habitats and species crossed bya railway are often not assessed. However, regardless of the cost considerations, the
24 F. Carvalho et al.

impacts of new projected linear infrastructures must always be assessed. Thus,measures should be taken before construction starts, and then during the con-struction phases to mitigate those impacts on wild species present: this includespaying attention to fences (adequate mesh size, buried, and without holes), faunapasses, and, mainly because of amphibians, the preservation of existing ponds (Iuellet al. 2003). Usually, a monitoring plan must follow four important steps: (1) thechoice of the target species; (2) the selection of the spatio-temporal scale of thestudy; (3) the selection of methods to estimate mortality; and (4) the standardizationof the variables influencing wildlife mortality, so that they are easily replicable andcomparable (Roedenbeck et al. 2007; van der Grift et al. 2013). To achieve thesegoals, the co-operation between railway company workers, stakeholders andwildlife researchers at all stages of the monitoring plan (Iuell et al. 2003;Roedenbeck et al. 2007).
Selecting the Target Species
The selection of the species to be monitored depends on their traits (e.g., vagility,conservation status, or sensitivity to fragmentation), on features of the landscapecrossed by the railway, and on the characteristics of the railway. For instance, if therailway has overhead electric lines and pylons special care should be taken withbirds and bat species (Peña and Llama 1997; Rose and Baillie 1989; SCV 1996); ifthere is a risk of entrapment inside the rail lines, low vagile reptiles (e.g., turtles)and amphibians (e.g., toads) must be prioritized (Kornilev et al. 2006; Pelletier et al.2006).
Species that show strong responses toward linear infrastructures and traffic flow,such as carnivores and ungulates, are often selected as target species. These animalsare good models for evaluating the factors influencing mortality, because they havelarge individual territories and large daily and seasonal movements that increase theprobability of crossing and of being hit by a train (Iuell et al. 2003; van der griftet al. 2013). Some habitat specialists, like forest-dwelling ones (e.g., the tawny owlStrix aluco), should also be considered in this group as they often use specificcorridors that cross railways, thus increasing their risk of collision.
Relying on larger species (or species with high visibility) may increase thedetection probability because recording wildlife mortality on railways is oftenharder than on roads, as railways have lower accessibility, narrower corridors, lackof lateral dirt roads, and a highly variable topographic profile (Dorsey 2011; Wellset al. 1999). In addition, choosing abundant species will likely increase samplesizes, and thus the power of the analyses and some species might serve as a proxyfor rarer ones that allows obtaining crucial data that otherwise will be not possible(e.g., Roedenbeck et al. 2007).
3 Methods to Monitor and Mitigate Wildlife Mortality in Railways 25

Selecting the Spatio-Temporal Scale
The rationale for selecting the spatio-temporal scales depends on the species to bemonitored (Roedenbeck et al. 2007; van der Grift et al. 2013). Large animals withlarge home ranges and daily movements require the survey of a railway stretchlarge enough (e.g., 30 km) to reflect their spatial requirements (Iuell et al. 2003;Seiler and Helldin 2006). By contrast, if we aim to study a local amphibian pop-ulation during seasonal migrations, a 1 km railway stretch can be reasonable (Helsand Buchwald 2001). Another important issue is the habitat preference. If the targetspecies is forest-dwelling, we must focus on stretches crossing forests (Iuell et al.2003). For more general species, the railway stretch selection should cover andreflect a hierarchical distribution and abundance of the existing habitats (van derGrift et al. 2013) or, alternatively, we may choose different railway stretches, eachrepresenting a different habitat (Roedenbeck et al. 2007). If a species shows clearseasonal movements with a high probability of railway crossings at certain periodsof the year (e.g., amphibian breeding season migrations), then wildlife mortalitystudies should focus on those periods.
Estimating the Number of Casualties on Railways
After assessing the baseline situation in a given region, the following guidelines areimportant to achieve an appropriate monitoring plan. In electrified railways, besidesthe mortality due to train-collisions (almost all vertebrate groups), we also expectmortality due to overhead electric line collisions (birds and bats) and electrocutionat cables and pylons (mainly birds). Once the sources of mortality are established,we should adopt the most practical prospecting methods (e.g., on foot, on foot witha search dog, or using a motor vehicle) according to the railway features (width,train speed and volume, vegetation on verges, topography, etc.) (Dorsey et al. 2015;SCV 1996).
Counting dead animals along railways is more challenging than on roadsbecause railways often cross remote areas and their accessibility is often difficult(tunnels, steep topography, etc.) (Dorsey et al. 2015; Wells et al. 1999). Therefore,most studies report counts obtained by the transportation agency personnel, such as,train drivers and maintenance workers, who often lack wildlife experience, leadingto inaccurate identifications and underestimation of the mortality (Wells et al.1999).
An important issue is the sampling effort required in each situation to effectivelydetect patterns of causalities (Costa et al. 2015; Santos et al. 2011, 2015). Asrecommended for roads, railway surveys should be carried out early in the morning(to reduce scavenging, but see also sources of bias below), preferably by twoexperienced observers walking at specified railway stretches, one on each side ofthe rail (Peña and Llama 1997), and covering a 10 m sight strip whenever logis-tically possible. The use of a vehicle could be a better choice if parallel dirty roadsexist (at least on one side), and in cases where the surveyed stretch is too long
26 F. Carvalho et al.

(>10 km), but their detectability as proved to be lower (Garrah et al. 2015). Once acarcass is found, and depending on its state of decay, several variables should berecorded: species, age, sex, GPS location, time of day, weather conditions, positionon the railway (verges, between lines, rock ballast, etc.), and surrounding habitat(Santos et al. 2011; Wells et al. 1999).
Surveys should be systematic, but their temporal frequency depends on speciestraits and biology. For small animals such as passerines, small mammals or bats,daily surveys are needed to reduce bias on estimates due to lower carcass persis-tence time (Santos et al. 2011, 2015). Santos et al. (2011) showed in a road studythat sampling at intervals greater than one day results in the loss of 60% of thecasualties for small animals (<500 g), and reaches 73 and 85% for lizards and bats,respectively. By contrast, they found that larger animals (>500 g, e.g., birds of preyand carnivores) persist for more than two days on average, which can be used as abaseline for their monitoring (Santos et al. 2011). In order to obtain a good balanceamong costs and survey frequency, the priority should be given to the animals’activity peaks, including those during dispersal, migration, and hunting seasons(Costa et al. 2015; Stevens and Dennis 2013). After the beginning of the railwayoperations, and in order to get a good evaluation of mortality estimates, monitoringshould cover a minimum period of 3 years, so that animals adapt to the newenvironment (Iuell et al. 2003).
On electrified railways the risk of bird and bat mortality increases due to col-lisions with the overhead electric lines. Additionally, the electrocution of birds canoccur at pylons and wherever the cable isolation has flaws (Kušta et al. 2011; Peñaand Llama 1997). Because overhead electric lines are placed at the sides of the rails,animals killed by electrocution may be projected further away than those sufferingcollisions with trains, thus decreasing their detectability. Accordingly, to obtainaccurate estimates on mortality when there are electric components (overheadelectric lines and pylons), surveys should be done daily, and if possible, supportedby search dogs, as these dogs have been shown to be more efficient than humans atdetecting carcasses under power lines (73 vs. 20%) and at wind farms (Mathewset al. 2013).
Review of the Methods Used on Wildlife Mortality Surveys
Most studies addressing mortality on railways rely on incidental reports providedby the railway staff (van der Grift and Kuijsters 1998). Few have described theirmethods exhaustively (Seiler and Helldin 2006), and most do not report themonitoring frequency (e.g., Cserkész and Farkas 2015; van der Grift and Kuijsters1998), or the methodology used (Jaren et al. 1991). Typically, studies used one ofthe following survey methods:
• Surveys by rail companies’ workers and non-expert citizens
These surveys are characterized by fortuitous observations. Reports of collisions areoften done by train drivers, and occasionally by maintenance crew personnel, who
3 Methods to Monitor and Mitigate Wildlife Mortality in Railways 27

visit the railways to maintain the rails, electric components, or fences (Huijser et al.2012), thus occasionally recording casualties but without a fixed periodicity(Gundersen et al. 1998; Kušta et al. 2014; SCV 1996). Recently, to minimize biasand identify hotspots properly, some studies have used reports of train driversobtained systematically, with information on both the species and location of theaccident (Dorsey 2011; Kušta et al. 2011, 2015). However, these studies are limitedto large species, those that impede train operations and are easily observed (e.g.,Singh et al. 2001). Some studies have depended on inquiries to railway staff aboutmortality data (Huijser et al. 2012), while others use anecdotal data from inhabi-tants, forest workers, naturalists, hunters, etc. (Singh et al. 2001).
• Surveys by sidewalks along the railways
Sidewalk surveys were mainly used in systematic studies by experienced techni-cians to detect mortality hotspots (Heske 2015; Peña and Llama 1997; Wells et al.1999). Usually, these surveys aim to monitor and quantify all taxonomic groups(from small to large animals) independently of the mortality source (train collisions,entrapment in the track lines or electrocution) (Peña and Llama 1997; Wells et al.1999).
• Surveys by video vigilance
In Alaska (USA), Rea et al. (2010) used movies from the YouTube video-sharingwebsite, made mainly by employees of train companies and some anonymouspeople, to record the behavior of moose and other ungulates in the presence oftrains. The use of video vigilance devices attached to trains, or cameras set onspecific railway stretches, allowed continuous and clear recording of the animals’behavior toward trains (Kinley et al. 2003; Babińska-Werka et al. 2015). Videovigilance is particularly valuable in the winter in regions where snow cover and/orsteep embankments impede the use of other methods (Rea et al. 2010). However,this method is expensive and thus has a limited observational range, and it cannotcapture the entire vertebrate community in the railway vicinity.
Standardization of Monitoring
Studies should have standardized survey methods across different geographic areas,and combine several methods in order to reduce bias and contribute to betterestimates of mortality on railways (Iuell et al. 2003; van der Grift et al. 2013). Forinstance, railway mortality should be presented as an index, reflecting the numberof casualties/km/year, and these results should include information on samplingeffort and periodicity (Peña and Llama 1997; SCV 1996). In order to achieveconsistency in the use of similar methods over temporal and spatial scales so thatcomparisons can be made, cooperation is required, and specialized personnelshould be trained (Roedenbeck et al. 2007; Rytwinski et al. 2015).
28 F. Carvalho et al.

How to Describe and Evaluate Hotspots of Mortality
Most methods developed to identify mortality hotspots have been developed forroads (Gomes et al. 2009; Malo et al. 2004). One of the methods includes theassumption that the expected number of kills per segment (km) follows a Poissondistribution, and hotspots correspond to segments where the number of casualties ishigher than the upper 95% confidence limit of the mean (Malo et al. 2004; Santoset al. 2015). The kernel method, identifies clusters of casualties by using a movingfunction to weight points of mortality within the influence of the function by theirproximity to the location where density is being calculated (Ramp et al. 2005). Thenearest neighbour hierarchical clustering identifies groups of points based on“nearest-neighbor-method” criteria (Gomes et al. 2009). Finally, the Getis-Ord Gi*statistic identifies hotspots by adding the number of casualties associated with agiven segment of the road to the casualties of its neighboring segments, andcompares that value with an overall expected distribution (Garrah et al. 2015).Integrating the information on rail sectors with high mortality rates with GISmapping tools leads to the identification of the locations where mitigation measures(drift fences, rail passages, traffic regulation, etc.) should be applied (Costa et al.2015). After obtaining the location of mortality hotspots, it is essential to verify theaccuracy of the estimates, as overestimation can result in false hotspots (i.e., areaswrongly identified as having high mortality rates; Santos et al. 2015).
Sources of Bias in Wildlife Mortality Estimates
The reduction of mortality is one of the main aims of mitigation measures, hencehigh mortality rates and their locations need to be as accurate as possible (Guinardet al. 2012). As stated, even in systematic surveys, the number of carcasses foundlargely underestimates mortality because (1) only a subset of animals killed staywithin the area that is searched by the observer; (2) many carcasses are removed byscavengers, or decomposed until the survey occurs; and (3) some dead animalsremain undetected because of the observers failure (Korner-Nievergelt et al. 2015).Thus, to obtain unbiased estimates, the numbers obtained during surveys should becorrected by taking into account: (1) the proportion of animals killed in the areasearched; (2) carcass persistence probability; and (3) searcher efficiency. In order totake into account these sources of bias, several mortality estimators were developedin wind farm studies (Korner-Nievergelt et al. 2015) and some have been applied toroad casualties (Gerow et al. 2010; Teixeira et al. 2013), but rarely to railways,where these issues also apply.
The proportion of casualties (dead and/or injured that have not moved away)recorded at the search area can be obtained from the size and spatial distribution ofthe total area that can be searched, the spatial distribution of the carcasses, and theproportion of injured animals (still alive) that manage to move away. However, the
3 Methods to Monitor and Mitigate Wildlife Mortality in Railways 29

spatial distribution of the carcasses depends on the type of obstacle they collidedwith, the size of the animal, and the wind speed at the time of collision(Korner-Nievergelt et al. 2015). Calculating the proportion of dead animals detectedin the search area relative to the total area is rarely done because of the difficulties inestimating the variables involved (Teixeira et al. 2013).
Carcass persistence is the time a carcass stays on the rail or ground before it isremoved by scavengers or has been severely decomposed, becoming undetectableto the observers. It depends mainly on the carcass size, the abundance and activityof scavengers, and temperature and humidity (Guinard et al. 2012; Santos et al.2011).
Searcher efficiency, or detectability, is the probability that an observer actuallyfinds a carcass in the search area. Detectability depends mostly on the surveymethod used, the experience and motivation of the observer, characteristics of theground (vegetation density, ballast color), time of day, weather conditions, and typeand size of the carcass. The method used for monitoring (e.g., by vehicle or on foot)greatly influences the detectability rates. For roads, Hels and Buchwald (2001)concluded that surveys by car detected between 7 and 67% of the amphibiancarcasses that had been detected by surveys on foot and, similarly, Teixeira et al.(2013) reported a reduction in the detection rates from 1 to 27% for small and largeanimals, respectively. The observer’s experience largely determines the probabilityof detectability: nevertheless, after several hours of work (>3 h), there is a “satu-ration effect” that affects the observer performance. Motivation is also important,because a motivated observer (e.g., working on a thesis) may stop more often tocollect data and see details that otherwise would have gone undetected (PVMC2003). On railways, the color of the rock ballast is one of the main factorsinfluencing carcass detectability. Generally, smooth terrain and light colors of rockincrease detectability as does clear verges on both sides of the rail. Additionally, ifthe vegetation beyond the verge is sparse and short (or even absent), detectabilityincreases. Another crucial aspect is the accessibility of the rail line, as well as thetopography on its sides. Weather conditions also influence detection by alteringvisibility—for instance, detectability decreases on rainy or foggy days (e.g.,Mathews et al. 2013). Intrinsic characteristics of the species, such as, the size, shapeand color of a species, can compromise their identification (e.g., small carcasseswith cryptic colors are more difficult to detect). These sources of error can be takeninto account by mathematical estimators to recalculate a detectability function thatis then used to correct the observed mortality estimates (Bernardino et al. 2013;Korner-Nievergelt et al. 2015), but this is not yet common practice in railwaymortality studies.
30 F. Carvalho et al.

How to Mitigate Wildlife Mortality in Railways?
Over the last few decades, research and investment on mitigation measures toreduce wildlife mortality on roads have increased greatly (Jackson and Griffin 2000;Glista et al. 2009; Polak et al. 2014; Kociolek et al. 2015; Ward et al. 2015). Inrailways the efforts to increase wildlife safety have not been as considerable (vander Grift 1999; Dorsey et al. 2015), and these efforts have been concentrated mostlyon mitigating the impacts on existing railways, ignoring the expansion of thehigh-speed railway network (Dorsey et al. 2015). An important difference betweenroads and railways is that in the latter, the speed and trajectory of a train cannot bechanged to avoid collisions; therefore, mitigation measures must rely almostentirely on preventing the animals from entering or remaining on the train tracks.
Crossing Structures
The structures that facilitate wildlife crossing of railways can be part of the originalengineering design of the infrastructure; these include culverts or bridges over roadsor rivers, even when that was not their original purpose. At other times, thesestructures can become wildlife crossing locations with just minor adaptations, ashappens with dry ledges. Alternatively, structures can be built with the specific goalof enabling movements across the linear infrastructure, usually designated aswildlife underpasses or overpasses.
Although crossing structures contribute to mitigating both mortality and barriereffects of linear infrastructures (Dorsey et al. 2015), their main role has beenfocused on barrier effects, ensuring connectivity through the landscapes crossed byrailways and roads (Glista et al. 2009; Jackson and Griffin 2000; van der Ree et al.2008). In this book, the application of crossing structures as a mitigation measure inrailways is described in greater detail in Chap. 4. Here, we give a short descriptionof the most frequently used crossing structures, and how they may help reducewildlife mortality on railways.
Pipe culverts are small structures designed to let water flow under the railway,being regularly flooded during the rainy seasons. Pipe culverts form part of thedesign of most linear infrastructures and are sometimes used by small animals(Glista et al. 2009; Jackson and Griffin 2000). The efficiency of pipe culverts inreducing mortality would increase if it were associated with railway exclusionmethods (see section below).
Box culverts are also designed for water drainage, and being larger than pipeculverts, often remain dry except in periods of heavy run-off. Box culverts aregenerally better as crossing structures than pipe culverts (Glista et al. 2009).
Culverts can be adapted before or after construction to facilitate their use bywildlife (Clevenger and Waltho 1999; Jackson and Griffin 2000; Rodríguez et al.1996), namely by (1) including dry ledges, (2) modifying habitats at entrances,
3 Methods to Monitor and Mitigate Wildlife Mortality in Railways 31

(3) adding drift fences, (4) avoiding culverts with steep slopes and large hydraulicjumps or steps; and (5) placing culverts in dry habitats (i.e., dry drainage culverts)and not only along streams. Flooded or very steep culverts may contribute little aswildlife crossing structures. Modifying culverts for wildlife crossing can representone of the most economical measures to mitigate mortality on railways (Clevengerand Waltho 1999).
Amphibian tunnels are sometimes used in roads to facilitate crossing in areaswhere amphibians concentrate their movements (Glista et al. 2009), and they can beeasily adapted to railways. Similarly, some tunnels can be designed for reptilecrossing—reptile tunnels. Turtles and other small animals may often get caughtbetween the rails, and a simple measure to prevent their becoming trapped can bethe excavation of the rock ballast between pairs of railway sleepers, thus allowinganimals to cross below the tracks (Dorsey et al. 2015; Pelletier et al. 2006).
Wildlife underpasses facilitate animal movement under linear infrastructures,and are generally located where railways cross watercourses and roads. However,underpasses can be specifically designed to be used by animals (Glista et al. 2009;Jackson and Griffin 2000). Therefore, underpasses show considerable differences insize, and provide variable crossing facilities. Underpasses can be very large (i.e.,viaducts, expanded bridges), where railways cross large watercourses and extensivevalleys, in which it is assumed that passage for wildlife is limited, or they can berelatively small when, for example, they are only meant to allow the access of localvehicles between agricultural fields. Small underpasses may provide limited use forwildlife crossing if they are associated with roads with considerable traffic, or whenthey are completely flooded by the watercourse.
Wildlife overpasses, also called “ecoducts,” are structures mainly designed forlarge animal crossings, such as ungulates and large carnivores, and have often beenused as a mitigation measure in large highways (Jackson and Griffin 2000).Overpasses with strips of natural vegetation are referred to as “green bridges,” whilethe term “landscape connectors” is used for very wide overpasses designed tomaintain landscape connectivity (Forman et al. 2003). Overpasses are often lessconfining than underpasses, facilitating the movement of a greater number ofspecies, and they maintain ambient conditions more easily throughout the year(Glista et al. 2009; Jackson and Griffin 2000). The main drawback is their high costof construction.
Crossing structures designed specifically for wildlife use should take intoaccount the following characteristics to improve their effectiveness (Glista et al.2009). However, as different species will favor different structure design, the bestoptions must be planned for each particular case:
1. Location. The place where crossing structures are implemented is probably thesingle, most important factor for their effectiveness; thus, structures should beimplemented where animal movements are more likely (Ando 2003; Jacksonand Griffin 2000; Rodríguez et al. 1996; Yanes et al. 1995).
2. Dimensions. There is no reference size for passage structures, depending greatlyon the target species. However, passages should have a relatively large diameter
32 F. Carvalho et al.

and openness (relative width-length of underpasses) and remain dry (at leastpartially) for most of the year (Baofa et al. 2006; Jackson and Griffin 2000;Yanes et al. 1995). Some species, such as rabbits, seem to prefer underpasseswhere it is possible to see the opposite end (Rosell et al. 1997).
3. Substrate, moisture, temperature, and light. These characteristics of crossingstructures will influence their use by animals (Glista et al. 2009; Jackson andGriffin 2000; Rosell et al. 1997). The set of adequate conditions can bespecies-specific, but in general animals prefer crossing structures with a naturalsubstrate, no temperature differences, and natural light (avoiding dark or arti-ficially lit structures). Amphibians in particular require moist conditions.
4. Approaching habitat. The habitat near passing structures should be attractive toanimals; in particular, the presence of covers, or their absence, may determinethe use of crossing structures by some species (Baofa et al. 2006; Jackson andGriffin 2000; Rodríguez et al. 1996; Yanes et al. 1995).
5. Guiding structures. Fences and barrier walls guiding wildlife to crossingstructures maximize their effectiveness (Jackson and Griffin 2000). For example,in Florida, the implementation of a barrier wall in conjunction with a culvertsystem reduced the road mortality of vertebrate species (excluding hylid tree-frogs) by 94% (Dodd et al. 2004).
6. Disturbance. The use of crossing structures by humans and vehicles should bereduced as much as possible (Baofa et al. 2006; Clevenger and Waltho 2000).Noisy underpasses are likely to be avoided by more sensitive species (Jacksonand Griffin 2000).
7. Interspecific interactions. The regular use of passages by predators may dis-courage their use by potential prey species (Clevenger and Waltho 1999, 2000).Habitats frequently used by predators of the target species should then beavoided—namely, the preferred hunting grounds and core areas of the homerange of predators.
Although crossing structures can strongly contribute to reducing the mortality ofnon-flying animals, they are less effective in preventing collisions of birds and batswith trains, as these animals fly above the railway (Tremblay and St. Clair 2009).The exception to this are the large railway bridges and viaducts going overwatercourses and valleys, in which the large size of the crossing structure facilitatesthe movement of birds and bats beneath the railway (Tremblay and St. Clair 2009).
Structures that Restrict Wildlife Access to Railways
One of the most effective measures for reducing wildlife mortality in railways is theimplementation of structures that prevent crossing or, in the case of flying animals,forcing the crossing above the trains and overhead wires (Dorsey et al. 2015; Glistaet al. 2009; van der Grift 1999). However, the application of measures that restrictmovements will inevitably increase barrier effects, unless accompanied by adequate
3 Methods to Monitor and Mitigate Wildlife Mortality in Railways 33

crossing structures (Dorsey et al. 2015; Jackson and Griffin 2000; van der Grift1999). Railways have already been recognized as potential ecological barriers,namely for large mammals (Ito et al. 2013, and see also Chap. 14), a similar andcumulative effect with that of roads (see Chap. 4). Therefore, the generalized use ofbarriers along railways should be discouraged (Dorsey et al. 2015; Ito et al. 2013;Jackson and Griffin 2000). Barriers should be erected only along the stretches withhigh incidence of wildlife-train collisions, i.e., mortality hotspots.
Exclusion fences are currently considered to be the most effective means torestrict wildlife access to railways (Ito et al. 2013; van der Grift 1999) being,probably, the best cost-effective measure to mitigate wildlife mortality in the longrun (Dorsey et al. 2015). However, fences may be less effective for species capableof climbing, jumping over, or digging under them (Jackson and Griffin 2000).When fencing is used, it is crucial to provide escapes to avoid animals becomingtrapped between fences on both sides of the railway (Jackson and Griffin 2000).One-way gates or returning ramps should be regularly installed in places whereanimal crossing is more intense. Short retaining walls can be efficient barriers forreptiles, amphibians and small mammals (Jackson and Griffin 2000). While leavinga small passage close to the ground (like raising the lower wire of fences) mayreduce the barrier effect for smaller and more agile species, it still prevents theaccess of livestock to the railway (Ito et al. 2013).
Olfactory repellents consist of chemicals applied on structures or on the veg-etation along the railway (e.g., Andreassen et al. 2005; Kušta et al. 2015). The aimof olfactory repellents is to drive animals away from the structure or to keep themmore alert, and thus more prone to evade approaching trains. There are severaltypes of olfactory repellents used for scent-marking, namely synthetic products ofpredator substances (Lutz 1994; Andreassen et al. 2005). In Norway, Andreassenet al. (2005) sprayed a repellant on trees and bamboo canes at 5 m intervals alongthe railway, and found that it had an effect on reducing moose casualties, althoughwith variable efficiency. In the Czech Republic, the application of odor repellentsreduced overall animal mortality on roads and railways, but it was not effective forreptiles or amphibians (Kušta et al. 2015). In addition, repellants seem to be lesseffective at low temperatures (Castiov 1999; Kušta et al. 2015).
Sound signalling and sound-barriers can represent a promising alternativemitigation measure, especially if they do not greatly limit movements across rail-ways. Sound signalling consists of warning animals of approaching trains(Babińska-Werka et al. 2015), while sound barriers are mostly intended to keepanimals off the railway. Stationary systems can be mounted in critical areas, using amotion-activated sensor triggering an audio (and sometimes also visual) stimulus tofrighten the animals. Alternatively, stationary systems can be activated only whenthere is a train coming. Electronic systems can also be installed on the front of thetrains. Displayed sounds can be audible or ultrasonic to humans depending on thetarget species. For instance, trains equipped with ultrasonic wildlife warning con-tributed to the reduction of moose-train collisions along a railway in Canada (Muzziand Bisset 1990). Babińska-Werka et al. (2015) studied the effectiveness of anacoustic wildlife warning device in reducing casualties along railways. The sound
34 F. Carvalho et al.

sequence in their devices combined: (1) the alarm call of the jay Garrulus glan-darius; (2) the sound of a frightened brown hare Lepus europaeus; (3) a dog Canisfamiliaris growling and barking; (4) a wolf Canis lupus howling; (5) squeal of awild boar Sus scrofa; and (6) warning sounds of roe deer Capreolus capreolus(Babińska-Werka et al. 2015). These natural warning calls should promote thealerted behavior of wild animals thus increasing their escape time from oncomingtrains. The sound warning devices may be placed along critical railway stretches(e.g., in Babińska-Werka et al. 2015 they were separated by 70 m), being activatedby a signal sent by the automatic railway system in advance of a train (30 s to3 min). The use of sound signalling increased the proportion of wildlife escapingfrom the tracks, with individuals reacting faster and showing no evidence ofhabituation to the warning signals (Babińska-Werka et al. 2015). Multiple hornblasts have been used by train drivers to effectively flush animals (mostly ungu-lates) from rails (Helldin et al. 2011).
Physical barriers such as trees, diversion poles, flight diverters, or noise bar-riers, may contribute to the reduction of mortality, especially among birds (Bardet al. 2002; Jacobson 2005; Kociolek et al. 2015; Zuberogoitia et al. 2015) and bats(Ward et al. 2015). Pole barriers may represent a relatively inexpensive mitigationmeasure, as they can be effective in diverting the flight of medium- or large-sizedbirds above the poles (Zuberogoitia et al. 2015). The pole barriers used byZuberogoitia et al. (2015) consisted of: (1) gray PVC poles 2 m high and 8 cm wideregularly separated by 1 or 2 m, and some had shredded pieces of coloured paper(white or orange) attached to the top of the pole, or (ii) tree trunks (20–26 cmdiameter and 350 cm height) separated by 1 m.
Trees and other hedgerow vegetation can work as a barrier, preventing access torailways, especially to large animals, and forcing birds and bats to fly above thetrains. However, this habitat can also become a refuge or foraging site for somespecies (e.g., small birds and mammals), thus potentially working as an ecologicaltrap by attracting wildlife to the proximity of the railway.
Lighting and reflectors have been mainly tested on roads as wildlife deterrents.This mitigation measure is used mostly for nocturnal species, and may reflect thelights of vehicles or, alternatively, flash signals before an oncoming train. Lightsand reflectors may be combined with sound signalling to provide a faster response.Nevertheless, lights should not be too intense in order to avoid blinding the animals,whose reaction will probably be to stay still, thus remaining on the tracks.
Habitat and Wildlife Population Management
Lower numbers of wildlife species near railways can be achieved by controllingpopulations (e.g., selective hunting, trapping), or by habitat modification. Changesin habitat structure along railway verges may also increase animals’ capability todetect and evade the train.
3 Methods to Monitor and Mitigate Wildlife Mortality in Railways 35

Habitat management includes vegetation mowing or pruning at railway verges,or the removal of specific fruiting plants (Andreassen et al. 2005; Eriksson 2014;Jacobson 2005). Vegetation removal (forest clearing) was successfully employedalong a railway in Norway, achieving a reduction in about half the number ofmoose casualties (Andreassen et al. 2005; Jaren et al. 1991). It combined adecreased attractiveness of verges for wildlife, hence leading to animals spendingless time foraging close to railways, and higher visibility, providing a shorterreaction time by animals. However, Helldin et al. (2011) and Eriksson (2014) foundthe opposite effect, suggesting that tree-clearing may increase moose and roe deertrain collisions in Sweden, as areas cleared after mowing offer attractive foragingopportunities for some species. In another study using Before-After-Control-Impact(BACI), tree clearance had no effect on the frequency of wildlife collisions(Eriksson 2014). Helldin et al. (2011) showed that vegetation management requiresregular maintenance; otherwise, mortality may return to previous levels after plantgrowth. These authors mention that tree-clearance can reduce collisions if appliedfrequently, but it can increase collisions if applied at intervals greater than 3–4years. Finally, it is relevant to mention that habitat management (vegetationremoval) can limit the movements of some species, hence increasing barrier effects;for example, small vertebrates are generally reluctant to cross large open spaces dueto greater exposure to predators (Hunt et al. 1987; Yanes et al. 1995).
Population control of a particular species may sometimes be used to reduce itsnumbers near railways. This method should only be applied on very commonspecies, or those that can compromise human safety due to collisions. This methodhas been used to prevent collision with vehicles on roads (Glista et al. 2009), but itsuse in railways may not be as necessary since most animals will not affect trains’movements.
Supplemental feeding stations placed far from railways may influence animalmovement, keeping animals away from linear infrastructures and thus contributingto reducing mortality (Andreassen et al. 2005; Wood and Wolfe 1988).
Reducing Train Speed
Greater speeds are undoubtedly associated with a greater risk of wildlife mortalityon roads as well as on, railways (e.g., Cserkész and Farkas 2015; Frikovic et al.1987). Thus, train speed moderation, at least at critical points (mortality hotspots)and during periods of higher crossing movements (e.g., migration), should con-tribute to reducing animal mortality, as slower trains have fewer collisions (Beckerand Grauvogel 1991; Belant 1995).
36 F. Carvalho et al.

Collision and Electrocution in Overhead Wires
Flying animals may collide or be electrocuted in the overhead wires that provideelectrical energy to trains—the catenary (SCV 1996). Thus, specific mitigationmeasures should be taken whenever high levels of mortality are expected oridentified. These measures are similar to those used to prevent collision and elec-trocution in powerlines (Bevanger 1994; Barrientos et al. 2011). Additionally, thetubular poles often used to support the overhead wires can cause death if uncapped,especially among cavity nesting birds (Malo et al. 2016). The compulsory use ofcapped poles can easily avoid this problem, since it prevents birds from fallinginside the poles.
Evaluating the Effectiveness of Mortality MitigationMeasures
Along with adequate planning for railway corridors, which accounts for theexpected impacts on wildlife, another fundamental and final step to reduce thenegative effects of railways is a thorough evaluation of the effectiveness of themitigation measures (Grilo et al. 2010; Glista et al. 2009; van der Grift et al. 2013).Poor mitigation measures, which do little to reduce wildlife mortality, represent awaste of valuable resources. Moreover, some structures may reduce animalmovement, disrupt landscape connectivity, or have negative implications for ero-sion and grazing.
Guidelines for evaluating the effectiveness of road mitigation measures havebeen proposed for roads (van der Grift et al. 2013; Rytwinski et al. 2015; van derGrift and van der Ree 2015), but since no similar research has been done specifi-cally for railways, one can consider the guidelines for roads as a starting point.
Step 1 Identify the species requiring mitigation measures and determine thespecific goals for them.
Step 2 Select the species (from the targeted species list) that will be used forevaluation.
Step 3 Select the best measures of interest, i.e., those that are most closely relatedto the aim of the mitigation (e.g., casualty rate, number of crossings,population trend).
Step 4 Select the adequate study design, including a spatial and temporalsampling strategy. Whenever possible, the best study design is a replicatedBACI at mitigation sites (where measures were taken) and control sites(with similar characteristics but where no mitigation measures wereapplied).
Step 5 Determine the best sampling scheme, including the number of sites, thefrequency of visits, the monitoring methods, and the number of replicates.
3 Methods to Monitor and Mitigate Wildlife Mortality in Railways 37

Step 6 Select the appropriate sites, both mitigated and control. This includeschoosing the best spatial scale for the evaluation study.
Step 7 Select the best covariates to measure (e.g., railway characteristics, type offences, type of culvert, presence of noise barriers, human disturbance,presence of vegetation on verges, train speed, surrounding landscapecharacteristics).
Step 8 Select the most suitable survey methods, namely preferring methods thatmonitor several species simultaneously, and choosing ways to reduce bias.
Step 9 Determine the costs and feasibility of the evaluation study, and act inagreement by implementing the necessary adaptations.
It is crucial to do a research-based evaluation of the success of mitigationmeasures, which should be of a broad scope that includes wildlife mortality andmovements, landscape constraints, and safety. Finally, as indirect ecological con-sequences of many mitigation measures are poorly understood and often neglected,they should be taken into account in the overall evaluation process of theireffectiveness.
Acknowledgments S.M. Santos and R. Lourenço were supported by post-doctoral Grants of theFundação para a Ciência e Tecnologia (FCT; SFRH/BPD/70124/2010 and SFRH/BPD/78241/2011,respectively).
References
Ando, C. (2003). The relationship between deer-train collisions and daily activity of the sika deer,Cervus nippon. Mammal Study, 28, 135–143.
Andreassen, H. P., Gundersen, H., & Storaasthe, T. (2005). The effect of scent-marking, forestclearing and supplemental feeding on moose-train collisions. Journal of Wildlife Management,69, 1125–1132.
Babińska-Werka, J., Krauze-Gryz, D., Wasilewski, M., & Jasińska, K. (2015). Effectiveness of anacoustic wildlife warning device using natural calls to reduce the risk of train collisions withanimals. Transportation Research D, 38, 6–14.
Baofa, Y., Huyin, H., Yili, Z., Le, Z., & Wanhong, W. (2006). Influence of the Qinghai-Tibetanrailway and highway on the activities of wild animals. Acta Ecologica Sinica, 26, 3917–3923.
Bard, A. M., Smith, H. T., Egensteiner, E. D., Mulholland, R., Harber, T. V., Heath, G. W., et al.(2002). A simple structural method to reduce road-kills of royal terns at bridge sites. WildlifeSociety Bulletin, 30, 603–605.
Barrientos, R., Alonso, J. C., Ponce, C., & Palacín, C. (2011). Meta-analysis of the effectiveness ofmarked wire in reducing avian collisions with power lines. Conservation Biology, 25, 893–903.
Becker, E. F., & Grauvogel, C. A. (1991). Relationship of reduced train speed on moose-traincollisions in Alaska. Alces, 27, 161–168.
Belant, J. L. (1995). Moose collisions with vehicles and trains in Northeastern Minnesota. Alces,31, 1–8.
Bernardino, J., Bispo, R., Costa, H., & Mascarenhas, M. (2013). Estimating bird and bat fatality atwind farms: A practical overview of estimators, their assumptions and limitations. New ZelandJournal of Zoology, 40, 63–74.
38 F. Carvalho et al.

Bevanger, K. (1994). Bird interactions with utility structures: Collision and electrocution, causesand mitigating measures. Ibis, 136, 412–425.
Castiov, F. (1999). Testing potential repellents for mitigation of vehicle-induced mortality of wildungulates in Ontario. Ph.D. thesis Dissertation, Laurentian University, Sudbury.
Clevenger, A. P., & Waltho, N. (1999). Dry drainage culvert use and design considerations forsmall- and medium-sized mammal movement across a major transportation corridor. In G.L. Evink, P. Garrett, & D. Zeigler (Eds.), Proceedings of the third international conference onwildlife ecology and transportation (pp. 263–277). Tallahassee, FL: Florida Department ofTransportation.
Clevenger, A. P., & Waltho, N. (2000). Factors influencing the effectiveness of wildlifeunderpasses in Banff National Park, Alberta, Canada. Conservation Biology, 14, 47–56.
Costa, A. S., Ascensão, F., & Bager, A. (2015). Mixed sampling protocols improve thecost-effectiveness of roadkill surveys. Biodiversity and Conservation, 24, 2953–2965.
Cserkész, T., & Farkas, J. (2015). Annual trends in the number of wildlife-vehicle collisions on themain linear transport corridors (highway and railway) of Hungary. North-Western Journal ofZoology, 11, 41–50.
Dodd, C. K., Jr., Barichivich, W. J., & Smith, L. L. (2004). Effectiveness of a barrier wall andculverts in reducing wildlife mortality on a heavily traveled highway in Florida. BiologicalConservation, 118, 619–631.
Dorsey, B. (2011). Factors affecting bear and ungulate mortalities along the Canadian PacificRailroad through Banff and Yoho National Parks. Master’s thesis, Montana State University.
Dorsey, B., Olsson, M., & Rew, L. J. (2015). Ecological effects of railways on wildlife. In R. vander Ree, D. J. Smith, & C. Grilo (Eds.), Handbook of road ecology (pp. 219–227). WestSussex: Wiley.
Eriksson, C. (2014). Does tree removal along railroads in Sweden influence the risk of trainaccidents with moose and roe deer? Dissertation, Second cycle, A2E. Grimsö och Uppsala:SLU, Department of Ecology, Grimsö Wildlife Research Station.
Forman, R. T. T., Sperling, D., Bissonette, J. A., Clevenger, A. P., Cutshall, C. D., Dale, V. H.,et al. (2003). Road ecology: Science and solutions. Washington, DC: Island Press.
Frikovic, A., Ruff, R. L., Cicnjak, L., & Huber, D. (1987). Brown bear mortality during 1946–85in Gorski Kotar, Yugoslavia. In International conference on bear research and management(Vol. 7, pp. 87–92).
Garrah, E., Danby, R. K., Eberhardt, E., Cunnington, G. M., & Mitchell, S. (2015). Hot spots andhot times: Wildlife road mortality in a regional conservation corridor. EnvironmentalManagement, 56, 874–889.
Gerow, K., Kline, N. C., Swann, D. E., & Pokorny, M. (2010). Estimating annual vertebratemortality on roads at Saguaro National Park, Arizona. Human and Wildlife Interactions, 4,283–292.
Glista, D. J., DeVault, T. L., & DeWoody, J. A. (2009). A review of mitigation measures forreducing wildlife mortality on roadways. Landscape and Urban Planning, 91, 1–7.
Gomes, L., Grilo, C., Silva, C., & Mira, A. (2009). Identification methods and deterministic factorsof owl roadkill hotspot locations in Mediterranean landscapes. Ecological Research, 24, 355–370.
Grilo, C., Bisonette, J. A., & Cramer, P. C. (2010). Mitigation measures to reduce impacts onbiodiversity. In S. R. Jones (Ed.), Highways: Construction, management, and maintenance(pp. 73–114). Hauppauge: Nova Science Publishers.
Guinard, E., Julliard, R., & Bardraud, C. (2012). Motorways and bird traffic casualties: Carcasssurveys and scavenging bias. Biological Conservation, 147, 40–51.
Gundersen, H., Andreassen, H. P., & Storaas, T. (1998). Spatial and temporal correlates toNorwegian moose-train collisions. Alces, 34, 385–394.
Gunson, K. E., Mountrakis, G., & Quackenbush, L. J. (2011). Spatial wildlife-vehicle collisionmodels: A review of current work and its application to transportation mitigation projects.Journal of Environmental Management, 92, 1074–1082.
3 Methods to Monitor and Mitigate Wildlife Mortality in Railways 39

Helldin, J. O., Seiler, A., Olsson, M., & Norin, H. (2011). Klövviltolyckor på järnväg:kunskapsläge, problemanalys och åtgärdsförslag. Ungulate-train collisions in Sweden—review, GIS-analyses and train-drivers experiences (in Swedish). Sweden: Trafikverket.
Hels, T., & Buchwald, E. (2001). The effect of road kills on amphibian populations. BiologicalConservation, 99, 331–340.
Heske, E. J. (2015). Blood on the tracks: Track mortality and scavenging rate in urban naturepreserves. Urban Naturalist, 4, 1–13.
Huijser, M. P., Begley, J. S., & van der Grift, E. A. (2012). Mortality and live observations ofwildlife on and along the Yellowhead Highway and the Railroad through Jasper National Parkand Mount Robson Provincial Park, Canada. Salmo Consulting Inc., On behalf of KinderMorgan Canada, Calgary, Canada.
Hunt, A., Dickens, H. J., & Whelan, R. J. (1987). Movement of mammals through tunnels underrailway lines. Australian Zoology, 24, 89–93.
Ito, T. Y., Lhagvasuren, B., Tsunekawa, A., Shinoda, M., Takatsuki, S., Buuveibaatar, B., et al.(2013). Fragmentation of the habitat of wild ungulates by anthropogenic barriers in Mongolia.PLoS ONE, 8, e56995.
Iuell, B., Bekker, G. J., Cuperus, R., Dufek, J., Fry, G., Hicks, C., et al. (2003).Wildlife and traffic:A European handbook for identifying conflicts and designing solutions. Utrecht: KNNVNatural History Publishers.
Jackson, S. D., & Griffin, C. R. (2000). A strategy for mitigating highway impacts on wildlife.In T. A. Messmer & B. West (Eds.), Wildlife and highways: Seeking solutions to an ecologicaland socio-economic dilemma (pp. 143–159). Bethesda: The Wildlife Society.
Jacobson, S. L. (2005).Mitigation measures for highway-caused impacts to birds. PSW-GTR-191.USDA Forest Service General Technical Report.
Jaren, V., Andersen, R., Ulleberg, M., Pedersen, P., & Wiseth, B. (1991). Moose-train collisions:The effects of vegetation removal with a cost-benefit analysis. Alces, 27, 93–99.
Kinley, T. A., Page, H. N., & Newhouse, N. J. (2003). Use of infrared camera video footage froma wildlife protection system to assess collision-risk behavior by deer in Kootenay NationalPark, British Columbia. Invermere, BC: Sylvan Consulting Ltd.
Kociolek, A., Grilo, C., & Jacobson, S. (2015). Flight doesn’t solve everything: Mitigation of roadimpacts on birds. In R. van der Ree, D. J. Smith, & C. Grilo (Eds.), Handbook of road ecology(pp. 281–289). West Sussex: Wiley.
Korner-Nievergelt, F., Behr, O., Brinkmann, R., Etterson, M. A., Huso, M. M. P., Dalthorp, D.,et al. (2015). Mortality estimation from carcass searches using the R-package carcass—Atutorial. Wildlife Biology, 21, 30–43.
Kornilev, Y., Price, S., & Dorcas, M. (2006). Between a rock and a hard place: Responses ofeastern box turtles (Terrapene carolina) when trapped between railroad tracks. HerpetologicalReviews, 37, 145–148.
Kušta, T., Holá, M., Keken, Z., Ježek, M., Zíka, T., & Hart, V. (2014). Deer on the railway line:Spatiotemporal trends in mortality patterns of roe deer. Turkish Journal of Zoology, 38, 479–485.
Kušta, T., Ježek, M., & Keken, Z. (2011). Mortality of large mammals on railway tracks. ScientiaAgriculturae Bohemica, 42, 12–18.
Kušta, T., Keken, Z., Ježek, M., & Kůta, Z. (2015). Effectiveness and costs of odor repellents inwildlife-vehicle collisions: A case study in Central Bohemia, Czech Republic. TransportationResearch Part D, 38, 1–5.
Lutz, W. (1994). Trial results of the use of a “Duftzaun®” (scent fence) to prevent game losses dueto traffic accidents. Zeitschrift für Jagdwissenschaft, 40, 91–108.
Malo, J. E., García de la Morena, E. L., Hervás, I., Mata, C., & Herranz, J. (2016). Uncappedtubular poles along high-speed railway lines act as pitfall traps for cavity nesting birds.European Journal of Wildlife Research, 62, 483–489.
Malo, J. E., Suarez, F., & Diez, A. (2004). Can we mitigate animal-vehicle accidents usingpredictive models? Journal of Applied Ecology, 41, 701–710.
40 F. Carvalho et al.

Mathews, F., Swindells, M., Goodhead, R., August, T. A., Hardman, P., Linton, D. M., et al.(2013). Effectiveness of search dogs compared with human observers in locating bat carcassesat wind-turbine sites: A blinded randomized trial. Wildlife Society Bulletin, 37, 34–40.
Muzzi, P. D., & Bisset, A. R. (1990). Effectiveness of ultrasonic wildlife warning devices toreduce moose fatalities along railway corridors. Alces, 26, 37–43.
Pelletier, S. K., Carlson, L., Nein, D., & Roy, R. D. (2006). Railroad crossing structures for spottedturtles: Massachusetts Bay Transportation Authority–Greenbush rail line wildlife crossingdemonstration project. In C. L. Irwin, P. Garrett, & K. P. McDermott (Eds.), Proceedings of the2005 international conference on ecology and transportation (pp. 414–425). Raleigh, NC:Center for Transportation and the Environment, North Carolina State University.
Peña, O. L., & Llama, O. P. (1997).Mortalidad de aves en un tramo de linea de ferrocarril (32 p).Grupo Local SEO-Sierra de Guadarrama, Spain.
Polak, T., Rhodes, J. R., Jones, D., & Possingham, H. P. (2014). Optimal planning for mitigatingthe impacts of roads on wildlife. Journal of Applied Ecology, 51, 726–734.
PVMC. (2003). Mortalidad de vertebrados en carreteras. Proyecto provisional de seguimiento dela mortalidad de vertebrados en carreteras. Coordinadora de Organizaciones de DefensaAmbiental. Documentos Técnicos de Conservación S.C.V., 4.
Ramp, D., Caldwell, J., Edwards, K., Warton, D., & Croft, D. (2005). Modelling of wildlifefatality hotspots along the Snowy Mountain Highway in New South Wales, Australia.Biological Conservation, 126, 474–490.
Rea, R. V., Child, K. N., & Aitken, D. A. (2010). Youtube™ insights into moose-traininteractions. Alces, 46, 183–187.
Rodríguez, A., Crema, G., & Delibes, M. (1996). Use of non-wildlife passages across a high speedrailway by terrestrial vertebrates. Journal of Applied Ecology, 33, 1527–1540.
Roedenbeck, I. A., Fahrig, L., Findlay, C. S., Houlahan, J. E., Jaeger, J. A. G., Klar, N., et al.(2007). The Rauischholzhausen agenda for road ecology. Ecology and Society, 12, 11.
Rose, P., & Baillie, S. (1989). The effects of collisions with overhead lines on British birds: Ananalysis of ringing recoveries. Research Report, 42. British Trust for Ornithology.
Rosell, C., Parpal, J., Campeny, R., Jove, S., Pasquina, A., & Velasco, J. M. (1997). Mitigation ofbarrier effect of linear infrastructures on wildlife. In K. Canters (Ed.), Habitat fragmentation &infrastructure (pp. 367–372). Proceedings of the International Conference on HabitatFragmentation, Infrastructure and the Role of Ecological Engineering. Delft, TheNetherlands: Ministry of Transport, Public Works and Water Management.
Rytwinski, T., van der Ree, R., Cunnington, G. M., Fahrig, L., Findlay, C. S., Houlahan, J., et al.(2015). Experimental study designs to improve the evaluation of road mitigation measures forwildlife. Journal of Environmental Management, 154, 48–64.
Santos, S. M., Carvalho, F., & Mira, A. (2011). How long do the dead survive on the Road?Carcass persistence probability and implications for road-kill monitoring surveys. PLoS ONE,6, e25383.
Santos, S. M., Marques, J. T., Lourenço, A., Medinas, D., Barbosa, A. M., Beja, P., et al. (2015).Sampling effects on the identification of roadkill hotspots: implications for survey design.Journal of Environmental Management, 162, 87–95.
S. C. V. (1996). Mortalidad de vertebrados en líneas de ferrocarril. Documentos Técnicos deConservacion SCV 1, Sociedad Conservación Vertebrados, Madrid.
Seiler, A., & Helldin, J.-O. (2006). Mortality in wildlife due to transportation. In J. Davenport &J. L. Davenport (Eds.), The ecology of transportation: Managing mobility for the environment(pp. 165–189). Dordrecht: Springer.
Singh, A. K., Kumar, A., Mookerjee, A., & Menon, V. (2001). A scientific approach tounderstanding and mitigating elephant mortality due to train accidents in Rajaji NationalPark. An Occasional Report no 3 by Wildlife Trust of India and the International Fund forAnimal Welfare of a Rapid Action Project on understanding and mitigating the problem ofelephant mortality due to train hits.
Stevens, B. S., & Dennis, B. (2013). Wildlife mortality from infrastructure collisions: Statisticalmodelling of count data from carcass surveys. Ecology, 94, 2087–2096.
3 Methods to Monitor and Mitigate Wildlife Mortality in Railways 41

Teixeira, F. Z., Coelho, A. V. P., Esperandio, I. B., & Kindel, A. (2013). Vertebrate road mortalityestimates: Effects of sampling methods and carcass removal. Biological Conservation, 157,317–323.
Tremblay, M. A., & St. Clair, C. C. (2009). Factors affecting the permeability of transportation andriparian corridors to the movements of songbirds in an urban landscape. Journal of AppliedEcology, 46, 1314–1322.
van der Grift, E. A. (1999). Mammals and railroads: Impacts and management implications. Lutra,42, 77–98.
van der Grift, E. A., & Kuijsters, H. M. J. (1998). Mitigation measures to reduce habitatfragmentation by railway lines in the Netherlands. In G. L. Evink, P. Garrett, D. Zeigler, &J. Berry (Eds.), Proceedings of the international conference on wildlife ecology andtransportation (pp. 166–170). Tallahassee, FL: Florida Department of Transportation.
van der Grift, E. A., & van der Ree, R. (2015). Guidelines for evaluation use of wildlife crossingstructures. In R. van der Ree, D. J. Smith, & C. Grilo (Eds.), Handbook of road ecology(pp. 119–128). West Sussex: Wiley.
van der Grift, E. A., van der Ree, R., Fahrig, L., Findlay, S., Houlahan, J., Jaeger, J. A. G., et al.(2013). Evaluating the effectiveness of road mitigation measures. Biodiversity andConservation, 22, 425–448.
van der Ree, R., Clarkson, D. T., Holland, K., Gulle, N., & Budden, M. (2008). Review ofmitigation measures used to deal with the issue of habitat fragmentation by major linearinfrastructure. Report for Department of Environment, Water, Heritage and the Arts(DEWHA), Contract No. 025/2006, Published by DEWHA.
Ward, A. I., Dendy, J., & Cowan, D. P. (2015). Mitigating impacts of roads on wildlife: An agendafor the conservation of priority European protected species in Great Britain. European Journalof Wildlife Research, 61, 199–211.
Wells, P., Woods, J. G., Bridgewater, G., & Morrison, H. (1999). Wildlife mortalities on railways:Monitoring methods and mitigation strategies, Revelstoke, BC. Unpublished report.
Wood, P., & Wolfe, M. L. (1988). Intercept feeding as a means of reducing deer-vehicle collisions.Wildlife Society Bulletin, 16, 376–380.
Yanes, M., Velasco, J. M., & Suaréz, F. (1995). Permeability of roads and railways to vertebrates:The importance of culverts. Biological Conservation, 7, 217–222.
Zuberogoitia, I., del Real, J., Torres, J. J., Rodríguez, L., Alonso, M., de Alba, V., et al. (2015).Testing pole barriers as feasible mitigation measure to avoid bird vehicle collisions (BVC).Ecological Engineering, 83, 144–151.
Open Access This chapter is licensed under the terms of the Creative Commons Attribution 4.0International License (http://creativecommons.org/licenses/by/4.0/), which permits use, sharing,adaptation, distribution and reproduction in any medium or format, as long as you give appropriatecredit to the original author(s) and the source, provide a link to the Creative Commons license andindicate if changes were made.The images or other third party material in this chapter are included in the chapter’s Creative
Commons license, unless indicated otherwise in a credit line to the material. If material is notincluded in the chapter’s Creative Commons license and your intended use is not permitted bystatutory regulation or exceeds the permitted use, you will need to obtain permission directly fromthe copyright holder.
42 F. Carvalho et al.

Chapter 4Railways as Barriers for Wildlife:Current Knowledge
Rafael Barrientos and Luís Borda-de-Água
Abstract In this chapter we provide practical suggestions, together with examples,to identify, monitor and mitigate railway barrier effects on wildlife, as this isconsidered one of the railways’ greatest impacts. Railways can be both physical andbehavioral barriers to wildlife movement, as well as disturbance to populationsliving close to them. Also, mortality is recognized as an important contribution tothe barrier effect. However, the consequences of habitat loss, and fragmentation dueto railways alone remain largely unexplored. Barrier effects have mainly beenmitigated with wildlife passes, with the effectiveness of this tool being one of themost-studied topics in Railway Ecology. Methods formerly employed to monitorpass usage, such as track beds or video-surveillance, are now being replaced bymolecular ones. Among the latter methods, genetic fingerprinting allowsindividual-based approaches, opening the door to population-scale studies. In fact,genetic sampling allows for the assessment of functional connectivity, which isclosely linked to successful reproduction and population viability, variables notnecessarily coupled with crossing rates. There is strong evidence that railwayverges offer new habitats for generalist species and for opportunistic individuals, apoint that deserves to be experimentally explored in order to find wildlife-friendlypolicies. Preventing animals from crossing (e.g., by fencing), should be reserved forcollision hotspots, as it increases barrier effects. Instead, it has been shown thatwarning signals or pole barriers effectively reduce collisions without increasingbarrier effects. In this respect, we argue that computer simulations are a promisingfield to investigate potential impact scenarios. Finally, we present a protocol toguide planners and managers when assessing barrier effects, with emphasis onmonitoring and mitigation strategies.
R. Barrientos (&) � L. Borda-de-ÁguaCIBIO/InBIO, Centro de Investigação em Biodiversidade e Recursos Genéticos,Universidade do Porto, Campus Agrário de Vairão, Rua Padre Armando Quintas,4485-661 Vairão, Portugale-mail: [email protected]
R. Barrientos � L. Borda-de-ÁguaCEABN/InBIO, Centro de Ecologia Aplicada “Professor Baeta Neves”, Instituto Superior deAgronomia, Universidade de Lisboa, Tapada da Ajuda, 1349-017 Lisboa, Portugal
© The Author(s) 2017L. Borda-de-Água et al. (eds.), Railway Ecology,DOI 10.1007/978-3-319-57496-7_4
43

Keywords Barrier effect � Connectivity � Habitat fragmentation � Permeability �Wildlife pass
Introduction
We know today that linear infrastructures are one of the largest threats to biodi-versity worldwide, including habitat loss and fragmentation (Forman et al. 2003;Benítez-López et al. 2010; van der Ree et al. 2015). As mentioned in the intro-ductory chapter, most of what we know regarding this comes from studies on roadshowever, as some of these impacts are shared by roads and railways, many of themanagement tools developed for the former can be applied to the latter.Nevertheless, new approaches are needed in some cases, because some impacts arerailway-specific (Dorsey et al. 2015).
This chapter provides some conceptual insight into, and summarizes in a singledocument, what is known about barrier effects caused by railways on wildlife popu-lations, which is considered by some to be one of the greatest ecological impacts ofthese infrastructures (Iuell et al. 2003; Rodríguez et al. 2008). This review is organizedas follows: We begin by identifying the factors contributing to railway barrier effectsandwe then describe the approaches used to study these effects, and the effectiveness ofthe measures implemented to mitigate them. Finally, we suggest management guide-lines for railway companies, and present a protocol to minimize these barrier effects.
We searched the ISI Web of Science and Zoological Record databases for railwayecology studies. For all searches, our search terms were combinations of the followingwords: barrier effect, collision, fragmentation, habitat loss, impact, permeability,radio-tracking, railroad, railway, train, underpass, wildlife pass. We looked for publi-cations in English, Spanish, Portuguese, and French.We also searchedGoogle Scholar™for additional studies not published in peer-reviewed journals (gray literature) but citingpeer-reviewed papers, such as Ph.D. dissertations, reports, or conference papers.
Barrier Effects
The various sources of railway barrier effects are closely related, and sometimes it isnot easy to clearly separate them. For instance, noisy traffic can cause both habitatloss (if wildlife refuses to use the area adjacent to the railway right-of-way), and itcan create a behavioral barrier if this noise implies a perceived risk. We identifiedfour broad types of impacts causing barrier effects.
Physical and Behavioral Barriers
Barriers can be physical, when a species cannot trespass the railway, or behavioral,when the species may be physically able to cross the barrier but does not do sobecause of unfavorable ambient conditions or perceived risk.
44 R. Barrientos and L. Borda-de-Água

Physical barrier constraints mainly affect species of small size with reducedmobility, such as herptiles. For instance, Kornilev et al. (2006) reported that easternbox turtles (Terrapene carolina) in the USA enter a railway at crossings with roads(where surfaces are at the same level), but then become trapped between the rails asthey are unable to climb over them, and finally die due to thermal stress. A study ofHermann’s tortoises (Testudo hermanni) in Romania found that the impossibility ofovertaking obstacles (e.g., ditches with angles of over 60°) led to an increase in thedistribution of railway-kills at the end of the ditches (Iosif 2012).
Bumblebees (Bombus impatiens and B. affinis) in the USA (Bhattacharya et al.2003) provide an example of a species to which the railway is a behavioral barrier.These species are reluctant to cross railways (and roads) because of their high fidelityto their foraging site. In experiments, individuals of these species could come back totheir patches of origin after being translocated, or could leave their patch when theirfood was removed, but these movements were rarely in-control (non-translocated)individuals (Bhattacharya et al. 2003). Bhattacharya et al. (2003) observed thatforaging bees turned back when they reached the edge of a patch (i.e., bisected by arailway); thus, rather than physically impassable barriers to bumblebees, railwaysacted as barriers because they are likely to be strong landmarks. On the other hand,most of the translocated gatekeeper butterflies (Pyronia tithonus) crossed the FrenchHigh Speed Rail (hereinafter “HSR”) to return to their capture plot, as this speciesshows a strong homing behavior (Vandevelde et al. 2012; see also Chap. 16).Mongolian gazelles (Procapra gutturosa) are able to cross fenced railways inMongolia (Ito et al. 2008), but they usually do not do so (Ito et al. 2005, 2013, andsee Chap. 14). Therefore, these fenced railways represented a barrier effect affectingpopulation dynamics as it caused disruptions in long-distance gazelle migrations (Itoet al. 2005, 2008, 2013). Stopping migration routes prevents gazelles from reachingtheir traditional food-rich winter quarters, potentially increasing their winter mor-tality due to starvation (Ito et al. 2005, 2008, 2013). This conservation problem iscompounded by the current climate change, as drought events reducing vegetationproductivity could require gazelles to migrate longer distances, instead of the currentaverage of 600 km (Olson et al. 2009). To date, railways do not seem to have been abarrier for gazelle gene flow, although this assertion should be explored with moresuitable markers (Okada et al. 2012; see below).
Although it has been less studied, the conservation threat of the criticallyendangered saiga antelope (Saiga tatarica) in Kazakhstan—as a consequence ofmigration disruption due to fenced railways—seems to be similar to that ofMongolian gazelles (Olson 2013; see also Olson and van der Ree 2015). In a studycarried out in Sweden, Kammonen (2015) found that a motorway and a railwayrunning in parallel acted as barriers for two bat species (whiskered bat Myotismystacinus and Brandt’s bat M. brandtii) in a forest-dominated area. Although thisauthor did not differentiate between these two infrastructures, she found that batsdid not directly cross them; rather they used either the green bridge or the underpassboth to cross it and to forage (Kammonen 2015).
4 Railways as Barriers for Wildlife: Current Knowledge 45

Disturbance
Traffic noise, vibrations, chemical pollution, and human presence can impact ani-mal populations living close to railways, contributing to the barrier effects (van derGrift 1999; Dorsey et al. 2015; see a more complete discussion in the Chap. 6).These impacts can be divided into those related to siting and construction, and thoserelated to the operation of the railway line (De Santo and Smith 1993; see alsoChap. 12). The former has received little attention, likely because they are con-sidered short-term, but they can nevertheless affect local animal populations. Forinstance, although construction was halted during the migration period of thehuman-wary Tibetan antelopes (Pantholops hodgsonii) in China, the animals didnot use wildlife passes because of the presence of machinery and debris (Xia et al.2007). However, this species finally adapted to the presence of the railway and usedwildlife passes once the was train operative (Yang and Xia 2008).
Among the long-term disturbances related to barrier effects, one of the mostsignificant seems to be the noise produced by trains, because railways’ right-of-wayhas little vegetation to absorb the sound, as it is frequently mowed. Studies to datehave been carried out with simple census-based approaches, and have providedcontradictory findings. For instance, whereas in the Netherlands, Waterman et al.(2002) found a reduction in the density of meadow birds close to railways,Wiącek et al. (2015), counting forest birds at 30, 280 and 530 m from the tracks,found higher species richness close to the railway in a Polish forest crossed by arailway. In fact, guilds like insectivorous or those ecotone-specialists were morecommon close to railways, and species with low-frequency calls were not averse toit (Wiącek et al. 2015). In a study in a Brazilian Atlantic forest, Cerboncini et al.(2016) did not find an effect of traffic noise (up to 120 dB, higher close to the track)on small mammals, probably because of the infrequent train passage.
Several field studies did not explore the potential causes of the abundance patternsobserved and the distance to railway tracks. For instance, Li et al. (2010) found higherground-dwelling bird richness and abundance in China close to the railway whensampledat 0, 300, 600, 900 and 1,200 m. In a study on the rodent community in the samerailway, Qian et al. (2009) found no effect on species composition or densities at 50, 200and 500 m from the railway in non-grazing areas, but grazing-disturbed areas showeddifferent species ratios (Qian et al. 2009). The density of urban foxes (Vulpes vulpes) inthe UK was similar in squares with and without railways (Trewhella and Harris 1990);however, in areas with poor habitat quality, fox dens were commonly placed in railwaybanks, most likely because they acted as refuges (Trewhella and Harris 1990).
Mortality
Chapters 2 and 3 deal exclusively with the impact of railways on wildlife mortality;however, because we consider mortality to be a barrier effect, and in order to ensurethat current chapter is self-contained, we now summarize the main results.
46 R. Barrientos and L. Borda-de-Água

Train-related mortality can directly prevent connectivity among sub-populations, orreduce their reproductive success, if individuals seeking mates die or if their off-spring are railway-killed. Wildlife-train collisions (hereinafter “WTC”) are the mostcommonly documented source of animal mortality, although electrocution or col-lisions with wires can also occur (Rodríguez et al. 2008; Dorsey et al. 2015).A recently documented source of mortality is that of cavity nester birds in uncappedcatenary poles from HSR in Spain, as these tubular poles act as pitfall traps forbirds, because poles have smooth internal walls, not allowing birds that enter themto fall down to fly out (Malo et al. 2016). As the drainage hole at the base of thepole is too narrow to allow trapped birds to escape, the problem could be readilysolved by simply capping the tops of all types of tubular poles (Malo et al. 2016).A non-exclusive mitigation alternative would be to widen drainage holes.
Most of our understanding about railway impacts on wildlife comes from studiesfocused on large mammal railway-kills, as they are the most conspicuous, and cancause accidents, delays to the trains’ operation, significant damage to trains due totheir large size, and, overall, significant financial losses (Dorsey et al. 2015, and alsoChap. 17). Among train-related factors influencing the rates of WTC, traffic flow isthe most important one, with the highest mortality occurring, in fact, in lines withmoderate traffic flow because higher traffic volume deters animals from attempting tocross (Dorsey et al. 2015). For instance, in the USA, the killing by trains of blackbears (Ursus americanus) attempting to cross areas with low vegetation coverthrough train bridges in lines with moderate traffic has been documented (van Whyand Chamberlain 2003). The existence of lapses of time without traffic encouragesthe bears to cross the valley by the bridge, and these are railway-killed when a trainarrives and they cannot jump off the railway bed (van Why and Chamberlain 2003).
Animal behavior also determines their mortality rates. The isotope analysesusing brown bear (U. arctos) hair in Canada showed that some individuals fed oncarcasses from train-killed animals, or on plants growing in railway verges(Hopkins et al. 2014; see also Wells et al. 1999; see also Chap. 9). Similarly,granivore species in Canada consumed grain spilled by wagons (Wells et al. 1999),and in Norway moose (Alces alces) took advantage of the availability of branchesresulting from logging activities in the right-of-way (Gundersen et al. 1998). On thecontrary, despite Cerboncini et al. (2016) trapped more small mammals close to thetracks in Brazil, their body condition was similar to that of animals trapped far fromthe railway. Thus, it seems that this guild of Atlantic forest specialists was nottaking advantage of grain falling from trains (Cerboncini et al. 2016). Railways canalso facilitate the movements of some species, as wildlife uses these homogeneoussurfaces for travelling faster. This was the case of moose and wolves (Canislupus) in Canada, and moose and roe deer (Capreolus capreolus) in Sweden, whensnow was very deep (Child 1983; Paquet and Callaghan 1996; Eriksson 2014), ofbrown bears in Slovenia, when the terrain was steep (Kaczensky et al. 2003).
One frequently neglected issue is to what extent WTCs could affect populationdynamics. In some species, this impact seems small, but in others it could beimportant. This impact can also vary at the population level, as was the case ofdifferent moose populations in the USA, with WTCs ranging from less than 1%
4 Railways as Barriers for Wildlife: Current Knowledge 47

(Belant 1995) to 70% (Schwartz and Bartley 1991) of the estimated population size,or 5% of adult radio-collared animals (n = 204; Modafferi and Becker 1997). Forbrown bears, it varied from 5% of radio-tracked animals in the USA (n = 43; Wallerand Servheen 2005) to 18% in Slovenia (n = 17; Kaczensky et al. 2003). Themortality due to collisions with trains affected 5% (n = 21) of the radio-tagged eagleowls (Bubo bubo) in Switzerland, with WTCs being less important than electrocu-tion and cable or car collisions (Schaub et al. 2010). However, all these figuresprovide little information without the corresponding population viability analyses(PVAs). In this sense, the latter paper estimated an annual 31% of population growthif the entire anthropogenic mortality of eagle owls was eliminated, but withoutinformation on the effects of removing WTCs alone (Schaub et al. 2010).
Habitat Loss and Fragmentation
Habitat loss takes place when railway construction leads to the reduction of theavailable habitat, since the transformed railway bed is unsuitable for several species.Habitat fragmentation is often, but not necessarily, mediated by habitat loss. Duringfragmentation, large, continuous fragments are divided resulting in smaller, oftenisolated, patches that may not be able to maintain viable populations in the long run(Fahrig 2003). Whereas general information on habitat fragmentation is abundant(see Fahrig 2003 for a review), studies exclusively focused on railway-relatedfragmentation are non-existent, because researchers did not differentiate betweenrailway- and road-related fragmentation, assessing these two different infrastructuresas a whole (e.g., Jaeger et al. 2007; Girvetz et al. 2008; Bruschi et al. 2015).
When a population’s territory is bisected by a railway, part of its habitat is lost,and the remainder may be degraded, usually via cascade effects. The latter is what ishappening to the woodland caribous (Rangifer tarandus) in Canada, as the con-struction of railways and other linear infrastructures facilitated the access of wolvesto remote areas where there are still populations of this ungulate, being their via-bility threatened (James and Stuart-Smith 2000; Whittington et al. 2011).
Habitat changes also take place in railway corridors, as their verges commonlydiffer from the surrounding landscape, but are homogeneous along the railwaynetwork. These changes can be exploited by generalist species or by opportunisticindividuals, using them as shelters or corridors. They can be used by invasivespecies as well (for more details on the latter, see Chap. 5). Some authors havesuggested that the creation of new habitats by mowing the right-of-way, and thepresence of associated structures like powerlines and their pylons, provide newopportunities for several species to breed or hunt (see Morelli et al. 2014 regardingbirds). For instance, Vandevelde et al. (2014) (see Chap. 16) found that in France,in intensive agricultural landscapes, where linear semi-natural elements likehedgerows tend to disappear, bat species that forage in more open habitats benefitedfrom railway verges. For Polish butterflies, railways not only acted as corridors, butalso sheltered greater species richness than forest clearings or degraded meadows
48 R. Barrientos and L. Borda-de-Água

(Kalarus and Bąkowski 2015). The wide range of environmental conditionsoccurring in tracks, led to the presence of a large number of nectar plant species,allowing the existence of many butterfly species, from those selecting dry and warmmicrohabitats to forest specialists (Kalarus and Bąkowski 2015). Similar resultshave been found for other pollinators due to the high diversity of bee forage flora,although their diversity is higher in lines with intermediate traffic volume, anddiffers between microhabitats within the embankments (Wrzesień et al. 2016). Onthe contrary, Cerboncini et al. (2016) found no effects of railway edge on micro-climate in a Brazilian Atlantic forest, probably because railway track was narrowand the forest was well developed. Finally, especially in more impacted landscapes,there is an opportunity to integrate old tracks once they are abandoned into theregional conservation schema. They can act, for instance, as habitat corridorsamong protected areas, as many of their new uses—like rail-cycle or hiking—arewildlife-friendly activities. However, much more research is needed on the con-servation potential of abandoned tracks as well as on cost-effective maintenancemethods, like the weeding by domestic animals used in France (Orthlieb 2016).Also in France, Kerbiriou et al. (2015) found a strong increase in the population ofhibernating pipistrelle bats (Pipistrellus pipistrellus) in a railway tunnel as a resultof the end of the exploitation of the railway line, remarking on the idea thatabandoned railway structures can have second-life fulfilling conservation purposes.
Methods to Estimate Barrier Effects
Some of themethodswe describe belowwere first used in road ecology studies (Smithand van der Ree 2015), but all of them are useful for railway ecology studies as well.
Direct Methods
(1) Wildlife-train collisions data. This is the simplest method to estimate barriereffects due to wildlife mortality. A reduction of WTCs after applying mitigationmeasures has been commonly argued to be a measure of the effectiveness ofmanagement policies (e.g., Andreassen et al. 2005; Kušta et al. 2015), althoughWTC data without PVAs may be a poor surrogate of the impact of the railway.
(2) Track beds. These consist of a layer offine sand,marble dust, or clay powder of 3–30 mm thick, spread across the entire pass (usually underpass or culvert), andsmoothed with a brush. It should be fine enough to detect the tracks of smallvertebrates such as mice or amphibians, or even macroinvertebrates. The passmust be reviewed every 1–2 days and, if necessary, thematerial must be removedand extra material added (Yanes et al. 1995; Rodríguez et al. 1996; Baofa et al.2006). This method, combined with strips of soot-coated paper, as well as
4 Railways as Barriers for Wildlife: Current Knowledge 49

trapping and indirect evidence, such as scat identification, was used in Australiafor the first time by Hunt et al. (1987). This technique has been repeatedlyimproved, as it was the first widely used method to confirm culvert/wildlife passusage. Due to its low costs, it is more cost-effective for short-term surveys thanmodern alternatives, like video-surveillance (Ford et al. 2009;Mateus et al. 2011).However, the use of track pads is limited to optimal conditions, as the materialemployed can become useless by rain or livestock passage (Rodríguez et al. 1996,1997; Mateus et al. 2011), and there can be track misidentification and under-estimation of crossings due to track overlapping (Ford et al. 2009). Tracks insnowy landscapes can help to estimate the qualitative crossing of certain sections(Olsson et al. 2010), although limitations of this method regarding misidentifi-cation and track overlapping are similar to those from sandy beds.
(3) Video-surveillance. Modern technology allows the monitoring of pass usagethanks to cameras activated by infrared motion detectors at the pass entrance(Ford et al. 2009; Mateus et al. 2011). This method is constrained by the sen-sitiveness of the camera monitor sensor (Ford et al. 2009), which is especiallylimiting in large passes and with small animals (Mateus et al. 2011), becausevideo cameras cover small areas and only animals close to the sensor arerecorded (Ford et al. 2009; García-Sánchez et al. 2010; Mateus et al. 2011).Thus, a logical next step to evaluate the use of wildlife passes has been thedevelopment of wireless sensor networks (García-Sánchez et al. 2010). Theseare low-cost devices that, by using a camera at the entrance of the pass and aninfrared motion sensor network deployed in the surrounding area, enable therecording of reactions of animals approaching the wildlife pass and theireventual crossings (García-Sánchez et al. 2010).
(4) Capture-mark-recapture (hereinafter “CMR”). These are fine-scale methods asthey are individual-based, but they are intrusive, time- and budget-consuming, andrequire safety measures both for the animals and the researchers working aroundthe transport infrastructures; all this leads to small- to modest-sized samples(Simmons et al. 2010). Tagging must be adapted to the size and the ecology of thetarget species. CMRwith numbered plastic tags allowedBhattacharya et al. (2003)to monitor bumblebee movement across a railway, with a recapture rate of 31%(n = 367). In France, Vandevelde et al. (2012) (see Chap. 16) used a thin-pointpermanent pen to mark gatekeeper butterflies with a recapture rate of 30%(n = 149). Alternatively, passive integrated transponders have been proven to beuseful tomonitorwildlife passages.Once the animal crosses, an antenna connectedto a decoder unit installed in the pass records the individual, time, and date ofcrossing (recapture rate = 50%, n = 6; Soanes et al. 2013).
Radio-tracking-based projects share some of the advantages (fine-scale,individual-based) and disadvantages (intrusive, time- and budget-consuming) of theprevious methods, although the increasing effectiveness (e.g., satellite-basedtelemetry) and decreasing price currently make radio-tracking suitable for a widevariety of organisms (Simmons et al. 2010). Furthermore, the devices are becomingminiaturized to the point of being a feasible alternative for some invertebrates (e.g.,
50 R. Barrientos and L. Borda-de-Água

Hedin and Ranius 2002). Radio-tracking can also provide detailed information, notonly on individual crossings, but also on the full territory use by animals relative tothe railway location, therefore allowing the impact of the linear infrastructure on themovements of individuals to be estimated (Clevenger and Sawaya 2010).
Non-invasive genetic sampling (hereinafter “NGS”) methods have been usedmainly to measure the genetic sub-structure of a population bisected by a railway(see below). However, NGS also enables individual identification based onmicrosatellite analysis (Balkenhol and Waits 2009; Clevenger and Sawaya 2010;Simmons et al. 2010), the so-called “fingerprinting” or “DNA profiling,” which is akind of capture-mark-recapture method. For instance, Clevenger and Sawaya(2010) showed that the passive hair-collection methods based on barbed wire and/oradhesive strings, followed by microsatellite analyses, was an effective technique formonitoring wildlife pass use at an individual level for cougars (Puma concolor),and black and brown bears in Canada. Furthermore, as costs for genetic analyses arebecome lower, the sample sizes have increased in recent studies (Simmons et al.2010). The main limitation of this method is that it is only suitable for large animalswhose remains (hairs, feathers, scats) can be found in the field in sufficient quantityto extract DNA from them. In addition, fingerprinting requires a relatively highnumber of microsatellites. If species-specific microsatellites have not been devel-oped in the target species, they have to be specifically developed, increasing bothtime and costs. However, microsatellites already developed for related species canbe tested, as sometimes they amplify the DNA from the target species as well.
Indirect Methods
(1) Census at both sides of a railway. This is the most simplistic approach, either toassess population densities (e.g., Waterman et al. 2002; Li et al. 2010; Wiąceket al. 2015), or to calculate diversity indices of community structures (e.g., Qianet al. 2009). However, it is also the most limited approach to identifying causalfactors or population dynamic-related processes. Failure to control for poten-tially confounding variables makes that detected patterns cannot be clearlyassociated with railway impact.
(2) Genetic-based assessment of functional connectivity. Even more important thanconfirming crossing is to assessing the functional connectivity (or the barriereffect)—that is, to detect whether individuals reproduce on both sides of therailway. It is worth noting that moderate to low crossing rates may not nec-essarily imply functional connectivity (Riley et al. 2006). This type of infor-mation is logistically difficult to obtain using other than genetic methods(Clevenger and Sawaya 2010; Simmons et al. 2010).Because the impact of railways is relatively recent, highly variable markerssuch as microsatellites are the most suitable method for estimating demographic
4 Railways as Barriers for Wildlife: Current Knowledge 51

and population genetic effects. Balkenhol and Waits (2009) found that 76% ofthe 33 reviewed studies employed these markers in road ecology studies (seebelow for railway studies). Indeed, authors who used mitochondrial analysesfailed to find genetic structuring related to railway-related barrier effects, ashappened with the Mongolian gazelle (Okada et al. 2012).The easiest design consists of sampling individuals at both sides of a railway toinfer whether this acts as a barrier driving population differentiation. Thisapproach was used by Gerlach and Musolf (2000) to study the genetic sub-structuring between bank vole (Clethrionomys glareolus) populations bisectedby a railway in Germany and Switzerland. The authors found that a 40-year-oldrailway did not contribute to genetic substructuring in bank voles. In their studyin the USA with the marbled salamander (Ambystoma opacum) in the USA,Bartoszek and Greenwald (2009) found that the populations from two pondsjust separated by a railway, although potentially connected by a culvert, weregenetically differentiated, although some gene flow was still occurring. On thecontrary, the Qinghai-Tibetan railway seems not to be a barrier structuring thetoad-headed lizard (Phrynocephalus vlangalii) populations, as samples fromboth sides of the railway were genetically similar, whereas those sampled at20 km away were different, as expected due to the distance (Hu et al. 2012).Genetics should be complemented with landscape analyses to control, amongother things, for the relationship between genetic and geographic distances. Rehand Seitz (1990), using a sample design that included several sites and enzymeanalyses, found that railways contributed to the isolation, and thus theinbreeding, of common frogs (Rana temporaria) in Germany. Yang et al.(2011) used landscape analysis and genetics based on microsatellites to identifythe factors influencing the differentiation among Przewalski’s gazelle(P. przewalskii) populations in China. Prunier et al. (2014) used a microsatelliteindividual-based sampling scheme combined with computer simulations todetermine whether HSR in west-central France was old enough to cause geneticdiscontinuities in the alpine newt (Ichthyosaura alpestris). The latter authorsdid not detect any barrier effects, which could be due both to the relativelyrecent existence of the railway (29 years), or to the highly nomadic behavior ofthis amphibian. Also, the small size of newts could allow them to move underthe rails, minimizing their risk of being railway-killed. The few smooth newts(Lissotriton vulgaris), a species of similar size, that were found railway-killedin Poland, were found at pedestrian crossings, where newts are forced to moveover instead of under the rails (Kaczmarski and Kaczmarek 2016). On the otherhand, the simultaneous use of genetic approaches and landscape analyses hasalso shown that linear infrastructures can, in some cases, increase connectivity.For instance, the use of microsatellites enabled Fenderson et al. (2014) toidentify railways, powerlines, or even road sides as dispersal facilitators of NewEngland cottontails (Sylvilagus transitionalis), but their approach was limitedas they did not evaluate the relative importance of each of these infrastructuresto the observed increase in connectivity. Such an increase in the landscape
52 R. Barrientos and L. Borda-de-Água

connectivity can be detrimental in some cases, such as that of invasive species,a theme that is discussed at length in Chap. 5.
(3) Computer Simulations. These tools have the potential to play a major role inunderstanding the impact of railways in wild animal populations and, accord-ingly, in planning new railway networks or developing mitigation measures.However, to the best of our knowledge, there are only a few simulation studiesthat specifically target the impact of the fragmentation caused by railways.Simulations can be used before and after railway construction. Before theconstruction phase, an impact assessment is desirable to compare alternatives.In particular, it is important to avoid cutting through areas of great naturalvalue, but if this is unavoidable, then it is necessary to identify the sectors mostaffected in order to implement mitigation measures. In such situations, aregion-wide focus that includes future projections is the most suitable approach.For these purposes, graph theory is being increasingly used in conservationbiology, as graph models provide simplified representations of ecologicalnetworks with flexible data requirements (Urban et al. 2009). For instance,Clauzel et al. (2013) (see also Chap. 13) combined graph-based analysis andspecies distribution models to assess the impact of a railway line on the futuredistribution of the European tree frogs (Hyla arborea) in France. This studywas able to identify—among potential routes—the railway line with the lowestimpact on the species distribution.Mateo-Sánchez et al. (2014) conducted computer simulations to assess thedegree of connectivity of two populations of the endangered brown bear innorth-western Spain. They used a multi-scale habitat model to predict thepresence of bears as a function of habitat suitability, combined with a factorialleast-cost path density analysis. With this model, the authors identified possiblecorridors that could connect the two populations and the locations that shouldbe prioritized in order to ameliorate the permeability of the local railways (androads). In a study to identify the most suitable corridor in a future railway linein Sweden, Karlson et al. (2016) integrated models with ecological and geo-logical information by using spatial multi-criteria analysis techniques to gen-erate a set of potential railway corridors, followed by the application of thelowest cost path analysis in order to find the corridor with the best environ-mental performance within the set.Much of what has been learned from simulations applied to the impact of roads(e.g., Roger et al. 2011; Borda-de-Água et al. 2011) can also be used in railwayecology. Among the techniques used, we highlight the individuals-basedmodels, (hereafter “IBM”) (e.g., Lacy 2000; Jaeger and Fahrig 2004;Kramer-Schadt et al. 2004; Grimm et al. 2006). While more traditional simu-lation approaches use variables to study the collective behavior of certainentities (for instance, an entire population could be characterized by a singlevariable describing the total number of individuals), IBMs explicitly simulateall individuals as separate entities, each with its own set of characteristics, andinteracting among them and with the environment. The main advantage of
4 Railways as Barriers for Wildlife: Current Knowledge 53

IBMs is that we are no longer constrained by the difficulties of obtaininganalytical or numerical solutions using differential calculus, or are dependent onthe mathematical tractability of complicated systems of differential (or integral)equations (Railsback and Grimm 2011). With IBMs, one can model a widevariety of behaviors, thus increasing the realism of the models—although oftenat the expense of time consuming simulations.The most effective tools for reducing barrier effects, such as overpasses orviaducts, increase construction costs considerably (Smith et al. 2015).Therefore, either before or after railway construction, simulations at the land-scape level can be used to identify the location and type of the mitigationmeasures to be implemented. For instance, Gundersen and Andreassen (1998)included both train- and environment-related variables to model the occurrenceof WTCs during seasonal moose migration to valley bottoms, when WTC riskis highest (Gundersen et al. 1998). and they tested the model predictability witha subset of data not used for model development, a method that can be used toinfer future WTCs (Gundersen and Andreassen 1998).
Effectiveness of Mitigation Measures
Avoiding Crossing
Several studies have tested measures, like fencing, to avoid animal crossings ofrailways. These can reduce WTCs but, on the other hand, they can increase barriereffects (e.g., Ito et al. 2005, 2008, 2013; see also Chap. 14). Thus, they should onlybe implemented in areas of high concentration of WTCs, and combined withwildlife passes to maintain railway permeability (van der Grift 1999). Buildingexclusion fences seems the most effective (van der Grift 1999; Ito et al. 2013), andis even the most cost-effective measure, in the long run (Dorsey et al. 2015). Theapplication of odor repellents reduced animal mortality in a study in the CzechRepublic, but with contrasting results among taxa (Kušta et al. 2015). This tech-nique was less effective at low temperatures, when repellents froze (Kušta et al.2015; see also Castiov 1999). Indeed, Andreassen et al. (2005) found odourrepellents to have highly variable efficiency in reducing moose WTCs in Norway.Instead, these authors found a more consistent decrease in WTCs after the place-ment of feeding stations to keep animals away from railways, and forest clearing inthe vicinity of the railway (Andreassen et al. 2005).
Interesting alternatives are those devices that aim to reduce WTCs withouthaving barrier effects (see Chap. 17). For example, trains equipped with ultrasonicwarning devices killed fewer moose in Canada than those without (Muzzi andBisset 1990). More recently, Babińska-Werka et al. (2015) reported the develop-ment of a device in Poland that uses alarm calls from several wild animals inadvance (30 s to 3 min) of an oncoming train that allows animals near the railway
54 R. Barrientos and L. Borda-de-Água

to react and escape in a natural way. The proportion of wildlife escaping from thetracks was higher, and individuals reacted faster, when the device was switched onand, importantly, animals did not show evidence of habituation to the warningsignals (Babińska-Werka et al. 2015).
Planting trees (Tremblay and St. Clair 2009) or erecting pole barriers(Zuberogoitia et al. 2015) in the railway corridor can reduce the WTCs of flyinganimals. However, trees could attract animals as well, for perching or feeding, sopole barriers are preferred since they have fewer side effects. An experiment withmedium- to large-sized birds in Spain showed that most birds shifted or raised theflight when approaching the pole barrier (Zuberogoitia et al. 2015).
Habitat Management
Vegetation mowing at railway verges was successfully applied to reduce mooseWTCs in Norway, and it could have had three complementary benefits: first,reducing the attractiveness of the verges for animals, therefore reducing foragingclose to railways (Jaren et al. 1991; Andreassen et al. 2005); second, reducing thetime spent by animals close to the railway, as they could perceive the clearing asdangerous (Jaren et al. 1991); and, third, allow them ‘see and be seen’ rule, asprovided for both the train driver and the animal, with a greater amount of time toreact to each other and avoid a collision (Jaren et al. 1991). This technique reducedthe number of moose WTCs by half (Jaren et al. 1991; Andreassen et al. 2005). Onthe contrary, Eriksson (2014) originally hypothesized that tree-clearing could be thefactor behind the increase in moose and roe deer train collisions in Sweden, as earlysuccessional stages created after mowing provided attractive foraging opportunitiesfor ungulates, but she found that it had no effect on the increase of WTCs in her“Before-After-Control-Impact”, the so-called BACI design (Eriksson 2014).Finally, it is worth mentioning that vegetation removal may increase barrier effectsfor small vertebrates, as these do not cross open spaces due to their associated highpredation risks (Hunt et al. 1987; Yanes et al. 1995).
Crossing Structures
Animals use both non-wildlife passes (i.e., those placed and designed for purposesother than to allow wildlife crossing, like drainage culverts), or wildlife passesspecifically designed on the basis of the target species traits (small tunnels foramphibians or small mammals; underpasses, overpasses, ecoducts or green bridgesfor large mammals) (Smith et al. 2015). Large passes mimicking natural habitat aremore expensive, but they are also the most effective technique for reducing barriereffects, commonly suitable for most species, including the most demanding ones, likelarge carnivores and ungulates (Iuell et al. 2003; Clevenger and Waltho 2005; Smith
4 Railways as Barriers for Wildlife: Current Knowledge 55

et al. 2015). In some cases, structures that were not originally designed as wildlifepasses have been adapted to better allow animal crossings. For instance, culverts weremodified by the addition of a bench to facilitate wildlife crossing when the culvert iswet (Iuell et al. 2003). In some cases, the adaptation is as easy as removing the gravelbelow pairs of sleepers to create a gap to allow small vertebrates, like spotted turtles(Clemmys guttata) in the USA, to cross under the sleepers, to where they werefunnelled by a fence (Pelletier et al. 2006). Culverts have been found to be used byanimals to bypass railways in Australia (Hunt et al. 1987) and in Spain (Yanes et al.1995; Rodríguez et al. 1996, 1997). However, culvert dimensions or the surroundinghabitats influence their use by vertebrates (Hunt et al. 1987; Yanes et al. 1995;Rodríguez et al. 1996, 1997). For instance, small culverts were used by small mam-mals, but they were unsuitable for ungulates (Rodríguez et al. 1996) and the additionof natural vegetation and refuges such as stones increased crossing rates for smallanimals (Hunt et al. 1987; Yanes et al. 1995). Not unexpectedly, longer passes havelower crossing rates for several taxa (Hunt et al. 1987; Yanes et al. 1995).
Notice, however, that all the examples of pass monitoring reported, at the most, theintensity of crossing, not the functional connectivity—two variables that are not nec-essarily coupled (Riley et al. 2006). Thus the implementation of these mitigation mea-sures should be complemented with genetic analyses at the population level to assesswhether they contribute to the effective reduction of barrier effects (Riley et al. 2006).
Management Guidelines
In Fig. 4.1 we present in a schematic way the steps to be followed in an “IdealProtocol to Mitigate Railway Barrier Effects”. These include:
Forecasting Impacts
To know the wildlife status in the whole region, it is necessary to assess the impactof potential routes, to understand the target-species ecology, as WTCs are usuallycorrelated with animal abundance (e.g., D’Amico et al. 2015), and the latter cantemporally and geographically change along the biological cycle (e.g., moose inCanada or Norway; Child 1983; Gundersen et al. 1998; or sika deer Cervus nipponin Japan; Ando 2003). Impacts can be predicted by NGS (Balkenhol and Waits2009) or by censuses (Species Distribution Models, Clauzel et al. 2013). In addi-tion, individual assignment tests and graph theory could be combined in landscapeanalyses to identify connectivity zones that should be preserved, and computersimulations could be run to evaluate population dynamics under several barriereffect levels (Balkenhol and Waits 2009; Clauzel et al. 2013). Thus, by combiningthese approaches, planners will be able to select the alternatives with the lowestbarrier effects on wildlife.
56 R. Barrientos and L. Borda-de-Água
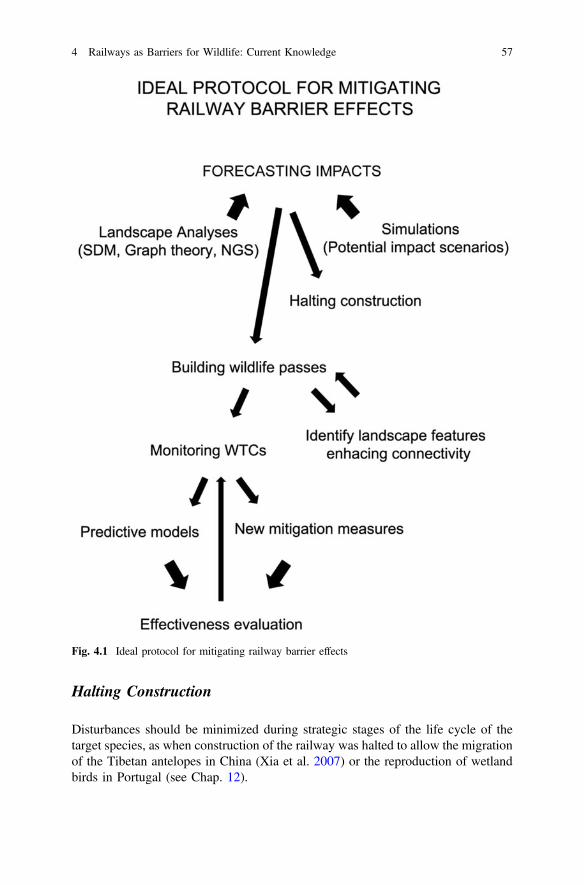
Halting Construction
Disturbances should be minimized during strategic stages of the life cycle of thetarget species, as when construction of the railway was halted to allow the migrationof the Tibetan antelopes in China (Xia et al. 2007) or the reproduction of wetlandbirds in Portugal (see Chap. 12).
Fig. 4.1 Ideal protocol for mitigating railway barrier effects
4 Railways as Barriers for Wildlife: Current Knowledge 57
Wildlife Passes Combined with Funnelling Fencing
This approach should be considered only in those railway sections previouslyidentified with landscape analysis studies to be particularly suitable to maintainconnectivity, since their construction is expensive. The option of elevating therailway on pile-supported structures is usually more feasible than it is for similarhighway segments (De Santo and Smith 1993). Demanding species, such as largeanimals, prefer to cross under bridges rather than through underpasses (Rodríguezet al. 1996; Baofa et al. 2006; Yang and Xia 2008) but, on the other hand, bridgescan represent a risk for flying species as they tend to cross above them (Tremblayand St. Clair 2009). Thus, bridges should be flanked by pole barriers to ensure safepassage well above moving traffic (Zuberogoitia et al. 2015). Finally, functionalconnectivity should be evaluated with molecular methods and BACI designsimplemented to know the effectiveness of mitigation measures (Balkenhol andWaits 2009; Corlatti et al. 2009; Clevenger and Sawaya 2010; Simmons et al. 2010;Soanes et al. 2013).
Identify Landscape Features Enhancing Connectivity
The identification of those features that enhance landscape connectivity and theiradoption when designing and operating railways should be promoted. For instance,as mowed railway rights-of-way have been found to restore population connectivitythe for New England cottontail, an early successional habitat specialist of conser-vation concern, a management recommendation to reduce the isolation of theirpopulations is not to allow vegetation development beyond shrub stratum(Fenderson et al. 2014).
Monitoring of WTCs to Identify Hotspots
A periodic schema should be implemented to monitor the railway line to identifysections with high collision rates, i.e., hotspots, and simulation models should bebuilt to forecast WTCs (Gundersen and Andreassen 1998). In identified hotspots,anti-collision measures, such as warning signals (Babińska-Werka et al. 2015; seealso Chap. 17) or pole barriers, (Zuberogoitia et al. 2015) should be placed. Theireffectiveness should be monitored with BACI designs.
58 R. Barrientos and L. Borda-de-Água

Conclusions
Railways can cause barrier effects in several ways. Some, like mortality, have beenwidely studied for some charismatic species, but their effects for others are poorlyknown. Studies on barrier effects due to behavioral responses to disturbances or theeffects of habitat loss and fragmentation due to railway implementation are scarce.The monitoring of the effectiveness of mitigation measures should incorporate morerecent approaches, such as genetic tools. It would allow, for instance, to broaden thecurrent scope based on the qualitative use of wildlife passes to a more interestingfunctional connectivity-based framework. The use of computer simulations hasadvantages not fully applied at present, but useful both before railway constructionand during its operation.
Acknowledgements We thank Graça Garcia and Clara Grilo for carefully reading an early versionof this chapter. This research was supported by FEDER funds through the Operational Programmefor Competitiveness Factors—COMPETE, by National Funds through FCT—the Foundation forScience and Technology under UID/BIA/50027/2013, POCI-01-0145-FEDER-006821, and by theInfraestruturas de Portugal Biodiversity Chair. Rafael Barrientos acknowledges financial support bythe Infraestruturas de Portugal Biodiversity Chair—CIBIO—Research Center in Biodiversity andGenetic Resources.
References
Ando, C. (2003). The relationship between deer-train collisions and daily activity of the sika deer,Cervus nippon. Mammal Study, 28, 135–143.
Andreassen, H. P., Gundersen, H., & Storaasthe, T. (2005). The effect of scent-marking, forestclearing and supplemental feeding on moose-train collisions. Journal of Wildlife Management,69, 1125–1132.
Babińska-Werka, J., Krauze-Gryz, D., Wasilewski, M., & Jasińska, K. (2015). Effectiveness of anacoustic wildlife warning device using natural calls to reduce the risk of train collisions withanimals. Transportation Research Part D, 38, 6–14.
Balkenhol, N., & Waits, L. P. (2009). Molecular road ecology: Exploring the potential of geneticsfor investigating transportation impacts on wildlife. Molecular Ecology, 18, 4151–4164.
Baofa, Y., Huyin, H., Yili, Z., Le, Z., & Wanhong, W. (2006). Influence of the Qinghai-Tibetanrailway and highway on the activities of wild animals. Acta Ecologica Sinica, 26, 3917–3923.
Bartoszek, J., & Greenwald, K. R. (2009). A population divided: Railroad tracks as barriers togene flow in an isolated population of marbled salamanders (Ambystoma opacum).Herpetological Conservation and Biology, 4, 191–197.
Belant, J. L. (1995). Moose collisions with vehicles and trains in Northeastern Minnesota. Alces,31, 45–52.
Benítez-López, A., Alkemade, R., & Verweij, P. A. (2010). The impacts of roads and otherinfrastructure on mammal and bird populations: A meta-analysis. Biological Conservation,143, 1307–1316.
Bhattacharya, M., Primack, R. B., & Gerwein, J. (2003). Are roads and railroads barriers tobumblebee movement in a temperate suburban conservation area? Biological Conservation,109, 37–45.
4 Railways as Barriers for Wildlife: Current Knowledge 59

Borda-de-Água, L., Navarro, L., Gavinhos, C., & Pereira, H. M. (2011). Spatio-temporal impactsof roads on the persistence of populations: Analytic and numerical approaches. LandscapeEcology, 26, 253–265.
Bruschi, D., Garcia, D. A., Gugliermetti, F., & Cumo, F. (2015). Characterizing the fragmentationlevel of Italian’s National Parks due to transportation infrastructures. Transportation ResearchPart D, 36, 18–28.
Castiov, F. (1999). Testing potential repellents for mitigation of vehicle-induced mortality of wildungulates in Ontario. Doctoral dissertation. Sudbury: Laurentian University.
Cerboncini, R. A. S., Roper, J. J., & Passos, F. C. (2016). Edge effects without habitatfragmentation? Small mammals and a railway in the Atlantic Forest of southern Brazil. Oryx,50, 460–467.
Child, K. (1983). Railways and moose in the central interior of BC: A recurrent managementproblem. Alces, 19, 118–135.
Clauzel, C., Girardet, X., & Foltête, J.-C. (2013). Impact assessment of a high-speed railway lineon species distribution: Application to the European tree frog (Hyla arborea) inFranche-Comté. Journal of Environmental Management, 127, 125–134.
Clevenger, A. P., & Sawaya, M. A. (2010). Piloting a non-invasive genetic sampling method forevaluating population-level benefits of wildlife crossing structures. Ecology and Society, 15, 7.
Clevenger, A. P., & Waltho, N. (2005). Performance indices to identify attributes of highwaycrossing structures facilitating movement of large mammals. Biological Conservation, 121,453–464.
Corlatti, L., Hackländer, K., & Frey-Roos, F. (2009). Ability of wildlife overpasses to provideconnectivity and prevent genetic isolation. Conservation Biology, 23, 548–556.
D’Amico, M., Román, J., de los Reyes, L., & Revilla, E. (2015). Vertebrate road-kill patterns inMediterranean habitats: Who, when and where. Biological Conservation, 191, 234–242.
De Santo, R. S., & Smith, D. G. (1993). Environmental auditing: An introduction to issues ofhabitat fragmentation relative to transportation corridors with special reference to high-speedrail (HSR). Environmental Management, 17, 111–114.
Dorsey, B., Olsson, M., & Rew, L. J. (2015). Ecological effects of railways on wildlife. In R. vander Ree, D. J. Smith, & C. Grilo (Eds.), Handbook of road ecology (pp. 219–227). WestSussex: Wiley.
Eriksson, C. (2014). Does tree removal along railroads in Sweden influence the risk of trainaccidents with moose and roe deer? Second cycle, A2E. Uppsala: Uppsala University.
Fahrig, L. (2003). Effects of habitat fragmentation on biodiversity. Annual Review of EcologyEvolution and Systematic, 34, 487–515.
Fenderson, L. E., Kovach, A. I., Litvaitis, J. A., O’Brien, K. M., Boland, K. M., & Jakuba, W.J. (2014). A multiscale analysis of gene flow for the New England cottontail, an imperiledhabitat specialist in a fragmented landscape. Ecology and Evolution, 4, 1853–1875.
Ford, A. T., Clevenger, A. P., & Bennett, A. (2009). Comparison of methods of monitoringwildlife crossing-structures on highways. Journal of Wildlife Management, 73, 1213–1222.
Forman, R. T. T., Sperling, D., Bissonette, J. A., Clevenger, A. P., Cutshall, C. D., Dale, V. H.,et al. (2003). Road ecology. Science and solutions. Washington: Island Press.
García-Sánchez, A. J., García-Sánchez, F., Losilla, F., Kulakowski, P., García-Haro, J., Rodríguez,A., et al. (2010). Wireless sensor network deployment for monitoring wildlife passages.Sensors, 10, 7236–7262.
Gerlach, G., & Musolf, K. (2000). fragmentation of landscape as a cause for genetic subdivision inbank voles. Conservation Biology, 14, 1066–1074.
Girvetz, E. H., James, H., Thorne, J. H., Berry, A. M., & Jaeger, J. A. G. (2008). Integration oflandscape fragmentation analysis into regional planning: A statewide multi-scale case studyfrom California, USA. Landscape and Urban Planning, 86, 205–218.
Grimm, V., Berger, U., Bastiansen, F., Eliassen, S., Ginot, V., Giske, J., et al. (2006). A standardprotocol for describing individual-based and agent-based models. Ecological Modelling, 198,115–126.
60 R. Barrientos and L. Borda-de-Água

Gundersen, H., & Andreassen, H. P. (1998). The risk of moose Alces alces collision: A predictivelogistic model for moose-train accidents. Wildlife Biology, 4, 103–110.
Gundersen, H., Andreassen, H. P., & Storaas, T. (1998). Spatial and temporal correlates toNorwegian moose-train collisions. Alces, 34, 385–394.
Hedin, J., & Ranius, T. (2002). Using radio telemetry to study dispersal of the beetle Osmodermaeremita, an inhabitant of tree hollows. Computers and Electronic in Agriculture, 35, 171–180.
Hopkins, J. B., III, Whittington, J., Clevenger, A. P., Sawaya, M. A., & St. Clair, C. C. (2014).Stable isotopes reveal rail-associated behavior in a threatened carnivore. Isotopes inEnvironmental and Health Studies, 50, 322–331.
Hu, D., Fu, J., Zou, F., & Qi, Y. (2012). Impact of the Qinghai-Tibet railway on population geneticstructure of the toad-headed lizard, Phrynocephalus vlangalii. Asian Herpetological Research,3, 280–287.
Hunt, A., Dickens, H. J., & Whelan, R. J. (1987). Movement of mammals through tunnels underrailway lines. Australian Zoologist, 24, 89–93.
Iosif, R. (2012). Railroad-associated mortality hot spots for a population of Romanian Hermann’stortoise (Testudo hermanni boettgeri): A gravity model for railroad-segment analysis. ProcediaEnvironmental Sciences, 14, 123–131.
Ito, T. Y., Lhagvasuren, B., Tsunekawa, A., Shinoda, M., Takatsuki, S., Buuveibaatar, B., et al.(2013). Fragmentation of the habitat of wild ungulates by anthropogenic barriers in Mongolia.PLoS ONE, 8, e56995.
Ito, T. Y., Miura, N., Lhagvasuren, B., Enkhbileg, D., Takatsuki, S., Tsunekawa, A., et al. (2005).Preliminary evidence of a barrier effect of a railroad on the migration of Mongolian gazelles.Conservation Biology, 19, 945–948.
Ito, T. Y., Okada, A., Buuveibaatar, B., Lhagvasuren, B., Takatsuki, S., & Tsunekawa, A. (2008).One-sided barrier effect of an international railroad on Mongolian gazelles. Journal of WildlifeManagement, 72, 940–943.
Iuell, B., Bekker, G. J., Cuperus, R., Dufek, J., Fry, G., Hicks, C., et al. (2003).Wildlife and traffic:A European handbook for identifying conflicts and designing solutions. Utrech: KNNVPublishers.
Jaeger, J. A. G., & Fahrig, L. (2004). Effects of road fencing on population persistence.Conservation Biology, 18, 1651–1657.
Jaeger, J. A. G., Schwarz-von Raumer, H.-G., Esswein, H., Müller, M., & Schmidt-Lüttmann, M.(2007). Time series of landscape fragmentation caused by transportation infrastructure andurban development: A case study from Baden-Württemberg, Germany. Ecology and Society,12, 22.
James, A. R., & Stuart-Smith, A. K. (2000). Distribution of caribou and wolves in relation to linearcorridors. Journal of Wildlife Management, 64, 154–159.
Jaren, V., Andersen, R., Ulleberg, M., Pedersen, P. H., & Wiseth, B. (1991). Moose-traincollisions: The effects of vegetation removal with a cost-benefit analysis. Alces, 27, 93–99.
Kaczensky, P., Knauer, F., Krze, B., Jonozovic, M., Adamic, M., & Gossow, M. (2003). Theimpact of high speed, high volume traffic axes on brown bears in Slovenia. BiologicalConservation, 111, 191–204.
Kaczmarski, M., & Kaczmarek, J. M. (2016). Heavy traffic, low mortality—Tram tracks asterrestrial habitat of newts. Acta Herpetologica, 11, 227–231.
Kalarus, K., & Bąkowski, M. (2015). Railway tracks can have great value for butterflies as a newalternative habitat. Italian Journal of Zoology, 82, 565–572.
Kammonen, J. (2015) Foraging behaviour of Myotis mystacinus and M. brandtii in relation to abig road and railway in south-central Sweden. Bachelor’s thesis. Uppsala: Uppsala University.
Karlson, M., Karlsson, C. S. J., Mörtberg, U., Olofsson, B., & Balfors, B. (2016). Design andevaluation of railway corridors based on spatial ecological and geological criteria.Transportation Research Part D, 46, 207–228.
Kerbiriou, C., Julien, J. F., Monsarrat, S., Lustrat, P., Haquart, A., & Robert, A. (2015).Information on population trends and biological constraints from bat counts in roost cavities: A
4 Railways as Barriers for Wildlife: Current Knowledge 61

22-year case study of a pipistrelle bats (Pipistrellus pipistrellus Schreber) hibernaculum.Wildlife Research, 42, 35–43.
Kornilev, Y. V., Price, S. J., & Dorcas, M. E. (2006). Between a rock and a hard place: Responsesof eastern box turtles (Terrapene carolina) when trapped between railroad tracks.Herpetological Review, 37, 145–148.
Kramer-Schadt, S., Revilla, E., Wiegand, T., & Breitenmoser, U. (2004). Fragmented landscapes,road mortality and patch connectivity: Modelling influences on the dispersal of Eurasian lynx.Journal of Applied Ecology, 41, 711–723.
Kušta, T., Keken, Z., Ježek, M., & Kůta, Z. (2015). Effectiveness and costs of odor repellents inwildlife–vehicle collisions: A case study in Central Bohemia, Czech Republic. TransportationResearch Part D, 38, 1–5.
Lacy, R. C. (2000). Considering threats to the viability of small populations using individual-basedmodels. Ecological Bulletins, 48, 39–51.
Li, Z., Ge, Ch., Li, J., Li, Y., Xu, A., Zhou, K., et al. (2010). Ground-dwelling birds near theQinghai-Tibet highway and railway. Transportation Research Part D, 15, 525–528.
Malo, J. E., García de la Morena, E. L., Hervás, I., Mata, C., & Herranz, J. (2016). Uncappedtubular poles along high-speed railway lines act as pitfall traps for cavity nesting birds.European Journal of Wildlife Research, 62, 483–489.
Mateo-Sánchez, M. C., Cushman, S. A., & Saura, S. (2014). Connecting endangered brown bearsubpopulations in the Cantabrian Range (north-western Spain). Animal Conservation, 17,430–440.
Mateus, A. R. A., Grilo, C., & Santos-Reis, M. (2011). Surveying drainage culvert use bycarnivores: Sampling design and cost–benefit analyzes of track-pads vs. video-surveillancemethods. Environmental Monitoring and Assessment, 181, 101–109.
Modafferi, R. D., & Becker, E. F. (1997). Survival of radiocollared adult moose in lower Susitnariver valley, southcentral Alaska. Journal of Wildlife Management, 61, 540–549.
Morelli, F., Beim, M., Jerzak, L., Jones, D., & Tryjanowski, P. (2014). Can roads, railways andrelated structures have positive effects on birds? A review. Transportation Research Part D,30, 21–31.
Muzzi, P. D., & Bisset, A. R. (1990). The effectiveness of ultrasonic wildlife warning devices toreduce moose fatalities along railway corridors. Alces, 26, 37–43.
Okada, A., Ito, T. Y., Buuveibaatar, B., Lhagvasuren, B., & Tsunekawa, A. (2012). Geneticstructure of Mongolian gazelle (Procapra gutturosa): The effect of railroad and demographicchange. Mongolian Journal of Biological Sciences, 10, 59–66.
Olson, K. A. (2013). Saiga crossing options: Guidelines and recommendations to mitigate barriereffects of border fencing and railroad corridors on saiga antelope in Kazakhstan. SmithsonianConservation Biology Institute. http://www.cms.int/sites/default/files/publication/Kirk_Olson_Saiga_Crossing_Options_English.pdf. Accessed November 11, 2016.
Olson, K. A., Mueller, T., Leimgruber, P., Nicolson, C., Fuller, T. K., Bolortsetseg, S., et al.(2009). Fences impede long-distance Mongolian Gazelle (Procapra gutturosa) movements indrought-stricken landscapes. Mongolian Journal of Biological Sciences, 7, 45–50.
Olson, K. A., & van der Ree, R. (2015). Railways, roads and fences across Kazakhistan andMongolia threaten the survival of wide-ranging wildlife. In R. van der Ree, D. J. Smith, & C.Grilo (Eds.), Handbook of road ecology (pp. 472–478). West Sussex: Wiley.
Olsson, M., Augustsson, E., Seiler, A., Widén, P., & Helldin, J.-O. (2010). The barrier effect oftwin tracked, non fenced railroads in Sweden. In Proceedings of the 2010 IENE InternationalConference on Ecology and Transportation (p. 76). Velence: Hungarian Academy of Sciences.
Orthlieb, X. (2016). Find a second life for old regional railway tracks in France allying transportperspective for the future and protection of the environment. In Proceedings of the 2016 IENEInternational Conference on Ecology and Transportation (p. 157). Lyon: Cerema andFondation pour la Recherche sur la Biodiversité.
Paquet, P., & Callaghan, C. (1996). Effects of linear developments on winter movements of graywolves in the Bow River Valley of Banff National Park, Alberta. In G. L. Evink, P. Garrett, D.
62 R. Barrientos and L. Borda-de-Água

Zeigler, & J. Berry (Eds.), Proceedings of the transportation related wildlife mortality seminar(pp. 46–66). Tallahassee: Florida Department of Transportation.
Pelletier, S. K., Carlson, L., Nein, D., & Roy, R. D. (2006). Railroad crossing structures for spottedturtles: Massachusetts Bay Transportation Authority—Greenbush rail line wildlife crossingdemonstration project. In C. L. Irwin, P. Garrett, & K. P. McDermott (Eds.), Proceedings of the2005 International conference on ecology and transportation (pp. 414–425). Raleigh: NorthCarolina State University.
Prunier, J. G., Kaufmann, B., Léna, J.-P., Fenet, S., Pompanon, F., & Joly, P. (2014).A 40-year-old divided highway does not prevent gene flow in the alpine newt Ichthyosauraalpestris. Conservation Genetics, 15, 453–468.
Qian, Z., Lin, X., Jun, M., Pan-Wen, W., & Qi-Sen, Y. (2009). Effects of the Qinghai-TibetRailway on the community structure of rodents in Qaidam desert region. Acta EcologicaSinica, 29, 267–271.
Railsback, S. F., & Grimm, V. (2011). Agent-based and individual-based modeling: A practicalintroduction. Princeton: Princeton University Press.
Reh, W., & Seitz, A. (1990). The influence of land use on the genetic structure of populations ofthe common frog Rana temporaria. Biological Conservation, 54, 239–249.
Riley, S. P. D., Pollinger, J. P., Sauvajot, R. M., York, E. C., Bromley, C., Fuller, T. K., et al.(2006). A southern California freeway is a physical and social barrier to gene flow incarnivores. Molecular Ecology, 15, 1733–1741.
Rodríguez, A., Crema, G., & Delibes, M. (1996). Use of non-wildlife passages across a high speedrailway by terrestrial vertebrates. Journal of Applied Ecology, 33, 1527–1540.
Rodríguez, A., Crema, G., & Delibes, M. (1997). Factors affecting crossing of red foxes andwildcats through non-wildlife passages across a high-speed railway. Ecography, 20, 287–294.
Rodríguez, J. J., García de la Morena, E., & González, D. (2008). Estudio de las medidascorrectoras para reducir las colisiones de aves con ferrocarriles de alta velocidad. Madrid:Centro de Estudios y Experimentación, Ministerio de Fomento.
Roger, E., Laffan, S. W., & Ramp, D. (2011). Road impacts a tipping point for wildlife populationsin threatened landscapes. Population Ecology, 53, 215–227.
Schaub, M., Aebischer, A., Gimenez, O., Berger, S., & Arlettaz, R. (2010). Massive immigrationbalances high anthropogenic mortality in a stable eagle owl population: Lessons forconservation. Biological Conservation, 143, 1911–1918.
Schwartz, C., & Bartley, B. (1991). Reducing incidental moose mortality: Considerations formanagement. Alces, 27, 93–99.
Simmons, J. M., Sunnucks, P., Taylor, A. C., & van der Ree, R. (2010). Beyond roadkill,radiotracking, recapture and FST—A review of some genetic methods to improveunderstanding of the influence of roads on wildlife. Ecology and Society, 15, 9.
Smith, D. J., & van der Ree, R. (2015). Field methods to evaluate the impacts of roads on wildlife.In R. van der Ree, D. J. Smith, & C. Grilo (Eds.), Handbook of road ecology (pp. 82–95). WestSussex: Wiley.
Smith, D. J., van der Ree, D., & Rosell, C. (2015). Wildlife crossing structures: An effectivestrategy to restore or maintain wildlife connectivity across roads. In R. van der Ree, D.J. Smith, & C. Grilo (Eds.), Handbook of road ecology (pp. 172–183). West Sussex: Wiley.
Soanes, K., Lobo, M. C., Vesk, P. A., McCarthy, M. A., Moore, J. L., & van der Ree, R. (2013).Movement re-established but not restored: Inferring the effectiveness of road-crossingmitigation for a gliding mammal by monitoring use. Biological Conservation, 159, 434–441.
Tremblay, M. A., & St. Clair, C. C. (2009). Factors affecting the permeability of transportation andriparian corridors to the movements of songbirds in an urban landscape. Journal of AppliedEcology, 46, 1314–1322.
Trewhella, W. J., & Harris, S. (1990). The effect of railway lines on urban fox (Vulpes vulpes)numbers and dispersal movements. Journal of Zoology, 221, 321–326.
Urban, D. L., Minor, E. S., Treml, E. A., & Schick, R. S. (2009). Graph models of habitat mosaics.Ecology Letters, 12, 260–273.
4 Railways as Barriers for Wildlife: Current Knowledge 63

van der Grift, E. A. (1999). Mammals and railroads: Impacts and management implications. Lutra,42, 77–98.
van der Ree, R., Smith, D. J., & Grilo, C. (2015). Handbook of road ecology. West Sussex: Wiley.van Why, K. R., & Chamberlain, M. J. (2003). Mortality of black bears, Ursus americanus,
associated with elevated train trestles. Canadian Field Naturalist, 117, 113–115.Vandevelde, J.-C., Bouhours, A., Julien, J.-F., Couvet, D., & Kerbiriou, C. (2014). Activity of
European common bats along railway verges. Ecological Engineering, 64, 49–56.Vandevelde, J.-C., Penone, C., & Julliard, R. (2012). High-speed railways are not barriers to
Pyronia tithonus butterfly movements. Journal of Insect Conservation, 16, 801–803.Waller, J. S., & Servheen, C. (2005). Effects of transportation infrastructure on grizzly bears in
northwestern Montana. Journal of Wildlife Management, 69, 985–1000.Waterman, E., Tulp, I., Reijnen, R., Krijgsveld, K., & Braak, C. (2002). Disturbance of meadow
birds by railway noise in The Netherlands. Geluid, 1, 2–3.Wells, P., Woods, J. G., Bridgewater, G., & Morrison, H. (1999). Wildlife mortalities on railways;
Monitoring methods and mitigation strategies. In G. Evink, P. Garrett, & D. Zeigler (Eds.),Proceedings of the third international conference on wildlife ecology and transportation(pp. 237–246). Tallahassee: Florida Department of Transportation.
Whittington, J., Hebblewhite, M., DeCesare, N. J., Neufeld, L., Bradley, M., Wilmshurst, J., et al.(2011). Caribou encounters with wolves increase near roads and trails: A time-to-eventapproach. Journal of Applied Ecology, 48, 1535–1542.
Wiącek, J., Polak, M., Filipiuk, M., Kucharczyk, M., & Bohatkiewicz, J. (2015). Do birds avoidrailroads as has been found for roads? Environmental Management, 56, 643–652.
Wrzesień, M., Jachuła, J., & Denisow, B. (2016). Railway embankments—Refuge areas for foodflora, and pollinators in agricultural landscape. Journal of Apicultural Science, 60, 97–110.
Xia, L., Yang, Q., Li, Z., Wu, Y., & Feng, Z. (2007). The effect of the Qinghai-Tibet railway onthe migration of Tibetan antelope Pantholops hodgsonii in Hoh-xil National Nature Reserve,China. Oryx, 41, 352–357.
Yanes, M., Velasco, J. M., & Suaréz, F. (1995). Permeability of roads and railways to vertebrates:The importance of culverts. Biological Conservation, 71, 217–222.
Yang, J., Jiang, Z., Zeng, Y., Turghan, M., Fang, H., & Li, C. (2011). Effect of anthropogeniclandscape features on population genetic differentiation of Przewalski’s Gazelle: Main role ofhuman settlement. PLoS ONE, 6, e20144.
Yang, Q., & Xia, L. (2008). Tibetan wildlife is getting used to the railway. Nature, 452, 810–811.Zuberogoitia, I., del Real, J., Torres, J. J., Rodríguez, L., Alonso, M., de Alba, V., et al. (2015).
Testing pole barriers as feasible mitigation measure to avoid bird vehicle collisions (BVC).Ecological Engineering, 83, 144–151.
Open Access This chapter is licensed under the terms of the Creative Commons Attribution 4.0International License (http://creativecommons.org/licenses/by/4.0/), which permits use, sharing,adaptation, distribution and reproduction in any medium or format, as long as you give appropriatecredit to the original author(s) and the source, provide a link to the Creative Commons license andindicate if changes were made.The images or other third party material in this chapter are included in the chapter’s Creative
Commons license, unless indicated otherwise in a credit line to the material. If material is notincluded in the chapter’s Creative Commons license and your intended use is not permitted bystatutory regulation or exceeds the permitted use, you will need to obtain permission directly fromthe copyright holder.
64 R. Barrientos and L. Borda-de-Água

Chapter 5Aliens on the Move: TransportationNetworks and Non-native Species
Fernando Ascensão and César Capinha
Abstract Biological invasions are a major component of global environmentalchange, threatening biodiversity and human well-being. These invasions have theirorigin in the human-mediated transportation of species beyond natural distributionranges, a process that has increased by orders of magnitude in recent decades as aresult of accelerating rates of international trade, travel, and transport. In thischapter, we address the role that overland transportation corridors, particularlyrailways, have in the transport of non-native species. We focus specifically on therole of rail vehicles in dispersing stowaway species, i.e. species that are movedinadvertently and that are not specific to the commodities being transported; we alsofocus on the natural dispersal and establishment of non-native species along railwayedges. We place these processes in the context of biological invasions as a globalphenomenon and provide examples from the literature. We also list general man-agement recommendations for biological invasions highlighting the particularitiesassociated with their management in railway transport systems. Following previousstudies, we briefly outline four possible management approaches: (1) “Do nothing;”(2) “Manage propagule supply;” (3) “Manage railway environments;” and (4) “Actover the invasive populations directly”. These approaches are not mutually exclu-sive, and they range from an expectation that natural processes (e.g. ecologicalsuccession) will drive the invaders out of the ecosystems, to the application of
Fernando Ascensão and César Capinha have contributed equally to this chapter.
F. AscensãoCIBIO/InBIO, Centro de Investigação em Biodiversidade e Recursos Genéticos,Universidade do Porto, Campus Agrário de Vairão, 4485-661 Vairão, Portugal
F. AscensãoCEABN/InBIO, Centro de Ecologia Aplicada “Professor Baeta Neves”,Instituto Superior de Agronomia, Universidade de Lisboa,Tapada da Ajuda, 1349-017 Lisboa, Portugal
C. Capinha (&)Global Health and Tropical Medicine Centre (GHTM), Instituto de Higiene e MedicinaTropical (IHMT), Universidade Nova de Lisboa, Lisboa, Portugale-mail: [email protected]
© The Author(s) 2017L. Borda-de-Água et al. (eds.), Railway Ecology,DOI 10.1007/978-3-319-57496-7_5
65

measures to extirpate the invaders directly (e.g. manual removal). We highlight thatbest practices for the management of invaders in railway-related systems may bedifficult to generalize and that they may have to be considered on a case-by-casebasis. We end by stressing that research on railways in the context of biologicalinvasions remains scarce, and that fundamental knowledge for understanding therelative importance of this transport system in the dispersal of species and on howthis process should be dealt with remains largely lacking.
Keywords Biological invasions � Stowaway species � Verges � Invasibility
Introduction
Nowadays non-native species are widespread around the world. These species,which have been moved beyond the limits of their natural ranges by humanactivities, include not only most farm animals and plants, forestry species and pets,but also many unwanted organisms such as mosquitoes, weeds, fungus and bac-teria. Although most of these species perish soon after arriving at the new area, oronce humans cease to care for them, a few do form wild populations and becomepart of the ecosystems (Williams and Newfield 2002). These species, often called as“invasive,” are now one of the most important causes of global change, beingresponsible for the decline and extinction of native species, economic losses, andhuman health problems (Simberloff et al. 2013).
Humans have been moving species since pre historic times (Di Castri 1989), butthe number of biological invasions and the magnitude of their impacts in the last fewdecades is unprecedented (Ricciardi 2007). This is to a great extent the result of therecent large scale expansion of the transportation network and of the increasingexchange of commodities to a nearly global coverage (Hulme 2009). Because of this,most of the earth’s surface is now within reach of non-native species. Moreover, thevolume and diversity of the cargo and number of passengers now being transported isalso much greater than in any period in the past (Hulme 2009). This allows for agreater diversity of species being introduced in new areas as well as a greater numberof their propagules, which increases both the number of potential invaders and theirability to establish (Lockwood et al. 2009). Finally, the latest technical advances intransportation allow species to move much faster. Even the least suspicious species,e.g. those that are more environmentally sensitive, may become invasive in remoteregions of the original distribution (Wilson et al. 2009). In summary, as the extent,volume, and efficiency of the transportation of people and freight increase, the burdenof biological invasions should also increase (Bradley et al. 2012).
Hulme et al. (2008) distinguish three main mechanisms by whichhuman-activities cause the dispersal of non-native species: (1) through importationas a commodity or with a commodity; (2) as stowaways, i.e. through a directinfluence of a transportation vehicle; and (3) by means of natural dispersal alongartificial infrastructures, such as water canals, roads, and, especially relevant for our
66 F. Ascensão and C. Capinha

concerns, railways. The first mechanism arises directly from trading activities,where the traded commodity may itself be the non-native species. In these cases, the“importation” of the species is deliberate, because some of its attributes are desiredin the area of destination. The reasons behind the importation of species are varied,and include farming, forestry, livestock, ornamental plants and pets, laboratorytesting or biocontrol. In some situations, the goal is purposely the formation of wildpopulations, as is the case of gaming and fishing or biocontrol agents. In othercases, the imported species are to be stored in enclosed environments, but they oftenescape from captivity. For instance, the American mink (Neovison vison) hasinvaded many European countries due to accidental escape or deliberate releasefrom fur farms (Vidal-Figueroa and Delibes 1987; Bonesi and Palazon 2007). It isworrisome that a great number of problematic invaders is still actively marketedtoday, including freshwater macroinvertebrates and fish (Capinha et al. 2013;Consuegra et al. 2011) and plants (Humair et al. 2015).
Trading activities may also lead to the arrival of non-native species as anaccidental “by-product” of a commodity, such as a commensal, a parasite or adisease. These species can remain undetected for long periods of time and maybenefit from measures towards the establishment to their hosts in the wild. Anillustrative example of such by-products of a traded commodity is the crayfishplague (Aphanomyces astaci) in Europe. This fungus-like disease is hosted byseveral North American crayfish species that were introduced in European wetlandsin order to boost the wild stocks of this food item. However, unlike for NorthAmerican species that co-evolved with the disease, the crayfish plague is deadly toEuropean species and has already caused numerous extinctions of local populations(Capinha et al. 2013).
Stowaway species can be associated with trading activities or any other activitythat involves a transportation vehicle. In other words, a non-native stowawayspecies is not specific to a particular commodity, and it can be any organism that atsome point is displaced by a vehicle or its load. This occurs more often with speciesthat are difficult to detect, such as those that are small or stealthy. Known examplesof these stowaway species include land snails attached to trains or their cargo(Peltanová et al. 2011), plankton in ship’s ballast waters (Hulme et al. 2008), orseeds in soil attached to automobiles (Hodkinson and Thompson 1997). Centers ofhuman and commodity transportation and nearby areas (e.g. seaports and railroadstations and yards) often provide the first records of non-native stowaways (e.g.Noma et al. 2010) and can host diverse communities of invasive species (Drake andLodge 2004).
Finally, transport infrastructures may also act as “corridors” for the naturaldispersal of non-native biodiversity. These infrastructures facilitate the dispersal ofnon-native organisms by allowing their movement across physical and environ-mental barriers (e.g. a mountain range now crossed by a tunnel), or by supplyingsuitable habitat for expanding invasive populations. Concerning the latter case, afew characteristics of the areas managed by transportation companies (e.g. road andrailway verges) are considered beneficial to the establishment of non-native species,particularly the regular occurrence of disturbance that gives rise to “vacant” niches
5 Aliens on the Move: Transportation Networks and Non-native … 67

and low biological diversity, reducing the number of potential competitors for spaceand resources (Catford et al. 2012).
In this chapter, we focus on the role of terrestrial transportation systems, par-ticularly railways, in dispersing stowaway fauna and flora and in facilitating thenatural dispersal of non-native species, i.e. the second and third mechanisms iden-tified above. We start by providing a contextual overview of the impacts of invasivespecies in a global context, in order to better familiarize readers with the significanceof the problem. We then focus on the role of railway traffic in transporting non-nativestowaway species and describe some of the best-known examples. Finally, wediscuss and provide examples of natural dispersal of non-native species alongtransportation corridors and conclude by discussing some of the management actionsthat could be taken to help reducing the spread of those species in railways.
Why Care about Invasive Species? An Overviewof Their Global-Scale Relevance
In natural environments, invasive species compete, predate and hybridize withnative species, and alter community structure and ecosystem processes, ultimatelyleading to irreversible changes on the diversity and distribution of life on earth(Simberloff et al. 2013; Capinha et al. 2015). Examples of mass extinctions pre-cipitated by the introduction of non-native species include nearly every native birdspecies on the Pacific island of Guam after the arrival of the invasive brown treesnake (Boiga irregularis) (Wiles et al. 2003), or the extinction of more than 100terrestrial gastropods due to the introduction of the predatory rosy wolf snail(Euglandina rosea) in tropical oceanic islands worldwide (Régnier et al. 2009). TheNile perch (Lates niloticus) is another paradigmatic example of the negativeimpacts of invasive species on native species. In the 1950s, this predatory fresh-water fish was intentionally introduced in Lake Victoria, Africa, to boost the lake’sfish stocks, which were becoming severely overfished. In the decades after itsintroduction, the Nile perch density grew massively leading to the extinction ofnearly 200 endemic species of cichlid fishes (Craig 1992).
The economic costs of invasive species can be striking. It is estimated thatinvasive species can cost many billions of dollars in the USA and in Europe alone(Pimentel et al. 2005; Davis 2009; Hulme 2009; Marbuah et al. 2014). For example,Bradshaw et al. (2016) recently compiled a comprehensive database of economiccosts of invasive insects. Taking all reported goods and service estimates, accordingto the authors’ study, invasive insects cost a minimum of US$70.0 billion per yearglobally and the associated health costs exceed US$6.9 billion per year. Thesevalues mainly reflect observable damages, such as those caused on other eco-nomically important species, e.g. the cinnamon fungus (Phytophthora cinnamomi)on the sweet chestnut (Castanea sativa in Europe, and Castanea dentata in NorthAmerica) (Vettraino et al. 2005), or on man-made infrastructures and equipment,
68 F. Ascensão and C. Capinha

e.g. the zebra mussel (Dreissena polymorpha) in water treatment works (Elliottet al. 2005). However, there are also many indirect damages that are difficult toquantify because they would require a deeper understanding of theecosystem-economy relationship (Bradshaw et al. 2016). Furthermore, manyinvasive species are also vectors of human diseases, such as malaria, plague, typhusor yellow fever, and their transportation may result in outbreaks of these infectionsin previously unsuspected areas (Lounibos 2010; Capinha et al. 2014). Also,invasive species may cause ecological or landscape changes that have negativeimplications for human safety, these can assume multiple forms, such as the pro-motion of pathogen eruptions (Vanderploeg et al. 2001), or an increase in thevulnerability of landscapes to natural hazards such as fires (Berry et al. 2011).
Importantly, many of the future impacts of non-native species may still remainunknown. For instance, the increased profusion of invasive species may render acascading effect on the vulnerability of ecosystems, i.e. by making these even moresusceptible to future impacts. Climate change is a further source of concern.Changes in climatic patterns altering the geography of the areas that can be invadedmay put additional pressures on native biodiversity. Understanding how theseprocesses will interact in the future to determine the impacts of biological invasionsis challenging. In fact, many future invasions may have already been set in motion,i.e. many non-native species are currently in a lag-phase, i.e. with little or noincrease in species occurrence, to be followed by an increase-phase in whichspecies occurrence and invasiveness rises rapidly before becoming invaders (Aikioet al. 2010; Essl et al. 2011).
Without increased efforts to manage non-native species in transportationinfrastructures, including in vehicles, transported cargo and verges, the number ofinvasive species will likely continue to grow steadily (Keller et al. 2011). Hence,more effective policies to reduce the transport and release of non-native species, andto manage those already established, should become a priority (Pimentel et al. 2005;Keller et al. 2011).
Non-native Hitchhikers: Transportation Vehiclesas Vectors of Stowaway Species
The surroundings of transportation infrastructures (e.g. verges and embankments)often host a high diversity of non-native species (Gelbard and Belnap 2003; Hansenand Clevenger 2005), in many cases due to their transportation as stowaways invehicles. Species can be accidentally moved by a vehicle in many different ways,e.g. snails and slugs clinging to a train, insects flying inside a vehicle, plant seeds inpassengers’ boots, or any organism that makes frequent use of cargo yards and thatis loaded unintentionally loaded with the cargo. Nevertheless, despite the range ofpossibilities, the movement of stowaway fauna and flora is poorly documented forterrestrial transportation systems. This is in contrast with aquatic transportation,especially maritime, for which there is a large body of research, particularly
5 Aliens on the Move: Transportation Networks and Non-native … 69

regarding the movement of species in ballast waters (Drake and Lodge 2004;Seebens et al. 2016). We speculate that overland transportation of biologicalstowaways is likely to be less frequent than those by aquatic vehicles; however, wealso suspect that the lack of studies for the terrestrial counterpart does not reflect thetrue contribution of this process for non-native species dispersal. Below we describea few documented cases where terrestrial transportation had a relevant role on theexpansion of biological invaders, with special emphasis on trains.
The spotted knapweed (Centaurea stoebe) is an example of a non-native speciesdispersed by trains. This plant, native to south east and central Europe, arrived inNorth America in the late 1800s and by the year 2000 it was already found in mostcontiguous American states (Sheley et al. 1998). The mechanisms that enabled sucha fast dispersal were unclear for a long time, but a recent reconstruction of thepatterns of invasion of this plant showed a close agreement between the extent ofcolonized areas and its velocity dispersal on one side, and the spatial coverage anddevelopment of the railway network in the USA on the other (Broennimann et al.2014). For instance, the wave of invasion was much faster and wider in the easternstates, where a denser and older network exists. In favor of the important role ofstowaway transportation of this species in trains, particularly for some long-distancedispersal events, is the plants’ known ability to become attached to the undercar-riages of vehicles (Sheley et al. 1998).
Trains are known to have been a vehicle of dispersal also for ragwort plantspecies. One of such cases concerns the South African ragwort (Senecio inae-quidens), a species introduced in Europe from South Africa in the first half of thetwentieth century, and that is now found from Norway in the north to Italy in thesouth, and from Bulgaria in the east to Spain in the west (Heger and Böhmer 2006).The achene-type fruit of this species is able to stick to trains in movement or to theirtransported commodities, a characteristic that contributed to the rapid dispersal ofthe species along railways systems (Heger and Böhmer 2005). Another plant of thisgroup known to “hitchhike” on trains is the Oxford ragwort (Senecio squalidus), ahybrid that escaped cultivation from the Oxford Botanic Garden. At the end of theeighteenth century it was established in some parts of Oxford (Harris 2002; Hegerand Böhmer 2005), and it currently invades most of Britain. George Druce, anEnglish botanist, described the dispersal of this plant as follows (1927b, p. 241, inHarris 2002): “ ... the vortex of air following the express train carries the fruits in itswake. I have seen them enter a railway-carriage window near Oxford and remainsuspended in the air in the compartment until they found an exit at Tilehurst [about40 km from Oxford]”.
A few records of animal species being transported as stowaways in trains canalso be found in the scientific literature and the media. Perhaps the most recurrentcases refer to urban pest species, such as rats and mice (Li et al. 2007), but there arealso references to ants (Elton 1958), beetles (White 1973), spiders (Nentwig andKobelt 2010) and even armadillos (Hofmann 2009). However, in these cases thecontribution of train-mediated transportation to the overall process of dispersalremains poorly studied.
70 F. Ascensão and C. Capinha

Verges as Habitat and Corridors for Non-native Species
Vegetated verges generally border transportation infrastructures, in particular rail-ways and roads. These verges are regularly mowed in order to ensure traffic safety,resulting in open and well-lighted areas. In places where the transportation corridoris wider, intense mowing is applied only to the zone closest to traffic, while thefarthest zone is managed less intensively, leading to the creation of awell-developed vegetation structure. These two zones of management regimeprovide habitat not only for native species but also for many non-native organisms.In Portugal, for example, many kilometers of railway and road verges are domi-nated by silver wattle (Acacia dealbata), one of the most widespread and damaginginvasive plants in the country (Sheppard et al. 2006; Vicente et al. 2011). This smalltree is native to Australia, and was introduced in Europe in the 1820s. In addition toits great natural dispersal ability, silver wattle inhibits undergrowth species fromgrowing, due to allelopathy, i.e. the ability to produce biochemical agents that thegrowth, survival, and reproduction of other organisms. Many other examples arereferenced in the literature on the presence and sometimes dominance of non-nativeweedy species in transportation verges (Ernst 1998; Parendes and Jones 2000;Tikka et al. 2001; Gelbard and Belnap 2003; Albrecht et al. 2011; McAvoy et al.2012; Penone et al. 2012; Suárez-Esteban et al. 2016). Even maritime or wetlandspecies may spread their populations into inland areas along railway and roadverges, as found in Finland (Suominen 1970), England (Scott and Davison 1982),or the USA (Wilcox 1989).
By facilitating dispersal, railways and roads may lead to homogeneous com-munities, sometimes dominated by invasive species. For example, Hansen andClevenger (2005) measured the frequency of several non-native plant species alongtransects from 0 to 150 m from the edge of railways and highways in grasslandsand forests, as well as at control sites away from corridors. These authors found thatboth transportation corridors had a higher frequency of non-native species than therespective control sites. Also, grasslands had a higher frequency of non-nativespecies than forested habitats, but this frequency did not differ between the high-ways and the railways. Other studies have described a decline in the presence ofinvasive species as a function of the distance to the transportation corridor (seeGelbard and Belnap 2003). Interestingly, the penetration of non-native species inareas adjacent to the transportation corridor is likely to vary according to thedominant land cover. In the study mentioned above, Hansen and Clevenger (2005)discovered that the frequency of non-native species in grasslands along railwaysand highways was higher than at control sites up to 150 m from the corridor’s edge,whereas in forested habitats the higher frequency of non-native species was onlyevident up to 10 m away from the corridor’s edge. A similar result was found inforested areas in the Chequamegon National Forest (USA), where invasive specieswere most prevalent within 15 m of roads but were uncommon in the interior of theforest (Watkins et al. 2003). Hence, it appears that the dispersal of non-native
5 Aliens on the Move: Transportation Networks and Non-native … 71

species in transportation corridors may have a lower impact in forested landscapesthan in open areas, such as grasslands.
The importance that verge areas represent for the spreading and fixation ofnon-native species is therefore clear. In fact, despite their relatively narrow width,verges can be long, creating continuous strips that may extend for many kilometersand occupy considerable areas. Knowing that the global railway and road lengthsare, respectively, approximately 1.1 and 64.3 million km (CIA 2016), and using aconservative value of mean verge width of two meters on each side, we realize thatmore than 262,000 kilometers of the world are occupied by verges. For compar-ison, this is equivalent to approximately 33% of the terrestrial protected areas ofNatura 2000 Network (EU 2016). Therefore, the management of the vegetation ofverges is of utmost importance not only for traffic safety, but also for the controlof non-native species.
Management of Non-native Speciesin Transportation Corridors
As discussed, transportation corridors can function as habitats and venues for thedispersal of non-native species, hence they are an important element to considerwhen managing and preventing the threats caused by biological invasions. On theother hand, verges can also help maintain conservation values and the connectivityamong landscapes, particularly in areas that are heavily modified by humanactivities (see Chap. 4). Because verges provide habitat areas and corridors for bothnative and non-native species, it creates management challenges, such as how tomaintain or increase the conservation value of transportation verges, while pre-venting non-native animal and plant species from spreading throughout the networkand its surroundings. A delicate balance between restricting the arrival and dispersalof non-native species and maintaining or restoring the conservation value of vergesis thus needed. This requires specific management actions, as we discuss below.
Identifying the factors that facilitate the arrival of propagules of non-nativespecies and their dispersal along the corridors may render it possible to manageverges in ways that limit the expansion of an invasive species (Fagan et al. 2002;With 2002). Despite the difficulties in identifying such key factors for all organ-isms, some general management practices are likely to prevent the dispersal ofnon-native species in most circumstances.
Perhaps the best management option is to avoid setting up the conditions fornon-native species dispersal and establishment when a corridor is under construc-tion, being upgraded or under maintenance. Such activities may imply baring soil,clearing of natural vegetation, or drainage, resulting in considerable disturbance ofnatural communities. In turn, these disturbances underlie ecological processes thatoften facilitate the colonization by invasive species, as they “remove” anypre-existing advantage of native over non-natives species that could be present in
72 F. Ascensão and C. Capinha

the area. Hence, reducing the disturbance of the existing communities as much aspossible, may be itself a good management practice.
Propagule pressure is also important. Christen and Matlack (2006) suggestedthat undisturbed areas are generally less invaded precisely because they may receivefewer non-native propagules. Avoiding the introduction of non-native propagulesprevents not only the establishment of invasive species, but also offers much greatereconomic benefits than the management of invasive populations after their estab-lishment (Keller et al. 2007). Equally important, management options availableprior to invasion are more numerous and include legislation or quarantine rules(Keller et al. 2011; Buckley and Catford 2016). In this context, the inspection ofcargo and their containers is of great importance, particularly for those having aninternational origin. For example, a recent inspection of international cargo enteringthe USA by rail enabled the identification of dozens of undeclared organisms,among which were invasive insects, noxious weeds and vectors of human diseases(https://goo.gl/fJ1uMo). Following legal rulings, some of the inspected cargo wasre-exported to its origin in order to prevent the dispersal of the unwanted pests.
In many cases, however, prevention is not possible as the non-native species arealready established in the landscape. In such cases, management actions should aimat containing or eradicating these species. However, the broad range of invasivespecies and the different ways that humans value the colonized ecosystems meanthat few generalizations can be provided for management and policy guidelines. Inother words, appropriate management and policies for invasive species is highlycontext dependent (Keller et al. 2011). However, based on the review provided byCatford et al. (2012), one can consider four not mutually exclusive main approachesfor managing transportation corridor verges when attempting to control or eradicateinvasive species: (1) “Do nothing;” (2) “Control at the introduction level bymanaging the propagule supply of non-native and native species;” (3) “Manageenvironmental conditions;” and (4) “Manage invasive species populations.”
1. Do nothing. This is an option when invaders are well established and are suc-cessional colonists. Several studies have shown that the proportion of invasivespecies can decrease with time since disturbance–not only weedy plants(Bellingham et al. 2005), but also larger plants (Dewine and Cooper 2008).Hence, active management by removal of invasive species immediately fol-lowing disturbance may be unnecessary and counterproductive. For example,tamarisk species (Tamarix ramosissima, T. chinensis, T. gallica and hybrids)have invaded riparian zones throughout western North America, southernAfrica, Argentina, Hawaii, and Australia, demanding expensive control efforts.However, as a relatively recent addition to North American plant communities(the 1920s–1960s was the period of main invasion), the competitive and suc-cessional processes are still ongoing. In fact, Dewine and Cooper (2008)demonstrated that box elder (Acer negundo), a native species found in canyonsthroughout western North America, is a superior competitor to tamarisk and iscapable of becoming established under dense tamarisk canopies, overtoppingand eventually killing the tamarisks. Thus, superior shade tolerance appears to
5 Aliens on the Move: Transportation Networks and Non-native … 73

be the mechanism for the successional replacement of tamarisk by box elder.The authors suggest that the preservation of box elder and other native treepopulations is probably a better and cheaper means of tamarisk control thantraditional control techniques.As highlighted by Catford et al. (2012), however, there are several argumentsagainst the “do nothing” approach. Firstly, ecosystem functions may be sig-nificantly altered by early successional invasive plants colonizing soon afterdisturbance (Peltzer et al. 2009). Secondly, some invasive species can out-compete functionally similar native species and therefore persist and dominateover long periods after disturbance (Christian and Wilson 1999). Thirdly,non-native species may establish themselves in highly disturbed areas first, andsubsequently adapt and colonize nearby areas with different environmentalconditions (Clark and Johnston 2011). Finally, most invasive species are notearly successional species that will be replaced over time, some of them are evenlong-lived K-strategists that are highly competitive and able to invade evenundisturbed areas (Wilsey et al. 2009).
2. Manage the propagule supply. By reducing the propagule pressure ofnon-native organisms and increasing that of native species, one can increase thedominance of the former. For example, one control action against silver wattle isthe use of prescribed fire to favor the germination of the seed bank, thereforereducing it by destroying part of the seeds or by stimulating the germination ofthe remainders (http://invasoras.pt). Applying this or other measures to reducethe seed bank soon after disturbance activities may strongly reduce thepropagule pressure and prevent or reduce the success of invasion. On the otherhand, native species suitable for direct sowing should also be selected based ontheir traits and ability to establish and persist under the specific conditions of thetransportation verges. This active selection towards native colonists may benefitnot only local biodiversity but also regional agricultural areas. Blackmore andGoulson (2014) found that sowing native wildflowers in road verges signifi-cantly increased the abundance of native flowering plants and that of pollinatorbumblebees (Bombus spp.) and hoverflies (Syrphidae), with benefits to agri-cultural crops. Furthermore, larvae of hoverflies prey on aphids, arthropod pestspecies that are responsible for enormous crop damages worldwide, every year.Hence, even easy to–implement interventions in verges may result in consid-erable environmental and economic gains.
3. Manage the environmental conditions. In some cases, it may be more effectiveto target the causes that boost the disturbance and facilitate the spread ofnon-native species than to attempt to manage their populations directly. Forexample, some weeds are particularly adapted to severely eroded verges. Ratherthan applying herbicide to control such weeds, it may be more effective tostabilize the soil (Catford et al. 2012). This option requires excellent knowledgeof the ecological requirements of each invader and it may imply conductingexperimental ecological work in order to evaluate the effectiveness of distinctmanagement actions. Nevertheless, for some of the species the necessary
74 F. Ascensão and C. Capinha

information already exists and is available in the various on-line databases thatprofile problematic invaders, such as the Invasive Species Compendium (http://sites.cabi.org/isc/), Invasoras (http://invasoras.pt) or the ‘Global InvasiveSpecies Database’ (http://www.iucngisd.org/).
4. Manage invasive species populations. For some highly problematic invasivespecies it may be more effective to focus on management techniques that directlytarget their populations. Traditional control techniques, such as the use of pre-scribed fire or herbicides, as well as mechanical removal may help to alleviate thecompetitive effects of some species and limit further spread. However, careshould be taken to minimize impacts on native species. If the non-native species,particularly plants, have unrestricted dispersal but infrequent propagule arrival,mapping and removing the individual colonist patches soon after they arise, mayachieve effective control. This is most important, as such patches often pose ahigh risk of becoming sources of subsequent dispersal (Moody and Mack 1988).Conversely, if the invasive species has limited dispersal ability, an effectivecontrol may be achieved by creating spatial discontinuities on vegetation types atan extent greater than the seed dispersal range, thereby breaking the continuity ofthe habitat to the invader (Christen and Matlack 2006).
Currently, railroad companies routinely clear-cut and/or spray with herbicide allvegetation that grows too close to the tracks. However, although this methoderadicates most of the vegetation (including native species), it also favors thedominance of species that respond favorably to clear-cutting or resist herbicides.Actually, in some cases, roadside herbicide treatments are known to reduce thecover of some non-native species favoring others (Gelbard and Belnap 2003).Hence, investing exclusively in the direct management of invasive populationsshould be accompanied by a careful evaluation of trade-offs and probably the bestoption is often a combination of various management possibilities.
Where to begin the control of invasive species is a major question whenmanaging railway verges. One factor that apparently influences the propagulepressure is the disturbance level of the transportation infrastructure. For example, itis known that older roads typically have higher cumulative levels of traffic andmaintenance than younger roads, which might result in an increase in non-nativespecies occurrence near old roads simply due to higher disturbance and therefore ofpropagule pressure. This was found for earthworms (Cameron and Bayne 2009) andthe invasive common reed (Phragmites australis) (Jodoin et al. 2008). Likewise,plant communities adjacent to roads that receive heavy traffic might be expected tobe invaded more than those adjacent to infrequently used and unpaved roads(Parendes and Jones 2000; Gelbard and Belnap 2003). Hence, the degree of per-turbation of the transportation corridor, namely the traffic level, could be used as anindicator of the invasion level of verges in railways, and to identify which corridorshould be targeted for management.
During the project phase of new railway corridors, engineers should considerwhether some routes might aid the dispersal of non-native species more than others.For example, routes expanding railways that are highly colonized by problematic
5 Aliens on the Move: Transportation Networks and Non-native … 75

invaders should be regularly monitored and managed to avoid the spread ofpropagules. Additionally, transportation networks can also be set to benefit peoplewhile minimizing their environmental and social costs. Integrating transportationverges in landscape connectivity management plans, including ecological corridors,would therefore better enable achieving the conservation goals, in particular toensure a sustainable co-existence between transportation networks with the con-servation of biodiversity.
Conclusions
Invasive species are responsible for many negative impacts on biodiversity andhuman welfare. What is worrisome is that as the transportation of people and goodsaround the world increases, so does the number of biological invasions. It is thusincreasingly important to identify the role that each transportation system has indispersing species beyond the limits of their natural ranges and to develop proce-dures by which this process can be reduced. Railways are responsible for severalimportant invasion events but, in comparison to other transportation systems, theiroverall contribution to biological invasions remains poorly understood. Likewise,the guidelines for preventing or managing the transportation of unwanted organismsin trains or along railways are poorly synthesized and consist mainly of a hand-fullof general principles that can be applied to overland transportation systems ingeneral. Thus it is thus clear that more research must be devoted to this topic.Particularly relevant contributions include the identification or “profiling” of thespecies that go as stowaways in trains or their cargo, and the identification of thecharacteristics of railways verges that contribute to the natural dispersal andestablishment of invaders over native species. Such knowledge remains vital forassessing the relative importance of railways systems in biological invasions and tohelping prioritize which measures to take in order to reduce the human dispersal ofunwanted species.
Acknowledgements Fernando Ascensão acknowledges financial support by the Infraestruturasde Portugal Biodiversity Chair—CIBIO—Research Center in Biodiversity and Genetic Resources.César Capinha acknowledges financial support from the Portuguese Foundation for Science andTechnology (FCT/MCTES) and POPH/FSE (EC) trough grant SFRH/BPD/84422/2012.
References
Aikio, S., Duncan, R. P., & Hulme, P. E. (2010). Lag-phases in alien plant invasions: Separatingthe facts from the artefacts. Oikos, 119, 370–378.
Albrecht, H., Eder, E., Langbehn, T., & Tschiersch, C. (2011). The soil seed bank and itsrelationship to the established vegetation in urban wastelands. Landscape and Urban Planning,100, 87–97.
76 F. Ascensão and C. Capinha

Bellingham, P. J., Peltzer, D. A., & Walker, L. R. (2005). Contrasting impacts of a native and aninvasive exotic shrub on flood-plain succession. Journal of Vegetation Science, 16, 135–142.
Berry, Z. C., Wevill, K., & Curran, T. J. (2011). The invasive weed Lantana camara increases firerisk in dry rainforest by altering fuel beds. Weed Research, 51, 525–533.
Blackmore, L. M., & Goulson, D. (2014). Evaluating the effectiveness of wildflower seed mixesfor boosting floral diversity and bumblebee and hoverfly abundance in urban areas. InsectConservation and Diversity, 7, 480–484.
Bonesi, L., & Palazon, S. (2007). The American mink in Europe: Status, impacts, and control.Biological Conservation, 134, 470–483.
Bradley, B., Blumenthal, D. M., Early, R., Grosholz, E. D., Lawler, J. J., Miller, L. P., et al.(2012). Global change, global trade, and the next wave of plant invasions. Frontiers in Ecologyand the Environment, 10, 20–28.
Bradshaw, C. J. A., Leroy, B., Bellard, C., Roiz, D., Albert, C., Fournier, A., et al. (2016). Massiveyet grossly underestimated global costs of invasive insects. Nature Communications, 7, 12986.
Broennimann, O., Mráz, P., Petitpierre, B., Guisan, A., & Müller-Schärer, H. (2014). Contrastingspatio-temporal climatic niche dynamics during the eastern and western invasions of spottedknapweed in North America. Journal of Biogeography, 41, 1126–1136.
Buckley, Y. M., & Catford, J. (2016). Does the biogeographic origin of species matter? Ecologicaleffects of native and non-native species and the use of origin to guide management. Journal ofEcology, 104, 4–17.
Cameron, E. K., & Bayne, E. M. (2009). Road age and its importance in earthworm invasion ofnorthern boreal forests. Journal of Applied Ecology, 46, 28–36.
Capinha, C., Essl, F., Seebens, H., Moser, D., & Pereira, H. M. (2015). The dispersal of alienspecies redefines biogeography in the Anthropocene. Science, 348, 1248–1251.
Capinha, C., Larson, E. R., Tricarico, E., Olden, J. D., & Gherardi, F. (2013). Effects of climatechange, invasive species, and disease on the distribution of native European crayfishes.Conservation Biology, 27, 731–740.
Capinha, C., Rocha, J., & Sousa, C. A. (2014). Macroclimate determines the global range limit ofAedes aegypti. EcoHealth, 11, 420–428.
Catford, J. A., Daehler, C. C., Murphy, H. T., Sheppard, A. W., Hardesty, B. D., Westcott, D.,et al. (2012). The intermediate disturbance hypothesis and plant invasions: Implications forspecies richness and management. Perspectives in Plant Ecology, Evolution and Systematics,14, 231–241.
Christen, D., & Matlack, G. (2006). The role of roadsides in plant invasions: A demographicapproach. Conservation Biology, 20, 385–391.
Christian, J. M., & Wilson, S. D. (1999). Long-term ecosystem impacts of an introduced grass inthe northern great plains. Ecology, 80, 2397–2407.
CIA (2016). The World Factbook—railways. https://www.cia.gov/library/publications/the-world-factbook/rankorder/2121rank.html
Clark, G. F., & Johnston, E. L. (2011). Temporal change in the diversity-invasibility relationshipin the presence of a disturbance regime. Ecology Letters, 14, 52–57.
Consuegra, S., Phillips, N., Gajardo, G., & de Leaniz, C. G. (2011). Winning the invasion roulette:Escapes from fish farms increase admixture and facilitate establishment of non-native rainbowtrout. Evolutionary Applications, 4, 660–671.
Craig, J. F. (1992). Human-induced changes in the composition of fish communities in the AfricanGreat Lakes. Reviews in Fish Biology and Fisheries, 2, 93–124.
Davis, M. A. (2009). Invasion Biology. New York: Oxford University Press.Dewine, J. M., & Cooper, D. J. (2008). Canopy shade and the successional replacement of
tamarisk by native box elder. Journal of Applied Ecology, 45, 505–514.Di Castri, F. (1989). History of biological invasions with special emphasis on the Old World.
In J. A. Drake, H. A. Mooney, F. Di Castri, R. H. Groves, F. J. Krüger, M. Rejmanek, & M.Williamson (Eds.), Biological Invasions: A Global Perspective (pp. 1–30). Chichester: Wiley.
5 Aliens on the Move: Transportation Networks and Non-native … 77

Drake, J. M., & Lodge, D. M. (2004). Global hot spots of biological invasions: evaluating optionsfor ballast-water management. Proceedings of the Royal Society B: Biological Sciences, 271,575–580.
Elliott, P., Cantab, M. A., Aldridge, D. C., & Moggrldge, P. G. D. (2005). The increasing effects ofzebra mussels on water installations in England.Water and Environment Journal, 19, 367–375.
Elton, C. S. (1958). The ecology of invasions by animals and plants. Chicago: University ofChicago Press.
Ernst, W. H. O. (1998). Invasion, dispersal and ecology of the South African neophyte Senecioinaequidens in The Netherlands: From wool alien to railway and road alien. Acta BotanicaNeerlandica, 47, 131–151.
Essl, F., Dullinger, S., Rabitsch, W., Hulme, P. E., Hülber, K., Jarošík, V., et al. (2011).Socioeconomic legacy yields an invasion debt. Proceedings of the National Academy ofSciences of the United States of America, 108, 203–207.
EU. (2016). Natura 2000 barometer. http://ec.europa.eu/environment/nature/natura2000/barometer/index_en.htm
Fagan, W. F., Lewis, M. A., Neubert, M. G., & Van Den Driessche, P. (2002). Invasion theory andbiological control. Ecology Letters, 5, 148–157.
Gelbard, J. L., & Belnap, J. (2003). Roads as conduits for exotic plant invasions in a semiaridlandscape. Conservation Biology, 17, 420–432.
Hansen, M. J., & Clevenger, A. P. (2005). The influence of disturbance and habitat on the presenceof non-native plant species along transport corridors. Biological Conservation, 125, 249–259.
Harris, S. A. (2002). Introduction of Oxford ragwort, Senecio squalidus L. (Asteraceae), to theUnited Kingdom. Watsonia, 24, 31–43.
Heger, T., & Böhmer, H. J. (2005). The invasion of Central Europe by Senecio inaequidens DC—A complex biogeographical problem. Erdkunde, 59, 34–49.
Heger, T., & Böhmer, H. (2006). NOBANIS—Invasive alien species fact sheet—Senecioinaequidens. Online database of the European Network on invasive alien species—NOBANIS. url:www.nobanis.org
Hodkinson, D. J., & Thompson, K. (1997). Plant dispersal: The role of man. Journal of AppliedEcology, 34, 1484–1496.
Hofmann, J. E. (2009). Records of nine-banded armadillos, Dasypus novemcinctus, in Illinois.Transactions of the Illinois State Academy of Science, 102, 95–106.
Hulme, P. E. (2009). Trade, transport and trouble: Managing invasive species pathways in an eraof globalization. Journal of Applied Ecology, 46, 10–18.
Hulme, P. E., Bacher, S., Kenis, M., Klotz, S., Kühn, I., Minchin, D., et al. (2008). Grasping at theroutes of biological invasions: A framework for integrating pathways into policy. Journal ofApplied Ecology, 45, 403–414.
Humair, F., Humair, L., Kuhn, F., & Kueffer, C. (2015). E-commerce trade in invasive plants.Conservation Biology: The Journal of the Society for Conservation Biology, 0, 1–8.
Jodoin, Y., Lavoie, C., Villeneuve, P., Theriault, M., Beaulieu, J., & Belzile, F. (2008). Highwaysas corridors and habitats for the invasive common reed Phragmites australis in Quebec,Canada. Journal of Applied Ecology, 45, 459–466.
Keller, R. P., Geist, J., Jeschke, J. M., & Kühn, I. (2011). Invasive species in Europe: Ecology,status, and policy. Environmental Sciences Europe, 23, 23.
Keller, R. P., Lodge, D. M., & Finnoff, D. C. (2007). Risk assessment for invasive speciesproduces net bioeconomic benefits. Proceedings of the National Academy of Sciences of theUnited States of America, 104, 203–207.
Li, B., Wang, Y., & Zhang, M. (2007). Guard against invasion of Rattus norvegicus intoTibet along Qinghai-Tibet railway. Research of Agricultural Modernization, 3, 24.
Lockwood, J. L., Cassey, P., & Blackburn, T. M. (2009). The more you introduce the more youget: The role of colonization pressure and propagule pressure in invasion ecology. Diversityand Distributions, 15, 904–910.
Lounibos, L. (2010). Human disease vectors. In D. Simberloff & M. Rejmánek (Eds.),Encyclopedia of Biological Invasions. Berkeley: University of California Press.
78 F. Ascensão and C. Capinha

Marbuah, G., Gren, I.-M., & McKie, B. (2014). Economics of harmful invasive species: A review.Diversity, 6, 500–523.
McAvoy, T. J., Snyder, A. L., Johnson, N., Salom, S. M., & Kok, L. T. (2012). Road survey of theinvasive tree-of-heaven (Ailanthus altissima) in Virginia. Invasive Plant Science andManagement, 5, 506–512.
Moody, M. E., & Mack, R. N. (1988). Controlling the spread of plant invasions: The importanceof nascent foci. Journal of Applied Ecology, 25, 1009–1021.
Nentwig, W., & Kobelt, M. (2010). Spiders (Araneae). In BioRisk 4: Alien Terrestrial Arthropodsof Europe (Vol. 4, pp. 131–147). Pensoft Publishers.
Noma, T., Colunga-Garcia, M., Brewer, M., Landis, J., Gooch, A., & Philip, M. (2010).Carthusian snail Monacha cartusiana. Michigan State University’s invasive species factsheets.http://www.ipm.msu.edu/uploads/files/forecasting_invasion_risks/carthusiansnail.pdf
Parendes, L. A., & Jones, J. A. (2000). Role of light availability and dispersal in exotic plantinvasion along roads and streams in the H.J. Andrews experimental forest, Oregon.Conservation Biology, 14, 64–75.
Peltanová, A., Petrusek, A., Kment, P., & Juřičková, L. (2011). A fast snail’s pace: Colonization ofCentral Europe by Mediterranean gastropods. Biological Invasions, 14, 759–764.
Peltzer, D. A., Bellingham, P. J., Kurokawa, H., Walker, L. R., Wardle, D. A., & Yeates, G. W.(2009). Punching above their weight: Low-biomass non-native plant species alter soilproperties during primary succession. Oikos, 118, 1001–1014.
Penone, C., Machon, N., Julliard, R., & Le Viol, I. (2012). Do railway edges provide functionalconnectivity for plant communities in an urban context? Biological Conservation, 148, 126–133.
Pimentel, D., Zuniga, R., & Morrison, D. (2005). Update on the environmental and economic costsassociated with alien-invasive species in the United States. Ecological Economics, 52, 273–288.
Régnier, C., Fontaine, B., & Bouchet, P. (2009). Not knowing, not recording, not listing:Numerous unnoticed mollusk extinctions. Conservation Biology, 23, 1214–1221.
Ricciardi, A. (2007). Are modern biological invasions an unprecedented form of global change?Conservation Biology, 21, 329–336.
Scott, N. E., & Davison, A. W. (1982). De-icing salt and the invasion of road verges by maritimeplants. Watsonia, 14, 41–52.
Seebens, H., Schwartz, N., Schupp, P. J., & Blasius, B. (2016). Predicting the spread of marinespecies introduced by global shipping. Proceedings of the National Academy of Sciences, 113,5646–5651.
Sheley, R. L., Jacobs, J. S., & Carpinelli, M. F. (1998). Distribution, biology, and management ofdiffuse knapweed (Centaurea diffusa) and spotted knapweed (Centaurea maculosa). WeedTechnology, 12, 353–362.
Sheppard, A. W., Shaw, R. H., & Sforza, R. (2006). Top 20 environmental weeds for classicalbiological control in Europe: A review of opportunities, regulations and other barriers toadoption. Weed Research, 46, 93–117.
Simberloff, D., Martin, J. L., Genovesi, P., Maris, V., Wardle, D. A., Aronson, J., et al. (2013).Impacts of biological invasions: What’s what and the way forward. Trends in Ecology &Evolution, 28, 58–66.
Suárez-Esteban, A., Fahrig, L., Delibes, M., & Fedriani, J. M. (2016). Can anthropogenic lineargaps increase plant abundance and diversity? Landscape Ecology, 31, 721–729.
Suominen, J. (1970). On Elymus arenarius (Gramineae) and its spread in Finnish inland areas.Annales Botanici Fennici, 7, 143–156.
Tikka, P. M., Högmander, H., & Koski, P. S. (2001). Road and railway verges serve as dispersalcorridors for grassland plants. Landscape Ecology, 16, 659–666.
Vanderploeg, H. A., Liebig, J. R., Carmichael, W. W., Agy, M. A., Johengen, T. H., Fahnenstiel,G. L., et al. (2001). Zebra mussel (Dreissena polymorpha) selective filtration promoted toxicmicrocystis blooms in Saginaw Bay (Lake Huron) and Lake Erie. Canadian Journal ofFisheries and Aquatic Sciences, 58, 1208–1221.
5 Aliens on the Move: Transportation Networks and Non-native … 79

Vettraino, A. M., Morel, O., Perlerou, C., Robin, C., Diamandis, S., & Vannini, A. (2005).Occurrence and distribution of Phytophthora species in European chestnut stands, and theirassociation with ink disease and crown decline. European Journal of Plant Pathology, 111,169–180.
Vicente, J., Randin, C. F., Gonçalves, J., Metzger, M. J., Lomba, Â., Honrado, J., et al. (2011).Where will conflicts between alien and rare species occur after climate and land-use change? Atest with a novel combined modelling approach. Biological Invasions, 13, 1209–1227.
Vidal-Figueroa, T., & Delibes, M. (1987). Primeros datos sobre el visón americano (Mustelavison) en el Suroeste de Galicia y Noroeste de Portugal. Ecologia, 1, 145–152.
Watkins, R. Z., Chen, J., Pickens, J., & Brosofske, K. D. (2003). Effects of forest roads onunderstory plants in a managed hardwood landscape. Conservation Biology, 17, 411–419.
White, T. C. R. (1973). The establishment, spread and host range of Paropsis charybdis Stal.Pacific Insects, 15, 59–66.
Wilcox, D. A. (1989). Migration and control of purple loosestrife (Lythrum salicaria L.) alonghighway corridors. Environmental Management, 13, 365–370.
Wiles, G. J., Bart, J., Beck, R. E., & Aguon, C. F. (2003). Impacts of the brown tree snake:Patterns of decline and species persistence in Guam’s avifauna. Conservation Biology, 17,1350–1360.
Williams, P. A., & Newfield, M. (2002). A weed risk assessment system for new conservationweeds in New Zealand. Wellington, New Zealand: Department of Conservation.
Wilsey, B. J., Teaschner, T. B., Daneshgar, P. P., Isbell, F. I., & Polley, H. W. (2009). Biodiversitymaintenance mechanisms differ between native and novel exotic-dominated communities.Ecology Letters, 12, 432–442.
Wilson, J. R. U., Dormontt, E. E., Prentis, P. J., Lowe, A. J., & Richardson, D. M. (2009).Something in the way you move: Dispersal pathways affect invasion success. Trends inEcology & Evolution, 24, 136–144.
With, K. A. (2002). The landscape ecology of invasive spread. Conservation Biology, 16, 1192–1203.
Open Access This chapter is licensed under the terms of the Creative Commons Attribution 4.0International License (http://creativecommons.org/licenses/by/4.0/), which permits use, sharing,adaptation, distribution and reproduction in any medium or format, as long as you give appropriatecredit to the original author(s) and the source, provide a link to the Creative Commons license andindicate if changes were made.The images or other third party material in this chapter are included in the chapter’s Creative
Commons license, unless indicated otherwise in a credit line to the material. If material is notincluded in the chapter’s Creative Commons license and your intended use is not permitted bystatutory regulation or exceeds the permitted use, you will need to obtain permission directly fromthe copyright holder.
80 F. Ascensão and C. Capinha

Chapter 6Railway Disturbances on Wildlife:Types, Effects, and Mitigation Measures
Priscila Silva Lucas, Ramon Gomes de Carvalho and Clara Grilo
Abstract In this chapter, we review the level of disturbance caused by railways dueto noise and vibration, air, soil and water pollution, and soil erosion. There is evidencethat soil and hydrology contamination may affect vegetation and aquatic fauna whilenoise can affect terrestrial vertebrates. In fact, noise, light, and vibration due torailways have been observed to reduce the abundance and richness of some insects,amphibians, and birds, and to cause avoidance behaviour on predators. Interestingly,reptiles, some bird species, small mammals, and large mammals seem to ignore railtraffic and benefit from the vegetation planted in the railway verges that provide foodand shelter. Some engineering structures have been implemented to reduce the effectsof railway disturbance: rail fastenings, rail dampers, under-sleeper pads, and noisebarriers are applied to minimize noise and vibration; washing with water and cleaningthe ballast are used to mitigate soil pollution; and grass plantation, the use of gypsumand application of compost/mulch coverage, are applied to control soil erosion.
Keywords Noise and vibration � Air and soil pollution � Water pollution � Soilerosion � Terrestrial vertebrates � Species richness � Avoidance effect
Introduction
The construction and operation of railways implies changes in the surroundedlandscape that alter the microclimate, soil, and hydrological dynamics, contributingto the degradation of the natural habitat for many species (Forman and Alexander1998; Eigenbrod et al. 2009). During operation, the main disturbances caused byrailways are air, soil and water pollution, as well as noise and vibration, which
P.S. Lucas (&) � R.G. de Carvalho � C. GriloCentro Brasileiro de Estudos em Ecologia de Estradas,Universidade Federal de Lavras, Lavras 37200-000, Brazile-mail: [email protected]
C. GriloSetor Ecologia, Departamento Biologia, Universidade Federalde Lavras, Lavras 37200-000, Brazil
© The Author(s) 2017L. Borda-de-Água et al. (eds.), Railway Ecology,DOI 10.1007/978-3-319-57496-7_6
81

may alter species richness and species abundance (e.g. Penone et al. 2012;Clauzel et al. 2013). In this chapter, we review these disturbance sources, theireffects on wildlife and the main actions to avoid or minimize their effects.
Main Railway Disturbances: Noise and Vibration, and Air,Soil and Water Pollution
The two most known disturbances of railways are the noise and vibrations causedby passing trains. However, railways are also responsible for a large amount ofemissions that cover a wide range of pollutants and toxic substances that affect theatmosphere, soil and water worldwide (Plakhotnik et al. 2005). Another impactresulting from the construction and establishment of the railways is soil erosion.Here, we describe the main railway disturbances that can potentially affect wildlife.
Noise and Vibration
Railway noise pollution can be either from airborne sound or fromvibration-induced as a result of rail traffic (Czop and Mendrok 2011; Palacin et al.2014). The main source of railway noise comes from freight wagons, followed byhigh-speed trains and inner-urban railways (Guarinoni et al. 2012). However,locomotives passing and accelerating, freight wagons braking, vibrations from railcorrugation, and out-of-round wheels or vehicle coupling in shunting yards, areother sources of noise (Clausen et al. 2010). Noise levels vary, depending on thelandscape and weather; open and flat areas allow noise to travel further than forestor mountains areas. In mountainou areas, the effect of noise is greater withinvalleys, when their width is less than the height of their walls, reducing theattenuating effect of noise (Chiocchia et al. 2010). Frost can make the ground hardand impede sound absorption, but fog prevents noise from dissipating.
Noise above 55 dB(A), where dB(A) is a measure that attempts to correct theway the human ear perceives loudness, is considered noise pollution for humans,and the sound values in the range 65–75 dB(A) cause stress to the body, leading toarterial hypertension (high blood pressure), cardiovascular disease, and heartattacks (Berglund et al. 1999). In Canada, the sound level of a passing train reachesvalues up to 85 dB(A), but between trains the sound levels drop to 43–53 dB(A)(CTA 2015). Measurement campaigns on high speed trains in several Europeancountries over 10 years revealed sound values ranging from 85.5 to 97 dB(A) whenthe train speed was between 250 and 350 km/h (Gautier et al. 2008). In Japan,Matsumoto et al. (2005) compared the noise as a function of distance and observeda high noise level of 64 dB at 200 m from a railway in the countryside, a valuesimilar to that near residential areas (65.7 dB). In fact, in Japan, noise can still reach72 dB at 50 m from the track, i.e., higher than the Japanese permissible standards of70 dB(A) (Kanda et al. 2007).
82 P.S. Lucas et al.
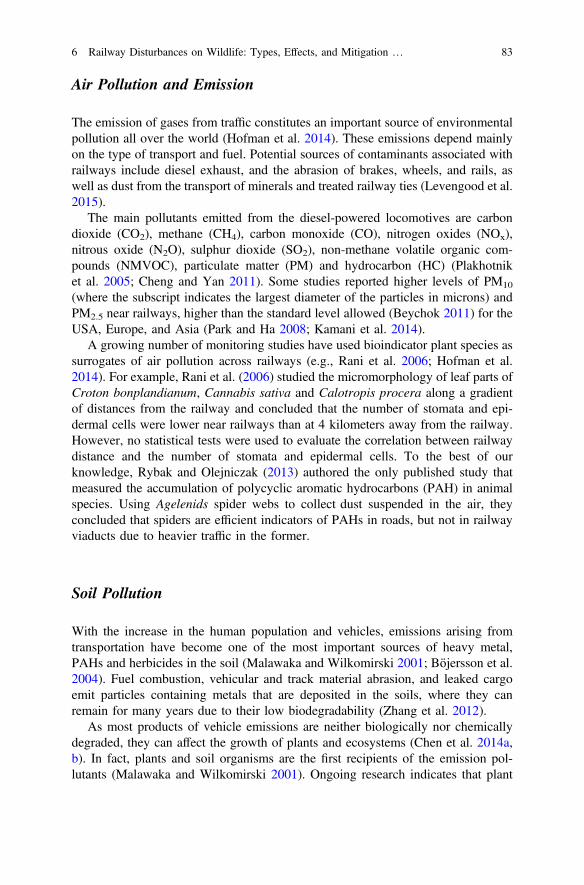
Air Pollution and Emission
The emission of gases from traffic constitutes an important source of environmentalpollution all over the world (Hofman et al. 2014). These emissions depend mainlyon the type of transport and fuel. Potential sources of contaminants associated withrailways include diesel exhaust, and the abrasion of brakes, wheels, and rails, aswell as dust from the transport of minerals and treated railway ties (Levengood et al.2015).
The main pollutants emitted from the diesel-powered locomotives are carbondioxide (CO2), methane (CH4), carbon monoxide (CO), nitrogen oxides (NOx),nitrous oxide (N2O), sulphur dioxide (SO2), non-methane volatile organic com-pounds (NMVOC), particulate matter (PM) and hydrocarbon (HC) (Plakhotniket al. 2005; Cheng and Yan 2011). Some studies reported higher levels of PM10
(where the subscript indicates the largest diameter of the particles in microns) andPM2.5 near railways, higher than the standard level allowed (Beychok 2011) for theUSA, Europe, and Asia (Park and Ha 2008; Kamani et al. 2014).
A growing number of monitoring studies have used bioindicator plant species assurrogates of air pollution across railways (e.g., Rani et al. 2006; Hofman et al.2014). For example, Rani et al. (2006) studied the micromorphology of leaf parts ofCroton bonplandianum, Cannabis sativa and Calotropis procera along a gradientof distances from the railway and concluded that the number of stomata and epi-dermal cells were lower near railways than at 4 kilometers away from the railway.However, no statistical tests were used to evaluate the correlation between railwaydistance and the number of stomata and epidermal cells. To the best of ourknowledge, Rybak and Olejniczak (2013) authored the only published study thatmeasured the accumulation of polycyclic aromatic hydrocarbons (PAH) in animalspecies. Using Agelenids spider webs to collect dust suspended in the air, theyconcluded that spiders are efficient indicators of PAHs in roads, but not in railwayviaducts due to heavier traffic in the former.
Soil Pollution
With the increase in the human population and vehicles, emissions arising fromtransportation have become one of the most important sources of heavy metal,PAHs and herbicides in the soil (Malawaka and Wilkomirski 2001; Böjersson et al.2004). Fuel combustion, vehicular and track material abrasion, and leaked cargoemit particles containing metals that are deposited in the soils, where they canremain for many years due to their low biodegradability (Zhang et al. 2012).
As most products of vehicle emissions are neither biologically nor chemicallydegraded, they can affect the growth of plants and ecosystems (Chen et al. 2014a,b). In fact, plants and soil organisms are the first recipients of the emission pol-lutants (Malawaka and Wilkomirski 2001). Ongoing research indicates that plant
6 Railway Disturbances on Wildlife: Types, Effects, and Mitigation … 83

uptake varies among species. For example, leucaena (Leucaena leucocephala),annual meadow grass (Poa annua), and indigofera (Indigofera amblyantha) areknown to have high translocation capacity for some metals, such as lead (Pb) andcadmium (Cd), but limited translocation of heavy metals from the roots to theaboveground tissues (Chen et al. 2014a, b), while others show the opposite trend(Ge et al. 2003).
High concentration levels of heavy metals are often found in the vicinity ofrailways. Wiłkomirski et al. (2011) reported the same concentration of molybdenum(Mo) close to and approximately 2 km from the railways in Poland. For instance,the concentration of nickel, cadmium, cobalt, and lead in the moss (Pleuroziumschreberi) was the same 30 m from the railway as it was at points near the railways(Mazur et al. 2013). In addition, high concentrations of PAHs were found in theaerial parts of plant species near the railway and up to distances of 30 m from therailway (Malawaka and Wilkomirski 2001; Wiłkomirski et al. 2011). On railways,in particular, the biodegradation of PAHs and herbicides is extremely low and canpersist over decades (Wilkomirski et al. 2012).
Water Pollution
Infrastructures associated with railways (e.g., leakages of petroleum products fromfuel storage tanks) contribute, together with pollutants, to aquatic ecosystems(Schweinsberg et al. 1999; Vo et al. 2015). Levengood et al. (2015) documentedhigh concentrations of PAHs and heavy metals in waterways bisected or borderedby railways. They showed that the PAH concentration was higher downstream thanupstream of the railway (Levengood et al. 2015). They also found that phenan-threne and dibenzo (a, h) anthracene (a PAH element) concentrations at some sitesrepresented a risk to aquatic life, whereas the chromium (Cr) values were still belowthe levels of concern for aquatic life (Levengood et al. 2015).
Herbicides and pesticides are other sources of water pollution. For herbicides,Schweinsberg et al. (1999) discovered that in Germany before the 1990s, a muchhigher total amount of these compounds were applied on railway tracks than inagriculture. Recently, Vo et al. (2015) showed that many herbicides applied duringthe operation of the railway are at concentrations that are lethal to most of theaquatic fauna, particularly fish populations; they indicate that compounds such asImazapyr or Diuron concentrations can take 6 and 48 months, respectively, to dropbelow 50% of their original levels.
Soil Erosion and Changes in Hydrology
The abrupt change of soil required to establish the railway embankment leads tovegetation loss, compresses the soil, and compromises water drainage (Ferrell and
84 P.S. Lucas et al.

Lautala 2010). Thus, soil becomes exposed and subject to an increasing runoff thatpromotes its erosion (Chen et al. 2015). The erosion of rail embankments can resultin a washing out of sediments (Jin et al. 2008) that cause water pollution.Furthermore, Gregorich et al. (1998) noted that soil erosion and deposition alter thebiological process of carbon mineralization in soil landscapes, which affects the soilquality and, hence, the vegetation.
Railway construction parallel to streams can result in hydrological disconnec-tions (Pennington et al. 2010) that dry the soils (Blanton and Marcus 2009). Suchdisconnections can have a significant impact on the ecological function of riparianlandscapes by negatively affecting floodplain evolution, riparian ecosystem pro-cesses, and associated biodiversity (Snyder et al. 2002). Although urban riparianareas could harbor great diversity of native canopy and shrub species, the richnessof native canopy species was lower near railways (Snyder et al. 2002).
Effects of Railway Disturbance on Wildlife
There is evidence that disturbance from noise, lights, and vibrations associated withthe construction and operation of the railway affect some species, and this can occurat various life cycles (van Rooyen 2009; Wiacek et al. 2015). In contrast, otherstudies suggest that wildlife ignores or adapts to railway disturbances (Ghosh et al.2010; Mundahl et al. 2013). As observed for roads, the severity of railway dis-turbance depends on the species’ bio-ecological features and on the degree of thedisturbance (e.g., Rytwinski and Fahrig 2012). However, little is known about theirrole in species viability. We now review the main findings on wildlife behaviourresponses to railway disturbance.
Insects
To the best of our knowledge, only the study by Penone et al. (2012) assessed theimpact of railways on insects. They studied Tettigoniidae (bush crickets) at railwayedges in an urban context (Penone et al. 2012), and found that species richness andabundance was explained by a quadratic effect of train speed (described by a hump-backed curve). This is especially true of mobile species at larger scales than onsedentary species. However, vegetated railway verges had a significant positive effecton most species, suggesting that suitable habitats with appropriate management canovercome the negative effects of disturbance on larger scales (Penone et al. 2012).
6 Railway Disturbances on Wildlife: Types, Effects, and Mitigation … 85

Herpetofauna
Among vertebrates, amphibians are one of the groups most affected by linearinfrastructures (e.g., Fahrig and Rytwinski 2009). Their dependence on aquatichabitats and seasonal migrations make amphibians particularly vulnerable to thenegative impacts of these structures (Hels and Buchwald 2001; Hamer andMcDonnell 2008). However, to the best of our knowledge no studies have beencarried out on the impact of railway disturbances on amphibians.
In contrast, there have been several studies that show that reptiles ignore railwaydisturbances. For example, in Belgium, all autochthonous reptile species havecolonized the railway embankments, but their presence and abundance largelydepend on the region and on the kind of railway (Graitson 2006). Railwayembankments can provide important novel habitats for reptiles, mainly in highlyhuman-altered landscapes (EN 2004). Some active lines in sunny areas of largevalleys and some large switchyards, as well as unused railways not dismounted, hada particularly high richness of reptiles (Graitson 2006). In fact, those railways mayhave contributed to the local dispersal of at least five species of reptiles: slow worm(Anguis fragilis), sand lizard (Lacerta agilis), common wall lizards (Podarcismuralis), viviparous lizard (Zootoca vivipara), and smooth snake (Coronella aus-triaca) (Graitson 2006). Likewise, the rainbow lizard (Cnemidophorus lemnistac-tus) was found in the weeds growing along the Florida East Coast Railway lineoccupied by industrial buildings (Wilson and Porras 1983). In Switzerland, a rel-atively great abundance of reptile species can be found in the vicinity of therailways, especially sand lizards (Stoll 2013). However, the abundance of reptiles inthe railway banks can be affected by two key factors: the inter-specific competitionwith the common wall lizard Podarcis muralis, and predation through domestic catsFelis catus (Stoll 2013).
Birds
There have been several studies that show that railway disturbance affects birdrichness, abundance, and behaviour. Noise can affect acoustic communicationamong bird species that use calls and songs to attract and bond with mates, defendterritories from rivals, maintain contact with social groups, beg for food, and warnof danger from approaching predators (Collins 2004; Marler 2004). Noise distur-bance was shown to alter the behaviour of many bird species, especially forbreeding birds, when territories are being defended, and during incubation (Reijnenet al. 1995). This disturbance can cause birds to accelerate hatching, abandon theiroccupied territories, nests and broods, and lead to hearing loss (Hanson 2007).
For example, noise emission from railway traffic has a negative effect on thedensity of all meadow birds in the Netherlands (Waterman et al. 2002). Thethreshold noise level from which densities were affected was around 42–49 dB(A)
86 P.S. Lucas et al.

for the black-tailed godwit (Limosa limosa), skylark (Alauda arvensis), and gar-ganey (Anas querquedula) (Waterman et al. 2002). There was also evidence thatsuccessful bald eagle (Haliaeetus leucocephalus) nests were farther away fromhighways and railways than unsuccessful ones (Mundahl et al. 2013).
Certain bird species seem to ignore railway disturbances. For example, brants(Branta asp.) seem to disregard the trains passing 50 m away (Owens 1977).Likewise, although Waterman et al. (2002) found a negative effect on the density ofbirds on railways in general, they did not find differences in bird density betweenquiet and busy railways. Indeed, there is evidence that bird species tolerate therailway disturbance due to the attractiveness of numerous railway-related features.Species whose predators show negative responses to train disturbance may alsobenefit from the railway vicinity (Rytwinski and Fahrig 2012). Railway verges maycreate edge effects that can increase biodiversity. In fact, special microclimates—thanks to different temperatures or insolation and new habitat availability along theedges—can enhance habitat heterogeneity in homogeneous landscapes (Delgadoet al. 2007). In turn, these new habitats may improve resting and foraging oppor-tunities for some bird species (Morelli et al. 2014). Also, railways can be a usefulsource for gastroliths’ digestive purposes, and a source of sand bathing locationsused by birds to clean the feathers. Ghosh et al. (2010) showed that apparently due tothe food availability, house sparrows (Passer domesticus) adapted to loud noise(between 35 and 95 dB), being undisturbed by passing trains at the railway stationstudy site. Equally, Li et al. (2010) observed the abundance and richness of sevenground-dwelling bird species, namely the Tibetan ground tit (Pseudopodoceshumilis), Tibetan lark (Melanocorypha maxima), horned lark (Eremophila alpes-tris), white-winged snowfinch (Montifringillla nivalis), plain-backed snowfinch (M.blandfordi), white-rumped snowfinch (M. taczanowskii), and rufous-necked snow-finch (M. ruficollis). They found greater numbers of individuals of these species nearthe Qinghai-Tibet railway (less than 300 m) than farther away (from 300 to1,200 m), probably due to verges provide nesting sites and foraging opportunities.
The non-continuous nature of the noise near railways due to the intermittent flow oftrain traffic may constitute the main reason that some birds ignore the railway. This washypothesized byWiacek et al. (2015) to explain the greater abundance of the breedingcommunity ofwoodlandbirds near a busy railway line inPolandwhen they assessed theeffect of noise at three different distances from the track (30, 280, and 530 m). Specieswith low frequency calls, such as the wood pigeon (Columba palumbus) and commoncuckoo (Cuculus canorus), also occurred in large numbers near railways. Other birdspecies also seem to ignore the railwaydisturbance.For example,more than90%ofbaldeagle nests were built near human infrastructures, including railways that hadmore than1,000 railcars going by each day (Mundahl et al. 2013).
6 Railway Disturbances on Wildlife: Types, Effects, and Mitigation … 87

Mammals
Railway disturbance impacts differ among mammal species. Besides the higherintensity of light and noise (it can achieve 120 dB), small mammals can be foundnear the railways if there is no grazing disturbance (Qian et al. 2009), or if theunnatural nature of rail bed and tracks is not an obstacle to their movements (vander Grift 1999). In fact, the richness of small mammal species was high at therailway verge in the Atlantic forest in southern Brazil (Cerboncini 2012), probablybecause the noise from the trains can force predators out of the area, which canfavor small mammals’ appearance (Cerboncini 2012). Similarly, railways may havea positive role in maintaining the common bat populations in highly humanizedlandscapes, such as intensive agriculture. In this case, railway verges seem to beused as shelters for bat species despite the traffic noise; only Myotis sp. foragingbehaviour was negatively affected by railway verges (Vandevelde et al. 2014).
Although the response of large mammals to the effects of railway disturbancevaries among species, they seem to ignore railway disturbances. However, there isevidence that the presence of railways had a subtle effect on some species’ behaviour.For example, railways had little effect on the distance or direction of fox dispersalmovements (Trewhella and Harris 1990); however, the railway disturbance may haveinfluenced the fox movements within their territories (Trewhella and Harris 1990).Similarly, the Canadian Pacific Railway in Banff National Park seems to redirect wolfmovements (individuals follow the railway), particularly when the snow is deep(Paquet and Callaghan 1996), while it seems to define the boundary of bears’ homeranges (Kaczensky et al. 2003). As detected for other species groups, changes in therailway verges can attract large mammals. In Banff National Park, railway vergesattracted black and grizzly bears (Ursus americanus and U. arctos, respectively) dueto the berry-producing areas within the verges (Gibeau and Herrero 1998). Grainspills along the Canadian Pacific rail line also attract bears (Gibeau and Herrero1998), while food spills seem to increase the abundance of mice, which may attracttheir predators, such as the coyote (Wells 1996).
By contrast, railways seem to be avoided by two large ungulates: Mongoliangazelles (Procopra gutturosa) and Tibetan antelopes (Pantholops hodgsoni). Noobservations of Mongolian gazelle crossings during dispersal were detected, and mostof the individuals were found 300 m from the railway (Ito et al. 2005). Likewise,there were no Tibetan antelope crossings (Xia et al. 2007) because these antelopeshesitated to cross the railway, most likely because of the slope of the rail bed.
Mitigation Measures to Reduce Railway Disturbances
There are several measures to reduce the main negative effects of railway distur-bances (Schulte-Werning et al. 2008; Maeda et al. 2012; Nielsen et al. 2015).Although some of these measures are known to effectively reduce the major
88 P.S. Lucas et al.

negative effects on biodiversity, the effectiveness has not yet been evaluated for afew other measures. Here, we describe the commonly used measures to reduce orminimize the impacts of railway disturbance for noise and vibration effects, and soilpollution and erosion that are found in the literature.
Noise and Vibration
In general, there are two approaches to minimizing rail traffic noise and vibration:(1) reduce the noise at the source, and (2) reduce its propagation (Lakušić and Ahac2012; Tiwari et al. 2013). The reduction of noise levels can be achieved bydecreasing the speed of rail vehicles and reducing the intensity of the radiated soundthrough regular maintenance in order to keep smooth rails and wheels (Lakušić andAhac 2012; Schulte-Werning et al. 2012). Currently, rail fastenings, rail dampers,under-sleeper pads, and noise barriers (Fig. 6.1) are the most commonly usedtechniques to directly reduce the noise and vibration in railways, techniques that arealso used in roads and motorways. The increased flexibility of railway elements(e.g., fastenings, sleepers, ballasts), have increased their ability to absorb vibrationsgenerated at wheel-rail interface (Lakušić and Ahac 2012). The use of resilient railfastening systems are designed to decrease the low-frequency ground borne or instructures with noise above 30 Hz and can be effective in reducing wayside noise
Fig. 6.1 Schematic drawing of a railway showing some measures to minimize noise andvibration: rail fastenings; rail dampers; under-sleepers pads; and noise barriers (not at scale)
6 Railway Disturbances on Wildlife: Types, Effects, and Mitigation … 89

radiated from steel. This structure provides noise reduction from 3 to 6 dB(A)through the elastic elements supporting the rail, which prevents direct contactbetween the rail foot and sleeper (Nelson 1997). However, systems that use con-crete ties with spring clips may not benefit from the use of resilient fasteners,because the spring clips already eliminate any looseness between the rail and the tie(Nelson 1997).
Another technique is the use of rail dampers (Fig. 6.1). This structure consists ofsteel components and elastomeric material that absorbs the energy of rail (springs)vibrations (Lakušić and Ahac 2012). The damping material reduces the displace-ment of the vibration waves along the rail, which results in the reduction of the railnoise. Dampers are known to be an efficient way to reduce noise emission inrailway networks (Lakušić and Ahac 2012). Studies performed at the rail tracksections with rail dampers installed showed a reduction in noise from 4 to 6 dB(A),and vibration up to 9 dB (Benton 2006; Koller et al. 2012).
Aside from rail noise, non-audible vibrations are also generated by the trains,transmitted via the tracks, and transferred to the soil. In surface railway lines,sleepers with elastic supports (under-sleeper pads—USPs) (Fig. 6.1) are an alter-native with moderate costs (compared to floating slab track systems and ballastmats) that increase track quality and achieve a significant reduction in vibrationsand railway noise (Schulte-Werning et al. 2012). USPs are resilient pads attached tothe bottom surface of sleepers to provide an intermediate elastic layer between thesleeper and the ballast. The USPs are normally made of polyurethane elastomerwith a foam structure that includes encapsulated air voids (Johansson et al. 2008).The use of USPs causes an average reduction of vibration of 16 dB due to thereduction of the contact between the sleeper and the ballast, which increaseselasticity of the track (Lakušic et al. 2010; Lakušić and Ahac 2012).
Commonly used to isolate the noise on railways (and roads), noise barriers(Fig. 6.1) can be an important tool for minimizing the negative effects of sound onwildlife, especially for species that are extremely sensitive to it. These structurescan be constructed from soil, wood, concrete, or metal (FHWA 2011; Morgan andPeeling 2012), or can be just the dense vegetation along the rails, which can, insome cases, form an almost perfect noise barrier (Tiwari et al. 2013; Bashir et al.2015). Soil verges along roads and railways can reduce, on average, 3 dB morethan vertical walls of the same height. However, the construction of soil verges canrequire a huge area, especially if they are very extensive and elevated. The con-struction of artificial walls requires less space, but they are usually limited to eightmeters in height for structural and aesthetic reasons (FHWA 2011). Vertical wallscan be applied, together with soil verges, in order to further reduce noise.
Studies by Van Renterghem and Botteldooren (2012) show that a soil verge canreduce, on average, noise levels of 11.1 dB, and walls can reduce, on average 7.7–8.3 dB. According to the U.S. Department of Transportation, effective noise bar-riers can typically reduce noise levels by 5–10 dB (FHWA 2011). Noise barriershave been mainly used to reduce the effect of noise on colonies of nesting birds(Bank et al. 2002). However, when applied without planning, noise barriers cancause various negative impacts on wildlife, such as the isolation of populations
90 P.S. Lucas et al.

(Bank et al. 2002). Thus, it is recommended to apply noise barriers together withwildlife passages to promote crossings between railway sides in order to maintaindispersal processes and ensure the long-term persistence of the species (Bank et al.2002; Schulte-Werning et al. 2012). However, reducing the noise disturbance mayreduce the ability of wildlife to perceive incoming trains, and consequently increasethe risk of collision (see Chap. 2).
Soil Pollution
Cleaning the ballast using ethylenediaminetetraacetate (EDTA) with water orthermosetting plastic resin are techniques that allow the recycling of pollutantcomponents in the surroundings of the railway network. Cleaning it can typicallyinvolve the use of products such as solvents or surfactants, which vary in efficiencyand potential environmental impacts (Anderson et al. 2002). The ballast cleaningtechnology with aqueous solutions of disodium EDTA can ensure metal extractionwithout altering the stones’ mechanical and physical characteristics, allowing reuseof the ballast (Di Palma and Petrucci 2015). The use of EDTA offers a highextraction efficiency of heavy metals (Di Palma et al. 2011); however, this chemicalagent should be administered with caution because it has low biodegradability inthe environment (Bucheli-Witschel and Egli 2001).
Using water to extract the ballast pollutants is very common in many countries(Di Palma et al. 2012). However, this method requires a great amount of surfactantwater, and the disposal of the waste produced after cleaning must be treatedappropriately (Cho et al. 2008). Incineration, landfilling, or recycling of the wasteare the options available, with the choice depending on the solvent system and onthe nature of the waste (Anderson et al. 2002). Dry cleaning that uses thermosettingplastic resin can successfully remove ballast pollutants in a very short time (Choet al. 2008). In areas with high levels of contamination, the support material shouldbe renovated regularly, including changing the ballast, and wood sleepers should bereplaced by concrete (Wiłkomirski et al. 2011).
Soil Erosion
There are techniques commonly used to minimize the effects of soil erosion onrailways and highways: grass plantation, use of gypsum, application ofcompost/mulch coverage, use of concrete prefabricated panes, lattice plots, andinterception and drainage. There is evidence that as the grass cover level increases,the soil erosion rate decreases (Gyasi-Agyei et al. 2001). For example, buffel grass(Cenchrus ciliaris) is one of the preferred species for revegetation of railwayembankments in Australia (Bhattarai et al. 2008); in some of the areas (CentralAustralia and Western Queensland), this grass spreads readily in soils with crumbly
6 Railway Disturbances on Wildlife: Types, Effects, and Mitigation … 91

or soft surfaces, but it needs to be handled with care because it has the potential tobecome a weed (Cameron 2004). This species, in combination with Japanese millet(Echinochloa esculenta), has also been used successfully in controlling soil erosionin the semi-arid tropics of Central Queensland. Japanese millet develop rapidly inpoor soils and can minimize the invasion of other unwanted weed species (Fox et al.2010). However, buffel grass is an invasive weed species that poses serious threatsto biodiversity in many other environments, such as in the Australian regionsmentioned above (Marshall et al. 2012) (see Chap. 4).
The use of gypsum on calcium-deficient soil before seeding can reduce theerosion rate by 25% (Gyasi-Agyei et al. 2001). This material has advantages, suchas low cost, availability, pH neutrality, and ease of handling (Gyasi-Agyei et al.2001). Once applied to the soil, the gypsum will increase the porosity and waterinfiltration ability. This phenomenon will avoid water runoff, thus preventing soilerosion (Beckett et al. 1989). The use of this mineral also promotes root penetrationand the emergence of seedlings (Chen and Dick 2011).
Compost/mulch coverage is considered to be one of the best managementpractices in both active construction and established areas prone to soil erosion onroadsides (Bakr et al. 2012), and it can be used in railway verges as well. InLouisiana, USA, Bakr et al. (2012) found that compost/mulch covers were highlyeffective in reducing runoff, total suspended solids (reduction between 70 and
Fig. 6.2 Spatial responses of wildlife to railway disturbances: the length of the white bars areproportional to the distances up to which the railway has an effect on a given taxon, while shortand black bars correspond to species’ occurrence in the railway verges
92 P.S. Lucas et al.

74%), and turbidity from soils susceptible to high-intensity storms. A study per-formed by Persyn et al. (2004) showed that the use of various compounds applied tothe soil might also reduce erosion rates. All compost treatments (biosolids, yardwaste, and bio-industrial by-products) were effective at reducing runoff and inter-rillerosion rates under the conditions simulated in the study conducted on a highwayembankment after construction in central Iowa (Persyn et al. 2004).
There are also engineering measures, such as concrete prefabricated panes,geocells (three-dimensional honeycomb-like structures to reduce runoff and sedi-ment transport), or interception and drainage that can also reduce the soil loss alonghighways and railways (e.g., Xu et al. 2006). These measures were effective in theshort term by decreasing between 40 and 60% of the runoff that had effectivelyreduced soil loss from sideslopes of highways in the Tibetan Plateau (Xu et al.2006). However, this measure needs to be applied with some caution, since weakconstruction may lead to water leaking from improperly sealed cracks or holes,loose contact parts, poorly rammed structures, or runoff converging along a flowline, causing adverse effects on the road embankment and in the surroundingenvironment (Xu et al. 2006).
Conclusions
There have been several studies that quantified the level of various disturbances andtheir impacts on wildlife populations. Plants are, in general, the first to be describedin relation to air and soil contamination, perhaps due to the facility of realizingexperimental analysis, or of using plants as bio-indicators. Nevertheless, there isstill little scant knowledge about the mechanisms and processes underlying thebehaviour of vertebrates, because most studies concerned only a small number ofspecies (van der Grift 1999). There is strong evidence that noise, light, andvibrations that can reach from 85.5 to 97 dB(A), can affect insects, amphibians andbirds (Fig. 6.2). In contrast, the availability of food and vegetation in the railwayverges seems to overcome the noise pollution and seems to attract reptiles, somebird species, and several mammals (Fig. 6.2). There is a wide diversity of measuresto minimize railway disturbances, but further studies are needed to understand theeffectiveness of these measures in reducing railway disturbance of wildlife.
Acknowledgments This research for this chapter was conducted within the framework of theproject “Road macroecology: analysis tools to assess impacts on biodiversity and landscapestructure,” that was funded by CNPq in Brazil (Nº 401171/2014-0). CG was supported by theGrant (300021/2015-1).
6 Railway Disturbances on Wildlife: Types, Effects, and Mitigation … 93

References
Anderson, P., Cunningham, C. J., & Barry, D. A. (2002). Efficiency and potential environmentalimpacts of different cleaning agents used on contaminated railway ballast. Land Contamination& Reclamation, 10, 71–78.
Bakr, N., Weindorf, D. C., Zhu, Y., Arceneaux, A. E., & Selim, H. M. (2012). Evaluation ofcompost/mulch as highway embankment erosion control in Louisiana at the plot-scale. Journalof Hydrology, 468, 257–267.
Bank, F. G., Irwin, C. L., Evink, G. L., Gray, M. E., Hagood, S., Kinar, J. R., et al. (2002).Wildlifehabitat connectivity across European highways (No. FHWA-PL-02-011).
Bashir, I., Taherzadeh, S., Shin, H. C., & Attenborough, K. (2015). Sound propagation over softground without and with crops and potential for surface transport noise attenuation. TheJournal of the Acoustical Society of America, 137, 154–164.
Beckett, P. H. T., Bouma, J., Farina, M. P. W., Fey, M. V., Miller, W. P., Pavan, M. A., et al.(1989). Advances in soil science (p. 9). New York: Springer.
Benton, D. (2006). Engineering aspects of rail damper design and installation. Rail Noise 2006:Mitigazione del Rumore Ferroviario, GAA, Arpat news, Pisa, 179.
Berglund, B., Lindvall, T., & Schwela, D. H. (1999). Guidelines for community noise. WorldHealth Organization. Retrieved February 3, 2016, from http://www.who.int/docstore/peh/noise/guidelines2.html
Beychok, M. (2011). U. S. National ambient air quality standards. Retrieved February 3, 2016,from http://www.eoearth.org/view/article/170853/
Bhattarai, S. P., Fox, J., & Gyasi-Agyei, Y. (2008). Enhancing buffel grass seed germination byacid treatment for rapid vegetation establishment on railway batters. Journal of AridEnvironments, 72, 255–262.
Blanton, P., & Marcus, W. A. (2009). Railroads, roads and lateral disconnection in the riverlandscapes of the continental United States. Geomorphology, 112, 212–227.
Böjersson, E., Lennart, T., & Stenström, J. (2004). The fate of imazapyr in a Swedish railwayembankment. Pest Management Science, 60, 544–549.
Bucheli-Witschel, M., & Egli, T. (2001). Environmental fate and microbial degradation ofaminopolycarboxylic acids. FEMS Microbiology Reviews, 25, 69–106.
Cameron, A. G. (2004). Buffel grass (A pasture grass for sandy soils) (online). Northern TerritoryGovernment, Australia. Retrieved February 9, 2016, from http://www.nt.gov.au/d/Content/File/p/Pasture/283.pdf
Cerboncini, R. (2012). Respostas de pequenos mamíferos ao efeito de borda da ferroviaParanaguá-Curitiba no parque estadual pico do marumbi, morretes. Dissertation. University ofParaná.
Chen, L., & Dick, W. A. (2011). Gypsum as an agricultural amendment: General use guidelines.Ohio State University Extension.
Chen, Z., Ai, Y., Fang, C., Wang, K., Li, W., Liu, S., et al. (2014b). Distribution andphytoavailability of heavy metal chemical fractions in artificial soil on rock cut slopesalongside railways. Journal of Hazardous Materials, 273, 165–173.
Chen, Z., Luo, R., Huang, Z., Tu, W., Chen, J., Li, W., et al. (2015). Effects of different backfillsoils on artificial soil quality for cut slope revegetation: Soil structure, soil erosion, moistureretention and soil C stock. Ecological Engineering, 83, 5–12.
Chen, Z., Wang, K., Ai, Y., Li, W., Gao, H., & Fang, C. (2014a). The effects of railwaytransportation on the enrichment of heavy metals in the artificial soil on railway cut slopes.Environmental Monitoring and Assessment, 186, 1039–1049.
Cheng, Y. H., & Yan, J. W. (2011). Comparisons of particulate matter, CO, and CO2 levels inunderground and ground-level stations in the Taipei mass rapid transit system. AtmosphericEnvironment, 45, 4882–4891.
Chiocchia, G., Clerico, M., Salizzoni, P., & Marro, M. (2010). Impact assessment of a railwaynoise in an alpine valley. In 10ème Congrès Français d’Acoustique.
94 P.S. Lucas et al.

Cho, Y., Park, D. S., Lee, J. Y., Yung, W. S., Kim, H. M., & Lim, J. I. (2008). Dry cleaning ofrailroad ballast gravels by blasting with thermosetting plastic resin powder. In Proceedings of8th World Congress on Railway Research, Coex, Seoul, Korea (pp. 18–22).
Clausen, U., Doll, C., Franklin, F. J., Heinrichmeyer, H., Kochsiek, J., Rothengatter, W., et al.(2010). Reducing railway noise pollution. Directorate General for Internal Policies, PolicyDepartment B: Structural and cohesion policies. Transport and Tourism, European Parliament.
Clauzel, C., Girardet, X., & Foltête, J. C. (2013). Impact assessment of a high-speed railway lineon species distribution: Application to the European tree frog (Hyla arborea) inFranche-Comté. Journal of Environmental Management, 127, 125–134.
Collins, S. (2004). Vocal fighting and flirting: The functions of birdsong. In P. Marler & H.Slabbekoorn (Eds.), Nature’s music: The science of birdsong (pp. 39–79). San Diego,California: Academic/Elsevier.
CTA. (2015). Railway noise measurement and reporting methodology. Retrieved February 3,2016, from https://www.otc-cta.gc.ca/eng/railway_noise_measurement
Czop, P., & Mendrok, K. (2011). A new method for operational monitoring of railway tracks toreduce environmental noise. Polish Journal of Environmental Studies, 20, 311–316.
Delgado, J. D., Arroyo, N. L., Arevalo, J. R., & Fernandez-Palacios, J. (2007). Edge effect of roadson temperature, light, canopy cover, and canopy height in laurel and pine forests. Landscapeand Urban Planning, 81, 328–340.
Di Palma, L., Gonzini, O., & Mecozzi, R. (2011). Use of different chelating agents for heavy metalextraction from contaminated harbour sediment. Chemistry and Ecology, 27, 97–106.
Di Palma, L., Mancini, D., & Petrucci, E. (2012). Experimental assessment of chromiummobilization from polluted soil by washing. Chemical Engineering Transactions, 28, 145–150.
Di Palma, L., & Petrucci, E. (2015). Treatment and recovery of contaminated railway ballast.Turkish Journal of Engineering and Environmental Sciences, 38, 248–255.
Eigenbrod, F., Hecnar, S. J., & Fahrig, L. (2009). Quantifying the road effect zone: Thresholdeffects of a motorway on anuran populations in Ontario, Canada. Ecology and Society, 14, 18–24.
EN. (2004). Reptiles: Guidelines for developers. English Nature. Northampton: Belmont Press.Fahrig, L., & Rytwinski, T. (2009). Effects of roads on animal abundance: An empirical review
and synthesis. Ecology and Society, 14, 21.Ferrell, S. M., & Lautala, P. T. (2010). Rail embankment stabilization on permafrost. London:
Global Experiences.FHWA, Federal Highway Administration. (2011). Highway traffic noise barriers at a glance.
Washington, DC: U. S. Department of Transportation.Forman, R. T., & Alexander, L. E. (1998). Roads and their major ecological effects. Annual
Review of Ecology and Systematics, 207-C2.Fox, J. L., Bhattarai, S. P., & Gyasi-Agyei, Y. (2010). Evaluation of different seed mixtures for
grass establishment to mitigate soil erosion on steep slopes of railway batters. Journal ofIrrigation and Drainage Engineering, 137, 624–631.
Gautier, P. E., Poisson, F., & Letourneaux, F. (2008). High speed trains external noise: A reviewof measurements and source models for the TGV case up to 360 km/h. In Proceedings of the8th world congress on railway research (pp. 1-1).
Ge, Y., Murray, P., Sauvé, S., & Hendershot, W. (2003). Low metal bioavailability in acontaminated urban site. Environmental Toxicology and Chemistry, 21, 954–961.
Gibeau, M. L., & Herrero, S. (1998). Roads, rails, and grizzly bears in the Bow River Valley,Alberta. In G. L. Evink (Ed.), Proceedings of the international conference on ecology andtransportation (pp. 104–108), Florida Dept. of Transportation, Tallahassee, Florida, USA.
Graitson, E. (2006). Répartition et écologie des reptiles sur le réseau ferroviaire en Wallonie.Bulletin de la Societe Herpetologique, 120, 15–32.
Gregorich, E. G., Greer, K. L., Anderson, D. W., & Liang, B. C. (1998). Carbon distribution andlosses: Erosion and deposition effects. Soil and Tillage Research, 47, 291–302.
Ghosh, S., Kim, K., & Bhattacharya, R. (2010). A survey on house sparrow population decline atBandel, West Bengal, India. Journal Korean Earth Science Society, 31, 448–453.
6 Railway Disturbances on Wildlife: Types, Effects, and Mitigation … 95

Guarinoni, M., Ganzleben, C., Murphy, E., & Jurkiewicz, K. (2012). Towards a comprehensivenoise strategy. Brussels: European Union.
Gyasi-Agyei, Y., Sibley, J., & Ashwath, N. (2001). Quantitative evaluation of strategies forerosion control on a railway embankment batter. Hydrological Processes, 15, 3249–3268.
Hamer, A. J., & McDonnell, M. J. (2008). Amphibian ecology and conservation in the urbanisingworld: A review. Biological Conservation, 141, 2432–2449.
Hanson, C. E. (2007). High speed train noise effects on wildlife and domestic livestock. In B.S. Werning, D. Thompson, P. E. Gautier, C. Hanson, B. Hemsworth, J. Nelson, T. Maeda, &P. Vos (Eds.), Noise and vibration mitigation for rail transportation systems (pp. 26–32). NewYork: Springer.
Hels, T., & Buchwald, E. (2001). The effect of road kills on amphibian populations. BiologicalConservation, 99, 331–340.
Hofman, J., Lefebvre, W., Janssen, S., Nackaerts, R., Nuyts, S., Mattheyses, L., et al. (2014).Increasing the spatial resolution of air quality assessments in urban areas: A comparison ofbiomagnetic monitoring and urban scale modelling. Atmospheric Environment, 92, 130–140.
Ito, T., Miura, N., Lhagvasuren, B., Enkhbileg, D., Takatsuki, S., Tsunekawa, A., et al. (2005).Preliminary evidence of a barrier effect of a railroad on the migration of Mongolian gazelles.Conservation Biology, 19, 945–948.
Jin, H. J., Yu, Q. H., Wang, S. L., & Lü, L. Z. (2008). Changes in permafrost environments alongthe Qinghai-Tibet engineering corridor induced by anthropogenic activities and climatewarming. Cold Regions Science and Technology, 53, 317–333.
Johansson, A., Nielsen, J. C., Bolmsvik, R., Karlström, A., & Lundén, R. (2008). Under sleeperpads—Influence on dynamic train–track interaction. Wear, 265, 1479–1487.
Kaczensky, P., Knauer, F., Krze, B., Jonozovic, M., Adamic, M., & Gossow, H. (2003). Theimpact of high speed, high volume traffic axes on brown bears in Slovenia. BiologicalConservation, 111, 191–204.
Kamani, H., Hoseini, M., Seyedsalehi, M., Mahdavi, Y., Jaafari, J., & Safari, G. H. (2014).Concentration and characterization of airbone particles in Tehran’s subways system.Environmental Science and Pollution Research, 21, 7319–7328.
Kanda, H., Tsuda, H., Ichikawa, K., & Yoshida, S. (2007). Environmental noise reduction ofTokaido Shinkansen and future prospect. In B. S. Werning, D. Thompson, P. E. Gautier, C.Hanson, B. Hemsworth, J. Nelson, T. Maeda, & P. Vos (Eds.), Noise and vibration mitigationfor rail transportation systems (pp. 1–8). Berlin, Heidelberg: Springer.
Koller, G., Kalivoda, M. T., Jaksch, M., Muncke, M., Oguchi, T., & Matsuda, Y. (2012). Railwaynoise reduction technology using a damping material. In T. Maeda, P. E. Gautier, C. Hanson,B. Hemsworth, J. T. Nelson, B. Schulte-Werning, D. Thompson, & P. Vos (Eds.), Noise andvibration mitigation for rail transportation systems (pp. 159–166). Tokyo: Springer.
Lakušić, S., & Ahac, M. (2012). Rail traffic noise and vibration mitigation measures in urban areas.Technical Gazette, 19, 427–435.
Lakušić, S., Ahac, M., & Haladin, I. (2010). Experimental investigation of railway track withunder sleeper pad. In: 10th Slovenian road and transportation congress (pp. 386–393). VilharMatija (ur.). Ljubljana.
Levengood, J. M., Heske, E. J., Wilkins, P. M., & Scott, J. W. (2015). Polyaromatic hydrocarbonsand elements in sediments associated with a suburban railway. Environmental Monitoring andAssessment, 187, 1–12.
Li, Z., Ge, C., Li, J., Li, Y., Xu, A., Zhou, K., et al. (2010). Ground-dwelling birds near theQinghai–Tibet highway and railway. Transportation Research Part D, 15, 525–528.
Maeda, T., Gautier, P. E., Hanson, C., Hemsworth, B., Nelson, J. T., Schulte-Werning, B., et al.(2012). Noise and vibration mitigation for rail Transportation systems. In Notes on numericalfluid mechanics and multidisciplinary design (Vol. 118).
Malawaka, M., & Wilkomirski, B. (2001). An analysis of soil and plant (Taraxacum officinale)contamination with heavy metals and polycyclic aromatic hydrocarbons (PAHs) in the area ofthe railway junction IŁAWA GŁÓWNA, Poland. Water, Air, and Soil Pollution, 127, 339–349.
96 P.S. Lucas et al.

Marler, P. (2004). Bird calls: A cornucopia for communication. In P. Marler & H. Slabbekoorn(Eds.), Nature’s music: The science of birdsong (pp. 132–177). San Diego, California:Academic/Elsevier.
Marshall, V. M., Lewis, M. M., & Ostendorf, B. (2012). Buffel grass (Cenchrus ciliaris) as aninvader and threat to biodiversity in arid environments: A review. Journal of AridEnvironments, 78, 1–12.
Matsumoto, S., Shao, X., & Shino, K. (2005). Environmental noise in Middle East region of KochiPrefecture [Japan]. Transactions of the Japanese Society of Irrigation, Drainage andReclamation Engineering (Japan).
Mazur, Z., Radziemska, M., Maczuga, O., & Makuch, A. (2013). Heavy metal concentrations insoil and moss (Pleurozium schreberi) near railroad lines in Olsztyn (Poland). FreseniusEnvironmental Bulletin, 22, 955–961.
Morelli, F., Beim, M., Jerzak, L., Jones, D., & Tryjanowski, P. (2014). Can roads, railways andrelated structures have positive effects on birds? A review. Transportation Research Part D,30, 21–31.
Morgan, P. A., & Peeling, J. (2012). Railway noise mitigation factsheet 01: Overview of railwaynoise. HS2 Rail Project Group.
Mundahl, N. D., Bilyeu, A. G., & Maas, L. (2013). Bald Eagle nesting habitats in the UpperMississippi River National Wildlife and Fish Refuge. Journal of Fish and WildlifeManagement, 4, 362–376.
Nelson, J. T. (1997). Wheel/rail noise, control manual (No. Project C-3 FY’93), Washington, DC.Nielsen, J., Anderson, D. F., Gautier, P.-E., Iida, M., Nelson, J. T., Thompson, D., et al. (2015).
Noise and vibration mitigation for rail transportation systems. In Notes on numerical fluidmechanics and multidisciplinary design (Vol. 126).
Owens, N. W. (1977). Responses of wintering brent geese to human disturbance. Wildfowl, 28, 5–14.
Palacin, R., Correia, J., Zdziech, M., Cassese, T., & Chitakova, T. (2014). Rail environmentalimpact: Energy consumption and noise pollution assessment of different transport modesconnecting Big Ben (London, UK) and Eiffel Tower (Paris, Fr). Transport Problems: AnInternational Scientific Journal, 9.
Paquet, P., & Callaghan, C. (1996). Effects of linear developments on winter movements of graywolves in the Bow river Valley of Banff National Park, Alberta. In G. L. Evink, P. Garrett, D.Zeigler, & J. Berry (Eds.), Trends in addressing transportation related wildlife mortality(pp. 21). Proceedings of the Transportation Related Wildlife Mortality Seminar, Orlando,Florida.
Park, D. U., & Ha, K. C. (2008). Characteristics of PM10, PM2.5, CO2 and CO monitored ininteriors and platforms of subway train in Seoul, Korea. Environment International, 34, 629–634.
Pennington, D. N., Hansel, J. R., & Gorchov, D. L. (2010). Urbanization and riparian forest woodycommunities: Diversity, composition, and structure within a metropolitan landscape.Biological Conservation, 143, 182–194.
Penone, C., Kerbiriou, C., Julien, J. F., Julliard, R., Machon, N., & Viol, I. (2012). Urbanisationeffect on orthoptera: Which scale matters? Insect Conservation and Diversity, 6, 319–327.
Persyn, R. A., Glanville, T. D., Richard, T. L., Laflen, J. M., & Dixon, P. M. (2004).Environmental effects of applying composted organics to new highway embankments: Part 1.interrill runoff and erosion. Transactions of the American Society of Agricultural Engineers,47, 463–469.
Plakhotnik, V. N., Onyshchenko, J. V., & Yaryshkina, L. A. (2005). The environmental impacts ofrailway transportation in the Ukraine. Transportation Research D, 10, 263–268.
Qian, Z., Lin, X., Jun, M., Pan-Wen, W., & Qi-Sen, Y. (2009). Effects of the Qinghai–TibetRailway on the community structure of rodents in Qaidam desert region. Acta EcologicaSinica, 29, 267–271.
Rani, M., Pal, N., & Sharma, R. K. (2006). Effect of railway engines emission on themicromorphology of some field plants. Journal of Environmental Biology, 27, 373–376.
6 Railway Disturbances on Wildlife: Types, Effects, and Mitigation … 97

Reijnen, R., Foppen, R., Braak, C. T., & Thissen, J. (1995). The effects of car traffic on breedingbird populations in woodland. III. Reduction of density in relation to the proximity of mainroads. Journal of Applied Ecology, 32, 187–202.
Rybak, J., & Olejniczak, T. (2013). Accumulation of polycyclic aromatic hydrocarbons (PAHs) onthe spider webs in the vicinity of road traffic emissions. Environmental Science and PollutionResearch, 21, 2313–2324.
Rytwinski, T., & Fahrig, L. (2012). Do species life history traits explain population responses toroads? A meta-analysis. Biological Conservation, 147, 87–98.
Schulte-Werning, B., Asmussen, B., Befr, W., Degen, K. G., & Garburg, R. (2012).Advancements in noise and vibration abatement to support the noise reduction strategy ofDeutsche Bahn. In T. Maeda, P. E. Gautier, C. Hanson, B. Hemsworth, J. T. Nelson, B.Schulte-Werning, D. Thompson, & P. Vos (Eds.), Noise and vibration mitigation for railtransportation systems (pp. 9–16). New York: Springer.
Schulte-Werning, B., Thompson, D., Gautier, P. E., Hanson, C., Hemsworth, B., Nelson, J., et al.(2008). Noise and vibration mitigation for rail transportation systems. In Notes on numericalfluid mechanics and multidisciplinary design (Vol. 99).
Schweinsberg, F., Abke, W., Rieth, K., Rohmann, U., & Zullei-Seibert, N. (1999). Herbicide useon railway tracks for safety reasons in Germany? Toxicology Letters, 107, 201–205.
Snyder, E. B., Arango, C. P., Eitemiller, D. J., Stanford, J. A., & Uebelacker, M. L. (2002).Floodplain hydrologic connectivity and fisheries restoration in the Yakima River, USA.Internationale Vereinigung für Limnologie, 28, 1653–1657.
Stoll, S. (2013). How site characteristics, competition and predation influence site specificabundance of sand lizard on railway banks. Dissertation. Universität Bern.
Tiwari, A., Kadu, P., & Mishra, A. (2013). Study of noise pollution due to railways and vehiculartraffic at level crossing and its remedial measures. American Journal of Engineering Research,2, 16–19.
Trewhella, W. J., & Harris, S. (1990). The effect of railway lines on urban fox (Vulpes vulpes)numbers and dispersal movements. Journal of Zoology, 221, 321–326.
van der Grift, E. A. (1999). Mammals and railroads: Impacts and management implications. Lutra,42, 77–79.
Vandevelde, J. C., Bouhoursc, A., Julien, J. F., Couvet, D., & Kerbiriou, C. (2014). Activity ofEuropean common bats along railway verges. Ecological Engineering, 64, 49–56.
Van Renterghem, T., & Botteldooren, D. (2012). On the choice between walls and berms for roadtraffic noise shielding including wind effects. Landscape and Urban Planning, 105, 199–210.
van Rooyen, C. (2009). Bird impact assessment study Kusile railway line and associatedinfrastructure. Report, Robindale.
Vo, P. T., Ngo, H. H., Guo, W., Zhou, J. L., Listowski, A., Du, B., et al. (2015). Stormwaterquality management in rail transportation—Past, present and future. Science of the TotalEnvironmnet, 512, 353–363.
Waterman, E., Tulp, I., Reijnen, R., Krijgsveld, K., & Braak, C. (2002). Disturbance of meadowbirds by railway noise in The Netherlands. Geluid, 1, 2–3.
Wells, P. (1996). Wildlife mortality on the Canadian Pacific Railway between Field andRevelstoke, British Columbia. Unpublished report.
Wiacek, J., Polak, M., Filipiuk, M., Kucharczyk, M., & Bohatkiewicz, J. (2015). Do birds avoidrailroads as has been found for roads? Environmental Management, 56, 643–652.
Wiłkomirski, B., Sudnik-Wójcikowska, B., Galera, H., Wierzbicka, M., & Malawska, M. (2011).Railway transportation as a serious source of organic and inorganic pollution. Water, Air, andSoil pollution, 218, 333–345.
Wilkomirski, B., Galera, H., Sudnik-Wójcikowska, B., Staszewski, T., & Malawska, M. (2012).Railway tracks-habitat conditions, contamination, floristic settlement-a review. Environmentand Natural Resources Research, 2, 86.
Wilson, L. D., & Porras, L. (1983). The ecological impact of man on the south Floridaherpetofauna. University of Kansas Museum of Natural History, Special Publication, 9, 89.
98 P.S. Lucas et al.

Xia, L., Yang Q., Li Z., Wu, Y., & Feng, Z. (2007). The effect of the Qinghai-Tibet railway on themigration of Tibetan antelope Pantholops hodgsonii in Hoh-xil National Nature Reserve,China. Oryx, 41, 3.
Xu, X., Zhang, K., Kong, Y., Chen, J., & Yu, B. (2006). Effectiveness of erosion control measuresalong the Qinghai–Tibet highway, Tibetan plateau, china. Transportation Research Part D:Transport and Environment, 11, 302–309.
Zhang, H., Wang, Z. F., Zhang, Y. L., & Hu, Z. J. (2012). The effects of the Qinghai–Tibet railwayon heavy metals enrichment in soils. Science of the Total Environment, 439, 240–248.
Open Access This chapter is licensed under the terms of the Creative Commons Attribution 4.0International License (http://creativecommons.org/licenses/by/4.0/), which permits use, sharing,adaptation, distribution and reproduction in any medium or format, as long as you give appropriatecredit to the original author(s) and the source, provide a link to the Creative Commons license andindicate if changes were made.The images or other third party material in this chapter are included in the chapter’s Creative
Commons license, unless indicated otherwise in a credit line to the material. If material is notincluded in the chapter’s Creative Commons license and your intended use is not permitted bystatutory regulation or exceeds the permitted use, you will need to obtain permission directly fromthe copyright holder.
6 Railway Disturbances on Wildlife: Types, Effects, and Mitigation … 99

Part IICase Studies
Chapter 7Bird Collisions in a Railway Crossinga Wetland of International Importance(Sado Estuary, Portugal)
Carlos Godinho, João T. Marques, Pedro Salgueiro, Luísa Catarino,Cândida Osório de Castro, António Mira and Pedro Beja
Abstract Many studies have evaluated bird mortality in relation to roads and otherhuman structures, but little is known about the potential impacts of railways. Inparticular, it is uncertain whether railways are an important mortality source whencrossing wetlands heavily used by aquatic birds. Here we analyze bird collisions ina railway that crosses the Nature Reserve of the Sado Estuary (Portugal) over anannual cycle, documenting bird mortality and the flight behaviour of aquatic birdsin relation to a bowstring bridge. During monthly surveys conducted on 16.3 km ofrailway, we found 5.8 dead birds/km/10 survey days in the section crossing wetlandhabitats (6.3 km), while <0.5 dead birds/km/10 survey days were found in twosections crossing only forested habitats. Most birds recorded were small songbirds(Passeriformes), while there was only a small number of aquatic birds (commonmoorhen, mallard, flamingo, great cormorant, gulls) and other non-passerinesassociated with wetlands (white stork). During nearly 400 h of observations, we
C. Godinho (&) � L. CatarinoLabOr—Laboratório de Ornitologia, ICAAM—Instituto de Ciências Agrárias e AmbientaisMediterrânicas, Universidade de Évora, Mitra, 7002-554 Évora, Portugale-mail: [email protected]
J.T. Marques � P. Salgueiro � A. MiraUnidade de Biologia da Conservação, Departamento de Biologia, Universidade de Évora,Mitra, 7002-554 Évora, Portugal
J.T. Marques � P. Salgueiro � A. MiraCIBIO/InBIO, Centro de Investigação em Biodiversidade e Recursos Genéticos,Universidade de Évora, Pólo de Évora, Casa do Cordovil 2º Andar, 7000-890 Évora, Portugal
C.O. de CastroDireção de Engenharia e Ambiente. Infraestruturas de Portugal, Campus do Pragal—Ed. 1,Praça da Portagem, 2801-013 Almada, Portugal
P. BejaCIBIO/InBIO, Centro de Investigação em Biodiversidade e Recursos Genéticos,Universidade do Porto, Campus Agrário de Vairão, Rua Padre Armando Quintas, 4485-661Vairão, Portugal
P. BejaCEABN/InBIO, Centro de Ecologia Aplicada “Professor Baeta Neves”, Instituto Superior deAgronomia, Universidade de Lisboa, Tapada da Ajuda, 1349-017 Lisboa, Portugal
© The Author(s) 2017L. Borda-de-Água et al. (eds.), Railway Ecology,DOI 10.1007/978-3-319-57496-7_7
103

recorded 27,000 movements of aquatic birds across the Sado bridge, particularly inautumn and winter. However, only <1% of movements were within the area ofcollision risk with trains, while about 91% were above the collision risk area, and8% were below the bridge. Overall, our case study suggests that bird collisions maybe far more numerous in railways crossing wetland habitats than elsewhere,although the risk to aquatic birds may be relatively low. Information from addi-tional study systems would be required to evaluate whether our conclusions applyto other wetlands and railway lines.
Keywords Anthropogenic mortality � Aquatic birds � Collision risk �Environmental impact � Wetlands � Wildlife mortality
Introduction
Collision with human structures and vehicles is an important source of wild birdmortality, killing hundreds of millions of birds each year (Loss et al. 2015).Although the population-level consequences of such mortality are poorly known(but see, e.g., Carrete et al. 2009; Borda-de-Água et al. 2014), it is generallyrecognized under the precautionary principle that efforts should bemade to reduce thenumber of birds killed each year as much as possible (Loss et al. 2015). Information isthus needed on the bird species most vulnerable to collisions, and on the environ-mental and species-specific factors affecting such vulnerability (Barrios andRodríguez 2004; Santos et al. 2016), which are essential for developing managementguidelines aimed at reducing collision risk (Barrientos et al. 2011; May et al. 2015).
To collect baseline information for mitigating impacts, bird collision risk hasbeen the subject of intensive research over the past two decades (Loss et al. 2015),with many studies documenting bird mortality and its correlates in relation to roads(Santos et al. 2016), wind farms (Barrios and Rodríguez 2004; Drewitt andLangston 2006), power lines (Barrientos et al. 2011, 2012), and buildings (Losset al. 2015). Surprisingly, however, very few studies have analyzed bird collision inrelation to railways, although these linear infrastructures extend over tens ofthousands of kilometers across the world (see Chap. 2). Railways present a numberof risks to birds from potential collisions with circulating trains, but there are alsorisks regarding collision with catenary wires, electrocution, and barotrauma by thetrain movement (Dorsey et al. 2015, and see Chap. 2). The few studies addressingthese problems reported that birds can account for over 50% of the vertebrateskilled in railways (SCV 1996; van der Grift and Kuijsters 1998), and that collisionsmay often involve species of conservation concern such as owls and birds of prey(Peña and Llama 1997; SCV 1996; Schaub et al. 2010). For some of these species,railway-related mortality may represent a considerable proportion of the overallmortality (van der Grift and Kuijsters 1998; Schaub et al. 2010), and thus may be arisk worth considering when designing or managing railways. However, the fewstudies conducted so far have covered just a very limited range of species andenvironmental conditions, making it difficult to draw generalizations (see Chap. 2).
104 C. Godinho et al.

Here we provide a case study on bird collisions in a railway that crosses awetland of international importance, the Sado Estuary (Portugal), which is aRAMSAR site and a Special Protection Area for birds classified under the EuropeanUnion Directive 79/409/EEC. Especially from autumn to mid-spring, this wetlandis home to thousands of waders, wildfowl, flamingos Phoenicopterus roseus, andother aquatic birds, which use a diversity of wet habitats including open water, mudflats, rice fields, and salt pans (Lourenço et al. 2009; Alves et al. 2011). These birdswere expected to cross the railway area on a daily basis, particularly the bridgecrossing the Sado River, due to movements from roosts to feeding areas, and amongfeeding areas (e.g., Dias et al. 2006). Therefore, it was feared that they wereexposed to a high risk of collision, with the possibility of mass mortality eventsoccurring due to the collision of large flocks with bridge structures and circulatingtrains. Our study was designed to clarify this issue, aiming at: (1) quantifying birdmortality patterns due to collisions associated with the presence of the railway;(2) characterizing the movements of wetland birds crossing the railway bridge alongthe circadian and the annual cycles; and (3) estimating the seriousness of the risk ofwetland bird mortality associated with this railway, as well as which bird speciesare most at risk. To the best of our knowledge, this is the first published studydocumenting the impacts of railways on wetland bird mortality.
Methods
The study was carried out in Portugal, focusing on the “Variante de Alcácer”railway, whose construction started in February 2007, with train circulationbeginning in December 2010 (Figs. 7.1 and 7.2). This is a single-track electrifiedrailway extending over 29 km, that is part of the network connecting Lisbon to thesouth of the country. It crosses the Natural Reserve of the Sado Estuary (Portugal)in a section of about 2.6 km (38° 24′N, 8° 36′W), most of which is occupied bywetland habitats including the Sado River, rice fields and salt pans (1.6 km), whilethe rest is dominated by cork oak Quercus suber and stone pine Pinus pineawoodlands. The crossing is made through a bowstring bridge built between 2007and 2010, with a length of 2735 m and three 160 m high arcs (Fig. 7.2). Anotherviaduct of this railway (about 0.8 km) crosses a small wetland outside the NaturalReserve, which corresponds to the São Martinho stream and the adjacent rice fields(Fig. 7.2). During the period of observations conducted over one year (see below),the bridge was crossed by 26 ± 4 [SD] trains/day. The train speed ranged from44 km/h (charcoal trains) to 170–200 km/h (passenger trains).
Bird mortality due to collisions with trains and railway structures was estimatedat three sections of this railway, with a total length of 16.3 km. One of thesesections (Section 1: 6.3 km) included the sectors crossing the Sado (2.6 km) andSão Martinho (0.8 km) wetlands, while the rest (2.9 km) crossed forested habitats.The other two sections (Section 2: 5.8 km; Section 3: 4.2 km) crossed onlyforested habitats, and they were used as controls to estimate how the presence ofwetlands affected bird collision rates. The railway tracks and the surrounding areaswere thoroughly surveyed for vertebrate corpses in the three sections, between
7 Bird Collisions in a Railway Crossing a Wetland … 105

Fig. 7.1 a Location of the Sado Estuary in Portugal, b map of the study area showing the locationof the three sections surveyed for bird mortality in the Variante de Alcácer” railway line, andc detail of the section 1 crossing the Sado River, with the location of the three bird counting points
November 2012 and October 2013. In section 1, surveys were conducted once aeach month, and on two consecutive days per month. In sections 2 and 3, surveyswere conducted in the same months as Section 1, but they were carried out in asingle day each month. For safety reasons, surveys were conducted only whenaccompanied by staff of the railway company and following all safety procedures.Each bird corpse located during surveys was identified to the lowest possibletaxonomic level and its position was recorded with a GPS receiver.
To evaluate bird movements across the Sado bridge, observations were madewithin 500-m buffers at three sampling points set 1 km apart along the bridge, andcovering all deck (Figs. 7.1 and 7.2). The points were set to cover the main habitatsavailable in the area: North—forested areas; Central—river and wetland habitats;South—forest and wetland habitats (Fig. 7.2). Twenty-two survey sessions tookplace between November 2012 and September 2013 by three observers simultane-ously. The number of birds crossing the railway were counted during the day in two6-hours sessions per month (i.e., �400 h of observation homogeneously distributedduring the study period), to cover the tidal cycle. Observers rotated between obser-vation points every 3 h to avoid hour-related biases. Species, number of individuals,hour, flight direction and height (based on structural elements of the bridge: (deck,electric cables and bridge arcs) were recorded for each crossing. Particular care wastaken to estimate the number of birds crossing at the train collision risk zone, cor-responding to the area between the deck and the catenary lines.
106 C. Godinho et al.

Results
Bird Mortality
Overall, we found 124 vertebrate corpses during mortality surveys, most of which(75.8%) were birds, although there were also a few amphibians (8.9%), reptiles
Fig. 7.2 Photographsillustrating aspects of thestudy area. Upper panelrailway crossing rice fields(São Martinho stream);middle panel bowstringrailway bridge crossing theSado River; lower panel flockof flamingos flying close tothe Sado railway bridge
7 Bird Collisions in a Railway Crossing a Wetland … 107

(3.2%), mammals (8.9%), and unidentified vertebrates (3.2%) (Table 7.1). Mostbirds were passerines (Passeriformes), which accounted for 15 of the 25 speciesidentified, and 67.9% of 53 individuals identified to species level. White wagtails(Motacilla alba) accounted for about 35% of the individuals identified, while for 18species we found only a single individual. Only eight individuals of strictly aquaticspecies were identified, including two common moorhens (Gallinula chloropus),and one each of mallard (Anas plathyrhynchos), flamingo, great cormorant(Phalacrocorax carbo) and lesser black-backed gull (Larus fuscus). To theseshould be added five white storks (Ciconia ciconia), which are frequently found inflooded rice fields in the area.
Table 7.1 Summary results of vertebrate mortality detected in the “Variante de Alcácer” railway(southern Portugal), between November 2012 and October 2013
Species Section 1 Section 2 Section 3
Wetland/Forest(6.3 km)
Forest (5.8 km) Forest (4.2 km)
N N/km/10 days N N/km/10 days N N/km/10 days
Amphibians 6 0.40 2 0.29 3 0.60
Common toad Bufo bufo – – 1 0.14 – –
Natterjack toad Bufo calamita – – – – 2 0.40
Common/Natterjack toad Bufobufo/calamita
– – – – 1 0.20
Treefrog Hyla sp. 1 0.07 1 0.14 – –
Perez’s frog Rana perezi 1 0.07 – – – –
Fire salamander Salamandrasalamandra
1 0.07 – – – –
Crested newt Triturus marmoratus 1 0.07 – – – –
Unidentified amphibian 2 0.13 – – – –
Reptiles 2 0.13 – – 2 0.40
Large psammodromusPsammodromus algirus
– – – – 2 0.40
Montpellier snake Malpolonmonspessulanus
2 0.13 – – – –
Birds 89 5.89 3 0.43 2 0.40
Mallard Anas plathyrhychos 1 0.07 – – – –
Greater flamingo Phoenicopterusroseus
1 0.07 – – – –
White stork Ciconia ciconia 5 0.33 – – – –
Great cormorant Phalacrocoraxcarbo
1 0.07 – – – –
Cattle egret Bubulcus ibis 1 0.07 – – – –
Moorhen Gallinula chloropus 2 0.13 – – – –
Lesser black-backed gull Larusfuscus
1 0.07 – – – –
Rock dove (domestic) Columbalivia
3 0.20 – – – –
(continued)
108 C. Godinho et al.

Table 7.1 (continued)
Species Section 1 Section 2 Section 3
Wetland/Forest(6.3 km)
Forest (5.8 km) Forest (4.2 km)
N N/km/10 days N N/km/10 days N N/km/10 days
Tawny owl Strix aluco 1 0.07 – – – –
Little owl Athene noctua – – 1 0.14 – –
Carrion crow Corvus corone 1 0.07 – – – –
Wood lark Lululla arborea – – 1 0.14 – –
Barn swallow Hirundo rustica 2 0.13 – – – –
Blue tit Cyanistes caeruleus 1 0.07 – – – –
Common chiffchaff Phylloscopuscollybita
1 0.07 – – – –
Reed warbler Acrocephalusscirpaceus
2 0.13 – – – –
Blackcap Sylvia atricapilla – – – – 1 0.20
Common redstart Phoenicurusochruros
1 0.07 – – – –
European stonechat Saxicolarubicola
1 0.07 – – – –
Song thrush Turdus philomelos – – 1 0.14 – –
Mistle thrush Turdus viscivorus – – – – 1 0.20
White wagtail Motacilla alba 19 1.26 – – – –
Chaffinch Fringilla coelebs 1 0.07 – – – –
Greenfinch/goldfinch Chlorischloris/Carduelis carduelis
1 0.07 – – – –
House sparrow Passer domesticus 2 0.13 – – – –
Unidentified Ardeidae 1 0.07 – – – –
Unidentified Columbidae 3 0.20 – – – –
Unidentified aquatic bird 1 0.07 – – – –
Unidentified songbird(Passeriforme)
6 0.40 – – – –
Unidentified bird 30 1.98 – – – –
Mammals 8 0.53 2 0.29 1 0.20
Kuhl’s pipistrelle Pipistrelluskuhlii
– – – – 1 0.20
Wood mouse Apodemus sylvaticus – – 1 0.14 – –
Red fox Vulpes vulpes 1 0.07 – – – –
Stone marten Martes foina 1 0.07 – – – –
Domestic cat Felis catus 1 0.07 – – – –
Domestic sheep Ovis aries 4 0.26 – – – –
Unidentified carnivore 1 0.07 – – – –
Unidentified mammal – – 1 0.14 – –
Unidentified vertebrate 4 0.26 – – – –
Total 109 7.21 7 1.01 8 1.59
Results are reported separately for three sections of the railway with different lengths and crossingdifferent habitats. For each section and species/taxa, we provide the total number of individuals detected(N) and the number of individuals detected per km and per 10 survey days (N/km/10 days)
7 Bird Collisions in a Railway Crossing a Wetland … 109

Most of the birds (94.6%) were found in Section 1, where we recorded 5.89birds/km/10 survey days, while in Sections 2 and 3 we recorded 0.43birds/km/10 days and 0.40 birds/km/10 days, respectively (Table 7.1). WithinSection 1, we found 76.4% of the birds in the two sectors crossing the Sado River(n = 59) and the São Martinho stream (n = 9) (Table 7.1). These two sectors wereresponsible for all mortality of strictly aquatic species, and for 80% of the whitestorks killed. Most bird mortality was recorded in the autumn (37.2%) and winter(33.0%), with much lower values in the spring (16.0%) and summer (13.8%). Thegroup of aquatic birds and white stork were recorded in each season except winter.
Bridge Crossing by Birds
We observed a total of about 27,000 birds crossing the bridge during the obser-vation periods, most of which (82.7%) were waterfowl and other aquatic birds, andthe others were mainly passerines. Overall, most crossings (76.6%) were detected inthe central section of the bridge, followed by the south (18.7%) and north sec-tions (4.7%). More than half the crossings were detected in winter (December–February), corresponding to 4217 crossings/month (Fig. 7.3). Spring (March–June)was the season with fewer crossings observed, with 571 crossings per month(Fig. 7.3). Less than 1% of the crossings were made between the deck and the
Fig. 7.3 Monthly number of aquatic birds observed crossing the railway bridge over the SadoRiver, between November 2012 and September 2013. Numbers are presented separately for thethree sampling points covering the main habitats available in the area: north (forested areas);central (river and wetland habitats); and south (forest and wetland habitats)
110 C. Godinho et al.
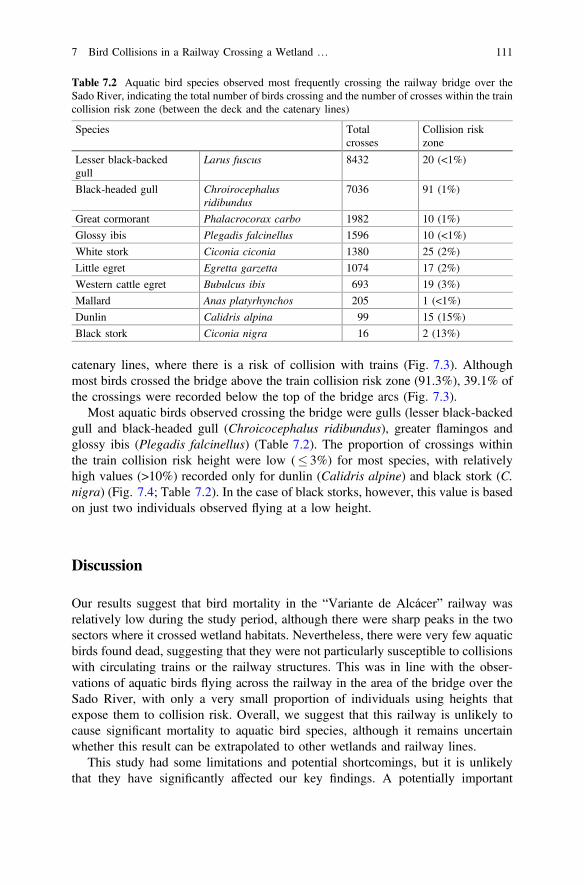
catenary lines, where there is a risk of collision with trains (Fig. 7.3). Althoughmost birds crossed the bridge above the train collision risk zone (91.3%), 39.1% ofthe crossings were recorded below the top of the bridge arcs (Fig. 7.3).
Most aquatic birds observed crossing the bridge were gulls (lesser black-backedgull and black-headed gull (Chroicocephalus ridibundus), greater flamingos andglossy ibis (Plegadis falcinellus) (Table 7.2). The proportion of crossings withinthe train collision risk height were low (� 3%) for most species, with relativelyhigh values (>10%) recorded only for dunlin (Calidris alpine) and black stork (C.nigra) (Fig. 7.4; Table 7.2). In the case of black storks, however, this value is basedon just two individuals observed flying at a low height.
Discussion
Our results suggest that bird mortality in the “Variante de Alcácer” railway wasrelatively low during the study period, although there were sharp peaks in the twosectors where it crossed wetland habitats. Nevertheless, there were very few aquaticbirds found dead, suggesting that they were not particularly susceptible to collisionswith circulating trains or the railway structures. This was in line with the obser-vations of aquatic birds flying across the railway in the area of the bridge over theSado River, with only a very small proportion of individuals using heights thatexpose them to collision risk. Overall, we suggest that this railway is unlikely tocause significant mortality to aquatic bird species, although it remains uncertainwhether this result can be extrapolated to other wetlands and railway lines.
This study had some limitations and potential shortcomings, but it is unlikelythat they have significantly affected our key findings. A potentially important
Table 7.2 Aquatic bird species observed most frequently crossing the railway bridge over theSado River, indicating the total number of birds crossing and the number of crosses within the traincollision risk zone (between the deck and the catenary lines)
Species Totalcrosses
Collision riskzone
Lesser black-backedgull
Larus fuscus 8432 20 (<1%)
Black-headed gull Chroirocephalusridibundus
7036 91 (1%)
Great cormorant Phalacrocorax carbo 1982 10 (1%)
Glossy ibis Plegadis falcinellus 1596 10 (<1%)
White stork Ciconia ciconia 1380 25 (2%)
Little egret Egretta garzetta 1074 17 (2%)
Western cattle egret Bubulcus ibis 693 19 (3%)
Mallard Anas platyrhynchos 205 1 (<1%)
Dunlin Calidris alpina 99 15 (15%)
Black stork Ciconia nigra 16 2 (13%)
7 Bird Collisions in a Railway Crossing a Wetland … 111

problem is that mortality surveys were carried out at monthly intervals and only onone or two days per month, which may influence mortality estimates (Santos et al.2011, 2015). For instance, an eventual mass mortality event due to a flock collidingwith a train might go unnoticed, if it occurs after a monthly survey and corpses decayor are removed until the next survey (Santos et al. 2011). The problem may beparticularly serious for small passerines, because their corpses are likely to persist forvery short periods in the railway, thereby causing underestimation of the mortalityrate (Santos et al. 2011) and making it difficult to precisely estimate the location ofmortality hotspots (Santos et al. 2015). However, the main focus of this study was onaquatic birds, which tend to be relatively large and thus less affected by very shortpersistence times. Furthermore, a collision with a flock of large birds would likely bedetected by the train driver and then reported to the safety department. Also, theobservation that mortality hotspots were coincident with wetland crossings is unli-kely to be due to survey bias, given that the number of bird corpses per km andsurvey day detected therein was more than 10 times higher than anywhere else alongthis railway. This number might be even greater, because some birds colliding withtrains on the wetland bridges could be thrown to the surrounding water or other wethabitats, where they would likely decay rapidly or otherwise go unnoticed byobservers. Another potential problem is that bird movements across the bridge overthe Sado River were also observed for just a few days, and we did not include dayswith poor visibility conditions (e.g., fog) or night time periods when there may beconsiderable activity by waders (Lourenço et al. 2008). Therefore, our conclusionthat birds were mainly flying outside the collision risk areas should be accepted withcare, because it cannot be completely ruled out that more dangerous flight patternswere taken at night or under particular weather conditions.
Fig. 7.4 Schematic drawing of the bowstring railway bridge across the Sado River, showing theproportion of bird crossings at various heights during one annual cycle (November 2012–September 2013). The grey section indicates the birds flying at the heights of collision risk withcirculating trains
112 C. Godinho et al.

Despite these potential problems, our study suggests that the mortality risk forbirds was higher in railway sections crossing wetlands than elsewhere, as under-lined by the concentration of bird kills in the Sado and, to a lesser extent, the SãoMartinho wetlands. However, in contrast to expectations, most mortality involvedsmall passerines, particularly white wagtails, while there were only a few aquaticbirds killed. This may be a consequence of the high productivity of wetlandhabitats, which attract large numbers of birds that are then exposed to collision withcirculating trains and railway structures during their daily movements. In theMediterranean region, these wetlands are particularly important in autumn andwinter, when they are used by large numbers of passerines from northern latitudes(Finlayson et al. 1992), which may be associated with the higher mortality observedduring these seasons. Aquatic birds may be less exposed to collisions because theyfly higher than small passerines (see below), which may explain the small numberof kills recorded in our study. However, this may vary in relation to ecologicalconditions and railway characteristics, because apparently larger mortalities of gullsand waterfowl have been found in other study areas (van der Grift and Kuijsters1998; Heske 2015).
As expected, we found a large number of aquatic birds crossing the bridge overthe Sado River, particularly from October to February, and following a path alongthe river. The birds observed most frequently included a number of waterfowl,waders and other aquatic species, which are abundant both locally and across theestuary (Alves et al. 2011). The flight patterns taken by these birds suggest that theywere very rarely at risk of collision with circulating trains or bridge structures. Wefound that only a very small proportion of crossings (�1%) were within the heightof collision risk with trains, while most birds (�52%) crossed above the bridges’arcs. Actually, the presence of the arcs may have helped deflect birds away from thecollision risk area, as we often observed birds avoiding these by changing flightpaths. This is in line with observations showing that individual birds and bird flockschange flight paths in response to the presence of anthropogenic structures such aspole barriers (Zuberogoitia et al. 2015).
Overall, our study contributed to clarifying the bird mortality risk due to colli-sions in railways, adding to just a few previous studies addressing this issue (SCV1996; Peña and Llama 1997; van der Grift and Kuijsters 1998; Schaub et al. 2010,see also Chap. 2). Our results, together with those previous studies, suggest that therisk associated with railways may be relatively low compared to other anthro-pogenic sources of mortality (Loss et al. 2015), although differences are difficult tojudge precisely, because of the variation in methodological approaches and eco-logical contexts. Nevertheless‚ it is worth noting that there were many more col-lisions where railways crossed wetland habitats, suggesting that the planning ofnew railways should strive to avoid these habitats as much as possible. Where thisis unfeasible or undesirable, monitoring programs should be implemented toevaluate the risks and provide information to design mitigation measures if nec-essary. Despite the relatively low numbers of dead aquatic birds recorded in ourstudy, we believe that they should not be disregarded in monitoring programsbecause mortality patterns may depend on local ecological and railway
7 Bird Collisions in a Railway Crossing a Wetland … 113

characteristics. Overall, we suggest that further empirical studies are necessary onother railways and covering a wider range of ecological conditions, to help drawgeneralizations that can be useful for landscape planners and environmentalmanagers.
Acknowledgements This study was supported by Infraestruturas de Portugal with the contri-bution of the Portuguese Science Foundation through the doctoral Grants SFRH/BD/81602/2011(Carlos Godinho) and SFRH/BD/87177/2012 (Pedro Salgueiro). Carlos Oliveira and JoséRebocho (REFER Manutenção) provided invaluable help during the mortality surveys.
References
Alves, J. A., Dias, M., Rocha, A., Barreto, B., Catry, T., Costa, H., et al. (2011). Monitorização daspopulações de aves aquáticas dos estuários do Tejo, Sado e Guadiana. Relatório do ano de2010. Anuário Ornitológico (SPEA), 8, 118–133.
Barrientos, R., Alonso, J. C., Ponce, C., & Palacin, C. (2011). Meta-analysis of the effectiveness ofmarked wire in reducing avian collisions with power lines. Conservation Biology, 25, 893–903.
Barrientos, R., Ponce, C., Palacin, C., Martín, C. A., Martín, B., & Alonso, J. C. (2012). Wiremarking results in a small but significant reduction in avian mortality at power lines: A BACIdesigned study. PLoS ONE, 7, e32569.
Barrios, L., & Rodríguez, A. (2004). Behavioral and environmental correlates of soaring-birdmortality at on-shore wind turbines. Journal of Applied Ecology, 41, 72–81.
Borda-de-Água, L., Grilo, C., & Pereira, H. M. (2014). Modeling the impact of road mortality onbarn owl (Tyto alba) populations using age-structured models. Ecological Modelling, 276, 29–37.
Carrete, M., Sánchez-Zapata, J. A., Benítez, J. R., Lobón, M., & Donázar, J. A. (2009). Large scalerisk assessment of wind-farms on population viability of a globally endangered long-livedraptor. Biological Conservation, 142, 2954–2961.
Dias, M. P., Granadeiro, J. P., Lecoq, M., Santos, C. D., & Palmeirim, J. M. (2006). Distance tohigh-tide roosts constrains the use of foraging areas by dunlins: Implications for themanagement of estuarine wetlands. Biological Conservation, 131, 446–452.
Dorsey, B., Olsson, M., & Rew, L. J. (2015). Ecological effects of railways on wildlife. In R. vander Ree, D. J. Smith, & C. Grilo (Eds.), Handbook of Road Ecology (pp. 219–227). WestSussex: Wiley.
Drewitt, A. L., & Langston, R. H. (2006). Assessing the impacts of wind farms on birds. Ibis, 148,29–42.
Finlayson, C. M., Hollis, G. E., & Davis, T. J. (1992). Managing Mediterranean Wetlands andTheir Birds. IWRB Special Publication 20. Slimbridge: International Wetland ResearchBureau.
Heske, E. J. (2015). Blood on the tracks: Track mortality and scavenging rate in urban naturepreserves. Urban Naturalist, 4, 1–13.
Loss, S. R., Will, T., & Marra, P. P. (2015). Direct mortality of birds from anthropogenic causes.Annual Review of Ecology Evolution and Systematics, 46, 99–120.
Lourenço, P. M., Groen, N., Hooijmeijer, J. C. E. W., & Piersma, T. (2009). The rice fields aroundthe estuaries of the Tejo and Sado are a critical stopover area for the globally near-threatenedBlack-tailed Godwit Limosa l. limosa: Site description, international importance andconservation proposals. Airo, 19, 19–26.
Lourenço, P. M., Silva, A., Santos, C. D., Miranda, A. C., Granadeiro, J. P., & Palmeirim, J. M.(2008). The energetic importance of night foraging for waders wintering in a temperate estuary.Acta Oecologica, 34, 122–129.
114 C. Godinho et al.

May, R., Reitan, O., Bevanger, K., Lorentsen, S. H., & Nygård, T. (2015). Mitigating wind-turbineinduced avian mortality: Sensory, aerodynamic and cognitive constraints and options.Renewable and Sustainable Energy Reviews, 42, 170–181.
Peña, O. L., & Llama, O. P. (1997). Mortalidad de aves en un tramo de linea de ferrocarril. GrupoLocal SEO-Sierra de Guadarrama, Spain. Unpublished report. SEO/BirdLife, Grupo localSEO-Sierra de Guadarrama. Retrieved July 19, 2016, from http://www.actiweb.es/seosierradeguadarrama/archivo1.pdf
Santos, S. M., Carvalho, F., & Mira, A. (2011). How long do the dead survive on the road?Carcass persistence probability and implications for road-kill monitoring surveys. PLoS ONE,6, e25383.
Santos, S. M., Marques, J. T., Lourenço, A., Medinas, D., Barbosa, A. M., Beja, P., et al. (2015).Sampling effects on the identification of roadkill hotspots: Implications for survey design.Journal of Environmental Management, 162, 87–95.
Santos, S. M., Mira, A., Salgueiro, P. A., Costa, P., Medinas, D., & Beja, P. (2016). Aviantrait-mediated vulnerability to road traffic collisions. Biological Conservation, 200, 122–130.
Schaub, M., Aebischer, A., Gimenez, O., Berger, S., & Arlettaz, R. (2010). Massive immigrationbalances high anthropogenic mortality in a stable eagle owl population: Lessons forconservation. Biological Conservation, 143, 1911–1918.
S. C. V. (1996). Mortalidad de vertebrados en líneas de ferrocarril. Documentos Técnicos deConservación SCV 1. Madrid: Sociedad Conservación de Vertebrados.
van der Grift, E. A., & Kuijsters, H. M. J. (1998). Mitigation measures to reduce habitatfragmentation by railway lines in the Netherlands. In G. L. Evink, P. Garrett, D. Zeigler, &J. Berry (Eds.), Proceedings of the international conference on wildlife ecology andtransportation (pp. 166–170). Tallahassee: Florida Department of Transportation.
Zuberogoitia, I., del Real, J., Torres, J. J., Rodríguez, L., Alonso, M., de Alba, V., et al. (2015).Testing pole barriers as feasible mitigation measure to avoid bird vehicle collisions (BVC).Ecological Engineering, 83, 144–151.
Open Access This chapter is licensed under the terms of the Creative Commons Attribution 4.0International License (http://creativecommons.org/licenses/by/4.0/), which permits use, sharing,adaptation, distribution and reproduction in any medium or format, as long as you give appropriatecredit to the original author(s) and the source, provide a link to the Creative Commons license andindicate if changes were made.The images or other third party material in this chapter are included in the chapter’s Creative
Commons license, unless indicated otherwise in a credit line to the material. If material is notincluded in the chapter’s Creative Commons license and your intended use is not permitted bystatutory regulation or exceeds the permitted use, you will need to obtain permission directly fromthe copyright holder.
7 Bird Collisions in a Railway Crossing a Wetland … 115

Chapter 8Cross-scale Changes in Bird BehaviorAround a High Speed Railway: FromLandscape Occupation to InfrastructureUse and Collision Risk
Juan E. Malo, Eladio L. García de la Morena, Israel Hervás,Cristina Mata and Jesús Herranz
Abstract Large-scale transportation infrastructures, such as high-speed railway(HSR) systems, cause changes in surrounding ecosystems, thus generating directand indirect impacts on bird communities. Such impacts are rooted in the individualresponses of birds to infrastructure components, such as habitat occupancy ofrailway proximities, the use of structural elements (e.g., perching or nesting sites),flights over the railway, and behavior towards approaching trains. In this chapter,we present the most important results of several studies that were carried out on birdcommunities, between 2011 and 2015 on a 22-km stretch of HSR built on anagrarian landscape in central Spain. Available data describe the abundance andspatial distribution of birds up to 1000 m from the railway, bird infrastructure use(e.g., embankments, catenaries), cross-flights of the railway obtained through focalsampling, and animal responses to approaching trains recorded from train cockpits.These data depict how bird species respond at various scales to the presence of theHSR, and show how the infrastructure impacts bird communities, due to bothhabitat changes and increases in mortality risk.
Keywords Agrarian steppe � Avian mortality � Community homogenization �Disturbance � Environmental impact assessment � Flight initiation distance �Habitat degradation � Road-kill
J.E. Malo (&) � I. Hervás � C. Mata � J. HerranzTerrestrial Ecology Group, Departamento de Ecología,Universidad Autónoma de Madrid, C. Darwin 2, 28049 Madrid, Spaine-mail: [email protected]
E.L. García de la MorenaSECIM, Servicios Especializados de Consultoría e Investigación Medioambiental,C. Segura 2, 28410 Manzanares el Real, Madrid, Spain
© The Author(s) 2017L. Borda-de-Água et al. (eds.), Railway Ecology,DOI 10.1007/978-3-319-57496-7_8
117

Introduction
The development of large-scale transport infrastructure impacts surroundingecosystems. Environmental impact assessment is the formal procedure set up topredict, evaluate, and plan for the mitigation or compensation of such impacts inadvance of project development (Petts 1999). Large projects impact various kinds ofspecies; those that affect animal populations, especially vertebrates, are prioritizeddue to societal biases in conservation (Wilson et al. 2007). Nonetheless, the existingknowledge about bird responses to the presence and operation of railways is extre-mely scarce, and the data are even more scarce with respect to high speed railways(HSRs), due to their limited and relatively recent presence (Dorsey et al. 2015). Giventhe expected expansion of these railways in the near future (Campos and de Rus 2009;Todorovich et al. 2011; Fu et al. 2012), it is urgent that the environmental effects ofthis new technology be assessed to enable the development of mitigation strategies.
There is now reliable information on the impacts of roads on wildlife and on birdsin particular (Benítez-López et al. 2010). We know that the effects are numerous,beginning with habitat loss generated by the construction of the infrastructure.However, the most serious impacts occur during the operating phase of roads, such asdirect mortality of individuals and indirect impacts derived from the degradation ofhabitats close to roads. Similarly, railways alter bird communities both by destructionand degradation of habitats, as well as by lethal collision (Spencer 1965; Mammenet al. 2002). Due to the structural characteristics of HSRs (larger embankments,catenaries, etc.), their structural effects on habitats (and thus on species) are expectedto exceed those of roads, while the degradation of habitats due to light, noise, andpollution, as well as mortality, are expected to be smaller due to lower traffic intensity.
In any case, the effects of HSRs on birds will depend upon the individual responsesof species to the new landscape conditions. On the one hand, species will respond tothe presence of structures that alter the natural physiognomy of the area, including thedevelopment of new habitats (e.g., revegetated embankments), and structural ele-ments (e.g., catenaries, poles, bridges) that provide new potential perching andnesting sites (Tryjanowski et al. 2013; Morelli et al. 2014). On the other hand, the riskof mortality is restricted to birds that enter the narrow corridor where trains circulate,where the habitat has undergone extreme modification, from the gravel ballast wherethe rails lie to the catenary wires. To explain the impacts of future projects, it is crucialto know how birds respond to the presence of the railway.
This chapter summarizes the results gathered during the monitoring of birds in anagricultural area of the Iberian Peninsula that is crossed by a high-speed railway. Wepresent a sequential approach that addresses the presence, abundance, and activitypatterns of birds in the surroundings and on an HSR, complemented with dataaddressing the response of birds facing approaching trains obtained through cockpitvideo recordings.
118 J.E. Malo et al.

0 90 180 270 360 450Kilometres
Mediterranean Sea
Atla
ntic
Oce
an
2000 1000 0 2000 meters2000 1000 0 2.000 meters
NoblejasVillarrubia de Santiago Santa Cruz de la Zarza
HSRStudy area
Madrid
Albacete
Fig. 8.1 Location of study site along the Madrid-Albacete HSR. Inset image shows a magnifiedview of the study area (boxed-in main image)
Study Area
The study area is the HSR traversing Madrid-Castilla La Mancha-Valencia-Murcia,specifically on the high plateau (Mesa) of Ocaña. The selected section correspondsto km mileposts 80–102 of the HSR that runs through the municipalities ofNoblejas, Villarrubia de Santiago, and Santa Cruz de la Zarza, in the northeast areaof the Toledo province in central Spain (Fig. 8.1).
The Mesa de Ocaña is a large flatland approximately 100 m above the TagusRiver valley, with an average altitude between 750 m above sea level (a.s.l.) at thewestern end of the section, and 790 m a.s.l. on the eastern side. The climate isMediterranean-continental, with an annual average temperature of 13.9 °C (averagemonthly minimum 7.4 °C, and maximum 20.5 °C), and an average annual rainfallof 437.8 mm (Ninyerola et al. 2005).
Of plain or slightly wavy relief, the area crossed by the railway is characterizedby its open physiognomy, with a predominance of dry crops (mainly cereals,although legume crops like chickpeas, are frequently found), interspersed with olivecrops and vineyards. In some areas north of the railway, the topography is some-what more irregular, with ravines, hills, and hillocks where some patches of naturalvegetation remain (oaks, pine trees, bushes, and Stipa tenacissima formations).
8 Cross-scale Changes in Bird Behavior Around … 119

Part of the study area is included in or adjacent to natural protected areas under aconservation legal status. Notably, south of the railway, there are 10 polygons thatconstitute the NATURA2000 site “Áreas esteparias de la Mancha Norte,” which areespecially important for the great bustard (Otis tarda) in the Castilla-La Mancharegion. Approximately 60% of the birds in the region are found here.
Bird Occupation of Railway Surroundings
Spatial patterns of birds around the HSR give broad-scale information of infras-tructure impacts on the animal community because the presence and abundance ofbird species along the landscape mirrors their response to it. Thus, it is foreseeablethat habitat destruction and degradation in the HSR vicinity will shape the waybirds use the area (Benítez-López et al. 2010; Torres et al. 2011; Wiaçek et al.2015). Comparisons of species abundance in close proximity to infrastructurelocations with that in the wider landscape are useful for the assessment of infras-tructure impacts (Torres et al. 2016). Ideally, to analyze human impacts, animalcommunities should be characterized before infrastructure construction as well asrecurrently afterwards, during the operation phase, in a “before and after”control-impact design (Torres et al. 2011). However, this approach is frequentlyunfeasible and scientific quantification of changes in bird densities around roads hasshown that most effects on birds extend up to 500 m from the infrastructure, withoutlying areas largely free of impacts (Benítez-López et al. 2010).
In this case study, the characterization of bird populations potentially affected bythe HSR line started before the operation phase, but after the line was already built.Thus, there is no information related to impacts associated with the constructionphase. Nonetheless, control areas 500–1,000 m from the railway give a detailedpicture of bird communities presumed to be negligibly affected by the presence ofthe project, and they are informative about local changes in bird communities bycomparison with data obtained in close proximity to the HSR (Wiaçek et al. 2015).The first censuses were conducted in May of 2010, coinciding with the breedingseason. Afterwards, the monitoring of bird populations took place during the firstthree years of operation (2011–2013), with censuses in both winter and spring.A final year-round monitoring with four seasonal samplings was conducted in2014–2015. All of these censuses involved two complementary methodologies:(1) linear transects on foot, and (2) direct counts from a car along dirt paths.
The census of passerine birds and other small-sized species was performed bywalking 1 km line-transects without a defined count bandwidth. Each transect waswalked by a single experienced observer, and all birds identified–visually oracoustically–were recorded. This method is frequently used in extensive surveys toestimate abundance, distribution, and patterns of habitat selection by birds (Bibbyet al. 2000). The transects were regularly distributed on both sides of the railway intwo lines parallel to the HSR, one next to the fence to sample the bird communityaffected by the railway, and the second (control) at a distance of 500 m from it.
120 J.E. Malo et al.

Direct counts of mid- and large-sized birds were conducted by car, as is common(Alonso et al. 2005; Morales et al. 2008). For these counts, the car was drivenslowly along dirt tracks up to 1000 m from the railway, with a fixed detection bandof 1000 m to each side of the vehicle. Regular stops were made to prospect the areathoroughly, including the surroundings of the railway and control sites on bothsides. All morning, censuses were carried out within four hours of sunrise, andafternoon censuses were done in the 2 h before sunset. Censuses were done on dayswith good visibility and no rain, and hunting days were avoided.
In the landscape traversed by the HSR, the avian community was typical of that inthe (Traba et al. 2013). Outstanding species typical of steppes include the great bustard,little bustard (Tetrax tetrax), and calandra lark (Melanocorypha calandra), togetherwith others common in agricultural areas, including the spotless starling (Sturnusunicolor), rock dove (Columba livia), common magpie (Pica pica), sparrows (Passerspp., Petronia petronia), and several Fringilidae and Embericidae species.
In all, 80 bird species have been detected in the study area, reflecting thepresence of a rich bird community, though 40–50% of the species that have beenobserved in the area were detected in fewer than 10 observations within eachsampling period. Eleven species of high conservation interest were present in thearea, including the black kite (Milvus milvus), which is nationally classified as“endangered” (Madroño et al. 2004). Species classified as “vulnerable” that wereobserved in the area include the great bustard, pin-tailed sandgrouse (Pteroclesalchata), black-bellied sandgrouse (P. orientalis) and little bustard as well asMontagu’s harrier (Circus pygargus).
Regarding changes potentially introduced by the railway, it is noteworthy thattotal bird densities were reduced from approximately 550 birds/km2 in 2010–2011to values in the range 360–390 birds/km2 range in the following years. This changeoccurred shortly after the trains began running, but there is no information fromcontrol sites remote enough to affirm that the decrease was directly associated withthe railway rather than other regional-scale phenomena. Among the local birdspecies, some showed a constant growing trend in their densities over the 5-yearstudy period, including the corn bunting (Emberiza calandra), house sparrow(Passer domesticus), rock dove, common magpie, and Eurasian skylark (Alaudaarvernsis) (Table 8.1). Some species, such as the crested lark (Galerida cristata),showed consistently high average densities. Reductions in population densityestimates over time were observed for the common quail (Coturnix coturnix),European serin (Serinus serinus), common linnet (Carduelis cannabina), meadowpipit (Anthus pratensis), calandra lark, Spanish sparrow (Passer hispaniolensis),and red-legged partridge (Alectoris rufa), among others.
Analysis of the spatial distribution of birds around the railway showed a dif-ferential use across the species (Table 8.1), though strong seasonal variabilitymakes it difficult to detect the effects of HSR proximity. This relationship wasnegative for a number of species, including the calandra lark, crested lark, rockdove, and spotted starling. However, it was strongly positive for several species offinches (common linnet, European serin) that take advantage of the grasslandabundance on HSR embankments. Others, such as the house sparrow, benefittedfrom their use of railway structures to nest. In parallel, a specific analysis of large-and mid-sized bird locations showed that both the great bustard and the little
8 Cross-scale Changes in Bird Behavior Around … 121

Table 8.1 Trends in bird densities in the area traversed by the HSR, 2011–2015
Species Averagedensity
Density near thefence
Calandra lark Melanocoryphacalandra
− −
Common chaffinch Fringilla coelebs − −
Common linnet Carduelis cannabina − +
Common magpie Pica pica +
Common quail Coturnix coturnix −
Common woodpigeon
Columba palumbus −
Corn bunting Emberiza calandra +
Eurasian skylark Alauda arvensis + −
Eurasianstone-curlew
Burhinus oedicnemus −
European serin Serinus serinus − +
House sparrow Passer domesticus + +
Little bustard Tetrax tetrax −
Meadow pipit Anthus pratensis −
Northern wheater Oenanthe oenanthe −
Red-legged partridge Alectoris rufa −
Rock dove Columba livia + −
Sardinian warbler Sylvia melanocephala −
Spanish sparrow Passer hispaniolensis −
Spotless starling Sturnus unicolor + −
Average density reflects average for whole study area. Density near the fence reflects data obtained<500 m from the fence. Only species that had a clear, stable trend, either (+) positive or negative(−), over several monitoring seasons are included
bustard significantly increased their distance (by 60–150 m) from the railway oncetrains started running. However, for most of the species, potential trends wereobscured by seasonal and inter-annual variability.
In conclusion, the construction of the HSR resulted in a general decrease in birddensity in the area, and modified the small-scale spatial patterns of the aviancommunity. Thus, certain birds typical of these pseudo-steppe open landscapes,such as the little bustard, common quail, calandra lark, and red-legged partridgeappeared to move away from the HSR location (Traba et al. 2013). On the otherhand, the infrastructure has led to the presence and/or increase in the numbers ofcertain species, mostly anthropohiles, that use it as a substrate for nesting, resting,or feeding, such as, most notably, sparrows, starlings, rock doves, and magpies(Clavel et al. 2011). The many perching possibilities enabled by the HSR led to awide use by corn buntings as well as by some raptors and corvids. On a narrowerscale, some species were found to concentrate around the railway (common linnet,European serin, house sparrow), while others tended to avoid it (calandra lark,common chaffinch). It is noteworthy that there were some incongruous observa-tions, such as species attracted to the railway or the embankments having decreased
122 J.E. Malo et al.

in numbers in the area (European serin, common linnet), while others that avoid therailway increased their abundance (Eurasian skylark, spotless starling, rock dove).
Bird Use of Railway Structures
Bird species behavior is an important factor in determining whether the HSR has apositive or negative impact on proximal population density. The mortality of birdsdepends on the extent to which they are exposed to the risk of being over-run whileflying, or being electrocuted by the HSR poles or catenary. In contrast, the provision ofnew elements in the landscape (e.g., poles, bridges, embankments) may facilitate thepresence and/or breeding of some species (Tryjanowski et al. 2013; Morelli et al. 2014).It is therefore interesting to elucidate how birds use track environs, because that use maybe beneficial, such as for nesting, or detrimental, such as by producing amortality risk. Ina sense, the above-mentioned changes in the bird community may correspond to land-scape scale impacts, al-though some impacts of the railway are associated with muchmore specific processes that take place on the infrastructure itself (Mainwaring 2015).
Data in this section were obtained from fixed observation stations and madeseasonally between the autumn of 2014 and the summer of 2015. The sampling unitin this case was 10-min observations of all birds that make any use of a 120 msection of the HSR from the position of the observer. This distance corresponds totwo spans between catenary poles, elements that aide in systematic data collectionand define a distance that allows the identification of species of almost all observedindividual birds. For each observed bird, the infrastructure elements used, and thetime spent in them, were noted. Recorded elements were powerlines (catenary,power line and all other supporting wires), built structures (passages and bridges),ballast (stone and gravel track bed), catenary poles, fences, and embankments.
Sampling station locations were selected with the premise of concentrating onhigh embankments where birds have access to all the typical HSR elements anddirectly face the need to determine at what height to cross the railway (see below).In the Villarrubia de Santiago area, 26–28 sampling stations were distributed overapproximately 3360 m. In the Santa Cruz de la Zarza area, 20 stations were dis-tributed over 2400 m. Data from both sections were clumped together for thepresentation of results. The infrastructure use by birds (nesting, rest, power, etc.) isexpressed as: (1) the number of birds and (2) the time of use per kilometer of HSRduring 1 h of observation (birds km−1 h−1).
In total, 936 birds, belonging to 30 species, were observed with an average of81.8 birds and 404 min of use per kilometer of HSR observed for 1 h (Table 8.2).The most common species observed in the vicinity of the HSR were the spotlessstarling, common linnet, rock dove, house sparrow, rock sparrow, crested lark, andcommon magpie (all >5 birds km−1 h−1). No protected species was found using thesampled elements of the infrastructure.
The structures used most were embankments (24 species in total; 26.4 birdskm−1 h−1) and powerlines (12 species; 25.2 birds km−1 h−1), although thenumerical importance of the latter is due to frequent perching by the most abundantspecies—the spotless starling. In this species, 94.3% of the observations were onthese elements. In order of importance, following embankments and powerlines, are
8 Cross-scale Changes in Bird Behavior Around … 123

fences (20 species; 11.3 birds km−1 h−1), built structures (5 species; 9.9 birdskm−1 h−1), ballast (9 species; 5.9 birds km−1 h−1), and, finally, catenary poles (5species; 3.0 birds km−1 h−1).
Table 8.3 summarizes HSR use by species observed more than 10 times. Theembankments are used by most species as a feeding substrate and nesting place.Such nesting takes place both in bushes used for plant restoration as well as on theground protected by them. For these species, embankments are islands with per-manent and green vegetation year-round, contrary to the crop fields and fallows in
Table 8.3 Birds’ use of HSR structural elements
Species Catenary Passages Ballast Poles Embankments Fence
Phoenicurus ochruros − − + −
Sylvia melanocephala + −
Saxicola torquatus + +
Emberiza calandra + − −
Serinus serinus +
Carduelis carduelis − + −
Columba livia − +
Pica pica − − − + + −
Galerida cristata + − + −
Petronia petronia − + − −
Passer domesticus − − − + +
Carduelis cannabina − − + −
Sturnus unicolor + − − − −
Average acrossspecies (%)
30.9 12.2 7.3 3.5 32.3 13.9
Only species with >10 observed individuals are included; +, intensive use (� 30% ofobservations); −, casual use (<30% of observations). Empty cells reflect no apparent use
Table 8.2 Species found making use of railway elements categorized by registered intensity ofuse
Usecategories
Species
Scarce Buteo buteo (1), Clamator glandarius (1), Streptopelia decaocto (1), Alaudaarvensis (2), Sylvia undata (2), Lanius meridionalis (3), Parus major (3),Oenanthe hispanica (3), Merops apiaster (4), Falco tinnunculus (4), Corvuscorone (4), Sylvia cantillans (4), Chloris chloris (4), Oenanthe oenanthe (7),Passer montanus (7), Motacilla alba (9), Fringilia coelebs (9)
Frequent Phoenicurus ochruros (11), Sylvia melanocephala (11), Saxicola torquatus(16), Emberiza calandra (17), Serinus serinus (31), Carduelis carduelis (33)
Veryfrequent
Columba livia (46), Pica pica (63), Galerida cristata (79), Petronia petronia(97), Passer domesticus (108), Carduelis cannabina (112), Sturnus unicolor(244)
Scarce use: 1–10 observations; frequent: 11–40 observations; very frequent: >40 observations
124 J.E. Malo et al.

the surrounding areas. The power lines are used as vantage and singing points bythe corn bunting, in addition to the spotless starling. In the case of passages andbridges, the only note-worthy use was by the rock dove and the rock sparrow; bothspecies rest and nest in holes within these structures. The ballast is only used by thecrested lark, while the catenary poles are occupied as vantage points by the com-mon magpie. It is noteworthy that during the monitoring presented in this chapter,it was discovered that these poles act as pitfall traps that cause the death of birdsthat fall inside (Malo et al. 2016). The spotless starling was the most affectedspecies by this, but magpies and kestrels also suffered this fate. Finally, although thefences are used by many species, their use is only remarkable in the case of thehouse sparrow and European stonechat (Saxicola torquatus).
In conclusion, the HSR provides new structural elements for birds, which areused in accordance with the particular requirements of the species (Morelli et al.2014). However, among the species that use these elements, some were found topresent their maximum densities in close proximity to the railway (common linnet,house sparrow). More frequently, however, species were repelled by the railway(spotless starling, rock dove, crested lark). Therefore, the direct expectation thatspecies that make an active use of the new opportunities provided by the HSRwould increase their densities in proximity to the railway (Benítez-López et al.2010), and in the area as a whole, was not fully met.
Bird Flight Over the Railway
In a sequential approach to the presentation of findings in the previous sections, tounderstand the potential magnitude of the HSR impact on birds, it is key to know towhat extent flying birds face the risk of being overrun by circulating trains.Mortality from roadkill is one of the most serious direct impacts of operatingtransportation infrastructures (Loss et al. 2014). The potential relevance of the HSRis conditioned by the fact that the great speed of the trains, in most cases, precludesbirds from avoiding train collisions (DeVault et al. 2015). If birds could fully avoidrunning trains by flying above their height, the railway would remain responsibleonly for effects on habitats and for increases in energy expenditure by individualsthat cross it in flight.
The collision risk area associated with the HSR corresponds basically to thesection framed by the catenary and the rails. In a simplified view, for twin tracks, itcorresponds to a rectangle with an 8 m-wide base that is 5.3 m high (height of thepower wire) where the trains run. Additionally, it is hazardous for birds to fly abovethe train collision risk area where they may come in contact with the catenary,suspenders, power wire, feeder, earth cable, and tensors (5.3–8.5 m above theground). Although there is a constant risk of collision with these elements evenwhen trains are not running, the risk of collision with the catenary may be increasedby the passage of trains due to the potential for turbulence generated by the movingtrain to destabilize the normal flight of birds. Thus, it is reasonable to assume that
8 Cross-scale Changes in Bird Behavior Around … 125

birds that cross the railway by flying between or below the catenary wires face themortality risk from train-kill.
In the HSR stretch analyzed here, surveys of birds flying over the infrastructurewere carried out between 2010 and 2015, with a total of approximately 270 h ofobservation at nearly 1100 observation points. Sampling structure varied,depending on the objectives of particular studies, but in all cases observations weremade from fixed stations for 10 min or 20 min. Bird flight was recorded from thesepoints, with HSR crossing flight height estimated with respect to the rails.Therefore, for all crossing events over the railway (N = 3313 records and 10,776individuals), it is known whether the birds crossed within the collision risk area(train path or catenary), allowing a risk index to be calculated for each species.Additionally, data obtained within 120 m of the observer have been used to esti-mate HSR crossing rates throughout the year (birds h−1 km−1). Furthermore, spatialand temporal sampling patterns are informative for elucidating interactions ofvarious factors, such as whether track crossover frequency is independent of HSRgeometry, astronomical season, or environmental conditions such as wind speed.Complementarily, data available on birds from surrounding areas, such as parallelsampling of flight behavior, can be used to determine whether birds change theirusual flight trajectories in the presence of the HSR. To ensure consistency of theresults, the data presented are restricted to species for which, in at least one sam-pling station, 10 crossing records were obtained.
Our analysis showed that birds cross the HSR frequently, with an average HSRcrossing frequency of 246.7 birds km−1 h−1 (experiment range, 160.2–514.0 birdskm−1 h−1). No consistent seasonal pattern was observed across the trials. However,our data analysis did reveal alterations in bird flight patterns in the vicinity of theHSR. An experiment conducted between June and July of 2011 at 237 observationstations along the HSR and 85 remote control sites showed that birds of any speciesfly, on average, almost 5 m higher near the HSR than in control sites (9.9 vs. 5.2 mover the ground). This increase in flight heights reflects some avoidance of theinfrastructure, with an added energy cost. The average flight height of birds over theHSR was lower in areas where the railway runs along embankments relative tosections of railway that are level with the surrounding landscape. In fact, severalexperiments showed that birds reduced their crossing railway height between 1 mand 4 m for every 10 m of embankment height. However, these general patternswere found to vary greatly across different species, and all of them combineobservations of birds both inside and outside the cross-section of collision risk.
Although the birds fly higher over the infrastructure than over an open field, thefrequency with which they cross the railway within the risk area is high. For the 33analyzed species, almost half of railway crossings (combined average, 46.5%)occurred less than 8.5 m above the ground (Table 8.4). More than two-thirds ofthese low crossings were under the catenary, and the remainder were through thecatenary wires. In fact, birds of 21 species crossed within (rather than over) the riskarea for at least 33% of their HSR crossings, and 14 species did so for at least 50%.
The partridge (100%), Eurasian tree sparrow (Passer montanus, 90%), hoopoe(Upupa epops, 88.5%), and northern wheatear (Oenanthe oenanthe, 83%) stand out
126 J.E. Malo et al.

as species with high-frequency risks of colliding with running trains. Conversely,the great bustard (0.0%), black kite (5.7%), common swift (Apus apus, 5.9%), woodpigeon (Columba palumbus, 8.7%), and great cormorant (Phalacrocorax carbo,8.1%) showed low-risk flying behavior. However, the fact that 12 great bustardcarcasses have been observed within the HSR study area indicates that great bus-tards must fly under or through the catenary at least occasionally (unpublished data,LIFE+ Impacto 0 2016). The collision risk was elevated on embankments, with therisk of collisions in one study being 14% greater on embankments over 5 m highthan in nearby flat sections of the HSR. Birds from virtually all of the protectedspecies present in the area crossed the risk area at least occasionally. Notably,40.0% of little bustard crossings, 28.6% of lesser kestrel (Falco naumanni)crossings, and 24.3% of Montagu’s harrier crossings were observed to be below8.5 m.
Finally, another important factor that determines the height of flight over theHSR is wind. Because birds tend to fly lower in the presence of strong winds,percentages of railway crossings through the risk area increase under windy con-ditions. The presence of fog would be expected to affect birds’ mortality risk in thevicinity of the HSR as well. However, foggy days were not sampled specifically.Generally, the potential influence of atmospheric conditions on bird behavior withrespect to the HSR should be clarified to better understand the risk faced by birdscrossing the railway.
In conclusion, although birds show some avoidance of the railway and catenary,many birds fly within the collision risk area. This risky behavior is also engaged inby protected species, although it is especially prevalent among species that makeuse of specific elements of the railway (e.g., common linnet, European serin,Eurasian skylark). There are also some species, such as the red-legged partridge andhoopoe, that tend to fly close to the ground naturally and thus face a high risk ofcollision with trains and the catenary.
Table 8.4 Species for which it was possible to define flight behavior patterns relative to thecollision risk area of the HSR (i.e. under or between the wires of the catenary)
Flying risk category Species
Infrequent flightthrough risk area
Otis tarda, Milvus migrans, Apus apus, Columba palumbus,Phalacrocorax carbo, Columba livia, Sturnus unicolor, Circuspygargus, Riparia riparia, Falco naumanni, Buteo buteo
Frequent flight throughrisk area
Anas platyrhynchos, undet. Passeriforme, Tetrax tetrax, Anthuspratensis, Fringilia coelebs, Falco tinnunculus, Corvus corone,Merops apiaster, Circus aeruginosus, Hirundo rustica,Melanocorypha calandra, Petronia petronia, Pica pica
Usual flight throughrisk area
Carduelis cannabina, Serinus serinus, Carduelis carduelis,Galerida cristata, Passer domesticus, Oenanthe oenanthe, Upupaepops, Passer montanus, Alectoris rufa
The species are grouped into three categories of flying frequency through risk area defined asfollows: infrequent, if they cross through it in less than a third of cases; frequent, betweenone-third and two-thirds of the cases; and usual, in more than two-thirds of the cases. Within eachcategory the species are ordered by increasing values of risk values
8 Cross-scale Changes in Bird Behavior Around … 127

Bird Behavior Towards Approaching Trains
A more detailed scale of bird interactions with the HSR is the behavior of individualbirds facing an approaching train. Note that if birds are able to react before thearrival of a train, even high rates of crossing the risk area would be harmless.However, it is methodologically complex to analyze this issue. Data presented inthe previous sections were in all cases collected with traditional direct observationmethodologies, which involve time-space limitations (e.g., length of sections underscrutiny, difficulty or impossibility of accessing the infrastructure, and frequency oftrains) that limit data quantity and quality (Wells et al. 1999). Such limitations areespecially noticeable for relatively rare animals and exacerbated by the difficulty ofobserving the process in real time, given the velocity of HSR trains (Rodríguezet al. 2008).
To overcome these limitations, data in this section were obtained in theframework of a project currently under development (LIFE+ Impacto 0 2016) thatuses high-speed video recording from the cockpits of running trains. This study isthe first time that this method was applied in a railway study, previous studies useddirect observations by train conductors (SCV 1996; SEO/BirdLife 1997; Wellset al. 1999), and video recordings have begun to be used to assess the interactions ofwildlife with powerlines (Carlton and Harness 2001), wind turbines (Desholm et al.2006; Cryan et al. 2014), airplanes (Doppler et al. 2015), and cars (Legagneux andDucatez 2013; DeVault et al. 2015). Cockpit video data provide accurate infor-mation on location, time, conditions (i.e., speed of the train, type of stretch), and thebehavior (i.e., distance of flight, type of reaction) of animals detected in front of thevehicle in events of crossing, infrastructure use, and collision. Also, observationscan be made continuously along the train path for tens or even hundreds of kilo-meters, and include sections inaccessible to walking personnel due to viaducts andtunnels. Hence the cockpit video approach increases the number and types ofobservations that can be made.
Video recordings included in the present analysis were made withforward-facing, high-speed cameras (120–240 frames per second, GoPro Hero 3+Black Edition) through the cockpit windshield. A technician located in the cabinoperated the recording equipment together with GPS register systems and recordedall bird observations (perching, crossings, collisions) on standardized forms.A series of basic data were thus used to simplify later analysis (e.g., recording time,relative size or bird species, position in the image, type of observation). Theseforms served as a reference for the systematic review of recordings, focusingattention on direct observations. Technicians’ observations, species, numbers ofindividuals, and behaviors were confirmed in the videos. In parallel, data from thenavigation system, such as train speed, location (geographic coordinates and milemark), stretch configuration, and surrounding habitat were extracted. High-speedrecording allowed repeated and frame-to-frame review of each event to facilitate theanalysis of the observations.
128 J.E. Malo et al.

The train trips with high speed recording were between the Madrid and Albacetestations (321.7 km) of the Madrid-Levante line, which includes the section in whichall field experiments were developed. A total of 66 trip recordings were collectedover different seasons (14–20 per season). There were five additional trips duringwhich the technical equipment was set up and tested (data not included). In all, 59 hand 55 min of recording (average trip, 55.3 min) along 14,700 km of accumulatedtrain motion (average trip, 226.2 km; range: 78.3–288.7 km) were analyzed.
These recordings yielded 1090 confirmed bird observations, including 39 col-lisions (3.6% of observations), yielding a mortality risk of 0.0026 killed birds perkm (1 hit per 406.1 km). Direct observation from the cockpit provided a newperspective in the analysis of the reactions of birds facing an approachingtrain. Train speed during bird collisions (mean ± standard deviation, 265.8 ±
39.2 km/h; range 175–305 km/h; N = 20) was similar to that during under-catenarycrossings (251.5 ± 58.9 km/h; range 0–305 km/h; N = 183). However, in allcases, bird collisions occurred with trains travelling at high speeds. Collision ratesvaried seasonally, consistent with prior observations (SEO/BirdLife 1997; Frías1999; Carvalho and Mira 2011; Bishop and Brogan 2013; Loss et al. 2014). Theroadkill rate varied between 0.0018 and 0.0032 birds/km, with a noteworthy con-stant percentage of under-catenary crossings in front of the train resulting in col-lisions (*12.2 ± 0.01%). These data suggest that train speed determines mortalityrisk independent of particular species’ characteristics, with the risk being a result ofthe fact that birds are not adapted to avoiding objects approaching at such highvelocities (Martin 2011; DeVault et al. 2015; Lima et al. 2015). Previous studieshave pointed out that birds have difficulty avoiding vehicles travelling over 80–90 km/h (Pallag 2000; DeVault et al. 2014, 2015). The lowest speeds of collisionrecorded in our study were *180 km/h, similar to the findings of DeVault et al.(2015), who suggested that such speeds exceed birds’ abilities to escapesuccessfully.
Given these data and the infeasibility of reducing train speeds, informationobtained from recordings with respect to birds’ infrastructure use and behaviorwhen facing a train, particularly in cases of collision, is of great interest. Of allrecorded birds, 29.4% flew below the catenary (i.e. through the risk area), a datumsimilar to that registered in previous field studies (33.1, see above section). Cockpitrecordings enabled us to determine that 37.7% of the birds that crossed the risk areawere using some element of the infrastructure moments before their trainencounters. That is, they commenced flight (most likely) due to the approach of thetrain, but crossed in front of it. Among the data obtained from the train, it isremarkable that 40.1% of the detected birds were initially observed in the infras-tructure, and 28% of them crossed below the catenary. In addition, 5 of 29 colli-sions recorded from the cockpit (17.2%) involved birds resting on or in theinfrastructure. Therefore, a high percentage of the birds that are finally exposed tothe risk of collision were using the railway as a place to rest or feed. Hence,corrective measures, such as barriers designed to raise the flight of birds above thecatenary (LIFE+ Impacto 0 2016), should also deter birds from HSR structures inorder to reduce bird mortality risk in the HSR.
8 Cross-scale Changes in Bird Behavior Around … 129

On the other hand, our analysis of the flight initiation distance of different groupsof birds showed that they do not seem to respond to trains as if they were predators,but rather human-associated elements (Møller et al. 2013; Neumann et al. 2013).Thus, species that are more tolerant of people or even anthropophilic (e.g.,passerines and pigeons) show flight initiation distances that are significantly shorterthan those of crows and birds of prey, which are more predatory (Table 8.5). Somespecies that are frequently observed around railways (e.g., the crested lark, doves,and pigeons) do not take flight in response to incoming trains, putting themselves atrisk of being hit or dragged by the turbulence of the passing train.
In short, it is evident that at least some of the birds living in the surroundings ofthe HSR do not treat trains as a natural threat, and exhibit some habituation to HSRtrain circulation. However, HSR train speed often proves fatal when birds enter thecollision risk area. Both factors could explain the high mortality rates near the HSRrelative to rates near other linear infrastructures, though further research on otherHSR stretches should be done to determine if this pattern of findings is represen-tative of broader HSR areas.
Conclusions
Our results provide a first picture of the avian response to the presence and oper-ation of HSR trains. Although the observed trends are not particularly prominentand are diluted by seasonal and inter-annual variability, they are consistent with thenotion that train circulation could be responsible for a decrease in bird abundance inthe traversed area. Accordingly, it can be concluded that the presence of the HSRhas led to a process of ruderalization characterized by the increased numbers ofspecies taking advantage of the railway. Some bird species representative of openand agricultural areas were found to avoid the HSR, whereas species that useman-made structures were found to be attracted to it. In fact, we documented theactive use of these new elements, mainly the embankments and the catenary, bybirds. In addition, birds alter their flight patterns near the railway, includingshowing some avoidance of it. However, birds risk train collision because suchavoidance is not complete. Moreover, the species that are most exposed to traincollisions are those that respond favorably to the railway and use its associated
Table 8.5 Flight initiation distance (mean ± SD) of birds facing and approaching high speedtrains
Bird group Number of observations Flight initiation distance (m)
Passerines 12 59.6 ± 33.5
Pigeons and doves 89 67.8 ± 36.8
Corvids 21 106.2 ± 42.2
Mid-sized raptors 40 136.0 ± 49.1
Data correspond to bird taxa with a sample size larger than 10 observations
130 J.E. Malo et al.

elements. The cockpit recordings confirmed bird habituation to moving trains andthat some portion of over-run specific birds were actively using the railwaymoments before they faced the approaching train. Nevertheless, the flight charac-teristics of each species are also a determinant, and species that fly close to theground are exposed to a disproportionate collision risk even if they do not makeactive use of the railway. These findings led us to conclude that changes in thecommunity of birds in the surroundings of the HSR are relevant and related tostructural landscape changes and the responses of bird species to the new infras-tructure. In addition, bird mortality may have a significant impact on the popula-tions of some species, given the fact that birds cross the collision risk areafrequently. The results may be contentious from an environmental impact per-spective given the limited opportunities for mitigation (Rodríguez et al. 2008).Firstly, changes in the avian community due to the presence of the HSR and the useof HSR structures are probably difficult to avoid because birds use elements that arefundamental to the infrastructure, thus, only minor design changes can be imple-mented to minimize HSR impacts on birds. Secondly, even if the installation ofsome devices can reduce flight paths across the railway, their implementation willbe feasible only in short stretches of high ornithological interest due to cost limi-tations. Finally, reducing train speed in poder to reduce the risk of collisions withbirds would conflict with the core objective of a HSR, making such a strategy againunlikely along long stretches of railway.
Acknowledgments Jorge Hernández Justribó, Mª José Pérez Sobola, Diego Sánchez Serrano,and safety personnel from Centro de Estudios y Experimentación of the Ministry for Public Works(CEDEX) and Ineco helped with fieldwork. Staff from CEDEX and Adif provided kind help withproject logistics. This study was carried out as part the LIFE+ Impacto 0 research project (LIFE 12BIO/ES/000660) and a research agreement between UAM and CEDEX; both focused on themitigation of High Speed Railway impacts on bird populations. The Comunidad de Madrid,together with the European Social Fund, supports the Terrestrial Ecology Group research groupthrough the REMEDINAL-3 Research Network (S-2013/MAE-2719).
References
Alonso, J. C., Palacín, C., & Martín, C. A. (Eds.). (2005). La avutarda común en la PenínsulaIbérica: población actual y método de censo. Madrid: SEO/BirdLife.
Benítez-López, A., Alkemade, R., & Verweij, P. A. (2010). The impacts of roads and otherinfrastructure on mammal and bird populations: A meta-analysis. Biological Conservation,143, 1307–1316.
Bibby, C. J., Burgess, N. D., & Hill, D. A. (2000). Bird census techniques (2nd ed.). London:Academic Press.
Bishop, C. A., & Brogan, J. M. (2013). Estimates of avian mortality attributed to vehicle collisionsin Canada. Avian Conservation and Ecology, 8, 2.
Campos, J., & de Rus, G. (2009). Some stylized facts about high-speed rail: A review of HSRexperiences around the world. Transport Policy, 16, 19–28.
Carlton, R. G., & Harness, R. E. (2001). Automated systems for monitoring avian interactions withutility structures and evaluating the effectiveness of mitigative measures. In: PowerEngineering Society winter meeting (Vol. 351, pp. 359–361). IEEE.
8 Cross-scale Changes in Bird Behavior Around … 131

Carvalho, F., & Mira, A. (2011). Comparing annual vertebrate road kills over two time periods,9 years apart: A case study in Mediterranean farmland. European Journal of Wildlife Research,57, 157–174.
Clavel, J., Julliard, R., & Devictor, V. (2011). Worldwide decline of specialist species: Toward aglobal functional homogenization? Frontiers in Ecology and the Environment, 9, 222–228.
Cryan, P. M., Gorresen, P. M., Hein, C. D., Schirmacher, M. R., Diehl, R. H., Huso, M. M., et al.(2014). Behavior of bats at wind turbines. Proceedings of the National Academy of Sciences,111, 15126–15131.
Desholm, M., Fox, A. D., Beasley, P. D. L., & Kahlert, J. (2006). Remote techniques for countingand estimating the number of bird-wind turbine collisions at sea: A review. Ibis, 148, 76–89.
DeVault, T. L., Blackwell, B. F., Seamans, T. W., Lima, S. L., & Fernández-Juricic, E. (2014).Effects of vehicle speed on flight initiation by turkey vultures: Implications for bird-vehiclecollisions. PLoS ONE, 9, e87944.
DeVault, T. L., Blackwell, B. F., Seamans, T. W., Lima, S. L., & Fernández-Juricic, E. (2015).Speed kills: Ineffective avian escape responses to oncoming vehicles. Proceedings of the RoyalSociety of London B, 282, 20142188.
Doppler, M. S., Blackwell, B. F., DeVault, T. L., & Fernández-Juricic, E. (2015). Cowbirdresponses to aircraft with lights tuned to their eyes: Implications for bird–aircraft collisions.The Condor, 117, 165–177.
Dorsey, B., Olsson, M., & Rew, L. J. (2015). Ecological effects of railways on wildlife. In R. vander Ree, D. J. Smith, & C. Grilo (Eds.), Handbook of road ecology (pp. 219–227). WestSussex: Wiley.
Frías, O. (1999). Estacionalidad de los atropellos de aves en el centro de España: número y edad delos individuos y riqueza y diversidad de especies. Ardeola, 46, 23–30.
Fu, X., Zhang, A., & Lei, Z. (2012). Will China’s airline industry survive the entry of high-speedrail? Research in Transportation Economics, 35, 13–25.
Legagneux, P., & Ducatez, S. (2013). European birds adjust their flight initiation distance to roadspeed limits. Biology Letters, 9, 20130417.
LIFE+ Impacto 0. (2016). Development and demonstration of an anti-bird strike tubular screenfor High Speed Rail lines. LIFE+ Biodiversity project (LIFE12 BIO/ES/000660). http://www.lifeimpactocero.com. Accessed October 14, 2016.
Lima, S. L., Blackwell, B. F., DeVault, T. L., & Fernández-Juricic, E. (2015). Animal reactions tooncoming vehicles: A conceptual review. Biological Reviews, 90, 60–76.
Loss, S. R., Will, T., & Marra, P. P. (2014). Estimation of bird-vehicle collision mortality on U.S.roads. Journal of Wildlife Management, 78, 763–771.
Madroño, A., González, A., & Atienza, J. C. (2004). Libro Rojo de las aves de España. DirecciónGeneral para la Biodiversidad-SEO/BirdLife, Madrid.
Mainwaring, M. C. (2015). The use of man-made structures as nesting sites by birds: A review ofthe costs and benefits. Journal of Nature Conservation, 25, 17–22.
Malo, J. E., García de la Morena, E. L., Hervás, I., Mata, C., & Herranz, J. (2016). Uncappedtubular poles along high-speed railway lines act as pitfall traps for cavity nesting birds.European Journal of Wildlife Research, 62, 483–489.
Mammen, U., Klammer, G., & Mammen, K. (2002). Greifvogeltod an Eisenbahntrassen—einunterschaetztes problem [Dead of raptors at railways—An underestimated problem]. Paperpresented at the 5. Internationales Symposium “Populationsökologie von Greifvogel- undEulenarten” [“Population Ecology of Raptors and Owls”], Meisdorf/Harz.
Martin, G. R. (2011). Through birds’ eyes: Insights into avian sensory ecology. Journal ofOrnithology, 153, 23–48.
Møller, A. P., Grim, T., Ibáñez-Álamo, J. D., Markó, G., & Tryjanowski, P. (2013). Change inflight initiation distance between urban and rural habitats following a cold winter. BehavioralEcology, 24, 1211–1217.
Morales, M. B., Traba, J., & Carriles, E. (2008). Sexual differences in microhabitat selection ofbreeding little bustards Tetrax tetrax: Ecological segregation based on vegetation structure.Acta Oecologica, 34, 345–353.
132 J.E. Malo et al.

Morelli, F., Beim, M., Jerzak, L., Jones, D., & Tryjanowski, P. (2014). Can roads, railways andrelated structures have positive effects on birds?—A review. Transportation Research Part DTransport and Environment, 30, 21–31.
Neumann, W., Ericsson, G., Dettki, H., & Radeloff, V. C. (2013). Behavioural response toinfrastructure of wildlife adapted to natural disturbances. Landscape Urban Plan, 114, 9–27.
Ninyerola, M., Pons, X., & Roure, J. M. (2005). Atlas Climático Digital de la Península Ibérica.Metodología y aplicaciones en bioclimatología y geobotánica. Bellaterra: UniversidadAutónoma de Barcelona.
Pallag, O. (2000). COST 341. Habitat fragmentation due to transportation infrastructure.Hungarian State of the Art Report. Technical and Information Services on National Roads(ÁKMI), Budapest.
Petts, J. (Ed.). (1999). Handbook of environmental impact assessment (2 Vols.). Oxford:Blackwell Science.
Rodríguez, J. J., García de la Morena, E. L., & González, D. (2008). Estudio de las medidascorrectoras para reducir las colisiones de aves con ferrocarriles de alta velocidad. Ministeriode Fomento, CEDEX, Madrid.
S. C. V. (1996). Mortalidad de vertebrados en líneas de ferrocarril. Documentos Técnicos deConservación SCV. Sociedad Para la Conservación de los Vertebrados, Madrid.
SEO/BirdLife. (1997). Mortalidad de aves en un tramo de línea de ferrocarril. SEO/BirdLife,Grupo local SEO-Sierra de Guadarrama.
Spencer, K. J. (1965). Avian casualties on railways. Bird Study, 12, 257.Todorovich, P., Schned, D., & Lane, R. (2011) High-speed rail. International Lessons for U.S.
Policy Makers. Lincoln Institute of Land Policy, Cambridge, Massachusetts, USA.Torres, A., Jaeger, J. A. G., & Alonso, J. C. (2016). Assessing large-scale wildlife responses to
human infrastructure development. Proceedings of the National Academy of Sciences, 113,8472–8477.
Torres, A., Palacín, J., Seoane, J., & Alonso, J. C. (2011). Assessing the effects of a highway on athreatened species using Before-During-After and Before-During-After-Control-Impactdesigns. Biological Conservation, 144, 2223–2232.
Traba, J., Sastre, P., & Morales, M. (2013). Factors determining species richness and compositionof steppe bird communities in Peninsular Spain: Grass-steppe vs. shrub-steppe bird species.In M. Morales & J. Traba (Eds.), Steppe ecosystems: Biological diversity, management andrestoration (pp. 29–45). New York: Nova Publishers.
Tryjanowski, P., Sparks, T. H., Jerzak, L., Rosin, Z. M., & Skórka, P. (2013). A paradox forconservation: Electricity pylons may benefit avian diversity in intensive farmland.Conservation Letters, 7, 34–40.
Wells, P., Woods, J. G., Bridgewater, G., & Morrison, H. (1999). Wildlife mortalities on railways:Monitoring methods and mitigation. In Proceedings of the Third International Conference onWildlife Ecology and Transportation. ICOET, Missoula, Montana.
Wiaçek, J., Polak, M., Filipiuk, M., Kucharczyk, M., & Bohatkiewicz, J. (2015). Do birds avoidrailroads as has been found for roads? Environmental Management, 56, 643–652.
Wilson, J. R. U., Proches, S., Braschler, B., Dixon, E. S., & Richardson, D. M. (2007). The(bio)diversity of science reflects the interests of society. Frontiers in Ecology and theEnvironment, 5, 409–414.
8 Cross-scale Changes in Bird Behavior Around … 133

Open Access This chapter is licensed under the terms of the Creative Commons Attribution 4.0International License (http://creativecommons.org/licenses/by/4.0/), which permits use, sharing,adaptation, distribution and reproduction in any medium or format, as long as you give appropriatecredit to the original author(s) and the source, provide a link to the Creative Commons license andindicate if changes were made.The images or other third party material in this chapter are included in the chapter’s Creative
Commons license, unless indicated otherwise in a credit line to the material. If material is notincluded in the chapter’s Creative Commons license and your intended use is not permitted bystatutory regulation or exceeds the permitted use, you will need to obtain permission directly fromthe copyright holder.
134 J.E. Malo et al.

Chapter 9Relative Risk and Variables Associatedwith Bear and Ungulate Mortalities Alonga Railroad in the Canadian RockyMountains
Benjamin P. Dorsey, Anthony Clevenger and Lisa J. Rew
Abstract Train-wildlife collisions can impact wildlife populations as well as createhuman and resource management challenges along railways.We identified locations andrailroad design features associated with train-wildlife collisions (strikes) on a 134 kmsection of the Canadian Pacific Railroad (CPR) that travels through the Banff and YohoNational Parks. A 21-year dataset of train strikes with elk (Cervus elaphus), deer(Odocoileus spp.), American black bears (Ursus americanus) and grizzly bears (U.arctos) were compared to relative abundance estimates, and nine train and railroadvariables. Train strikes and relative abundance varied spatially for elk, deer and bears.Hotspots and relative risk estimates were used to identify potential problem locations.Hotspots were defined as segments of the train line where strike counts were above the95% confidence interval based on a Poisson distribution, and could be identified for elkand deer but not bears. Relative risk was estimated as the ratio of strike counts to thatexpected based on relative abundance. High relative risk locations, where more strikesoccurred than were expected, were identified for elk, deer, and bears. Relative abundancewas positively correlated with strikes for elk and deer but not bears. Train speed limit waspositively associatedwith strikes for elk anddeer. For bears, the number of structures (e.g.,overpasses, tunnels, snow sheds and rock cuts) and bridges were positively correlated tostrikes. To reduce the risk of train strikes on wildlife, our management recommendationsinclude train speed reduction, habitat modifications and railroad design alterations.
Keywords Animal collision mortality � Grain spillage � Railroad � Relative risk �Transportation corridor
B.P. Dorsey (&)Parks Canada, Revelstoke, BC V0E 2S0, Canadae-mail: [email protected]
A. ClevengerWestern Transportation Institute, College of Engineering, Montana State University,334 Leon Johnson, Bozeman, MT 59717, USA
L.J. RewLand Resources and Environmental Sciences, Montana State University,334 Leon Johnson, Bozeman, MT 59717, USA
© The Author(s) 2017L. Borda-de-Água et al. (eds.), Railway Ecology,DOI 10.1007/978-3-319-57496-7_9
135

Introduction
Like roads, railroads affect wildlife through direct mortality, habitat loss and habitatfragmentation (van der Grift 1999; Forman et al. 2003; Davenport and Davenport2006). Direct mortalities result when trains strike wildlife. Strikes can be a significantsource of mortality for some wildlife populations and have been reported for decades(Child 1983; Gundersen et al. 1998; Bertch and Gibeau 2010a). Studies have reportedstrike rates for large mammals such as grizzly bears (Ursus arctos) (Bertch andGibeau 2010a, b) and moose (Alces alces) (Child 1983, 1991; Modafferi 1991).
In Canada’s Rocky Mountain National Parks, train strikes are a leading source ofmortality for grizzly bears (0.35 year−1) and black bears (1.95 year−1), and thesecond largest source of mortality for deer (Odocoileus spp.), elk (Cervus elaphus)and moose (Bertch and Gibeau 2010a, b) in the Banff and Yoho National Parks. It islikely that true mortality rates due to train strikes are higher than reported. Forexample, as few as 50% of strikes with large mammals were reported by standardobservers (train engineers) along the Canadian Pacific Railroad (CPR) during asix-year period (Wells et al. 1999). In other cases, strikes may not be reportedexcept when large groups (>450) of wildlife are killed (Chaney 2011) or whenstrikes occur within protected areas (Waller and Servheen 2005). Long-term data oftrain strikes along the CPR exist because strikes have been reported to ParksCanada for at least 30 years. However, other railroads may not report or recordstrikes with such consistency.
Studies on roads have analyzed the spatial pattern of road-kills, which showedthat these occurred in clusters (Finder et al. 1999; Clevenger et al. 2003; Malo et al.2004). The spatial pattern of road-kills has been explained by landscape, envi-ronmental and infrastructure variables (Finder et al. 1999; Hubbard and Danielson2000; Gunson et al. 2006; Kassar 2005). These studies have helped inform man-agement actions targeted at reducing road-kills (Clevenger et al. 2001; Grilo et al.2009). At least five general factors are thought to affect the spatial pattern ofroad-kills and train strikes (Seiler and Helldin 2006). Along railroads, these include:animal (e.g., wildlife abundance and behavior); train (e.g., train speed and fre-quency); railroad design (e.g., curvature or alignment); and landscape (e.g., vege-tation type) variables (Huber et al. 1998; Bashore et al. 1985; Finder et al. 1999;Seiler and Helldin 2006). Driver behavior variables are largely removed from trainstrike analyses because trains generally cannot stop or swerve to avoid animals.
Landscape variables derived from land cover data have been found to be the bestpredictors of road-kill rates (Bashore et al. 1985; Finder et al. 1999; Roger and Ramp2009). We suggest that estimates of relative abundance be used to assess the spatialpattern of road-kills and train strikes. The importance of including wildlife abun-dance in the analysis of factors contributing to wildlife strikes was demonstrated formoose: strikes coincided with locations of high moose abundance in wintering areasand on migration routes (Gundersen et al. 1998; Ito et al. 2008). Train variables andrailroad design, as well as animal abundance, vary along the CPR and may also affectstrike rates. If train or railroad variables altered the probability of a strike, the rate of
136 B.P. Dorsey et al.

strikes would vary spatially along with differences in these variables, even if wildlifeabundance were constant. There are at least three theoretical mechanisms that couldalter the spatial probability of strike occurrence. These mechanisms, based onwildlife behavior are: (1) constrained flight paths—some design features, such asbridges, may restrict wildlife movements on the rail bed surface instead of out of thepath of oncoming trains; (2) reduced detectability—some design features mayimpede the sight and/or sound of oncoming trains, so that wildlife are less likely todetect trains resulting in increased strike rates; and (3) reduced reaction time—highertrain speeds may reduce the time available to wildlife to successfully cross or fleebefore being struck. These mechanisms likely interact. For example, with increasingtrain speeds both the time to detect and flee may be reduced.
There is evidence that these mechanisms affect the rate of train strikes withungulates and bears along railroads. Previous studies have shown that bears werestruck at bridges and rock cuts (constrained flight paths) and in locations where thesound of oncoming trains was reduced (reduced detectability) (Van Why andChamberlain 2003; Kaczensky et al. 2003). Moose have been observed to not fleeoff the railroad tracks in Alaska, with the suggestion that deep snow alongside therailroad restricted their ability to flee down the track (Andersen et al. 1991;Modafferi 1991). Similarly for bears, engine-mounted video footage suggested thatsome bears were struck while fleeing from trains where track-side slopes or otherdesign variables appeared to obligate flight paths on the tracks instead of off and outof danger. Other associations are unclear, for example bighorn sheep (Oviscanadensis) strikes have been associated with rock cuts and may be a result offine-scale habitat selection or multiple design mechanisms acting concurrently (VanTighem 1981). As a result, it may be difficult to determine the exact mechanism(s)driving strike rates. However, identifying the animal, train or railroad variablesassociated with strikes and the direction of the effect (e.g., increased mortality at aparticular design feature) may be a more tractable approach and could indicate waysto reduce strikes along the CPR and railways more broadly.
The purpose of this research was to identify locations where species-specificmitigation solutions are needed, and to identify the variables associated with thoselocations along the CPR. Four ungulate species (elk, mule deer [Odocoileushemionus], white-tailed deer [O. virginianus] and two bear species (grizzly andblack bear) were used for this analysis). We tested whether strike rates were cor-related with the relative abundance and nine railway variables that could alter theflight path, detectability or reaction time of animals present.
Methods
Study Area
The study was conducted along a 134 km section of the CPR running from the westernboundary of Yoho National Park, British Columbia (116° 39′W, 51° 14′N) to the
9 Relative Risk and Variables Associated with Bear and Ungulate … 137
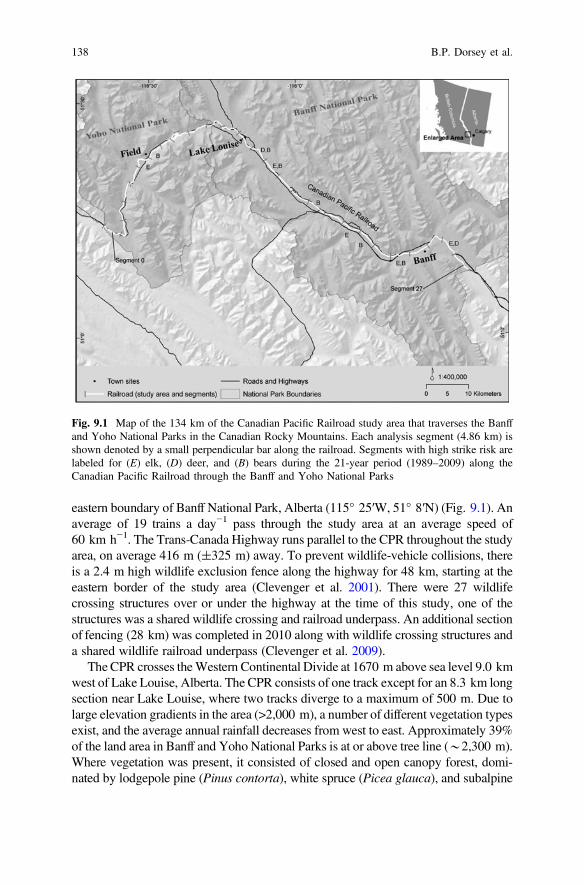
eastern boundary of Banff National Park, Alberta (115° 25′W, 51° 8′N) (Fig. 9.1). Anaverage of 19 trains a day−1 pass through the study area at an average speed of60 km h−1. The Trans-Canada Highway runs parallel to the CPR throughout the studyarea, on average 416 m (±325 m) away. To prevent wildlife-vehicle collisions, thereis a 2.4 m high wildlife exclusion fence along the highway for 48 km, starting at theeastern border of the study area (Clevenger et al. 2001). There were 27 wildlifecrossing structures over or under the highway at the time of this study, one of thestructures was a shared wildlife crossing and railroad underpass. An additional sectionof fencing (28 km) was completed in 2010 along with wildlife crossing structures anda shared wildlife railroad underpass (Clevenger et al. 2009).
The CPR crosses theWestern Continental Divide at 1670 m above sea level 9.0 kmwest of Lake Louise, Alberta. The CPR consists of one track except for an 8.3 km longsection near Lake Louise, where two tracks diverge to a maximum of 500 m. Due tolarge elevation gradients in the area (>2,000 m), a number of different vegetation typesexist, and the average annual rainfall decreases from west to east. Approximately 39%of the land area in Banff and Yoho National Parks is at or above tree line (*2,300 m).Where vegetation was present, it consisted of closed and open canopy forest, domi-nated by lodgepole pine (Pinus contorta), white spruce (Picea glauca), and subalpine
Fig. 9.1 Map of the 134 km of the Canadian Pacific Railroad study area that traverses the Banffand Yoho National Parks in the Canadian Rocky Mountains. Each analysis segment (4.86 km) isshown denoted by a small perpendicular bar along the railroad. Segments with high strike risk arelabeled for (E) elk, (D) deer, and (B) bears during the 21-year period (1989–2009) along theCanadian Pacific Railroad through the Banff and Yoho National Parks
138 B.P. Dorsey et al.

fir (Abies lasiocarpa) (Holland and Coen 1983). Vegetation within the CPRright-of-way (ROW) was kept in an early successional stage by mechanical treatmentsand consisted primarily of herbaceous vegetation (grasses, sedges and rushes), dan-delions (Taraxacum spp.), bearberry (Arctostaphylos uva-ursi) and horsetail(Equisetum spp.). Numerous species of shrub including buffaloberry (Sheperdiacanadensis) and tree species including lodgepole pine and white fir were present atreduced heights (<2 m). Vegetation between the rails was almost non-existent due toherbicide treatments and the rocky substrate. Where there was vegetation between therails there was small herbaceous growth of native and non-native grasses or youngsprouts of train-spilled agricultural products (cereal grains).
Data Collected
Wildlife Strike Records
Counts of train-struck ungulates and bears were obtained from Parks Canada for a21-year period (1989–2009) (Parks Canada, unpublished data, 2010). These recordsincluded all strikes reported by CPR and Parks Canada personnel. Strikes werevisited and removed only by Parks Canada personnel to avoid double counting.Records after 2001 were spatially referenced with a Garmin® global positioningsystem (GPS), but before 2001, records were referenced to permanent mile-markerposts or to geographic features along the CPR. As a result some strike records werespatially inaccurate by as much as 1.6 km (1.0 mile); thus, an error of plus or minus1.6 km was assumed for all records. A spatial data layer representing the railroadwas acquired from CPR and then imported into a geographic information system(GIS). The spatial layer was separated into 30 roughly equal segments 4.86 km(3 miles) in long. The segment length was based on a conservative estimate of theminimum mapping accuracy of the wildlife strike records, which were tallied to theappropriate 4.86 km (3 mile) segment in a GIS.
Relative Abundance Data
Relative abundance data were collected by sampling transects oriented parallel andperpendicular to the CPR (hereinafter called “rail bed transects” and “perpendiculartransects,” respectively). Both methods were binned to 4.86 km long rail segments,ensuring that data were analyzed at the same spatial scale. Sampling was carriedduring the summers of 2008–2009 by the same observer. A total of 313 km of railbed transects and 129 perpendicular transects were surveyed in 2008 and 2009.
The relative abundance of bears was sampled using both methods. However,ungulates were sampled only using perpendicular transects that allowed for anaccurate representation of ungulate distribution throughout the year.
Parallel transects were centered directly on the rail bed. Segments were treated asa strip transect 3 m wide and 4.86 km long. Locations of bear scats were recorded
9 Relative Risk and Variables Associated with Bear and Ungulate … 139

using a GPS unit (Trimble Navigation Ltd., Sunnyvale, USA). Black and grizzlybear scats were classified as “bear” because they could not be differentiated in thefield. When the diameter, age and contents were visibly similar for scats foundwithin 5 m, only one scat was recorded. All scats detected were removed from theCPR to avoid double counting. Where multiple tracks were encountered, e.g.,sidings, all tracks were surveyed and the mean number of scats detected per trackwas used in the analysis.
Perpendicular transects were used to estimate relative abundance for bears andungulates within the railroad corridor (<250 m). Two random points were generatedwithin each rail segment in a GIS for each sampling year. Each point was used asthe starting location for a perpendicular transect. At each point, a transect extendedout perpendicularly away from the CPR in both directions for 250 m; the transectswere 3 m wide. Pellet groups and scat found more than 1.5 m from the transectcenter were not recorded. Perpendicular transects were truncated at the edge ofimpassable features such as rock cliffs, rivers and open water. Along each transectungulate pellet groups were classified into those of elk or deer based on differencesin size and shaped as described by Elbroch (2003). White-tailed deer and mule deerpellets were combined into one class of “deer” because they could not be reliablydifferentiated in the field. The number of pellet groups was counted for eachtransect. Bear scats were recorded using the same criteria as the rail bed transects.Pellets and scat that appeared to be more than a year old-based on visible signs ofdecay (bleached color or unconsolidated) were excluded as were amorphousungulate or bear feces (Elbroch 2003).
The count of bear scats were weighted based on the date they were detected, asthey are detectable throughout the short summer season (Dorsey 2011). The firstday that bears have been historically sighted in the study area is April 15; althoughthe date of bears’ emergence varies each year, it was used as a starting date forwhen bears could have been foraging on grain and left scats. As each day passedafter April 15, there were cumulatively more days when bears could have visitedand left scats. Therefore, each scat was given a weight inversely proportional to theday of year it was detected after April 15, which is the 105th Julian calendar day ofthe year. For example, the weighted value of one scat detected on September 13th,(day 273 of the year) would be ((273–105)−1 = 0.006). The final value was the sumof all weighted scats detected for each track segment stored as RArail bed.
The relative abundance for each species was defined as the number of pelletgroups or weighted value km−1 within each 4.86 km long segment (i) (Eq. 1). Forexample, the relative abundance of elk, RArail corridor (i) was the number of elk pelletgroups km−1 averaged over n transects (t) within each rail segment (i).
RArail corridor ið Þ ¼P pellet groupst
transect lengtht
� �� 1000
Pnt¼1 t
ð1Þ
140 B.P. Dorsey et al.

Railroad Design and Train Spill Grain Data
Three additional variables were measured at the starting location of each perpendic-ular transect. The mean right-of-way width (ROWmean) was measured using aBushnell® Yardage Pro® 1,000 range finder (Bushnell Corporation, Denver, CO),which extended to the forest edge or open water. A maximum distance of 500 m wasimposed in locations where open habitat and level ground resulted in an unidentifiableROW corridor. Topography adjacent to the railroad was classified into three cate-gories similar to those used to assess wildlife-vehicle collisions on the parallelTrans-Canada Highway (Clevenger et al. 2003; Gunson et al. 2006)(VERGESLOPE): (0) flat; (1) raised and partly raised; and (2) buried, buried-raised,and partly buried. Train-spilled grain was also measured at each transect startinglocation on the rail bed. Grain density was estimated visually by counting the wheatand barley seeds inside a frame (10 cm2) placed randomly on the rail bed three timeswithin a 5 m segment of track (Fig. 9.2). The sampling process was repeated for eachtrack where sidings were present. Grain density was calculated as the average of allsubsamples within a rail segment (GRAINmean); the density was affected by the date itwas measured because grain spill decreased over the course of a summer (Dorsey
Fig. 9.2 Grain spill sampling method used on the rail bed. The sampling frame (10 � 10 cm2),was randomly thrown three times to estimate the mean density of wheat and barley seeds within a5 m zone
9 Relative Risk and Variables Associated with Bear and Ungulate … 141

2011). Therefore, grain densitywasweighted by theweek of year it wasmeasured. Forboth years, theweighted valuewas calculated as themean seed countmultiplied by theaverage rate of decrease (3%) for each additional week after April 15th (data notshown). For example, a weighted seed count of 80 wheat and barley seeds measuredon June 20th (4 weeks after April 15th) was [80 � (0.97 � 4) = 310.4]. The graindensity data were binned to the appropriate 4.86 km long segment in a GIS.
The GIS layer representing the railroad contained additional information on trainspeed limits, bridges, sidings and track grades. The highest posted train speed limit(SPEEDmax) and mean track grade (GRADEmean) were calculated for each segment.The variable SINUOSITY was calculated using the “sinuosity” function in Hawth’sanalysis tools extension for ArcGIS 9 (ESRI Redlands, CA 2004). The number ofbridges were counted and summed for the variable, hereinafter termed “BRIDGEc”.A count of vehicle overpasses, tunnels, snow sheds or rock cuts occurring along eachsegmentwere each given a value of “1” and summed for the variable hereinafter called“BARRIERc”. The lengths of track inside two tunnels and one secondary trackwest ofLake Louisewere omitted from analyses; in all, 28 segments were used in the analysis.
Data Analysis
Analyses were conducted independently for elk, deer and bears. Strikes that occurredover the 21-year period were compared to relative abundance estimated using datacovering a 2-year period (2008 and 2009). This comparison assumes that relativeabundance across the study area remained relatively stable during the precedingyears. To assess this assumption, we looked for changes in the distribution of strikesover time. A better approach would be to assess changes in relative abundance overtime, but these data were not available for enough of the study area or species.Changes in the distribution of strikes over time were assessed by conductingANOVA on year and rail segments. More variability in year than rail segment maymean that substantial shifts occurred in the relative abundance, therby invalidatingfurther analysis. Next, to determine if strikes and/or wildlife abundance were evenlydistributed along the CPR, chi-squared tests were used. To identify hotspots theupper 95% confidence interval of strikes per segment was used, which assumed thatthe counts followed a Poisson distribution (Bivand et al. 2008; Malo et al. 2004).
Risk estimates for each rail segment were developed through three steps. First,the RArail corridor or RArail bed estimates for each segment (i) were converted to apercentage of the total from all rail segments. Next, the expected number of strikesfor each rail segment (Expected(i)) was calculated by multiplying the percent oftotal scat on that segment by the overall mortality rate for that species (Eq. 2).
Expectedi ¼P
STRIKESiPRArail corridori
� RArail corridori ð2Þ
142 B.P. Dorsey et al.

Risk was estimated by assessing the ratio of the number of strikes to theexpected number of strikes for each segment (Eq. 3). Both values were assumed toequal at least 1.0 for all rail segments because all species are included in the studyarea. In cases where no strikes or no pellets were detected the risk estimate was setto 1.0 without confidence intervals. Otherwise the risk estimate would have equaledzero or infinity in these cases.
Riski ¼ StrikesiExpectedi
ð3Þ
The risk estimate, evaluates relative risk between segments. It has been widelyused in spatial epidemiology studies and is referred to as a standardized mortalityratio where the ratio is expected to equal 1.0 because internal standardization wasused (Mantel and Haenszel 2004; Banerjee et al. 2004; Bivand et al. 2008). In thesedata, the average risk (risk = 1.0) meant that the number of strikes was proportionalto the relative abundance for that species. When the estimated ratio was above 1.0 itindicated relatively high risk (more strikes occurred than expected). Internal stan-dardization reduced the number of degrees of freedom to n − 1 which was used inchi-squared tests (Kim and Wakefield 2010).
To test for non-constant risk, the number of strikes observed was compared tothe number expected using v2 tests (Bivand et al. 2008) and the relationshipbetween observed and expected was evaluated with generalized linear modelsassuming a Poisson count distribution and a log link function. To determine whichsections had an unusually high risk, a bootstrap function was used to resample thewildlife abundance estimates from scat counts for each rail segment. A new relativerisk estimate was computed for each of 1,000 resampled abundance estimates; thenconfidence intervals were assessed from the distribution of the 1,000 estimates.High-risk segments were defined as those where 95% of bootstrapped estimates ofrisk were above 1.0. All analyses were performed in R (R Development Core Team2009).
A set of variables hypothesized to affect train strikes were tested using gener-alized linear mixed models with a log link function (Table 9.1). Models wereevaluated for each species by fitting the count of strikes per segment (summed overthe 21-year period) to 10 predictors, including the appropriate wildlife abundanceestimate (which included two for bears, due to evaluation at the rail bed andlandscape scales). Initial fits used restricted maximum likelihood estimation andlikelihood ratio tests to assess whether a negative binomial distribution was needed(Zuur et al. 2009). Each model was subjected to a “drop one approach,” where theleast significant parameter was dropped until all remaining parameters were sig-nificant. If models were reduced to a single predictor, the model with the minimalresidual deviance was selected as the final model. Final models were refit withmaximum likelihood and inspected using standard diagnostic plots.Semivariograms and residuals from the final model were plotted to assess theremaining spatial trends. Prior to performing the analysis, co-variates were testedfor collinearity (Menard 1995). When correlated variables (r > 0.6) were found, the
9 Relative Risk and Variables Associated with Bear and Ungulate … 143

one with a higher correlation to the response remained in the analysis (Guisan andZimmermann 2000). Based on this cut-off, track grade was significantly correlatedwith train speed and was removed from the analysis.
Results
Strike Rates
Over the 21-year period (1989–2009), 862 strikes were recorded along 134 km ofthe CPR, consisting of 579 elk, 185 deer, 69 black bears, 9 grizzly bears, and 1unidentified bear species. The bear data were combined into one class for furtheranalysis. The spatial distribution of strikes per rail segment were non-uniform forelk v2(1, 27) = 834.4, p < 0.001, deer v2(1, 27) = 252.5, p < 0.001, and bearsv2(1, 27) = 37.1, p = 0.03 (Fig. 9.3).
The strike rates also varied temporally for elk, deer, and bears (Fig. 9.4).A decreasing trend was detected for elk strikes [belk = −1.04, t(19) = −2.29,p = 0.03], and conversely an increasing trend for deer [bdeer = 1.13, t(19) = 8.18,
Table 9.1 Description of field-collected and GIS-derived spatially varying train and railroaddesign variables and the hypothesized correlation to strike rates
Variable Description Hypothesis Source
Continuous variables
RArail corridor Mean number of weighted pellets or scatsstandardized by distance searched alongperpendicular strip transects
+ Field
RArail bed Total of weighted bear scats detected on theCPR track bed
+ Field
GRAINmean Mean number of train-spilled grains + Field
GRADEmean Mean percent grade of the railroad bed + GIS
ROWmean Mean right-of-way width − GIS
SINUOSITY Ratio of rail segment length to the distancebetween the start and end locations
+ GIS
SPEEDmax Maximum speed limit in miles per hour + GIS
Categorical variables
BARRIERc Count of overpass, snow shed, rock cut, ortunnel
+ Field
BRIDGEc Count of bridges + Field
SIDING Presence/absence + Field
VERGESLOPEa Railroad verge slope classesa + Field
(+) indicates a positive correlation and (−) indicates a negative correlation hypothesized for bothungulates and bears. Those in bold provided significant general linear mixed-effects modelrelationships see Table 9.3a(0) flat (1) at least one down slope (2) at least one up slope or water
144 B.P. Dorsey et al.

Fig. 9.3 The number of train strikes (white bars) for a elk; b deer; and c bear, compared to theexpected number of strikes (gray bars, a positive value) based on the abundance of wildlife signsalong each 4.86 km segment using perpendicular transects; d compares on-track relativeabundance for bears to number of strikes. Hotspots are segments with a strike count above the 95%confidence interval (gray dashed line) and high-risk segments are those with a risk estimatesignificantly above 1.0 (black points and error bars). Gray points are risk estimates notsignificantly different from 1.0 (the number killed was close to the number expected based onwildlife abundance). Segments proceed west to east, where 0 is the first 4.86 km inside the westernboundary of Yoho National Park. The field town site is located at segment 6, the Lake Louise townsite corresponds to segment 13, and the Banff town site segment 24
9 Relative Risk and Variables Associated with Bear and Ungulate … 145

p < 0.001] and bears [bbear = 1.12, t(19) = 4.58, p < 0.001] over the 21-year per-iod. Although annual mortality rates fluctuated for all three species, the spatialdistribution of strikes accounted for more of the variability in strikes for both elkand bear, but not for deer (Table 9.2).
Relative Abundance
A total of 341 bear scats were detected on the CPR, resulting in a detection rate of0.46 km−1 year−1. On perpendicular transects, 599 elk pellet groups (5.98 km−1
year−1), 212 deer pellet groups (2.23 km−1 year−1), and 39 bear scats(0.33 km−1 year−1) were detected. Relative abundance varied for elk[v2(27) = 940.12, p < 0.001] and deer [v2(27) = 294.2, p < 0.001]. Bear scats wereunevenly distributed both on the rail bed [v2(27) = 263.3, p < 0.001] and on per-pendicular transects [v2(27) = 125.4, p < 0.001] (Fig. 9.3c, d). The rail bed tran-sects likely better represented relative risk for bears, because few bear scats weredetected along the perpendicular transects (n = 39) relative to the 341 scats detecteddirectly on the rail bed (Fig. 9.3d). Therefore, further analyses for bears were basedon rail bed scats.
Hotspots and Relative Risk
Six elk hotspots were identified (21% of the CPR segments), which were segmentswith 29 or more strikes (Fig. 9.3a). Likewise, five deer hotspots (17% of the CPRsegments) were identified, which averaged 6.54 ± 1.73 per segment (Fig. 9.3b).Bears were struck on average 2.86 ± 0.44 per segment, but no segment wasidentified as a hotspot because no single segment incurred more than seven strikes.
After estimating the ratio of strikes to wildlife abundance for each segment,overall non-constant risk was apparent for elk (v2 = 286.1, df = 27; p < 0.0001),deer (v2 = 182.0, df = 27; p < 0.0001), and bears (v2 = 7.4 � 106, df = 27;p < 0.0001). High-risk segments were identified for each species (Figs. 9.1 and9.3). Five, two and six high-risk segments were determined for elk, deer and bears,respectively, and hotspots and high-risk segments differed in number and location(Fig. 9.3).
146 B.P. Dorsey et al.

Fig. 9.4 Annual train strikes for a elk, b deer and c bears along 134 km of the Canadian PacificRailroad through the Banff and Yoho National Parks, 1989–2009
9 Relative Risk and Variables Associated with Bear and Ungulate … 147

Variables Associated with Strikes
The variability in train strikes to relative abundance and nine train or railroad designvariables (Table 9.1) indicated a negative binomial distribution for all speciesmodels. Initial models did not indicate that autocorrelation was present between railsegments and the most parsimonious models are reported (Table 9.3).
Table 9.2 Variation between years and railroad segments for (a) elk, (b) deer, and (c) bears alongthe Canadian Pacific Railroad within the Banff and Yoho National Parks, 1989–2009
Factor df Sum Sq. Mean Sq. F p
(a) ElkYear 20 311.31 15.57 2.4 <0.001
Railroad segment 26 760.81 29.26 4.6 <0.001
Residuals 234 1489.85 6.37
(b) DeerYear 20 74.19 3.71 3.7 <0.001
Railroad segment 26 67.65 2.60 2.6 <0.001
Residuals 234 233.37 1.00
(c) BearYear 20 17.19 0.86 3.2 <0.001
Railroad segment 26 22.34 0.86 3.2 <0.001
Residuals 234 63.27 0.27
Table 9.3 Significant (p < 0.05) parameter estimates explaining train strike rates with elk, deer,and bears
Elk Deer Bears
b SE p b SE p b SE p
Explanatory variables
Y-intercept −1.063 0.782 <0.001 −1.917 0.751 <0.001 0.825 0.153 <0.001
RArail
corridor
0.024 0.007 <0.001 0.069 0.014 <0.001
ROWmean 0.009 0.003 0.005
SPEEDmax 0.080 0.020 <0.001 0.055 0.017
Categorical variables
BARRIERc 0.458 0.170 0.007
Dispersion(h)
1.5 3.8 20.0
Devianceexplained(%)
41.7 28.3 82.042
Model-fit statistics are provided from maximum likelihood fits
148 B.P. Dorsey et al.

Elk
Train speed and relative abundance explained the variability in elk strikes (Loglikelihood = −113.0 with 2 df, v2 = 26.3, p < 0.001). Elk strikes increased onaverage e0.07 = 1.07 per segment, with each 1.0 mph increase in maximum postedtrain speed when elk relative abundance was held constant (Table 9.3). Likewisewhen the SPEEDmax was held constant strikes increased e0.03 = 1.03 for each oneunit increase in elk RArail corridor. The variable SPEEDmax averaged 37.5 ± 1.85mph (60.3 kmph) and ranged from 20 to 50 mph.
Deer
The variables deer relative abundance (RArail corridor), SPEEDmax and ROWmean
best explained the variability in deer strikes using the model selection process (Loglikelihood = −78.46 with 5 df, v2 = 48.89, p < 0.001). The parameter coefficientsfrom a maximum likelihood fit indicated that e0.06 = 1.06 additional deer strikeswere observed on average with an 1.0 mph increase in the posted train speed limitwhen deer abundance and ROW width were held constant. Likewise, e0.009 = 1.009additional deer strikes were observed for each 1.0 m increase in ROW width whenspeed and deer abundance were held constant. The variable ROWmean was onaverage 79.78 ± 7.68 m across all segments.
Bears
A single predictor model, including the variable BARRIERc, best explained bearstrikes (Log likelihood = −57.233 on 4 df, v2 = 14.686, p < 0.001). The parameterestimated for BARRIERc (bbarrier = e0.458 = 1.58) revealed that for each additionalbarrier feature per segment bear strikes increased on average 1.58 (95% CI 1.13 to2.20) (Table 9.3). A second single predictor model has almost equal explanatorypower. This model included the variable BRIDGEc. However, BRIDGEc andBARRIERc were not correlated (r = 0.23, t = 1.1968, df = 26, p = 0.24). Thevariable BRIDGEc was positively correlated to bear strikes (r = 0.44, p < 0.02).
For bears, neither estimate of relative abundance was significant; therefore, thefinal model did not include either variable describing bears relative abundance. Thischanges the modeling results from assessing risk to incidence rate. For this reason,the model selection procedure was repeated with the variable RArail bed log trans-formed and held in the model as an offset to assess relative risk (Zuur et al. 2009).This model selection procedure resulted in a single predictor model that includedSPEEDmax, indicating that as posted train speed increased, so did the “risk” of bearstrikes (b = e0.053 = 1.054). However, train speed explained only 17% of thedeviance, compared to 82% explained by the BARRIERc model (Table 9.3).
9 Relative Risk and Variables Associated with Bear and Ungulate … 149

Discussion
This study is the first attempt to account for unevenly distributed wildlife popula-tions when assessing strikes along a railroad; its information was used to helpunderstand the spatial pattern of train strikes along the CPR. Hotspots were segmentsof the CPR that had strike rates significantly higher than the overall mean, and wereidentified for elk and deer, but not bears. Hotspots were generally associated withhigher relative abundance for elk and deer at the analysis scale (3 miles). Althoughthere was disagreement between bears’ relative abundance and strike rates at thisscale (Fig. 9.3c, d), general correlation was apparent at a larger scale. For example,bear strikes and relative abundance were relatively higher in the western half of thestudy area (Fig. 9.3d segments 0–3), compared to the eastern half (Fig. 9.3d seg-ments 14–27). High-risk segments had significantly higher kill rates than expected,based on estimates of relative wildlife abundance, and they indicated potentialproblem areas that may have been overlooked using strike data alone.
There was a significant relationship for elk, deer and bears with at least one trainor railroad design variable. These relationships indicated higher abundance andtrain speeds (elk and deer), and larger right-of-way widths (deer) were associatedwith increased strike rates. For bears, the number of barriers and presence of bridgeswas also positively correlated with strike rates. These results supported thehypothesis that there are at least three general variables that affect the spatial patternof train strikes: 1) the relative abundance of wildlife either on the rail bed or on theadjacent landscape; 2) train speed; and 3) railroad designs such as highway over-passes, rock-cuts, tunnels, snow sheds and bridges. Other railroad studies haveshown similar associations with bears. In Slovenia, Eurasian brown bears(U. arctos) were struck at rock cuts and on bridges (Kaczensky et al. 2003). At leastone road study has noted the effect of bridges on strikes with bears (Van Why andChamberlain 2003). Huber et al. (1998) studied locations where brown bears werestruck by trains in Croatia, and used variables similar to those of this study. Theyfound no difference in verge slope or longitudinal or perpendicular visibility but diddetect a difference in the presence of bear foods at strike locations compared torandom locations. They noted a slight difference in the distance at which trains werefirst audible at strike locations (Huber et al. 1998). Data on train noise was notcollected in this study, but field observations suggested that train volume varieddepending on train direction within the study area, and the direction in which thetrains were moving when each animal was struck was not recorded.
There are at least four possible explanations for the lack of correlation betweenbear strikes and relative abundance found in this study. The first is based on thestrength of non-constant risk phenomena, and three others deal with limitations ofthe methods and analysis. First, railroad design or other variables may have stronglyaffected strike probabilities. If these variables had strong causal or probabilisticeffects, the spatial pattern of strikes would be a function of the spatial pattern ofthese variables and not the bears’ relative abundance. However, it is unclearwhether this is the case because the sample size is relatively low (n = 80) and no
150 B.P. Dorsey et al.
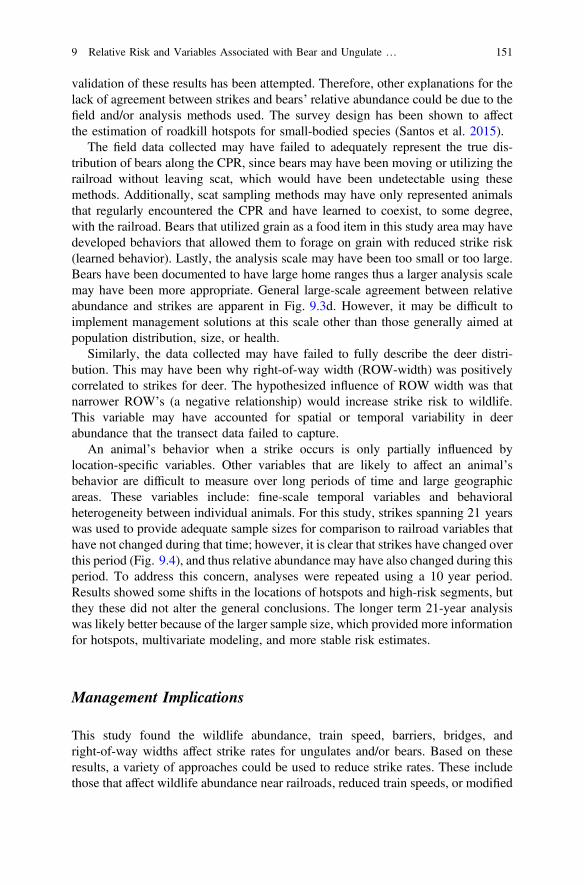
validation of these results has been attempted. Therefore, other explanations for thelack of agreement between strikes and bears’ relative abundance could be due to thefield and/or analysis methods used. The survey design has been shown to affectthe estimation of roadkill hotspots for small-bodied species (Santos et al. 2015).
The field data collected may have failed to adequately represent the true dis-tribution of bears along the CPR, since bears may have been moving or utilizing therailroad without leaving scat, which would have been undetectable using thesemethods. Additionally, scat sampling methods may have only represented animalsthat regularly encountered the CPR and have learned to coexist, to some degree,with the railroad. Bears that utilized grain as a food item in this study area may havedeveloped behaviors that allowed them to forage on grain with reduced strike risk(learned behavior). Lastly, the analysis scale may have been too small or too large.Bears have been documented to have large home ranges thus a larger analysis scalemay have been more appropriate. General large-scale agreement between relativeabundance and strikes are apparent in Fig. 9.3d. However, it may be difficult toimplement management solutions at this scale other than those generally aimed atpopulation distribution, size, or health.
Similarly, the data collected may have failed to fully describe the deer distri-bution. This may have been why right-of-way width (ROW-width) was positivelycorrelated to strikes for deer. The hypothesized influence of ROW width was thatnarrower ROW’s (a negative relationship) would increase strike risk to wildlife.This variable may have accounted for spatial or temporal variability in deerabundance that the transect data failed to capture.
An animal’s behavior when a strike occurs is only partially influenced bylocation-specific variables. Other variables that are likely to affect an animal’sbehavior are difficult to measure over long periods of time and large geographicareas. These variables include: fine-scale temporal variables and behavioralheterogeneity between individual animals. For this study, strikes spanning 21 yearswas used to provide adequate sample sizes for comparison to railroad variables thathave not changed during that time; however, it is clear that strikes have changed overthis period (Fig. 9.4), and thus relative abundance may have also changed during thisperiod. To address this concern, analyses were repeated using a 10 year period.Results showed some shifts in the locations of hotspots and high-risk segments, butthey these did not alter the general conclusions. The longer term 21-year analysiswas likely better because of the larger sample size, which provided more informationfor hotspots, multivariate modeling, and more stable risk estimates.
Management Implications
This study found the wildlife abundance, train speed, barriers, bridges, andright-of-way widths affect strike rates for ungulates and/or bears. Based on theseresults, a variety of approaches could be used to reduce strike rates. These includethose that affect wildlife abundance near railroads, reduced train speeds, or modified
9 Relative Risk and Variables Associated with Bear and Ungulate … 151
railway designs. Much of the CPR is co-aligned with a productive montane habitat,hence altering the abundance of deer or other species near the CPR may not befeasible. A two- step approach may be needed that both reduces forage quality andavailability along the CPR and increases habitat quality away from it.
Two studies have documented a decrease in strike rates for moose (Jaren et al.1991; Andreassen et al. 2005). One developed ungulate habitat away from a rail-road (Jaren et al. 1991), and the other both modified habitat and provided sup-plemental forage away from the railroad (Andreassen et al. 2005). The feasibility ofsuch an approach will be site-specific, but is likely to be beneficial to large mammalpopulations.
Train speed was also clearly important. Reduced train speeds may be an effectivemeasure to reduce strike risk, particularly in problemareas.Train speed is a spatially andtemporally explicit management solution, and likely interacts with the other mecha-nisms described above; thus, it could be implemented where or when strikes are mostlikely to occur.However, reduced speedsmay be ineffective if othermechanisms are theprimary driver in strike occurrences. For example, a study inAlaska observed a possiblemechanism (constrained flight paths) resulting in strikes with moose (Becker andGrauvogel 1991). The study then evaluated reduced train speeds (reaction timemechanism) on reducing moose strike rates. The authors found reduced train speeds tobe ineffective in this case but suggested that at some levels of speed reduction, theapproach may have been effective; since these speeds are surely economicallycost-prohibitive (Becker andGrauvogel 1991), and so variables (such as snow removal)enabling moose to move off the railroad, vegetative or other terrain modificationsshould be evaluated. Although moose were not analyzed in this study, speed waspositively associated with increasing strike risks for elk and deer along the CPR. Speedreduction in hotspots and high-risk areas should be empirically evaluated in the future.
For bears, it may be most important to evaluate design modifications or miti-gation solutions targeted at barriers including: highway vehicle overpasses, tunnels,snow sheds, rock cuts and bridges. However, multiple approaches are likely war-ranted in high-risk segments, including those that decrease the probability the bearswill be exposed to strikes, increase the detectability of trains, increase the oppor-tunities for safe flight paths off-track, and increase the time bears have to suc-cessfully avoid trains.
Acknowledgements B. Dorsey received support from the Western Transportation Institute(WTI) at Montana State University and Parks Canada to complete this project, as part of hisMaster’s degree.
References
Andersen, R., Wiseth, B., Pedersen, P. H., & Jaren, V. (1991). Moose-train collisions: Effects ofenvironmental conditions. Alces, 27, 79–84.
Andreassen, H. P., Gundersen, H., & Storaas, T. (2005). The effect of scent-marking, forestclearing, and supplemental feeding on moose-train collisions. Journal of Wildlife Management,69, 1125–1132.
152 B.P. Dorsey et al.

Banerjee, S., Carlin, B. P., & Gelfand, A. E. (2004). Hierarchical modeling and analysis forspatial data. London: Chapman & Hall.
Bashore, T. L., Tzilkowski, W. M., & Bellis, E. D. (1985). Analysis of deer-vehicle collision sitesin Pennsylvania. The Journal of Wildlife Management, 49, 769–774.
Becker, E. F., & Grauvogel, C. A. (1991). Relationship of reduced train speed on moose-traincollisions in Alaska. Alces, 27, 161–168.
Bertch, B., & Gibeau, M. (2010a). Grizzly bear monitoring in and around the Mountain NationalParks: Mortalities and bear/human encounters 1980–2009. Parks Canada report.
Bertch, B., & Gibeau, M. (2010b). Black bear mortalities in the Mountain National Parks:1990–2009. National Parks. Parks Canada report.
Bivand, R., Pebesma, E., & Gómez-Rubio, V. (2008). Applied spatial data analysis with R.New York: Springer.
Chaney, R. (2011, April 28). Antelope roam west to Clinton. Missoulian.Child, K. (1983). Railways and moose in the central interior of BC: A recurrent management
problem. Alces, 19, 118–135.Child, K. (1991). Moose mortality on highways and railways in British Columbia. Alces, 27,
41–49.Clevenger, A., Chruszcz, B., & Gunson, K. (2001). Highway mitigation fencing reduces
wildlife-vehicle collisions. Wildlife Society Bulletin, 29, 646–653.Clevenger, A., Chruszcz, B., & Gunson, K. (2003). Spatial patterns and factors influencing small
vertebrate fauna road-kill aggregations. Biological Conservation, 109, 15–26.Clevenger, A. P., Ford, A. T., & Sawaya, M. A. (2009). Banff wildlife crossings project:
Integrating science and education in restoring population connectivity across transportationcorridors. Final report to Parks Canada Agency.
Davenport, J., & Davenport, J. L. (Eds.). (2006). The ecology of transportation: Managingmobility for the environment. In Environmental pollution. Dordrecht: Springer.
Dorsey, P. B. (2011). Factors affecting bear and ungulate mortalities along the Canadian PacificRailroad through Banff and Yoho National Parks. MS thesis, Montana State University.
Elbroch, M. (2003). Mammal tracks and signs: A guide to North American species.Mechanicsburg, PA: Stackpole Books.
Finder, R. A., Roseberry, J. L., & Woolf, A. (1999). Site and landscape conditions at white-taileddeer/vehicle collision locations in Illinois. Landscape and Urban Planning, 44, 77–85.
Forman, R. T. T., Sperling, D., Bissonette, J. A., Clevenger, A. P., Cutshall, C. D., Dale, V. H.,et al. (2003). Road ecology: Science and solutions. Washington, DC: Island Press.
Grilo, C., Bissonette, J. A., Santos-Reis, M. (2009). Spatial–temporal patterns in Mediterraneancarnivore road casualties: Consequences for mitigation. Biological Conservation, 142 (2009),301–313.
Guisan, A., & Zimmermann, N. (2000). Predictive habitat distribution models in ecology.Ecological Modelling, 135, 147–186.
Gundersen, H., Andreassen, H. P., & Storaas, T. (1998). Spatial and temporal correlates toNorwegian moose-train collisions. Alces, 34, 385–394.
Gunson, K., Chruszcz, B., & Clevenger, A. (2006). What features of the landscape and highwayinfluence ungulate vehicle collisions in the watersheds of the Central Canadian Rockymountains: A fine-scale perspective? In K. Mcdermott, C. L. Irwin, & P. Garrett (Eds.),Proceedings of the 2005 international conference on ecology and transportation(pp. 545–556).
Holland, W. D., & Coen, G. M. (1983). Ecological (Biophysical) Land classification of Banff andJasper National Parks (Vol. 1), Edmonton, AB.
Hubbard, M., & Danielson, B. (2000). Factors influencing the location of deer-vehicle accidents inIowa. The Journal of Wildlife Management, 64, 707–713.
Huber, D., Kusak, J., & Frkovic, A. (1998). Traffic kills of brown bears in Gorski Kotar, Croatia.Ursus, 10, 167–171.
9 Relative Risk and Variables Associated with Bear and Ungulate … 153

Ito, T. Y., Okada, A., Buuveibaatar, B., Lhagvasuren, B., Takatsuki, S., & Tsunekawa, A. (2008).One-sided barrier impact of an International Railroad on Mongolian Gazelles. Journal ofWildlife Management, 72 (4), 940–943.
Jaren, V., Andersen, R., Ulleberg, M., Pedersen, P., & Wiseth, B. (1991). Moose-train collisions:The effects of vegetation removal with a cost-benefit analysis. Alces, 27, 93–99.
Kaczensky, P., Knauer, F., Krze, B., Jonozovic, M., Adamic, M., & Gossow, H. (2003). Theimpact of high speed, high volume traffic axes on brown bears in Slovenia. BiologicalConservation, 111, 191–204.
Kassar, C. (2005). Wildlife—Vehicle collisions in Utah: An analysis of wildlife road mortality hotspots, economic impacts, and implications for mitigation and management. Thesis: Utah StateUniversity, Logan, Utah.
Kim, A., & Wakefield, J. (2010). R data and methods for spatial epidemiology: The SpatialEpiPackage.
Malo, J., Suárez, F., & Díez, A. (2004). Can we mitigate animal-vehicle accidents using predictivemodels. Journal of Applied Ecology, 41, 701–710.
Mantel, N., & Haenszel, W. (2004). Statistical aspects of the analysis of data from retrospectivestudies of disease. The Challenge of Epidemiology: Issues and Selected Readings, 1, 533–553.
Menard, S. W. (1995). Applied logistic regression analysis. Thousand Oaks, CA: Sage.Modafferi, R. (1991). Train moose-kill in Alaska: Characteristics and relationship with snowpack
depth and moose distribution in lower Susitna Valley. Alces, 27, 193–207.R Core Team. (2009). R: A language and environment for statistical computing. R Foundation for
Statistical Computing, Vienna, Austria. http://www.R-project.org/.Roger, E., & Ramp, D. (2009). Incorporating habitat use in models of fauna fatalities on roads.
Diversity and Distributions, 15, 222–231.Santos, S. M., Marques, J. T., Lourenço, A., Medinas, D., Barbosa, A. M., Beja, P., et al. (2015).
Sampling effects on the identification of roadkill hotspots: Implications for survey design.Journal of Environmental Management, 162, 87–95.
Seiler, A., & Helldin, J. O. (2006). Mortality in wildlife due to transportation. In J. Davenport &J. L. Davenport (Eds.), The ecology of transportation: Managing mobility for the environment(pp. 165–189). Berlin: Springer.
van der Grift, E. (1999). Mammals and railroads: Impacts and management implications. Lutra,42, 77–91.
Van Tighem, K. (1981). Mortality of bighorn sheep on a railroad and highway in Jasper NationalPark, Canada. Parks Canada report.
Van Why, K., & Chamberlain, M. (2003). Mortality of black bears, Ursus americanus, associatedwith elevated train trestles. Canadian Field Naturalist, 117, 113–114.
Waller, J., & Servheen, C. (2005). Effects of transportation infrastructure on grizzly bears innorthwestern Montana. Journal of Wildlife Management, 69, 985–1000.
Wells, P., Woods, J., Bridgewater, G., & Morrison, H. (1999). Wildlife mortalities on railways;monitoring methods and mitigation strategies. In G. Evink, P. Garrett, & D. Zeigler (Eds.),Proceedings of the third international conference on wildlife ecology and transportation(pp. 237–246), Tallahassee, FL.
Zuur, A., Ieno, E., Walker, N., Saveliev, A., & Smith, G. (2009). Mixed effects models andextensions in ecology with R. statistics. New York: Springer.
154 B.P. Dorsey et al.

Open Access This chapter is licensed under the terms of the Creative Commons Attribution 4.0International License (http://creativecommons.org/licenses/by/4.0/), which permits use, sharing,adaptation, distribution and reproduction in any medium or format, as long as you give appropriatecredit to the original author(s) and the source, provide a link to the Creative Commons license andindicate if changes were made.The images or other third party material in this chapter are included in the chapter’s Creative
Commons license, unless indicated otherwise in a credit line to the material. If material is notincluded in the chapter’s Creative Commons license and your intended use is not permitted bystatutory regulation or exceeds the permitted use, you will need to obtain permission directly fromthe copyright holder.
9 Relative Risk and Variables Associated with Bear and Ungulate … 155

Chapter 10Railways and Wildlife: A Case Studyof Train-Elephant Collisions in NorthernWest Bengal, India
Mukti Roy and Raman Sukumar
Abstract The extensive network of the Indian Railways cuts through severalforested landscapes, resulting in collisions of trains with a variety of wildlife spe-cies, including the largest land mammal–the elephant. In India, railway lines crosselephant habitats in several states, with accidents that resulted in more than 200elephant deaths between 1987 and 2015. As the 161-km Siliguri–Alipurduar trackin the northern West Bengal state witnesses train–elephant collisions frequently, wedeveloped a case study there with the objectives of mapping locations of collisionsand generating a susceptibility map showing locations prone to accidents. Wemapped elephant crossing points and movement paths along this railway track, aswell as accident locations. Between 1974 and 2015, collisions occurred throughoutthe line, although there were several hotspots where elephant deaths were con-centrated. A disproportionate number of accidents occurred during the night. Cropraiding in villages and train elephant accidents seem to be closely related, probablydue to an increased frequency of elephant movement near or across this railwaytrack during the cultivation season. Male elephants were much more prone toaccidents, possibly because of behavioural characteristics that make them crossrailway tracks more frequently. To reduce the frequency of accidents in this region,we recommend reducing the speed of trains, limiting the operation of trains duringat night, provisioning overpasses and underpasses, using communications tech-nology, realigning a portion of the track, and fencing the track except for corridorareas.
Keywords Train elephant accidents � Elephant deaths � Crop raiding � Accidentsusceptibility map � Northern West Bengal
M. Roy (&)Asian Nature Conservation Foundation, c/o Centre for Ecological Sciences,Indian Institute of Science, Bangalore 560012, Karnataka, Indiae-mail: [email protected]
R. SukumarCentre for Ecological Sciences, Indian Institute of Science,Bangalore 560012, Karnataka, Indiae-mail: [email protected]
© The Author(s) 2017L. Borda-de-Água et al. (eds.), Railway Ecology,DOI 10.1007/978-3-319-57496-7_10
157

Introduction
Many animals range widely across landscapes in the quest to meet their daily,seasonal and annual biological needs of food, water, shelter and mates (Caughleyand Sinclair 1994). Habitat connectivity within a landscape helps dispersal andre-colonization, thus maintaining regional metapopulations and minimizing risks ofinbreeding within populations (Newmark 1987; Wilcove et al. 1998). Historically,the spread of agriculture probably contributed the most to loss and fragmentation oftheir natural habitat. In an increasingly industrialized world, however, transportnetworks (railways, roads, and waterways) or so-called “linear infrastructures,”restrict the movement of wildlife populations by fragmenting their habitat,increasing edge effects, constricting ecological corridors, blocking animal move-ment, and increasing the risk of mortality due to direct collisions with motorizedvehicles (Forman and Deblinger 2000; Trombulak and Frissell 2000; Inell et al.2003; Van der Ree et al. 2011). These processes hinder the persistence of species inhuman-dominated landscapes because small and isolated populations are morevulnerable to extinction from stochastic demographic processes and loss of geneticvariation (Soule and Wilcox 1980).
Roads are perhaps the most widespread and pervasive form of “linear infras-tructure” that have greatly impacted wildlife populations in the more developedparts of the world through habitat loss, restriction of animal movements, alterationof animal behaviour, and directly injuring or killing very large numbers of animalsin collisions with vehicles (Trombulak and Frissell 2000; Seiler and Helldin 2015).A variety of animals are involved in road–kills, from large-bodied ones such asmoose to smaller creatures such as frogs (Fahrig et al. 1995; Formann et al. 2003;Dorans et al. 2012). One estimate of road–kills suggested that 1,000,000 vertebrateswere killed in the USA every day (Lalo 1987), while Conover et al. (1995) esti-mated that the number of deer–vehicle collisions in the USA exceeds 1,000,000annually, causing approximately 29,000 human injuries and 200 fatalities, apartfrom animal fatalities. Given the magnitude of animal road–kills and the occurrenceof human fatalities, there has been much attention paid to mitigating wildlife roadkills through the appropriate design of roadways in many developed countries(Clarke et al. 1998; Inell et al. 2003). In contrast, only limited attention has beenpaid to wildlife–train collisions, although this has also been happening on signifi-cant scales in many countries. For instance, 200 moose train collisions were esti-mated in the province of British Columbia, Canada, during 1988–1990 (Child et al.1991), with 266 collisions in a 92 km section of railways in Norway during 1980–1988 (Andersen et al. 1991), and between 9 and 725 collisions annually in Alaska(Modafferi 1991). Similarly, 69 roe deer train collisions in the Czech Republic werereported during 2009 (Kusta et al. 2014). Therefore, there is an urgent need formore information on train–wildlife collisions, and how these may be mitigated.
India is one of the countries with serious problems of train–wildlife collisions.This is because the Indian Railways (IR) is one of the world’s largest railwaynetworks, comprising 115,000 km of tracks over a route of about 65,000 km and
158 M. Roy and R. Sukumar

7500 stations (Indian Railways 2014). In 2015–2016, IR transported more than22,000,000 passengers and 3,000,000 tons of freight daily (Indian Railways 2015).Furthermore, the Indian Railway network cuts across various forested landscapes,and its impact on wildlife and their habitats has been a matter of increasing concern,although there are few studies on the subject. Direct as well as indirect impacts ofthe railways have exacerbated over the years with the expansion of the rail network,gauge conversion, and increases in frequency and speed of trains to meet the needsof a modernizing society and an increasing population. A number of larger mam-malian species including gaur (Bos gaurus), rhinoceros (Rhinoceros unicornis),sambar deer (Rusa unicolor), nilgai (Boselaphus tragocamelus), sloth bear(Melursus ursinus), leopard (Panthera pardus), lion (Pathera leo) and tiger(Panthera tigris) have been killed in collision with trains (MOEF 2010; Raman2011; Dasgupta and Ghosh 2015).
Ironically, the mascot of the Indian Railways, the Asian elephant (Elephasmaximus), has itself been a frequent victim of train collisions (Singh et al. 2001;Sarma et al. 2006; Roy et al. 2009), which is a cause of conservation and safetyconcerns. Railway tracks pass through elephant habitat in several Indian states,including Assam, West Bengal, Uttarakhand, Jharkhand, Odisha, Kerala and TamilNadu, with accidents resulting in more than 200 elephant deaths between 1987 and2015. Train–elephant collisions have been common along railway lines such asthe Siliguri–Alipurduar line in northern West Bengal (Roy et al. 2009), Guwahati–Lumding line in Assam and Meghalaya (Sarma et al. 2006), Haridwar–Dehradunline in Uttarakhand (Singh et al. 2001), and Coimbatore–Thrissur line in TamilNadu and Kerala (Jha et al. 2014). Railway–elephant collisions have also occurredalong the Delhi–Howrah line within Jharkhand state (see news report, The Times ofIndia, 02.08.2013), and the Kharagpur–Adra railway line in southern West Bengal(West Bengal Forest Department 2013). To give an idea of the numbers of acci-dents involving elephants along these tracks, 18 elephant deaths were recorded atRajaji National Park, Uttarkhand, between 1987 and 2001 (Singh et al. 2001),35 deaths in Assam from 1987 to 2006 (Sarma et al.2006), 16 in Odisha (Palai et al.2013) and 13 elephant deaths in Tamil Nadu between 2002 and 2013 (Jha et al.2014). However, the Siliguri Alipurduar track in northern West Bengal has wit-nessed the highest numbers of elephant deaths in train collisions; while 27 deathswere recorded between 1974 and 2002, the figure rose to 65 between 2004 and2015 (Roy et al. 2009; Dasgupta and Ghosh 2015; Roy and Sukumar 2016).
As northern West Bengal is a “hotspot” of train–elephant collisions, we carriedout a case study of this phenomenon with the following objectives: (1) mapping thelocations of collisions and generating a susceptibility map showing locations proneto accidents; (2) understanding patterns in accidents involving elephants; (3) map-ping elephant crossing points and their movement paths along the railway track; and(4) providing suggestions for reducing the incidence of accidents.
10 Railways and Wildlife: A Case Study … 159

Methods
Study Area
This case study was carried out along the 161-km long railway line between theSiliguri Junction (latitude 26.70758°N, longitude 88.42761°E) and the AlipurduarJunction (latitude 26.49099°N, longitude 89.52644°E) in northern West Bengalstate, India. The Eastern Bengal Railway (EBR) was one of the pioneer railwaycompanies in the former Bengal and Assam provinces of British India from 1857 to1942. The Siliguri Alipurduar track was built during 1910–1911, usingnon-standard meter gauge (MG). Major tracts of tropical moist forests dominatedby sal (Shorea robusta) were cleared to establish the railway line and to expand tea(Camellia sinensis) plantations. Other forests were also cut to make way forestablishing agricultural land and to provide the wood to make the railway sleepers.These forests supported a large elephant population from historical times (GoWB1957) and even supplied elephants for use in armies of Sultanate and Mughal rulers,and later in logging operations by the British (Sukumar 2011). Post-independence,the Eastern Bengal Railway operating in Assam and northern Bengal came underthe jurisdiction of the North-East Frontier Railways.
This railway line passes through an elephant range that is part of the EasternHimalayan biodiversity hotspot and the Eastern Dooars Elephant Reserve(Roy et al. 2009). The line cuts through a mixture of forests, tea gardens, towns,crop lands, human settlements, army establishments, streams, rivers, and elephantcorridors within the districts of Darjeeling, Jalpaiguri, and Alipurduar. Establishedin the early nineteenth century primarily to serve the tea industry (Ray 2002) andthe extraction of timber from this region, the line initially had a “meter-gauge track”distance between two rails = 1000 mm/3 ft 3 3/8 in.); at that time, only a few trainsused the line and did so at maximum speeds of 60 kph (37 mph). However, giventhe increasing demand to improve connectivity between the states of north-easternIndia and the rest of the country, this railway line was converted from meter-gaugeto broad-gauge (distance between two rails 1676 mm or 5’ 6”) in 2003.Broad-gauge lines can carry heavier loads (including more people) and withstandhigher train speeds; consequently, the number of freight and passenger trains on thetrack has almost doubled. The speed of trains has also increased to more than100 kph (62 mph). Over 74 km (46 mi) of this line run through forested areas,including several protected areas (Mahananda Wildlife Sanctuary, GorumaraNational Park, Chapramari Wildlife Sanctuary, Jaldapara National Park and BuxaTiger Reserve), as well as through more than 40 tea gardens, 4 army establishments,and agricultural land (mainly paddy and maize, cultivated seasonally).
160 M. Roy and R. Sukumar

Data Collection
We collected data on elephant casualties due to collisions with trains between 1974and 2015, using records maintained by the Government of West Bengal (2012), theAlipurduar Divisional Railway Manager’s office, several offices of the West BengalForest Department, tea association offices, scientific reports and publications (Royet al. 2009; Dasgupta and Ghosh 2015), and newspaper reports. These recordsinclude date, time, location, number of animals injured or killed, and the gender andage groups of these animals. We also collected first-hand information on some of themore recent accidents during our field research on elephant ecology in this region.
To estimate the distribution and relative abundance of elephants, we conductedsurveys along this railway track during three seasons in 2015: non-crop (Jan–Mar),maize cultivation/harvest (Apr–Jul), and paddy cultivation/harvest (Aug–Dec). Thesurvey was done along a 150 km stretch of the 161-km railway track, excluding apart of the Siliguri Junction–Gulma station and Rajabhatkhawa station–Alipurduarjunction, as these portions fall within human habitation areas with no elephantpresence. The surveys were conducted along the track on foot by a team consistingof one researcher and two assistants, aiming to detect elephant signs (dung, tracks,footprints, feeding signs), as well as direct sightings, on both sides of the track, upto a distance of 10 m. Every sign was counted separately and thus footprints, dung,and tracks at a particular location were counted as three separate pieces of evidence,as in general it was not possible to determine whether these signs, most of whichwere old, came from the same elephant or different ones. The paddy season surveyalso included the mapping of elephant corridors, which mostly pass through teagardens in this region. All the evidence of elephant evidence that we detected wereGPS-referenced and plotted on Arc GIS 10.3.1. (ESRI 2014). The non-crop seasonsurvey took 33 days, the maize season survey 22 days, and the paddy seasonsurvey 41 days to complete.
Data Analysis
Using data on the spatial distribution of elephant signs (dung, footprints, tracksigns, feeding signs), we generated a “susceptibility map” to estimate the locationsalong the railway track where accidents were more likely to occur due to theconcentration of elephant activity. This map was computed using the point densitytool of Arc GIS 10.3.1 software, and the GPS locations of elephant signs. The pointdensity tool calculates the density of point features around a given neighborhood ofeach raster cell by dividing the number of points that fall in the neighborhood by thearea of the neighborhood. In our computations, we used an output cell size of0.001375 km2 and search radius of 0.11458 km, based on values provided auto-matically by the GIS software. We also generated a “kernel density map” inARC GIS 10.3.1, taking into account all indirect evidence of elephants (dung,
10 Railways and Wildlife: A Case Study … 161
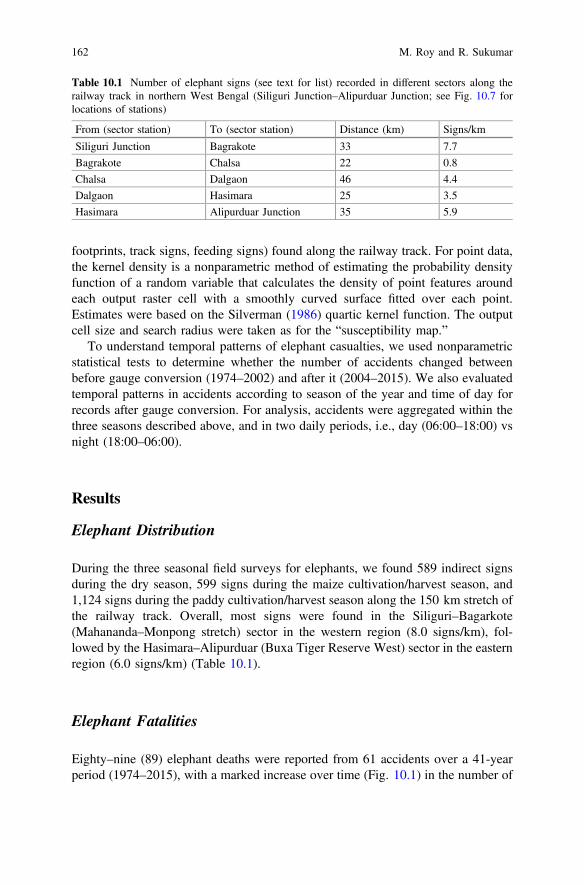
footprints, track signs, feeding signs) found along the railway track. For point data,the kernel density is a nonparametric method of estimating the probability densityfunction of a random variable that calculates the density of point features aroundeach output raster cell with a smoothly curved surface fitted over each point.Estimates were based on the Silverman (1986) quartic kernel function. The outputcell size and search radius were taken as for the “susceptibility map.”
To understand temporal patterns of elephant casualties, we used nonparametricstatistical tests to determine whether the number of accidents changed betweenbefore gauge conversion (1974–2002) and after it (2004–2015). We also evaluatedtemporal patterns in accidents according to season of the year and time of day forrecords after gauge conversion. For analysis, accidents were aggregated within thethree seasons described above, and in two daily periods, i.e., day (06:00–18:00) vsnight (18:00–06:00).
Results
Elephant Distribution
During the three seasonal field surveys for elephants, we found 589 indirect signsduring the dry season, 599 signs during the maize cultivation/harvest season, and1,124 signs during the paddy cultivation/harvest season along the 150 km stretch ofthe railway track. Overall, most signs were found in the Siliguri–Bagarkote(Mahananda–Monpong stretch) sector in the western region (8.0 signs/km), fol-lowed by the Hasimara–Alipurduar (Buxa Tiger Reserve West) sector in the easternregion (6.0 signs/km) (Table 10.1).
Elephant Fatalities
Eighty–nine (89) elephant deaths were reported from 61 accidents over a 41-yearperiod (1974–2015), with a marked increase over time (Fig. 10.1) in the number of
Table 10.1 Number of elephant signs (see text for list) recorded in different sectors along therailway track in northern West Bengal (Siliguri Junction–Alipurduar Junction; see Fig. 10.7 forlocations of stations)
From (sector station) To (sector station) Distance (km) Signs/km
Siliguri Junction Bagrakote 33 7.7
Bagrakote Chalsa 22 0.8
Chalsa Dalgaon 46 4.4
Dalgaon Hasimara 25 3.5
Hasimara Alipurduar Junction 35 5.9
162 M. Roy and R. Sukumar

accidents (Pearson’s r = 0.82, P < 0.05) and the number of elephants killedper year (r = 0.96, P < 0.0001). Between 1974 and 2002, when meter gauge(MG) was in operation, 27 elephants died in 26 accidents, corresponding to0.90 accidents/year ±1.11 (SD) and 0.93 ± 1.19 (SD) elephants/accident. In the12 years (2004–2015) after conversion to broad gauge (BG), these figures jumpedto 62 fatalities in 35 accidents, corresponding to 2.92 accidents/year ±1.98(SD) and 5.17 ± 5.89 (SD) elephants/accident. There were statistically significantdifferences between the time periods before and after gauge conversion, for both theannual number of accidents (Mann–Whitney U = 283.5, Z = −3.13, P < 0.001)and the annual number of animals killed (Mann–Whitney U = 290.5, Z = −3.33,P < 0.001).
We also analyzed data in more detail for accidents occurring from 2004 to 2015(after gauge conversion). Females accounted for most of the animals killed intrain collisions, while adults (>15 years) constituted nearly 60% of all mortalityrecorded (Table 10.2). Also noteworthy is the relatively high mortality of calves(Table 10.2). Comparing these figures with available data on the age structure ofelephant populations in northern West Bengal (Sukumar et al. 2003), we found thatadult elephant males were killed far more frequently (31% or more than 2.5–fold)than what would have been expected from their representation in the population(13%; Table 10.2). A proportions test also showed that adult males (Z = 3.831,P < 0.001), and calves (Z = 2.136, P = 0.037) were involved to a significantlygreater extent in train accidents (n = 62) than their representation in the population(n = 650).
0
10
20
30
40
50
60
Num
ber
No inc
ele killed
Fig. 10.1 Temporal variation between 1974 and 2015 in the number of train–elephant collisionaccidents (No inc) and in the number of elephants killed (ele killed) per 5-year period, in theSiliguri–Alipurduar railway, northern West Bengal, India
10 Railways and Wildlife: A Case Study … 163

Also in 2004–2015, we found that the occurrence of elephant–train collisionsvaried markedly during the daily cycle. In fact, most accidents occurred betweenmidnight and 6:00 and 16:00–24:00, with peaks at 01:00–2:00 and 22:00–23:00(Fig. 10.2). More accidents occurred during the night (80%), and this was signif-icantly higher than during the day (Z = 3.198, P = 0.002). There were also sig-nificant seasonal patterns in the number of accidents (Kruskal–Wallis H = 12.69,P = 0.05) and the number of elephant deaths (Kruskal–Wallis H = 39.70,P = 0.05), with both occurring most frequently during the paddy cultivation season,followed by maize and non-crop seasons (Fig. 10.3). The association of accidentswith elephants with the crop cultivation seasons is further emphasized by the strongcorrelation between the monthly proportion of elephants killed and the frequency ofcrop raiding by elephants in villages (all seasons: r = 0.38, P = 0.11; maize season:r = 0.81, P = 0.025; paddy season: r = −0.037, P = 0.47). In fact, there were
Table 10.2 Age structure of the elephant population in northern West Bengal (based on Sukumaret al. 2003) and those killed in train elephant collisions in the Siliguri–Alipurduar railway between2004 and 2015
Age class % Femalesin population
% Females killed intrain accidents
% Males inpopulation
% Males killedin train accidents
Adult 33.3 29.0 12.9 30.6
Sub-adult 11.1 11.3 12.3 8.1
Juvenile 13.5 4.8 8.8 0.0
Calves 4.1 8.1 4.1 8.1
Total 62.0 53.2 38.0 46.8
0.0
2.0
4.0
6.0
8.0
10.0
12.0
00:0
0-01
:00
01:0
0-02
:00
02:0
0-03
:00
03:0
0-04
:00
04:0
0-05
:00
05:0
0-06
:00
06:0
0-07
:00
07:0
0-08
:00
08:0
0-09
:00
09:0
0-10
:00
10:0
0-11
:00
11:0
0-12
:00
12:0
0-13
:00
13:0
0-14
:00
14:0
0-15
:00
15:0
0 -16
:00
16:0
0-17
:00
17:0
0-18
:00
18:0
0-19
:00
19:0
0-20
:00
20:0
0-21
:00
21:0
0 -22
:00
22:0
0-23
:00
23:0
0-24
:00
Percentag
e
Fig. 10.2 Temporal distribution of train–elephant collisions during the daily cycle from 2004until 2015 (after broad gauge conversion), in the Siliguri–Alipurduar railway, northern WestBengal, India
164 M. Roy and R. Sukumar

simultaneous peaks in elephant mortality and crop raiding during the year, corre-sponding to the maize (May–June) and paddy-harvesting season (Oct–Dec)(Fig. 10.4).
0.0
5.0
10.0
15.0
20.0
25.0
Jan Feb Mar Apr May Jun Jul Aug Sep Oct Nov Dec
Per
cen
tag
e
%REA
% FCR
Fig. 10.4 Monthly variation of railway elephant accidents (REA) between 2004 and 2015 (afterbroad gauge conversion), in the Siliguri–Alipurduar railway, and in the frequency of crop raiding(FCR) by elephants in villages. Data on crop raiding are based on Sukumar et al. (2003) and Roy(2010)
0
5
10
15
20
25
30
35
Non-Crop ( Jan-Mar)
Maize (Apr-Jul) Paddy ( Aug-Dec)
Nu
mb
er
InC no
Ele No
Fig. 10.3 Variation in relation to season in the number of accidents (InC no) and number ofelephants killed (ele no) in collisions with trains during 2004–2015 (after broad gauge conversion)in the Siliguri–Alipurduar railway, northern West Bengal, India
10 Railways and Wildlife: A Case Study … 165

Spatial Distribution of Collision Risk
There was a strong spatial variation in the number of accidents both before and aftergauge conversion (Fig. 10.5), with many accidents occurring in the same areas andnone in others. The concentrations of accidents matched some areas with highelephant activity as estimated from the densities of elephant signs (Fig. 10.6), butthere were also areas with large densities of elephant signs but with no or just a fewaccidents. However, when we divided the entire railway line surveyed into seg-ments of 2 km each (n = 76) and plotted the elephant signs found (dung, tracks,foot prints, feeding signs) in each segment with the number of accidents thatoccurred, we found a strong correlation (Spearman’s rank correlation r = 0.80,P � 0.001).
During 2004–2015, after gauge conversion, the Buxa Tiger Reserve WestDivision region recorded the highest number (29%) of the accidents that took place(n = 35), followed by the Mahananda Wildlife Sanctuary (26%), the JalpaiguriForest Division (17%), the Jaldapara Wildlife Division (14%), the KalimpongForest Division (9%), and the Gorumara Wildlife Division (6%). When we considerthe number of elephants killed (n = 62), the highest figures were observed inJalpaiguri (31%), followed by the Buxa Tiger Reserve West (26%), GorumaraWildlife (16%), Mahananda Wildlife Sanctuary (15%), Jaldapara Wildlife Division(8%), and Kalimpong Division (5%). More elephant groups were involved inaccidents in Gorumara and Jalpaiguri resulting in multiple fatalities per accident.
Discussion
Our study describes the spatial and temporal mortality patterns of elephants due tocollisions with trains along a 150-km stretch of the 161-km railway line between theSiliguri and Alipurduar Junctions. Collisions occurred throughout the study period(1974–2015), but they greatly increased after 2004, when a new schedule of trainsbegan operating, after the line was converted from meter gauge to broad gauge.Most collisions occurred during the night, and adult male elephants and calvesappeared particularly susceptible to this type of mortality. There was an unevendistribution of accidents during the annual cycle, with peaks in May–June andSeptember–October, during the crop cultivation seasons of maize and paddy rice,respectively. The spatial distribution of accidents was also uneven, occurringmostly in a few well-defined hotspots. Overall, our study provides useful infor-mation to mitigate elephant–train accidents in the Siliguri–Alipurduar railway, andelsewhere in India.
One reason for the increase that was seen in the frequency of accidents wasprobably the increase in the number of circulating trains, from about 10 trains/dayduring the pre-conversion period, to estimates of between 17 (Ghosh 2001) and 22–26/day (Das 2013) during the post-conversion period, thereby increasing the
166 M. Roy and R. Sukumar

chances of an elephant encountering a train when crossing the railway. Also, broadgauge allows trains to reach higher velocities, making it harder for elephants toavoid a moving train. In fact, after gauge conversion, the maximum speed of trains
Fig. 10.5 Locations of elephant–train accidents in northern West Bengal between 1974 and 2002(upper panel, a) when meter gauge was in operation (pink stars indicate locations where accidentsoccurred), and during 2004–2015 (lower panel, b), after broad gauge conversion (red starsindicate locations where accidents occurred)
10 Railways and Wildlife: A Case Study … 167

increased from about 60 kph (37 mph) to over 100 kph (62 mph). A second pos-sible reason for the increasing number of accidents was the increase in the elephantpopulation of this region; the population more than doubled or even tripled herewhen 150 elephants were reported in 1980 from this region (Roy 2010).
Fig. 10.6 Maps estimating the spatial variation in the risk of collision of elephants with trainsalong the railway track in northern West Bengal based on point densities (susceptibility map,upper panel a) and kernel densities (lower panel b)
168 M. Roy and R. Sukumar

In terms of age and gender, we found that adults were killed more often thanother age groups, but this was roughly proportional to their representation in thepopulation. What is striking, however, is that the proportion of adult males killedwas nearly three times higher than that expected from their representation in thepopulation. The reasons for this are uncertain, but it is possible that adult malesrange over larger areas, raid crops in villages more frequently, and thus crossrailways more often than females do (Sukumar 1989; Sukumar et al. 2003; Roy2010; Williams et al. 2001). It is also noteworthy that juveniles were killed to alesser extent than expected, implying that they are alert and protected within afamily group, whereas calves were killed more often than expected from theirpercentage of the population, probably because of their inability to respond quicklyto dangerous situations.
The concentration of accidents at night was probably a consequence of elephantmovement patterns, rather than resulting from variation in the number of circulatingtrains. In fact, about 80% of accidents occurred between 18:00 and 6:00, althoughonly 35% of trains operate at this time; this is probably because in daytime, ele-phants tend to rest in more dense forests, moving towards cultivated fields at night(Sukumar 2003) and eventually crossing railway lines. Other studies have reportedsimilar patterns, showing a matching between animal daily activity patterns andcollisions with trains. For instance, Ando (2003) found that 69% of the collisions ofSika deer Cervus nippon with trains in the eastern Hokkaido line, Japan, wererecorded in the evening, which is the period when animals move between restingand feeding sites.
The seasonal distribution of collisions may also be a consequence, at least partly,of elephant movements from forests to agricultural areas, where they forage forcrops. This is supported by the close matching between accident peaks and theharvest seasons of maize and paddy rice, as well as the observed spatial andtemporal patterns of elephant raiding of crops in the region. Similar patterns havebeen observed elsewhere in India, with Singh et al. (2001) reporting that 78% ofcollisions with trains in the Rajaji National Park occurred in January–June andpeaked in May, which matches the wheat and sugar cane cultivation/harvest season.Likewise, Sarma et al. (2006) in Assam found one peak in June–July during theactive monsoon period, when elephants move away from floodplains to higherground through which railway tracks run, and another in November that coincideswith the paddy crop harvesting season. Studies on other herbivores, such as Sikadeer (Ando 2003), moose (Alces alces, Andersen et al. 1991), and roe deer(Capreolus capreolus, Kusta et al. 2014), also suggested that collisions with trainspeaked during the seasons when animals moved widely in search of food.
The spatial distribution of train–elephant collisions was uneven, with the occur-rence of a few well-defined hotspots. Reasons for this are uncertain, but it may be theresult of a number of factors, such as a variation in animal abundance, activity, andbehaviour, habitat distribution, landscape topography, and rail design, as describedfor other species elsewhere (Gundersen andAndreassen 1998; Inbar andMayer 1999;Haikonen and Summala 2001; Joyce andMahoney 2001;Mysterud 2004; Roy 2010).In our case, accidents seemed concentrated in areas where the railway track crossed
10 Railways and Wildlife: A Case Study … 169

forested habitats heavily used by elephants, and in areas where elephants cross fromforests to agricultural areas during their foraging movements. There is probably also ahigh risk of collisions in corridors that are used when animals move/migrate amongforest patches, including the Reti Reserved Forest (RF)-Moraghat RF, Reti RF-DianaRF, Neora RF-Apalchand RF (Roy and Sukumar 2015).
It is not certain whether the observed mortality from collisions with trains hasany significant impact on the local elephant population, but it is worth noting thattrain accidents from 2004 to 2013 were responsible for causing about 25% of the224 elephant deaths recorded in northern West Bengal. This compares with apopulation size of 674 elephants estimated for northern West Bengal in 2015 (WestBengal Forest Department 2015), suggesting that there may indeed be some neg-ative effects. As mentioned, the elephant population in this region has beenincreasing over the past three decades. Although northern West Bengal accounts foronly 2.3% of the free-ranging elephant population in India, it is part of a muchlarger elephant population (about 2,700–3,000 animals) of the North Bank land-scape (of the Brahmaputra River) that shares a contiguous habitat with Bhutan inthe north and Assam in the east (Chowdhury and Menon 2006).
The impact of these accidents is very significant, Trains have to stop, elephantshave to be removed, carriages may be damaged, etc. Due to these railways–elephantaccidents revenue loss was estimated all over India Rs. 69,675.97 cores fromfreight and Rs. 28,645.52 cores (Nayak 2013).
Management Implications
Together with other studies (Singh et al. 2001; Sarma et al. 2006), our work clearlyshows that elephant mortality due to collision with trains is a significant problemthat urgently needs to be resolved. Addressing this issue requires that collision risksbe duly considered in “environmental impact assessments,” both when developingnew railway projects, and when improving the operational characteristics of extantones (e.g., changes from meter to broad gauge). These studies should assess thespatial and temporal patterns of elephant abundance, movements, and activity,thereby identifying areas where the risk of collision is high and new railway linesshould not be laid. Where new lines are unavoidable, or where lines are already inoperation, efforts should be targeted to mitigating impacts by implementing mea-sures such as fencing, bridges, under- or overpasses, and local topographyadjustments, among others. These processes should be conducted by technicallyqualified agencies in close collaboration with local and regional stakeholders,including government, NGOs, and the general public. It is also important thatmonitoring be put in place–in both the construction and exploration phases–aimingat the early detection of unanticipated impacts, and for assessing the efficiency ofmitigation and compensation measures (Inell et al. 2003).
Along railway lines where collisions with elephants are frequent, such as in ourstudy area, measures should be put in place to reduce the risks and thus avoid
170 M. Roy and R. Sukumar

elephant mortality to the extent possible. Below are a number of recommendationsthat need to be considered in the Siliguri–Alipurduar line, and that may also beuseful in similar areas elsewhere:
1. Reduce the speed of trains in the most vulnerable stretches of the track Thissuggestion has been repeated by several committees that have addressed train–elephant collisions in this region, but there have been genuine technical diffi-culties faced by the railway companies in implementing it due to operationalconstraints. With the current train operations along the Siliguri–Alipurduar line,it seems that reduced speed can only be implemented along a few stretches.
2. Limit the operation of trains during the night-time Since the frequency ofaccidents is much higher during the night than during the day, the curtailment oftrain movement along this track at night might be a possible way to reduceaccidents. The acceptance of this suggestion would again depend on the oper-ational needs of the railways.
3. Provision of overpasses and underpasses at vulnerable crossing points Thiswould require an engineering survey along the entire stretch in order to deter-mine the need, feasibility, and costs of any structure at locations where elephantsare expected to cross more frequently. Considerable expenses would be incurredin undertaking such constructions. A pilot project on landscaping at somecritical places such as Chalsa-Nagrakata, where the track is laid through anarrow passage in a hillock with steep excavation on either side, can beundertaken to assess its success or otherwise in reducing train elephant acci-dents. It is also important to consider whether elephants would use such engi-neered passages for crossing the railway track or would be suspicious of themand avoid them.
4. Patrolling along the track by forest/wildlife/railway staff This is alreadybeing practiced in northern West Bengal but can perhaps be strengthened duringcrop–raiding seasons, when the frequency of elephants crossing the tracksincreases. The patrolling staff can then pass on the information to the railwaysignalmen on the presence of elephants. These measures are not without theirproblems, as patrolling at night inside dense forest is hazardous. The provisionof more watch towers along the track in forest areas may be useful.
5. Implement garbage clearance and ensure better visibility along the trackElephants are attracted by food items, including packaged ones that passengersmay throw out of trains. Creating awareness among passengers and employingstaff to remove such garbage along the track would help reduce the possibility ofelephants lingering along the railway track in search of food. Vegetation alongthe track has to be cleared on a regular basis to ensure the best possible visibilityto train drivers who have to be sensitized to the risks of elephants crossing thetracks (such awareness is already being instituted among the drivers). Therehave been instances of elephants, usually solitary bulls, feeding on an attractiveplant (such as banana) that grows close to a railway track, and being hit by atrain. It is important to remove such elephant forage plants along the railwaytracks.
10 Railways and Wildlife: A Case Study … 171

6. Use of communications technology as an advance warning to train driversand signalling staff Electronic surveillance can be undertaken to assess itsefficacy in detecting elephants close to the railway track. Various technologieshave been suggested, including seismic sensors that measure ground vibrationsto record elephant presence, infrared (thermal) sensors and cameras to provideimages of elephants along railway tracks, infrared beams to detect the movementof an elephant, and even acoustic devices to scare elephants from tracks whentrains are approaching. These require considerable R&D for field situations,extensive field trials, and evaluation of cost-effectiveness before being deployedon a large scale. GPS collaring of representative animals in family herds andbulls would help in the fine-grained analysis of their movement pattern along therailway track, and help in planning mitigation measures.
7. Realignment of a portion of the track The existing track can be realigned so asto avoid passing through the Buxa Tiger Reserve West Division and theJaldapara National Park, where a large number of accidents has taken place. TheSouthern line between New Jalpaiguri and New Alipurduar can be doubled tohandle the increased traffic. There are four possibilities for realignment of theNorthern line (Fig. 10.7).
(i) From the Dalgaon Railway station the track can be diverted and/or linkedto the southern line, namely, Salbari–Falakata station between the NewJalpaiguri Junction– and the New Alipurduar Junction line so that sometrains can be diverted before the Jaladapara—Buxa Reserve forest areasto avoid accidents.
(ii) From the Madarihat Station, the track can be diverted and/or linked to thesouthern line, namely, the Falakata station, along the New JalpaiguriJunction–New Alipurduar Junction line so that some trains can be divertedbefore the Jaladapara–Buxa Reserve forest areas to avoid accidents.
(iii) From the Madarihat Station the track can be diverted and/or linked alongthe southwest periphery of the Jaldapara National Park (NP) and southernperiphery of Jaldapara and Buxa Tiger Reserve (BTR) linked toAlipurduar Junction.
(iv) The fourth possibility is to realign the northern line from Hamiltanganj/Kalchini to Damanpur by diverting the line along the south west border of theBuxa Tiger Reserve via Nimati and along south of highway NH31, which islinked to Damanpur, to avoid going through the Buxa Tiger Reserve.
Besides these technical recommendations, it should be kept in mind that limitingaccidents to elephants from train collisions is extremely challenging, requiring theactive participation of a number of stakeholders that include the Indian Railways,Ministry of Environment, Forest and Climate Change (Govt. of India), West BengalForest Department, NGOs, elephant biologists/conservationists, engineers andtechnologists, tea garden management, and the people living along the track. Wesuggest that various solutions be implemented at an experimental level, and thenmonitored over a reasonable time frame for testing their efficacy. The mostcost-effective solutions should then be selected and implemented on a larger scale,thereby reducing collision risks and ultimately contributing to the conservation ofelephants in India and elsewhere in Asia
172 M. Roy and R. Sukumar

Fig. 10.7 Suggestions for realignment of the existing railway track from the Siliguri Junction tothe Alipurduar Junction to reduce the risk of train–elephant collisions in northern West Bengal.#Red line Northern sector railway track (Siliguri Junction–Alipurduar Junction). #Green lineSouthern sector railway track (New Jalpaiguri–New Alipurduar Junction) that does not passthrough any forest. #Pink lines Possible realignment of track (Dalgaon- Falakata (A-1), Madarihat–Falakata (A-2)). #Blue dotted lines Possible realignment of proposed track (Madarihat–AlipurduarJunction (A-3) and Hamlitonganj–Damanpur (A-4))
Photo credit @Debopratim Saha
10 Railways and Wildlife: A Case Study … 173

Acknowledgements We thank the International Elephant Foundation, the primary agency thatfunded this project; the Asian Nature Conservation Foundation for the work place and adminis-tration of the project; the Centre for Ecological Sciences, Indian Institute of Science, for officespace, Internet and report writing; the West Bengal Forest Department for permissions and help inthe field to carry out the study; the Indian Railways (North Frontier Railway) for permissions tosurvey along the track; the Dooars Branch of the Indian Tea Association for permissions to surveyelephant paths within their tea gardens; and the Environmental System Research Institute forproviding online software as well as Arc GIS 10.3.1. We also thank Mr. Santosh Chhetri, Mr.Sapwan Chhetri, Mr. Sushil Manger, Mr. Rabin Chhetri, Mr Ratua Oran, Mr. Rohit Munda andMr. Bikash Kairala for their help in the field, often under difficult conditions.
References
Andersen, R., Wiseth, B., Pedersen, P. H., & Jaren, V. (1991). Moose–train collisions: Effects ofenvironmental conditions. Alces, 27, 79–84.
Ando, C. (2003). The relationship between deer–train casualties and daily activity of the sika deer,Cervus nippon. Mammal Study, 28, 135–143.
Caughley, G., & Sinclair, A. R. E. (1994). Wildlife Ecology and Management. Cambridge, MA:Blackwell Science.
Child, K. N., Barry, S. P., & Aitken, D. A. (1991). Moose mortality on highways and railways inBritish Columbia. Alces, 27, 41–49.
Chowdhury, A., & Menon, V. (2006). Conservation of Asian elephant in north-east India. Gajah,25, 47–60.
Clarke, G. B., White, P. C. L., & Harris, S. (1998). Effects of roads on badger Meles melespopulations in south-west England. Biological Conservation, 86, 117–124.
Conover, M. R., Pitt, W. C., Kessler, K. K., Dubow, T. J., & Sanborn, W. A. (1995). Review ofhuman injuries, illnesses, and economic losses caused by wildlife in the United States. WildlifeBulletin, 23, 407–414.
Das, K. (2013). Man Elephant Conflict in Northern Bengal. Unpublished report to TERIUniversity. Retrieved on November 05, 2016, from http://www.teriuniversity.ac.in/mct/pdf/assignment/Kalyan-Das.pdf
Dasgupta, S., & Ghosh, A. K. (2015). Elephant–railway conflict in a biodiversity hotspot:Determinants and perceptions of the conflict in Northern West Bengal, India. HumanDimensions of Wildlife, 20, 81–94.
Dorans, R. A. P., Kindel, A., Bager, A., & Freitas, S. R. (2012). Avaliação da mortalidade devertebrados em rodovias no Brasil. In A. BAGER (ed.), Ecologia de estradas: tendências epesquisas. Lavras: UFLA, pp. 139–152.
ESRI. (2014). ArcGIS Desktop: Release 10.3.1. Redlands, CA: Environmental Systems ResearchInstitute.
Fahrig, L., Pedlar, J. H., Pope, S. E., Taylor, P. D., & Wegner, J. F. (1995). Effect of road traffic onamphibian density. Biological Conservation, 73, 177–182.
Forman, R. T. T., & Deblinger, R. D. (2000). The ecological road-effect zone of a Massachusetts(USA) suburban highway. Conservation Biology, 14, 36–46.
Formann, R. T. T., Sperling, D., Bissonette, J. A., Clevenger, A. P., Cutshall, C. D., Dale, V. H.,et al. (2003) Road Ecology: Science and Solutions (481 p). Washington: Island Press.
Fahrig, L., France, R., Goldman, C. R., Heanue, K., & Jone, I. A. (2003) Road ecology: Scienceand solutions (481 p). Washington: Island Press.
Ghosh, L. (2001). Tracking death. India today. Retrieved November 5, 2016 from, http://indiatoday.intoday.in/story/railway-expansion-project-increases-threat-to-wildlife-in-bengal-sanctuaries/1/232130.html)
174 M. Roy and R. Sukumar

Government of West Bengal, Forest Department (GoWB). (1957). Sixth working plan of thereserved forests of Jalpaiguri Division (1957–58 to 1966–67), Vol. 1, prepared by theDivisional Forest Officer, Jalpaiguri Division.
Government of West Bengal. (2012). State forest reports: 2006–2012. Kolkata: Government ofWest Bengal, Directorate of Forests, Office of the Principal Chief Conservator of Forests.
Government of West Bengal. (2013). State forest reports: 2013. Kolkata, India: Government ofWest Bengal, Directorate of Forests, Office of the Principal Chief Conservator of Forests.
Government of West Bengal. (2015). Synchronized population estimation of the Asian elephant inforest divisions of Northern West Bengal-2014. Jalpaiguri, West Bengal: West Bengal,Directorate of Forests, Office of Conservator of Forests.
Government of India. (2015). Indian railways lifeline of the nation (A White Paper) February2015, Ministry of Railways New Delhi.
Gundersen, H., & Andreassen, H. P. (1998). The risk of moose Alces alces collision: A predictivelogistic model for moose train accidents. Wildlife Biology, 4, 103–110.
Haikonen, H., & Summala, H. (2001). Deer-vehicle clashes: Extensive peak at 1 hour after sunset.American Journal of Preventive Medicine, 21, 209–213.
https://en.wikipedia.org/wiki/Track_gauge_in_Indiahttp://indiatoday.intoday.in/story/railway-expansion-project-increases-threat-to-wildlife-in-bengal-
sanctuaries/1/232130.htmlInbar, M., & Mayer, R. T. M. (1999). Spatio-temporal trends in armadillo diurnal activity and
road-kills in central Florida. Wildlife Society Bulletin, 27, 865–872.Indian Railways. (2014). Statistical summary—Indian railways. Retrieved November 05, 2016,
from http://indianrailways.gov.in/railwayboard/uploads/directorate/stat_econ/IRSP_201314/pdf/Statistical_Summary/Summary%20Sheet_Eng.pdf
Inell, B., Bekker, G. J., Cuperus, R., Dufek, J., Fry, G., Hicks, C., et al. (Eds.). (2003).Wildlife andtraffic: A European handbook for identifying conflicts and designing solutions. Brussels:European Co-operation in the Field of Scientific and Technical Research.
Jha, N., Sarma, K., & Bhattacharya, P. (2014). Assessment of elephant (Elephas maximus)mortality along Palakkad–Coimbatore railway stretch of Kerala and Tamil Nadu usingGeospatial Technology. Journal of Biodiversity Management & Forestry, 3, 1–7.
Joyce, T. L., & Mahoney, S. P. (2001). Spatial and temporal distributions of moose–vehiclecollisions in Newfoundland. Wildlife Society Bulletin, 29, 281–291.
Kusta, T., Hola, M., Keken, Z., Jezek, M., Zika, T., & Hart, V. (2014). Deer on the railwayline: Spatiotemporal trends in mortality patterns of roe deer. Turkish Journal of Zoology, 38,479–485.
Lalo, J. (1987). The problem of road kill. American Forests, 50, 50–52.Modafferi, R. D. (1991). Train moose kill in Alaska: Characteristics and relationships with
snowpack depth and moose distribution in Lower Susitna Valley. Alces, 27, 193–207.Mysterud, A. (2004). Temporal variation in the number of car-killed red deer Cervus elaphus in
Norway. Wildlife Biology, 10, 203–210.Ministry of Environment and Forests (MOEF). (2010). Gajah: Securing the future for elephants in
India. New Delhi, IndiaNayak, S. (2013). A petition under article 32 of the Constitution of India in the nature of public
Interest litigation challenging the inaction of ministry of Environment & Forest, Indianrailways and many State Governments and under their failure to protect wealth like theelephants, In the Supreme Court of India, New Delhi.
Newmark, W. (1987). A land–bridge island perspective on mammalian extinctions in westernAmerican parks. Nature, 325, 430–432.
Palai, N. C., Bhakta, P. R., & Kar, C. S. (2013). Death of elephants due to railway accidents inOdisha, India. Gajah, 38, 39–41.
Raman, T. S. R. (2011). Framing ecologically sound policy on linear intrusions affecting wildlifehabitats (background paper for the National Board of Wildlife). Mysore: Nature ConservationFoundation.
10 Railways and Wildlife: A Case Study … 175

Ray, S. (2002). Transformations on the Bengal frontier: Jalpaiguri 1765–1948. Curzon, NY:Routledge.
Roy, M., Baskaran, N., & Sukumar, R. (2009). The death of jumbos on railway lines in northernWest Bengal. Gajah, 31, 36–39.
Roy, M. (2010). Habitat use and foraging ecology of the Asian Elephant (Elephas maximus) inBuxa Tiger Reserve and adjoining areas of northern West Bengal. Ph.D. thesis, VidyasagarUniversity, West Bengal, India.
Roy, M., & Sukumar, R. (2015). Elephant corridors in northern West Bengal. Gajah, 43, 26–35.Roy, M., & Sukumar, R. (2016). Survey of elephant movement paths/corridors across rail tracks
in northern West Bengal. Final Report to International Elephant Foundation, March 2016.Seiler, A., & Helldin, J. O. (2015). Greener transport infrastructure—IENE 2014 international
conference. In A. Seiler & J. O. Helldin (Eds.), Proceedings of IENE 2014 InternationalConference on Ecology and Transportation, Vol 11, pp. 5–12. Malmö, Sweden. NatureConservation. doi:10.3897/natureconservation.11.5458
Sarma, U. K., Easa, P. S., & Menon, V. (2006). Deadly lines: A scientific approach tounderstanding and mitigating elephant mortality due to train hits in Assam (Occasional Reportno. 24). New Delhi: Wildlife Trust of India.
Silverman, B. W. (1986). Density estimation for statistics and data analysis. New York: Chapmanand Hall.
Singh, A. K., Kumar, A., Mookerjee, A., & Menon, V. (2001). Jumbo express: A scientificapproach to understanding and mitigating elephant mortality due to train accidents in RajajiNational Park (Occasional Report no. 3). New Delhi: Wildlife Trust of India.
Soule, M. E., & Wilcox, B. A. (Eds.). (1980). Conservation biology: An evolutionary-ecologicalperspective. Sunderland, MA: Sinauer.
Sukumar, R. (2011). The story of Asia’s elephants. Mumbai: Marg Foundation.Sukumar, R. (1989). The Asian elephant: Ecology and management. Cambridge: Cambridge
University Press.Sukumar, R. (2003). The living elephants: Evolutionary ecology, behavior and conservation. New
York: Oxford University Press.Sukumar, R., Baskaran, N., Dharmarajan, G., Roy, M., Suresh, H.S., & Narendran, K. (2003).
Study of Elephants in the Buxa Tiger Reserve and adjoining areas of northern West Bengal andpreparation of Conservation action plan. Final Report submitted to West Bengal ForestDepartment. Centre for Ecological Sciences, Indian Institute of Science, Bangalore, India.
Trombulak, S. C., & Frissell, C. A. (2000). Review of ecological effects of roads on terrestrial andaquatic communities. Conservation Biology, 14, 18–30.
Van der Ree, R., Jaeger, J. A. G., Van der Grift, E. A., & Clevenger, A. P. (2011). Effects of roadsand traffic on wildlife populations and landscape function: Road ecology is moving towardslarger scales. Ecology and Society, 16, 48.
Wilcove, D. S., Rothstrin, D., Dubow, J., Philips, A., & Locos, E. (1998). Quantifying threats toimperiled species in the United States. BioScience, 48, 607–615.
Williams, A. C., Johnsingh, A. J. T., & Krausman, P. R. (2001). Elephant–human conflicts inRajaji National Park, north-western India. Wildlife Society Bulletin, 29, 1097–1104.
176 M. Roy and R. Sukumar

Open Access This chapter is licensed under the terms of the Creative Commons Attribution 4.0International License (http://creativecommons.org/licenses/by/4.0/), which permits use, sharing,adaptation, distribution and reproduction in any medium or format, as long as you give appropriatecredit to the original author(s) and the source, provide a link to the Creative Commons license andindicate if changes were made.The images or other third party material in this chapter are included in the chapter’s Creative
Commons license, unless indicated otherwise in a credit line to the material. If material is notincluded in the chapter’s Creative Commons license and your intended use is not permitted bystatutory regulation or exceeds the permitted use, you will need to obtain permission directly fromthe copyright holder.
10 Railways and Wildlife: A Case Study … 177

Chapter 11Assessing Bird Exclusion Effectsin a Wetland Crossed by a Railway(Sado Estuary, Portugal)
Carlos Godinho, Luísa Catarino, João T. Marques, António Miraand Pedro Beja
Abstract Linear transportation infrastructures may displace wildlife from nearbyareas that otherwise would provide adequate habitat conditions. This exclusioneffect has been documented in roads, but much less is known about railways. Herewe evaluated the potential exclusion effect on birds of a railway crossing a wetlandof international importance (Sado Estuary, Portugal). We selected 22 sectors rep-resentative of locally available wetland habitats (salt pans, rice paddy fields, andintertidal mudflats); of each, half were located either close to (0–500 m) or far from(500–1500 m) the railway line. Water birds were counted in each sector betweenDecember 2012 and October 2015, during two months per season (spring, summer,winter, and autumn) and year, at both low and high tide. We recorded 46 species, ofwhich the most abundant (>70% of individuals) were black-headed gull, greaterflamingo, northern shoveler, black-tailed godwit, and lesser black-backed gull. Peakabundances were found in autumn and winter. There was no significant variationbetween sectors close to and far from the railway in species richness, total abun-dance, and abundance of the most common species. Some species tended to be most
C. Godinho (&) � L. CatarinoLabOr—Laboratório de Ornitologia, ICAAM—Instituto de Ciências Agrárias e AmbientaisMediterrânicas, Universidade de Évora, Mitra, 7002-554 Évora, Portugale-mail: [email protected]
J.T. Marques � A. MiraUnidade de Biologia da Conservação, Departamento de Biologia, Universidade de Évora,Mitra, 7002-554 Évora, Portugal
J.T. Marques � A. MiraCIBIO/InBIO, Centro de Investigação em Biodiversidade e Recursos Genéticos,Universidade de Évora, Pólo de Évora, Casa do Cordovil 2º Andar, 7000-890 Évora, Portugal
P. BejaCIBIO/InBIO, Centro de Investigação em Biodiversidade e Recursos Genéticos,Universidade do Porto, Campus Agrário de Vairão, Rua Padre Armando Quintas, 4485-661Vairão, Portugal
P. BejaCEABN/InBIO, Centro de Ecologia Aplicada “Professor Baeta Neves”, Instituto Superior deAgronomia, Universidade de Lisboa, Tapada da Ajuda, 1349-017 Lisboa, Portugal
© The Author(s) 2017L. Borda-de-Água et al. (eds.), Railway Ecology,DOI 10.1007/978-3-319-57496-7_11
179

abundant either close to or far from the railway albeit not significantly so but thisoften varied across the tidal and annual cycles. Overall, our study did not findnoticeable exclusion effects of this railway on wetland birds, with spatial variationin abundances probably reflecting habitat selection and daily movement patterns.Information is needed on other study systems to assess the generality of ourfindings.
Keywords Aquatic birds � Habitat loss � Human disturbance � Environmentalimpact � Transportation infrastructures � Zone of influence
Introduction
Linear transportation infrastructures such as roads and railways are increasingworldwide, and this is generally considered a serious threat to wildlife conservation(van der Ree et al. 2015). Transportation infrastructure networks are particularlydense in developed countries, with a recent study showing that in Europe about50% of the land area is within 1.5 km of a paved road or railway line (Torres et al.2016). This problem also increasingly affects less developed countries, where mostinfrastructure and urban development is expected to take place over the comingdecades (Seto et al. 2012). Therefore, there is an urgent need to evaluate the impactsof linear infrastructure development on wildlife, and to devise planning and tech-nical solutions to mitigate such impacts (DeFries et al. 2012).
The impacts of linear transportation infrastructures are generally associated withdirect mortality caused by animal collisions with circulating vehicles (Loss et al.2015; Santos et al. 2016), and with barrier effects and the consequent increases inhabitat fragmentation and reduced landscape connectivity (Carvalho et al. 2016).However, there may also be widespread indirect habitat degradation, because manyanimal species avoid using areas close to transportation infrastructures (Forman andDeblinger 2000; Torres et al. 2016). For instance, a recent study showed that manybird species strongly avoided traffic noise, while certain others remaining close tonoisy environments exhibited degradation in body condition (Ware et al. 2015).Another study showed that even unpaved roads reduced herbivore densities in aprotected area (D’Amico et al. 2016).Most of these studies, however, have focused onroads, either ignoring railways or assuming that roads and railways have largelysimilar impacts (e.g. Torres et al. 2016). Furthermore, the few studies available arecontradictory (see Chap. 6), with some pointing out negative effects of noise, lightsand vibrations associated with circulating trains, while others suggest that wildlifeignore or adapt to railway disturbance (Owens 1977;Waterman et al. 2002;Gosh et al.2010; Li et al. 2010;Mundahl et al. 2013;Wiacek et al. 2015). Thus,more informationis needed on the exclusion effects of railways, particularly on the species and eco-logical conditions associated with the most negative effects.
If railways have strong exclusion effects, their consequences may be particularlyserious when crossing wetland habitats. This is because wetlands are declining fast,
180 C. Godinho et al.

they are among the most threatened habitats, and the species they support are amongthe most endangered taxa (e.g. Millennium Ecosystem Assessment 2005; Tittensoret al. 2014); therefore, further habitat degradation due to railways and other trans-portation infrastructures may have particularly negative consequences. Moreover,wetlands are very productive habitats that are home to large concentrations of wild-life, particularly aquatic birds such as herons, egrets, waders, waterfowl and gulls,among others, many of which are declining and are highly sensitive to habitat loss anddegradation (e.g. Kleijn et al. 2014). Despite its importance, there is very littleinformation on the eventual exclusion effects of railways crossingwetlands, with veryfew studies focusing on aquatic bird species. In one of these studies, Waterman et al.(2002) found significant negative effects of railways on densities of black-tailedgodwit Limosa limosa and garganey Anas querquedula, for noise levels above 45–49 dB(A). In contrast, Owens (1977) observed that geese Branta spp. disregardedtrains passing nearby, while the single study using a Before-After-Control-Impact(BACI) design found no exclusion effects of a new railway line on a diverse wetlandbird assemblage throughout the annual cycle (see Chap. 16). Possibly, the type andmagnitude of effects depend on a number of factors related to wetland and railwaycharacteristics, as well as the behaviour and life history traits of the species involved.Therefore, the development of a number of case studies covering a wide range ofsocio-ecological conditions would be needed to find general patterns.
In this study, we addressed the eventual exclusion effects on birds of a new railwayline crossing the upper sector of the Sado Estuary (Portugal). This estuary is a“wetland of international importance” under the Ramsar Convention, and it isincluded in a Natural Reserve and in the Natura 2000 Network of Special ProtectedAreas and Sites of Community Importance. The Sado Estuary is inhabited by thou-sands of wetland birds, particularly from early autumn to spring, with large numbersoccurring in the area where the railway line started operating in December 2010(Lourenço et al. 2009; Alves et al. 2011). The environmental impact assessment studyraised the possibility of the railway causing the displacement of these birds, therebycausing potential losses in prime wetland habitat. The study was designed to clarifythis issue, aiming at: (1) describing the wetland bird assemblages occurring in thevicinity of the railway, and estimating how wetland bird assemblages varied inrelation to proximity to the railway line, in terms of (2) species richness, (3) total birddensity, and (4) densities of the most common species. Results of our study were usedto discuss the potential exclusion effects of railways crossing wetland habitats.
Methods
Our study was carried out in the Natural Reserve of the Sado Estuary (Portugal), ina 3-km section of the upper estuary crossed by the “Variante de Alcácer” railway.Specifically, we focused in the area known as Salinas da Batalha (38° 24′N, 8°36W), where the railway crosses the Sado River and adjacent wetland habitatsthrough a bowstring bridge (see details in Chap. 7). During the study period
11 Assessing Bird Exclusion Effects in a Wetland Crossed … 181

Table 11.1 Number (N) and area (ha) of habitat types in relation to distance categories (<500 and>500 m) from a railway bridge, which were sampled to estimate the exclusion effects on aquaticbirds in the Sado Estuary, Portugal
Habitat Distance (m) N Mean area (ha) ± SD Total area (ha)
Rice paddy fields <500 6 2.7 ± 1.4 16.6
>500 5 4.0 ± 1.5 19.9
Intertidal mudflats <500 3 0.7 ± 0.1 2.2
>500 2 0.9 ± 0.3 1.7
Salt pans <500 2 3.2 ± 0.9 6.4
>500 4 4.5 ± 2.0 18.0
(26 weeks in 2013–2015), the number of trains using the railway increased from26 ± 4 [SD] trains/day in 2013 to 34 ± 6 trains/day in 2015, and they mostlycrossed the line (70%) during the day. The railway is bordered by habitats used bywetland birds, including mainly rice paddy fields, salt pans and intertidal mudflats.Rice paddy fields are particularly important foraging habitats in autumn and winter,outside the crop growing season, when they are partly flooded and occupied bystubbles, which may be used by black-tailed godwits and a number of herons,egrets, ibis, waders and waterfowl species (Fasola and Ruiz 1996; Lourenço andPiersma 2009). Salt pans are also artificial habitats of utmost importance for wet-land birds in the Mediterranean region, as they provide important foraging groundsand critical high-tide roost for species foraging mainly on intertidal areas(Paracuellos et al. 2002; Dias et al. 2006). Finally, intertidal flats are critical for-aging habitats for waders and some waterfowl species, which in the Mediterraneanregion are mainly used by wintering birds, and as stopovers during the autumn andspring migration periods (Moreira 1999; Granadeiro et al. 2007). In late spring andsummer these habitats tend to be much less used by wetland birds, although theyare still important for a few breeding species, such as the purple heron Ardeapurpurea and black-winged stilt Himantopus himantopus.
We counted birds in 11 wetland sectors close to (0–500 m) and 11 sectors farfrom (500–1500 m) the railway line between December 2012 and October 2015.These sectors were selected to encompass the variety of habitats represented in thestudy area (Table 11.1), including intertidal mudflats (3.9 ha), rice paddy fields(36.5 ha), and salt pans (24.4 ha). We tried to balance the number and area ofhabitat types per distance category, but this was only partially achieved due to thelocal distribution of habitats around the railway bridge (Fig. 11.1). To minimize thisproblem, we reported and analyzed the data in terms of bird densities, rather thanusing absolute counts.
In each of the three study years, counts were made during two months in each ofthe winter, spring, summer and autumn seasons. In each month, counts were carriedout both at low and high tide, between two hours before and two hours after peaktide. This design was used to account for the movements of wetland birds duringthe tidal cycle between foraging and roosting areas, and among foraging areas (e.g.Dias et al. 2006). In each wetland sector, counts were made using the “scanningmethod,” beginning in the plot limit and sequentially covering the entire plot, and
182 C. Godinho et al.

thus minimizing double counts (Bibby et al. 2005). We did not carry out counts ondays with adverse weather conditions, such as heavy rain and strong winds.
We used Generalized Linear Mixed Models (GLMM; Zuur et al. 2009) toevaluate how species richness and wetland bird densities varied in relation to therailway line. In order to model species’ richness, we used Poisson errors and a loglink, while the modelling of bird densities was done on log-transformed data usingGaussian errors and the identity link (Zuur et al. 2009). As fixed effects, we useddichotomous variables coding the distance to the railway line (<500 vs. >500 m)and the stage of the tidal cycle (low vs. high tide), and the interaction between them.We considered random effects on the intercept, including as factors the sector, thesampling month, and the sampling year. Models were fit using the package lmer(Bates et al. 2015) for the R software 3.2.2 (R Core Team 2015).
Results
Wetland Bird Assemblages
Overall, we counted 32,647 individuals of 46 wetland bird species during thesurveys (“Annex”). The most abundant species accounted for 71% of the birds
Fig. 11.1 Map of the study area in the Sado Estuary (Portugal), showing the location of thesectors close to (0–500 m) and far from (500–1500 m) the railway, where wetland birds werecounted between December 2012 and October 2015
11 Assessing Bird Exclusion Effects in a Wetland Crossed … 183

observed, and included black-headed gull Chroicocephalus ridibundus (21.9% ofbirds observed), greater flamingo Phoenicopterus roseus (20.7%), northern shov-eler A. clypeata (10.0%), black-tailed godwit (9.6%) and lesser black-backed gullLarus fuscus (9.3%). Many more birds were recorded in autumn (47.3%) and winter(22.0%), than in spring (11.9%) and summer (18.8%). This pattern of seasonaloccurrence was also observed for the most abundant species, except in the case offlamingos, which were mainly recorded in winter and spring, and godwits, whichpeaked in autumn and summer.
The distribution of birds was highly concentrated, with about 76% of individualscounted on just eight of the 22 plots surveyed. Many more birds were counted in thetanks of salt pans (64.5%), than in either rice fields (27.2%) or intertidal areas(8.4%). This pattern was also found for most individual species, although therewere also several species with peak counts (>75% of observations) in rice fields(e.g. cattle egret Bubulcus ibis, purple heron, white stork Ciconia ciconia, blackstork C. nigra, glossy ibis Plegadis falcinellus, and lapwing Vanellus vanellus).Only a few species were most counted (>50%) in intertidal areas, including mallardA. platyrhynchos, grey plover Pluvialis squatarola, common sandpiper Actitishypoleucos, and whimbrel Numenius phaeopus.
Effects of Distance to Railway
There were no statistically significant effects of distance to railway on speciesrichness, total bird abundance and the abundance of the 12 most abundant species(overall counts >500 individuals) (Table 11.2). The observed patterns of bird dis-tribution in relation to the railway varied markedly across species, and for each itoften varied in relation to the tidal cycle and the season (Fig. 11.2). For instance,black-headed gull densities were highest close to the railway in winter, both at lowand high tides, while in both autumn and summer, densities were highest far from therailway, particularly at high tide. Also, the densities of the shoveler were highestclose to the railway in autumn irrespective of tide, and in winter at low tide, while thereverse was found in winter at high tide. A comparable variation in relation to tidewas found for pied avocets Recurvirostra avosetta, which in autumn, showed thehighest densities close to the railway at low tide, and far from the railway at high tide.In white storks, densities in autumn and winter were always higher close to therailway, while the reverse was found in summer, irrespective of the tidal cycle. Otherspecies had more consistent patterns, albeit not statistically significant, with largerdensities tending to be found either close to (e.g. flamingo, dunlin Calidris alpina) orfar from (e.g. godwit, great cormorant Phalacrocorax carbo) the railway.
Discussion
The bird assemblages recorded around the railway line crossing the upper SadoEstuary were comparable to those occurring in other coastal wetlands in Portugal,including a diversity of species such as herons, egrets, ibis, flamingos, gulls, waders,
184 C. Godinho et al.
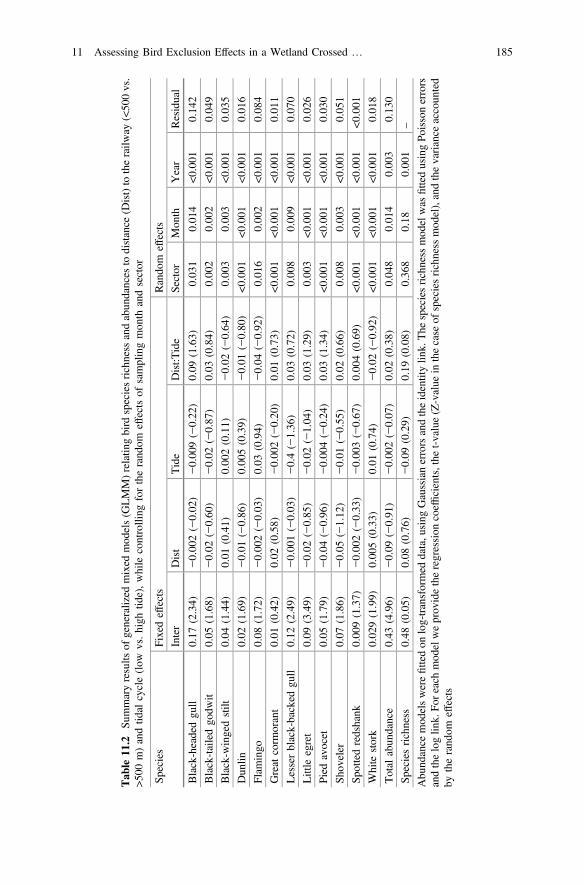
Tab
le11
.2Su
mmaryresults
ofgeneralized
mixed
mod
els(G
LMM)relatin
gbird
speciesrichness
andabun
dances
todistance
(Dist)to
therailw
ay(<50
0vs.
>500
m)andtid
alcycle(low
vs.high
tide),while
controlling
fortherand
omeffectsof
samplingmon
thandsector
Species
Fixedeffects
Rando
meffects
Inter
Dist
Tide
Dist:T
ide
Sector
Mon
thYear
Residual
Black-headedgu
ll0.17
(2.34)
−0.00
2(−0.02
)−0.00
9(−0.22
)0.09
(1.63)
0.03
10.01
4<0
.001
0.14
2
Black-tailedgo
dwit
0.05
(1.68)
−0.02
(−0.60
)−0.02
(−0.87
)0.03
(0.84)
0.00
20.00
2<0
.001
0.04
9
Black-w
ingedstilt
0.04
(1.44)
0.01
(0.41)
0.00
2(0.11)
−0.02
(−0.64
)0.00
30.00
3<0
.001
0.03
5
Dun
lin0.02
(1.69)
−0.01
(−0.86
)0.00
5(0.39)
−0.01
(−0.80
)<0
.001
<0.001
<0.001
0.01
6
Flam
ingo
0.08
(1.72)
−0.00
2(−0.03
)0.03
(0.94)
−0.04
(−0.92
)0.01
60.00
2<0
.001
0.08
4
Great
corm
orant
0.01
(0.42)
0.02
(0.58)
−0.00
2(−0.20
)0.01
(0.73)
<0.001
<0.001
<0.001
0.01
1
Lesserblack-backed
gull
0.12
(2.49)
−0.00
1(−0.03
)−0.4(−1.36
)0.03
(0.72)
0.00
80.00
9<0
.001
0.07
0
Little
egret
0.09
(3.49)
−0.02
(−0.85
)−0.02
(−1.04
)0.03
(1.29)
0.00
3<0
.001
<0.001
0.02
6
Pied
avocet
0.05
(1.79)
−0.04
(−0.96
)−0.00
4(−0.24
)0.03
(1.34)
<0.001
<0.001
<0.001
0.03
0
Shov
eler
0.07
(1.86)
−0.05
(−1.12
)−0.01
(−0.55
)0.02
(0.66)
0.00
80.00
3<0
.001
0.05
1
Spottedredshank
0.00
9(1.37)
−0.00
2(−0.33
)−0.00
3(−0.67
)0.00
4(0.69)
<0.001
<0.001
<0.001
<0.001
White
stork
0.02
9(1.99)
0.00
5(0.33)
0.01
(0.74)
−0.02
(−0.92
)<0
.001
<0.001
<0.001
0.01
8
Total
abun
dance
0.43
(4.96)
−0.09
(−0.91
)−0.00
2(−0.07
)0.02
(0.38)
0.04
80.01
40.00
30.13
0
Speciesrichness
0.48
(0.05)
0.08
(0.76)
−0.09
(0.29)
0.19
(0.08)
0.36
80.18
0.00
1–
Abu
ndance
mod
elswerefittedon
log-transformed
data,u
sing
Gaussianerrorsandtheidentitylin
k.The
speciesrichness
mod
elwas
fittedusingPo
issonerrors
andtheloglin
k.Fo
reach
mod
elweprov
idetheregression
coefficients,the
t-value(Z-value
inthecase
ofspeciesrichness
mod
el),andthevariance
accoun
ted
bytherand
omeffects
11 Assessing Bird Exclusion Effects in a Wetland Crossed … 185

and waterfowl (Lourenço et al. 2009; Alves et al. 2011). Also, the temporal patternsof species’ composition were similar to those of other wetlands, with diversity andabundance of most species peaking during the autumn and, to a lesser extent, springmigration periods, and in winter. There was no evidence that the spatial patterns ofbird assemblages were affected by proximity to the railway, with species richnessand abundances not showing significant differences in areas close to and far from therailway. Although higher densities of some species were recorded far from therailway on some occasions, there was no consistent pattern due to strong variationacross species and seasons, and through the tidal cycle. Overall, we could find nonoticeable exclusion effects of this railway line on wetland birds, which is in line
Fig. 11.2 Variation in mean densities (birds/ha) of the most abundant wetland birds counted insectors close to (<500 m) and far from (>500 m) the railway line, in relation to season and level ofthe tidal cycle
186 C. Godinho et al.

with some of the few studies addressing the same issue (Owens 1977, and Chap. 16),but in contrast with another study (Waterman et al. 2002).
Although our study had some limitations and potential shortcomings, it isunlikely that they significantly affected our key conclusions. The main problem isthat no information on abundances and bird spatial distribution was available for theperiod before the construction of the railway line. Because of this, it was impossibleto carry out a proper BACI study, which would be essential to fully demonstratewhether or not there were any significant impacts (e.g. Tarr et al. 2010).Nevertheless, our results are still useful to suggest that wetland bird abundances atpresent are not lower at <500 m from the railway than elsewhere in the estuary,though they cannot be used to make comparisons in relation to the situation beforethe construction of the railway. Another problem is that our study focused only onspecies richness and densities, although there might be more subtle impacts due, forinstance, to changes in vigilance and feeding activity close to the railway (e.g.Yasué 2006). Although this issue was not dealt with in our study, non-systematicobservations of 55 individuals of 18 species did not provide any evidence that birdsare more alert close to than there are far from the railway. Finally, we considered arelatively wide area to represent proximity to the railway (<500 m), althoughexclusion effects may only be apparent at shorter distances from disturbance. Thiswas a constraint required to obtain sufficiently large sample sizes, but observationsduring the study period suggest that this was not serious because large bird con-centrations were often recorded very close to the railway.
The lack of obvious avoidance responses observed in our study may be aconsequence of wetland birds tolerating well or eventually adapting behaviourallyto human structures and vehicles such as circulating trains, and thus largelyignoring these potential sources of disturbances when selecting foraging and
Fig. 11.2 (continued)
11 Assessing Bird Exclusion Effects in a Wetland Crossed … 187

roosting habitats. Studies addressing this hypothesis are scarce, but there is somesupportive evidence. For instance, a study showed that the displacement effects ofwind farms on pink-footed geese Anser brachyrhynchus occurred over relativelyshort distances (<150 m), and that the negative effects declined markedly in the 10years after wind farm construction (Madsen and Boertmann 2008). Also,Donaldson et al. (2007) found that waterbirds were more tolerant of human pres-ence in developed than in undeveloped sites, probably reflecting some level ofbehavioural adaptation to potential anthropogenic disturbance (see also Lowry et al.2013). In contrast to these studies, however, in Chap. 12, Múrias and colleagues, ina study akin to a BACI design, reported significantly lower shorebird abundances insaltpans close to a new railway that had recently begun to operate. Another study byBurton et al. (2002) reported reduced wader abundances in relation to footpaths,roads and railroads, although this greatly varied across species and human struc-tures. Together, these studies suggest that the exclusion effects of railways onwetland birds may be small in some cases but not in others, and thus drawinggeneralities would require a larger number of studies covering a wide range ofsocio-ecological contexts.
Although our study did not find obvious negative effects, the densities of somespecies were sometimes higher far from (or close to) the railway, although this wasnot statistically significant and there were inconsistencies across species, seasons,and stages of the tidal cycle. Reasons for this are not certain, but they may be aconsequence of spatial and temporal variations in habitat requirements and qualityfor foraging and roosting, rather than reflecting negative (or positive) effects of therailway. It is well known that waders and other aquatic birds undertake dailymovements between foraging and roosting habitats, which are jointly affected bythe circadian and tidal cycles, and which induce great variations in bird spatialdistributions in estuaries and other wetlands (Dias et al. 2006; Granadeiro et al.2006). Also, there are changes in the use of habitats through the annual cycle, duefor instance, to differences in habitat selection between wintering and migratingbirds (Martins et al. 2016), or temporal changes in habitat quality (Lourenço et al.2009). These factors may underlie, for instance, the observation of avocets con-centrating at high densities in intertidal mudflats close to the railway at low tide inautumn, but not in winter, while at high tide they were mainly found in a single saltpan far from the railway in both autumn and winter. Conversely, dunlins werefound concentrated in a single salt pan close to the railway in winter at high tide,while at low tide during the same season they were mostly counted in intertidalareas close to the railway and in a salt pan far from the railway. Overall, theseresults suggest that care should be taken when evaluating the effects of railways onwetland birds, due to the confounding effects resulting from species-specific habitatrequirements and preferences, the availability and quality of habitats, and thechanges in these factors over the seasonal, circadian, and tidal cycles.
Acknowledgements We would like to thank to Pedro Salgueiro and Luís Gomes for their supportin field work. This study was supported by Infraestruturas de Portugal with the contribution of thePortuguese Science Foundation through the Doctoral Grant SFRH/BD/81602/2011 (CarlosGodinho) doctoral grant.
188 C. Godinho et al.

Ann
ex
Wetland
birdscountedin
thestudyarea
(SadoEstuary,Po
rtugal)betweenDecem
ber2012
andOctober
2015.Fo
reach
specieswe
presentthe
numberof
birdscountedperseason,in11
sectorscloseto
(<500m)and11
sectorsfarfrom
(>500m)arailw
aylin
e.We
also
presentthe
proportio
nof
birdscountedin
each
ofthethreemainhabitatsrepresentedin
thestudyarea:ricefields
(rice),intertid
almud
flats(intertid
al)andsaltpans
(tanks).
Species
Winter
Autum
nSp
ring
Summer
Total
Habitat
<500
m>5
00m
<500
m>5
00m
<500
m>5
00m
<500
m>5
00m
Rice
(%)
Intertidal
(%)
Tank
(%)
Com
mon
sheldu
ckTa
dornatado
rna
6520
207
1512
77
93
Ruddy
sheldu
ckTa
dorna
ferruginea
22
100
Mallard
Ana
splatyrhynchos
142
66
2737
546
278
967
24
Gadwall
Ana
sstrepera
22
100
Northernshoveler
Ana
sclypeata
490
585
1289
747
166
3277
496
Eurasianteal
Ana
screcca
11
100
Black-necked
grebe
Pod
iceps
nigricollis
105
2920
451
200
397
Little
grebe
Tachybap
tus
ruficollis
6194
939
72
212
199
Great
corm
orant
Pha
lacrocorax
carbo
1952
814
82
6275
93
97
Western
cattle
egret
Bub
ulcusibis
714
1361
103
6032
048
893
16
Little
egret
Egretta
garzetta
3850
9625
425
5110
316
778
464
1125
(con
tinued)
11 Assessing Bird Exclusion Effects in a Wetland Crossed … 189

(con
tinued)
Species
Winter
Autum
nSp
ring
Summer
Total
Habitat
<500
m>5
00m
<500
m>5
00m
<500
m>5
00m
<500
m>5
00m
Rice
(%)
Intertidal
(%)
Tank
(%)
Great
egret
Casmerodius
albu
s6
101
136
3664
333
Greyheron
Ardea
cinerea
5848
4951
98
2642
291
6215
22
Purple
heron
Ardea
purpurea
29
1110
0
White
stork
Cicon
iaciconia
9030
201
190
17
1788
624
7525
Black
stork
Cicon
ianigra
33
100
Glossyibis
Plega
dis
falcinellus
116
126
030
407
100
0
Eurasianspoonb
illPlatalea
leucorod
ia18
4250
9716
1010
4428
718
1864
Greater
flamingo
Phoenicopterus
roseus
261
343
2061
843
1776
741
235
484
6744
330
67
Eurasiancoot
Fulicaatra
44
100
Com
mon
moo
rhen
Gallin
ula
chloropus
22
410
0
Pied
avocet
Recurvirostra
avosetta
1470
117
139
3815
51
534
132
67
Black
-winged
Stilt
Himan
topu
shiman
topu
s8
720
198
117
696
594
1541
204
76
Com
mon
ring
edplov
erCharadrius
hiaticula
341
11
845
4431
24
Kentishplov
erCharadrius
alexan
drinus
192
56
148
5437
954
Greyplov
erPluvialis
squatarola
3767
81
113
1454
32
Northernlapw
ing
Vanellusvanellu
s82
3211
410
0(con
tinued)
190 C. Godinho et al.

(con
tinued)
Species
Winter
Autum
nSp
ring
Summer
Total
Habitat
<500
m>5
00m
<500
m>5
00m
<500
m>5
00m
<500
m>5
00m
Rice
(%)
Intertidal
(%)
Tank
(%)
Sand
erlin
gCalidrisalba
11
24
100
Dun
linCalidrisalpina
470
9613
2814
621
725
23
Curlew
sand
piper
Calidris
ferruginea
22
100
Green
sand
piper
Tringa
ochrop
us13
74
22
222
5277
1212
Com
mon
sandpiper
Actitis
hypoleucos
2515
44
41
57
6523
6611
Spottedredshank
Tringa
erythrop
us11
816
113
643
15
3914
261
1093
815
77
Com
mon
Redshank
Tringa
totanus
46
16
3148
1823
59
Com
mon
greenshank
Tringa
nebularia
222
132
410
368
411
34
789
Black-tailed
God
wit
Limosalim
osa
1123
7437
025
331
402
890
Whimbrel
Num
enius
phaeop
us1
110
0
Com
mon
snipe
Gallin
ago
gallinago
122
27
2310
0
Ruff
Philomachu
spu
gnax
171
1028
100
Black-headed
Gull
Larusridibund
us16
4951
247
824
5695
189
356
1417
7152
2014
66
Yellow-legged
Gull
Larusmichahellis
11
100
Larusfuscus
256
249
733
1555
136
674
2030
2063
730
(con
tinued)
11 Assessing Bird Exclusion Effects in a Wetland Crossed … 191

(con
tinued)
Species
Winter
Autum
nSp
ring
Summer
Total
Habitat
<500
m>5
00m
<500
m>5
00m
<500
m>5
00m
<500
m>5
00m
Rice
(%)
Intertidal
(%)
Tank
(%)
Lesser
Black-backed
Gull
Little
tern
Sternu
laalbifrons
1616
100
Sand
wichtern
Sterna
sandvicensis
75
1210
0
Com
mon
tern
Sterna
hirundo
22
100
Caspian
tern
Hydroprogne
caspia
13
410
0
Sterna
spp.
22
100
Unidentified
31
75
117
1218
71
Anasspp.
120
1413
490
10
Charadriusspp.
21
367
33
Calidrisspp.
22
100
Tringa
spp.
215
929
193
149
397
Larusspp.
11
100
192 C. Godinho et al.

References
Alves, J. A., Dias, M., Rocha, A., Barreto, B., Catry, T., Costa, H., et al. (2011). Monitorização daspopulações de aves aquáticas dos estuários do Tejo, Sado e Guadiana. Relatório do ano de2010. Anuário Ornitológico (SPEA), 8, 118–133.
Bates, D., Maechler, M., Bolker, B., & Walker, S. (2015). Fitting linear mixed-effects modelsusing lme4. Journal of Statistical Software, 67, 1–48.
Bibby, C. J., Burgess, N. D., Hill, D. A., Mustoe, S. H. (2005). Bird census techniques (2nd ed.).London: Elsevier Academic Press.
Burton, N. H., Armitage, M. J., Musgrove, A. J., & Rehfisch, M. M. (2002). Impacts of man-madelandscape features on numbers of estuarine waterbirds at low tide. EnvironmentalManagement, 30, 0857–0864.
Carvalho, F., Carvalho, R., Mira, A., & Beja, P. (2016). Assessing landscape functionalconnectivity in a forest carnivore using path selection functions. Landscape Ecology, 31, 1021–1036.
D’Amico, M., Périquet, S., Román, J., & Revilla, E. (2016). Road avoidance responses determinethe impact of heterogeneous road networks at a regional scale. Journal of Applied Ecology, 53,181–190.
DeFries, R. S., Ellis, E. C., Chapin, F. S., Matson, P. A., Turner, B. L., Agrawal, A., et al. (2012).Planetary opportunities: A social contract for global change science to contribute to asustainable future. BioScience, 62, 603–606.
Dias, M. P., Granadeiro, J. P., Lecoq, M., Santos, C. D., & Palmeirim, J. M. (2006). Distance tohigh-tide roosts constrains the use of foraging areas by dunlins: Implications for themanagement of estuarine wetlands. Biological Conservation, 131, 446–452.
Donaldson, M. R., Henein, K. M., & Runtz, M. W. (2007). Assessing the effect of developedhabitat on waterbird behaviour in an urban riparian system in Ottawa, Canada. UrbanEcosystems, 10, 139–151.
Fasola, M., & Ruiz, X. (1996). The value of rice fields as substitutes for natural wetlands forwaterbirds in the Mediterranean region. Colonial Waterbirds, 19, 122–128.
Forman, R. T., & Deblinger, R. D. (2000). The ecological road-effect zone of a Massachusetts(USA) suburban highway. Conservation Biology, 14, 36–46.
Gosh, S., Kim, K., & Bhattacharya, R. (2010). A survey on house sparrow population decline atBandel, West Bengal, India. Journal Korean Earth Science Society, 31, 448–453.
Granadeiro, J. P., Dias, M. P., Martins, R. C., & Palmeirim, J. M. (2006). Variation in numbers andbehaviour of waders during the tidal cycle: Implications for the use of estuarine sediment flats.Acta Oecologica, 29, 293–300.
Granadeiro, J. P., Santos, C. D., Dias, M. P., & Palmeirim, J. M. (2007). Environmental factorsdrive habitat partitioning in birds feeding in intertidal flats: Implications for conservation.Hydrobiologia, 587, 291–302.
Kleijn, D., Cherkaoui, I., Goedhart, P. W., van der Hout, J., & Lammersma, D. (2014). Waterbirdsincrease more rapidly in Ramsar-designated wetlands than in unprotected wetlands. Journal ofApplied Ecology, 51, 289–298.
Li, Z., Ge, C., Li, J., Li, Y., Xu, A., Zhou, K., et al. (2010). Ground-dwelling birds near theQinghai-Tibet highway and railway. Transportation Research Part D, 15, 525–528.
Loss, S. R., Will, T., & Marra, P. P. (2015). Direct mortality of birds from anthropogenic causes.Annual Review of Ecology Evolution and Systematics, 46, 99–120.
11 Assessing Bird Exclusion Effects in a Wetland Crossed … 193

Lourenço, P. M., Groen, N., Hooijmeijer, J. C. E. W., & Piersma, T. (2009). The rice fields aroundthe estuaries of the Tejo and Sado are a critical stopover area for the globally near-threatenedblack-tailed godwit Limosa l. limosa: Site description, international importance andconservation proposals. Airo, 19, 19–26.
Lourenço, P. M., & Piersma, T. (2009). Waterbird densities in South European rice fields as afunction of rice management. Ibis, 151, 196–199.
Lowry, H., Lill, A., & Wong, B. (2013). Behavioural responses of wildlife to urban environments.Biological Reviews, 88, 537–549.
Madsen, J., & Boertmann, D. (2008). Animal behavioral adaptation to changing landscapes:Spring-staging geese habituate to wind farms. Landscape Ecology, 23, 1007–1011.
Martins, R. C., Catry, T., Rebelo, R., Pardal, S., Palmeirim, J. M., & Granadeiro, J. P. (2016).Contrasting estuary-scale distribution of wintering and migrating waders: The potential role offear. Hydrobiologia, 768, 211–222.
Millennium Ecosystem Assessment. (2005). Ecosystems and human well-being: Wetlands andwater synthesis. Washington, DC, USA: World Resources Institute.
Moreira, F. (1999). On the use by birds of intertidal areas of the Tagus estuary: Implications formanagement. Aquatic Ecology, 33, 301–309.
Mundahl, N. D., Bilyeu, A. G., & Maas, L. (2013). Bald Eagle Nesting Habitats in the UpperMississippi River National Wildlife and Fish Refuge. Journal of Fish and WildlifeManagement, 4, 362–376.
Owens, N. W. (1977). Responses of wintering brent geese to human disturbance. Wildfowl, 28, 5–14.
Paracuellos, M., Castro, H., Nevado, J. C., Oña, J. A., Matamala, J. J., García, L., et al. (2002).Repercussions of the abandonment of Mediterranean saltpans on waterbird communities.Waterbirds, 25, 492–498.
R Core Team. (2015). R: A language and environment for statistical computing. Austria: RFoundation for Statistical Computing.
Santos, S. M., Mira, A., Salgueiro, P. A., Costa, P., Medinas, D., & Beja, P. (2016). Aviantrait-mediated vulnerability to road traffic collisions. Biological Conservation, 200, 122–130.
Seto, K. C., Güneralp, B., & Hutyra, L. R. (2012). Global forecasts of urban expansion to 2030and direct impacts on biodiversity and carbon pools. Proceedings of the National Academy ofSciences, 109, 16083–16088.
Tarr, N. M., Simons, T. R., & Pollock, K. H. (2010). An experimental assessment of vehicledisturbance effects on migratory shorebirds. The Journal of Wildlife Management, 74, 1776–1783.
Tittensor, D. P., Walpole, M., Hill, S. L., Boyce, D. G., Britten, G. L., Burgess, N. D., et al.(2014). A mid-term analysis of progress toward international biodiversity targets. Science, 346,241–244.
Torres, A., Jaeger, J. A., & Alonso, J. C. (2016). Assessing large-scale wildlife responses to humaninfrastructure development. Proceedings of the National Academy of Sciences, 113, 8472–8477.
van der Ree, R., Smith, D. J., & Grilo, C. (2015). Handbook of Road Ecology. Hoboken: Wiley.Ware, H. E., McClure, C. J., Carlisle, J. D., & Barber, J. R. (2015). A phantom road experiment
reveals traffic noise is an invisible source of habitat degradation. Proceedings of the NationalAcademy of Sciences, 112, 12105–12109.
Waterman, E., Tulp, I., Reijnen, R., Krijgsveld, K., & Braak, C. (2002). Disturbance of meadowbirds by railway noise in The Netherlands. Geluid, 1, 2–3.
194 C. Godinho et al.

Wiącek, J., Polak, M., Filipiuk, M., Kucharczyk, M., & Bohatkiewicz, J. (2015). Do birds avoidrailroads as has been found for roads? Environmental Management, 56, 643–652.
Yasué, M. (2006). Environmental factors and spatial scale influence shorebirds’ responses tohuman disturbance. Biological Conservation, 128, 47–54.
Zuur, A. F., Leno, E. N., Walker, N. J., Saveliev, A. A., & Smith, G. M. (2009). Mixed effectsmodels and extensions in ecology with R. New York: Springer.
Open Access This chapter is licensed under the terms of the Creative Commons Attribution 4.0International License (http://creativecommons.org/licenses/by/4.0/), which permits use, sharing,adaptation, distribution and reproduction in any medium or format, as long as you give appropriatecredit to the original author(s) and the source, provide a link to the Creative Commons license andindicate if changes were made.The images or other third party material in this chapter are included in the chapter’s Creative
Commons license, unless indicated otherwise in a credit line to the material. If material is notincluded in the chapter’s Creative Commons license and your intended use is not permitted bystatutory regulation or exceeds the permitted use, you will need to obtain permission directly fromthe copyright holder.
11 Assessing Bird Exclusion Effects in a Wetland Crossed … 195

Chapter 12Evaluating the Impacts of a New Railwayon Shorebirds: A Case Study in CentralPortugal (Aveiro Lagoon)
Tiago Múrias, David Gonçalves and Ricardo Jorge Lopes
Abstract In 2007, the Portuguese Railway Company (REFER) began to build anew railway connecting the commercial port of Aveiro (Central Portugal) to thenational rail network, which extended for about 9 km and crossed three of theremaining saltpans of the Aveiro Lagoon through a viaduct. Due to the importanceof these habitats for shorebirds, and because the railway crossed a Natura 2000 site,the national biodiversity conservation authority required the impact assessment ofthis infrastructure. The study extended from 2006 (pre-construction), through 2008and 2009 (construction), to 2011 (post-construction), encompassing four breedingand four wintering seasons. We used a Before-After-Control-Impact (BACI)design, with three impacted (those under the viaduct) and six control saltpans.During the breeding season (April–July) we monitored the numbers and breedingparameters of Black-winged stilt (Himantopus himantopus), and the numbers ofKentish plover (Charadrius alexandrinus) and Little tern (Sterna albifrons). In thewinter, we monitored the numbers and spatial distribution of all shorebirds, and theactivity of Dunlin (Calidris alpina). There was evidence for reductions in theabundance of the three breeding species in impacted saltpans in 2011, while nosignificant negative effects were found on abundances during 2008–2009 and on thebreeding parameters of Black-winged Stilt. There was also evidence for reductionsin wintering shorebird abundances in impacted saltpans in 2011, with no significanteffects on abundances in 2008–2009, and on shorebird spatial distribution andactivity patterns. Overall, the results suggest that the operation of a new railwayclose to important wetland habitats had negative impacts on the abundance ofbreeding and wintering shorebirds.
T. Múrias � D. Gonçalves � R.J. Lopes (&)CIBIO/InBIO, Centro de Investigação em Biodiversidade e Recursos Genéticos,Universidade do Porto, Campus Agrário de Vairão, Rua Padre Armando Quintas,4485-661 Vairão, Portugale-mail: [email protected]
D. GonçalvesDepartamento de Biologia, Faculdade de Ciências, Universidade do Porto,Rua do Campo Alegre, 4169-007 Porto, Portugal
© The Author(s) 2017L. Borda-de-Água et al. (eds.), Railway Ecology,DOI 10.1007/978-3-319-57496-7_12
197

Keywords Shorebirds � Wetlands � Saltpans � Impact � Railway
Introduction
The assessment of ecological effects on habitats and species of the construction andposterior operation of railways is still in its infancy when compared with otherhuman-made infrastructures, like such as roads or powerlines, as largely stressed inChap. 1. Although mortality is the most obvious and direct ecological effect of rail-ways (as with other linear structures), the railways may also have indirecteffects-namely as barriers for wildlife (Chap. 4), as vectors for the transport of alienspecies (Chap. 5), and as sources of disturbance (Chap. 6). In this book, most exam-ples refer to railways on land or aquatic inland ecosystems (e.g. lakes, rivers), which israther logical, since for the most part, railway lines are built overland. However, theymay also impact non-terrestrial habitats (and associated species), when they are built inor near commercial ports. These are almost invariably located on estuaries, one of themost sensible ecosystems in terms of functioning and conservation, and critical for theconservation of many bird species (McLusky and Elliott 2004).
The eventual negative impacts of railways in estuarine systemsmay be particularlyrelevant for shorebirds and related species (Charadriiformes), which are among thebirds of highest conservation concern (InternationalWader StudyGroup 2003; van deKamp et al. 2004), due to their migratory status, feeding specialization, and, as aresult, dependency on a limited set of areas for breeding, staging, and wintering(McLusky and Elliott 2004). Most of these species are very dependent on estuarinehabitats and neighboring inland wetlands, as saltmarshes (Prater 1981) and, insouthern Europe, also saltpans (Luís et al. 2002; Masero 2003; Múrias et al. 1997;Rufino et al. 1984). Therefore, it is important to assess the impacts of railways on thisgroup of species, thereby allowing the development of adequate mitigation measures.
Portugal is one of the countries in southern Europe that holds internationalimportant wetlands for shorebirds, and where the development of railway networksto serve harbors can impact on estuarine and other coastal habitats. In these wet-lands, saltpans appear to play an important role for shorebird conservation, as theyare used both as refuges for sheltering at high tides, and as foraging habitats,especially when the mudflats are covered. Therefore, saltpans provide importantsources of supplementary energy for birds, particularly during the demandingmigratory periods and in winter (Dias et al. 2014; Lopes et al. 2005; Múrias et al.2002; Rufino et al. 1984). Moreover, saltpans provide suitable breeding locations topopulations of some shorebird species, such as Black-winged Stilt Himantopushimantopus, Kentish plover Charadrius alexandrinus, Redshank Tringa tetanusand Little tern Sterna albifrons (Fonseca et al. 2005; Jardim 1984; Múrias et al.1997; Rufino and Araújo 1987). For the Black-winged stilt they even represent themost important breeding areas in Portugal (Rufino and Neves 1992).
Despite their importance for shorebirds, saltpans in Portugal are fast disap-pearing due to abandonment or conversion to aquaculture. As a result, only a few
198 T. Múrias et al.

artisanal and industrial salt works still persist in the wetlands of Aveiro, Mondego,Tagus, and Sado estuaries, along the western coast of the country, as well as inwetlands along the southern coast of Algarve. According to figures from the mostrecent national census in 2015, there were only 73 saltpans in the whole country,which produced a total of 117 tons of salt (INE 2016). Once a thriving industry inthe majority of the estuaries and coastal lagoons of the Portuguese coast, the marinesalt extraction declined with the onset of new food conservation technologies andthe reduction or abandonment of the once-prosperous long-range fishing fleet,particularly since the early 1960s (Rodrigues et al. 2011; Vieira and Bio 2014).
In this chapter, we provide a case study developed in the coastal lagoon ofAveiro (Ria de Aveiro), evaluating the response of shorebirds using saltpans to theimpacts associated with the construction and operation of a new railway, bothduring the breeding and the wintering seasons. Under this scope, our specificobjectives were to evaluate whether the railway affected (a) the numbers of the mainbreeding shorebirds (Black-winged Stilt, Kentish plover and Little tern); (b) thephenology and breeding success of Black-winged Stilt; and (c) the numbers, dis-tribution, and activity of wintering shorebirds.
Methodology
Study Area
The study was carried out in Ria de Aveiro (Fig. 12.1), which is a complex lagoonsystem located in western Portugal at the mouth of the Vouga River that covers anarea of approximately 450 km2. For centuries, marine salt extraction occupied a largepart of this system (Bastos 2009; Rodrigues et al. 2011). By the early 1970s, therewere still some 270 saltpans (1160 ha), but in subsequent decades, most of thesesaltpans were abandoned, flooded, and/or converted for other purposes (e.g., aqua-culture production), with only nine saltpans (56 ha) persisting in 2007 (Bastos 2009;Rodrigues et al. 2011). In contrast, a busy trading and fishing harbor has grown in thelast few decades, particularly since it was linked by a highway to the Spanish border.To connect the harbor to the national rail network, a new railroad connection about9 km long started to be built in 2007 (REFER 2009). The engineering and envi-ronmental problems faced by the project were challenging, because this was adensely populated area, and Ria de Aveiro is a wetland included in the Natura 2000network, established by the European Directive 92/43/EEC. Furthermore, the pro-posed rail path crossed important wetland areas, including eight of the last remaininguntransformed saltpans, and there were no technically viable alternatives. For thisreason, it was decided that the railway should cross the saltpans and adjoining areasthrough a 5.5 km viaduct, to minimize the loss of important shorebird habitats.Despite these efforts, three saltpans were directly affected by sustaining viaductpillars (Fig. 12.1), or the construction of a service road (REFER 2009).
12 Evaluating the Impacts of a New Railway on Shorebirds … 199

Fig. 12.1 a Map of the study area in Ria de Aveiro (Portugal), showing the location of the newrailway line and the saltpans that were impacted by the construction and functioning of the railway(blue) and the saltpans that were used as control sampling units (green). b Timeline of the differentphases, with photos of the same railway viaduct section, also showing one of the impacted saltpans
200 T. Múrias et al.

Study Design
The study was based on a Before-After-Control-Impact (BACI) designed to test forthe impacts of railway construction and operation in shorebirds using saltpans.Sampling was carried out on three time periods (Fig. 12.1) six years: one controlyear before the construction (2006); two years during the phase of construction(2008 and 2009); and one year in the post-construction (i.e., operation) phase(2011). Each “treatment” phase (i.e., construction and post-construction) wascompared with the control phase (i.e., pre-construction) using as sampling unitsthree impacted (those under the viaduct) and six control saltpans (Fig. 12.1). Thepresence of significant interactions between year and type of pond (i.e., control vs.impact) was understood to indicate significant railway impacts-either positive ornegative-depending on the sign of the interaction term. We used saltpans as sam-pling units because they were the most important shorebird habitats affected by theproject, and because they form discrete units where it is possible to make absolutecounts both of all birds and their nests. Moreover, they have easy access and theywere the only nesting areas used by shorebirds close to the railway corridor.Periodical winter counts in the surrounding saltmarshes did not reveal a substantialusage of these areas by shorebirds, with the exception of a small number of Dunlin(Calidris alpina) and common sandpiper (Actitis hypoleucos), which seemed to belargely insensitive to the construction of the pillars (personal observation).
We focused the impact assessment on breeding and wintering seasons, which arethe two most critical periods in the phenology of shorebirds. During the breedingseason (April–July), data were gathered from visits carried out at weekly intervalsto all saltpans. During the winter season (January–February) we made regular, butinterspersed visits (at least 1-week intervals) to all saltpans to obtain a suitablenumber of sampling occasions. In each sampling visit, selected parameters (seebelow) were estimated in all saltpans based on pre-established transects andobservation points, by a team of two researchers using binoculars and telescopes.Detailed maps of bird distribution in each saltpan were produced at each visit.
Statistical analysis was carried out in the R 3.2.6 statistical environment (R CoreTeam 2015), using packages lmer4 (Bates et al. 2015), glmmADMB (Fournier et al.2012), and lsmeans (Lenth 2016; Bates et al. 2015).
Evaluating Effects on Breeding Shorebirds
Shorebirds are mobile animals and can thus avoid potential impacts by movingaway from impacted saltpans (Cayford 1993). When they remain in the impactedsaltpans, however, they may still change their spatial distribution (individuals ornests), which may eventually affect their phenology or breeding success, throughreduced nest or chick survival (Sansom et al. 2016; Pearce-Higgins et al. 2007). Wetested these ideas by focusing on the three main breeding shorebird species:
12 Evaluating the Impacts of a New Railway on Shorebirds … 201

Black-winged Stilt, Kentish plover, and Little tern. A more detailed study was madeof the Black-winged Stilt, because it was the only species breeding on all saltpans inreasonable numbers, and it was the only one amenable to reliable surveys whileminimizing disturbances, due to the relatively large size and conspicuousness ofnests and chicks. Therefore, besides abundance, for this species we estimated forthis species the distribution of nests, phenology and breeding success (Fig. 12.2).Overall, we tested the following hypothesis:
1. The overall abundance of each breeding species should decrease in the impactedsaltpans.
2. The distribution of Black-winged Stilt nests should change within impactedsaltpans.
3. For the Black-winged Stilt, the (a) nesting phenology should be delayed, and(b) breeding success should be lower in impacted saltpans in comparison tocontrol saltpans.
Nests per week
Success
Nests
with eggsNests
with eclosion
Pulli
> 4 weeks
Breeding individuals
per saltpan
Phenology
Type of pond
1. Abundance 2. Nest distribution 3. Breeding parameters
Feeders
Evaporators
Crystallizers
Foraging Roosting
3. Activity
Wintering individuals
per saltpan
1. Abundance
Type of pond
Feeders
Evaporators
Crystallizers
2. Distribution
Bre
ed
ing
Win
teri
ng
Fig. 12.2 Outline of the sampling rationale and parameters collected to test for the impacts of anew railway on shorebirds breeding and wintering in saltpans of Ria de Aveiro (Portugal)
202 T. Múrias et al.

Breeding Shorebird Abundance
For the three focal species, we recorded the number of individuals per saltpan on aweekly basis during the breeding season. We tested for the effects of time (year) andtype of saltpan (impacted vs. control) on the weekly number of individuals usingGLMM with negative binomial distribution, controlling for overdispersion(Crawley 2013). The saltpan and the week of census were used as random factors.An offset variable was always specified to account for variation in the area (hec-tares) of the saltpans. The models’ fitness was assessed graphically (residualsinspection), and they were compared with null models to test their significance(Zuur et al. 2009).
Spatial Distribution of Black-Winged Stilt Nests
Each saltpan was divided into three pond categories (feeders, evaporators, andcrystallizers), according to their position, size, and microhabitat characteristics,such as water level (Rodrigues et al. 2011). Black-winged stilt nests are not dis-tributed randomly among these categories (Tavares et al. 2008), and we expectedthat the disturbance caused by the construction and operation of the railway wouldaffect the distribution of nests. For this reason, we recorded the spatial distributionof all Black-winged stilt nests according to type of pond. We then tested fordifferences in the number of nests and the type of pond, time of year, and type ofsaltpan (impacted vs. control) using a GLMM with a negative binomial distribution,controlling for overdispersion and saltpan area (Crawley 2013), and specifying thesaltpan and week of visit as random factors.
Black-Winged Stilt Nest Phenology and Breeding Success
Black-winged stilts incubate 3–4 eggs for 4 weeks, and chicks remain in the samesaltpan while not yet able to fly and are protected by their parents. Five weeks afterhatching, chicks are no longer restricted to the saltpan where they were born,because they can already fly and follow their parents (del Hoyo et al. 1996). Werecorded the timing of deployment of nests during the breeding season on a weeklybasis (see above) in all saltpans (impacted and control). We tested for differences inthe temporal distribution of the nests with time of year and type of saltpan (im-pacted vs. control), using Kolmogorov–Smirnov tests (Griffin 1999) with the ks.testprocedure (R Core Team 2015). Following nest identification (see above) werecorded, on a weekly basis, the number of chicks and their ages. This allowedestimation of two binomial parameters of breeding success: nest and fledglingsuccess. A nest was considered successful if at least one chick up to one week oldwas observed, while fledging success was considered for each clutch when at leastone chick reached the age of fledging (4–5 weeks). We tested for differences withtime of year and saltpan (impacted vs. control) on nest and fledging success, using
12 Evaluating the Impacts of a New Railway on Shorebirds … 203

GLMM with a binary distribution function, and controlling for saltpan area(Crawley 2013). The saltpan identity was specified as a random factor.
Evaluating Effects on Wintering Shorebirds
As in the breeding season, wintering shorebirds can avoid potential impacts bymoving away from impacted saltpans (Cayford 1993). If they stay, they maychange their spatial distribution on impacted saltpans and their activity patterns,which may eventually affect their winter survival, mainly by affecting energy intake(Yasué et al. 2008; Robinson and Pollitt 2002). We monitored the number of allwintering shorebirds, and assessed their distribution and patterns of activity(Fig. 12.2), thereby testing the following hypothesis:
1. Shorebird abundance should decline in impacted saltpans in comparison tocontrol saltpans.
2. The distribution of shorebirds within impacted saltpans should change after thebeginning of the construction and operation of the railway.
3. The distribution and activity of shorebirds within impacted saltpans shouldchange after the beginning of the construction and operation of the railway.
Wintering Shorebird Abundance
We estimated the number of individuals of all shorebird species in the saltpans,from counts carried out at regular intervals during the months of January and/orFebruary (3–5 sampling occasions). Given the small number of counts per speciesand the associated overdispersion, we pooled the counts of all species. We tested fordifferences in the total number of shorebirds with time of year and type of saltpan(impacted vs. control), using a GLMM with a negative binomial distribution,controlling for overdispersion and using the saltpan area as an offset (Crawley2013). Saltpan identity and survey week were specified as random variables.
Shorebird Spatial Distribution and Activity Within Saltpans
Using the same rationale established for the breeding season, we recorded thespatial distribution of shorebirds in each saltpan according to the type of pond(feeders, evaporators, and crystallizers). We then tested for variation in the totalnumber of shorebirds in relation to the type of pond, time (year) and type of saltpan(impacted vs control) using a GLMM with a negative binomial distribution, con-trolling for over-dispersion and saltpan area (Crawley 2013). Saltpan identity andthe survey week were specified as random variables.
We also recorded the activity (foraging vs roosting) of each shorebird. Becauseactivity budgets differ between species, we used only for Dunlin data for this
204 T. Múrias et al.

analysis, because this was the most abundant species. We tested for differences inactivity with time (year) and type of saltpan (impacted and control) using a GLMMwith a binomial distribution function, controlling for saltpan area (Crawley 2013).
Results
Effects on Breeding Shorebirds
Shorebird Abundances
The average abundance of breeding shorebirds presented large variations, whichranged from the complete absence in some saltpans, in a breeding season, tomaximum average values per saltpan of 36.2 Black-winged stilts (9.3 birds/ha),26.0 Kentish plovers (7.9 birds/ha) and 89.7 Little terns (23.0 birds/ha) in 2006. Forthe three focal species, there was a significant interaction term between time andtype of pond (Table 12.1), thus pointing out an impact of the construction andoperation of the railway viaduct. Regarding the construction phase, there weresignificant increases in the abundance of Kentish plover (2008) and Little tern(2008 and 2009) in impacted saltpans in relation to the expectation from temporaltrends at control saltpans (Table 12.1). However, during the operation phase(2011), the numbers of Black-winged Stilt, Kentish plover, and Little tern declinedin impacted saltpans in relation to the expectation from temporal trends at controlsaltpans (Table 12.1).
Black-Winged Stilt Nest Spatial Distribution Within the Saltpans
The total number of nests at the saltpans monitored showed a steady negativetemporal trend: annual average = 81.2 (density=22.3 nests/ha), 2006 = 97 (26.6nests/ha), 2008 = 89 (22.6 nests/ha), 2009 = 81 (21.1 nests/ha), 2011 = 58 (17.5nests/ha). Considering the four years, it was found that most of the Black-wingedStilt nests were built in feeders (annual average = 32.2 nests) and evaporators (45.7nests), while few were found in crystallizers (3.2 nests). There was no evidence ofthe railway affecting nest numbers, as the full GLMM did not differ significantlyfrom the model without the interaction term (Table 12.1).
Black-Winged Stilt Breeding Phenology and Success
Overall, the nesting phenology of Black-winged stilts was clearly unimodal, withthe first nest detected in week 16 (late April) and the last on week 27 (early July),with a peak number of nests in week 21 (end of May) (Fig. 12.3). There were nosignificant differences in phenology between impacted and control in any phase, but
12 Evaluating the Impacts of a New Railway on Shorebirds … 205

Tab
le12
.1Su
mmaryof
theresults
ofgeneralized
linearmixed
mod
els(G
LMM)used
toevaluate
theim
pact
ofarailw
ayon
breeding
andwintering
shorebirds
insaltp
ansof
Ria
deAveiro(Portugal)
GLMM
AIC
Mod
elcomparison
Interactionterm
s
Fullmod
elNullmod
elDev
dfp
Con
trast
Coef
SEp
Breedingshorebirds
Abu
ndan
ce
Black-w
ingedStilt
a22
9022
9813
.63
3<0
.010
2006
versus
2008
−0.24
0.25
0.32
5
2006
versus
2009
0.19
0.25
0.43
8
2006
versus
2011
−0.73
0.26
<0.05
Kentishplov
era
1887
1930
49.00
3<0
.001
2006
versus
2008
0.64
0.26
<0.05
2006
versus
2009
0.23
0.26
0.38
6
2006
versus
2011
−1.46
0.30
<0.001
Little
tern
a20
4020
5824
.21
3<0
.001
2006
versus
2008
1.34
0.46
<0.01
2006
versus
2009
1.09
0.42
<0.01
2006
versus
2011
−0.63
0.48
0.18
9
Breedingpa
rameters(Black-wingedStilt)
Nestdistribu
tionb
455
447
7.38
80.50
Nullmod
elaccepted
Nestsuccessa
154
154
6.45
30.09
Nullmod
elaccepted
Fledging
successa
9086
1.87
30.60
Nullmod
elaccepted
Wintering
shorebirds
Abu
ndan
cea
1293
1299
12.49
3<0
.01
2006
versus
2008
−2.91
1.59
0.06
7
2006
versus
2009
1.52
1.48
0.30
4
2006
versus
2011
−3.01
1.52
<0.05
(con
tinued)
206 T. Múrias et al.
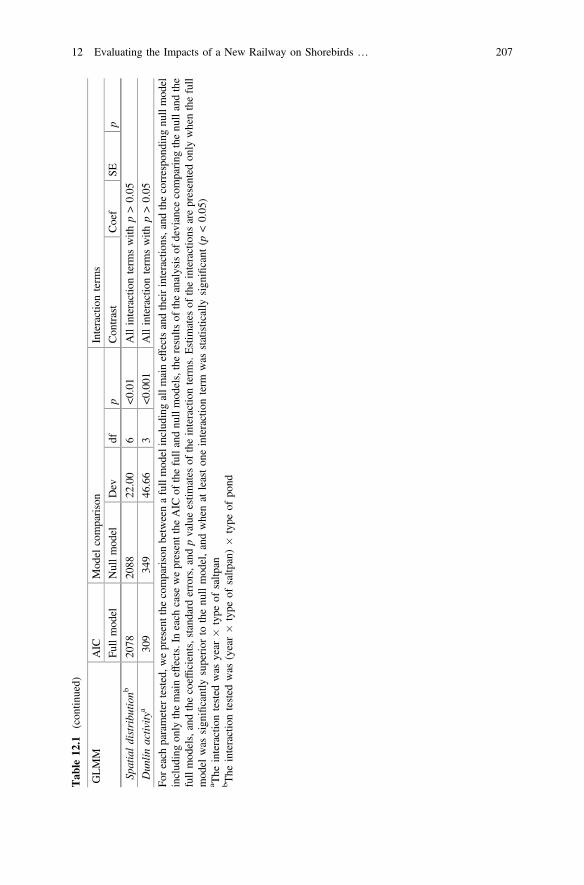
Tab
le12
.1(con
tinued)
GLMM
AIC
Mod
elcomparison
Interactionterm
s
Fullmod
elNullmod
elDev
dfp
Con
trast
Coef
SEp
Spatialdistribu
tionb
2078
2088
22.00
6<0
.01
Allinteractionterm
swith
p>0.05
Dun
linactivity
a30
934
946
.66
3<0
.001
Allinteractionterm
swith
p>0.05
Foreach
parameter
tested,w
epresentthe
comparisonbetweenafullmod
elinclud
ingallm
aineffectsandtheirinteractions,and
thecorrespo
ndingnullmod
elinclud
ingon
lythemaineffects.In
each
case
wepresentthe
AIC
ofthefullandnu
llmod
els,theresults
oftheanalysisof
deviance
comparing
thenu
llandthe
fullmod
els,andthecoefficients,stand
arderrors,and
pvalueestim
ates
oftheinteractionterm
s.Estim
ates
oftheinteractions
arepresentedon
lywhenthefull
mod
elwas
sign
ificantly
superior
tothenu
llmod
el,andwhenat
leaston
einteractionterm
was
statistically
sign
ificant
(p<0.05
)a The
interactiontested
was
year
�type
ofsaltp
anb The
interactiontested
was
(year�
type
ofsaltp
an)�
type
ofpo
nd
12 Evaluating the Impacts of a New Railway on Shorebirds … 207

there were differences between the control and construction phases in impacted(D = 0.39, p < 0.05) and control (D = 0.32, p < 0.01) saltpans, with fewer earlynests and more late season nests in the latter. We did not find significant differencesin temporal nest distribution between the construction and the post-constructionphase in either impacted (D = 0.19, p = 0.86) or control saltpans (D = 0.18,p = 0.40). This suggests an overall delay in nesting phenology, irrespective ofproximity to the railway.
Week
Nests
(N
)
0
4
8
12
0
4
8
12
0
4
8
12
0
4
8
12
Impacted
16 18 20 22 24 26
Control
16 18 20 22 24 26
20
06
20
08
20
09
20
11
Be
fore
Du
ring
co
nstru
ctio
nA
fter
Fig. 12.3 Number of nests per week of Black-winged Stilt in impacted and control saltpans of Riade Aveiro (Portugal), before (2006), during (2008–2009), and after (2011) the construction of anew railway in the study area
208 T. Múrias et al.

The nest success (global = 62%, 2006 = 65%, 2008 = 68%, 2009 = 52%,2011 = 64%) and fledging success (global = 52%, 2006 = 49%, 2008 = 62%,2009 = 42%, 2011 = 51%) were fairly constant over time (Fig. 12.4). There was noevidence of impacts on breeding success, as the full GLMMs did not differ signifi-cantly from the corresponding null models without the interaction term (Table 12.1).
Fig. 12.4 Boxplots showing variation in the number of Black-winged Stilt nests, and nest andfledging success, in impacted and control saltpans of Ria de Aveiro (Portugal), before (2006),during (2008–2009), and after (2011) the construction of a new railway in the study area
12 Evaluating the Impacts of a New Railway on Shorebirds … 209

Effects on Wintering Shorebirds
Shorebird Abundances
The total number of shorebirds counted per winter varied between 9331 (2008) and2166 (2009). Dunlin was the most abundant species, followed by the Black-tailedGodwit Limosa limosa. The full GLMM was significantly different from the nullmodel without the interaction term, thus pointing out the presence of impacts fromthe railway (Table 12.1). The number of birds counted in the impacted saltpansduring the operation phase (2011) was significantly lower than expected given thetemporal trends observed at the control saltpans (Table 12.1).
Spatial Distribution and Activity Within Saltpans
The use of a specific type of pond (feeders, evaporators and crystallisers) in winterdid not show significant differences with type of saltpan (impacted or control).Although the full GLMM was significantly different from a null model(Table 12.1), none of the variables presented significant interactions between thetype of pond and the combined interaction between time of year and the type ofsaltpan. Likewise, although the full GLMM for activity differed significantly fromthe corresponding null model without the interaction term, none of the interactionterms was statistically significant (Table 12.1). This suggests that shorebirds did notchange significantly their spatial distribution and activity within impacted saltpansduring the construction and operation phases.
Discussion
During the breeding season, we detected significantly negative impact of the rail-way on the average abundance of Black-winged Stilt and Kentish plover. But,during the construction phase, it is likely that the interruption of the constructionduring the breeding phase in the whole area of the railway viaduct corridor,imposed by legal authorities, was crucial to reduce the impact of the constructionphase and in the case of the Kentish plover (2008) and the Little tern (2008 and2009) this had a positive impact on the average abundance in impacted saltpans.However, our data does not discriminate between birds that failed to breed frombreeding individuals. These birds can be present at different saltpans in differentsampling dates, and this increased the dispersion of the data and could have maskedto some extent the real pattern.
In the case of the Black-winged Stilt, assumed to be the key indicator species toassess the impact of disturbance caused by the railway, we did not find significantevidence for any impact on the spatial distribution of nests, breeding phenology and
210 T. Múrias et al.

breeding success. The results suggest that the distribution of Black-winged Stiltbetween types of pond (feeders, evaporators and crystallizers) was not particularlyaffected by the construction. The major disturbance took place in the crystallizers,where the pillars were erected. However, as the results above show, these were theareas less used by the species, even in the pre-construction phase, which may be thereason why no impact was observed during the entire construction period andafterwards. Concerning nest phenology, the interruption of construction probablyprevented an impact on the temporal distribution of nests. Likewise, this mayexplain why we did not find any evidence that the railway affected hatching andsurvival of the fledglings that used impacted saltpans.
During the wintering season, the usage of the saltpans can be conditioned bytheir availability, particularly by unpredictable fluctuations in the water level. Thus,the birds may be more limited in their choice of the saltpans, causing a highvariability in the counts. This effect is more restricted during the breeding seasondue to the management of saltpans for the extraction of salt. During the last phase ofthis study, two saltpans (one impacted) were transformed into aquacultures, con-ditioning the use of the saltpans even more. Additionally, many of the shorebirdspecies do not show a random distribution since they group for foraging or roosting,even if there is enough area to spread (van de Kamp et al. 2004). Even taking intoaccount these sources of variability, the data suggest that the wintering community,as a whole, did show a negative response to the disturbance caused by the railway,since significant differences were found between the two types of saltpans over theyears, regarding the species’ abundance. Nevertheless, although the use of a poolednumber of individual birds allowed the analysis of data that is inherentlyover-dispersed and zero-inflated, it restricts the full interpretation of the data. On theother hand, the distribution of the main wintering species was not affected, while forthe wintering Dunlin, the number of birds in each activity did not show a responseto the disturbance caused by the railway. Disturbances can inhibit foraging activ-ities in favor of vigilant behaviour, but since all saltpans are close to sources ofhuman disturbance (e.g., roads), the effect of the railway may have been buffered.
Final Remarks
As an overall conclusion, the data collected suggest that the construction and thebeginning of the operation of the new Aveiro railway showed mixed effects on boththe breeding and wintering communities of shorebirds using the Aveiro saltpancomplex. Additionally, it had indirect effects, as it probably accelerated the aban-donment of salt extraction in one of the affected saltpans, and thus promoted itstransformation into an aquaculture during the last phase of our study. The netconsequence of this process was the loss of this saltpan for the breeding birds, andalso for feeding of the smaller shorebird species. At this point and with the presentdata, however, it is impossible to evaluate the consequences of this loss of habitat,
12 Evaluating the Impacts of a New Railway on Shorebirds … 211

and whether it could be compensated by the use of the other saltpans or other placesoutside the study area.
We applied an experimental design that provides a spatial and temporal contextto integrate the evaluation of potential impacts of railways and other line infras-tructures on wetlands. Our approach surpasses the usual estimators of mortality dueto the effect of barrier and evaluates the effects on the spatial and temporal distri-bution, survival and behaviour. This decision was made due to the nature of thisrailway and the mitigation measures that were decided a priori to decrease theprobability of negative impacts over the aquatic birds that uses the area crossed bythis infrastructure. Indeed, the construction of a viaduct over the most critical areaswas a decision that decreased land reclamation on the saltpans. On the other hand,this railway was meant from the start to be used for commercial purposes, trans-porting containers from the harbor to the main national line. The expected trafficand speed of the trains was thus limited and conditioned to specific daily periods,thus decreasing the barrier effect of this infrastructure and, hopefully, lowered theexpected mortality due to collisions with the trains. In fact, during the study period,only two casualties were reported: a common Sandpiper (Actitis hypoleucos) and anunidentified gull.
The main guidelines described in this book pertaining to future studies in railwayecology seem mostly designed to terrestrial environments (and species) and longstretches of continuous railway beds. This study dealt (albeit in a preliminary way)with some of them, namely by (1) studying species with different ecological traits(even if belonging to the same taxonomic group), (2) using an experimental anal-ysis, which includes comparison between a control phase with the period of con-struction and after, (3) studying the effect of habitat fragmentation (in this case, howthe birds responded to the loss/degradation of the impacted saltpans both in thebreeding season and in winter, and (4) a preliminary study of the population per-sistence in the area after the railway construction.
In our view, the most interesting feature of the present study is the integration ofseveral spatial scales, from the macroscale of other case studies (see Chaps. 7 and11) to the microscale of the habitat. This option was imposed by the nature of theproblem itself and allowed us to go beyond the usual evaluation of mortality ofadult birds due to collisions (Chap. 7) or the general patterns of disturbance andhabitat loss (Chap. 11), and changed the focus of analysis to the impact of dis-turbance (both on the breeding and wintering birds) and chick mortality at smallerscales (habitat), a feature that is seldom attempted. We have developed a conceptualmethodology where the rationale is hypothesis-based and uses aBefore-After-Control-Impact comparative approach (as advised in the guidelines ofChap. 19). We think that it can be easily extended to the same or other aquatic birdspecies and habitats affected by railways in the wetland areas, enabling a multi-scalehabitat analysis that can be combined with the usual broad scope procedures.Although the method has the potential to be improved and refined, we feel that itrepresents an add-on to the arsenal of methods of analysis in future studies ofrailway ecology, as those proposed in Chap. 19.
212 T. Múrias et al.

Acknowledgements We would like to thank REFER (Rede Ferroviária Nacional E. P. E.), andespecially Eng. João Sarmento for kindly making all data available for use in this publication. Wealso thank all the saltpan owners and workers for their support in the study area. Ricardo JorgeLopes was supported by Grants SFRH/BPD/40786/2007 and SFRH/BPD/84141/2012, funded byFCT/MEC and POPH/QREN/FSE.
References
Bastos, M. R. (2009). On the track of salt: Adding value to the history of saltponds exploration inthe coastal management scene of Aveiro lagoon. Journal of Integrated Coastal ZoneManagement, 9, 25–43.
Bates, D., Maechler, M., Bolker, B., & Walker, S. (2015). Fitting linear mixed-effects modelsusing lme4. Journal of Statistical Software, 67(1), 1–48.
Cayford, J. T. (1993). Wader disturbance: A theoretical overview. Wader Study Group Bulletin,68, 3–5.
Crawley, M. J. (2013). The R book (2nd ed.). West Sussex, UK: Wiley.del Hoyo, J., Elliott, A., & Sargatal, J. (1996). Handbook of the birds of the world (Vol. 3) Hoatzin
to Auks. Spain: Lynx Edicions, BarcelonaDias, M. P., Lecoq, M., Moniz, F., & Rabaça, J. E. (2014). Can human-made saltpans represent an
alternative habitat for shorebirds? Implications for a predictable loss of estuarine sediment flats.Environmental Management, 53, 163–171.
Fonseca, V., Grande, N., & Fonseca, L. C. (2005). Waterbird breeding on salinas in Ria Formosa,southern Portugal. Wader Study Group Bulletin, 106, 58–59.
Fournier, D. A., Skaug, H. J., Ancheta, J., Ianelli, J., Magnusson, A., Maunder, M. N., et al. (2012).AD model builder: Using automatic differentiation for statistical inference of highly parame-terized complex nonlinear models. Optimization Methods and Software, 27(2), 233–249.
Griffin, L. R. (1999). Colonization patterns at Rook Corvus frugilegus colonies: Implications forsurvey strategies. Bird Study, 46, 170–173.
INE. (2016). Estatísticas da Pesca 2015. Lisboa: Instituto Nacional de Estatística.International Wader Study Group. (2003). Waders are declining worldwide. Wader Study Group
Bulletin, 101, 8–12.Jardim, G. (1984). Recenseamento e distribuição de aves limícolas nidificantes no estuário do Tejo
em 1983. Cyanopica, 3, 223–229.Lenth, R. V. (2016). Least-squares means: The R package lsmeans. Journal of Statistical Software,
69(1), 1–33.Lopes, R. J., Múrias, T., Cabral, J. C., & Marques, J. C. (2005). A ten year study of variation,
trends and seasonality of shorebird community in the Mondego Estuary. Portugal. Waterbids,28(1), 8–18.
Luís, A., Moreira, H., & Goss-Custard, J. (2002). The feeding strategy of the Dunlin (Calidrisalpina L.) in artificial and non-artificial habitats at Ria de Aveiro, Portugal. Hydrobiologia,475–476(1), 335–343.
Masero, J. A. (2003). Assessing alternative anthropogenic habitats for conserving waterbirds:Salinas as buffer areas against the impact of natural habitat loss for shorebirds. Biodiversity andConservation, 12(6), 1157–1173.
McLusky, D. S., & Elliott, M. (2004). The estuarine ecosystem. Oxford: Oxford University Press.Múrias, T., Cabral, J. A., Lopes, R. J., Marques, J. C., & Goss-Custard, J. D. (1997). Low-water
use of the Mondego Estuary (West Portugal) by waders (Charadrii). Ardeola, 44(1), 79–91.Múrias, T., Cabral, J. A., Lopes, R. J., Marques, J. C., & Goss-Custard, J. D. (2002). Use of
traditional salines by waders in the Mondego estuary (Portugal): A conservation perspective.Ardeola, 49, 223–240.
12 Evaluating the Impacts of a New Railway on Shorebirds … 213

Pearce-Higgins, J. W., Finney, S. K., & Yalden, D. W. (2007). Testing the effects of recreationaldisturbance on two upland breeding waders. Ibis, 149(s1), 45–55.
Prater, A. J. (1981). Estuary birds of Britain and Ireland. Calton, UK: T & A.D. Poyser.R Core Team. (2015). R: A language and environment for statistical computing. Austria: R
Foundation for Statistical Computing.REFER. (2009). Ligação Ferroviária ao Porto de Aveiro. Rede Ferroviária Nacional E.P. (Direcção
de Comunicação e Imagem), Lisboa, Portugal.Robinson, J., & Pollitt, M. S. (2002). Sources and extent of human disturbance to waterbirds in the
UK: An analysis of Wetland Bird Survey data, 1995/96 to 1998/99. Bird Study, 49, 205–211.Rodrigues, C., Bio, A., Amat, F., & Vieira, N. (2011). Artisanal salt production in Aveiro/Portugal
—An ecofriendly process. Saline Systems, 7(1), 3.Rufino, R., & Araújo, A. (1987). Seasonal variation in wader numbers and distribution at the Ria
de Faro. Wader Study Group Bulletin, 51, 48–53.Rufino, R., Araújo, A., Pina, J. P., & Miranda, P. S. (1984). The use of salinas by waders in
Algarve, South Portugal. Wader Study Group Bulletin, 42, 41–42.Rufino, R., & Neves, R. (1992). The effects on wader populations of the conversion of salinas into
fishfarms. In M. Finlayson, T. Hollis, & T. Davis (Eds.), Managing Mediterranean Wetlandsand Their Birds: Proceedings of an IWRB International Symposium (pp. 177–182). Grado,Italy.
Sansom, A., Pearce-Higgins, J. W., & Douglas, D. J. T. (2016). Negative impact of wind energydevelopment on a breeding shorebird assessed with a BACI study design. Ibis, 158(3),541–555.
Tavares, P., Kelly, A., Maia, R., Lopes, R. J., Serrão Santos, R., Pereira, M. E., et al. (2008).Variation in the mobilization of mercury into Black-winged Stilt Himantopus himantopuschicks in coastal saltpans, as revealed by stable isotopes. Estuarine, Coastal and Shelf Science,77(1), 65–76.
van de Kamp, J., Bruno, E., Piersma, T., & Zwarts, L. (2004). Shorebirds: An illustratedbehavioural ecology. Utrecht, The Netherlands: KNNV Publishers.
Vieira, N., & Bio, A. (2014). Artisanal salina—Unique wetland habitats worth preserving. Journalof Marine Science: Research & Development, 4(1), e125.
Yasué, M., Dearden, P., & Moore, A. (2008). An approach to assess the potential impacts ofhuman disturbance on wintering tropical shorebirds. Oryx, 42(3), 415–423.
Zuur, A. F., Ieno, E. N., Walker, N., Saveliev, A. A., & Smith, G. M. (2009). Mixed effects modelsand extensions in ecology with R. New York: Springer.
Open Access This chapter is licensed under the terms of the Creative Commons Attribution 4.0International License (http://creativecommons.org/licenses/by/4.0/), which permits use, sharing,adaptation, distribution and reproduction in any medium or format, as long as you give appropriatecredit to the original author(s) and the source, provide a link to the Creative Commons license andindicate if changes were made.The images or other third party material in this chapter are included in the chapter’s Creative
Commons license, unless indicated otherwise in a credit line to the material. If material is notincluded in the chapter’s Creative Commons license and your intended use is not permitted bystatutory regulation or exceeds the permitted use, you will need to obtain permission directly fromthe copyright holder.
214 T. Múrias et al.
Chapter 13Evaluating and Mitigating the Impactof a High-Speed Railway on Connectivity:A Case Study with an Amphibian Speciesin France
Céline Clauzel
Abstract The aim of this study is to evaluate and mitigate the impact of ahigh-speed railway (HSR) line on functional connectivity for the European tree frog(Hyla arborea), an amphibian species highly sensitive to habitat fragmentation. Themethod consists of modeling its ecological network using graph theory before andafter the implementation of the infrastructure and of evaluating changes in con-nectivity. This diachronic analysis helps visualize the potential impact of the HSRline and to identify areas likely to be most affected by the infrastructure.
Keywords Impact assessment � Landscape connectivity � Ecological network �Graph theory � Amphibians
Introduction
Among world’s vertebrates, amphibians have the highest proportion of threatenedspecies, currently estimated at 32% by the IUCN Red List (IUCN 2016). Thisproportion could increase in the future because at least 42% of all amphibianspecies are declining in population (Stuart et al. 2008). Habitat loss, degradationand fragmentation are the greatest threats to amphibians. Fragmentation is a spatialprocess which affects habitat patches by decreasing their size or increasing theirisolation (Fahrig 2003), making landscape less permeable to wildlife movementsand gene flow (Cushman 2006; Forman and Alexander 1998). Amphibians areparticularly affected because of the importance of movements during their life cycle
C. Clauzel (&)LADYSS, UMR 7533 CNRS, Sorbonne Paris Cité, University Paris-Diderot,5 rue Thomas Mann, 75013 Paris, Francee-mail: [email protected]
C. ClauzelTheMA, CNRS, University Bourgogne Franche-Comté,32 rue Mégevand, 25030 Besançon Cedex, France
© The Author(s) 2017L. Borda-de-Água et al. (eds.), Railway Ecology,DOI 10.1007/978-3-319-57496-7_13
215

(Joly et al. 2003). Most species occupy an aquatic habitat for breeding and duringthe larval period, and a terrestrial habitat after breeding and during hibernation.Daily movements and seasonal migrations across the landscape matrix connectthese two types of habitat. Furthermore, many species are structured intometapopulations, in which several subpopulations occupy spatially distinct habitatpatches separated by a more or less unfavorable matrix. Dispersal events allowindividuals to colonize new ponds or to recolonize sites where the species is nearingextinction. A literature review about amphibian dispersal (Smith and Green 2005)showed that the median distance is less than 400 m but 7% of observed species mayreach 10 km.
The major causes of landscape fragmentation are farming practices, urbandevelopment, and the construction of transportation infrastructures (Forman andAlexander 1998). Apart from direct loss of suitable habitats and road-kills, linearinfrastructures cause the loss of landscape connectivity (Forman and Alexander1998; Geneletti 2004), which is recognized as a key functional factor for the viabilityof species and their genetic diversity (Fahrig et al. 1995). Major infrastructures suchas motorways or high-speed railway lines act as barriers to the movement of animalsand isolate organisms in small subpopulations which become more sensitive to therisk of extinction (Forman and Alexander 1998). This is especially the case forpopulations of amphibians whose daily movements, seasonal migrations and dis-persal events mean they regularly cross the landscape matrix (Allentoft and O’Brien2010; Cushman 2006; Fahrig et al. 1995; Scherer et al. 2012).
Several case studies have contributed to identifying and quantifying the effectsof linear infrastructures on species distribution in many regions of the world, usingvarious methods. Authors have related data describing species (e.g. abundance,collisions) to proximity of infrastructures (Brotons and Herrando 2001; Fahrig et al.1995; Huijser and Bergers 2000; Kaczensky et al. 2003; Li et al. 2010) and to thedegree of habitat fragmentation (Fu et al. 2010; Serrano et al. 2002; Vos andChardon 1998). These studies measure the real impact of the infrastructure usingdata on species collected after its construction. However, before the constructionphase, an impact prediction stage is also necessary to compare alternative infras-tructure routes (Fernandes 2000; Geneletti 2004; Vasas et al. 2009) or to guide themitigation measures from the beginning of the project (Clauzel et al. 2015a, b;Girardet et al. 2016; Mörtberg et al. 2007; Noble et al. 2011).
Reviews by Geneletti (2006) and Gontier et al. (2006) show that the effects oflandscape fragmentation are more difficult to predict than the direct loss of habitat.According to these authors, current assessment methods are often restricted to pro-tected areas or to a narrow strip on either side of the infrastructure. However, land-scape fragmentation may have consequences on a far broader scale (Forman 2000).
To assess the long-distance effects of linear infrastructures on species distributions,models must include connectivity metrics that take into account both structural (ar-rangement of habitat patches) and functional (behavior of the organisms) aspects.Withthis aim in mind, the development of methods based on graph theory in landscapemodelling is promising (Dale and Fortin 2010; Urban et al. 2009). For our purposes, agraph is a set of habitat patches of a given species (called “nodes”) potentially
216 C. Clauzel

connected by functional relationships (“links”). It provides a simplified representationof ecological networks and is considered an interesting trade-off between informationcontent and data requirements (Calabrese and Fagan 2004). Several metrics can becomputed at global level to assess connectivity for the entire graph or at local level forindividual nodes or links (Galpern et al. 2011). Graph-based studies have been used toidentify the key elements for connectivity (Bodin and Saura 2010; Saura andPascual-Hortal 2007), to evaluate the importance of connectivity for species distri-bution (Foltête et al. 2012a; Galpern and Manseau 2013; Lookingbill et al. 2010), toassess the impact assessment of a given development on connectivity (Clauzel et al.2013; Fu et al. 2010; Girardet et al. 2013; Gurrutxaga et al. 2011; Liu et al. 2014)or to proposemitigationmeasures for improving connectivity (Clauzel et al. 2015a, b;Girardet et al. 2016; Mimet et al. 2016).
In this case study, we propose to assess and to mitigate the potential impact of aHSR line on connectivity for the European tree frog (Hyla arborea) in easternFrance. Populations of this species are declining in western Europe due to severalcauses: climate change, increased UV-radiation (Alford and Richards 1999), pre-dation or competition, pollution and eutrophication of ponds (Borgula 1993),road-kill (Elzanowski et al. 2008), and above all the destruction and fragmentationof its habitat (Andersen et al. 2004; Cushman 2006; Vos and Stumpel 1996). In theregion under study, the development of the HSR line and consecutive changes inconnectivity may therefore impact the viability of tree frog populations.
The analysis consists of modeling the ecological network of the European tree frogwith and without the HSR line in the landscape map. The presence of the HSR lineprobably entails a loss of connectivity among suitable habitats thus restricting thepotential movements of the species. Comparison of the connectivity values betweenthe two graphs provides an assessment of the changes in connectivity induced by theHSR line. The analysis is supplemented by a search for the best locations foramphibian crossing structures in order to improve connectivity. This study is basedon a predictive modelling approach that estimates a potential impact but does notmeasure a real impact. This approach is therefore put in place before the constructionof an infrastructure and allows areas potentially affected by isolation to be mapped.
Materials and Methods
Data Preparation
Study Area
Our study was carried out in a zone of 4600 km2 in the Burgundy-Franche-Comtéregion of eastern France (Fig. 13.1). In this zone altitude ranges from 184 to 768 m,the landscape mosaic is dominated by forests (42% of total area), intensive agri-culture (27%) and grasslands (20%). This area is strategic for environmental con-servation because it contains many threatened species of birds (such as the little
13 Evaluating and Mitigating the Impact of a High-Speed Railway … 217

bustard, Tetrax tetrax), mammals (lesser horseshoe bat, Rhinolophus hipposideros),reptiles (European pond turtle, Emys orbicularis) and amphibians (European treefrog, Hyla arborea) (Paul 2011).
In December 2011, a high-speed railway line came into service in the regionafter 4 years of construction. It is part of a larger project that improves connectionsfor eastern France with both Paris and the south of France. This infrastructure is140 km long and 30 m wide on average and crosses the study area from west toeast following the Ognon valley. The line includes a total 1300 m of viaducts and2000 m of tunnels. In this study, this infrastructure is considered as impassableeither because it forms a physical barrier or because traffic noise can disrupt theanimals’ behaviors (Eigenbrod et al. 2009; Lengagne 2008) even when theinfrastructure is on a viaduct. This simplified representation of reality is used tobetter predict the potential impact of the infrastructure on landscape connectivityand by repercussion on tree frog populations.
Study Species
The tree frog is widely distributed in Europe from Spain to western Russia, but itspopulations have declined in north-western Europe over the last 50 years (Corbett1989). The species is classified as endangered and is on the IUCN Regional RedList of Threatened Species for Burgundy-Franche-Comté where it is mainly presentin the Ognon valley (Fig. 13.1) (Pinston et al. 2000).
The tree frog has a two-phase life cycle with aquatic and terrestrial stages. Thebreeding pond consists of shallow and sunny ponds, marshlands, gravel-pits or riverpools. Pond size does not appear decisive and ranges from 1 to 4000 m2 (Grosse
Fig. 13.1 Landscape (a) and ecological network of the tree frog (b) in theBurgundy-Franche-Comté region
218 C. Clauzel

and Nöllert 1993). In fact, the presence of the tree frog does not seem to be relatedto pond size but rather to the amount of terrestrial habitat surrounding the pond(Vos and Stumpel 1996). Although the aquatic habitat is essential for reproduction,the species spends most of its time in terrestrial habitats. In agricultural environ-ments, the species often prefers edge habitats like ponds located on river banks,ditches, fields and forest edges (Pellet et al. 2004).
The seasonal migrations between this terrestrial habitat and the breeding pondrange from 250 to 1000 m (Stumpel 1993). These dispersal events are veryimportant in the tree frog’s life cycle. Juveniles disperse from the breeding pondinto the surrounding landscape to access other ponds. Despite the fidelity of the treefrog to its breeding ground, some adults may disperse and change ponds (Fog1993). Observed dispersal distances are generally less than 2000 m but may reachup to 4000 m (Vos and Stumpel 1996).
Landscape Data
The study required the creation of two landscape maps, the first describing theinitial state before construction of the HSR line, the second including the linearinfrastructure. Except for the HSR line, the land cover was identical on both mapsso only the impact of the infrastructure was estimated. Different data sources werecombined using ArcGis 10. The 1 m-accuracy vectorial landscape databases pro-vided by French cartographic services (DREAL Franche-Comté, BD Topo IGN)were used to represent wetlands, hedgerows, forests, buildings, roads, railways andrivers. In agricultural areas, the French Record of Agricultural Plots were used toseparate grassland and bare ground. A morphological spatial pattern analysis wasalso applied to the forest category to identify forest edges. All these data elementswere combined into a single raster layer with a resolution of 10 m. In this rasterlayer, the HSR line was represented by a 3-pixel wide line to reflect its actual size. It
Table 13.1 Landscapecategories and cost values
Landscape categories Function Cost values
Ponds Aquatic habitat 1
Hedgerows Terrestrial habitat 1
Forest edges Terrestrial habitat 1
Rivers Suitable 10
Wetlands Suitable 10
Wooded grasslands Suitable 10
Grasslands Unfavorable 100
Roads Unfavorable 100
Railways Unfavorable 100
Bare ground Highly unfavorable 1000
Forests Highly unfavorable 1000
Buildings Highly unfavorable 1000
Motorway (A36) Highly unfavorable 1000
13 Evaluating and Mitigating the Impact of a High-Speed Railway … 219

also avoided potential discontinuities induced by the conversion of linear elementsin a raster format (Adriaensen et al. 2003). Altogether, thirteen landscape categorieswere obtained (Table 13.1).
Landscape Graph Construction
The nodes of the graphs corresponding to the habitat patches were defined as theaquatic habitat units (breeding ponds) adjacent to an area of potential terrestrialhabitat. The quality of the habitat patches, i.e. capacity, was defined as the amount ofterrestrial habitat and suitable elements around ponds. The links between nodes weredefined in cost distance because the ability of the tree frog to disperse dependsgreatly on the surrounding matrix. The ecological literature and expert opinions werethus used to classify each landscape category according to its resistance to move-ment (Table 13.1). Radio tracking experiments (Pellet et al. 2004; Vos and Stumpel1996) have concluded that wooded grasslands and linear elements like hedgerows orforest edges facilitate movement and often provided the species’ terrestrial habitat.Rivers and wetlands are less favorable because their permeability depends on thedensity of vegetation. Conversely, grasslands, roads and railways tend to constrainmovement. Finally, the cores of forest patches, bare ground, buildings and motor-ways are considered highly impassable and are mostly avoided by the tree frog.
Clauzel et al. (2013) performed several tests by varying the cost values and thenumber of classes to find the model that best explained the occurrence of the treefrog in the Franche-Comté region. The results showed that highly contrastingvalues between favorable and unfavorable landscape categories were the mostrelevant. Consequently, in the present study (Table 13.1), aquatic and terrestrialhabitats were assigned a cost of 1. Suitable elements such as wetlands or woodedgrasslands were assigned a low cost (10), unfavorable landscape elements a cost of100, and highly unfavorable elements a high cost (1000). In the second landscapemap including the HSR line, a cost of 10,000 was assigned to the infrastructure soas to remove any links crossing it, i.e. considering it as an absolute barrier. From thetwo landscape maps, without and with the HSR line, two graphs were built andthresholded at a distance of 2500 m corresponding approximately to the dispersaldistance for the tree frog. This distance was selected in line with the results byClauzel et al. (2013), where several maximum distances were tested. The modelusing the distance of 2500 m proved the most relevant. Consequently, only linksshorter than this distance were kept.
Landscape Graph Analysis
For each graph, connectivity metrics were calculated, and then compared over timeby computing their rates of variation. The magnitude of the difference betweenmetric values provided an assessment of the impact of the HSR line. Two levels of
220 C. Clauzel

analysis were investigated. The regional-scale analysis provided an assessment ofchanges on the overall connectivity throughout the study area. The local-scaleanalysis provided a finer assessment by identifying the most severely affectedpatches and corridors, i.e., those that experienced the largest changes in localconnectivity or that removed by the infrastructure.
The identification of the best locations for potential wildlife crossings was basedon a cumulative method developed by Foltête et al. (2014) and Girardet et al.(2016). The method consisted of testing each graph link crossed by the HSR lineand to validate the one maximizing the global connectivity of the tree frog network.In the first step, all links cut by the HSR line were removed and the global con-nectivity was calculated. Then, an iterative process added each link and computedagain connectivity. After testing all links individually, the one that produced thebiggest increase in the connectivity was validated. The process was repeated untilthe desired number of new crossings was reached by integrating changes in thegraph topology induced by the addition of previous crossings.
For all analysis, connectivity was quantifying by the Probability of Connectivity(PC) developed by Saura and Pascual-Hortal (2007). The PC index is a globalmetric given by the expression:
PC ¼Xn
i¼1
Xn
j¼1
aiajp�ij
!,A2
where ai and aj are the capacities of the patches i and j, p�ij is the maximumprobability of all potential paths between patches i and j, and A is the total areaunder study. The maximum p�ij is obtained from pij which is determined by anexponential function such that:
pij ¼ expð�adijÞ
where dij is the least-cost distance between these patches and a (0 < a < 1)expresses the intensity of the decrease of the dispersal probabilities resulting fromthis exponential function (Foltête et al. 2012a).
From the global metric PC, a patch-based metric was derived, the PCflux (Foltêteet al. 2014), which is the contribution of each patch to the global PC index. For agiven patch j, PCflux(j) is given by:
PCfluxðjÞ ¼Xn
i¼1
aiajp�ij
!,A2
where ai and aj are the capacities of the patches i and j, p�ij is the maximumprobability of all potential paths between patches i and j, and A is the total areaunder study.
13 Evaluating and Mitigating the Impact of a High-Speed Railway … 221

Graphab 2.0 software (Foltête et al. 2012b) was used to construct landscapegraphs and perform all analysis (Software available at http://thema.univ-fcomte.fr/productions/graphab/en-home.html).
Results
The graph modeling the ecological network of the tree frog contains 1464 nodesranging in size from 0.01 to 86 ha (mean 0.6 ha) and 2624 links (Fig. 13.1). Thenetwork is highly fragmented with 264 components, i.e. the subparts of the graphwithin which the species may move from one patch to another at the dispersal scale.The largest components are located in the Ognon valley, where landscape isdominated by wetlands and grasslands. This area has the largest number of sites ofthis species in the region.
The diachronic analysis of the global PC value without and with the HSR lineshows that the infrastructure has a low effect (−1.36%) on connectivity at theregional scale. This is explained by the already high level of fragmentation.However, as the HSR line runs through the Ognon valley, a much stronger localimpact can be expected. Indeed, the implementation of the HSR line removes 61links and let to a decline in local connectivity in 339 habitat patches (23%) mainlylocated in the Ognon valley (Fig. 13.2). The decrease in the PCflux values on theseimpacted patches is, on average, −71%, with a maximum of −99%. Some patcheslocated more than 12 km north also experience a decline in their connectivity(about −77%).
Fig. 13.2 Rate of variation of the PCflux values (%) due to the implementation of the HSR line
222 C. Clauzel

The search algorithm tests the 61 links removed by the HSR line to select the 10best locations for new amphibian crossing structures, i.e. those maximizing theglobal connectivity. The curve in Fig. 13.3 shows that the PC value increasesgreatly with the first two new crossing structures (+60%) and tends to graduallystabilize from the seventh one. The construction of only 4 amphibian passes istheoretically sufficient to restore 85% of the initial connectivity. These 4 firstcrossing structures reconnect several components to the main one along the Ognonvalley. The combination of these four amphibian passes provides the greatestincrease in connectivity because it concerns the largest components of the network.The other crossing structures reconnect smallest components or reinforce connec-tions inside the main component.
Discussion
This study proposes an integrative approach to assess the potential impact of ahigh-speed railway line on connectivity for the European tree frog in the easternFrance. The analysis can improve knowledge in the fields of environmental impactforecasting and species conservation.
Fig. 13.3 Location of ten new wildlife crossing structures maximizing connectivity. The top leftinset shows the curve of the increase in connectivity provided by new amphibian passes. Thenumbers 1–10 refer to the rank of crossings according to the gain in connectivity they provide
13 Evaluating and Mitigating the Impact of a High-Speed Railway … 223

The diachronic analysis of the local connectivity values shows that the impact ofthe HSR line ranges from a few meters to several kilometers. The impact is oftenlocated near the infrastructure but, in some sections, it may occur up to 12 km fromthe line. This variability is related to the landscape configuration and the initial stateof the connectivity of the habitat patches. Indeed, all impacted habitat patches areinto components fragmented by the HSR line. The extent of disturbance thereforedepends on the size of these components, with a large component increasing thedistance of the impact as in the north-east of the study area. This highlights thevalue of a regional-scale analysis for taking into account the long-distance effect ofan infrastructure on connectivity. From this perspective, graph-based methods areinteresting because they include both structural and functional aspects of connec-tivity. Our results are consistent with several previous studies that highlighted theimportance of integrating the barrier effect in addition to the direct loss of habitat inenvironmental impact assessment (Clauzel et al. 2013; Forman and Alexander1998; Fu et al. 2010; Girardet et al. 2013; Liu et al. 2014).
This graph-based approach provides an approximation of the potential impactbut not a hard and fast measurement of the true impact. In order to validate ourapproach, these findings could be confirmed by field observations to test whetherthe real impact of the infrastructure is similar to that predicted by the model. In June2011, a specific field survey was conducted in the Ognon valley to observe the treefrog presence after the construction of the HSR line. A total of 227 sites was visitedwith 42 presences and 185 absences. The results from this survey were comparedwith the connectivity changes predicted by the model. All presence points werelocated where there was no impact according to the model. The absence points werelocated in more or less affected areas, with a potential connectivity change between0 and −90%. These survey results should be considered carefully because theSpring of 2011 was very unfavorable for the tree frog due to early drying up ofwater bodies. These climatic conditions could therefore explain the many points ofabsence of the species. Furthermore, the time delay between the construction of theHSR line and the surveys was not sufficient to assess the real impact of theinfrastructure. Other field surveys should be conducted in the coming years toassess precisely the conservation status of the tree frog populations and of theirhabitats in the region. These surveys will also identify the causes of extinction ofbreeding populations, as several environmental factors may lie behind the extinc-tion process, and be compounded to the long-distance effects of the infrastructure.
The method used to identify the best locations for new amphibian crossings goesbeyond the prioritization of candidate sites developed by García-Feced et al. (2011).It is cumulative and so includes changes made to graph topology by adding pre-vious links before searching for the next one. Graph modelling is used to includebroad-scale connectivity as a criterion to be maximized, which is a key factor forthe ecological sustainability of landscapes and for the viability of metapopulations(Opdam et al. 2006). In this study, the tested locations corresponded to the links, i.e.corridors potentially used by the tree frog, cut by the HSR line. Relying on theinitial network of the species increases the likelihood of functional crossingsbecause these links already connected habitat patches before the implementation of
224 C. Clauzel

the infrastructure. In addition to cartographic results, a curve of the increasedconnectivity provided by new crossings is generated. This graphical tool indicatesthe number of potential crossings to be created in order to reach a given level ofconnectivity or to detect levels above which crossing creation fails to increaseconnectivity sufficiently. The method used here can also be applied to other specieswith different ecological requirements, or to other perspectives such as habitatrestoration as in the study of Clauzel et al. (2015a) for the tree frog conservation.
Conclusions
The methodological approach used appears to be a handy tool for planners inforecasting the impact of linear infrastructures at different spatial scales, includingthe regional level, which is recognized as a gap in current methods (Fernandes2000; Geneletti 2006; Mörtberg et al. 2007). The map of connectivity changes canhelp optimize the location of new protected areas or mitigation measures byidentifying the areas most affected by the infrastructure. The results also provideinformation about the maximum distance of the impact, which is often difficult toassess. In the case of the HSR line in the Burgundy-Franche-Comté region, theenvironmental assessment studies focused only on a strip of 800 m on either side ofthe HSR line, which allowed the creation of new ponds to replace those destroyedby the construction of the infrastructure.
Acknowledgements The research has been funded by the French Ministry of Ecology, Energy,Sustainable Development and the Sea (ITTECOP Program). The graph analysis was conducted aspart of the Graphab project managed by the USR 3124 MSHE 744 Ledoux. Computations wereperformed on the supercomputer facilities of the MSHE Ledoux.
References
Adriaensen, F., Chardon, J. P., De Blust, G., Swinnen, E., Villalba, S., Gulinck, H., et al. (2003).The application of “least-cost” modelling as a functional landscape model. Landscape andUrban Planning, 64, 233–247.
Alford, R. A., & Richards, S. J. (1999). Global amphibian declines: A problem in applied ecology.Annual Review of Ecology and Systematics, 30, 133–165.
Allentoft, M. E., & O’Brien, J. (2010). Global amphibian declines, loss of genetic diversity andfitness: A review. Diversity, 2, 47–71.
Andersen, L. W., Fog, K., & Damgaard, C. (2004). Habitat fragmentation causes bottlenecks andinbreeding in the European tree frog (Hyla arborea). Proceedings of the Royal Society B:Biological Sciences, 271, 1293–1302.
Bodin, Ö., & Saura, S. (2010). Ranking individual habitat patches as connectivity providers:Integrating network analysis and patch removal experiments. Ecological Modelling, 221,2393–2405.
Borgula, A. (1993). Causes of the decline in Hyla arborea. In A. H. P. Stumpel & U. Tester (Eds.),Ecology and conservation of the European tree frog. Proceedings of the 1st International
13 Evaluating and Mitigating the Impact of a High-Speed Railway … 225

Workshop on Hyla arborea (pp. 71–80). Wageningen: Institute for Forestry and NatureResearch.
Brotons, L., & Herrando, S. (2001). Reduced bird occurrence in pine forest fragments associatedwith road proximity in a Mediterranean agricultural area. Landscape and Urban Planning, 57,77–89.
Calabrese, J. M., & Fagan, W. F. (2004). A comparison-shopper’s guide to connectivity metrics.Frontiers in Ecology and the Environment, 2, 529–536.
Clauzel, C., Bannwarth, C., & Foltête, J.-C. (2015a). Integrating regional-scale connectivity inhabitat restoration: An application for amphibian conservation in eastern France. Journal forNature Conservation, 23, 98–107.
Clauzel, C., Girardet, X., & Foltête, J.-C. (2013). Impact assessment of a high-speed railway lineon species distribution: Application to the European tree frog (Hyla arborea) inFranche-Comté. Journal of Environmental Management, 127, 125–134.
Clauzel, C., Xiqing, D., Gongsheng, W., Giraudoux, P., & Li, L. (2015b). Assessing the impact ofroad developments on connectivity across multiple scales: Application to Yunnan snub-nosedmonkey conservation. Biological Conservation, 192, 207–217.
Corbett, K. (1989). Conservation of European reptiles and amphibians. Bromley, Kent: Helm.Cushman, S. A. (2006). Effects of habitat loss and fragmentation on amphibians: A review and
prospectus. Biological Conservation, 128, 231–240.Dale, M. R. T., & Fortin, M.-J. (2010). From graphs to spatial graphs. Annual Review of Ecology
Evolution and Systematics, 41, 21–38.Eigenbrod, F., Hecnar, S. J., & Fahrig, L. (2009). Quantifying the road effect zone: Threshold
effects of a motorway on anuran populations in Ontario, Canada. Ecology and Society, 14.http://www.ecologyandsociety.org/vol14/iss1/art24/
Elzanowski, A., Ciesiołkiewicz, J., Kaczor, M., Radwańska, J., & Urban, R. (2008). Amphibianroad mortality in Europe: A meta-analysis with new data from Poland. European Journal ofWildlife Research, 55, 33–43.
Fahrig, L. (2003). Effects of habitat fragmentation on biodiversity. Annual Review of EcologyEvolution and Systematics, 34, 487–515.
Fahrig, L., Pedlar, J. H., Pope, S. E., Taylor, P. D., & Wegner, J. F. (1995). Effect of road traffic onamphibian density. Biological Conservation, 73, 177–182.
Fernandes, J. P. (2000). Landscape ecology and conservation management—Evaluation ofalternatives in a highway EIA process. Environmental Impact Assessment Review, 20,665–680.
Fog, K. (1993). Migration in the tree frog Hyla arborea. In A. H. P Stumpel & U. Tester (Eds.),Ecology and conservation of the European tree frog. Proceedings of the 1st InternationalWorkshop on Hyla arborea (pp. 55–64). Wageningen: Institute for Forestry and NatureResearch.
Foltête, J.-C., Clauzel, C., & Vuidel, G. (2012a). A software tool dedicated to the modelling oflandscape networks. Environmental Modelling and Software, 38, 16–32.
Foltête, J.-C., Clauzel, C., Vuidel, G., & Tournant, P. (2012b). Integrating graph-basedconnectivity metrics into species distribution models. Landscape Ecology, 27, 1–13.
Foltête, J.-C., Girardet, X., & Clauzel, C. (2014). A methodological framework for the use oflandscape graphs in land-use planning. Landscape and Urban Planning, 124, 240–250.
Forman, R. T. T. (2000). Estimate of the area affected ecologically by the road system in theUnited States. Conservation Biology, 14, 31–35.
Forman, R. T. T., & Alexander, L. E. (1998). Roads and their major ecological effects. AnnualReview of Ecology and Systematics, 29, 207–231.
Fu, W., Liu, S., Degloria, S. D., Dong, S., & Beazley, R. (2010). Characterizing the“fragmentation–barrier” effect of road networks on landscape connectivity: A case study inXishuangbanna, Southwest China. Landscape and Urban Planning, 95, 122–129.
Galpern, P., & Manseau, M. (2013). Modelling the influence of landscape connectivity on animaldistribution: A functional grain approach. Ecography, 36, 1004–1016.
226 C. Clauzel

Galpern, P., Manseau, M., & Fall, A. (2011). Patch-based graphs of landscape connectivity: Aguide to construction, analysis and application for conservation. Biological Conservation, 144,44–55.
García-Feced, C., Saura, S., & Elena-Rosselló, R. (2011). Improving landscape connectivity inforest districts: A two-stage process for prioritizing agricultural patches for reforestation.Forest Ecology and Management, 261, 154–161.
Geneletti, D. (2004). Using spatial indicators and value functions to assess ecosystemfragmentation caused by linear infrastructures. International Journal of Applied EarthObservation and Geoinformation, 5, 1–15.
Geneletti, D. (2006). Some common shortcomings in the treatment of impacts of linearinfrastructures on natural habitat. Environmental Impact Assessment Review, 26, 257–267.
Girardet, X., Foltête, J. C., & Clauzel, C. (2013). Designing a graph-based approach in thelandscape ecological assessment of linear infrastructures. Environmental Impact AssessmentReview, 42, 10–17.
Girardet, X., Foltête, J.-C., Clauzel, C., & Vuidel, G. (2016). Restauration de la connectivitéécologique: proposition méthodologique pour une localisation optimisée des passages à faune.VertigO - la revue électronique en sciences de l’environnement. http://vertigo.revues.org/17337
Gontier, M., Balfors, B., & Mörtberg, U. (2006). Biodiversity in environmental assessment—Current practice and tools for prediction. Environmental Impact Assessment Review, 26,268–286.
Grosse, W. R., & Nöllert, A. K. (1993). Migration in the tree frog Hyla arborea. In A.H. P. Stumpel & U. Tester (Eds.), Ecology and conservation of the European tree frog.Proceedings of the 1st international workshop on Hyla arborea (pp. 37–45). Wageningen:Institute for Forestry and Nature Research.
Gurrutxaga, M., Rubio, L., & Saura, S. (2011). Key connectors in protected forest area networksand the impact of highways: A transnational case study from the Cantabrian range to theWestern Alps (SW Europe). Landscape and Urban Planning, 101, 310–320.
Huijser, M. P., & Bergers, P. J. (2000). The effect of roads and traffic on hedgehog (Erinaceuseuropaeus) populations. Biological Conservation, 95, 111–116.
IUCN. (2016). Amphibians on the IUCN Red List. http://www.iucnredlist.org/initiatives/amphibians
Joly, P., Morand, C., & Cohas, A. (2003). Habitat fragmentation and amphibian conservation:Building a tool for assessing landscape matrix connectivity. Comptes Rendus Biologies, 326,132–139.
Kaczensky, P., Knauer, F., Krze, B., Jonozovic, M., Adamic, M., & Gossow, H. (2003). Theimpact of high speed, high volume traffic axes on brown bears in Slovenia. BiologicalConservation, 111, 191–204.
Lengagne, T. (2008). Traffic noise affects communication behaviour in a breeding anuran, Hylaarborea. Biological Conservation, 141, 2023–2031.
Li, Z., Ge, C., Li, J., Li, Y., Xu, A., Zhou, K., et al. (2010). Ground-dwelling birds near theQinghai-Tibet highway and railway. Transportation Research Part D: Transport andEnvironment, 15, 525–528.
Liu, S., Dong, Y., Deng, L., Liu, Q., Zhao, H., & Dong, S. (2014). Forest fragmentation andlandscape connectivity change associated with road network extension and city expansion: Acase study in the Lancang River Valley. Ecological Indicators, 36, 160–168.
Lookingbill, T. R., Gardner, R. H., Ferrari, J. R., & Keller, C. E. (2010). Combining a dispersalmodel with network theory to assess habitat connectivity. Ecological Applications, 20,427–441.
Mimet, A., Clauzel, C., & Foltête, J.-C. (2016). Locating wildlife crossings for multispeciesconnectivity across linear infrastructures. Landscape Ecology, 32, 1955–1973.
Mörtberg, U. M., Balfors, B., & Knol, W. C. (2007). Landscape ecological assessment: A tool forintegrating biodiversity issues in strategic environmental assessment and planning. Journal ofEnvironmental Management, 82, 457–470.
13 Evaluating and Mitigating the Impact of a High-Speed Railway … 227

Noble, B., Hill, M., & Nielsen, J. (2011). Environmental assessment framework for identifying andmitigating the effects of linear development to wetlands. Landscape and Urban Planning, 99,133–140.
Opdam, P., Steingröver, E., & Rooij, S. (2006). Ecological networks: A spatial concept formulti-actor planning of sustainable landscapes. Landscape and Urban Planning, 75, 322–332.
Paul, J.-P. (2011). Liste rouge des vertébrés terrestres de Franche-Comté. Groupe Naturaliste deFranche-Comté et Conseil Régional de Franche-Comté (Eds.), Besançon.
Pellet, J., Hoehn, S., & Perrin, N. (2004). Multiscale determinants of tree frog (Hyla arborea L.)calling ponds in western Switzerland. Biodiversity and Conservation, 13, 2227–2235.
Pinston H., Craney E., Pépin D., Montadert M., & Duquet M. (2000). Amphibiens et Reptiles deFranche-Comté. Atlas commenté de répartition. Groupe Naturaliste de Franche-Comté etConseil Régional de Franche-Comté (Eds.), Besançon.
Saura, S., & Pascual-Hortal, L. (2007). A new habitat availability index to integrate connectivity inlandscape conservation planning: Comparison with existing indices and application to a casestudy. Landscape and Urban Planning, 83, 91–103.
Scherer, R. D., Muths, E., & Noon, B. R. (2012). The importance of local and landscape-scaleprocesses to the occupancy of wetlands by pond-breeding amphibians. Population Ecology, 54,487–498.
Serrano, M., Sanz, L., Puig, J., & Pons, J. (2002). Landscape fragmentation caused by the transportnetwork in Navarra (Spain). Landscape and Urban Planning, 58, 113–123.
Smith, A., & Green, D. (2005). Dispersal and the metapopulation paradigm in amphibian ecologyand conservation: Are all amphibian populations metapopulations? Ecography, 28, 110–128.
Stuart, S. N., Hoffmann, M., Chanson, J. S., Cox, N. A., Berridge, R. J., Ramani, P., et al. (2008).Threatened amphibians of the world. Lynx Edicions, Barcelona, Spain; IUCN, Gland,Switzerland; and Conservation International, Arlington, VA.
Stumpel, A. H. P. (1993). The terrestrial habitat of Hyla arborea. In A. H. P. Stumpel & U. Tester(Eds.), Ecology and conservation of the European tree frog. Proceedings of the 1stinternational workshop on Hyla arborea (pp. 47–54). Wageningen: Institute for Forestry andNature Research.
Urban, D. L., Minor, E. S., Treml, E. A., & Schick, R. S. (2009). Graph models of habitat mosaics.Ecology Letters, 12, 260–273.
Vasas, V., Magura, T., Jordán, F., & Tóthmérész, B. (2009). Graph theory in action: Evaluatingplanned highway tracks based on connectivity measures. Landscape Ecology, 24, 581–586.
Vos, C. C., & Chardon, J. P. (1998). Effects of habitat fragmentation and road density on thedistribution pattern of the moor frog Rana arvalis. Journal of Applied Ecology, 35, 44–56.
Vos, C. C., & Stumpel, A. H. P. (1996). Comparison of habitat-isolation parameters in relation tofragmented distribution patterns in the tree frog (Hyla arborea). Landscape Ecology, 11,203–214.
Open Access This chapter is licensed under the terms of the Creative Commons Attribution 4.0International License (http://creativecommons.org/licenses/by/4.0/), which permits use, sharing,adaptation, distribution and reproduction in any medium or format, as long as you give appropriatecredit to the original author(s) and the source, provide a link to the Creative Commons license andindicate if changes were made.The images or other third party material in this chapter are included in the chapter’s Creative
Commons license, unless indicated otherwise in a credit line to the material. If material is notincluded in the chapter’s Creative Commons license and your intended use is not permitted bystatutory regulation or exceeds the permitted use, you will need to obtain permission directly fromthe copyright holder.
228 C. Clauzel

Chapter 14Habitat Fragmentation by Railwaysas a Barrier to Great Migrationsof Ungulates in Mongolia
Takehiko Y. Ito, Badamjav Lhagvasuren, Atsushi Tsunekawaand Masato Shinoda
Abstract Mongolia’s Gobi-Steppe Ecosystem is the largest grassland in the worldand the habitat of long-distance movement ungulates, such as the Mongoliangazelle (Procapra gutturosa) and the Asiatic wild ass (Equus hemionus). Theinternational railway between Russia and China bisects this habitat, and there hasbeen concern that it may impede the movements of wild ungulates. We trackedungulate movements on both sides of the Ulaanbaatar–Beijing Railway, and foundthat most of the tracked animals never crossed the railway. The construction ofadditional railways to permit mining projects in the area is therefore a further threatto maintaining the great migrations of ungulates across Mongolia.
Keywords Asiatic wild ass � Dryland � Grassland � Desert � Long-distancemovement � Mongolian gazelle � NDVI � Remote sensing � Satellite tracking �Terrestrial mammal
Introduction
Mongolia occupies an area of 1,564,100 km2 in central Asia. Mainly due to its lowhuman population density (2.0 ind./km2 in 2015 for all of Mongolia; NationalStatistical Office of Mongolia 2016), it harbors the largest grassland in the world.Several species of ungulates inhabit this grassland, including the Mongolian gazelle(Procapra gutturosa), the goitered gazelle (Gazella subgutturosa), and the Asiaticwild ass (Equus hemionus), with some of them, such as the Mongolian gazelle,forming large herds (Fig. 14.1).
T.Y. Ito (&) � A. TsunekawaArid Land Research Center, Tottori University, Tottori, Japane-mail: [email protected]
B. LhagvasurenInstitute of General and Experimental Biology, Mongolian Academy of Sciences,Ulaanbaatar, Mongolia
M. ShinodaGraduate School of Environmental Studies, Nagoya University, Nagoya, Japan
© The Author(s) 2017L. Borda-de-Água et al. (eds.), Railway Ecology,DOI 10.1007/978-3-319-57496-7_14
229
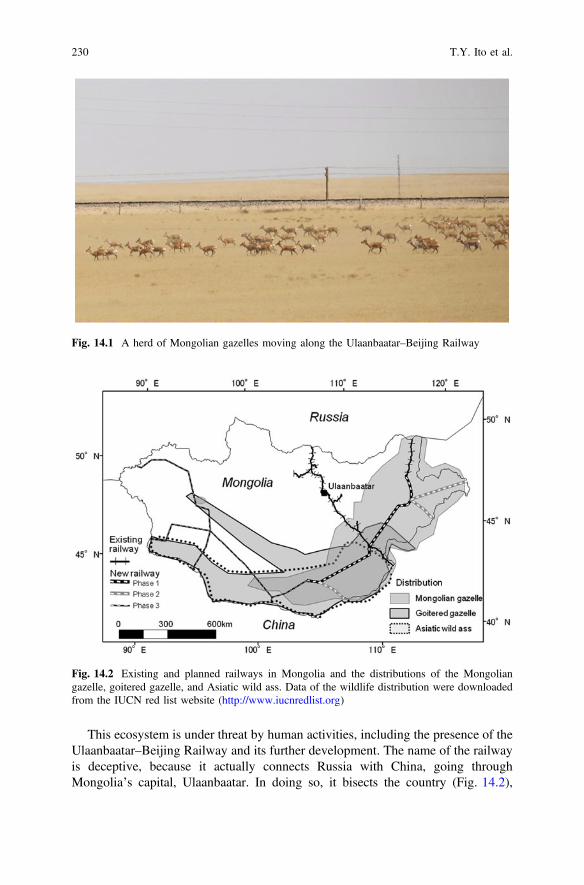
This ecosystem is under threat by human activities, including the presence of theUlaanbaatar–Beijing Railway and its further development. The name of the railwayis deceptive, because it actually connects Russia with China, going throughMongolia’s capital, Ulaanbaatar. In doing so, it bisects the country (Fig. 14.2),
Fig. 14.1 A herd of Mongolian gazelles moving along the Ulaanbaatar–Beijing Railway
Fig. 14.2 Existing and planned railways in Mongolia and the distributions of the Mongoliangazelle, goitered gazelle, and Asiatic wild ass. Data of the wildlife distribution were downloadedfrom the IUCN red list website (http://www.iucnredlist.org)
230 T.Y. Ito et al.

forming a barrier to the movements, including migrations, of several animals, andparticularly the Mongolian gazelle. Since 2002, we have been studying the impactof the railway on the Mongolian gazelle by using satellite tracking methods tofollow individuals of this species. Our results show that the railway is a barrier tomigrations of the gazelle, contributing directly and indirectly to its mortality. Harshwinters in Mongolia force the Mongolian gazelle and other ungulates to performlong-distance movements to find food and the presence of the railway acts a barrierpreventing animals from accessing certain food sources.
Here, we report the results of our studies on the impact of the Ulaanbaatar–Beijing Railway on the movements of the Mongolian gazelle and the spatial dis-tribution of gazelle carcasses that results from the presence of this barrier.Moreover, we assess the impact of further development of the railway network inMongolia and the need to implement mitigation measures if we want to preserve thegreat migrations of ungulates across the Mongolian grasslands.
Environments of Mongolia’s Gobi-Steppe Ecosystem
Mongolia’s Gobi-Steppe Ecosystem is the world’s largest area of intact grassland(827,000 km2), and it is much larger than other globally famous grasslands aswildlife habitat, such as the Greater Yellowstone Ecosystem (108,000 km2) in thewestern United States and the Serengeti-Mara Ecosystem (25,000 km2) in EastAfrica (Batsaikhan et al. 2014). The Gobi-Steppe Ecosystem is a wide and intactsteppe and semi-desert ecosystem in northern China, Mongolia, and southernRussia where great migrations of wild ungulates still occur. Nomadic pastoralismhas been the main lifestyle of the Mongolian people for several thousand years, andthe grassland ecosystem has been maintained in relatively good condition comparedto that in other regions thanks to low human and livestock densities, low grazingpressure, and movements of people with their livestock between grazing sites totake advantage of better grazing conditions in different seasons and years.
Mongolia has one of the smallest human populations in the world and, althoughthe population is growing, its density in the countryside outside of the capital citywas only 1.1 ind./km2 in 2015 (National Statistical Office of Mongolia 2016),mainly because half of the country’s population is concentrated in the capital city,Ulaanbaatar. The number of livestock, especially goats, has increased since thecapitalist system replaced the communist system in 1991, and grassland degradationby overgrazing has been reported in some areas (e.g., Sasaki et al. 2008), althoughrelatively fine and continuous habitats for wildlife remain.
The Gobi-Steppe Ecosystem dominates most of Mongolia, except in mountainousareas and in the northern forests, and is characterized by relatively flat topography.Annual average precipitation in this area is less than about 350 mm, but its interannualvariation is large (Vandandorj et al. 2015; Yu et al. 2004), which is typical fordrylands. Because precipitation and snowfall increase and temperature decreasesfrom south to north (Morinaga et al. 2003; Nandintsetseg and Shinoda 2011), veg-etation correspondingly changes from desert to drylands and forest steppe
14 Habitat Fragmentation by Railways as a Barrier to Great … 231

ecosystems. Droughts and severe winters are a cause of high mortality among live-stock (Fernandez-Gimenez et al. 2012, 2015; Tachiiri and Shinoda 2012) and wildanimals (Kaczensky et al. 2011a).
Railways and Vulnerable Wild Animals in Mongolia
The Ulaanbaatar–Beijing Railway is an international railway that connects Chinawith Russia thorough Ulaanbaatar (Fig. 14.2). It was built in the 1950s and runsfrom northwest to southeast; the section that is south of Ulaanbaatar crosses theGobi-Steppe Ecosystem. Barbed wire fences have been built on both sides of therailway, mainly to prevent accidents with livestock. The influence of the railway onwild animal movements and concomitant population declines has been a cause ofconcern. Animals can suffer mortality directly when crossing the railway or indi-rectly because of barrier effects that prevent them from reaching suitable sites forfood, water, and reproduction. These concerns led to animal tracking studies (e.g.,Ito et al. 2005, 2013a). Mammals inhabiting the grassland ecosystems of Mongoliaand showing long-distance movements that are potentially affected by the railwayare the Mongolian gazelle, the goitered gazelle, and the Asiatic wild ass (Fig. 14.2;Mallon and Jiang 2009). Current train frequency on the railway is not high (about1 train/h in daytime based on our rough observations), and freight trains are morefrequent than passenger trains.
Both historically and today, the Mongolian gazelle has had one of the longestmigrations among terrestrial animals (Berger 2004; Teitelbaum et al. 2015). Untilthe 1930s, this species had a distribution that occupied most of the grasslands innorthern China, Mongolia, and southern Russia, but since then its distribution hasbeen reduced to the eastern half of Mongolia and to areas close to the borderbetween Mongolia, China, and Russia (Fig. 14.2; Jiang et al. 1998; Lhagvasurenand Milner-Gulland 1997; Mallon 2008b). In the latest IUCN Red List, theMongolian gazelle is ranked as least concern (LC) due to population estimates overthe last 10 years ranging from 400,000 to 2,700,000 and because its range isexpanding toward the northwest (Mallon 2008b).
Mongolia has the largest population of goitered gazelles (40–50% of the globalpopulation; Mallon 2008a). This species has a body size and morphology similar tothose of the Mongolian gazelle, but it does not form large herds, and details of itsecology are still unknown. The Asiatic wild ass has lost 70% of its global range sincethe 19th century, and at present, more than 75% of the population (about 55,000animals) lives in Mongolia (Kaczensky et al. 2011a, 2015; Reading et al. 2001).
Movement Ecology of Mongolian Gazelles
Among ungulates, the Mongolian gazelle is the most well studied species in termsof the impact of the Ulaanbaatar–Beijing Railway on its movements. Although thespecies’ behavioral ecology has not been fully elucidated, Mongolian gazelles
232 T.Y. Ito et al.
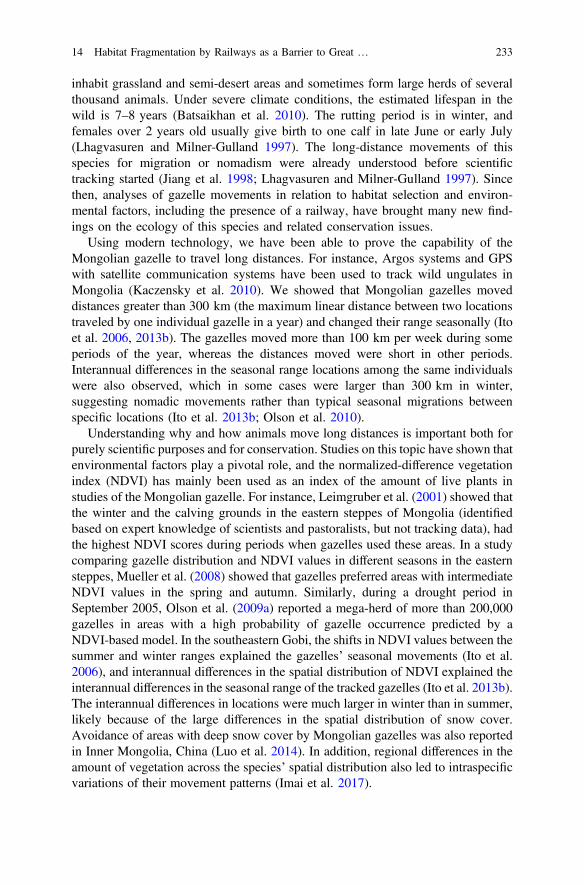
inhabit grassland and semi-desert areas and sometimes form large herds of severalthousand animals. Under severe climate conditions, the estimated lifespan in thewild is 7–8 years (Batsaikhan et al. 2010). The rutting period is in winter, andfemales over 2 years old usually give birth to one calf in late June or early July(Lhagvasuren and Milner-Gulland 1997). The long-distance movements of thisspecies for migration or nomadism were already understood before scientifictracking started (Jiang et al. 1998; Lhagvasuren and Milner-Gulland 1997). Sincethen, analyses of gazelle movements in relation to habitat selection and environ-mental factors, including the presence of a railway, have brought many new find-ings on the ecology of this species and related conservation issues.
Using modern technology, we have been able to prove the capability of theMongolian gazelle to travel long distances. For instance, Argos systems and GPSwith satellite communication systems have been used to track wild ungulates inMongolia (Kaczensky et al. 2010). We showed that Mongolian gazelles moveddistances greater than 300 km (the maximum linear distance between two locationstraveled by one individual gazelle in a year) and changed their range seasonally (Itoet al. 2006, 2013b). The gazelles moved more than 100 km per week during someperiods of the year, whereas the distances moved were short in other periods.Interannual differences in the seasonal range locations among the same individualswere also observed, which in some cases were larger than 300 km in winter,suggesting nomadic movements rather than typical seasonal migrations betweenspecific locations (Ito et al. 2013b; Olson et al. 2010).
Understanding why and how animals move long distances is important both forpurely scientific purposes and for conservation. Studies on this topic have shown thatenvironmental factors play a pivotal role, and the normalized-difference vegetationindex (NDVI) has mainly been used as an index of the amount of live plants instudies of the Mongolian gazelle. For instance, Leimgruber et al. (2001) showed thatthe winter and the calving grounds in the eastern steppes of Mongolia (identifiedbased on expert knowledge of scientists and pastoralists, but not tracking data), hadthe highest NDVI scores during periods when gazelles used these areas. In a studycomparing gazelle distribution and NDVI values in different seasons in the easternsteppes, Mueller et al. (2008) showed that gazelles preferred areas with intermediateNDVI values in the spring and autumn. Similarly, during a drought period inSeptember 2005, Olson et al. (2009a) reported a mega-herd of more than 200,000gazelles in areas with a high probability of gazelle occurrence predicted by aNDVI-based model. In the southeastern Gobi, the shifts in NDVI values between thesummer and winter ranges explained the gazelles’ seasonal movements (Ito et al.2006), and interannual differences in the spatial distribution of NDVI explained theinterannual differences in the seasonal range of the tracked gazelles (Ito et al. 2013b).The interannual differences in locations were much larger in winter than in summer,likely because of the large differences in the spatial distribution of snow cover.Avoidance of areas with deep snow cover by Mongolian gazelles was also reportedin Inner Mongolia, China (Luo et al. 2014). In addition, regional differences in theamount of vegetation across the species’ spatial distribution also led to intraspecificvariations of their movement patterns (Imai et al. 2017).
14 Habitat Fragmentation by Railways as a Barrier to Great … 233

The spatial distribution and seasonal change of food plants are considered to beimportant factors determining the movement patterns of ungulates (Mueller and Fagan2008). Therefore, environmental unpredictability at the landscape level affectsmovement patterns of animals through seasonal and interannual changes in foodavailability. Mongolian gazelles in the eastern steppe of Mongolia have nomadicmovements that are more irregular than those of other ungulate species, such as caribou(Rangifer tarandus granti) in Alaska, which exhibit regular seasonal migration, or theguanaco (Lama guanicoe) in Argentina and moose (Alces alces) in the northeasternUnited States, both of which move shorter distances with more predictable movements(Mueller et al. 2011). Therefore, in order to conserve nomadic animals, likeMongoliangazelles, that live in unpredictable environments, the maintenance of good environ-mental conditions and access to vast areas are essential, especially during those periodswhen conditions become unsuitable in much of their ranges.
Effects of the Ulaanbaatar–Beijing Railway on WildUngulates
Barrier Effect of the Existing Railway
The barrier effect of the Ulaanbaatar–Beijing Railway on the movements of wildungulates in Mongolia has been apparent since the beginning of satellite tracking ofthese animals. We first conducted satellite tracking of Mongolian gazelles in 2002 (Itoet al. 2005, 2006). In October 2002, two female gazelles were captured on the south-western side of the railway and collared with a satellite transmitter. The distancebetween the site of capture and the railway was about 7 km. Although both gazelleswere captured at exactly the same place, their movements after release were different(Fig. 14.3). This is a small sample size, but it is representative of themovements ofmoreindividuals because at the time when the animals were captured, the gazelles were partof a herd with several hundred animals. The different movements of the two gazellesalso indicate loose relations among gazelle individuals. SometimesMongolian gazellesform large herds, whereas other times they separate into relatively small groups. Suchuncoordinated movement patterns were also reported in a comparative study of theMongolian gazelle, caribou, guanaco, and moose (Mueller et al. 2011).
The two gazelles captured near the railway moved along it for a year, but nevercrossed it (Ito et al. 2005). They moved closer to the railway during winter(October–March) than during summer (April–September), and the nearest distancesof the two gazelles to the railway were 0.3 and 1.8 km, respectively (Fig. 14.3).These results suggest that the railway is a barrier for gazelle movements mainlybecause of the fences along the rails. Some wildlife crossing locations exist alongthe railway (Fig. 14.4), but our data suggest that these crossings are ineffective,probably due to their limited number and their lack of suitable natural features thatcould reduce the natural wariness of the gazelles.
234 T.Y. Ito et al.

Fig. 14.3 Locations of two tracked Mongolian gazelles from 2002 to 2003 in Mongolia, and thezones in which the normalized-difference vegetation index (NDVI) was analyzed. Zones W30,W60, and W90 are 0–30, 30–60, and 60–90 km northwest of the railway, respectively, and zonesE30, E60, and E90 are 0–30, 30–60, and 60–90 km southeast of the railway, respectively. Thehatched line represents the railway (from Ito et al. 2005)
To understand why the gazelles used areas near the railway during the winter andwhether there were any disadvantages for gazelles caused by being restricted to onlyone side of the railway, we compared NDVI values on both sides of the railway. Weestablished three 30-km zones on each side of the railway, parallel to the rails(Fig. 14.3). These zones spanned most northern and southern gazelle locationsobserved during the winter. We detected a significant gradient of NDVI values from17 November to 2 December 2002, the period when the gazelles moved the greatestdistance, from southwest to northeast (Ito et al. 2005). The highest average NDVIvalue was in the 30- to 60-km northeastern zone (Fig. 14.5), suggesting that the
14 Habitat Fragmentation by Railways as a Barrier to Great … 235

tracked gazelles, (and thus, many gazelles living on the southwestern side of therailway) could not use better sites existing on the opposite side due to the barriercaused by the railway.
The barrier effect of the railway became more evident as more animal trackingdata were gathered. An Asiatic wild ass tracked from July 2005 to February 2006also moved along the southwestern side of the railway but did not cross it(Kaczensky et al. 2006, 2011b). The railway now likely forms the eastern edge of
Fig. 14.4 Underpasses on the Ulaanbaatar–Beijing Railway
236 T.Y. Ito et al.

the current Asiatic wild ass distribution because no wild ass has been observed onthe eastern side for many years, despite the existence of suitable habitat on thenortheastern side of the railway (Kaczensky et al. 2011b, 2015). Further data ontracked Mongolian gazelles have confirmed that the railway impeded 24 gazellestracked between 2002 and 2012 from crossing to both sides (Fig. 14.6; Ito et al.2013a), except for one individual (Olson 2012).
International border fences further exacerbate the fragmentation of the landscapeand have a similar barrier effect on wild ungulates. Almost none of the trackedungulates in Mongolia crossed the borders (Fig. 14.6; Ito et al. 2013a; Kaczenskyet al. 2006, 2008, 2011a; Olson 2012; Olson et al. 2009b), except for one reportedcase of an Asiatic wild ass in western Mongolia (Kaczensky et al. 2011a). Theseresults indicate that the railway and the border fences are likely causes of habitatfragmentation and impediments to long-distance movements of ungulates.
Influences of the Barrier Effect on Wild Ungulates
What are the problems caused by railway barrier effects on wild ungulates?Although the railway bisects Mongolia’s Gobi-Steppe Ecosystem, each part of theecosystem is still vast. The seasonality of the ungulates’ location is a key toevaluate how the railway influences the animals restricted to one side of this barrier.Tracked Mongolian gazelles and Asiatic wild asses used areas far from the barriersduring summer but used areas close to the railway and the borders during winter(Fig. 14.7; Ito et al. 2005, 2013a). The only case of a tracked wild ass crossing theborder to China and returning to Mongolia was observed during the harsh winter
Fig. 14.5 Averagenormalized-differencevegetation index (NDVI) ineach zone adjacent to therailway from 17 November to2 December 2002. Error barsrepresent 95% confidenceintervals. See Fig. 14.3 forexplanation of zone names(from Ito et al. 2005)
14 Habitat Fragmentation by Railways as a Barrier to Great … 237

Fig. 14.6 Movements of the tracked Mongolian gazelles: a gazelles captured on the southwesternside of the Ulaanbaatar–Beijing Railway in 2007, and b gazelles captured on the northeasternside from 2003. The tracking continued until 2012 (from Ito et al. 2013a)
238 T.Y. Ito et al.

(dzud) of 2009/2010 in western Mongolia (Kaczensky et al. 2011a), but no othertracked animals ever crossed it. The reason why animals tend to be closer to therailway in the winter is likely to be related to food availability. During the plantgrowing period (summer in Mongolia), suitable areas for herbivores are wide-spread. In contrast, the period from winter to early spring is the severest period forwild and livestock animals in Mongolia because of low temperatures and poor foodavailability caused by plant withering, plant consumption by continuous grazing,and snow cover on the vegetation. Herbivorous animals, therefore, have to move inorder to find suitable sites with enough vegetation to survive during this harsh time,and many animals consequently reach areas close to the railway and internationalborders, which often have fences.
The limitation of movements and habitat use by ungulates may lead to highermortality. If suitable sites for ungulates are mainly located on the opposite side ofthe barriers during winter, the animals may not get enough food to survive.Therefore we predicted a higher density of carcasses of Mongolian gazelles alongthe Ulaanbaatar–Beijing Railway than in remote areas away from the railway.Indeed, many carcasses were actually found near the railway, although we have notcompared this with the carcass density in remote areas. We conducted a carcasssurvey along a 630-km section of the railway in June 2005 and found a total of 241Mongolian gazelle carcasses. Carcass densities differed not only between regionsbut also between the southwestern and northeastern sides of the railway (Fig. 14.8;Ito et al. 2008). A similar carcass survey was conducted in summer 2011, and 393
Fig. 14.7 Monthly ratio (mean + SE) of location data within 10 km of the anthropogenic barriers(the railway and the international border fence) to all monthly location data for tracked Mongoliangazelles that used areas within 10 km of the barriers at least once during the tracking periods(n = 16; from Ito et al. 2013a)
14 Habitat Fragmentation by Railways as a Barrier to Great … 239

Fig. 14.8 a Study area of a Mongolian gazelle carcass census conducted along the Ulaanbaatar–Beijing Railway in June 2005 and ranges of each zone. Open squares are locations of major townsand the start- and end-points of the carcass census. The hatched line represents the railway.b Carcass numbers of Mongolian gazelles on the southwestern and northeastern sides of theUlaanbaatar–Beijing Railway in each zone. We categorized carcasses according to whether wefound them outside or inside railway fences (from Ito et al. 2008)
240 T.Y. Ito et al.

carcasses were recorded (Olson 2012). Although the carcass distribution patterns indifferent years were similar, there were also some differences. An area of highcarcass density existed to the southeast of Ayrag Town in the 2005 survey(Fig. 14.8), but a high density was found to the northwest of the town in the 2011survey. We attribute this interannual difference among areas of high carcass densityto the high environmental unpredictability, which leads to changes in the locationsof suitable sites for wild ungulates. Thus, the areas with high carcass density in oneyear do not necessarily indicate that these are the best sites to implement wildlifecrossings. However, because Mongolian gazelles likely have a learning capacity,the sites are still good candidates given that gazelles had previously used theseareas. For example, some tracked gazelles came back from several hundred kilo-meters to the same location in the following summer (Ito et al. 2013b).
Carcasses were also found inside the fenced area (Fig. 14.8), suggesting that thefences did not form a total barrier to wild ungulates. The existence of carcassesinside the fences might be explained by the fact that plant biomass is more abundant
Fig. 14.8 (continued)
14 Habitat Fragmentation by Railways as a Barrier to Great … 241

inside the fence at the beginning of winter, because these areas are not usuallygrazed by livestock or wild ungulates during summer. Therefore, the area inside thefences may be attractive for herbivores in winter, leading to some ungulates tryingto enter it. Once inside the fenced area, the animal may not be able to find suitablelocations to jump or crawl out of the fence again or may become too weak to do so.Note, however, that we found some carcasses entangled in the fence’s barbed wires(Fig. 14.9), suggesting that the fence itself is a cause of mortality.
Several questions remain concerning the interpretation of areas of high carcassdensity. For example, was animal density simply higher in these areas? Did a largenumber of animals try to cross there because the area looked easy to pass? Did thearea have any intrinsic factors that cause higher mortality? For example, do thefence structures easily entangle animals, making it difficult to escape once inside?
Finally, the genetic structure of the gazelle populations sampled in the 2005survey was not different between the two sides of the railway (Okada et al. 2012,2015). This can be explained by animals occasionally crossing the railway viaunderpasses and areas with broken fences, and other permeable areas. In addition,the survey was conducted just about 50 years after the railway’s construction,which is not enough time for genetic differentiation given the relatively longlifespan of the species. Therefore, the genetic structure of wild ungulate populationsmay differentiate in the future if the railway barrier effects persist.
Fig. 14.9 Carcass of a Mongolian gazelle entangled in a railway fence of the Ulaanbaatar–BeijingRailway
242 T.Y. Ito et al.

Railway Development as a Threat to Wildlife
Mongolia’s Gobi-Steppe Ecosystem is facing the threats of new railway develop-ment (Batsaikhan et al. 2014). Large mining projects are being developed insouthern Mongolia, and there are plans to develop a railway network to transportmining products and connect cities. In fact, construction has already started in someregions. The new railways run through the central distribution ranges of theMongolian gazelle, the goitered gazelle, and the Asiatic wild ass (Fig. 14.2). If thenew railways have barrier effects similar to those of the existing railway, then theungulates’ habitat will be further fragmented into smaller areas. The railways alsocross the distribution ranges of the critically endangered wild Bactrian camel(Camelus ferus), the reintroduced Przewalski’s horse (Equus ferus przewalskii), andthe saiga antelope (Saiga tatarica). Przewalski’s horse was once extinct in the wild,but it is currently only ranked as an endangered species by the IUCN Red Listbecause its populations have successfully increased after its reintroduction (Kinget al. 2016). However, future recovery of the distributions and population numbersof these endangered ungulates may be threatened by the new railways.
Railways also attract human activities to their vicinities that have potential neg-ative impacts on wildlife. Olson et al. (2011) reported that in eastern Mongolia, theMongolian gazelle density was lower in areas with households than in areas with nohouseholds. One detrimental impact of an increased human population is the increasein livestock. Mongolian gazelles have food habits similar to those of domestic sheepand goats (Campos-Arceiz et al. 2004; Yoshihara et al. 2008), and the food habits ofthe Asiatic wild ass are similar to those of the domestic horse (Taro Sugimoto,personal communication). Thus, food competition between wild ungulates andlivestock would likely become more severe if the livestock density increases.Hunting and poaching by humans may also decrease populations of wild ungulates.
Habitat fragmentation has caused regional extinctions of many animal species invarious regions of the world (see Chap. 4). Even if the ungulate populations inMongolia’s Gobi-Steppe Ecosystem persist in the smaller habitat fragments pro-duced by railways, their great migrations might disappear in the future. Thesespectacular migrations need both continuous vast areas and large animal popula-tions. To maintain large wild ungulate populations in Mongolia, it is essential thatthe accessibility to wide ranges is maintained, due to the high environmentalunpredictability in this region.
To maintain accessibility after the construction of new railways, it will benecessary to construct suitable wildlife crossings at regular intervals. Sectionswithout fences in areas with low livestock densities will be also effective. Inaddition, maintaining the ecosystem in good condition is also necessary, forexample, by avoiding land-use changes to farmland, human residential areas, orroad networks and by avoiding land degradation due to overgrazing by livestock.Maintaining good conditions of the ecosystem across wide ranges will be effectivefor the conservation of both wild ungulates and biodiversity in the ecosystem.
14 Habitat Fragmentation by Railways as a Barrier to Great … 243

Acknowledgements This study was funded by the Japan Ministry of Education, Culture, Sports,Science, and Technology’s Grants-in-Aid for Scientific Research 14405039, 18255002, 20255001,24510326, 25220201, 15K06931.
References
Batsaikhan, N., Buuveibaatar, B., Chimed, B., Enkhtuya, O., Galbrakh, D., Ganbaatar, O., et al.(2014). Conserving the world’s finest grassland amidst ambitious national development.Conservation Biology, 28, 1736–1739.
Batsaikhan, N., Samiya, R., Shar, S., & King, S. R. B. (2010). A field guide to the mammals ofMongolia. London: Zoological Society of London.
Berger, J. (2004). The last mile: How to sustain long-distance migration in mammals.Conservation Biology, 18, 320–331.
Campos-Arceiz, A., Takatsuki, S., & Lhagvasuren, B. (2004). Food overlap between Mongoliangazelles and livestock in Omnogobi, southern Mongolia. Ecological Research, 19, 455–460.
Fernandez-Gimenez, M. E., Batkhishig, B., & Batbuyan, B. (2012). Cross-boundary andcross-level dynamics increase vulnerability to severe winter disasters (dzud) in Mongolia.Global Environmental Change-Human and Policy Dimensions, 22, 836–851.
Fernandez-Gimenez, M. E., Batkhishig, B., Batbuyan, B., & Ulambayar, T. (2015). Lessons fromthe dzud: Community-based rangeland management increases the adaptive capacity ofMongolian herders to winter disasters. World Development, 68, 48–65.
Imai, S., Ito, T. Y., Kinugasa, T., Shinoda, M., Tsunekawa, A., & Lhagvasuren, B. (2017). Effectsof spatiotemporal heterogeneity of forage availability on annual range size of Mongoliangazelles. Journal of Zoology, 301, 133–140.
Ito, T. Y., Miura, N., Lhagvasuren, B., Enkhbileg, D., Takatsuki, S., Tsunekawa, A., et al. (2005).Preliminary evidence of a barrier effect of a railroad on the migration of Mongolian gazelles.Conservation Biology, 19, 945–948.
Ito, T. Y., Miura, N., Lhagvasuren, B., Enkhbileg, D., Takatsuki, S., Tsunekawa, A., et al. (2006).Satellite tracking of Mongolian gazelles (Procapra gutturosa) and habitat shifts in theirseasonal ranges. Journal of Zoology, 269, 291–298.
Ito, T. Y., Okada, A., Buuveibaatar, B., Lhagvasuren, B., Takatsuki, S., & Tsunekawa, A. (2008).One-sided barrier impact of an international railroad on Mongolian gazelles. Journal ofWildlife Management, 72, 940–943.
Ito, T. Y., Lhagvasuren, B., Tsunekawa, A., Shinoda, M., Takatsuki, S., Buuveibaatar, B., et al.(2013a). Fragmentation of the habitat of wild ungulates by anthropogenic barriers in Mongolia.PLoS ONE, 8, e56995.
Ito, T. Y., Tsuge, M., Lhagvasuren, B., Buuveibaatar, B., Chimeddorj, B., Takatsuki, S., et al.(2013b). Effects of interannual variations in environmental conditions on seasonal rangeselection by Mongolian gazelles. Journal of Arid Environments, 91, 61–68.
Jiang, Z., Takatsuki, S., Gao, Z., & Jin, K. (1998). The present status, ecology and conservation ofthe Mongolian gazelle, Procapra gutturosa: A review. Mammal Study, 23, 63–78.
Kaczensky, P., Sheehy, D. P., Johnson, D. E., Walzer, C., Lhkagvasuren, D., & Sheehy, C. M.(2006). Room to roam? The threat to khulan (wild ass) from human intrusion. Washington, D.C.: World Bank.
Kaczensky, P., Ganbaatar, O., von Wehrden, H., & Walzer, C. (2008). Resource selection bysympatric wild equids in the Mongolian Gobi. Journal of Applied Ecology, 45, 1762–1769.
Kaczensky, P., Ito, T. Y., & Walzer, C. (2010). Satellite telemetry of large mammals in Mongolia:What expectations should we have for collar function? Wildlife Biology in Practice, 6,108–126.
244 T.Y. Ito et al.

Kaczensky, P., Ganbataar, O., Altansukh, N., Enkhsaikhan, N., Stauffer, C., & Walzer, C. (2011a).The danger of having all your eggs in one basket: Winter crash of the re-introducedPrzewalski’s horses in the Mongolian Gobi. PLoS ONE, 6, e28057.
Kaczensky, P., Kuehn, R., Lhagvasuren, B., Pietsch, S., Yang, W. K., & Walzer, C. (2011b).Connectivity of the Asiatic wild ass population in the Mongolian Gobi. BiologicalConservation, 144, 920–929.
Kaczensky, P., Lkhagvasuren, B., Pereladova, O., Hemami, M., & Bouskila, A. (2015). Equushemionus. The IUCN Red List of Threatened Species 2015, e.T7951A45171204. doi:10.2305/IUCN.UK.2015-4.RLTS.T7951A45171204.en
King, S. R. B., Boyd, L., Zimmerman, W., & Kendall, B. E. (2016). Equus ferus. The IUCN RedList of Threatened Species 2016, e.T41763A97204950.
Leimgruber, P., McShea, W. J., Brookes, C. J., Bolor-Erdene, L., Wemmer, C., & Larson, C.(2001). Spatial patterns in relative primary productivity and gazelle migration in the easternsteppes of Mongolia. Biological Conservation, 102, 205–212.
Lhagvasuren, B., & Milner-Gulland, E. J. (1997). The status and management of the Mongoliangazelle Procapra gutturosa population. Oryx, 31, 127–134.
Luo, Z., Liu, B., Liu, S., Jiang, Z., & Halbrook, R. S. (2014). Influences of human and livestockdensity on winter habitat selection of Mongolian gazelle (Procapra gutturosa). ZoologicalScience, 31, 20–30.
Mallon, D. P. (2008a). Gazelle subgutturosa. The IUCN Red List of Threatened Species 2008, e.T8976A12945246. doi:10.2305/IUCN.UK.2008.RLTS.T8976A12945246.en/
Mallon, D. P. (2008b). Procapra gutturosa. The IUCN Red List of Threatened Species 2008, e.T18232A7858611. doi:10.2305/IUCN.UK.2008.RLTS.T18232A7858611.en
Mallon, D. P., & Jiang, Z. (2009). Grazers on the plains: Challenges and prospects for largeherbivores in central Asia. Journal of Applied Ecology, 46, 516–519.
Morinaga, Y., Tian, S. F., & Shinoda, M. (2003). Winter snow anomaly and atmosphericcirculation in Mongolia. International Journal of Climatology, 23, 1627–1636.
Mueller, T., & Fagan, W. F. (2008). Search and navigation in dynamic environments: Fromindividual behaviors to population distributions. Oikos, 117, 654–664.
Mueller, T., Olson, K. A., Dressler, G., Leimgruber, P., Fuller, T. K., Nicolson, C., et al. (2011).How landscape dynamics link individual- to population-level movement patterns: Amultispecies comparison of ungulate relocation data. Global Ecology and Biogeography, 20,683–694.
Mueller, T., Olson, K. A., Fuller, T. K., Schaller, G. B., Murray, M. G., & Leimgruber, P. (2008).In search of forage: Predicting dynamic habitats of Mongolian gazelles using satellite-basedestimates of vegetation productivity. Journal of Applied Ecology, 45, 649–658.
Nandintsetseg, B., & Shinoda, M. (2011). Seasonal change of soil moisture in Mongolia: Itsclimatology and modelling. International Journal of Climatology, 31, 1143–1152.
National Statistical Office of Mongolia. (2016). Mongolian statistical information service. http://www.1212.mn/en/contents/stats/contents_stat_fld_tree_html.jsp
Okada, A., Ito, T. Y., Buuveibaatar, B., Lhagvasuren, B., & Tsunekawa, A. (2012). Geneticstructure of Mongolian gazelle (Procapra gutturosa): the effect of railroad and demographicchange. Mongolian Journal of Biological Sciences, 10, 59–66.
Okada, A., Ito, T. Y., Buuveibaatar, B., Lhagvasuren, B., & Tsunekawa, A. (2015). Geneticstructure in Mongolian gazelles based on mitochondrial and microsatellite markers.Mammalian Biology, 80, 303–311.
Olson, K. (2012). Wildlife crossing options along existing and planned Mongolian railwaycorridors. Washington D.C.: World Bank.
Olson, K. A., Fuller, T. K., Mueller, T., Murray, M. G., Nicolson, C., Odonkhuu, D., et al. (2010).Annual movements of Mongolian gazelles: Nomads in the eastern steppe. Journal of AridEnvironments, 74, 1435–1442.
Olson, K. A., Mueller, T., Kerby, J. T., Bolortsetseg, S., Leimgruber, P., Nicolson, C. R., et al.(2011). Death by a thousand huts? Effects of household presence on density and distribution ofMongolian gazelles. Conservation Letters, 4, 304–312.
14 Habitat Fragmentation by Railways as a Barrier to Great … 245

Olson, K. A., Mueller, T., Bolortsetseg, S., Leimgruber, P., Fagan, W. F., & Fuller, T. K. (2009a).A mega-herd of more than 200,000 Mongolian gazelles Procapra gutturosa: a consequence ofhabitat quality. Oryx, 43, 149.
Olson, K. A., Mueller, T., Leimgruber, P., Nicolson, C., Fuller, T. K., Bolortsetseg, S., et al.(2009b). Fences impede long-distance Mongolian gazelle (Procapra gutturosa) movements indrought-stricken landscapes. Mongolian Journal of Biological Sciences, 7, 45–50.
Reading, R. P., Mix, H. M., Lhagvasuren, B., Feh, C., Kane, D. P., Dulamtseren, S., et al. (2001).Status and distribution of khulan (Equus hemionus) in Mongolia. Journal of Zoology, 254,381–389.
Sasaki, T., Okayasu, T., Jamsran, U., & Takeuchi, K. (2008). Threshold changes in vegetationalong a grazing gradient in Mongolian rangelands. Journal of Ecology, 96, 145–154.
Tachiiri, K., & Shinoda, M. (2012). Quantitative risk assessment for future meteorologicaldisasters: Reduced livestock mortality in Mongolia. Climatic Change, 113, 867–882.
Teitelbaum, C. S., Fagan, W. F., Fleming, C. H., Dressler, G., Calabrese, J. M., Leimgruber, P.,et al. (2015). How far to go? Determinants of migration distance in land mammals. EcologyLetters, 18, 545–552.
Vandandorj, S., Gantsetseg, B., & Boldgiv, B. (2015). Spatial and temporal variability invegetation cover of Mongolia and its implications. Journal of Arid Land, 7, 450–461.
Yoshihara, Y., Ito, T. Y., Lhagvasuren, B., & Takatsuki, S. (2008). A comparison of foodresources used by Mongolian gazelles and sympatric livestock in three areas in Mongolia.Journal of Arid Environments, 72, 48–55.
Yu, F., Price, K. P., Ellis, J., Feddema, J. J., & Shi, P. (2004). Interannual variations of thegrassland boundaries bordering the eastern edges of the Gobi Desert in central Asia.International Journal of Remote Sensing, 25, 327–346.
Open Access This chapter is licensed under the terms of the Creative Commons Attribution 4.0International License (http://creativecommons.org/licenses/by/4.0/), which permits use, sharing,adaptation, distribution and reproduction in any medium or format, as long as you give appropriatecredit to the original author(s) and the source, provide a link to the Creative Commons license andindicate if changes were made.The images or other third party material in this chapter are included in the chapter’s Creative
Commons license, unless indicated otherwise in a credit line to the material. If material is notincluded in the chapter’s Creative Commons license and your intended use is not permitted bystatutory regulation or exceeds the permitted use, you will need to obtain permission directly fromthe copyright holder.
246 T.Y. Ito et al.

Chapter 15Railway Ecology—Experiencesand Examples in the Czech Republic
Z. Keken and T. Kušta
Abstract The range of direct and indirect effects of railway transport on animals,plants, ecological processes and the actual ecosystems vary considerably. Railwaytransport operations and infrastructure building lead to environmental pollution,loss or conversion of habitats, landscape fragmentation and, last but not least, toanimal mortality caused by collisions with passing trains. The impact of railways isdetermined by the nature of railway infrastructure, which is not as significant in theCzech Republic as road infrastructure, yet it is one of the densest in Europe. Animportant feature is relatively low electrification (about 33% of the lines) and thelength of multi-track lines (about 20%). In the coming years, we can expect massiveinvestments in revitalization, optimization and modernization of the railways in theCzech Republic, and eventually their electrification. To connect the crucialtrans-European lines and all regions it will be necessary to complete the basicnetwork of high-speed railways. Based on these facts we can say that the signifi-cance of railway ecology in the Czech Republic will grow with the amount ofinvestment activities implemented in the railway network. In the past, similardevelopment took place with road infrastructure, and therefore there is an oppor-tunity to learn from it. To mitigate the direct effects of railways on wildlife, on thebasis of previous experience in the Czech Republic we recommend working pri-marily with management measures. These are both in terms of wildlife managementand the management of habitats in the area of transport infrastructure.
Keywords Habitat fragmentation � Train accident � Traffic mortality �Wildlife-train collision � Wildlife-vehicle collision
Z. Keken (&)Department of Applied Ecology, Faculty of Environmental Sciences, Czech University ofLife Sciences Prague, Kamýcká 129, 165 21 Praha 6, Suchdol, Czech Republice-mail: [email protected]
T. KuštaDepartment of Game Management and Wildlife Biology, Faculty of Forestry and WoodSciences, Czech University of Life Sciences Prague, Kamýcká 129, 165 21 Praha 6, Suchdol,Czech Republic
© The Author(s) 2017L. Borda-de-Água et al. (eds.), Railway Ecology,DOI 10.1007/978-3-319-57496-7_15
247

Introduction
Railway transport is more environmentally sustainable than road transport(Operational programme Transport 2014) and therefore more preferable forinvestment from EU structural funds (Partnership Agreement with the CzechRepublic 2014). Therefore, we can expect that major construction activities, such asrevitalization of train tracks, optimization, and the actual expansion of railwayinfrastructure, will continue on railway networks across the EU member states infuture decades, also in connection with fulfilling objectives in combating climatechange by developing low-carbon transport systems (European Commission 2011).
One of the major problems of nature and landscape protection at the turn of the21st century is the fragmentation of natural habitats by settlements and transportinfrastructure (Kušta et al. 2017). Railway transport is involved in this phenomenonas well (Anděl et al. 2010a). Railways can be a significant barrier to the migrationof large mammals (Kušta et al. 2014b), especially high-speed railways, which inEurope are usually enclosed, thereby preventing large mammals from crossing them(Groot and Hazebroek 1996). Noise barriers along railway corridors also signifi-cantly contribute to the fragmentation of the landscape, creating an impenetrablebarrier. Other factors negatively affecting migration near railway infrastructureinclude noise and light pollution, but also a higher level of human activities, forexample maintenance (Dussault et al. 2006; Jaren et al. 1991) or development ofresidential and commercial activities.
To show the degree of landscape fragmentation, the method of expressingUnfragmented Area by Traffic (UAT) is very often used (Illmann et al. 2000;Gawlak 2001; Binot-Hafke et al. 2002; Anděl et al. 2005; Anděl et al. 2010b). UATis the part of the landscape which simultaneously fulfils two conditions: (1) it isbounded either by roads with an annual average daily traffic volume higher than1000 vehicles/day, or by multi-track railways; and (2) it has an area greater than orequal to 100 km2 (Anděl et al. 2010a). In the context of railway transport, theproblem when expressing UAT is mainly seen with multi-track railways; however,research carried out in recent years suggests that even single-track railways withlower traffic intensity can be problematic in terms of railway ecology (Kušta et al.2014b), and therefore more attention should be paid to them.
The key task is the integration of landscape fragmentation issues and theirresulting effects into decision-making processes at all levels, from international andnational concepts up to actual investment projects (Fig. 15.1).
Railway Network in the Czech Republic
Railway transport in the Czech Republic has its origins in the first third of the 19thcentury. The Czechoslovak Republic took over the network at its inception in 1918,after the collapse of the Austro-Hungarian Empire. The dominant owner, builder
248 Z. Keken and T. Kušta

and operator of railway lines in the Czech Republic throughout history has been thestate. Currently, the state owns the majority of railway lines in the Czech Republic,represented by the state organization Railway Infrastructure Administration. CzechRailways are the largest national carrier.
The railway network in the Czech Republic is relatively inefficient by Europeanstandards, being characterized by its low technical level (insufficient ground speedand frequent drops in speed, low capacity, insufficient interoperability and insuf-ficient standards for freight). The reasons for this include the fact that much of theinfrastructure is obsolete, with previously neglected maintenance and high opera-tional costs.
The total length of railway lines in the Czech Republic is 9566 km (CSO 2015).About 33% (3153 km) of the length of constructed lines are electrified, and 20%(1858 km) of lines are two tracks. Only 0.38% (36 km) of lines are three andmulti-track. In terms of maximum speed, about 38% of tracks are in the category<60 km/h, 26% of tracks in the category 60–80 km/h, 22% of tracks in the category80–120 km/h and 14% of tracks in the category 120–160 km/h (Fig. 15.2).
In 2014, 176.05 million passengers were transported by railway in the CzechRepublic. The average transport distance was approximately 44.3 km. The averagetransport distance is increasing: in 1995 it was only 35.2 km. In terms of the
Fig. 15.1 Road and railway and wildlife, overview of implication and general way of solution
15 Railway Ecology—Experiences and Examples in the Czech Republic 249

amount of transported goods, 91.6 million tons of goods were transported byrailway with an average transport distance of 159.2 km in 2014 (CSO 2015).
In 2014, 104 serious accidents happened on the railway in the Czech Republic,resulting in 29 fatalities and 60 people seriously injured. Property damage was151.7 million CZK (CSO 2015).
Railway Versus Road Infrastructure in the Czech Republic
The problem of animal mortality, often discussed in relation to road transport, isonly marginally known in the case of railways. There are only a few studies thatquantify the impact of railways on the mortality of wildlife (e.g. Andersen et al.1991; Child 1983; Kušta et al. 2011; Kušta et al. 2014a, b; Paquet and Callaghan1996; Wells et al. 1999).
Although railway infrastructure in the Czech Republic is significantly lessextensive compared to road infrastructure (Fig. 15.3), it is one of the densest inEurope. The overall density of railways is 0.12 km/km2, while road density isapproximately six times higher (0.7 km/km2) (for comparison, the density of rail-ways in Poland is 0.071 km/km2, in Italy 0.065 km/km2, in Sweden 0.025 km/km2,and the average in the EU is 0.053 km/km2). In the Czech Republic in many cases,the main railway corridors are parallel with the main roads.
Fig. 15.2 Categorization of railways in the Czech Republic (location in Europe in inset) bymaximal speed
250 Z. Keken and T. Kušta

Future Perspectives for Railway Infrastructure Development
To define good practice within Railway Ecology, as well as Road Ecology, it isnecessary to put the acquired knowledge and experience into context with theplanned strategic development of transport infrastructure. This is because a sum-mary measure of impact affecting both the environment and public health will begenerated from the nature of future development directions and extension as well.
Based on White Paper on transport (2011), The European Commission adopted aroadmap of 40 concrete initiatives for the next decade to build a competitivetransport system that will increase mobility, remove major barriers in key areas andfuel growth and employment. At the same time, the proposals will dramaticallyreduce Europe’s dependence on imported oil and cut carbon emissions in transport
Fig. 15.3 Road versus railway infrastructure in the Czech Republic
15 Railway Ecology—Experiences and Examples in the Czech Republic 251

by 60% by 2050. According to the general requirements of this roadmap, plannedrailway development in the EU member states can be described as follows:
• Implement structural changes that would enable railways to compete effectivelyand take a significantly higher proportion of freight and passengers over mediumand long distances.
• By 2030, 30% of road freight transport over 300 km should be transferred toother means such as railway or ship transportation, and by 2050 it should bemore than 50%.
• Finish the European high-speed railway network by 2050. Triple the length ofthe existing high-speed railway networks by 2030 and maintain a dense railwaynetwork in all EU member states. By 2050, most passengers over mediumdistance should travel by railway.
• By 2050, link all core network airports (T-ENT) with the railway network,preferably high-speed; ensure that all major seaports are connected to the rail-way freight transport and, where appropriate, to inland waterways.
Meeting these goals will require massive development of the railway infras-tructure across EU member states, both in towns and their immediate surroundings,as well as in the open countryside. In the case of the Czech Republic, various kindsof investments will be needed, from revitalization, optimization and modernizationof railways to retrofitting the existing railways with modern security systems, andeventually their electrification. Next, we need to take into account the completion ofa basic network of railway lines that will provide connection to the crucialtrans-European lines, linking all regions, connection of Prague international airportto the long-distance railway network, and solutions for major urban and suburbanlinkages (Operational programme Transport 2014).
Railway Ecology Experience in the Czech Republic
Obtaining data on train accidents with wild animals is very difficult. One reason isprobably that these accidents very rarely involve human injuries or propertydamage (Steiner et al. 2014). It is common knowledge that many animals are killeddue to railway transport (Kušta et al. 2014b).
In the Czech Republic there is no database where accidents between trains andanimals are recorded. This contrasts with road accidents, where the reported acci-dents are registered by the Police of the Czech Republic. In case of railways somedata is obtained from employees of Czech Railways, and it is often the only way toget more detailed information (in particular the exact time and location of theaccident). A site visit will only give data on the location of the accident, not time orother information. Also, it is not easy to find the carcasses near the track becausethey can be thrown into the surrounding vegetation. Most of the studies addressingthis topic struggled with the issue of obtaining input on wildlife-train collision
252 Z. Keken and T. Kušta

(WTC) (e.g. Becker and Grauvogel 1991; Jaren et al. 1991; Muzzi and Bisset1990).
The first known study in the Czech Republic dealing with the influence ofrailways on animals was the study by Havlín (1987), which focused on animalmortality caused by railways in the agrarian landscape. A 314-km long railway linein the South Moravia Region was studied between 1981 and 1986. In that period,91 birds (19 species) and 149 mammals (11 species) were killed. The most com-mon species were European hare (Lepus europaeus) and common pheasant(Phasianus colchicus).
Another well-known study in the Czech Republic was carried out on the trackbetween Trhový Štěpánov and Benešov u Prahy (Jankovský and Čech 2001). Thetrack is 33 km long and it crosses many very different habitats and therefore enablesa more comprehensive view of the impacts of railways. The first research on thistrack was carried out in the winter of 1999–2000. The research was based on fieldtrips and analysis of skeletal findings of animals killed by train. The results showthat Leporidae were hit in 32% of cases, Even-toed ungulates in 22% [in the vastmajority of cases, roe deer (Capreolus capreolus)], Carnivora in 18%, Birds in10%, Insectivora in 4% and Reptiles in 2%. The findings of physical remnants weretied to those sections where the track does not form a significant barrier height,whether by an embankment or a cutting. At areas significantly banked and oftenvegetated by shrubs, many pheasant carcasses were found. In May 2006, repeatedresearch was carried out on the track between Trhový Štěpánov and Benešov uPrahy which, among other findings, found an increase in the mortality of roe deer(Jankovský and Čech 2008).
Kušta et al. (2014b) published the results of the monitoring of roe deer deaths in2009 on four train tracks (regional as well as local): (1) Plzeň–Horažďovice;(2) Bělčice–Závišín; (3) Obrataň–Jindřichův Hradec; (4) Dobrá Voda uPelhřimova–Hříběcí. The research showed that collisions of trains with roe deeroccur most frequently in winter. The results of this study show that when evaluatinganimal mortality the specific context should be taken into account (location, cli-matic conditions, animal abundance in the location, its biology and ethology,railway transport intensity, etc.). For example, on the monitored track Dobrá Vodau Pelhřimova–Hříběcí, collisions with roe deer occurred most often in summermonths, while on the track Jedlová–Chřibská in winter months. Both tracks lie atapproximately the same altitude (650 m a.s.l.) and about the same number of trainsuse them weekly (132 and 197).
Interestingly, railway accidents most often occur in winter, while accidents onroads occur less frequently in winter (Hothorn et al. 2012; Kušta et al. 2014a; Kuštaet al. 2017; Pokorný 2006). Therefore railway transport can influence animalbehaviour in a different way than road transport. It is necessary to look for thereasons why accidents happen so often in this season. In the Czech Republic it maybe due to the attractive food availability, which is in the immediate vicinity of thetracks in the winter (wild raspberry bushes, etc.). This explanation is also supportedin other studies (Bowman et al. 2010; Rea et al. 2010; Marchand 1996). In the
15 Railway Ecology—Experiences and Examples in the Czech Republic 253

winter months the cleared track can also act as a migration corridor. On sunny days,it can serve as a resting place for animals (Seiler 2005).
Kušta et al. (2014b) found a connection between the number of accidents and thefrequency of passing trains, a pattern also reported in other studies (Danks andPorter 2010; Hussain et al. 2007; Seiler 2004). On the other hand, there was nocorrelation between accidents and the abundance of wildlife around the monitoredtracks. The study also found that there were more accidents on tracks with moremeadows and fields around them than on tracks with prevailing forest. However,significant differences in accidents in different types of habitats (meadows, forestsand scrubland) were not statistically confirmed. According to the information fromemployees of Czech Railways, the most frequent collisions with animals occur inopen flat sections of the track, especially at dawn, dusk or at night. This is probablycaused by grazing ungulates in these locations and their greater physical activity atdusk and dawn (Kušta et al. 2017), which can correlate with temporal patterns ofwildlife-vehicle collision (WVC) on roads (Kušta et al. 2017).
Good Practice and Recommendation for Future Action
Decision Making Process
For individual investment plans, the permissible level of environmental impact isalready pre-defined within a strategic level by SEA procedure (StrategicEnvironmental Assessment) and at a project level by EIA procedure(Environmental Impact Assessment). In the future, the results of the evaluation needto be considered, especially through the implementation of EIA Follow-up(Environmental Impact Assessment post-project analysis). To ensure more accuratepredictions and more effective mitigation measures, the existing railways need tocompare the predicted impacts with the ones that occurred in reality and definerecommendations for future authorization procedures based on these comparisons.
Technical Measures
Technical measures against accidents with animals on railway tracks are not veryfrequent. For example, measures for reducing drive-through speed of trains orwarning devices are placed (Becker and Grauvogel 1991; Muzzi and Bisset 1990),noise warning devices are installed (Boscagli 1985; Child 1983), the ground speedof trains is reduced (Becker and Grauvogel 1991; Child 1983), snow along therailway is cleaned up, enabling animals to escape from the corridor when snow isdeep (Child 1983; Child et al. 1991), carcasses are removed from around the tracks(Gibeau and Heuer 1996), spilled cereal grains and other food sources are cleaned
254 Z. Keken and T. Kušta

from around the tracks and occurrence of this spillage is prevented (Gibeau andHeuer 1996; Wells et al. 1999), or fences are built along the tracks (Boscagli 1985).
In the Czech Republic, the above mentioned technical measures are used quiterarely. The most common technical solution is the application of odour repellentsnear railway tracks. However, their effectiveness is questionable. Their effective-ness depends on many factors. Among them is, for example, seasonal food avail-ability and its nutritional value (Van Beest et al. 2010), weather, frequency ofproduct application and its concentration (Diaz-Varela et al. 2011; Knapp et al.2004; Wagner and Nolte 2001). The reason for the ineffectiveness of repellents canoften be the excessive disturbance of animals (e.g. by hunting), which then changestheir behaviour (Benhaiem et al. 2008) making them less responsive to the repel-lents. The most probable reason for their frequent ineffectiveness is the fact that theenvironment around tracks is highly food-attractive for the animals and the appliedodours are not able to discourage the animals from being near the railway. Otherstudies (Elmeros et al. 2011; Schlageter and Haag-Wackernagel 2012a, b) came tosimilar conclusions, i.e. ineffectiveness of odour repellents in places with attractivefood for animals. In contrast, in the vicinity of roads, odour repellents appear to bean efficient tool to reduce the number of animals killed in collisions with cars(e.g. Kušta et al. 2015).
Management Measures
On the other hand, we recommend paying close attention to management measures,whose implementation is often the cheapest and can be most effective option ofsolving collisions.
We should study in detail the ecological and behavioural needs of animals thatare threatened by railway transport. It is very important to identify critical areaswhere collisions occur most frequently and establish databases on animal mortalityon railways with the information on location, time and external collision factors.
Fencing is an option for sites with high collision rates, and also in the case ofmain corridors with significantly high capacity, but it requires maintenance and hasa major impact on the fragmentation of habitats and populations. For the widercountryside, the most important management measures include the management ofwildlife in such numbers that match the capacity of the environment (applies to thespecies that can be managed by hunting). Animals must not be overpopulated in agiven area in any case. Their high numbers do not only cause frequent damage toagricultural land, crops and forests, but also cause significantly frequent WTC aswell as WVC.
Furthermore, hunting must not interfere with the appropriate social structure (i.e.age and sex) of the population and a correct sex ratio must be retained. In thiscontext, the heads of the herd and their young need to be protected. This preventsexcessive migration of animals due to excessive stress and the need to find newlocations.
15 Railway Ecology—Experiences and Examples in the Czech Republic 255

In the Czech countryside it is common practice to give supplementary feed togame in the winter season. Knowledge of this feeding can be used to reducemigration and therefore even collisions (Kušta et al. 2017). It is important to placefeeding devices near animal resting areas so that they do not have to migrate insearch of food in winter, or even have to search for it intensively. Feeding devicesshould never be placed near railways, which would enable animals to concentratenear them.
Also, around railway tracks where the animals occur in higher numbers, veryintense hunting should be practiced within the hunting plan in the given territory.On the contrary, hunting should be reduced in areas where there is no danger ofWTC or wildlife-vehicle collision (WVC). In game management this correspondsto establishing so-called quiet zones: there is no hunting, peace and quiet is ensuredand food is supplied intensively. Suitable conditions for animals should also becreated in these locations (e.g. planting appropriate woody plants, planting feedingfield, etc.). Animals are then focused into them and protected. They can thus bedetained in a certain place, which will prevent their migration in search of foodacross railway tracks. The results of the study Kušta et al. (2017) show that whenanimals have suitable resting, cover and feeding conditions, they limit their physicalactivity to a minimum.
In the vicinity of transport infrastructure (road and railway) there are often hikingtrails, country lanes, or the area is used for recreation (walking, dog walking, etc.).Thus, resting animals are often disturbed and forced to cross a road or railway intheir escape, which may result in a collision with a passing vehicle or train. Peaceand quiet must be guaranteed, especially in winter, which is extremelyenergy-intensive for animals. For this reason, it is undesirable to let dogs movefreely when walking in the countryside in this period, especially around roads andrailways; in the Czech Republic there are very often successional areas with sparsevegetation or woody plants growing outside the forest, and the animals rest there(Keken et al. 2016).
A practical tool for reducing collisions with animals also appears to be removingvegetation from the immediate vicinity of the tracks (deciduous trees, herbs,brambles) and trimming browsing trees that are very attractive to animals from thefood point of view (Jaren et al. 1991) and also growing unattractive plant speciesalong railway tracks (Jaren et al. 1991; Gundersen and Andreassen 1998; Lavsundand Sandegren 1991). Some studies demonstrated a reduction of animal mortalitydue to a decrease in food supply along the tracks, for example a 56% reduction incollisions on a railway studied in Norway (Jaren et al. 1991). The measure consistedof the removal of vegetation 20–30 m along the train track. However, Sielecki(2000) states that this method is very costly.
256 Z. Keken and T. Kušta

Conclusion
Taking into account the worldwide research on this subject, it is obvious that thisissue is very topical and requires further thorough investigation. The planned futuregrowth of railway transport associated with an increase in the probability of col-lisions with animals must be treated as a nationwide issue with the involvement ofthe largest possible number of affected organizations, including governmentadministration, businesses farming on adjacent land, hunters, conservationists andothers.
Although it is very difficult and expensive to prevent animal mortality due tocollisions with road and railway transport, it is important to find solutions whichwill at least minimize these accidents. Above all, we propose: evaluating the risksassociated with the environment more efficiently and accurately in the plannedprojects within the decision-making process; providing feedback to individuallicensing procedures; paying close attention to management measures; andfocussing on technical measures in the riskiest sections.
Acknowledgements This chapter was supported by the Ministry of Agriculture of the CzechRepublic Grant No. QJ1220314. Further, authors would like to thank the Faculty of EnvironmentalSciences and the Faculty of Forestry and Wood Sciences at the Czech University of Life SciencesPrague for support during our research career.
References
Anděl, P., Gorčicová, I., Hlaváč, V., Miko, L., & Andělová, H. (2005). Assessment of landscapefragmentation caused by traffic. Liberec: Evernia.
Anděl, P., Mináriková, T., & Andreas, M. (Eds.). (2010a). Protection of landscape connectivity forlarge mammals. Liberec: Evernia.
Anděl, P., Petržílka, L., & Gorčicová, I. (2010b). Indikátory fragmentace krajiny. Liberec:Evernia.
Andersen, R., Wiseth, B., Pedersen, P. H., & Jaren, J. (1991). Moose–train collisions: Effects ofenvironmental conditions. Alces, 27, 79–84.
Becker, E. F., & Grauvogel, C. A. (1991). Relationship of reduced train speed on moose-traincollisions in Alaska. Alces, 27, 161–168.
Benhaiem, S., Delon, M., Lourtet, B., Cargnelutti, B., Aulagnier, S., Hewison, A. J. M., et al.(2008). Hunting increases vigilance levels in roe deer and modifies feeding site selection.Animal Behaviour, 76, 611–618.
Binot-Hafke, M., Illmann, J., Schäfer, H. J., & Wolf, D. (Eds.). (2002). Nature data 2002. Bonn:Bundesamt für Natruschutz.
Boscagli, G. (1985). Wolves, bears and highways in Italy: a short communication. In J. M. Bernard(Eds.), Proceedings highways and wildlife relationships (pp. 237–239). Ministsre deløÐquipement, du Logement, de løAmTnagement du Territoire et des Transports, Colmar,France.
Bowman, J., Ray, J. C., Magoun, A. J., Johnson, D. S., & Dawson, F. N. (2010). Roads, logging,and the large-mammal community of an eastern Canadian boreal forest. Canadian Journal ofZoology, 88, 454–467.
15 Railway Ecology—Experiences and Examples in the Czech Republic 257

Child, K. N. (1983). Railways and moose in the central interior of BC: A recurrent managementproblem. Alces, 19, 118–135.
Child, K. N., Barry, S. P., & Aitken, D. A. (1991). Moose mortality on highways and railways inBritish Columbia. Alces, 27, 41–49.
Czech Statistical Office. (2015). Statistical databases and registers of Czech Republic. Availablein internet. https://www.czso.cz/csu/czso/doprava_a_spoje (cited August 15, 2016).
Danks, Z. D., & Porter, F. P. (2010). Temporal, spatial, and landscape habitat characteristicsof moose-vehicle collisions in western Maine. The Journal of Wildlife Management, 74,1229–1241.
Diaz-Varela, E. R., Vazquez-Gonzalez, I., Marey-Perez, M. F., & Alverez-Lopez, C. J. (2011).B57 assessing methods of mitigating wildlife-vehicle collisions by accident characterizationand spatial analysis. Transport Research Part D, 16, 281–287.
Dussault, C., Poulin, M., Courtois, R., & Ouellet, J. P. (2006). Temporal and spatial distribution ofmoose-vehicle accidents in the Laurentides Wildlife Reserve, Quebec, Canada. WildlifeBiology, 12, 415–425.
Elmeros, M., Winbladh, J. K., Andersen, P. N., Madsen, A. B., & Christensen, J. T. (2011).Effectiveness of odour repellents on red deer (Cervus elaphus) and roe deer (Capreoluscapreolus): a field test. European Journal of Wildlife Research, 57, 1223–1226.
European Commission. (2011). Europe 2020: A European strategy for smart, sustainable, andinclusive growth. Brussels.
Gawlak, C. (2001). Unzerschnittene verkehrsarme Räume in Deutschland 1999. Natur undLandschaft, 76, 481–484.
Gibeau, M. L., & Heuer, K. (1996). Effects of transportation corridors on large carnivores in theBow River Valley, Alberta. In G. L. Evink, P. Garrett, D. Zeigler, & J. Berry (Eds.),Proceedings of the transportation related wildlife mortality seminar (pp. 58–96). Tallahassee,Florida: Florida Department of Transportation.
Groot, B., & Hazebroek, E. (1996). Ungulate traffic collisions in Europe. Conservation Biology,10, 1059–1067.
Gundersen, H., & Andreassen, H. P. (1998). The risk of moose (Alces alces) collision: Apredictive logistic model for moose-train accidents. Wildlife Biology, 4, 103–110.
Havlín, J. (1987). On the importance of railway lines for the life of avifauna in agrocoenoses. FoliaZoologica, 36, 345–358.
Hothorn, T., Brandl, R., & Müller, J. (2012). Large-scale model-based assessment of deer–vehiclecollision risk. PLoS ONE, 7, e29510.
Hussain, A., Armstrong, J. B., Brown, D. B., & Hogland, J. (2007). Land-use pattern,urbanization, and deer-vehicle collisions in Alabama. Human-Wildlife Conflicts, 1, 89–96.
Illmann, J., Lehrke, S., & Schäfer, H. J. (Eds.). (2000). Nature data 1999 (266 p.). Bonn:Bundesamt für Naturschutz.
Jankovský, M., & Čech, M. (2001). Railway tracks as the place for collisions with animals. Živa,1, 39–40.
Jankovský, M., & Čech, M. (2008). Železniční doprava a fauna v okolí tratě. Živa, 3, 136.Jaren, V. R., Anderson, R., Ulleberg, M., Pederson, P., & Wiseth, B. (1991). Moose–train
collisions: The effects of vegetation removal with a cost-benefit analysis. Alces, 27, 93–99.Keken, Z., Kušta, T., Langer, P., & Skaloš, J. (2016). Landscape structural changes between 1950
and 2012 and their role in wildlife–vehicle collisions in the Czech Republic. Land Use Policy,59, 543–556.
Knapp, K. K., Yi, X., Oakasa, T., Thimm, W., Hudson, E., & Rathmann, C. (2004). Deer–Vehiclecrash countermeasure toolbox: A decision and choice resource (263 p.). Wisconsin: MidwestRegional University Transportation Center.
Kušta, T., Holá, M., Keken, Z., Ježek, M., Zíka, T., & Hart, V. (2014a). Deer on the railwaylines: Spatiotemporal trends in mortality patterns of roe deer. Turkish Journal of Zoology, 38,479–485.
Kušta, T., Ježek, M., & Keken, Z. (2011). Mortality of large mammals on railway tracks. ScientiaAgriculturae Bohemica, 42, 12–18.
258 Z. Keken and T. Kušta

Kušta, T., Keken, Z., Barták, V., Holá, M., Ježek, M., Hart, V., et al. (2014b). The mortalitypatterns of wildlife-vehicle collisions in the Czech Republic. North-Western Journal ofZoology, 10, 393–399.
Kušta, T., Keken, Z., Ježek, M., Holá, M., & Šmíd, P. (2017). The effect of traffic intensity andanimal activity on probability of ungulate-vehicle collisions in the Czech Republic. SafetyScience, 91, 105–113.
Kušta, T., Keken, Z., Ježek, M., & Kůta, Z. (2015). Effectiveness and costs of odor repellents inwildlife–vehicle collisions: A case study in Central Bohemia, Czech Republic. TransportResearch Part D, 38, 1–5.
Lavsund, S., & Sandegren, F. (1991). Moose-vehicle relations in Sweden: A review. Alces, 27,118–126.
Marchand, P. J. (1996). Life in the cold: An introduction to winter ecology. Hanover, NH:University Press of New England.
Muzzi, P. D., & Bisset, A. R. (1990). Effectiveness of ultrasonic wildlife warning devices toreduce moose fatalities along railway corridors. Alces, 26, 37–43.
Operational programme Transport. (2014). Operational programme transport for the program-ming period 2014–2020. Ministry of Transport of the Czech Republic, Prague.
Paquet, P., Callaghan, C. (1996). Effects of linear developments on winter movements of graywolves in the Bow River Valley of Banff National Park, Alberta. In G. L. Evink, P. Garrett, D.Ziegler, & J. Berry (Eds.), Proceedings of the transportation related wildlife mortality seminar(113 pp.). Florida: Florida Department of Transportation, Tallahassee.
Partnership Agreement. (2014). Partnership Agreement for the programming period 2014–2020.Ministry of Regional Development of the Czech Republic, Prague.
Pokorný, B. (2006). Roe deer-vehicle collisions in Slovenia: Situation, mitigation strategy andcountermeasures. Veterinary Archives, 76, 177–187.
Rea, R. V., Child, K. N., Spata, D. P., & MacDonald, D. (2010). Road and rail side vegetationmanagement implications of habitat use by moose relative to brush cutting season.Environmental Management, 46, 101–109.
Schlageter, A., & Haag-Wackernagel, D. (2012a). Evaluation of an odor repellent for protectingcrops from wild boar damage. Journal of Pest Science, 85, 209–215.
Schlageter, A., & Haag-Wackernagel, D. (2012b). A gustatory repellent for protection ofagricultural land from wild boar damage: An investigation on effectiveness. Journal ofAgricultural Science, 4, 61–68.
Seiler, A. (2004). Trends and spatial patterns in ungulate-vehicle collisions in Sweden. WildlifeBiology, 10, 301–313.
Seiler, A. (2005). Predicting locations of moose–vehicle collisions in Sweden. Journal of AppliedEcology, 42, 371–382.
Sielecki, L. E. (2000). WARS wildlife accident reporting system 1999 annual report (1995–1999synopsis). Victoria, BC: Environmental Management Section, Ministry of Transportation andHighways.
Steiner, W., Leisch, F., & Hackländer, K. (2014). A review on the temporal pattern of deer-vehicleaccidents: Impact of seasonal, diurnal and lunar effects in cervids. Accident Analysis andPrevention, 66, 168–181.
Van Beest, F. M., Mysterud, A., Loe, L. E., & Milner, J. M. (2010). Forage quantity, quality anddepletion as scale-dependent mechanism driving habitat selection of a large browsingherbivore. Journal of Animal Ecology, 79, 910–922.
Wagner, K. K., & Nolte, D. L. (2001). Comparison of active ingredients and delivery systems indeer repellents. Wildlife Society Bulletin, 29, 322–330.
Wells, P., Woods, J. G., Bridegewater, G., Morrison, H. (1999). Wildlife mortalities on railways:Monitoring, methods and mitigation strategies. In G. L. Evink, P. Garrett, & D. Zeigler (Eds.),Proceedings of the Third International Conference on Wildlife Ecology and Transportation(pp. 85–88). FL-ER-73-99, Florida Department of Transportation, Florida.
White Paper on Transport. (2011). White paper—Roadmap to a single European transport area—Towards a competitive and resource efficient transport system. Brussels.
15 Railway Ecology—Experiences and Examples in the Czech Republic 259

Open Access This chapter is licensed under the terms of the Creative Commons Attribution 4.0International License (http://creativecommons.org/licenses/by/4.0/), which permits use, sharing,adaptation, distribution and reproduction in any medium or format, as long as you give appropriatecredit to the original author(s) and the source, provide a link to the Creative Commons license andindicate if changes were made.The images or other third party material in this chapter are included in the chapter’s Creative
Commons license, unless indicated otherwise in a credit line to the material. If material is notincluded in the chapter’s Creative Commons license and your intended use is not permitted bystatutory regulation or exceeds the permitted use, you will need to obtain permission directly fromthe copyright holder.
260 Z. Keken and T. Kušta

Chapter 16Ecological Roles of Railway Vergesin Anthropogenic Landscapes: A Synthesisof Five Case Studies in Northern France
J.-C. Vandevelde and C. Penone
Abstract This chapter presents the results of several studies realised between 2010and 2014 on the French railway network. We assessed several potential ecologicalroles for this network on various taxa: (1) habitat, (2) corridor/longitudinal connec-tivity along railways and (3) barrier/transversal connectivity across railways. Ourresults show that railway verges, contrary to common belief, can have positive effectsin anthropogenic landscapes for several taxa and communities. They can be habitatsfor semi-natural grassland plants, bats and orthopteran. They provide functionalconnectivity for some plants, but do not seem to increase it for highly mobile invasivespecies in urban landscapes. Railways also seem to be weaker barriers than roads forone butterfly species. We conclude by proposing a change in management practices,stressing that extensive management coupled with small-scale revegetation pro-cesses, either artificial or natural, may help increase the positive effects of railwayverges and counteract the negative large-scale effects of urbanisation.
Keywords Habitat � Corridor � Barrier � Agricultural landscape � Urban land-scape � Bat � Orthoptera � Plant � Butterfly � Railway verges management
Introduction
Changes in land-use are important drivers of biodiversity loss (MEA 2005). Linearinfrastructures such as roads and railways play a particular role in this process byaltering, artificializing and fragmenting landscapes (see previous chapters).
J.-C. Vandevelde (&)UMR 7204 (MNHN-CNRS-UPMC), Centre d’Ecologie et de Sciencesde la Conservation (CESCO), 43 rue Buffon, 75005 Paris, Francee-mail: [email protected]
C. PenoneInstitute of Plant Sciences, University of Bern,Altenbergrain 21, 3013 Bern, Switzerland
© The Author(s) 2017L. Borda-de-Água et al. (eds.), Railway Ecology,DOI 10.1007/978-3-319-57496-7_16
261

Nonetheless, linear infrastructure verges can also have positive roles for a largenumber of taxa (Hodkinson and Thompson 1997; Merriam and Lanoue 1990). Theycan be substitution habitats for grassland plants and insects (Saarinen et al. 2005;Wehling and Diekmann 2009), hence contribute to the conservation of indigenousflora (O’Farrell and Milton 2006) and fauna (Ries et al. 2001). They can also ensurestructural and functional connectivity when they penetrate artificial areas such asdense urban areas or agricultural-intensive landscapes (Tikka et al. 2001).
Among studies examining the effects of linear infrastructure verges, very fewfocused on railway verges, the majority concerning roadside verges (Forman et al.2002). Indeed, compared to roadside verges, railway verges occupy smaller sur-faces. Nevertheless, railway verges have at least two peculiarities worth consideringwhen compared to roadside verges. First, their potential positive effects on biodi-versity may be significant in human-dominated areas such as intensive agriculturalor urban landscapes due to their greater width margins and lower traffic intensity.Second, railway lines of many European countries are managed by one uniquemanager, allowing realistic biodiversity-friendly management (see discussion).
This chapter presents the results of five studies realised between 2009 and 2014on the French railway network. We assessed three potential ecological roles for thisnetwork: (1) habitat, (2) corridor/longitudinal connectivity along the railway and(3) barrier/transversal connectivity across the railway.
General Context and Methodology
We conducted five different studies in the Paris region, France (Fig. 16.1).Although densely populated, with 20% of the national population living in just 2%of the nation’s land area, and with a spreading urbanisation, the Paris region is stillpredominantly rural. Intensive farming covers 50% of the regional territory, woodsand natural land more than 25%, and urban areas and transport infrastructures coverabout 25%.
Fig. 16.1 Location of study sites in France (left panel) and in the Paris region (right panel)
262 J.-C. Vandevelde and C. Penone

Vegetation of railway verges in France
The studies described in this chapter were conducted along railway verges. Railwayverges are all the green areas that are beside the railway tracks. The total areaoccupied by railway verges in France is estimated by the railway owner, the SNCFRéseau company, at 50 000 hectares. The vegetation type on these green spaces isdictated by security reasons. Management is thus necessary but different in differentparts of the railway concerned:
– Tracks and lanes: the goal is the absence of vegetation to avoid platform/infrastructure deterioration. Total weed control is recommended once a year butdepends on the age of the infrastructure. For instance, a recent track, better drained,is less sensitive to plant colonization and is usually not treated for 10 year;
The verges can be separated in two main zones:
– The first zone is adjacent to the tracks and has variable width depending on theslope and surrounding landscape. Here the objective is to have an herbaceousvegetation to allow visibility and limit fire problems. These semi-naturalgrasslands are ideally managed by annual or multi-annual mowing depending onfire risks and on potential recolonisation by woody species;
– In the second zone, the desired vegetation can be higher depending on theirconfiguration: if the verge is lower compared to the tracks (fill section), the treesand shrubs are allowed to grow higher compared to a configuration where theverges are higher than the tracks (cut section). Management here does not needto be intensive and can be done every 3–5 years depending on the slope and thevegetation in the surrounding landscape.
We examined two types of railways: recently built high-speed railway lines(1994 and 2007) and long-established railway lines (built in the nineteenth century).In the high-speed lines, we studied verges from 10 to 20 m-wide, composed ofherbaceous species and shrubs. No vegetation management plan existed for theseverges. Clearcutting of trees and mowing were applied on a case-by-case basiswhen presenting threats for train security, e.g. risk of tree falling on overhead lines.The long-established lines traverse a landscape structured by different degrees ofurbanisation, as they cross numerous cities and towns from the centre of Paristowards the limits of the region. The vegetation found along the borders of the traintracks is mainly spontaneous as the verges have not been planted or sown sincetheir construction and is principally interrupted by railway stations and overpasses.
Roles of Railway Verges: Habitat, Corridor, Barrier
Railways as Habitats
Linear infrastructures can be substitution habitats for various taxa (O’Farrell andMilton 2006; Ries et al. 2001), however, hardly any studies focused properly on
16 Ecological Roles of Railway Verges in Anthropogenic Landscapes … 263

railways. We thus decided to examine the role of railway verges as a habitat for twogroups: common bats and Tettigoniidae (Orthoptera) (Vandevelde et al. 2014;Penone et al. 2013).
Bats Along Railway Verges in an Intensive Agricultural Landscape
Studies have shown that bat activity and species richness decrease whenapproaching a motorway (Berthinussen and Altringham 2012). Some studiesstressed particular negative effects, such as road casualties (Lesinski et al. 2011).Others found that roads formed strong barriers to the movements of bats within thelandscape (Bach et al. 2004; Kerth and Melber 2009; Abbott et al. 2012).
Yet, very few studies have focused on the potential positive effects of linearinfrastructures such as railway verges on bats. Some bat species fly along suchfeatures when commuting from roosts to foraging areas because these linear ele-ments could constitute commuting paths away from predators and wind (Limpensand Kapteyn 1991). In addition, some species forage regularly along linear ele-ments (Verboom and Huitema 1997). Indeed, foraging activity is facilitated close tothese features because of greater abundance of some preys (Verboom and Spoelstra1999). These contrasting behaviours among species may be linked to their specificforaging ecology (Kerth and Melber 2009).
We hypothesized that railway verges impacted negatively some species, par-ticularly gleaner species generally linked with forest habitat (such as species fromthe Myotis genus). These species could perceive railway verges as an inadequatehabitat and in addition could be impacted by the fragmentation effect of theseverges. Conversely, aerial hawking species that generally forage in more openhabitats, such as species of the genus Pipistrellus, Nyctalus or Eptesicus, couldbenefit from the edge effect of railway verges, using them as a foraging/commutinghabitat (Vandevelde et al. 2014).
To test this hypothesis, we examined the potential use by bats of railway vergescrossing woodland patches within an agricultural matrix as foraging/commutinghabitats. We tested whether (i) at a large scale (national level), railways lines wereglobally a preferred foraging/commuting habitat for these different common batsspecies, and (ii) at a local scale (landscape level), woodland-railway verges had aneffect on bat activity compared to other habitat types like woodland-field verges,woodland habitats and field habitats. At local scale, we also tested the influence oflandscape composition on bat activity over habitat types (Vandevelde et al. 2014).
We identified ten similar sites via aerial photographs and field visits: each siteconsisted of a railway portion of 600 m to 2 km long fragmenting a woodland patchwithin a farmland matrix. We used two distinct sets of data for bat calls.‘Local-scale’ data from railway sites were sampled in the summer of 2010 fol-lowing a similar protocol to the one designed for the French Bat MonitoringProgramme (named Vigie-Chiro), from which we used ‘large-scale’ (national) datacollected from 2006 to 2011. For both local- and large-scale data sets, bat calls weredetected. Each point was monitored twice: once in the period between June 15 and
264 J.-C. Vandevelde and C. Penone

July 31, during which females give birth and feed their offspring; second, in theperiod between August 15 and September 31, during which young are flying andindividuals are expected to be less dependent on their reproductive roost. Habitatcharacteristics were analysed in a radius of 100 m around the sampled point, usinga detailed habitat classification (Kerbiriou et al. 2010). Species calls were identifiedthrough spectrogram analyses.
At large scale, we found that activity of common bats in railway verges was ofthe same order of magnitude as in other habitats, except for aquatic habitats, whichare known as key habitats for numerous European bat species (Russo and Jones2003; Nicholls and Racey 2006). Furthermore, we found that activity was evengreater in railway verges than in some other habitats for two aerial species:N. leislerii and P. pipistrellus. For P. pipistrellus, a very generalist species(Russ and Montgomery 2002), activity in railway verges was greater than in sevenother habitats. Overall, bat activity among railway verges was not inferior to theactivity in highly modified habitats such as continuous artificial surfaces, discon-tinuous artificial surfaces and arable land (confirmed for 4 of the 5 taxa studied).
At local scale, we found a negative effect of railway areas on the Myotis spp. forthe two sample periods and a positive effect on Nyctalus spp. for thepost-reproductive period. When focusing the analysis on the site type, we detectedfew obvious significant differences in bat activity between the verges of railwaysand the three other site types (field verges, plain field and plain wood). The sig-nificant difference for Nyctalus spp. during the post-reproductive period (loweractivity in woods than on railway verges) may seem contradictory with the positiveeffect of surrounding areas of wood for these species at the same period. Theforaging ecology of these aerial hawking bats and their habitat requirements couldexplain these results: Nyctalus spp. are species that forage mainly along edges, thusmore in forest verges than in the heart of forests, but otherwise inhabit the interior ofthe forests, thus the amount of woodland habitat at the landscape level would havealso an overall positive effect.
It must be noted that except for the Myotis spp. group in the reproductive period,we detected no difference between the verges of railways and those of fields. Thisresult seems to indicate a similar functioning role for railway verges on bats as thatof other linear verges, particularly on common aerial hawking bats (Verboom andHuitema 1997).
Our results suggest that the presence of railway verges does not influence signifi-cantly the foraging/commuting activity of common bats, except for species like thosefromtheMyotisgroup, agroup includingmostlygleaner species, lessgeneralist species(Dietz et al. 2007) and some threatened species (Temple and Terry 2009).
In several cases (for P. pipistrellus at global scale and for Nyctalus spp. at localscale), railway verges even seem to provide a significant habitat in intensiveagricultural landscapes where semi-natural elements, in particular linear elementslike hedgerows, tend to disappear. Railways, along with other artificial linearinfrastructures, may thus contribute to maintaining common bat populations in suchlandscapes.
16 Ecological Roles of Railway Verges in Anthropogenic Landscapes … 265

Orthoptera Along Railway Verges in an Urban Landscape
Railway verges could potentially provide a habitat for Orthoptera in an urbanlandscape because the majority of these insects in Europe are grassland species andsome occur at roadsides (Theuerkauf and Rouys 2006). We thus studiedTettigonidae along railway verges in urban landscapes using an original method.Because Orthoptera produce mating calls that are species-specific, it is possible tocollect large standardised datasets using sound recording devices. To sample a largenumber of landscapes, we thus recorded Orthoptera sounds from running trainsalong five long-established railway lines in the Paris region (Penone et al. 2013).We did not sample the entire community of singing Orthoptera but rather focusedon insects that produced powerful stridulations, which were not masked by thenoise produced by trains.
We detected 2003 individuals of 10 species of bush-crickets from theTettigoniidae family along 209 km of railway verges (Penone et al. 2013). Thisrepresented 59% of Tettigoniidae species known to exist in the region (Voisin2003) and included specialist species (e.g. Conocephalus fuscus). These resultssuggest that railway verges play a habitat role for these arthropods even for spe-cialist species that are more heavily affected by anthropogenic changes. This wasfurther strengthened by the fact that Orthoptera abundance was significantly lowerwhen the trains crossed areas with paved (non vegetated) railway verges (Penoneet al. 2013). We also detected a significant negative effect of urbanisation on speciesrichness, abundance and community specialization, over a broad set of spatialscales (Penone et al. 2013). This effect was partly mitigated when railway vergeswere vegetated, suggesting that these zones are not only habitats but could even actas refugia for Orthoptera in an urban landscape. Therefore, if extensively managed(Marini et al. 2008), railway verges could play a role in the conservation of bio-diversity in urban areas. More generally, we believe that acoustic surveys are asimple and cost-effective method, allowing long-term and large-scale surveys thatcan help advance railway ecology studies.
Railways as Corridors in an Urban Landscape (LongitudinalConnectivity)
Habitat fragmentation is a major perturbation that affects biodiversity at local,regional and global scales (Fahrig 2003; Krauss et al. 2010). Fragmentation haseffects not only at the population level but also on taxonomic and functionalcomposition of communities and on species interactions (Fahrig 2003; Fischer andLindenmayer 2007; Krauss et al. 2010). Fragmented landscapes, including urbanones, are characterised by small habitat patches isolated by a matrix that filtersspecies according to their mobility and dispersal abilities (Ewers and Didham 2006;Ricketts 2001). In this context, functional connectivity is crucial to maintain
266 J.-C. Vandevelde and C. Penone

populations, communities and potentially, ecosystem services (Taylor et al. 1993).As shown before in this book, railways are mainly considered to be barriers forwildlife or corridors for invasive species. However, railways are linear and almostcontinuous patches of vegetation that penetrate into dense urban areas, ensuring astructural connectivity. Despite their potential as corridors, railway verges func-tional connectivity has been poorly studied (but see Tikka et al. 2001), and moststudies have focussed on invasive species (Hansen and Clevenger 2005).
As mentioned previously, semi-natural grasslands are one of the vegetation typesin railway verges, especially in urban contexts, where the space is precious and theverges have a reduced width. In general, semi-natural grasslands are importanthabitats for conservation because they support plants, invertebrates and vertebrates,including threatened ones, and provide ecosystem services (Ridding et al. 2015).However, surfaces are decreasing all around Europe, therefore it is crucial toconserve them and ensure connectivity between the patches to enhance gene andspecies flows. In our study (Penone et al. 2012), we examined whether these areascould provide functional connectivity for semi-natural grassland plants in urbanlandscapes.
Using Structural Breaks to Detect FunctionalConnectivity Along Railways
If linear structures provide functional connectivity an interruption of structureshould result in an interruption of the function. The structural connectivity ofrailway verges is regularly interrupted by spatial breaks, such as overpasses andstations. We hypothesised that if railway verges favour connectivity, spatiallyconnected communities within railway verges should be more similar than dis-connected communities (H1). We tested this assumption by comparing floristicdissimilarities between sites located along railway verges that were either connectedor separated by a railway break (Penone et al. 2012). In order to take into accountdifferences among plant species, we considered species traits linked to dispersalabilities. These analyses were conducted on 71 plots located on two differentrailway lines going from Paris to the south of the Paris region (Fig. 16.1).
We found a significant effect of railway breaks on most species and dispersaltraits consistent to our hypothesis (H1): connected communities were more similarthan disconnected ones, suggesting a potential corridor role of railway verges(Penone et al. 2012). However, this effect was influenced by species mobility(summarized in Fig. 16.2). Highly mobile species (e.g. wind pollinated) were notaffected by railway breaks, likely because they can disperse over long distances inany direction. Similarly, we did not find a significant effect of railway breaks onpoorly mobile species (e.g. gravity-dispersed seeds). Their dispersal is more relatedto very local factors (e.g. slope) and the effect of breaks might be only visible overmultiple generations. The most interesting result was found for moderately mobilespecies (e.g. wind-dispersed seeds), for which we found a significant effect ofrailway breaks. For these species railways seemed to provide functional
16 Ecological Roles of Railway Verges in Anthropogenic Landscapes … 267

connectivity, at least between two railway breaks, which can represent large dis-tances (e.g. more than 5 km in our study) (Penone et al. 2012).
Interestingly, we detected an effect of overpasses but not of stations on com-munity dissimilarities (Penone et al. 2012 and Fig. 16.2). The slipstream of trains,which possibly carry wind-dispersed seeds (as shown for cars, Von der Lippe andKowarik 2007), can be interrupted by air turbulence or crosswind when the trainstraverse overpasses (Ernst 1998). Since those have very narrow paved verges, theseeds are more likely to be lost. The airflow may also be interrupted when trainsslow down or stop at stations. But at stations, seeds may then be picked up again byair turbulence or wind. More generally, using structural connectivity to detectfunctional connectivity allows assessing corridor efficiency for several speciesgroups. The precision is lower compared to genetic methods, which are the bestsuited methods for this purpose, but our methods are cost and time effective.Therefore, we believe that is an interesting and valuable cost-effective approach thatcan be widely applied to railway research to assess corridor efficiency in the future.
Using Urbanisation Effects to Detect FunctionalConnectivity Along Railways
Plant community composition is the result of stochastic effects as well as differentbiotic and abiotic processes, or filters, that select species with suitable functionaltraits from a species pool through dispersal and survival (Roy and de Blois 2006;Weiher and Keddy 1999; Williams et al. 2009). The effects of these processes areparticularly strong in urban landscapes (Stenhouse 2004). The abiotic constraints incities include higher temperatures and nitrogen deposition (McDonnell et al. 1997;Pellissier et al. 2008). Fragmentation and isolation in urban landscapes also have an
Fig. 16.2 Functional connectivity of railway verges for semi-natural plant species. Green patchesrepresent railway verges. Arrows represent propagules movement. Circles with symbols representplant communities with highly (black), moderately (dark grey) and poorly (light grey) mobilespecies
268 J.-C. Vandevelde and C. Penone

effect on communities through habitat size reduction and dispersal limitation. Allthese effects should be reflected in communities’ trait composition (Weiher andKeddy 1999). While the first abiotic effects (temperature, nitrogen), should not beinfluenced by connectivity between patches within urban landscapes, the seconds(fragmentation effects) should be attenuated if communities are connected. We usedthis assumption as a supplementary and indirect approach to assess functionalconnectivity in railway verges. We hypothesised that if railway verges favourconnectivity this should attenuate the effect of fragmentation on plant communities(H2). We thus examined the effects of urbanisation on species richness, diversityand trait composition in railway verges and compared our results with the patternsdescribed in literature. This study was conducted using the same data as the pre-vious analysis, i.e. 71 plots on two lines.
We did not detect urbanisation effects on plant communities due to fragmenta-tion (Penone et al. 2012). Indeed, we did not find significant relationships betweenurban cover and plant richness, diversity or dispersal traits, while most studiesdetected positive or negative effects, depending on urbanisation intensity(McKinney 2008). In contrast we found an effect of abiotic conditions linked to theurban landscape, which were consistent with the literature. For instance, wedetected a positive effect of urbanisation on the abundance of species adapted tohigher temperatures and nitrogen levels (Penone et al. 2012). These results matchedour hypothesis (H2) and thus further suggested that railway verges provide func-tional connectivity in urban landscapes for semi-natural grassland species.
What About Exotic and Invasive Species?
Our study showed that railway verges can play a positive role for semi-naturalgrassland plants in urban landscapes by connecting communities and potentiallyimproving gene and species flow between communities (Penone et al. 2012).However, as showed in Chap. 5, railway verges can also be corridors for invasivespecies. In order to explore this topic in an urban context, we performed the sameanalyses described above (railway breaks and urbanisation effects) separately forexotic and invasive species (Penone et al. 2012). We also focussed on one particularinvasive species, Senecio inaequidens, which is one of Europe’s fastest plantinvaders and is suspected to spread along railways (Lachmuth et al. 2010).
We detected a significant effect of railway breaks on community similarity interms of exotic but not invasive species (the latter being a subset of the exotic). Asfor native plants, this effect was only observed for overpasses and not railwaystations (Penone et al. 2012). In addition, we measured the similarity between plotsin the two different railway lines, accounting for urbanisation effects. We also founda difference between the two lines for exotic but not for invasive species (Penoneet al. 2012). According to our hypothesis (H1: if railways verges provide functionalconnectivity, structurally connected communities should be more similar thandisconnected ones) this result suggests that railway verges might play a connec-tivity role for exotic but not for invasive species in urban landscapes.
16 Ecological Roles of Railway Verges in Anthropogenic Landscapes … 269

We also analysed the effects of urbanisation on the frequency of exotic andinvasive plants to test our hypothesis H2 (urbanisation effects should be attenuatedif communities are connected). We found the well-known positive urbanisationeffect on exotic and invasive species, i.e., increased species frequency in highlyurbanised areas (Penone et al. 2012). This result possibly suggests that theurbanisation effect was not attenuated by railways connectivity and thus railwaysdid not provide additional functional connectivity for exotic and invasive species inurban landscapes.
To further confirm these results we performed a genetic analysis on S. inae-quidens in the same region (Blanchet et al. 2014). This perennial herb presents aself-incompatible reproductive system and is pollinated by insects; the effectivefruit production is high, with 75% viable achenes, which are well dispersed by windand animals (Lopez-Garcia and Maillet 2005). This species was introduced in thesouth of France (Mazamet) in 1936 and then observed in Gare d’Austerlitz (aParisian railway station) in 1990 (Henry and Maurin 1999). Consequently, wehypothesised that if railway verges play a corridor role for S. inaequidens, geneticdiversity of this species should be structured along railways. We collected 450individuals from 15 populations regularly on 3 different railway lines connectingthe centre of Paris to its periphery. Given that the species was first seen in Parisianrailway stations and assuming that railways act as corridors for S. inaequidens in theParisian region, we expected a significant genetic differentiation among the maindeparture stations within Paris centre and among the three railway lines. We alsoexpected significant isolation by distance (i.e., positive correlation between geneticdistance and geographical distance) if the main central stations act as sources forother populations in the surroundings.
Our results did not confirm these scenarios: despite a clear differentiation amongthe three departure stations of the centre of Paris and a genetic cline along one of thelines, the differentiation among lines was low. Similarly, we did not detect sig-nificant isolation by distance among populations within lines, supporting theabsence of population structure along railways (Blanchet et al. 2014). One expla-nation could lie in multiple sources of introduction of S. inaequidens from otherEuropean regions (e.g. Belgium or Germany). This species has high dispersalability and is also present in other urban habitats (e.g. wastelands), which could alsocontribute to the high gene flow detected. In sum, the impact of railways as cor-ridors on the genetic structure of S. inaequidens was not confirmed in our study,especially outside the centre of Paris where the deep interconnection with othercorridors such as motorways in the suburban matrix may have a significant impactby reducing genetic differentiation among railway lines.
All the results that we put together converge and tend to suggest that in a highlyurbanized and anthropogenic region, railway verges provide functional connectivityfor exotic species but not for invasive species. This is inconsistent with many otherstudies on other transport networks (roadsides, highways), and should then beentaken with care (but see Kalwij et al. 2008 for a similar result). Although railwayverges did not appear as clear corridors for invasive species, trains might constitutean efficient transportation vector for seeds and contribute to their spread outside
270 J.-C. Vandevelde and C. Penone

cities. Furthermore, railway verges are habitats and thus potential sources for thesespecies for other habitats. The positive urbanisation effect that we found on thesespecies, suggests that their presence is more linked to the urban context (sources,abiotic conditions) than railways connectivity. More studies are needed to assessrailways connectivity in other landscapes and for a greater number of species.
Railways as Barriers in an Agricultural Landscape(Transversal Connectivity)
Linear infrastructures such as railways can be barriers to the movements of indi-viduals and, hence, may have strong impacts on populations (see Chap. 4). Wetested if this effect existed or if there was transversal connectivity between the twosides of a high-speed railway for the common butterfly Pyronia tithonus(Vandevelde et al. 2012). We hypothesised that P. tithonus individuals, if capturedon the railway verge on one side of the railway and translocated to the other side ina similar habitat, will not be able to return to their original site because of thealleged barrier effect of the railroad. This hypothesis is based on empirical evidencethat P. tithonus shows homing behaviour when displaced: when given a choicebetween a familiar and an unfamiliar habitat, these butterflies prefer to return totheir familiar habitat (Conradt et al. 2001).
Pyronia tithonus is a European Satyrinae (Nymphalidae) occurring in severalgrassland habitats, usually in association with scrub or hedges.Mean life-span of adultsranges from 3.5 to 8 days (Brakefield 1987). P. tithonus produces only one generationper year and uses several grasses as host plants (Merckx and Van Dyck 2002).
We captured, marked and displaced 152 individuals in two different locations.One-third of the butterflies were released at a capture plot, one-third on the otherside of the railway (in a similar habitat) and one-third on the same side but 100 maway from the capture plot. Many (31%) butterflies crossed the railway, showinghoming behaviour. There were even a slightly greater number of exchangesbetween the two release plots across the railway (12) than between the two releaseplots along the railway (8); the opposite of what we would expect if railways actedas a barrier to butterfly movements.
Even if based on a small sample, our results tend to show that contrary to widebusy roads (Munguira and Thomas 1992), high-speed railways, which are narrowerand have infrequent traffic, are not barriers to Gatekeeper movements. These resultsalso suggest that in a predominantly agricultural-intensive context, railways withlarge grassy verges could be substitution habitats for grassland butterflies, with noeffect of the 20-m-wide-ballast-tracks. Furthermore, it suggests that passing trainsdo not have an impact on P. tithonus movements. However, the mortality risk fromtrain traffic still has to be properly assessed, as well as the possible effects of therailway structure (tracks on cuttings vs. those on embankments; wide vs. narrowverges) on movements of individuals.
16 Ecological Roles of Railway Verges in Anthropogenic Landscapes … 271

Conclusion
In a context of rapid biodiversity decline, our results (see synthesis Table 16.1)suggest that railway verges should be considered by managers and engineers notonly as a side aspect of the railroad, but also as elements having a potential role inmaintaining common biodiversity, especially in human-dominated landscapes suchas urban areas or agricultural systems. We found that railway verges could playhabitat and corridor roles and that railways were not barriers for butterfly species.The total length of the railway network worldwide is more than one million kilo-metres (CIA 2008), and its verges represent important green areas (e.g. nearly 0.1%of the French surface). Therefore, the latter could represent an interesting topic forbiodiversity conservation in human-dominated landscapes, as already suggested(Jarošík et al. 2011; Le Viol et al. 2008). More precisely, railway verges maycontribute, along with private gardens and green spaces (Vergnes et al. 2012), toimprove biodiversity in urban environments and could be potentially included inurban green network planning. Moreover, railway verges plants are mainly herbsand grasses that can be of interest for semi-natural grassland conservation, asalready suggested for road verges (Cousins and Lindborg 2008).
In order to contribute to the maintenance of biodiversity, the management ofthese verges is thus crucial, as shown by previous studies (e.g. Noordijk et al.2010). The following management rules should be considered: (1) during theconstruction phase, the revegetation process should try to maximise plant diversityto increase interactions with higher trophic levels as well as ecosystem functioning,(2) the relationship between the network of these linear features and the overalllandscape connectivity should be considered (Karim and Mallik 2008; Bougheyet al. 2011), (3) finally, during the exploitation phase of the railroad, managementdecisions could take biodiversity into account through a move from clearcutting tomore extensive management (e.g. selected cutting and late-mowing), enabling themaintenance of some linear structures and allowing the reproduction of severalplant and insect species.
Table 16.1 The three roles of railway verges studied on selected taxa
Habitat Longitudinalconnectivity
Transversalconnectivity
Bats Generalist species: yesSpecialist species: no
nt nt
Orthoptera Yes nt nt
Plants Yes Yes nt
Invasive species(S. inaequidens)
Yes Not detected Possible
Common butterfly(P. tithonus)
nt nt Yes
nt not tested
272 J.-C. Vandevelde and C. Penone

Overall, we suggest that extensive management coupled with small-scalerevegetation processes, either artificial or natural, may help counteract the negativelarge-scale effects of urbanisation and of the homogenisation of agriculturallandscapes.
Acknowledgements We deeply thank the editors for inviting us to participate to this stimulatingbook on railway ecology. We would also like to thank in particular L. Borda de Água as well as I.Takehito for their constructive and helpful comments on the submitted version of this chapter.
References
Abbott, I. M., Butler, F., & Harrison, S. (2012). When flyways meet highways—The relativepermeability of different motorway crossing sites to functionally diverse bat species.Landscape and Urban Planning, 106, 293–302.
Bach, L., Burkhardt, P., & Limpens, H. J. (2004). Tunnels as a possibility to connect bat habitats.Mammalia, 68, 411–420.
Berthinussen, A., & Altringham, J. (2012). The effect of a major road on bat activity and diversity.Journal of Applied Ecology, 49, 82–89.
Blanchet, É., Penone, C., Maurel, N., Billot, C., Rivallan, R., Risterucci, A.-M., et al. (2014).Multivariate analysis of polyploid data reveals the role of railways in the spread of the invasiveSouth African Ragwort (Senecio inaequidens). Conservation Genetics, 16, 523–533.
Boughey, K. L., Lake, I. R., Haysom, K. A., & Dolman, P. M. (2011). Improving the biodiversitybenefits of hedgerows: How physical characteristics and the proximity of foraging habitat affectthe use of linear features by bats. Biological Conservation, 144, 1790–1798.
Brakefield, P. M. (1987). Geographical variability in, and temperature effects on, the phenology ofManiola jurtina and Pyronia tithonus (Lepidoptera, Satyrinae) in England and Wales.Ecological Entomology, 12, 139–148.
Central Intelligence Agency. (2008). Transportation. In The world factbook.Conradt, L., Roper, T. J., & Thomas, C. D. (2001). Dispersal behaviour of individuals in
metapopulations of two British butterflies. Oikos, 95, 416–424.Cousins, S. A. O., & Lindborg, R. (2008). Remnant grassland habitats as source communities for
plant diversification in agricultural landscapes. Biological Conservation, 141, 233–240.Dietz, C. Von, Helversen, O., & Nill, D. (2007). Handbuch der Fledermäuse Europas und
Nordwestafrikas. Stuttgart: Franckh-Kosmos Verlag.Ernst, W. H. O. (1998). Invasion, dispersal and ecology of the South African neophyte Senecio
inaequidens in The Netherlands: From wool alien to railway and road alien. Acta BotanicaNeerlandica, 47, 131–151.
Ewers, R. M., & Didham, R. K. (2006). Confounding factors in the detection of species responsesto habitat fragmentation. Biological Reviews, 81, 117–142.
Fahrig, L. (2003). Effects of habitat fragmentation on biodiversity. Annual Review of EcologyEvolution and Systematics, 34, 487–515.
Fischer, J., & Lindenmayer, D. B. (2007). Landscape modification and habitat fragmentation: Asynthesis. Global Ecology and Biogeography, 16, 265–280.
Forman, R. T., Sperling, D., Bissonette, J. A., Clevenger, A. P., Cutshall, C. D., Dale, V. H., et al.(2002). Road ecology: Science and solutions. Washington, DC: Island Press.
Hansen, M. J., & Clevenger, A. P. (2005). The influence of disturbance and habitat on the presenceof non-native plant species along transport corridors. Biological Conservation, 125, 249–259.
Henry, H.-P., & Maurin, H. (1999). Les inventaires du patrimoine naturel en milieu urbain [Theinventories of the natural heritage in urban environments]. In B. Lizet, A.-E. Wolf, & J. Celecia(Eds.), Sauvages dans la ville. De l’inventaire naturaliste à l’écologie urbaine [Wild in the city.
16 Ecological Roles of Railway Verges in Anthropogenic Landscapes … 273

From naturalist inventories to urban ecology] (pp. 333–355). Paris: Publications scientifiquesdu Muséum.
Hodkinson, D. J., & Thompson, K. (1997). Plant dispersal: The role of man. Journal of AppliedEcology, 34, 1484–1496.
Jarošík, J., Konvička, M., Pyšek, P., Kadlec, T., & Beneš, J. (2011). Conservation in a city: Do thesame principles apply to different taxa? Biological Conservation, 144, 490–499.
Kalwij, J. M., Milton, S. J., & McGeoch, M. A. (2008). Road verges as invasion corridors? Aspatial hierarchical test in an arid ecosystem. Landscape Ecology, 23, 439–451.
Karim, M. N., & Mallik, A. U. (2008). Roadside revegetation by native plants: I. Roadsidemicrohabitats, floristic zonation and species traits. Ecological Engineering, 32, 222–237.
Kerbiriou, C., Bas, Y., Dufrêne, L., Robert, A., & Julien, J. F. (2010). Long term trendsmonitoring of bats, from biodiversity indicator production to species specialization assessment.Paper presented at the 24th Annual Meeting of the Society for Conservation Biology,Edmonton, Canada.
Kerth, G., & Melber, M. (2009). Species-specific barrier effects of a motorway on the habitat useof two threatened forest-living bat species. Biological Conservation, 142, 270–279.
Krauss, J., Bommarco, R., Guardiola, M., Heikkinen, R. K., Helm, A., Kuussaari, M., et al. (2010).Habitat fragmentation causes immediate and time-delayed biodiversity loss at different trophiclevels. Ecology Letters, 13, 597–605.
Lachmuth, S., Durka, W., & Schurr, F. M. (2010). The making of a rapid plant invader: Geneticdiversity and differentiation in the native and invaded range of Senecio inaequidens. MolecularEcology, 19, 3952–3967.
Lesinski, G., Olszewski, A., & Popczyk, B. (2011). Forest roads used by commuting and foragingbats in edge and interior zones. Polish Journal of Ecology, 59, 611–616.
Le Viol, I., Julliard, R., de Kerbiriou, C., Redon, L., Carnino, N., Machon, N., et al. (2008). Plantand spider communities benefit differently from the presence of planted hedgerows in highwayverges. Biological Conservation, 141, 1581–1590.
Limpens, H., & Kapteyn, K. (1991). Bats, their behaviour and linear landscape elements. Myotis,29, 39–48.
Lopez-Garcia, M. C., & Maillet, J. (2005). Biological characteristics of an invasive South Africanspecies. Biological Invasions, 7, 181–194.
Marini, L., Fontana, P., Scotton, M., & Klimek, S. (2008). Vascular plant and Orthoptera diversityin relation to grassland management and landscape composition in the European Alps. Journalof Applied Ecology, 45, 361–370.
McDonnell, M. J., Pickett, S. T. A., Groffman, P., Bohlen, P., Pouyat, R. V., Zipperer, W. C., et al.(1997). Ecosystem processes along an urban-to-rural gradient. Urban Ecosystems, 1, 21–36.
McKinney, M. (2008). Effects of urbanization on species richness: A review of plants and animals.Urban Ecosystems, 11, 161–176.
MEA. (2005). Ecosystems and human well-being. Washington, DC: Island Press.Merckx, T., & Van Dyck, H. (2002). Interrelations among habitat use, behavior, and flight-related
morphology in two cooccurring satyrine butterflies, Maniola jurtina and Pyronia tithonus.Journal of Insect Behavior, 15, 541–561.
Merriam, G., & Lanoue, A. (1990). Corridor use by small mammals: Field measurement for threeexperimental types of Peromyscus leucopus. Landscape Ecology, 4, 123–131.
Munguira, M. L., & Thomas, J. A. (1992). Use of road verges by butterfly and burnet populations,and the effect of roads on adult dispersal and mortality. Journal of Applied Ecology, 29,316–329.
Nicholls, B., & Racey, P. A. (2006). Habitat selection as a mechanism of resource partitioning intwo cryptic bat species Pipistrellus pipistrellus and Pipistrellus pygmaeus. Ecography, 29,697–708.
Noordijk, J., Schaffers, A. P., Heijerman, T., Boer, P., Gleichman, M., & Sýkora, K. V. (2010).Effects of vegetation management by mowing on ground-dwelling arthropods. EcologicalEngineering, 36, 740–750.
274 J.-C. Vandevelde and C. Penone

O’Farrell, P. J., & Milton, S. J. (2006). Road verge and rangeland plant communities in thesouthern Karoo: Exploring what influences diversity, dominance and cover. Biodiversity andConservation, 15, 921–938.
Pellissier, V., Roze, F., Aguejdad, R., Quenol, H., & Clergeau, P. (2008). Relationships betweensoil seed bank, vegetation and soil fertility along an urbanisation gradient. Applied VegetationScience, 11, 325–334.
Penone, C., Kerbiriou, C., Julien, J.-F., Julliard, R., Machon, N., & Le Viol, I. (2013).Urbanisation effect on Orthoptera: Which scale matters? Insect Conservation and Diversity, 6,319–327.
Penone, C., Machon, N., Julliard, R., & Le Viol, I. (2012). Do railway edges provide functionalconnectivity for plant communities in an urban context? Biological Conservation, 148,126–133.
Ricketts, T. H. (2001). The matrix matters: Effective isolation in fragmented landscapes. TheAmerican Naturalist, 158, 87–99.
Ridding, L. E., Redhead, J. W., & Pywell, R. F. (2015). Fate of semi-natural grassland in Englandbetween 1960 and 2013: A test of national conservation policy. Global Ecology andConservation, 4, 516–525.
Ries, L., Debinski, D. M., & Wieland, M. L. (2001). Conservation value of roadside prairierestoration to butterfly communities. Conservation Biology, 15, 401–411.
Roy, V., & de Blois, S. (2006). Using functional traits to assess the role of hedgerow corridors asenvironmental filters for forest herbs. Biological Conservation, 130, 592–603.
Russ, J. M., & Montgomery, W. I. (2002). Habitat associations of bats in Northern Ireland:Implications for conservation. Biological Conservation, 108, 49–58.
Russo, D., & Jones, G. (2003). Use of foraging habitats by bats in a Mediterranean area determinedby acoustic surveys: Conservation implications. Ecography, 26, 197–209.
Saarinen, K., Valtonen, A., Jantunen, J., & Saarnio, S. (2005). Butterflies and diurnal moths alongroad verges: Does road type affect diversity and abundance? Biological Conservation, 123,403–412.
Stenhouse, R. N. (2004). Fragmentation and internal disturbance of native vegetation reserves inthe Perth metropolitan area, Western Australia. Landscape and Urban Planning, 68, 389–401.
Taylor, P. D., Fahrig, L., Henein, K., & Merriam, G. (1993). Connectivity is a vital element oflandscape structure. Oikos, 68, 571–573.
Temple, H. J., & Terry, A. (2009). The status and distribution of european mammals.Luxembourg: Office for Official Publications of the European Communities.
Theuerkauf, J., & Rouys, S. (2006). Do Orthoptera need human land use in Central Europe? Therole of habitat patch size and linear corridors in the Biaowieza forest, Poland. Biodiversity andConservation, 15, 1497–1508.
Tikka, P. M., Hogmander, H., & Koski, P. S. (2001). Road and railway verges serve as dispersalcorridors for grassland plants. Landscape Ecology, 16, 659–666.
Vandevelde, J.-C., Bouhours, A., Julien, J.-F., Couvet, D., & Kerbiriou, C. (2014). Activity ofEuropean common bats along railway verges. Ecological Engineering, 64, 49–56.
Vandevelde, J.-C., Penone, C., & Julliard, R. (2012). High-speed railways are not barriers toPyronia tithonus butterfly movements. Journal of Insect Conservation, 16, 801–803.
Verboom, B., & Huitema, H. (1997). The importance of linear landscape elements for thepipistrelle Pipistrellus pipistrellus and the serotine bat Eptesicus serotinus. Landscape Ecology,12, 117–125.
Verboom, B., & Spoelstra, K. (1999). Effects of food abundance and wind on the use of treelines by an insectivorous bat, Pipistrellus pipistrellus. Canadian Journal of Zoology, 77, 1393–1401.
Vergnes, A., Le Viol, I., & Clergeau, P. (2012). Green corridors in urban landscapes affect thearthropod communities of domestic gardens. Biological Conservation, 145, 171–178.
Voisin, J. F. (2003). Atlas des Orthoptères et des Mantides de France [Atlas of French Orthopteraand Mantis of France]. Paris: MNHN, Collection Patrimoines Naturels.
16 Ecological Roles of Railway Verges in Anthropogenic Landscapes … 275

Von der Lippe, M., & Kowarik, I. (2007). Long-distance dispersal of plants by vehicles as a driverof plant invasions. Conservation Biology, 21, 986–996.
Wehling, S., & Diekmann, M. (2009). Importance of hedgerows as habitat corridors for forestplants in agricultural landscapes. Biological Conservation, 142, 2522–2530.
Weiher, E., & Keddy, P. (1999). Assembly rules as general constraints on communitycomposition. In E. Weiher & P. Keddy (Eds.), Ecological assembly rules (pp. 251–271).Cambridge: Cambridge University Press.
Williams, N. S. G., Schwartz, M. W., Vesk, P. A., McCarthy, M. A., Hahs, A. K., Clemants, S. E.,et al. (2009). A conceptual framework for predicting the effects of urban environments onfloras. Journal of Ecology, 97, 4–9.
Open Access This chapter is licensed under the terms of the Creative Commons Attribution 4.0International License (http://creativecommons.org/licenses/by/4.0/), which permits use, sharing,adaptation, distribution and reproduction in any medium or format, as long as you give appropriatecredit to the original author(s) and the source, provide a link to the Creative Commons license andindicate if changes were made.The images or other third party material in this chapter are included in the chapter’s Creative
Commons license, unless indicated otherwise in a credit line to the material. If material is notincluded in the chapter’s Creative Commons license and your intended use is not permitted bystatutory regulation or exceeds the permitted use, you will need to obtain permission directly fromthe copyright holder.
276 J.-C. Vandevelde and C. Penone

Chapter 17Wildlife Deterrent Methodsfor Railways—An Experimental Study
Andreas Seiler and Mattias Olsson
Abstract Since reliable accident statistics and consequent costs have becomeavailable, train collisions with wildlife, especially ungulates, have receivedincreasing attention in Sweden. In contrast to collisions on roads, accidentsinvolving wildlife on railways do not entail human injury or death, but can causesubstantial train damage and lead to significant delays in railway traffic.Wildlife-train collisions (WTC) are rising in numbers and railways appear as agreater source of ungulate mortality per kilometer than roads. Nevertheless, rail-ways are largely unprotected against wildlife collisions, and mitigation measuresthat have hitherto been applied to roads are either infeasible or economicallyunviable for railways. The Swedish Transport Administration is therefore seekinginnovative and cost-effective measures for preventing collisions with larger wildanimals. In this chapter, we present research on WTC in Sweden that has been usedto define the baseline and set up criteria for a new mitigation project. This projectaims to develop warning or deterring signals that encourage animals to leave therailway shortly before trains arrive. This will be carried out at several experimentalcrosswalks for animals along fenced railways where the effect of different signalson animal behaviour can be evaluated. If effective, these deterrent systems couldreplace fencing and/or crossing structures, and reduce mortality and barrier effectson wildlife. The project was begun in 2015 and will continue for at least 4 years.
Keywords Accident prevention � Animal-deterrent � Crosswalk � Deer-trainaccidents � Exclusion fences � Hotspots � Wildlife-train collisions �Wildlife-warning
A. Seiler (&)Department of Ecology, Swedish University of Agricultural Sciences,SLU, Riddarhyttan, Swedene-mail: [email protected]
M. OlssonEnviroPlanning AB, Gothenburg, Swedene-mail: [email protected]
© The Author(s) 2017L. Borda-de-Água et al. (eds.), Railway Ecology,DOI 10.1007/978-3-319-57496-7_17
277

Introduction
Wildlife-train collisions (WTC) on Swedish railways have steadily increased overthe past 15 years (Fig. 17.1), totalling about 5,000 reported incidents with moose(Alces alces), roe deer (Capreolus capreolus), reindeer (Rangifer tarandus), andother ungulates (fallow deer, red deer, wild boar) every year (Seiler et al. 2011;Olsson and Seiler 2015). The number of unreported WTCs, as well as the numberof collisions with smaller mammals and birds, is unknown. WTCs receiveincreasing public media attention and their importance is also acknowledged bytrain operators and the Swedish Transport Administration (Olsson and Seiler 2015).WTC can cause significant disruptions and delays to train traffic; produce consid-erable repair costs for material damages; and entail further costs related to theretrieval and handling of animal carcasses, the loss of other economic values of
Fig. 17.1 Trends in moose and roe deer reportedly killed on roads, on railways and throughhunting. Traffic accounts for about 10–15% of all human-caused mortality, and the proportion isincreasing. (updated from Seiler et al. 2011)
278 A. Seiler and M. Olsson

wildlife, and the administration of accidents (Child and Stuart 1987; Jaren et al.1991; Gundersen and Andreassen 1998).
However, since WTCs do not cause human injury or death, and hence are notconsidered a traffic safety problem, the Swedish railway network is still largelyunprotected against collisions with wildlife. Except for a few railway sections in thenorthern region, where accidents with semi-domestic reindeer lead to expensivereimbursements, fencing has long been regarded as economically unviable forrailways, and alternative measures have not been seriously tested. This attitude,however, is changing as train operators upgrade their train systems to modernlight-weight multiple-unit trains. These trains are less robust than traditional singletrain engines and require more expensive repairs after a WTC, sometimes leading tosignificant delays in railway traffic. The overall socio-economic costs of WTCs inSweden have recently been estimated at 100,000,000–150,000,000 million Eurosper year (Seiler et al. 2014). This is similar to the costs estimated for wildlife-vehicle collisions on roads (250,000,000 Euros per year) (Seiler and Olsson 2015),despite railways comprising less than 2% of the national road network. Thus, thenumber of collisions with larger wildlife, especially ungulates, per kilometer, isgreater on railways than public roads.
Preliminary analyses of the Swedish railway network suggest that there are atleast 10 railway sections with very high WTC frequencies where fencing would beeconomically viable today. On most railway sections, however, fencing still maynot be cost-effective. Alternative methods, such as wildlife deterrents or warningsystems, need to be developed to keep animals off railways, at least when trainsapproach. Initial attempts with such wildlife warning systems in other studies haveproduced promising results (Larsson-Kråik 2005; Werka and Wasilewski 2009;Babińska-Werka et al. 2015; Shimura et al. 2015).
Therefore, the Swedish Transport Administration, in cooperation with SwedishRailways, Enviroplanning AB, and the Swedish University of AgriculturalSciences, initiated a project in 2015 to develop and test methods for deterringwildlife from railways when trains approach. In this chapter, we describe theresearch that provided the baseline for this unique project and describe its specificsettings and objectives.
Background
Wildlife-train collisions (WTC) on Swedish railways were not scientifically studiedbefore 2011 (Seiler et al. 2011) because empirical data was not accessible, andauthorities did not perceive WTC as a problem and thus did not finance research.Collisions with semi-domestic reindeer were an exception, probably because railauthorities had to reimburse reindeer owners and therefore maintain detailedstatistics (Åhrén and Larsson 1999, 2001). WTCs are reported by train drivers viatelephone to a central register. Based on these reports, railway patrols and speciallytrained hunters visit the accident site to remove the carcasses or take care of the
17 Wildlife Deterrent Methods for Railways—An Experimental Study 279

wounded animals. We compiled these reports and analyzed spatial and temporalpatterns in the distribution of WTCs. We also surveyed train drivers regarding theirexperiences with wildlife on railways and wildlife-train collisions. These studiesprovided the framework for the preparation of the current mitigation project, whosemain findings are summarized below. The major objectives were to evaluate themagnitude of the problem, obtain input on potential mitigation measures, analyzespatial and temporal patterns, and identify the hotspots where mitigation might bemost urgently required.
Train Driver Survey
In 2010, we conducted a survey with train drivers to map their experiences withWTCs (Seiler et al. 2011). Drivers were asked about how often they observedanimals on or near the railway, how often they experienced collisions with ungu-lates, and how animals typically responded to the oncoming train. Train driverswere also asked for their opinions and ideas on how to reduce WTCs. About 17% ofthe 1,023 participants took an active part in the survey, and over 65% of therespondents replied that they encountered deer several times a week. Mostrespondents (91%) had experienced collisions with roe deer (49.3%), moose(23.5%), reindeer (19.4%), and other larger wildlife (7.8%) during the previousyear. This matches the overall accident statistics, in which these three species makeup over 90% of all reported cases (Fig. 17.2). Collisions with wild boars (Susscrofa), fallow deer (Dama dama) or red deer (Cervus elaphus) are rare, probablybecause these species are more restricted in their geographic distributions.
Train drivers perceived poor visibility, thick vegetation, poor light conditions,and deep snow as the main causes for WTCs. These factors may cause the animalsto detect approaching trains very late or be unable to escape in time. However, train
Fig. 17.2 Reported wildlife-train collisions in Sweden during 2001–2010 Source Seiler et al. 2011)
280 A. Seiler and M. Olsson

drivers also reported that many animals in the vicinity of the railway rarely seemedto react to passing trains. Flight behaviour was not often observed, but if flight wasinitiated by the train or by warning signals (horn), the animals sometimes fled aheadof the train and along the rail (see also Rea et al. 2010; Child 1983). Animalssometimes even walked up on to the railway track as the train approached, pre-sumably to gain speed during flight (Child 1983).
Most train drivers (90%) were concerned about damage to the train, trafficdelays, and unnecessary suffering and non-fatal injuries to the animals. Many dri-vers considered WTC to be a severe working environment issue because of thepsychological stress they cause. Since train drivers are not able to slow down orstop the train to avoid a collision, their only options are to use the horn or flash theheadlights in order to alert animals. However, most drivers disagreed about whetherthese measures are effective.
Collision Statistics
About 2,500–3,000 collision reports were issued every year from 2001–2010,including, on average, 1,070 moose, 1,336 roe deer and 994 other large mammalskilled or injured annually (since accidents may involve more than one individual;Fig. 17.1). The number of unreported cases and undetected incidents is not known,but is assumed to be large and more pronounced in the smaller and lighter species.Since 2001, accident reports on roe deer and moose have increased by about 2.5%per year, despite decreasing hunting statistics that suggest smaller populations. Thetrend in WTC reflects trends in wildlife-accident numbers on roads (Seiler 2011).This follows both a similar diurnal pattern to road accidents with most collisionsoccurring during dusk and dawn, and a similar seasonal pattern with most accidentsreported during autumn and winter (Neumann et al. 2012; Borda-de-Água et al.2014; Rolandsen 2015). Likewise, as on roads (Seiler and Helldin 2006; Jacobsonet al. 2016), WTCs were more frequent on railways with intermediate traffic vol-umes (50–150 trains per day) and less frequent on both calmer and busier tracks.
Overall, wildlife collisions on railways and roads seem to share many charac-teristics and patterns. However, collisions with moose appeared to be twice asfrequent per kilometer of railway (and with roe deer slightly more frequent) than onpublic roads, suggesting that railways may be more dangerous than roads onaverage. We assume that this may be related to the relatively long intervals betweentrains; animals may be deterred less often by railway traffic and use railway tracksmore readily than roads, because trains pass by less often.
In Sweden, WTCs are reported by train drivers not as an actual GPS position,but as incidents occurring between two consecutive nodes in the railway network.Thus, WTCs contain no point statistics, but rather frequencies related to a givensection of railway. These sections average 8 km, but range from a few hundredmeters to 53 km. A total of 1,377 sections longer than 1 km were included in thestudy. On average, during 2001–2011, annual reports yielded 0.79 moose and 1.09
17 Wildlife Deterrent Methods for Railways—An Experimental Study 281

roe deer incidents per 10 km railway per year. On some sections, however, den-sities would exceed one accident per km per year (Fig. 17.3).
WTC Hotspots
We identified special aggregations of WTCs or “hotspots” as railway sections withcollision frequencies above 2.38 collisions with moose and 3.30 collisions with roedeer per 10 km per year, which corresponded to the top 5% at the national level.We then ranked hotspots according to their stability over time, with high-rankedsections comprising those that were among the top 50 sections in more than four ofseven overlapping 5-year intervals during 2001–2011. For comparison, we selected“coldspots” as sections for which no WTC had been reported during the studyperiod. Logistic regression analyses successfully distinguished between “hotspots”and “coldspots” based on the composition of the surrounding landscape, availability
Fig. 17.3 Annual frequencies of reported and positioned train collisions with moose and roe deerper km of railway in Sweden during 2001–2009. (from Seiler et al. 2011)
282 A. Seiler and M. Olsson
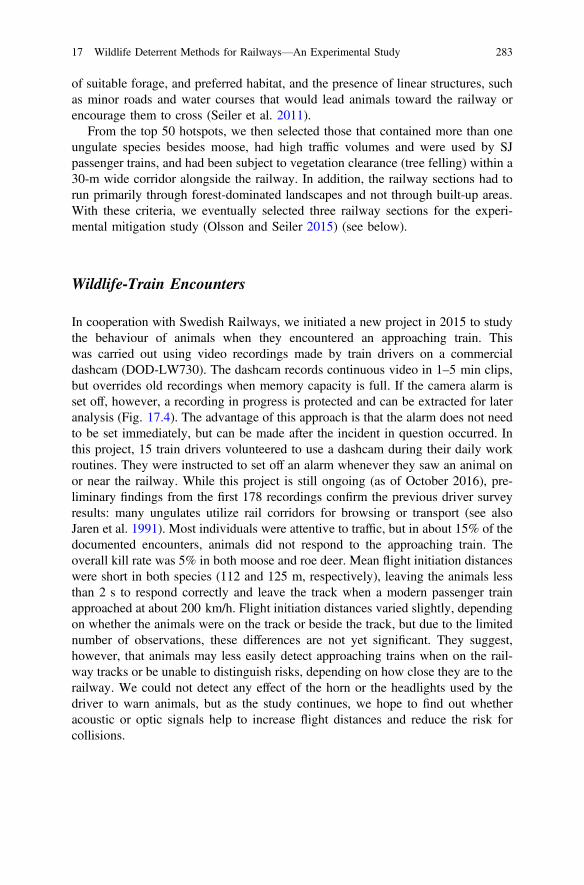
of suitable forage, and preferred habitat, and the presence of linear structures, suchas minor roads and water courses that would lead animals toward the railway orencourage them to cross (Seiler et al. 2011).
From the top 50 hotspots, we then selected those that contained more than oneungulate species besides moose, had high traffic volumes and were used by SJpassenger trains, and had been subject to vegetation clearance (tree felling) within a30-m wide corridor alongside the railway. In addition, the railway sections had torun primarily through forest-dominated landscapes and not through built-up areas.With these criteria, we eventually selected three railway sections for the experi-mental mitigation study (Olsson and Seiler 2015) (see below).
Wildlife-Train Encounters
In cooperation with Swedish Railways, we initiated a new project in 2015 to studythe behaviour of animals when they encountered an approaching train. Thiswas carried out using video recordings made by train drivers on a commercialdashcam (DOD-LW730). The dashcam records continuous video in 1–5 min clips,but overrides old recordings when memory capacity is full. If the camera alarm isset off, however, a recording in progress is protected and can be extracted for lateranalysis (Fig. 17.4). The advantage of this approach is that the alarm does not needto be set immediately, but can be made after the incident in question occurred. Inthis project, 15 train drivers volunteered to use a dashcam during their daily workroutines. They were instructed to set off an alarm whenever they saw an animal onor near the railway. While this project is still ongoing (as of October 2016), pre-liminary findings from the first 178 recordings confirm the previous driver surveyresults: many ungulates utilize rail corridors for browsing or transport (see alsoJaren et al. 1991). Most individuals were attentive to traffic, but in about 15% of thedocumented encounters, animals did not respond to the approaching train. Theoverall kill rate was 5% in both moose and roe deer. Mean flight initiation distanceswere short in both species (112 and 125 m, respectively), leaving the animals lessthan 2 s to respond correctly and leave the track when a modern passenger trainapproached at about 200 km/h. Flight initiation distances varied slightly, dependingon whether the animals were on the track or beside the track, but due to the limitednumber of observations, these differences are not yet significant. They suggest,however, that animals may less easily detect approaching trains when on the rail-way tracks or be unable to distinguish risks, depending on how close they are to therailway. We could not detect any effect of the horn or the headlights used by thedriver to warn animals, but as the study continues, we hope to find out whetheracoustic or optic signals help to increase flight distances and reduce the risk forcollisions.
17 Wildlife Deterrent Methods for Railways—An Experimental Study 283

Fig. 17.4 Train driver’s view of a fleeing moose shortly before collision (above). The picture wastaken with a video dashcam mounted inside the driver’s cabin. The damaged front of the X2000train engine after the moose collision (below) (photos Jimmy Nilsson, Swedish Railways)
284 A. Seiler and M. Olsson

Ultimate and Proximate Causes of WTCs
Based on these previous studies, we can identify various factors that influencecollision risk.
Clearly, WTCs are more frequent in areas with higher wildlife abundances (seealso Gundersen and Andreassen 1998; Hedlund et al. 2004; Seiler 2005), or whereanimals are more likely to cross railways. This relates to landscape composition,food availability, landscape structure, and other regional and local factors typicallybeyond the responsibility of the train operator or the railway manager (Seiler et al.2011; Rolandsen 2015). Other factors relate to the attractiveness and accessibility ofthe railway, including vegetation management alongside railways (Jaren et al. 1991;Rolandsen 2015), the presence of gullies and fences, or by train density (Righettiand Malli 2004; Kusta et al. 2011).
The proximate cause of WTCs, however, must be attributed to the behaviour ofthe animal itself. In contrast to roads, where motorists carry the main responsibilityfor avoiding collisions with wildlife (Seiler and Helldin 2006; Litvaitis and Tash2008), trains are unable to stop or change paths. Therefore, it is only the animal thatcan avert a collision, but this depends on its chance of detecting an oncoming trainin time, its cognitive abilities, and its anti-predator or flight behaviour. As we haveseen on video recordings, flight initiation distances were short, leaving little time forthe animals to respond appropriately, especially to rapidly moving and silentmodern passenger trains (Gundersen and Andreassen 1998; Rea et al. 2010).Therefore, a possible mitigation is to increase the available response time byalerting animals earlier, before the train is too close to be avoided.
Mitigation Project
Objectives
In 2015, the Swedish Transport Administration, in cooperation with SwedishRailways, Enviroplanning AB, and the Swedish University of AgriculturalSciences, initiated a project to develop novel approaches and test available systemsfor alerting and deterring wildlife from railways shortly before trains arrive (Olssonand Seiler 2015). The goal is to prevent WTCs while still allowing animals to crossthe railway when no trains are approaching.
Earlier studies from Poland (Werka and Wasilewski 2009; Babińska-Werka et al.2015) have been promising, but further technical and methodological developmentis needed to develop a cost-effective and robust alternative to fences and crossingstructures.
17 Wildlife Deterrent Methods for Railways—An Experimental Study 285

Approach
To develop and test wildlife warning systems, we selected three railway sections(8, 11 and 23 km in length) with extreme WTC frequencies (“hotspots”) and twoother sections for practical reasons. All five sections will be fenced, using 2 m highstandard exclusion fences of a type also used along roads. These fences will beperforated by 20–24 experimental crosswalks, i.e., gaps in the fence of about 50 mthat are monitored by video and thermal cameras and secured by the alerting ordeterring systems (Fig. 17.5). The fences thus serve two purposes: they reduceWTC on most of the railway section by an estimated 80% in moose and 60% in roedeer (Swedish-Transport-Administration 2014), and they lead animals toward theopenings at the crosswalks.
These experimental crosswalks serve as test locations where the effect of variousstimuli can be studied (Fig. 17.5). They thus provide independent replicates andcontrols in a BACI setup (BACI = Before, After, Control, Impact). The crosswalkswill be placed at feasible locations where animals are known to cross the railway(detected by snow tracking) and are dispersed approximately 2 km apart, providingan estimated sufficient level of permeability to moose and roe deer (Seiler et al.2015). The crosswalks will be constructed so that terrain conditions, vegetation andground substrate naturally and effectively lead animals toward the fence gap and
Fig. 17.5 Conceptual sketch of an experimental crosswalk: standard exclusion fences leadanimals towards an opening about 50 m wide where movement detectors, thermal cameras, andvideo cameras monitor the presence and behaviour of animals and trigger the warning systemwhen trains approach. Crushed stone or cattle guards will discourage ungulates from entering thefenced area. Human access to the crosswalk is prohibited (sketch Lars Jäderberg)
286 A. Seiler and M. Olsson

over the railway. Cattle guards or large crushed stones alongside the crossings willdiscourage animals from entering the fenced railroad track. Escape ramps orone-way gates will be installed to allow animals to exit if they get trapped inside thefence nevertheless.
Providing the same animal detection and monitoring and surveillance systems,each experimental crosswalk will operate as an independent unit that will be trig-gered by the same signal from a standard train sensor located several kilometersearlier along the railway. One train sensor will serve several crosswalks, and thedelay between the train passing the sensor and the alarm at each crosswalk willbe adjusted to the speed of the train and the distance between the crosswalk and thesensor. Warnings will only be displayed when animals are detected near thecrosswalk and a train has passed the sensor, i.e., when the risk of a collision isimminent. This basic setup will be identical at all crosswalks and guarantee astandardized basis for the evaluation and comparison of different warning methods.
We budgeted 150,000–270,000 Euros per experimental crosswalk that includessurveillance equipment and warning systems. If such systems were installed on aregular basis, the costs would be substantially lower. The overall budget for the 20–24 crosswalks along 50 km of fenced railways was 5.5 million Euros in total(minimum cost estimate 4,500,000 million Euros and maximum estimate7,800,000 million Euros) (Olsson and Seiler 2015). Most of the budget is reservedfor fences (about 50,000 Euros per km), while research money totalled about5,500,000 Euros over 4 years. However, if one assumes that over the next 20 years,WTC levels and the average costs for repairs, delays, and reimbursements are similarto those of the last 10 years, and at least 80% of the WTCS could be prevented byfences and/or crosswalks, then the socio-economic costs that could be saved bymitigating the selected hotspots alone would exceed 4,600,000 Euros. However, it islikely that the overall costs for the installation of the experimental study will beoutbalanced by the savings, because the benefits are easily underestimated (Olssonand Seiler 2015; Seiler et al. 2016).
The Deterrent System
Traditional attempts to scare animals away from fields, roads, and airports by meansof ultrasonic whistles, explosionss or shooting guns have mostly been ineffective(Koehler et al. 1990; Romin and Dalton 1992; Curtis et al. 1997; Belant et al. 1998;Ujvari et al. 2004). The underlying problem is that when the warning signal is notfollowed by a real threat and is merely a bluff without consequence, animals willsoon habituate and learn to ignore the signal (Bomford and O’Brien 1990). In ourapproach, we rely on the passing train to reinforce the signal. In most cases, as wehave seen in our video recordings, the train will be frightening enough when it isnearby. Habituation should therefore not be a problem; instead, learning shouldinstead lead to a conditioning, provided the animals are able to relate the signal tothe approaching train. Conditioning will presumably work best in those individuals
17 Wildlife Deterrent Methods for Railways—An Experimental Study 287

who have an experimental crosswalk within their home range and thus repeatedlyexperience the signal and the passing train. However, there will always be a pro-portion of animals (offspring, dispersers, and migratory animals) that are not yetconditioned or do not know about the danger of traffic. Thus, rather than usingabstract stimuli, such as whistles or bangs that would alert humans, it may be moreeffective to use natural sounds that already communicate a message for animals,such as a human voice indicating the presence of people, or a deer warning ordistress call for alarming other animals.
Such approaches have been tested in Poland using animal alarm calls, barkingdogs and sounds from hunting scenes (Werka and Wasilewski 2009;Babińska-Werka et al. 2015); in Japan, using sika deer warning calls (Shimura et al.2015); in Italy, using sounds of dogs and humans to scare wildlife off roads whencars approach (Mertens et al. 2014); and in Northern Sweden, using human voicesfrom a conventional radio to alert semi-domestic reindeer (Larsson-Kråik 2005).Experiences from these studies suggest that such warning systems may be effectivein causing the animals to leave the disturbed site.
The basic idea is thus to condition a movement response to an auditory and/orvisual stimulus that is strong enough to evoke the desired, subtle response in mostindividuals, but weak enough to avoid causing a panic reaction and allowing theanimals to experience reinforcement through the passing train.
We intend to address questions such as which signals will work best, howquickly animals learn to respond appropriately, and to what extent this reduces therisk of collisions. If the systems prove successful in moving wildlife away from therailway track when trains approach, they could replace more costly crossingstructures such as bridges or tunnels and provide the necessary complement tofences in an inclusive mitigation system (Huijser et al. 2009; Seiler et al. 2016). Ifthe system is to replace fencing, however, the deterrent or warning effect must beextendable over several kilometers. This may be evaluated in a later study. If thesystem does not operate successfully, i.e., if animals show very little response towarning signals, and if collisions in the crosswalks are not reduced, the gaps in thefences may need to be closed.
Complementary Studies
Besides the aforementioned system of crosswalks and fences, the project willinvolve complementary activities such as in-depth analyses of WTC statistics; fieldsurveys to assess unreported collisions; improvements to the reporting and regis-tration routines of WTCs; studies on the indirect costs of WTCs due to delays intrain traffic; exploration of possible animal detection and warning systems that canbe mounted on train engines instead of in railway infrastructure; and continuedvideo monitoring of train-animal encounters. Collaborations with similar researchprojects in Norway and Austria have been initiated. An international referencegroup will be established together with a group of private companies interested intesting their technical solutions and ideas for a warning system.
288 A. Seiler and M. Olsson

Parallel to this project, empirical studies are being conducted to reducewildlife-vehicle collisions on roads; in combination, these studies will help todevelop national objectives and set up a national strategy for reducing wildlife andtraffic problems in Sweden.
Acknowledgements This project is being financed by the Swedish Transport Administration andconducted in cooperation with Swedish Railways, Enviroplanning AB, and the SwedishUniversity of Agricultural Sciences. Financial support for the video documentation was providedby the Marie Claire Cronstedt Foundation. We thank Luís Borda-de-Água and Rafael Barrientosfor their valuable comments on the manuscript, and Tim Hipkiss at Enviroplanning AB, and GeetaSingh at SLU, for proofreading this paper. The project is being carried out in close collaborationwith Anders Sjölund (Swedish Transport Administration), Pär Söderström, and Anders Forsberg(Swedish Railways), Andreas Eklund (WSP), and many others. We are grateful for the help of thetrain drivers in recording wildlife-train collisions, as well as for the interest of many privatecompanies in developing and testing innovative, technical solutions for warning wildlife onrailways.
References
Åhrén, T., & Larsson, P. O. (1999). Renpåkörningar - En pilotstudie för att hitta förslag tilleffektiva åtgärder för att minska antalet djurpåkörningar utmed Malmbanan. Luleå: BanverketNorra Regionen.
Åhrén, T., & Larsson, P. O. (2001). Djur i spår - En nulägesbeskrivning av djurpåkörningar inomBanverket. Swedish National Rail Administration (intern report).
Babińska-Werka, J., Krauze-Gryz, D., Wasilewski, M., & Jasińska, K. (2015). Effectiveness of anacoustic wildlife warning device using natural calls to reduce the risk of train collisions withanimals. Transportation Research Part D: Transport and Environment, 38, 6–14. doi:10.1016/j.trd.2015.04.021.
Belant, J. L., Seamans, T. W., & Tyson, L. A. (1998). Evaluation of electronic frightening devicesas white-tailed deer deterrents. Proceedings of the Vertebrate Pest Conference, 18, 107.
Bomford, M., & O’Brien, P. H. (1990). Sonic deterrents in animal damage control: A review ofdevice tests and effectiveness. Wildlife Society Bulletin (1973–2006), 18, 411–422.
Borda-de-Água, L., Grilo, C., & Pereira, H. M. (2014). Modeling the impact of road mortality onbarn owl (Tyto alba) populations using age-structured models. Ecological Modelling, 276,29–37. doi:10.1016/j.ecolmodel.2013.12.022
Child, K. (1983). Railways and moose in the central interior of BC: A recurrent managementproblem. Alces, 19, 118–135.
Child, K. N., & Stuart, K. M. (1987). Vehicle and train collision fatalities of moose: Somemanagement and socio-economic considerations. Swedish Wildlife Research, (1), 699–703.
Curtis, P. D., Fitzgerald, C., & Richmond, M. E. (1997). Evaluation of the Yard Gard ultrasonicyard protector for repelling white-tailed deer. Proceedings of the Eastern Wildlife DamageControl Conference, 7, 172.
Gundersen, H., & Andreassen, H. P. (1998). The risk of moose Alces alces collision: A predictivelogistic model for moose-train accidents. Wildlife Biology, 4, 103–110.
Hedlund, J. H., Curtis, P. D., Curtis, G., & Williams, A. F. (2004). Methods to reduce trafficcrashes involving deer: What works and what does not. Traffic Injury Prevention, 5, 122–131.
Huijser, M. P., Duffield, J. W., Clevenger, A. P., Ament, R. J., & McGowen, P. T. (2009).Cost-benefit analyses of mitigation measures aimed at reducing collisions with large ungulatesin the United States and Canada: A decision support tool. Ecology and Society, 14, 15.
17 Wildlife Deterrent Methods for Railways—An Experimental Study 289

Jacobson, S., Bliss-Ketchum, L., De Rivera, C., & Smith, W. P. (2016). A behavior basedframework for assessing barrier effects to wildlife from vehicle traffic volume. Ecosphere, 7,article e01345. DOI Ecosphere 7(4), e01345. 10.1002/ecs2.1345
Jaren, V., Andersen, R., Ulleberg, M., Pedersen, P. H., & Wiseth, B. (1991). Moose-traincollisions: The effects of vegetation removal with a cost-benefit analysis. Alces, 27, 93–99.
Koehler, A. E., Marsh, R. E., & Salmon, T. P. (1990). Frightening methods and devices/stimuli toprevent mammal damage—A review. Paper presented at the proceedings 14th vertebrate pestconference 1990, paper 50. http://digitalcommons.unl.edu/vpc14/50
Kusta, T., Jezek, M., & Keken, Z. (2011). Mortality of large mammals on railway tracks. ScientiaAgriculturae Bohemica, 42, 12–18.
Larsson-Kråik, P. O. (2005). Utvärdering av djurskrämmer vid plankorsningar. Perioden2002-02-01 till 2004-12-31. Luleå: Banverket, BRNB Rapport 2005-02-28.
Litvaitis, J. A., & Tash, J. P. (2008). An approach toward understanding wildlife-vehiclecollisions. Environmental Management, 42, 688–697. doi:10.1007/s00267-008-9108-4
Mertens, A., Ricci, S., Sergiacomi, U., & Mazzei, R. (2014). LIFESTRADE—A new LIFE Projectfor the development of an innovative system to prevent road mortality in central Italy. Paperpresented at the IENE 2014 international conference on ecology and transportation, Malmö,Sweden. http://iene2014.iene.info
Neumann, W., Ericsson, G., Dettki, H., Bunnefeld, N., Keuler, N. S., Helmers, D. P., et al. (2012).Difference in spatiotemporal patterns of wildlife road-crossings and wildlife-vehicle collisions.Biological Conservation, 145, 70–78. doi:10.1016/j.biocon.2011.10.011
Olsson, M., & Seiler, A. (2015). Viltsäker järnväg, Utredning av olycksdrabbade sträckor ochförslag till åtgärder (Vol. 2015, pp. 082). Borlänge: Trafikverket Publikation.
Rea, R., Child, K., & Aitken, D. A. (2010). Youtube TM insights in to moose-train interactions.Alces, 46, 183–187.
Righetti, A., & Malli, H. (2004). Einfluss von ungezäunten (Hochleistungs-) Zugstrecken aufWildtierpopulationen. Bern, CH: COST-341 Synthesebericht - PiU GmbH.
Rolandsen, C. M. (2015). Animal-train accidents on the railway in Norway 1991–2014. InNorwegian with English summary: Dyrepåkjørsler på jernbanen i Norge 1991–2014. Retrievedfrom Trondheim http://www.researchgate.net/publication/277989048
Romin, L. A., & Dalton, L. B. (1992). Lack of response by mule deer to wildlife warning whistles.Wildlife Society Bulletin, 20, 382–384.
Seiler, A. (2005). Predicting locations of moose-vehicle collisions in Sweden. Journal of AppliedEcology, 42, 371–382. doi:10.1111/j.1365-2664.2005.01013.x
Seiler, A. (2011). Viltolyckor på väg och järnväg– nya rön om trender, fördelning och kostnader.Paper presented at the IENE workshop: Viltolyckor, Stockholm. http://sweden.iene.info/2011-viltolyckor/
Seiler, A., & Helldin, J. O. (2006). Mortality in wildlife due to transportation. In J. Davenport &J. L. Davenport (Eds.), The ecology of transportation: Managing mobility for the environment(pp. 165–190). Amsterdam: Kluwer.
Seiler, A., & Olsson, M. (2015). Cost-benefit of wildlife mitigation measures on roads. InSwedish: Viltåtgärder på väg - en lönsamhetsbedömning (Vol. 94). Uppsala, Triekol report,CBM Publications. http://www.TRIEKOL.se
Seiler, A., Olsson, M., Helldin, J. O., & Norin, H. (2011). Ungulate-train collisions in Sweden (InSwedish with English summary: Klövviltolyckor på järnväg - kunskapsläge, problemanalysoch åtgärdsförslag). (Vol. 2011, pp. 058). Borlänge: Trafikverket Publikation.
Seiler, A., Olsson, M., & Lindqvist, M. (2015). Analysis of the permeability of transportinfrastructure for ungulates. In Swedish: Analys av infrastrukturens permeabilitet för klövdjur(Vol. 2015, p. 254). Trafikverket Publikation.
Seiler, A., Olsson, M., Rosell, C., & Van Der Grift, E. A. (2016). Cost-benefit analyses for wildlifeand traffic safety. SAFEROAD Technical report 4. Brussels: Conference of European Directorsof Roads (CEDR).
Seiler, A., Söderström, P., Olsson, M., & Sjölund, A. (2014). Costs and effects of deer-traincollisions in Sweden. Paper presented at the IENE 2014 International Conference on Ecologyand Transportation, Malmö, Sweden. http://iene2014.iene.info
290 A. Seiler and M. Olsson

Shimura, M., Ushoki, T., Kyotani, T., Nakai, K., & Hayakawa, T. (2015). Study of behavior ofsika deer nearby railroad tracks and effect of alarm call. RTRI Report, 29, 45–50.
Swedish-Transport-Administration. (2014). Guideline on wildlife exclusion fences (In Swedish:Viltstängsel). Borlänge: Swedish Transport Administration (Trafikverket) TDOK 2014-0115.
Ujvari, M., Baagoe, H. J., & Madsen, A. B. (2004). Effectiveness of acoustic road markings inreducing deer-vehicle collisions: A behavioural study. Wildlife Biology, 10, 155–159.
Werka, J., & Wasilewski, M. (2009). Animal deterring devices (UOZ-1) monitoring. Warsaw:Warsaw University of Life Sciences (Sggw), Faculty of Forestry, Department of ForestZoology and Wildlife Management.
Open Access This chapter is licensed under the terms of the Creative Commons Attribution 4.0International License (http://creativecommons.org/licenses/by/4.0/), which permits use, sharing,adaptation, distribution and reproduction in any medium or format, as long as you give appropriatecredit to the original author(s) and the source, provide a link to the Creative Commons license andindicate if changes were made.The images or other third party material in this chapter are included in the chapter’s Creative
Commons license, unless indicated otherwise in a credit line to the material. If material is notincluded in the chapter’s Creative Commons license and your intended use is not permitted bystatutory regulation or exceeds the permitted use, you will need to obtain permission directly fromthe copyright holder.
17 Wildlife Deterrent Methods for Railways—An Experimental Study 291

Chapter 18Commerce and Conservation in the Crownof the Continent
John S. Waller
Abstract While railroads figure prominently in U. S. history and culture, theirenvironmental impacts are often overlooked. Here, I describe situations whereoperation andmaintenance of a section of transcontinental railroad inMontana, USA,resulted in high mortality of grizzly bears (Ursus arctos), a threatened species underthe U. S. Endangered Species Act, and where proposed avalanche control measuresconflicted with the preservation mandates of Glacier National Park. A uniquepublic/private partnership was created to work towards effective solutions to envi-ronmental problems. The partnership was successful in decreasing high grizzly bearmortality rates, but less so infinding a consensus on howbest to reduce avalanche risk.I suggest that collaborative partnerships, such as that developed here, will be essentialto solving future environmental problems associated with railroads.
Keywords Avalanche control � Connectivity � Cooperative conservation � Grizzlybear � Highways � Partnerships � Ursus arctos
Introduction
Railroads hold an important place in U. S. history. They served an importantfunction in settling the west and transporting homesteaders and all the goods theyneeded to build a life on the frontier. Completed in 1893, the Great Northern wasone of the last of the frontier railroads. It penetrated the vast wilderness of north-west Montana, opening an area of scenic wonder to a nation hungry to exploreitself. The Great Northern railroad was instrumental in the development of what isnow Glacier National Park, constructing numerous grand lodges and chalets thatnow are themselves historic tourist attractions. These lodges and tourist facilitieswere small islands of civilization within a largely untamed wilderness.
J.S. Waller (&)Glacier National Park, West Glacier, MT, USAe-mail: [email protected]
© The Author(s) 2017L. Borda-de-Água et al. (eds.), Railway Ecology,DOI 10.1007/978-3-319-57496-7_18
293
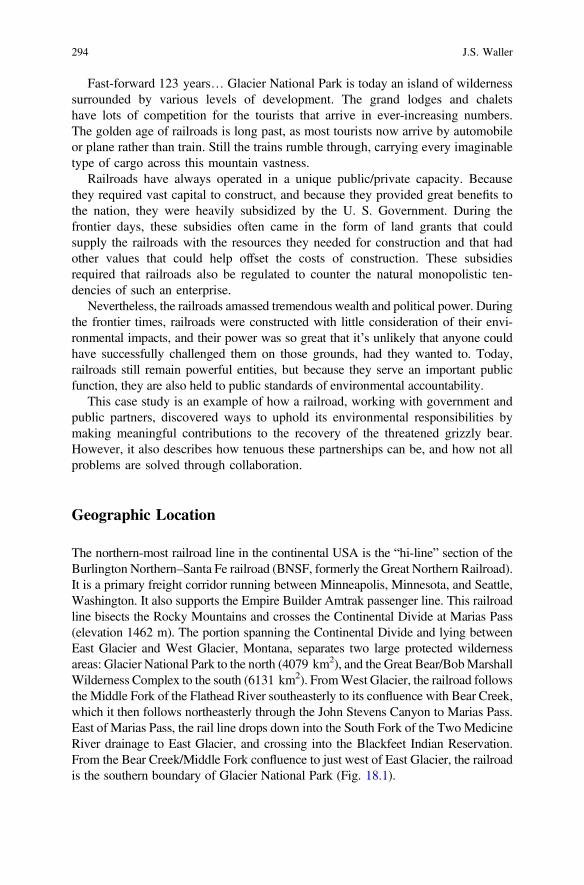
Fast-forward 123 years… Glacier National Park is today an island of wildernesssurrounded by various levels of development. The grand lodges and chaletshave lots of competition for the tourists that arrive in ever-increasing numbers.The golden age of railroads is long past, as most tourists now arrive by automobileor plane rather than train. Still the trains rumble through, carrying every imaginabletype of cargo across this mountain vastness.
Railroads have always operated in a unique public/private capacity. Becausethey required vast capital to construct, and because they provided great benefits tothe nation, they were heavily subsidized by the U. S. Government. During thefrontier days, these subsidies often came in the form of land grants that couldsupply the railroads with the resources they needed for construction and that hadother values that could help offset the costs of construction. These subsidiesrequired that railroads also be regulated to counter the natural monopolistic ten-dencies of such an enterprise.
Nevertheless, the railroads amassed tremendous wealth and political power. Duringthe frontier times, railroads were constructed with little consideration of their envi-ronmental impacts, and their power was so great that it’s unlikely that anyone couldhave successfully challenged them on those grounds, had they wanted to. Today,railroads still remain powerful entities, but because they serve an important publicfunction, they are also held to public standards of environmental accountability.
This case study is an example of how a railroad, working with government andpublic partners, discovered ways to uphold its environmental responsibilities bymaking meaningful contributions to the recovery of the threatened grizzly bear.However, it also describes how tenuous these partnerships can be, and how not allproblems are solved through collaboration.
Geographic Location
The northern-most railroad line in the continental USA is the “hi-line” section of theBurlington Northern–Santa Fe railroad (BNSF, formerly the Great Northern Railroad).It is a primary freight corridor running between Minneapolis, Minnesota, and Seattle,Washington. It also supports the Empire Builder Amtrak passenger line. This railroadline bisects the Rocky Mountains and crosses the Continental Divide at Marias Pass(elevation 1462 m). The portion spanning the Continental Divide and lying betweenEast Glacier and West Glacier, Montana, separates two large protected wildernessareas: Glacier National Park to the north (4079 km2), and the Great Bear/BobMarshallWilderness Complex to the south (6131 km2). FromWest Glacier, the railroad followsthe Middle Fork of the Flathead River southeasterly to its confluence with Bear Creek,which it then follows northeasterly through the John Stevens Canyon to Marias Pass.East of Marias Pass, the rail line drops down into the South Fork of the TwoMedicineRiver drainage to East Glacier, and crossing into the Blackfeet Indian Reservation.From the Bear Creek/Middle Fork confluence to just west of East Glacier, the railroadis the southern boundary of Glacier National Park (Fig. 18.1).
294 J.S. Waller

Fig. 18.1 The Great Northern Environmental Stewardship Area between West Glacier and EastGlacier, Montana, USA
Land Ownership
Traveling southeast from West Glacier, the railroad line passes through intermixedpublic and private lands (Fig. 18.1). The private lands are primarily small ranchesand recreational home sites, small communities, and campgrounds. The public landsare primarily managed by the U. S. Forest Service for recreation and timber. Also, U.S. Highway 2 parallels the railroad for its entire length between East and WestGlacier, as does a natural gas pipeline and electricity transmission line. This narrowribbon of railroad, highway, utilities, and private land development form whatServheen and Sandstrom (1993) term a “fracture zone”which is a zone where humandevelopment impedes the connectivity of wildlife populations within a natural area.
Ecological Characteristics
Glacier National Park and the Great Bear/Bob Marshall Wilderness Complex arehighly protected federal lands managed for preservation of their natural qualitiesand for non-motorized recreation. Glacier National Park has been designated abiosphere preserve and a world heritage site by the United Nations (UNESCO).
18 Commerce and Conservation in the Crown of the Continent 295

Additionally, the Middle Fork of the Flathead River is federally designated as aWild and Scenic River, which recognizes that it flows on an unmodified flood plain,is ecologically unimpaired, and provides some protection from future development.
The floodplain and its function have been the topic of important ecologicalresearch (Harner and Stanford 2003). This area is also home to a number of rarespecies, including some listed as threatened under the U. S. Endangered SpeciesAct (ESA). These include the grizzly bear (Ursus arctos), Canada lynx (LynxCanadensis), wolverine (Gulo gulo), and bull trout (Salvelinus confluentus).Other species of note are Rocky Mountain elk (Cervus canadensis), mountain goat(Oreamnos americanus), Rocky Mountain bighorn sheep (Ovis canadensis), moose(Alces alces), mountain lion (Puma concolor), black bear (Ursus americanus), wolf(Canis lupus), and bald eagle (Haliaeetus leucocephalus); in fact, the area retains itsentire complement of native fauna with the exception of American bison (Bisonbison). This diverse fauna is supported by high floral diversity that arises from theareas location within the transition zone between the Pacific coastal and continentalclimate regimes.
West of the continental divide, the climate is characterized by cold, wet winters,and cool, moist summers, supporting extensive conifer forests, primarily ofEngelmann spruce (Picea engelmannii) and subalpine fir (Abies lasiocarpa).Lodgepole pine (Pinus contortus), Douglas fir (Pseudotsuga menziesii), andwestern larch (Larix occidentalis) are also well represented. East of the continental
Fig. 18.2 A westbound Burlington-Northern Santa Fe freight train crossing Marias Pass
296 J.S. Waller

divide, the climate is characterized by dry, cold winters and hot, dry summers. Here,conifer forests give way to extensive aspen (Populus tremuloides) park lands andshortgrass prairie (Fig. 18.2). The entire area has been frequently recognized as animportant area for wildlife connectivity, for example, the Yellowstone to Yukonconservation initiative (Levesque 2001), the Western Governors Association(2008), and the National Fish and Wildlife Foundation (Ament et al. 2014). Thelarger ecosystem, which the BNSF rail line crosses has been variously termed theNorthern Continental Divide Ecosystem (NCDE; in a grizzly bear recovery plancontext), or the Crown of the Continent Ecosystem (in a trans-boundary manage-ment context).
Railroad Attributes
The East Glacier to West Glacier portion of the BNSF railroad line is composed ofsingle and double-track sections, depending on topography. Locomotives are stagedalong the track to help long freight trains ascend and descend the pass. Freighttrains carry a wide variety of goods and materials, especially corn and wheat fromthe Midwest headed to Pacific export terminals. In recent years, a large volume ofcrude oil from the Bakken oil fields in North Dakota has been transported as well.Because the railroad traverses extreme mountain topography, it is impacted bysnow avalanches, rock slides, floods, heavy snow, and extreme temperatures thatcan affect rail integrity. Most of the wooden railroad ties over the pass have beenreplaced with concrete ties to help improve track stability. There are also snowsheds that protect portions of the track from avalanches.
The railroad line in this area generally has a smaller ecological footprint thanhighways because its width is typically narrower and carries less human traffic.However, as is the case here, railroad lines are typically paired with other devel-opments such as roads and utility corridors. Thus, the cumulative footprint is large.In many areas, wildlife fencing is used to keep animals off rail lines and roads, butin our area, neither the highway nor the railroad line are fenced to exclude wildlife.
A Grizzly Problem Arises
The railroad operated without much environmental controversy through most of thetwentieth century. However, a problem arose during the late 1980s and early 1990s.Between 1985 and 1989, at least 134 cars of corn derailed along a 15-mile sectionof track west of Marias Pass (Fig. 18.3). Each car carried approximately 3500bushels of corn so the total amount spilled was 469,000 bushels or nearly12,000 metric tons. In its haste to repair the tracks and to dispose of the spilledgrain, BNSF buried it along its right-of-way. As the buried grain began todecompose, it fermented, producing a strong odor that drew black and grizzly bears
18 Commerce and Conservation in the Crown of the Continent 297

into the site from many kilometers away. One observer claimed to have observed atleast 20 different grizzly bears feeding at the site. As the bears began to excavateand consume the fermented grain, some observers believed the bears becameintoxicated. Regardless, the feeding bears became highly habituated to the closepassage of trains. As a result, between 1985 and 1990, at least 9 grizzly bears werehit by trains and killed. Grizzly bears are listed as a threatened species under the U.S. Endangered Species Act; hence, their deaths during operation of the railroadamounted to an illegal taking under that act.
These grain spills and the resulting deaths of grizzly bears brought increasedscrutiny to the frequency and causes of grizzly bear mortalities in the corridor.Bears weren’t just dying during grain spills–they were dying at relatively high ratesin general. Bears were being struck and killed along the tracks at areas other thangrain spills and in conflicts with humans at developed sites. Further investigationrevealed that many of the hopper-bottom train cars that carry grain had hopperdoors that did not seal well; as a result, grain constantly dribbled out along thetracks and created small piles between the rails whenever the train stopped. Also, astrain cars were filled at terminals, grain would accumulate along the tops of the cars,which would then fall off along the tracks as the train headed west. This continuousdeposition of grain along the tracks acted as a powerful attractant for bears. Most ofthe bears found killed by trains had grain in their stomachs.
Much of the rail line through the corridor crosses ungulate winter range andareas grazed by livestock. Wild ungulates and domestic livestock are occasionally
Fig. 18.3 Spilled corn covers the slopes below the tracks during cleanup of a freight trainderailment near Marias Pass, Montana, USA
298 J.S. Waller

struck by trains and their carcasses also become attractants for bears. As bears cometo scavenge the remains, they themselves become victims.
A third important source of mortality was associated with trestles. The rail linecrosses a number of deeply incised water courses with high trestles (Fig. 18.4). Asgrizzly bears traveled the tracks in search of grain and carcasses, or just as an easymeans of travel, they would utilize these trestles. Occasionally, an oncoming trainwould overtake bears on the trestle where they could not escape and they would behit and killed.
Working Towards a Solution
In 1990, two environmental activist groups threatened to sue the railroad for con-tinuing to kill grizzly bears. During the summer of 1992, railroad operations causeda small wildfire inside Glacier National Park (GNP) that enabled the park to seekdamage reparation payment from BNSF. In order to help prevent future grizzly bearmortalities, then-GNP Superintendent Gil Lusk suggested that rather than pay GNPdamages for the fire, BNSF establish a special organization to help facilitatesolutions to environmental problems in the rail corridor. BNSF agreed and estab-lished the rail line between East and West Glacier as a special operating area called
Fig. 18.4 A Burlington-Northern Santa Fe freight train crosses the Sheep Cr. Trestle
18 Commerce and Conservation in the Crown of the Continent 299

the Burlington-Northern Environmental Stewardship Area (BNESA), along with anorganization to administer its operation.
In the agreement, BNSF and the signatory agencies acknowledged the impor-tance of balancing the interests of commerce, agriculture, transportation, naturalresources, and wildlife and acknowledged the nationally significant qualities of thecorridor. Specifically, the parties agreed to pay particular attention to the operationand maintenance of the railway because of the areas importance to populations ofthreatened and endangered species. The parties committed to working cooperativelywith affected jurisdictions to plan and implement emergency responses to derail-ments, including providing and placing emergency response equipment to expediteresponse times and prevent spilled materials from entering rivers and streams. Theagreement tasked wildlife biologists from the Montana Department of Fish,Wildlife, and Parks (MFWP) with determining specific sections of track that werehazardous to grizzly bears or sections where bears frequently crossed the tracks orotherwise congregated. BNSF committed to rapid spill response and placement ofcleanup material at key points for ready access to these resources; to strict adher-ence to operating speed limits, and use of continuous welded rail, welded turnouts,and concrete ties to improve rail integrity; the erection of fences at key locationsdetermined by MFWP wildlife biologists; and special training and educationalprograms for BNSF personnel working in the corridor conducted by the appropriateagency. The BNESA agreement also established a conservation trust fund to beused for the protection of critical grizzly bear habitat and movement corridors,placement of a grizzly bear management specialist to serve as a coordinator in thearea, provide education and resolution of management issues and bear conflicts, andresearch to evaluate the effectiveness of operational changes and develop newtechniques to minimize grizzly bear mortalities. Additional actions implemented byBNSF included the regular use of a vacuum truck that picks up spilled grain alongthe tracks, and every spring after the snow melts, BNSF crews pick up carcassesalong the tracks and dispose of them in safe areas. They have also usedmotion-sensitive electronic noise makers on trestles to discourage use by bears, andexperimented with electric fencing and electric “track-mats”. It is difficult to assessthe success of these efforts in absolute terms, but we do know that even as thenumber of bears in the ecosystem has increased substantially (Mace et al. 2012), thenumbers of bears hit and killed along the railroad tracks has dropped significantly;only four grizzly bears were killed between 2010 and 2015, compared to thesix-year running average of 11.
As the BNESA organization grew, its name was changed to the Great NorthernEnvironmental Stewardship Area (GNESA) to reflect its broader mission andpurpose beyond just the BNSF railroad. The GNESA organization grew to includerepresentatives of the more than 20 state, tribal, and federal agencies having landmanagement authority within the GNESA corridor (GNP, U. S. Forest Service,MFWP, Montana Department of Transportation, U. S. Fish and Wildlife Service,Flathead Conservation district, and Blackfeet Indian Nation), private land owners,utilities (Flathead and Glacier Electric Cooperatives, Northwestern Energy), andcounty officials. Over the next several years, GNESA facilitated additional actions
300 J.S. Waller

to reduce grizzly bear mortalities along the railroad tracks. They helped fund atransition from open garbage containers to bear-resistant models at county refusesites; worked to establish guidelines for the safe transportation of hazardousmaterials through the corridor; and facilitated interagency cooperation in planningfor responses to accidents involving hazardous materials, including resolution ofemergency communications issues.
GNESA has also supported wildlife research in the corridor, including studies ofhabitat connectivity across the corridor. They worked to preserve local knowledgeof wildlife connectivity by hosting workshops that involved citizens who work andlive in the corridor, including train engineers, school bus drivers, local lawenforcement officials, biologists, and rangers. They helped fund a study of gametrail use in the corridor that identified where animals were crossing the highway andrailroad (Roesch 2010). This information will be vital, as crossing structures mayeventually be required.
BNSF and the U. S. Department of Transportation also supported in-depthresearch into grizzly bear movement patterns across the corridor. Obtainingfine-scale movement data from grizzly bears was nearly impossible before theadvent of satellite global positioning system (GPS) tracking collars in the late1990s. One of the first studies in the continental U. S. to utilize this technology onbrown bears was that of Waller and Servheen (2005), which used a relatively largesample of GPS-collared grizzly bears (n = 42), paired with detailed road and trafficcounts, to assess the response of grizzly bears to various traffic types and volumes.These researchers found that although the highway and railroad did have mea-sureable effects on the trans-corridor movements of grizzly bears, they still crossedfrequently and successfully. Grizzly bears crossing the transportation corridor werefaced with traversing both the railroad line and the highway, which closely parallelone another through the GNESA area. The monitored grizzly bears appeared tomake behavioral adjustments to daily fluctuations in highway traffic but not for railtraffic. Grizzly bears chose to cross the corridor when highway traffic volumeswere lowest, but when rail traffic was the highest. Rail traffic was higher at nightbecause most rail maintenance work is done during daylight hours, thus curtailingdaytime freight traffic. Furthermore, freight trains loaded on the coast during theday leave in the evening and arrive in the GNESA area at night, 24–36 h later. Itmay be that grizzly bears are more easily habituated to rail traffic because it tendsto be highly predictable. The consequence, however, is that grizzly bear mortalitywas much higher on the tracks than on the highway. Between 1980 and 2002, 23grizzly bears were killed on the tracks in the GNESA corridor, but only two on thehighway. The fine-scale movement data did not show that grizzly bears were stillfeeding on grain accumulations along the railroad tracks, suggesting thatgrain-control actions were working as intended. Therefore, the authors concludedthat the high observed post-grain spill mortality rates were the consequence ofhigh rail traffic volume, low highway traffic volume, and natural grizzly bearmovement patterns.
The collaborative environment that fostered the birth of GNESA and innovativeproblem-solving approaches to environmental issues was recognized as a model for
18 Commerce and Conservation in the Crown of the Continent 301

other conservation problems throughout the world. In 2008, GNESA was recog-nized by the U. S. Department of Interior as an exemplary example of collaborativeconservation (USDOI 2008). Such collaboration is often the result of the rightpeople being in the right place at the right time. In 2004, an issue arose that wouldtest the limits of the collaborative efforts embodied in GNESA.
An Avalanche of Problems
On January 28, 2004, heavy snowfall resulted in avalanches in the GNESA corridorthat blocked the BNSF railroad for 29 h. These avalanches began in starting zoneswithin the GNP. During the storm, an empty 119-car freight train was struck by anavalanche and derailed. While it was derailed, another avalanche in an adjacentslide path struck the train again, derailing more cars. A third avalanche nearly hit aclean-up crew, and a fourth avalanche hit a truck travelling the highway beneath therailroad. Responding to continued snowpack instability and the need to ensure thesafety of its personnel, BNSF requested a special use permit from GNP that wouldauthorize explosive avalanche control in the John Stevens Canyon. After muchdeliberation, GNP granted a 3-day emergency special use permit, but, as is often thecase, moderate weather allowed the snowpack to stabilize, and the avalanche riskabated before any control measures could be implemented.
After the January 2004 incident, BNSF contracted with a company specializingin avalanche control to analyze the avalanche hazard in the canyon. Their reportdescribed the avalanche potential in 14 avalanche paths along the railroad in theJohn Stevens Canyon (Hamre and Overcast 2004). Nine of those paths had somelevel of protection provided by snow sheds, although seven of them were too shortto provide complete protection. Avalanche paths are dynamic, changing over timewith changes in vegetation growth. Most of the sheds were constructed around1900, so for some of them, the paths had widened or altered position, so that thesheds no longer provided complete protection (Fig. 18.5). The report identifiedavalanche hazard reduction measures ranging from explosive control to snow shedconstruction. From the viewpoint of BNSF and their consultants, explosive controlwas the most expedient and cost-effective means to mitigate the avalanche risk.However, the viewpoint of GNP was quite different.
Glacier National Park is congressionally mandated to protect the park fromimpairment resulting from human-caused activities. Other legal mandates includethe protection of wilderness values (the Wilderness Act of 1964), protection ofthreatened and endangered species, protection of scenic and cultural resources, andmaintenance of visitor enjoyment. The use of explosives generally ran counter tothese mandates and were inconsistent with the park’s status as a biosphere preserveand world heritage site. In order to evaluate alternative courses of action, GNPprepared an Environmental Impact Statement (EIS) as required by the NationalEnvironmental Policy Act of 1970. Four alternatives were evaluated in the EIS: a“no action” alternative, by which no action by BNSF to mitigate avalanche hazard
302 J.S. Waller
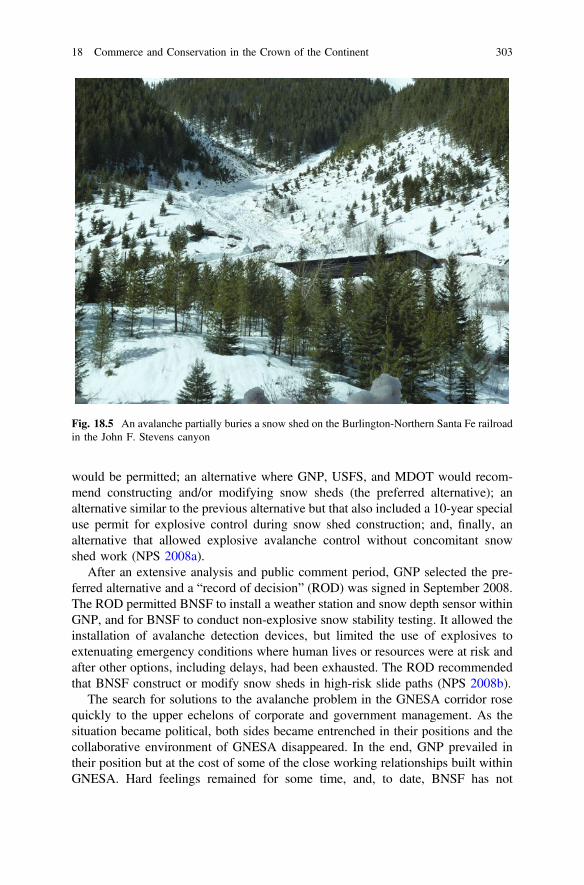
would be permitted; an alternative where GNP, USFS, and MDOT would recom-mend constructing and/or modifying snow sheds (the preferred alternative); analternative similar to the previous alternative but that also included a 10-year specialuse permit for explosive control during snow shed construction; and, finally, analternative that allowed explosive avalanche control without concomitant snowshed work (NPS 2008a).
After an extensive analysis and public comment period, GNP selected the pre-ferred alternative and a “record of decision” (ROD) was signed in September 2008.The ROD permitted BNSF to install a weather station and snow depth sensor withinGNP, and for BNSF to conduct non-explosive snow stability testing. It allowed theinstallation of avalanche detection devices, but limited the use of explosives toextenuating emergency conditions where human lives or resources were at risk andafter other options, including delays, had been exhausted. The ROD recommendedthat BNSF construct or modify snow sheds in high-risk slide paths (NPS 2008b).
The search for solutions to the avalanche problem in the GNESA corridor rosequickly to the upper echelons of corporate and government management. As thesituation became political, both sides became entrenched in their positions and thecollaborative environment of GNESA disappeared. In the end, GNP prevailed intheir position but at the cost of some of the close working relationships built withinGNESA. Hard feelings remained for some time, and, to date, BNSF has not
Fig. 18.5 An avalanche partially buries a snow shed on the Burlington-Northern Santa Fe railroadin the John F. Stevens canyon
18 Commerce and Conservation in the Crown of the Continent 303

attempted to construct or modify any snow sheds, instead relying on an avalancheforecasting program to mitigate risk. They have approached the park on at least oneoccasion for a special permit for avalanche control, but usually high-hazard condi-tions ameliorate rapidly and so the opportunities for explosion control are verylimited (Reardon et al. 2004). The BNSF also purchased a “Daisy Bell” devicewhich, when suspended below a helicopter, can test snow stability by directing ablast downward to the snowpack. This technique eliminates many of the disad-vantages associated with explosive control. Fortunately, it appears that, as timepasses and as personnel changes take place, working relationships are being restored.
What Next?
The GNESA corridor remains an important locale for commerce and connectivity,and grizzly bears remain an important issue in the corridor. The U. S. Fish andWildlife Service is working with BNSF to prepare a habitat conservation plan that,under the ESA, will indemnify BNSF against litigation resulting from grizzly beardeaths provided that BNSF continues to implement procedures and practices thatwork to minimize mortalities. The implementation of the GNESA protocols andcontinued support of the organization will likely be an important component of thatplan.
In general, efforts to control grizzly bear mortality have been successfulthroughout the ecosystem, and the grizzly bear population rapidly is expanding(Mace et al. 2012). State and federal bear managers are confident about the recoveryof the bear population and will likely seek removal of the NCDE grizzly bear from theESA within the next several years. Collaborative conservation efforts, as embodiedby GNESA, have been critical to the attainment of this conservation success.
New issues will continue to surface as development within the corridor con-tinues. Heavy traffic of railroad cars carrying crude oil have been a concern, as hasincreasing traffic on U. S. Highway 2 (Waller and Miller 2016). As traffic increases,wildlife connectivity across the corridor will diminish to the point where some typeof accommodation will have to be made. Crossing structures are the current tool formaintaining connectivity, but other concepts may arise. For example, strategichighway planning might be used to direct higher traffic volumes to better-developedroad systems in less ecologically sensitive areas. The avalanche sheds currentlyused are over 100 years old, in some cases, it might be possible to replace themwith new designs that serve to protect the railroad and highway from avalanchesand also serve as a crossing structure. Conservation investments of this magnitudewill require public/private partnerships and inter-agency collaboration.
New technologies will continue to surface that have the potential to further limitwildlife mortalities and railroads have a responsibility to support the developmentand application of these technologies. For example, long-range, optical-infraredvideo alarm systems can warn engineers of wildlife on tracks day or night, far in
304 J.S. Waller

advance, and long-range acoustic devices or other sonic devices may be able to getanimals to move out of harm’s way (Babińska-Werka et al.2015; Grey 2015).
As connectivity becomes an issue, so will watershed integrity. When the railroadwas constructed, massive cuts and fills were used to bridge drainages (Fig. 18.6),these large fills obstruct the natural terrain, alter natural stream courses, and mayneed to be removed. Modification of this kind will be very expensive and willprobably require public investment.
The success of the GNESA partnership was due, in large part, to the participationof individuals who were unafraid to take risks inside corporate and agency cultures.These individuals were committed to using the GNESA group to seek solutions andto resolve issues at the lowest possible levels. They did not use the media to advancetheir positions; they worked to get to know one another on a personal level; and theyrespected each other’s different mandates. It also required organizational frame-works that were flexible towards this type of participation and tolerant of the risk thatcomes with trusting others in other organizations. Future success will demand moreof the same from individuals and organizations. Building trust takes time andpatience; while some conflict may be inevitable, it is important to accept thosesituations and move beyond them. Building a robust network of trust requires morethan just affinitive trust among key individuals; establishing rational andsystems-based trust adds resiliency when personnel turnover changes the group
Fig. 18.6 A large cut-and-fill railroad bed completely obstructs natural drainage in GlacierNational Park
18 Commerce and Conservation in the Crown of the Continent 305

dynamic (Stern and Baird 2015). Bridging organizations, such as GNESA, bridgethe boundaries between stakeholders that operate at different scales, linking variedconstituencies to increase collective capabilities and social capital (Pretty 2003;Pahl-Wostl et al. 2007). With these lessons in mind, the trust and culture willhopefully be in place to allow future collaborative conservation to proceed.
Acknowledgements This study presents the combined contributions of many persons over thecourse of many years. The author thanks the GNESA partnership for their commitment to envi-ronmental stewardship. Major funding for the work described herein was provided by the U.S. Fish and Wildlife Service, U. S. National Park Service, Glacier National Park, and the FederalHighways Administration. Valuable support was provided by the U. S. Forest Service; MontanaDepartment of Transportation; Montana Department of Fish, Wildlife, and Parks; and theBurlington-Northern Santa Fe railroad.
References
Ament, R., McGowen, P., McClure, M., Rutherford, A., Ellis, C., & Grebenc, J. (2014). Highwaymitigation for wildlife in northwest Montana. Sonoran Institute, Northern Rockies Office,Bozeman, MT, 84 pp.
Babińska-Werka, J., Krauze-Gryz, D., Wasilewski, M., & Jasińska, K. (2015). Effectiveness of anacoustic wildlife warning device using natural calls to reduce the risk of train collisions withanimals. Transportation Research Part D: Transport and Environment, 38, 6–14.
Grey, E. (2015). The underdog: Preventing animal casualties on railways. http://www.railway-technology.com/features/featurethe-underdog-preventing-animal-casualties-on-railways-4532957/.Accessed June 12, 2016.
Hamre, D., & Overcast, M. (2004). Avalanche risk analysis: John Stevens Canyon, Essex,Montana. Unpublished Report, Chugach Adventure Guides, LLC., Girdwood, AK, 80 pp.
Harner, M. J., & Stanford, J. A. (2003). Differences in cottonwood growth between a losing and againing reach of an alluvial floodplain. Ecology, 84, 1453–1458.
Levesque, S. L. (2001). The Yellowstone to Yukon conservation initiative: reconstructingboundaries, biodiversity, and beliefs. In: Reflections on water: New approaches totransboundary conflicts and cooperation (pp. 123–162). Cambridge: MIT Press.
Mace, R. D., Carney, D. W., Chilton-Radandt, T., Courville, S. A., Haroldson, M. A., Harris, R.B., et al. (2012). Grizzly bear population vital rates and trend in the Northern ContinentalDivide Ecosystem, Montana. The Journal of Wildlife Management, 76, 119–128.
National Park Service. (2008a). Avalanche hazard reduction by Burlington Northern Santa FeRailway in Glacier National Park and Flathead National Forest, Montana. Final EnvironmentalImpact Statement.
National Park Service. (2008b). Avalanche hazard reduction by Burlington Northern Santa FeRailway in Glacier National Park and Flathead National Forest, Montana. Record of Decision.
Pahl-Wostl, C., Craps, M., Dewulf, A., Mostert, E., Tabara, D., & Taillieu, T. (2007). Sociallearning and water resources management. Ecology and Society, 12, 2007.
Pretty, J. (2003). Social capital and the collective management of resources. Science, 302,1912–1914.
Reardon, B. A., Fagre, D. B., & Steiner, R. W. (2004, September). Natural avalanches andtransportation: A case study from Glacier National Park, Montana, USA. In Proceedings of theInternational Snow Science Workshop (pp. 19–24).
306 J.S. Waller

Roesch, M. J. (2010). Identifying wildlife crossing zones for the prioritization of highwaymitigation measures along US Highway 2: West Glacier, MT to Milepost 193. Thesis,University of Montana.
Servheen, C., & Sandstrom, P. (1993). Ecosystem management and linkage zones for grizzly bearsand other large carnivores in the northern Rocky Mountains in Montana and Idaho.Endangered Species Technical Bulletin, 18(3), 10–13.
Stern, M. J., & Baird, T. (2015). Trust ecology and the resilience of natural resource managementinstitutions. Ecology and Society, 20, 14.
US Department of Interior. (2008). Press release. Available from https://www.doi.gov/sites/doi.gov/files/archive/news/archive/08_News_Releases/080421d.html
Waller, J. S., & Miller, C. S. (2016). Increasing traffic volumes on US Highway 2. IntermountainJournal of Sciences, 21 (in press).
Waller, J. S., & Servheen, C. (2005). Effects of transportation infrastructure on grizzly bears inNorthwestern Montana. Journal of Wildlife Management, 69, 985–1000.
Western Governors Association. (2008). Western Governors’ Association wildlife corridorsinitiative report. Available from http://www.westgov.org/images/dmdocuments/wildlife08.pdf.Accessed July, 2016.
Open Access This chapter is licensed under the terms of the Creative Commons Attribution 4.0International License (http://creativecommons.org/licenses/by/4.0/), which permits use, sharing,adaptation, distribution and reproduction in any medium or format, as long as you give appropriatecredit to the original author(s) and the source, provide a link to the Creative Commons license andindicate if changes were made.The images or other third party material in this chapter are included in the chapter’s Creative
Commons license, unless indicated otherwise in a credit line to the material. If material is notincluded in the chapter’s Creative Commons license and your intended use is not permitted bystatutory regulation or exceeds the permitted use, you will need to obtain permission directly fromthe copyright holder.
18 Commerce and Conservation in the Crown of the Continent 307

Part IIIConclusion

Chapter 19What’s Next? Railway Ecology in the 21stCentury
Rafael Barrientos, Luís Borda-de-Água, Pedro Brum, Pedro Bejaand Henrique M. Pereira
Predicting is very difficult, especially about the future, attributedto Niels Bohr.
Abstract As societies realise the importance of maintaining biodiversity and,accordingly, acknowledge the need for monitoring, minimizing and compensatingthe impacts of socioeconomic activities, including transportation, more scientistswill be called to address these societal challenges. Railway Ecology is emerging inthis context as a relatively new field to identify and provide solutions to the specificenvironmental problems associated with the building and operation of railways,particularly their impacts on wildlife. This is an interdisciplinary field that uses anddraws methods from other disciplines, ranging from ecology and genetics, tostatistics and computer simulations. Here, we summarize the guidelines to addressrailway-related biodiversity conservation problems as they were identified in theseveral chapters of this book, and recommend lines for future research.
Keywords Climate change � Environmental sustainability � Linear infrastructures �Railway ecology
R. Barrientos � L. Borda-de-Água � P. Beja � H.M. PereiraCIBIO/InBIO, Centro de Investigação em Biodiversidade e Recursos Genéticos,Universidade do Porto, Campus Agrário de Vairão, Rua Padre Armando Quintas,4485-661 Vairão, Portugal
R. Barrientos (&) � L. Borda-de-Água � P. Beja � H.M. PereiraCEABN/InBIO, Centro de Ecologia Aplicada “Professor Baeta Neves”,Instituto Superior de Agronomia, Universidade de Lisboa, Tapada da Ajuda,1349-017 Lisboa, Portugale-mail: [email protected]
P. BrumFaculdade de Ciências Socias e Humanas da Universidade Nova de Lisboa,Lisboa, Portugal
H.M. PereiraGerman Centre for Integrative Biodiversity Research (iDiv)Halle-Jena-Leipzig Deutscher Platz 5e, 04103 Leipzig, Germany
© The Author(s) 2017L. Borda-de-Água et al. (eds.), Railway Ecology,DOI 10.1007/978-3-319-57496-7_19
311

A Bright Look at the Future of Railways
Transportation in the 21st century involves multiple challenges. Transports will haveto deal with the increasing needs of a growing and wealthier human population, andthe socioeconomic requirements to deliver natural resources, manufactured goods,and transport people. The emergence of new strong economies, and the expectationthat economic growth will raise the living standards of vast populations, will be surelyaccompanied by an increase in transportation infrastructures, given the well-knownrelationship between transportation activity and Gross Domestic Product(GDP) (Profillidis 2014). How societies will accommodate economic developmentwith the biophysical constrains imposed by the environment is a major challenge, butone where railways will certainly play an important role (Smith 1998, 2003).
One of the reasons to expect a steady development of railways is related to theircost-effectiveness over other means of transportation, particularly for the so-calledintermediate range distances (Profillidis 2014). Therefore, it is expected that rail-ways will develop to fill in the niche that lay somewhere in-between the local doorto door transportation and, in the other extreme, the long distance transportation ofpassengers or freight that is better accomplished through aviation or marinetransportation. The exact level at which railways will fill in such niche, however,will depend on the characteristics of the region where they operate: its geography,the size of its population and how the population is distributed. Nevertheless, it islikely that in many countries new railway lines will be built and others will beimproved, to support, for instance, the commuting of people between the suburbiaand city centres, to transport passengers among cities laying a few hundred kilo-metres apart, and to transport freight among harbours and big cities.
Another reason to expect the expansion of railways is related to its environmentalbenefits relatively to othermeans of transportation, which iswell illustrated by the roleit can play in addressing global warming. For instance, Dulac (2013) analysedinfrastructure requirements under different climate change scenarios, concluding thatan increase in 335,000 railway track kilometres would be needed to accommodate theprojected transportation needs until 2050, while keeping the increase in averageglobal atmospheric temperatures under 4 °C. Under a more strict policy scenario of a2 °C increase in temperatures, the railway network would have to expand byapproximately 535,000 track kilometres, reflecting the higher efficiency of railwayover road transportation (Dulac 2013). Once again, this will certainly lead to a steadydevelopment of railway networks, thereby calling for the collaboration of railwayecologists tomitigate impacts and to foster the environmental added value of railways.
Emerging Trends and Challenges
While we expect a major development in railway networks in the next decades,technological developments may considerably affect their characteristics, as well asthe environmental problems that will be raised. For instance, in regions with high
312 R. Barrientos et al.

population densities the use of the magnetic levitated (“maglev”) trains maybecome a typical feature (Najafi and Nassar 1996), but some of the problemsassociated with barrier effects and mortality are still likely to occur. Althoughmaglev trains share several of the characteristics with the present railways, othertechnologies such as the admittedly farfetched “hyperloop” may differ considerably(Matthews and Brueggemann 2015). In a hyperloop, passengers and freight travelin vehicles enclosed in elevated “tubular” structures. In this case, barrier effects willbe greatly reduced, and mortality due to collisions with the trains will disappear,though the possibility of flying animals colliding with the tubular structure will stillexist. Another technological advancement that is likely to develop in forthcomingyears is electric cars with auto-pilot features. As we write, this technology is beingpromoted by large companies (e.g., Google) and at least one company alreadycommercializes cars with hardware and software enabling the auto-pilot mode(Tesla Motors), a development that services such as Uber may use automated in thefuture. These vehicles, or future improved versions, may enable comfortable travelswith the flexibility of door to door connections, challenging some of the advantagesthat trains presently exhibit for some distances. Nevertheless, it is unlikely thatrailway transportation as we know it today will become obsolete at any time in thenear future, requiring a continued engagement of railway ecologists to deal with thecurrent and future challenges associated with this transportation system.
Despite its positive prospects at the global scale, however, it is likely that somerailway lines will get out of operation due to technological developments andchanges in socioeconomic requirements, as it has happened during the past decades.For instance, railways in the USA after World War II were quickly put aside infavor of other means of transportation of passengers, such as automobiles andairplanes, and by 1990 the 270,000 miles of active rail lines had diminished to141,000 miles (Ferster 2006), though railways have retained 43% of the freightmarket (Profillidis 2014). Comparable processes have occurred in other countriessuch as Portugal, where many lines built during the early twentieth century losttheir importance and were progressively abandoned during the second half of thetwentieth and early twentyfirst centuries (Sarmento 2002). These changes representopportunities for conservation and call for the active participation of railwayecologists in collaboration with other specialists, as abandoned railway lines maylead to ecologically-oriented projects as well as to the mitigation of situations ofsocial injustice. The combination of ecological and social minded policies cancontribute to a new global pattern of urban transformation, as exemplified by theHigh Line in New York City or the Sentier Nature in Paris (Foster 2010). The oldHigh Line railroad was disused in 1980 and it then started to develop as asemi-natural habitat that was converted into a public park comprising twenty-twoblocks along the lower west side of Manhattan (Foster 2010). Paris’ Sentier Naturerepresents another approach, where an old railway was converted into a nature trail,now enriched with a diversity of types of ecosystems, with 200 species of flora and70 species of fauna (Foster 2010). Although this field of ecological restoration afterrailway abandonment was not dealt with in this book, this is an important area
19 What’s Next? Railway Ecology in the 21st Century 313

where the experience on linear infrastructures of railway ecologists may proveinstrumental, namely due to their knowledge on the species and habitats that canpersist in railway verges in urban and suburban settings (see Chap. 16).
Railways Travel Towards Environmental Sustainability
As with any other means of transportation, there are environmental issues associ-ated with railways, ranging from wildlife mortality, barrier effects, introduction ofexotic species, and several forms of pollution. Some of these are comparable tothose found in roads and other linear infrastructures, while others are railwayspecific. Likewise, some mitigation measures can be adapted from road and powerline infrastructures, while others have to be developed specifically for railways. Ashighlighted throughout this book, information is still in short supply for the eval-uation and mitigation of impacts specific to railways, which justifies the need tocontinue investing in research programs targeting railway ecology on its own right.Based on the collective experience of this book we suggest that the followingresearch lines should be the priority focus of such programs, which will greatlycontribute to help keep railways on track towards environmental sustainability:
• First and foremost, studies to evaluate the biodiversity impacts of railways andtheir mitigation measures need in most cases to be strengthened through the useof adequate designs, sufficiently large sample sizes, and sufficiently long timeframes. Ideally, BACI (Before-After-Control-Impact) designs should be used toexamine such impacts, avoiding simple designs that have little power todemonstrate causality (Balkenhol and Waits 2009; Corlatti et al. 2009; Soaneset al. 2013; see Chap. 12). Monitoring must be long-term, as some species needtime to get used to disturbances associated with railway operation, and to theimplementation of mitigation measures (Baofa et al. 2006; Yang and Xia 2008;Corlatti et al. 2009; Soanes et al. 2013).
• Second, we still need better estimates of wildlife mortality in railways, thoughthis is one of the most visible and well-studied impacts. Tackling this problemwill require, for instance, field experiments on searcher efficiency and carcasspersistence on railways (Barrientos et al. in review). These are expected to berailway-specific because, as commented in Chap. 1, traffic flow on railways ismarkedly lower than that of roads. This is important because low traffic flowsallow time gaps for scavengers to have access to carcasses. On the other hand,trains travel over rails, and corpses falling out of them can persist longer as thereis no flattening as it may happen in roads.
• Third, we need a better understanding on the barrier and fragmentation effects ofrailways, and how these may act together with those of other linear structuressuch as roads (see, e.g., Chap. 14). Concurrently, we need to know where, whenand how can wildlife passes effectively mitigate such barrier and fragmentationeffects, by helping to restore connectivity across the landscape. A range of
314 R. Barrientos et al.

studies may contribute to such understanding, including comparisons of wildlifecrossings of railways before and after the building of wildlife passes, in placeswith and without such passes (i.e., BACI designs; Corlatti et al. 2009; Soaneset al. 2013). Novel molecular techniques may also contribute to tackle theseissues, using for instance non-invasive genetics to know which individuals crossthe railways and how railway barriers contribute to spatial genetic structuring(Riley et al. 2006; Balkenhol and Waits 2009; Clevenger and Sawaya 2010;Simmons et al. 2010; see also Chap. 4). Modelling approaches may also beuseful to explore the demographic and genetic consequences of barrier effectsinduced by railways, and to disentangle barrier from mortality effects (Borda-de-Água et al. 2011, 2014; Ceia-Hasse et al. 2017).
• Fourth, we need to know if and how mortality and barrier effects translate intopopulation effects, which in turn can affect the persistence of vulnerable speciesaround railway corridors (van der Grift 1999; Dorsey et al. 2015). This might beachieved through population modelling approaches similar to those already usedin road ecology (Taylor and Goldingay 2009; van der Ree et al. 2009; Borda-de-Água et al. 2014; Ceia-Hasse et al. in review). The development of these modelsrequire careful field studies whereby critical information on fecundity, survivaland dispersal are estimated, which can then be used to estimate the conditionsunder which population viability may be affected by railways. Due considera-tion should also be given to age- and sex-specific demographic parameters, ashuge variation in population responses may occur if mortality affects primarilynon-breeding versus breeding individuals, or males versus females. Molecularmethods may also contribute to understand population responses to railways,either by helping to estimate population parameters, or to evaluate changes ineffective population sizes in relation to mortality and fragmentation effects(Balkenhol and Waits 2009).
• Fifth, we need studies on railway ecology focusing on a wide range of species,which should be representative of life history and behavioural traits potentiallyaffecting vulnerability to railways. To date, most research has focused on spe-cies with high socio-economic profile, like large charismatic mammals, or onthose with limited mobility, like herptiles (van der Grift 1999; Dorsey et al.2015). Broadening the scope of research is important, because mitigationmeasures designed for some species may be inappropriate for others, thusrequiring informed adjustment based on scientifically sound information(Clevenger and Waltho 2005; Morelli et al. 2014; Vandevelde et al. 2014;Wiacek et al. 2015; see Chap. 16). To forecast impacts on species with differ-ential traits, pilot field studies and a systematic review of the available evidenceshould be carried out to investigate what are the key ecological traits, such asdispersal ability or generation time, affecting population responses to railways.
• Finally, there are a number of important issues that remain poorly explored,despite their potential importance to the environmentally-sound management ofrailways. For instance, little is known about the consequences of vibration andnoise on biodiversity living adjacent to the railway bed (see Chap.6). Also,studies are needed on the relative cost-effectiveness of different management
19 What’s Next? Railway Ecology in the 21st Century 315

tools and mitigation measures to help reconcile environmental protection andsocio-economic demands (see, e.g., Andreassen et al. 2005; Ford et al. 2009;Mateus et al. 2011). The potential positive impacts of railways also need to bebetter explored, including in particular the prospective for the right-of-way to actas a shelter for biodiversity (see Chap. 16), which can probably be improvedthrough well-designed wildlife-friendly management procedures.
Final Remarks
Overall, our book documents the wealth of research that is already available on theecology of railways, particularly on the evaluation and mitigation of impacts onwildlife, illustrating the considerable progress that has been made over the pastdecade. However, it also shows that many aspects of railway ecology remain poorlyresearched, which makes it difficult to understand what are the main impacts ofrailways on important dimensions of biodiversity such as landscape connectivityand population viability. As a consequence, the evaluation and mitigation of rail-way impacts continue to be largely driven by the lessons gained from road ecology,which may often be inadequate for application in the railway context. By reviewingthe state-of-the-art and presenting a diversity of valuable case studies, we hope thatthis book can contribute to attract both researchers and practitioners to this inter-esting field of applied science, thereby promoting the development of new tools andapplications for a better integration of the transportation networks with the chal-lenges associated with the protection of biodiversity.
References
Andreassen, H. P., Gundersen, H., & Storaasthe, T. (2005). The effect of scent-marking, forestclearing and supplemental feeding on moose-train collisions. Journal of Wildlife Management,69, 1125–1132.
Balkenhol, N., & Waits, L. P. (2009). Molecular road ecology: Exploring the potential of geneticsfor investigating transportation impacts on wildlife. Molecular Ecology, 18, 4151–4164.
Baofa, Y., Huyin, H., Yili, Z., Le, Z., & Wanhong, W. (2006). Influence of the Qinghai-Tibetanrailway and highway on the activities of wild animals. Acta Ecologica Sinica, 26, 3917–3923.
Barrientos, R., Martins, R. C., Ascensao, F., D’Amico, M., Moreira, F., & Pereira, H. M., et al. (inreview) Searcher efficiency and carcass persistence in field experiments: meta-analysis withmanagement guidelines.
Borda-de-Água, L., Grilo, C., & Pereira, H. M. (2014). Modeling the impact of road mortalityon barn owl (Tyto alba) populations using age-structured models. Ecological Modelling, 276,29–37.
Borda-de-Água, L., Navarro, L., Gavinhos, C., & Pereira, H. M. (2011). Spatio-temporal impactsof roads on the persistence of populations: Analytic and numerical approaches. LandscapeEcology, 26, 253–265.
316 R. Barrientos et al.

Ceia-Hasse, A., Borda-de-Água, L., Grilo, C., & Pereira, H. M. (2017). Global exposure ofcarnivores to roads. Global Ecology and Biogeography, 26, 592–600.
Ceia-Hasse, A., Navarro, L., Borda-de-Água, L., & Pereira, H. M. (in review) Populationpersistence in fragmented landscapes: Disentangling isolation, mortality, and the effect ofdispersal.
Clevenger, A. P., & Sawaya, M. A. (2010). Piloting a non-invasive genetic sampling method forevaluating population-level benefits of wildlife crossing structures. Ecology and Society, 15, 7.
Clevenger, A. P., & Waltho, N. (2005). Performance indices to identify attributes of highwaycrossing structures facilitating movement of large mammals. Biological Conservation, 121,453–464.
Corlatti, L., Hackländer, K., & Frey-Roos, F. (2009). Ability of wildlife overpasses to provideconnectivity and prevent genetic isolation. Conservation Biology, 23, 548–556.
Dorsey, B., Olsson, M., & Rew, L. J. (2015). Ecological effects of railways on wildlife. In R. vander Ree, D. J. Smith, & C. Grilo (Eds.), Handbook of road ecology (pp. 219–227). WestSussex: Wiley.
Dulac, J. (2013). Global land transport infrastructure requirements: Estimating road and railwayinfrastructure capacity and costs to 2050. Paris: International Energy Agency. Available athttps://www.iea.org/publications/freepublications/publication/TransportInfrastructureInsights_FINAL_WEB.pdf
Ferster, A. C. (2006). Rails-to-trails conversions: A review of legal issues. Planning andEnvironmental Law, 58, 3–9.
Ford, A. T., Clevenger, A. P., & Bennett, A. (2009). Comparison of methods of monitoringwildlife crossing-structures on highways. Journal of Wildlife Management, 73, 1213–1222.
Foster, J. (2010). Off track, in nature: Constructing ecology on old rail lines in Paris and NewYork. Nature and Culture, 5, 316–337.
Mateus, A. R. A., Grilo, C., & Santos-Reis, M. (2011). Surveying drainage culvert use bycarnivores: Sampling design and cost–benefit analyzes of track-pads vs. video-surveillancemethods. Environmental Monitoring and Assessment, 181, 101–109.
Matthews, C. H., & Brueggemann, R. (2015). Innovation and entrepreneurship: A competencyframework. New York: Routledge.
Morelli, F., Beim, M., Jerzak, L., Jones, D., & Tryjanowski, P. (2014). Can roads, railways andrelated structures have positive effects on birds? A review. Transportation Research Part D,30, 21–31.
Najafi, F. T., & Nassar, F. E. (1996). Comparison of high-speed rail and maglev systems. Journalof Transportation Engineering, 122, 276–281.
Profillidis, V. A. (2014). Railway management and engineering. Burlington: Ashgate PublishingLtd.
Riley, S. P. D., Pollinger, J. P., Sauvajot, R. M., York, E. C., Bromley, C., Fuller, T. K., et al.(2006). A southern California freeway is a physical and social barrier to gene flow incarnivores. Molecular Ecology, 15, 1733–1741.
Sarmento, J. (2002). The geography of “disused” railways: What is happening in Portugal?Finisterra, 37, 55–71.
Simmons, J. M., Sunnucks, P., Taylor, A. C., & van der Ree, R. (2010). Beyond roadkill,radiotracking, recapture and FST—A review of some genetic methods to improveunderstanding of the influence of roads on wildlife. Ecology and Society, 15, 9.
Smith, R. A. (1998). Global environmental challenges and railway transport. Japan Railway andTransport Review, 18, 4–11.
Smith, R. A. (2003). Railways: How they may contribute to a sustainable future. Proceedings ofthe Institution of Mechanical Engineers, Part F: Journal of Rail and Rapid Transit, 217, 243–248.
Soanes, K., Lobo, M. C., Vesk, P. A., McCarthy, M. A., Moore, J. L., & van der Ree, R. (2013).Movement re-established but not restored: Inferring the effectiveness of road-crossingmitigation for a gliding mammal by monitoring use. Biological Conservation, 159, 434–441.
19 What’s Next? Railway Ecology in the 21st Century 317

Taylor, B. D., & Goldingay, R. L. (2009). Can road-crossing structures improve populationviability of an urban gliding mammal? Ecology and Society, 14, 13.
van der Grift, E. A. (1999). Mammals and railroads: Impacts and management implications. Lutra,42, 77–98.
van der Ree, R., Heinze, D., McCarthy, M., & Mansergh, I. (2009). Wildlife tunnel enhancespopulation viability. Ecology and Society, 14, 7.
Vandevelde, J.-C., Bouhours, A., Julien, J.-F., Couvet, D., & Kerbiriou, C. (2014). Activity ofEuropean common bats along railway verges. Ecological Engineering, 64, 49–56.
Wiącek, J., Polak, M., Filipiuk, M., Kucharczyk, M., & Bohatkiewicz, J. (2015). Do birds avoidrailroads as has been found for roads? Environmental Management, 56, 643–652.
Yang, Q., & Xia, L. (2008). Tibetan wildlife is getting used to the railway. Nature, 452, 810–811.
Open Access This chapter is licensed under the terms of the Creative Commons Attribution 4.0International License (http://creativecommons.org/licenses/by/4.0/), which permits use, sharing,adaptation, distribution and reproduction in any medium or format, as long as you give appropriatecredit to the original author(s) and the source, provide a link to the Creative Commons license andindicate if changes were made.The images or other third party material in this chapter are included in the chapter’s Creative
Commons license, unless indicated otherwise in a credit line to the material. If material is notincluded in the chapter’s Creative Commons license and your intended use is not permitted bystatutory regulation or exceeds the permitted use, you will need to obtain permission directly fromthe copyright holder.
318 R. Barrientos et al.

Glossary
Barrier effect The combined effects of physical barriers, infrastructure avoidance,traffic mortality and habitat loss which together reduce the railway permeability.
Carcass The corpse of a dead animal (or its remains) that is used inmonitoring studiesto evaluate mortality rates caused by trains (and other vehicles) collisions.
Carcass persistence time The time each animal carcass remains on the railway (orroad) before it disappears, either due to scavengers or to decomposing.
Connectivity The degree to which the landscape facilitates or impedes movementof wildlife among resource patches. From a species’ point of view, it is theability of individuals to disperse through the matrix (e.g., unsuitable habitat).
dB A decibel (dB) is a unit of sound pressure. It is defined as 20 log10(P/Pref),where Pref is a value of reference, typically, 20 micropascals in the air.
dB(A) A-weighted decibels. The A-weighting systems attempts to correct to theway the human ear perceives loundness.
Habitat fragmentation The division of contiguous tracts of suitable habitat intoprogressively smaller patches.
Introduction The deliberate or accidental release of an organism(s) into thewild by human agency.
Mortality hotspot Segments of railways (or roads) with higher concentration orincreased probability of wildlife mortality.
Native or indigenous A species that occurs naturally in an area, i.e. whose dis-persal has occurred independently of human-mediated transportation. In general,a species thought to have occurred in an area since before the Neolithic isconsidered to be native.
Naturalised A non-native species that, following introduction, hasformed self-sustaining populations in the wild.
‘Non-native’ or ‘alien’ A species that occurs outside its native geographical rangeas a result of human-mediated transportation.
© The Editor(s) (if applicable) and The Author(s) 2017L. Borda-de-Água et al. (eds.), Railway Ecology,DOI 10.1007/978-3-319-57496-7
319

Permeability Describes the degree in which a railway allows wildlife to movefreely across it.
Probability of detection Probability of a carcass being present on a railway (orroad) being detected by an observer.
Probability of removal Probability of a carcass being removed (or consumed)from the railway, usually by scavengers.
Propagule pressure A measure of the number of individuals introduced and thenumber of introduction events that took place. Generally, the higher propagulepressure is, the higher the likelihood of establishment will be.
Wildlife pass/passage Designated place for wildlife to safely cross the railway.
© The Editor(s) (if applicable) and The Author(s) 2017. This book is an open access publicationOpen Access This book is licensed under the terms of the Creative Commons Attribution 4.0International License (http://creativecommons.org/licenses/by/4.0/), which permits use, sharing,adaptation, distribution and reproduction in any medium or format, as long as you give appropriatecredit to the original author(s) and the source, provide a link to the Creative Commons license andindicate if changes were made.The images or other third party material in this book are included in the chapter’s Creative
Commons license, unless indicated otherwise in a credit line to the material. If material is notincluded in the chapter’s Creative Commons license and your intended use is not permitted bystatutory regulation or exceeds the permitted use, you will need to obtain permission directly fromthe copyright holder.
320 Glossary