Rafael Cezar Menezes and N´elio Domingues Pizzolato2* · Rafael Cezar Menezes1 and N´elio...
17
Pesquisa Operacional (2014) 34(2): 301-317 © 2014 Brazilian Operations Research Society Printed version ISSN 0101-7438 / Online version ISSN 1678-5142 www.scielo.br/pope doi: 10.1590/0101-7438.2014.034.02.0301 LOCATING PUBLIC SCHOOLS IN FAST EXPANDING AREAS: APPLICATION OF THE CAPACITATED p-MEDIAN AND MAXIMAL COVERING LOCATION MODELS Rafael Cezar Menezes 1 and N´ elio Domingues Pizzolato 2* Received April 20, 2012 / Accepted January 25, 2014 ABSTRACT. The area of Guaratiba, in Rio de Janeiro, presents extraordinary population growth rates that exceed all other districts of the city. Moreover, the public investments underway, in view of the 2106 Olympic Games, are making the region even more attractive. Therefore, it is appropriate to suggest proac- tive measures to avoid the predicted collapse of several public systems among them the education system. This paper considers the projected population for the years 2015 and 2020 and, using various computing resources, specially the ArcGIS Network Analyst tool for measuring traveled distances, proposes locating new facilities with the Capacitated p-Median Model and with the Maximum Covering Location Problem, considering an ideal maximal home-school distance of 1,500 meters, but also evaluating longer distances. Both problems have been solved with AIMMS. The consideration of both models provides a constructive insight that certainly improves the implemented solution and favors the local community. Keywords: school location, capacitated p-median model, maximal covering location problem. 1 INTRODUCTION The depletion of urban areas in the municipality of Rio de Janeiro, circumscribed by wetlands, mountains and sea, has led to the occupation of hills and slopes, the migration to distant sub- urbs, and the formation of slums. It should be noted that historically the strong socio-economic inequalities in the country have forced large segments of the population to search for inventive forms of struggle for survival, among them the construction of houses in areas illegally occu- pied, both public and private. In the case of the periphery, as well as in the metropolitan areas, this phenomenon has occurred without proper urbanization and infrastructure planning, includ- ing sanitation, transportation systems, health, and education. In the case of education, typically deficient when offered to the poorest populations living in distant areas, the school teachers, who come from other social groups and are not local residents, tend to find it isolated, unattractive, *Corresponding author 1 Researcher, Pontifical Catholic University of Rio de Janeiro – PUC-Rio, RJ, Brazil. E-mail: [email protected] 2 Associate Professor, Pontifical Catholic University of Rio de Janeiro – PUC-Rio, RJ, Brazil. E-mail: [email protected]
Transcript of Rafael Cezar Menezes and N´elio Domingues Pizzolato2* · Rafael Cezar Menezes1 and N´elio...
�
�
“main” — 2014/7/14 — 13:55 — page 301 — #1�
�
�
�
�
�
Pesquisa Operacional (2014) 34(2): 301-317© 2014 Brazilian Operations Research SocietyPrinted version ISSN 0101-7438 / Online version ISSN 1678-5142www.scielo.br/popedoi: 10.1590/0101-7438.2014.034.02.0301
LOCATING PUBLIC SCHOOLS IN FAST EXPANDING AREAS:APPLICATION OF THE CAPACITATED p-MEDIAN AND MAXIMAL
COVERING LOCATION MODELS
Rafael Cezar Menezes1 and Nelio Domingues Pizzolato2*
Received April 20, 2012 / Accepted January 25, 2014
ABSTRACT. The area of Guaratiba, in Rio de Janeiro, presents extraordinary population growth rates
that exceed all other districts of the city. Moreover, the public investments underway, in view of the 2106
Olympic Games, are making the region even more attractive. Therefore, it is appropriate to suggest proac-
tive measures to avoid the predicted collapse of several public systems among them the education system.
This paper considers the projected population for the years 2015 and 2020 and, using various computing
resources, specially the ArcGIS Network Analyst tool for measuring traveled distances, proposes locating
new facilities with the Capacitated p-Median Model and with the Maximum Covering Location Problem,
considering an ideal maximal home-school distance of 1,500 meters, but also evaluating longer distances.
Both problems have been solved with AIMMS. The consideration of both models provides a constructive
insight that certainly improves the implemented solution and favors the local community.
Keywords: school location, capacitated p-median model, maximal covering location problem.
1 INTRODUCTION
The depletion of urban areas in the municipality of Rio de Janeiro, circumscribed by wetlands,
mountains and sea, has led to the occupation of hills and slopes, the migration to distant sub-urbs, and the formation of slums. It should be noted that historically the strong socio-economicinequalities in the country have forced large segments of the population to search for inventive
forms of struggle for survival, among them the construction of houses in areas illegally occu-pied, both public and private. In the case of the periphery, as well as in the metropolitan areas,this phenomenon has occurred without proper urbanization and infrastructure planning, includ-
ing sanitation, transportation systems, health, and education. In the case of education, typicallydeficient when offered to the poorest populations living in distant areas, the school teachers, whocome from other social groups and are not local residents, tend to find it isolated, unattractive,
*Corresponding author1Researcher, Pontifical Catholic University of Rio de Janeiro – PUC-Rio, RJ, Brazil. E-mail: [email protected] Professor, Pontifical Catholic University of Rio de Janeiro – PUC-Rio, RJ, Brazil. E-mail: [email protected]
�
�
“main” — 2014/7/14 — 13:55 — page 302 — #2�
�
�
�
�
�
302 APPLICATION OF THE CAPACITATED P-MEDIAN AND MAXIMAL COVERING LOCATION MODELS
and less motivating. Certainly, the recent country’s economic rise, and its goal to satisfy various
international standards, especially regarding sanitation, health, and education, has motivated thegovernment to invest in the most needy populations. On the other hand, along the last decade,almost if not all socially marginalized segments have made significant progress in economical
and social participation and have, therefore, expanded their expectations for social integration.
The Guaratiba Administrative Region lies on the outskirts of the city of Rio de Janeiro andwas the one that proportionally showed the largest population growth in the entire city. In year2000 this region had 66.53% more people than in the previous 1991 Census, while the city
as a whole grew about 6.88% over the same decade. The yearly values along the last 9 yearshave been about 5.83% for the Region and .74% for the entire city. This fact implies a hugechallenge for the planning of public services such as schools, hospitals, garbage collection, water
supply, waste water treatment, and so on, in order to effectively meet the needs of this growingpopulation. It is estimated that the quickness of the settlement process will be maintained or evenincrease, given the widespread availability of public land in the area and the ongoing investments
in transportation that will substantially benefit the region in view of the 2016 Olympic Games.
The referred area is currently under highly accelerated occupation as a result of the intense pop-ulation growth process noted on the large West Zone of Rio de Janeiro. The territory is beingdeveloped over a marshy area that is suffering landfills and unplanned occupation which, sooner
or later, however, shall receive satisfactory public services. This fast occupation stems from acombination of reasons. On the one hand, the varied factors that have propelled the developmenton the West Zone, such as industrial areas, business activities, expansion of the urban occupation,intense offer of services, have reflected all around and have attracted unskilled man power from
all quarters of the country. On another hand, unoccupied land in Guaratiba, is mostly property ofthe federal government, but the usual public policy is to tolerate illegal occupation, if no signifi-cant threat to the environment is perceived. Since this is the case, and housing for large segments
of low income workers is at stake, these settlements are being progressively incorporated to thecity. Finally, the current public investment plans on infrastructure and transportation, designed tosatisfy the agreements for the 2016 Games, have determined the construction of a new Bus Rapid
Transit (BRT) line that passes through the area and this is stimulating an even faster occupation.
The present settlement process has resulted in six nucleus or, more properly, six independentareas of occupation, connected by long sinuous roads, and served by a poor transportation sys-tem. At different paces, each one of these nucleus is continuously receiving new settlers and
facing a dramatic expansion. As a consequence, any study in the area shall be composed by sixsimilar studies applying similar methodologies. Given these evidences it is appropriate to suggestproactive measures to avoid the predictable collapse of the basic education system.
Using both the Capacitated p-Median Problem (CPMP) and the Maximal Covering Location
Problem (MCLP), the objective of this work is to contribute to the planning of the public schoolnetwork in this region, considering the forecast of strong population growth for years 2015 and2020 as released by the IBGE Census Bureau (Brazilian Institute of Geography and Statistics).
The former model seeks to minimize distances traveled by the students, taking into account
Pesquisa Operacional, Vol. 34(2), 2014
�
�
“main” — 2014/7/14 — 13:55 — page 303 — #3�
�
�
�
�
�
RAFAEL MENEZES and NELIO DOMINGUES PIZZOLATO 303
the capacity of schools, which are being set to 1,300 students according to the recent policy of
constructing standard sized schools. In the latter model the objective is to locate new schoolsseeking to maximize the number of students covered by the school network, according to a max-imum given distance along the road network. The maximum distance would ideally be 1,500
meters but longer distances have been considered since they might be eventually required, un-less many more schools are constructed. Precise distance measurements might be done with theArcGis Network Analyst, a tool belonging to the family of Geographic Information Systems
(GIS). Both models are subsequently solved with the Advanced Interactive MultidimensionalModeling System (AIMMS).
Thanks to the geographic tools included in the study, the ArcView Network Analyst in particular,the definition of school coverage areas is defined. The reach of each school might preferably
be 1,500 meters, but could have different values, such as 1,000, 2,000 or 3,000 meters aroundeach school, measured along the local road network, adjusted to any existing barrier or alternatepaths. Certainly, long distances between a student and its school are not desirable but might be
required. The mentioned ArcGis Network Analyst tool allows identifying the demand for eachschool within each distance level, warranting the suggestion to build new schools such as toreduce distances for all students to satisfactory levels.
Although both studies are concerned with the location problem, they have complementary fea-
tures, and the corresponding data set vary according to the model applied. For the CPMP theyrepresent the distance traveled by the student to the nearest school, while for the MCLP theyindicate the school reach or distances measured from each school. In other words, the CPMPlocates schools in order to minimize the sum of the distances traveled by all students but respect-
ing the design capacity of 1,300 students, and the MCLP locates schools in order to maximizethe number of students covered within a given distance. We understand that both models providecomplementary information to be used in the planning process. Certainly, from the students or
their families’ point of view the actual selection process is more complex because it involves notonly quantitative but also qualitative issues. However, if all schools have similar characteristicssuch as quality of the building, comfort, satisfactory school meals, experienced teachers, and so
on, there will be no reason for the student to prefer a more distant school, since no bus serviceis provided. This study will also argue that as the CPMP model is successively applied for agrowing number of schools the capacitated model will approach the MCLP solution.
Both studies have a normative character, since the city administration is the only supplier of
education in the area, contrasting with most of other cities in the country in which private schoolsaccount for a significant part of the demand, typically one third. The reason is that the privateschools are directed to specific social segments normally with higher income levels, but the
average income observed in the area is presently a deterrent to private services.
This work is divided as follows: Section 2 makes a literature review on the location of schoolsand other public facilities; Section 3 briefly describes some functions of the ArcGis NetworkAnalyst system. Section 4 introduces the mathematical formulation of both CPMP and MCLP
models. Section 5 discusses the methodology employed, assessing the current distribution of
Pesquisa Operacional, Vol. 34(2), 2014
�
�
“main” — 2014/7/14 — 13:55 — page 304 — #4�
�
�
�
�
�
304 APPLICATION OF THE CAPACITATED P-MEDIAN AND MAXIMAL COVERING LOCATION MODELS
Municipal Schools and proposing the location of new school facilities with respect to both mod-
els, given the demographic projections and the various options of maximum distance. Section 6evaluates the conclusions and the contributions of the study.
2 LITERATURE REVIEW
The use of models to locate facilities supported by Geographic Information Systems (GIS) hasbecome a powerful tool for the decision making process. The GIS graphical user interface as-sociated with geo-referenced databases enables the public manager to prepare the location plan-ning of the community facilities through the spatial analysis of a given area, taking into accountthe street configuration, geographical and topological barriers, as well as the distribution of thepopulation by age, family income, family size, available areas, socioeconomic aspects, and even-tual restrictions.
Regarding the location of public schools, an early and celebrated paper was published by Tewari& Jena (1987). Using the tools available at the time, these authors study the high-school locationproblem in a large geographical district in India with two cities, hundreds of villages, morethan 1.5 million inhabitants and propose the location of high schools considering, among othersfeatures, some peculiar questions such as the language spoken in each school and the maximumdistance of 8 km for a student to reach a high school. This work was followed by many otherssuch as Viegas (1987), Molinero (1988), Beguin et al. (1989), Pizzolato & Silva (1997), Barceloset al. (2004), Teixeira & Antunes (2008), and so on.
In a recent study, White et al. (2010) review the use of optimization techniques in locating fa-cilities in developing countries, highlighting a number of studies specially related to health andeducation. According to them, Rahman & Smith (2000) provide a review of locational analysisfor healthcare planning in developing countries; Galvao et al. (2002) apply locational techniquesto optimize maternal and perinatal healthcare services in Rio; Pizzolato et al. (2004) considerthe location of public schools in urban areas; Yasenovsky and Hogdon (2007) apply locationalanalysis to healthcare provision in the rural area of Suhum, Ghana; as well as Smith et al. (2009)that deal with a similar healthcare problem for rural regions of India. Another recent reviewon location challenges mostly based on the p-median model and extensions may be found inPizzolato et al. (2012), as well as a hierarchical study on hierarchical location mostly directed tohealth services, may be found in Smith et al. (2013).
Considering the accessibility to schools through the maximal and ideal student-school distance,Brau et al. (1980), certainly influenced by European standards, suggest some ideal distances,which are not discrepant to those applied to urban areas in Brazil. These certainly differ sub-stantially from the distances established by Tewari and Jena and employed in rural India, sincea high school student in a rural area has larger walking autonomy than a young student in anurban setting. For childhood and elementary education, Brau et al. classify a distance of 500meters between home and school as excellent accessibility, between 500 and 1,000 meters, asgood accessibility, between 1,000 and 1,500 meters, regular accessibility, between 1,500 and2,000 meters, low accessibility, and distances above 2,000 meters were classified as poor acces-sibility. The present study may face the maximum distance as a variable to be adjusted accordingto managerial preferences.
Pesquisa Operacional, Vol. 34(2), 2014
�
�
“main” — 2014/7/14 — 13:55 — page 305 — #5�
�
�
�
�
�
RAFAEL MENEZES and NELIO DOMINGUES PIZZOLATO 305
3 GEOGRAPHIC INFORMATION SYSTEM – ArcGIS NETWORK ANALYST
ArcGIS is the name of a family of software produced by the ESRI Company. ArcGIS includes:ArcReader, which views maps created with other ArcGIS products such as ArcView for thevisualization of spatial data, creation of maps and basic performance of spatial analysis; andArcEditor, which includes all the functionality of ArcView and even more advanced tools formanipulating shapefiles and geodatabases. ArcInfo, the most advanced version of ArcGIS, in-cludes additional capabilities for data manipulation, edition and analysis.
ArcGIS Network Analyst is an ArcGIS extension that allows performing a spatial analysis ofthe network, including routing between nodes, location and allocation of facilities, and definitionof service area, among others. One of the major advances of the tool is the possibility of usingthe actual condition of the road network such as direction, speed limits, and blocks of any kind.Regarding the school location problem, this tool allows the practical consideration of distancesalong the road network, not only the minimum distances to use in the CPMP problem, but alsothe maximum distances to use in the MCLP problem. In this latter problem, the covering distanceindicates the desired accessibility and may be exploited in a sort of sensitivity evaluation of theproposal for varying values of the distance.
The ArcGIS Network Analyst allows the generation of a series of polygons representing thedistance that can be reached by a facility in relation to a maximal distance or time limits, usingthe road network of the study area. The polygons around each school are known as coveragearea. Thus, it is possible to know the number of potential users who are within the pre-establishedcoverage area, and the facilities that should be relocated to better serve them. This study usedthis tool to generate a series of tables containing the distance across the road network between asource vertex and several destination vertices, comprising the OD distance matrix. Due to spacelimitations, just one of the six areas, namely the Assessment Region 5, will be reported since thisappears to be the most critical area of the region and representative of the entire study. In anycase, the results for all Regions are available with the authors.
4 CAPACITATED p-MEDIAN PROBLEM MODEL (CPMP)
Given a network G(V,A) consisting of a set V of vertices and a set A of arcs, the objective ofthe p-median problem is to locate p facilities in order to minimize the sum of weighted distancesfrom each vertex to the nearest facility. The Capacitated p-Median Problem (CPMP) correspondsto cases where, for each facility j , there is a maximum capacity. The CPMP formulation derivesfrom the p-median model (Current et al., 2002):
Min Z =∑
i∈N
∑
j∈N
widi j xi j (1)
Subject to∑
j∈N
xi j = 1, i ∈ N (2)
∑
j∈N
x j j = p (3)
Pesquisa Operacional, Vol. 34(2), 2014
�
�
“main” — 2014/7/14 — 13:55 — page 306 — #6�
�
�
�
�
�
306 APPLICATION OF THE CAPACITATED P-MEDIAN AND MAXIMAL COVERING LOCATION MODELS
∑
i∈N
wi xi j ≤ Q j x j j , j ∈ N (4)
xi j ∈ {0, 1}, i, j ∈ N . (5)
where:N = {1, 2, . . . , n}: set of demand points;N = {1, 2, . . . , n}: set of possible locations;wi : weight at point or vertex i;p: number of facilities to be located;di j = shortest distance from vertex i to vertex j ;xi j = 1, if demand point i is served by facility located at vertex j ; 0 otherwise;x j j = 1, if a facility is located at vertex j ; 0 otherwise.
The objective function (1) consists of minimizing weighted distances from each vertex to thenearest median; the constraint (2) requires that each vertex is allocated to a single vertex, which
must be a median; the constraint (3) determines the exact number p of medians to be located;and the constraint (5) specifies the integrality conditions. The formulation of the capacitated p-median problem differs from the basic formulation of the p-median problem with respect to the
constraint (4), linking the customer i to facility j , since this case considers the service capacityQ j of facility x j j . The above model assumes, for each centroid, exclusivity with the facility thatwill offer the service, since the variables xi j are binary.
It is important to remark that the feasibility of the solution depends on the correct choice of
the minimum value of the parameter p, since the total capacity offered has to meet the totalpopulation to be attended. The statement is more obvious when the schools have limited andsimilar capacities. In addition, as the number of schools increases, the average distance crossedby each student diminishes, although some of the schools might operate below their capacities.
4.1 Maximal Covering Location Problem (MCLP)
The MCLP consists of choosing locations to build p facilities in order to cover the largest numberof customers or users, since the coverage of a client means that its distance to a facility is less
than a pre-established critical distance (S). The model also identifies the allocations, i.e., in whichfacility each customer would be attended. Therefore, the aim is to maximize the coverage of agiven population in relation to a given set of community facilities, and a given coverage radius,
seeking to ensure that the greatest possible number of users is covered, while any user beyondthe critical distance is no longer covered by this facility. The decision variable is basically theacceptable distance between the location of the service and the one of its customers.
Therefore, in the MCLP, the problem aims to locate p facilities so that there are as many users as
possible within the maximal predefined distance S. In some applications, this critical distance Smight be seen as a convenience parameter, in which smaller values are more desirable. Certainly,the quality of a given set of locations might be measured by the number of students living beyond
Pesquisa Operacional, Vol. 34(2), 2014
�
�
“main” — 2014/7/14 — 13:55 — page 307 — #7�
�
�
�
�
�
RAFAEL MENEZES and NELIO DOMINGUES PIZZOLATO 307
the maximal distance. The formulation was first proposed by Church & ReVelle (1974) and
corresponds to the model:
Max Z =∑
i∈I
wi zi (6)
Subject to∑
j∈Ni
x j − zi ≥ 0, i ∈ I (7)
∑
j∈J
x j = p (8)
x j ∈ {0, 1}, j ∈ J (9)
zi ∈ {0, 1}, i ∈ I. (10)
where:I = {1, 2, . . . , n}: set of demand points;J = 1, 2, . . . , n}: set of possible facilities;
wi : weight at point or vertex i;p: number of facilities to be located;di j = shortest distance from vertex i to vertex j ;
Ni = { j ∈ J |di j ≤ S}, indicates the set J of vertices that cover vertex i, i.e., all vertices j forwhich di j = S where S is the maximal distance;zi = 1, if demand point i is covered; 0 otherwise;
x j = 1, if a facility is located at vertex j ; 0 otherwise.
The objective function (6) maximizes the covered demand within the stated maximal distance;the constraint (7) indicates that a customer will be covered if there is at least one facility locatedwithin the maximal coverage distance S. The constraint (8) limits to exactly p the number of
facilities located and the restrictions (9) and (10) define binary-type decision variables.
Regarding the influence of the parameter p, similar considerations might be done. A small valueof p might leave many students out of any school reach and the demand for the most centralschools extremely high. In contrast, if p is made progressively higher, all students would be
attended but the school occupation would be highly uneven and some would have low demand.
5 METHODOLOGY
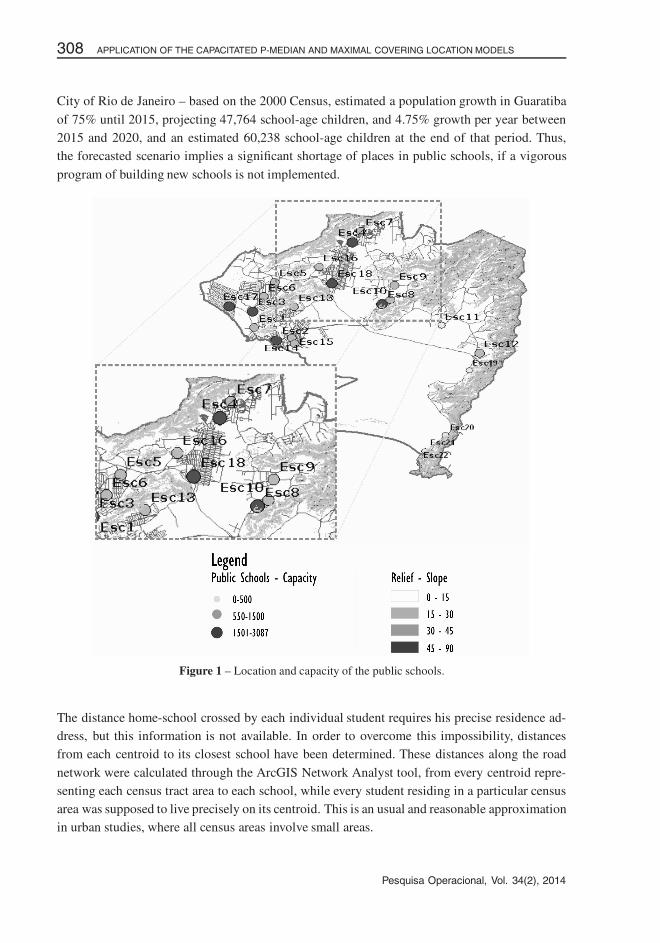
Figure 1 gives an overview of the Guaratiba region, indicating the location of the present 22 basicschools. The capacities are highly different since the capacitated schools is a policy recently im-
plemented. Thus, capacities are known, but only partially reproduced on the forthcoming tablessince this report intends to highlight only part of the district. In this figure, the road network aswell as the present location of each school are represented. The size of each school according to
three different capacity ranges is indicated by gray variations. Interested readers might ask theauthors for a colored version of the figure. At the time of the study, 20,659 students were en-rolled in these schools. The study conducted by the IBGE in 2004 – Demographic Trends in the
Pesquisa Operacional, Vol. 34(2), 2014
�
�
“main” — 2014/7/14 — 13:55 — page 308 — #8�
�
�
�
�
�
308 APPLICATION OF THE CAPACITATED P-MEDIAN AND MAXIMAL COVERING LOCATION MODELS
City of Rio de Janeiro – based on the 2000 Census, estimated a population growth in Guaratiba
of 75% until 2015, projecting 47,764 school-age children, and 4.75% growth per year between2015 and 2020, and an estimated 60,238 school-age children at the end of that period. Thus,the forecasted scenario implies a significant shortage of places in public schools, if a vigorous
program of building new schools is not implemented.
Figure 1 – Location and capacity of the public schools.
The distance home-school crossed by each individual student requires his precise residence ad-dress, but this information is not available. In order to overcome this impossibility, distancesfrom each centroid to its closest school have been determined. These distances along the road
network were calculated through the ArcGIS Network Analyst tool, from every centroid repre-senting each census tract area to each school, while every student residing in a particular censusarea was supposed to live precisely on its centroid. This is an usual and reasonable approximationin urban studies, where all census areas involve small areas.
Pesquisa Operacional, Vol. 34(2), 2014
�
�
“main” — 2014/7/14 — 13:55 — page 309 — #9�
�
�
�
�
�
RAFAEL MENEZES and NELIO DOMINGUES PIZZOLATO 309
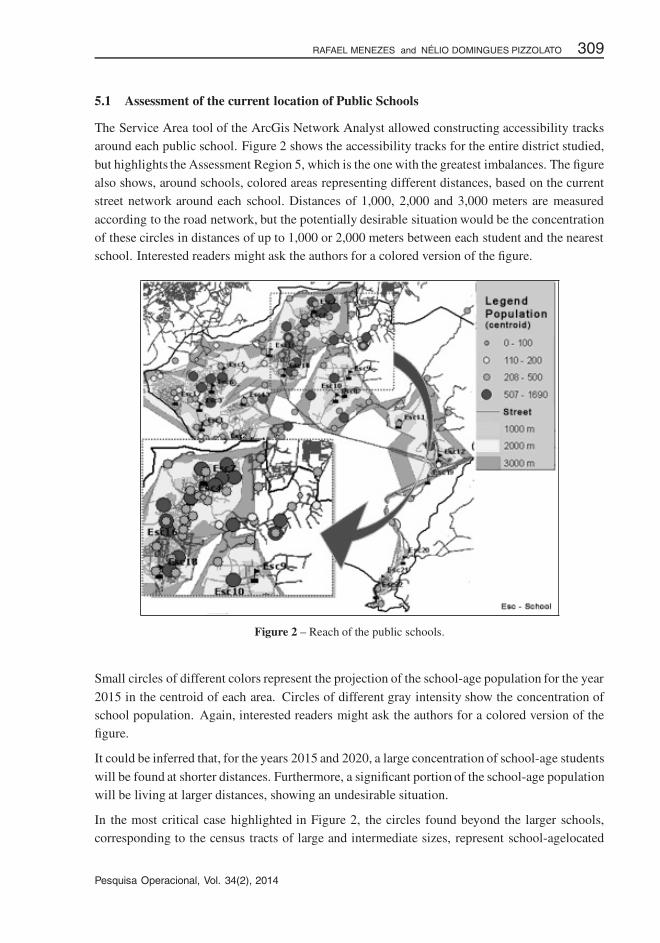
5.1 Assessment of the current location of Public Schools
The Service Area tool of the ArcGis Network Analyst allowed constructing accessibility tracksaround each public school. Figure 2 shows the accessibility tracks for the entire district studied,
but highlights the Assessment Region 5, which is the one with the greatest imbalances. The figurealso shows, around schools, colored areas representing different distances, based on the currentstreet network around each school. Distances of 1,000, 2,000 and 3,000 meters are measured
according to the road network, but the potentially desirable situation would be the concentrationof these circles in distances of up to 1,000 or 2,000 meters between each student and the nearestschool. Interested readers might ask the authors for a colored version of the figure.
Figure 2 – Reach of the public schools.
Small circles of different colors represent the projection of the school-age population for the year
2015 in the centroid of each area. Circles of different gray intensity show the concentration ofschool population. Again, interested readers might ask the authors for a colored version of thefigure.
It could be inferred that, for the years 2015 and 2020, a large concentration of school-age students
will be found at shorter distances. Furthermore, a significant portion of the school-age populationwill be living at larger distances, showing an undesirable situation.
In the most critical case highlighted in Figure 2, the circles found beyond the larger schools,corresponding to the census tracts of large and intermediate sizes, represent school-agelocated
Pesquisa Operacional, Vol. 34(2), 2014
�
�
“main” — 2014/7/14 — 13:55 — page 310 — #10�
�
�
�
�
�
310 APPLICATION OF THE CAPACITATED P-MEDIAN AND MAXIMAL COVERING LOCATION MODELS
more than 3,000 meters away from the nearest public school, featuring an improper situation.
Certainly, the recommended proposal would be the construction of one or more new schools inthe region in order to reduce the large distance to be covered by this part of the population.
It can be seen in the highlighted portion of the larger tracts (from 507 to 1,690 school-age people)or smaller ones (from 208 to 500 school-age people) have a school nearby (up to 1,000 meters)
or as near (1,000 to 2,000 meters) as it is the case of schools 4, 7, 16 and 18, also belonging tothe referred region. In any case, this is a region with insufficient coverage, since a significantportion of students is within the low accessibility zone or even beyond the desirable nearby zone.
5.2 Location of New School Facilities under both Models
The most recent schools that have been built in the municipality of Rio de Janeiro had a stan-dardized service capacity of about 1,300 students. In the CPMP study it is assumed that newschools will be built according to this standard capacity, while pre-existing schools will keep
their original capacities.
The goal of the second model, MCLP, is to determine the location of new facilities in order tomaximize the number of students that might reach one school within a given radius, which isthe maximum distance considered appropriate for the daily home-school travel of each student.
Thus, the capacity of the new facility should be adjusted according to the total population to becovered. In this maximal covering model, population projections for the coming years were cal-culated, and the total capacity of the public school system had to satisfy all demand. Therefore,
for this part of the study, the schools will be supposed uncapacitated.
Although both models appear independent, their joint consideration provides a constructive in-sight for implementing a solution that favors the population of the area, since capacity and dis-tance may be balanced. The potential interrelation of these models are explored in the following
pages.
Both models were solved in the AIMMS software, which features specific functionalities tomodel integer linear programming problems, providing various solvers and allowing the controlof the performance of each. In this study, for its notorious advantages, the CPLEX solver was
used to solve both of them.
5.3 Results obtained with the CPMP
Presently, there are four public schools in Assessment Region 5, namely, Sch4, Sch7, Sch16,
and Sch18, as shown in the highlighted part of Figure 2 and their present combined capacity is5,778 students. Incidentally, as shown in Table 3, if a coverage radius of 1,500 meters is set,only 55% of the school population that lives today in this region would be within this given
range. Since the projected school-age population for 2015 is 19,295, the minimum number ofnew standard schools is 11, but we preferred to use the next integer, 12 schools. For 2020 asimilar computation suggests the construction of three additional schools.
Pesquisa Operacional, Vol. 34(2), 2014
�
�
“main” — 2014/7/14 — 13:55 — page 311 — #11�
�
�
�
�
�
RAFAEL MENEZES and NELIO DOMINGUES PIZZOLATO 311
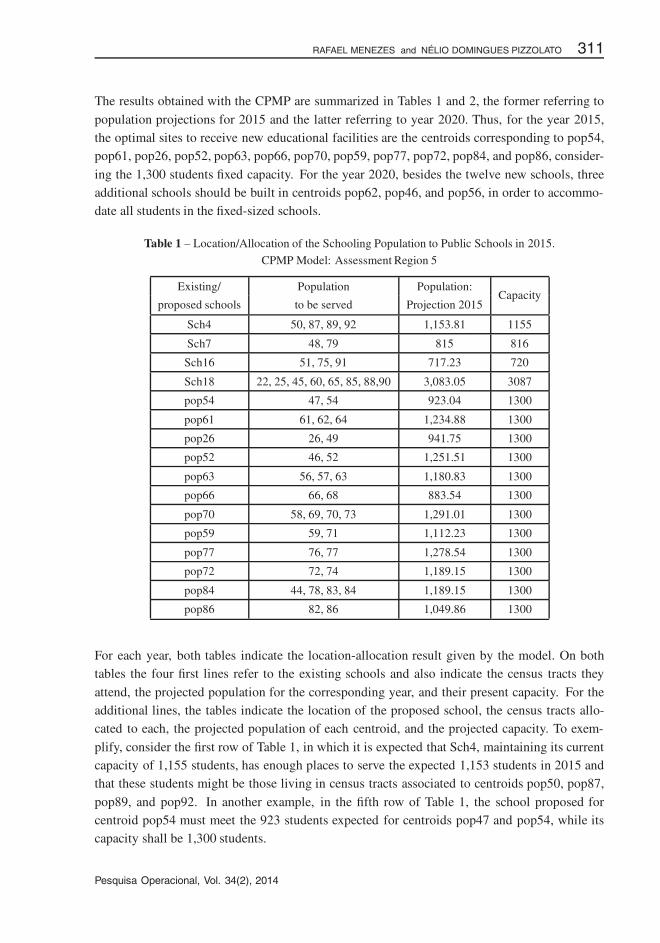
The results obtained with the CPMP are summarized in Tables 1 and 2, the former referring to
population projections for 2015 and the latter referring to year 2020. Thus, for the year 2015,the optimal sites to receive new educational facilities are the centroids corresponding to pop54,pop61, pop26, pop52, pop63, pop66, pop70, pop59, pop77, pop72, pop84, and pop86, consider-
ing the 1,300 students fixed capacity. For the year 2020, besides the twelve new schools, threeadditional schools should be built in centroids pop62, pop46, and pop56, in order to accommo-date all students in the fixed-sized schools.
Table 1 – Location/Allocation of the Schooling Population to Public Schools in 2015.
CPMP Model: Assessment Region 5
Existing/ Population Population:Capacity
proposed schools to be served Projection 2015
Sch4 50, 87, 89, 92 1,153.81 1155
Sch7 48, 79 815 816
Sch16 51, 75, 91 717.23 720
Sch18 22, 25, 45, 60, 65, 85, 88,90 3,083.05 3087
pop54 47, 54 923.04 1300
pop61 61, 62, 64 1,234.88 1300
pop26 26, 49 941.75 1300
pop52 46, 52 1,251.51 1300
pop63 56, 57, 63 1,180.83 1300
pop66 66, 68 883.54 1300
pop70 58, 69, 70, 73 1,291.01 1300
pop59 59, 71 1,112.23 1300
pop77 76, 77 1,278.54 1300
pop72 72, 74 1,189.15 1300
pop84 44, 78, 83, 84 1,189.15 1300
pop86 82, 86 1,049.86 1300
For each year, both tables indicate the location-allocation result given by the model. On bothtables the four first lines refer to the existing schools and also indicate the census tracts they
attend, the projected population for the corresponding year, and their present capacity. For theadditional lines, the tables indicate the location of the proposed school, the census tracts allo-cated to each, the projected population of each centroid, and the projected capacity. To exem-
plify, consider the first row of Table 1, in which it is expected that Sch4, maintaining its currentcapacity of 1,155 students, has enough places to serve the expected 1,153 students in 2015 andthat these students might be those living in census tracts associated to centroids pop50, pop87,
pop89, and pop92. In another example, in the fifth row of Table 1, the school proposed forcentroid pop54 must meet the 923 students expected for centroids pop47 and pop54, while itscapacity shall be 1,300 students.
Pesquisa Operacional, Vol. 34(2), 2014
�
�
“main” — 2014/7/14 — 13:55 — page 312 — #12�
�
�
�
�
�
312 APPLICATION OF THE CAPACITATED P-MEDIAN AND MAXIMAL COVERING LOCATION MODELS
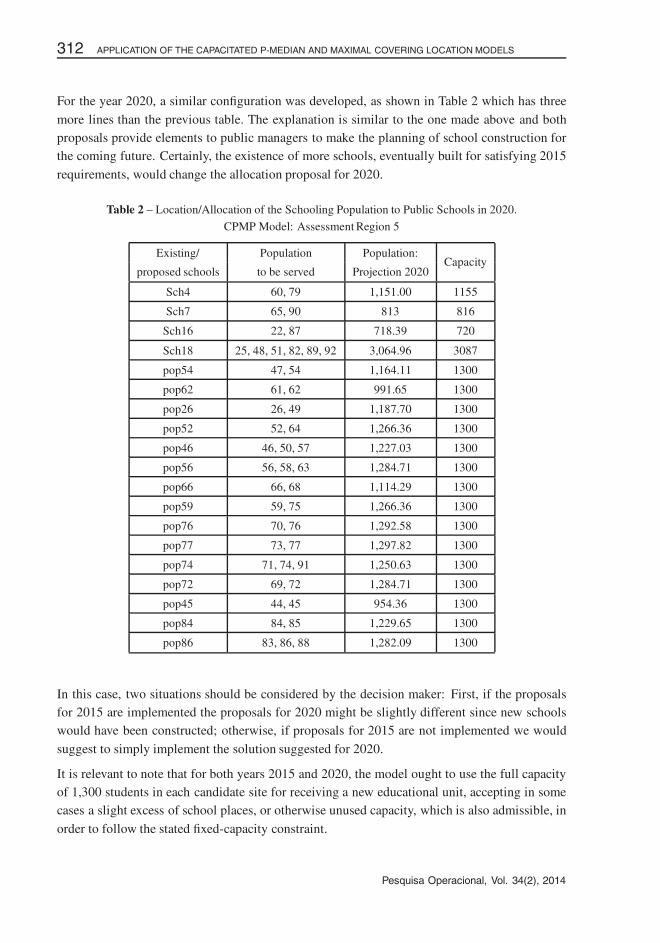
For the year 2020, a similar configuration was developed, as shown in Table 2 which has three
more lines than the previous table. The explanation is similar to the one made above and bothproposals provide elements to public managers to make the planning of school construction forthe coming future. Certainly, the existence of more schools, eventually built for satisfying 2015
requirements, would change the allocation proposal for 2020.
Table 2 – Location/Allocation of the Schooling Population to Public Schools in 2020.
CPMP Model: Assessment Region 5
Existing/ Population Population:Capacity
proposed schools to be served Projection 2020
Sch4 60, 79 1,151.00 1155
Sch7 65, 90 813 816
Sch16 22, 87 718.39 720
Sch18 25, 48, 51, 82, 89, 92 3,064.96 3087
pop54 47, 54 1,164.11 1300
pop62 61, 62 991.65 1300
pop26 26, 49 1,187.70 1300
pop52 52, 64 1,266.36 1300
pop46 46, 50, 57 1,227.03 1300
pop56 56, 58, 63 1,284.71 1300
pop66 66, 68 1,114.29 1300
pop59 59, 75 1,266.36 1300
pop76 70, 76 1,292.58 1300
pop77 73, 77 1,297.82 1300
pop74 71, 74, 91 1,250.63 1300
pop72 69, 72 1,284.71 1300
pop45 44, 45 954.36 1300
pop84 84, 85 1,229.65 1300
pop86 83, 86, 88 1,282.09 1300
In this case, two situations should be considered by the decision maker: First, if the proposalsfor 2015 are implemented the proposals for 2020 might be slightly different since new schoolswould have been constructed; otherwise, if proposals for 2015 are not implemented we would
suggest to simply implement the solution suggested for 2020.
It is relevant to note that for both years 2015 and 2020, the model ought to use the full capacityof 1,300 students in each candidate site for receiving a new educational unit, accepting in somecases a slight excess of school places, or otherwise unused capacity, which is also admissible, in
order to follow the stated fixed-capacity constraint.
Pesquisa Operacional, Vol. 34(2), 2014
�
�
“main” — 2014/7/14 — 13:55 — page 313 — #13�
�
�
�
�
�
RAFAEL MENEZES and NELIO DOMINGUES PIZZOLATO 313
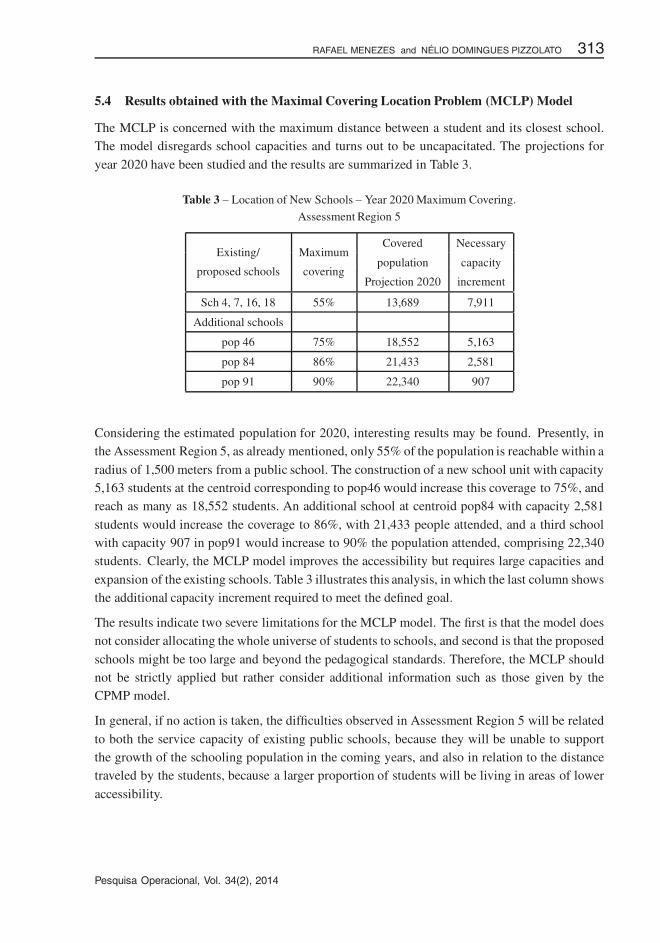
5.4 Results obtained with the Maximal Covering Location Problem (MCLP) Model
The MCLP is concerned with the maximum distance between a student and its closest school.The model disregards school capacities and turns out to be uncapacitated. The projections for
year 2020 have been studied and the results are summarized in Table 3.
Table 3 – Location of New Schools – Year 2020 Maximum Covering.
Assessment Region 5
Existing/ MaximumCovered Necessary
proposed schools coveringpopulation capacity
Projection 2020 increment
Sch 4, 7, 16, 18 55% 13,689 7,911
Additional schools
pop 46 75% 18,552 5,163
pop 84 86% 21,433 2,581
pop 91 90% 22,340 907
Considering the estimated population for 2020, interesting results may be found. Presently, inthe Assessment Region 5, as already mentioned, only 55% of the population is reachable within a
radius of 1,500 meters from a public school. The construction of a new school unit with capacity5,163 students at the centroid corresponding to pop46 would increase this coverage to 75%, andreach as many as 18,552 students. An additional school at centroid pop84 with capacity 2,581
students would increase the coverage to 86%, with 21,433 people attended, and a third schoolwith capacity 907 in pop91 would increase to 90% the population attended, comprising 22,340students. Clearly, the MCLP model improves the accessibility but requires large capacities and
expansion of the existing schools. Table 3 illustrates this analysis, in which the last column showsthe additional capacity increment required to meet the defined goal.
The results indicate two severe limitations for the MCLP model. The first is that the model doesnot consider allocating the whole universe of students to schools, and second is that the proposed
schools might be too large and beyond the pedagogical standards. Therefore, the MCLP shouldnot be strictly applied but rather consider additional information such as those given by theCPMP model.
In general, if no action is taken, the difficulties observed in Assessment Region 5 will be related
to both the service capacity of existing public schools, because they will be unable to supportthe growth of the schooling population in the coming years, and also in relation to the distancetraveled by the students, because a larger proportion of students will be living in areas of lower
accessibility.
Pesquisa Operacional, Vol. 34(2), 2014
�
�
“main” — 2014/7/14 — 13:55 — page 314 — #14�
�
�
�
�
�
314 APPLICATION OF THE CAPACITATED P-MEDIAN AND MAXIMAL COVERING LOCATION MODELS
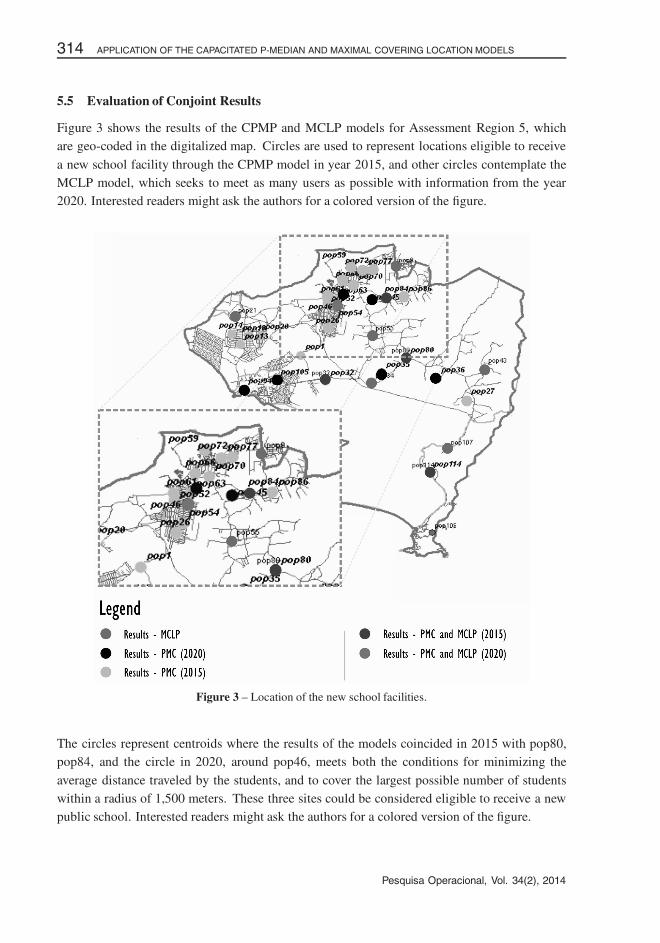
5.5 Evaluation of Conjoint Results
Figure 3 shows the results of the CPMP and MCLP models for Assessment Region 5, whichare geo-coded in the digitalized map. Circles are used to represent locations eligible to receive
a new school facility through the CPMP model in year 2015, and other circles contemplate theMCLP model, which seeks to meet as many users as possible with information from the year2020. Interested readers might ask the authors for a colored version of the figure.
Figure 3 – Location of the new school facilities.
The circles represent centroids where the results of the models coincided in 2015 with pop80,pop84, and the circle in 2020, around pop46, meets both the conditions for minimizing the
average distance traveled by the students, and to cover the largest possible number of studentswithin a radius of 1,500 meters. These three sites could be considered eligible to receive a newpublic school. Interested readers might ask the authors for a colored version of the figure.
Pesquisa Operacional, Vol. 34(2), 2014
�
�
“main” — 2014/7/14 — 13:55 — page 315 — #15�
�
�
�
�
�
RAFAEL MENEZES and NELIO DOMINGUES PIZZOLATO 315
6 FINAL CONCLUSIONS AND CONSIDERATIONS
The results obtained with CPMP and MCLP models showed that, if the growth forecast predictedby the IBGE for the Guaratiba Administrative Region for the years 2015 and 2020 is confirmed,the number of school places available today in the public schools may be very inadequate, andserving the school population at a suitable distance could become an important factor to improvethe usual low quality of the educational services.
In the Assessment Region 5, the CPMP location/allocation model showed that the constructionof 12 standard Public Schools in 2015 with 1,300 students capacity and additional three for2020 would be required to fully meet the expected population growth. For the entire district ofGuaratiba these numbers would be 21 and seven, respectively.
The Maximal Covering model, MCLP, is primarily concerned with the location of school unitsto ensure the greatest possible number of school-age population within a radius of 1,500 metersfrom schools. However, guaranteeing this level of service can impose the construction of verylarge buildings, and disregard the complete universe of students, as discussed in Section 5.4.Overall, twelve public schools should be built in the entire Guaratiba Administrative Regionto meet at least 90% of the population within the desired distance, while for the AssessmentRegion 5 three schools would be sufficient.
Despite the differences between models, it was possible to achieve common results in theAssessment Region 5, which is the region identified as the most complex. The construction oftwo new educational units of large capacities at centroids pop84 and pop46 seems to be satis-factory both for the condition of minimizing the average distance traveled by students, as for thecondition to cover the greatest number of students within a distance of 1,500 meters.
Regarding the two models considered, the Capacitated p-Median problem model showed betterapplicability to the real case of locating Public Schools, because it has a capacity constraint thatbest represents the standard model for school construction defined by the Municipal Secretaryof Education. However, this model does not ensure that the school is within a stated maximumdistance from the school-age population.
The disadvantage of the CPMP model may be avoided by the MCLP model, because this lattermodel allows locating new public schools and ensuring the service to students who are within thedistance of 1,500 meters from the nearest school. However, ensuring 100% of population servicewithin the established radius can become quite costly, since a greater number of schools shouldbe built while several would not use their full capacity. On the other hand, the MCLP modeldid not take into account the capacity constraint, making the results somehow distant from thepresent policy of the public education sector. In other words, if both criteria are imposed, i.e.,if the CPMP model is applied and at the same time a distance limit of 1,500 meters is imposedthen the number of new schools would be large, and operating costs for the municipality possiblybeyond the possibilities established by the budget.
The use of two different models in this study showed the possibility of finding solutions commonto both, that is, to find a solution that anticipates the expected demand while minimizing the
Pesquisa Operacional, Vol. 34(2), 2014
�
�
“main” — 2014/7/14 — 13:55 — page 316 — #16�
�
�
�
�
�
316 APPLICATION OF THE CAPACITATED P-MEDIAN AND MAXIMAL COVERING LOCATION MODELS
distance traveled by the student. This feature ensures coverage of the greatest number of studentsin a given radius.
Overall, the study showed that there is a need for immediate expansion of the Childhood andElementary Education Network in the Guaratiba Administrative Region. It seems necessary andrecommended to elaborate a comprehensive project involving many specializations: a logisticalplanning for the location/ allocation of schools; application of pedagogical studies; expansionof the number of teachers and other supporting personnel; geographical and statistical studies tomonitor the behavior of the population growth, and, finally, urban planning to allow the develop-ment of the infrastructure in the region studied.
REFERENCES
[1] BARCELOS FB, PIZZOLATO ND & LORENA LN. 2004. Localizacao de escolas de ensino fun-
damental com modelos capacitado e nao-capacitado: Caso de Vitoria/ES. Pesquisa Operacional,24(1): 133–149.
[2] CURRENT J, DASKIN M & SCHILLING D. 2002. Discrete network location models. In: DREZNER
Z & HAMACHER HW. (Editors), Facility Location: Applications and Theory, Springer-Verlag BerlinHeidelberg New York.
[3] BEGUIN H, DECONNINK J & PEETERS D. 1989. Optimizer la localization des ecoles primaires: Le
cas de Mouscron, Belgique. Revue d’Economie Regionale et Urbaine, 5: 795–806.
[4] BRAU L, MERCE M & TARRAGO M. 1980. Manual de urbanismo. Barcelona, LEUMT, 2.
[5] CHURCH R & REVELLE C. 1974. The maximal covering location problem. Papers of the Regional
Science Association, 32: 101–118.
[6] GALVAO RD, ESPEJO LGA & BOFFEY B. 2002. A hierarchical model for the location of perinatal
facilities in the Municipality of Rio de Janeiro. European Journal of Operational Research, 138:495–517.
[7] IBGE. Instituto Brasileiro de Geografia e Estatıstica – IBGE, Censo 2000.
[8] MOLINERO CM. 1988. Schools in Southhampton: A quantitative approach to school location, closure
and staffing. Journal of the Operational Research Society, 39(4): 339–350.
[9] PIZZOLATO ND, BARCELOS FG & LORENA LAN. 2004. School location methodology in urban
areas of developing countries. International Transactions in Operations Research, 11: 667–681.
[10] PIZZOLATO ND, RAUPP FMP & ALZAMORA GS. 2012. Revisao de desafios aplicados em loca-lizacao com base em modelos de p-medianas e suas variantes. Pesquisa Operacional para o Desen-
volvimento, 4(1): 13–42.
[11] PIZZOLATO ND & SILVA HBF. 1997. The location of public schools: evaluation of practical experi-
ences. International Transactions in Operations Research, 4(1): 13–22.
[12] RAHMAN SU & SMITH DK. 2002. Use of location-allocation models in health service developmentplanning in developing nations. European Journal of Operational Research, 123: 437–452.
[13] SMITH DK. 2008. A bibliography of applications of Operational Research in West Africa. Interna-
tional Journal of Operational Research, 15: 121–150.
Pesquisa Operacional, Vol. 34(2), 2014
�
�
“main” — 2014/7/14 — 13:55 — page 317 — #17�
�
�
�
�
�
RAFAEL MENEZES and NELIO DOMINGUES PIZZOLATO 317
[14] SMITH DK, HARPER PR & POTTS CN. 2013. Bicriteria efficiency/equity hierarchical location
models for public service application. Journal of the Operational Research Society, 64: 500–512.
[15] TEIXEIRA JC & ANTUNES AP. 2008. A hierarchical location model for public facility planning.
European Journal of Operations Research, 15(1): 92–104.
[16] TEWARI VK & JENA S. 1987. High school location decision making in rural India and location-allocation models, in Spatial Analysis and Location-Allocation Models [edited by GHOSHAND A &
RUSHTON G.], New York: Van Nostrand Rheinhold.
[17] VIEGAS JM. 1987. Short and mid-term planning of an elementary school network in a suburb of
Lisbon. Sistemi Urbani, 1: 57–77.
[18] WHITE L, SMITH H & CURRIE C. 2011. OR in developing countries: A review. European Journal
of Operations Research, 208: 1–11.
[19] YASENOVSKIY VS & HODGSON MJ. 2007. Hierarchical location-allocation with spatial choice in-
teraction modeling. Annals of the Association of American Geographers, 97: 496–511.
Pesquisa Operacional, Vol. 34(2), 2014

![[Cloud Summit 2010] Cezar Taurion - IBM](https://static.fdocuments.in/doc/165x107/554be74ab4c90556328b4c38/cloud-summit-2010-cezar-taurion-ibm.jpg)