RAF Brize Norton Environmental Appraisal
29
Defence Infrastructure RAF Brize Norton Environmental Comparative Assessment of Aircraft Noise RAF Brize Norton Environmental Appraisal Comparative Assessment of Aircraft Noise Emissions Version 1.0 Dated: 03-OCT-14 DIO Ops Projects Ramillies Bldg Marlborough Lines Monxton Rd Andover SP11 8HJ
Transcript of RAF Brize Norton Environmental Appraisal
Defence InfrastructureOrganisation
RAF Brize NortonEnvironmentalAppraisalComparative Assessment of Aircraft NoiseEmissions
October 2014
AMEC Environment & InfrastructureUK Limited
RAF Brize Norton Environmental AppraisalComparative Assessment of Aircraft Noise Emissions
Version 1.0
Dated: 03-OCT-14
DIO Ops ProjectsRamillies Bldg
Marlborough LinesMonxton Rd
Andover SP11 8HJ

DOCUMENT CONTROL SHEET
ChangeNo.
VersionNo.
Originator ofchange
Date ofChange Description of change
1.0 Sue Thomas 03/10/14 Final Report
Contributors:
DIO Area Project Manager
DIO Project Manager:
Study Team:
Author:
Reviewers:
Distribution:


i
z:\mod projects\35357 lea brize norton environmental appraisal subfile\d design\noise\stage 2\35357 a400m comparisonreport.docx
October 2014
Executive Summary
Purpose of this ReportThis report has been produced for the purpose of summarising and comparing the availablenoise data for the A400M.
The A400M will arrive at RAF Brize Norton on Monday 6th October and be commissionedshortly thereafter. It is of interest and importance to the local community to understand thenoise implications of the introduction of this new aircraft.
This report is mainly concerned with Engine Ground Running (EGR) noise as this is the sourceof the majority of noise complaints received by RAF Brize Norton. The report thereforecompares the noise emissions from EGR of the A400M with the other aircraft in use at the base;the C130J, the A330 and the C17.
Available data for takeoff and landing is also presented.
The comparison study indicates that the A400M is quieter in flight than the C17, C130 andVC10. However, under high power runs, the A400M has higher noise emissions. This shouldbe considered within the airport noise management plan. The position of the APU should alsobe considered when selecting the stands to be used as the directivity of the A400M is oppositeto that of the C130. However, it should be noted that the number of hours of EGR required forthe A400M are estimated to be lower than for the C130 and C17.
There are limitations to this study and it is recommended that a full modelling exercise iscompleted to quantify the effects of refleeting on the community. It is understood that thisexercise is being undertaken by RAFCAM for air noise.

ii
z:\mod projects\35357 lea brize norton environmental appraisal subfile\d design\noise\stage 2\35357 a400m comparisonreport.docx
October 2014

iii
z:\mod projects\35357 lea brize norton environmental appraisal subfile\d design\noise\stage 2\35357 a400m comparisonreport.docx
October 2014
Contents
Purpose of this Report i
1. Introduction 11.1 Background and Understanding 11.2 Aerodrome Noise 31.3 Refleeting of RAF Brize Norton 41.4 Scope 5
2. Noise terminology 62.1 Key Noise Terms 6
3. Legislation and Policy 83.1 National Legislation 83.2 MOD Policy 8
4. Methodology 104.1 Noise survey methodology 104.2 Comparative Analysis methodology 11
5. Results 145.1 Engine Ground Running 145.2 Take-off 165.3 Landing 18
6. Summary 206.1 Comparison of Aircraft Noise Emissions 206.2 Limitations 20
7. Conclusion 217.1 Conclusion 21

iv
z:\mod projects\35357 lea brize norton environmental appraisal subfile\d design\noise\stage 2\35357 a400m comparisonreport.docx
October 2014
7.2 Next Steps 21
Table 1.1 Summary of Studies Undertaken to Date 2Table 1.2 Non-AMEC Documents Referenced in this Report 3Table 2.1 Typical Noise Levels 6Table 5.1 EGR Annual Duration 16Table 6.1 Summary of Comparative study 20
Figure 4.1 EGR Measurement Locations 11Figure 5.1 EGR APU Comparison 14Figure 5.2 EGR High Power Comparison 15Figure 5.3 EPNL Comparison of Maximum Take off Settings 17Figure 5.4 LAmax Comparison of Maximum Take off Settings 17Figure 5.5 SEL Comparison of Maximum Take off Settings 18Figure 5.6 EPNL Comparison of High Power Landing 18Figure 5.7 LAmax Comparison of High Power Landing 19Figure 5.8 SEL Comparison of High Power Landing 19

1
z:\mod projects\35357 lea brize norton environmental appraisal subfile\d design\noise\stage 2\35357 a400m comparisonreport.docx
October 2014
1. Introduction
1.1 Background and UnderstandingAMEC Environment and Infrastructure UK (AMEC) have been commissioned by DefenceInfrastructure Organisation (DIO) to undertake a comparison of noise levels from engine groundrunning activities of various aircraft at Royal Air Force (RAF) Brize Norton.
RAF Brize Norton is the largest station in the RAF with approximately 5800 Service Personnel,1200 contractors and 300 Civilian staff members. RAF Brize Norton is of national strategicimportance as the UKs military air transport hub and Airport of Embarkation. The station is thehome of the RAF's Strategic and Tactical Air Transport (AT) and Air-to-Air Refuelling (AAR)forces and provides capability and support for UK Defence, NATO and coalition Operations.Noise is an inevitable consequence of these activities and the base’s function.
Historically, RAF Brize Norton has been associated with the Vickers VC10 jet aircraft, whichwere withdrawn from service in 2013 after 47 years. The base also accommodates other largeaircraft such as the C-17 Globemaster, the A330 Voyager, the C130J Hercules, and untilrecently, the Lockheed L-1011 Tri-Star. From October 2014, the A400M Atlas will beintroduced to RAF Brize Norton.
It is of great interest and importance to the local community to understand whether theintroduction of the A400M will change the noise climate in the surrounding area.
A previous AMEC report published in April 2014 reviewed the available noise data of aircraftnoise emissions and community noise levels to identify areas where further information wasrequired to provide a model to show the effects of refleeting. This interim report provides anintroduction to the A400M and its noise characteristics, and will be followed by a further reportand noise model to quantify the effects of refleeting at RAF Brize Norton.
This assessment aims to provide DIO and RAF Brize Norton with an understanding of the noiseemissions from engine ground running of all the aircraft on base and to determine whether theintroduction of the A400M will require any changes to the noise management programmecurrently employed.
Previous AMEC Noise ReportsAMEC has undertaken a number of recent studies in relation to noise from RAF Brize Norton.These are summarised in Table 1.1 with studies focused on noise arising from EGR, particularlyfrom the C130 aircraft. These were commissioned by DIO in direct response to noisecomplaints received at the Station from surrounding communities.

2
z:\mod projects\35357 lea brize norton environmental appraisal subfile\d design\noise\stage 2\35357 a400m comparisonreport.docx
October 2014
Table 1.1 Summary of Studies Undertaken to Date
Date Study
October 2011 –December 2011
Original week-long noise surveys to determine level and nature of noise exposure fromC130 EGR in communities.Measurements of C130 EGR to identify noise characteristics and directivity.Initial modelling to determine wider community exposure.Indicative modelling assessment of alternative stands and engine running pens to assesspotential benefits.
February 2012 Further indicative noise modelling to assess potential noise control measures beingconsidered by RAF Brize Norton.
March 2012 Measurements of VC10 EGR noise to understanding differences in noise levels between theVC10 and C130 aircraft.
May 2012 Measurements of A400M EGR to identify noise characteristics and directivity.Consideration of noise impacts at sensitive receptors at on-base locations.
August 2012 Publication of all technical investigations as outlined above in a report released under theFreedom of Information Act.
March/April 2013 4-week long noise survey to re-assess noise exposure at communities surrounding the baseduring a range of weather conditions.
June/July 2013 Additional, 4 week survey to compensate for a lack of westerly conditions in theMarch/ April survey.
May 2013 –September 2013
Development of software tool to calculate C130 EGR noise under prevailing weatherconditions using standard modelling methodology, adapted based on March/April andJune/July 2013 monitoring results.Comparison of noise exposure at receptors at and around RAF Brize Norton frommeasurements obtained in original October 2011 survey.
October 2013 Evaluation of changes in noise exposure from the base against the levels of exposuremeasured in October 2011 prior to the implementation of the measures recommended inprevious reports.Investigation of any further management procedures which may help manage noiseexposure from C130 EGR in light of prevailing weather conditions.
April 2014 Review of available baseline information and identification of the additional data required toinvestigate and model the noise effects of refleeting.
Other Noise ReportsThe following documents prepared by other organisations also consider noise from operationsand activities at RAF Brize Norton and have been referenced in the preparation of this report.

3
z:\mod projects\35357 lea brize norton environmental appraisal subfile\d design\noise\stage 2\35357 a400m comparisonreport.docx
October 2014
Table 1.2 Non-AMEC Documents Referenced in this Report
Author Date Study
Royal Air ForceCentre of AviationMedicine(RAFCAM)
January 2014 OEM/04/14 A report on an environmental noise survey at RAF BrizeNorton.Noise Amelioration Scheme (Military) (NAS(M)) Assessment.
MOD February 2014 Noise Amelioration Scheme (Military) (NAS(M)) Assessment.
MOD August 2013 Brize Norton Noise management.
MOD September 2010 Joint Service Publication (JSP) 148 MOD Corporate EnvironmentalProtection Manual: Environmental Noise.
Airbus July 2014 External noise Study Item for UK : A400M ANP data Technical Report RefM090RP1429764
Airbus July 2014 External noise Study Item for UK : A400M Run up noise results RefM090RP1424866
Airbus Military 2011 UK MOB Noise Information: Maintenance Aspects
1.2 Aerodrome NoiseThe noise produced by aerodromes is generally typically split into three categories:
• Air noise (i.e. aircraft on the runway during landing and take-off and in-flightduring descent/ final approach, climb-out and cruise);
• Ground noise (i.e. aircraft running Auxiliary Power Units (APUs) on stand whilstin park mode: Ground Service Equipment (GSE) handling of stationary aircraft,aircraft taxiing to the runway threshold and queuing and holding prior to departure,aircraft ‘start-of-roll’ for departures, fixed-plant in airport buildings and facilities,and aircraft Engine Ground Running (EGR) including any associated MaintenanceRepair Overhaul (MRO) operations; and,
• Surface Access Noise (i.e. noise from the modes of transport used by personneland people who work and/or reside at the base).
The consideration and assessment of these noise sources is undertaken in isolation, however itshould be recognised that these noise sources combine to result in the ambient and backgroundnoise climate that is experienced at and in the vicinity of any aerodrome. Some locations mayexperience only one of these noise sources whereas another may be affected by all three.
Each of these noise sources have different characteristics and can result in different responses,such as annoyance or complaint.

4
z:\mod projects\35357 lea brize norton environmental appraisal subfile\d design\noise\stage 2\35357 a400m comparisonreport.docx
October 2014
1.3 Refleeting of RAF Brize NortonAs discussed in Section 1.1, there are on-going changes to the aircraft fleet at RAF BrizeNorton. The following sections provide a summary of recent and upcoming changes in thefleet1.
VC10The VC10 was withdrawn from service at RAF Brize Norton in September 2013 after 47 yearsof service. The VC10 in its final role at RAF Brize Norton was as an air tanker providing air-to-air refuelling (AAR). It performed this role from 1993.
Tri-StarThe Tri-Star retired from service on 24 March 2014 as an RAF AT and AAR asset. The Tri-Star’s duties have been taken over by the Voyager.
C130 HerculesThe C130 fleet was transferred from RAF Lyneham to RAF Brize Norton in the Summer of2011. The C130-K variant reached its Out of Service Date (OSD) in October 2013 when theremaining four K variants were retired. The C130-J fleet continue to fulfil their tacticaloperational role and had recently been involved in the operations in the Central AfricanRepublic and assisted with the Philippines disaster relief effort.
C-17 GlobemasterThe C-17 fleet continues to maintain its worldwide operational commitment. Its global reachwas used to good effect in December when the aircraft was used for the short notice extractionof a large number of entitled personnel from South Sudan.
A330 VoyagerThe MOD selected the A330, following an open competition, to provide the replacement air-to-air refuelling and air transport capability through the Future Strategic Tanker Aircraft (FSTA)programme. The A330 (also known as the Voyager K2/K3) began air-to-air refuelling (AAR)operations with Typhoon in late May 2013, with a formal Release to Service (RTS) on 15August 2013. A330 Voyagers have served operations in Afghanistan, improving the travelexperience of the troops deploying to and from the operational theatre. In addition they havereplaced the Tri-Star in the Air to Air Refuelling role.
A400M AtlasThe first aircraft is due to be delivered to RAF Brize Norton on 6th October 2014. A total of 22aircraft have been ordered and are expected to arrive at a rate of one per month. The aircraft aresimilar in nature to the C130-J in the form of a turbo-prop military transport aircraft.
1 Minutes of the local consultation working group general meeting, held at RAF Brize Norton (20 Jan 14)

5
z:\mod projects\35357 lea brize norton environmental appraisal subfile\d design\noise\stage 2\35357 a400m comparisonreport.docx
October 2014
1.4 ScopeThe assessment has been undertaken to the following scope:
• Undertake a one week noise survey of EGR noise for aircraft types where no datais already available (A330 and C17),
• To observe and if possible measure other noise sources such as takeoff andlandings of all aircraft (A330, C130J, A400M, C17)
• Obtain data for the A400M from Airbus where measurements are not possible
• Analysis of the measurements and those from previous reports to provide acomparison between aircraft
A subsequent report will use the data from this assessment to create a noise model which will beused to test and quantify the effects of future refleeting at RAF Brize Norton. This will use theoutputs provided by RAFCAM.
6
z:\mod projects\35357 lea brize norton environmental appraisal subfile\d design\noise\stage 2\35357 a400m comparisonreport.docx
October 2014
2. Noise terminology
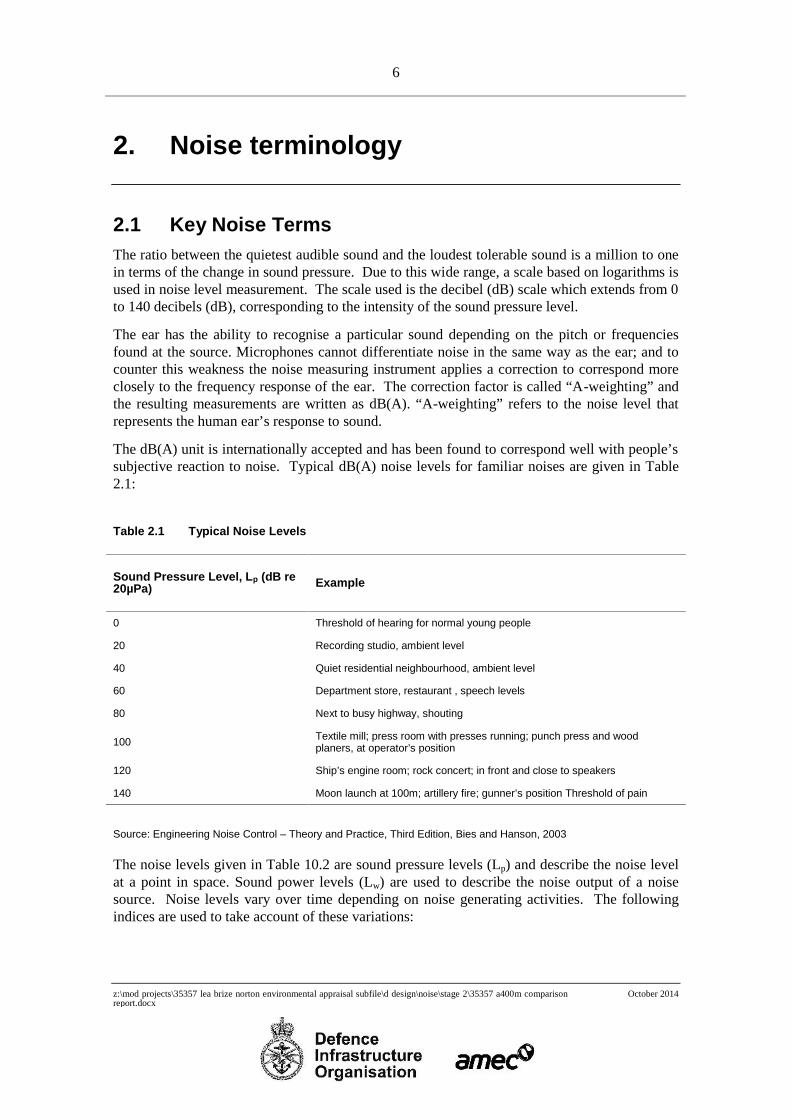
2.1 Key Noise TermsThe ratio between the quietest audible sound and the loudest tolerable sound is a million to onein terms of the change in sound pressure. Due to this wide range, a scale based on logarithms isused in noise level measurement. The scale used is the decibel (dB) scale which extends from 0to 140 decibels (dB), corresponding to the intensity of the sound pressure level.
The ear has the ability to recognise a particular sound depending on the pitch or frequenciesfound at the source. Microphones cannot differentiate noise in the same way as the ear; and tocounter this weakness the noise measuring instrument applies a correction to correspond moreclosely to the frequency response of the ear. The correction factor is called “A-weighting” andthe resulting measurements are written as dB(A). “A-weighting” refers to the noise level thatrepresents the human ear’s response to sound.
The dB(A) unit is internationally accepted and has been found to correspond well with people’ssubjective reaction to noise. Typical dB(A) noise levels for familiar noises are given in Table2.1:
Table 2.1 Typical Noise Levels
Sound Pressure Level, Lp (dB re20µPa) Example
0 Threshold of hearing for normal young people
20 Recording studio, ambient level
40 Quiet residential neighbourhood, ambient level
60 Department store, restaurant , speech levels
80 Next to busy highway, shouting
100 Textile mill; press room with presses running; punch press and woodplaners, at operator’s position
120 Ship’s engine room; rock concert; in front and close to speakers
140 Moon launch at 100m; artillery fire; gunner’s position Threshold of pain
Source: Engineering Noise Control – Theory and Practice, Third Edition, Bies and Hanson, 2003
The noise levels given in Table 10.2 are sound pressure levels (Lp) and describe the noise levelat a point in space. Sound power levels (Lw) are used to describe the noise output of a noisesource. Noise levels vary over time depending on noise generating activities. The followingindices are used to take account of these variations:

7
z:\mod projects\35357 lea brize norton environmental appraisal subfile\d design\noise\stage 2\35357 a400m comparisonreport.docx
October 2014
• LAeq is the equivalent continuous sound level and is the sound level of a steadysound having the same energy as a fluctuating sound over the same period. It ispossible to consider this level as the ambient noise encompassing all noise at agiven time. LAeq is considered the best general purpose index for environmentalnoise;
• LA90 index represents the noise level exceeded for 90 percent of the measurementperiod and is used to indicate quieter times during the measurement period. It isusually referred to as the background noise level;
• LA10 refers to the level exceeded for 10% of the measurement period. LA10 is widelyused as a descriptor of traffic noise;
• LAmax is maximum recorded noise level during the measurement period.
• In addition, the following definitions may be helpful when reading this report:
• Ambient Noise: Totally encompassing sound in a given situation at a given timeusually composed of sound from many sources near and far;
• Background Noise: (See LA90,T). The A-weighted sound pressure level of theresidual noise at the assessment position that is exceeded for 90% of a given timeinterval, T, measured using the fast time weighting;
• Fast Time Weighting: A sound pressure level measurement using a 125ms movingaverage time weighting period is said to have been determined using ‘fastweighting’.
• Free Field: Signifies that a noise measurement has been undertaken in ‘free field’conditions i.e. away from any reflecting facades e.g. building facades, closeboarded fencework etc.

8
z:\mod projects\35357 lea brize norton environmental appraisal subfile\d design\noise\stage 2\35357 a400m comparisonreport.docx
October 2014
3. Legislation and Policy
3.1 National LegislationEnvironmental Protection Act 1990The primary legislation concerning environmental noise impacts is the EnvironmentalProtection Act 1990 (EPA). This states in Section 79 (1)(g) that a statutory nuisance includes“noise emitted from premises so as to be prejudicial to health or a nuisance”. However,section 79( 2) states that Section 79(1)(g) above does not apply in relation to premises
(a) Occupied on behalf of the Crown for naval, military or air force purposes or forthe purposes of the department of the Secretary of State having responsibility fordefence, or;
(b) Occupied by or for the purposes of a visiting force;
and “visiting force” means any such body, contingent or detachment of the forces ofany country as is a visiting force for the purposes of any of the provisions of theVisiting Forces Act 1952.
Therefore, the EPA s79(1)(g) does not apply to RAF Brize Norton in respect of enforcement bythe courts, however, the MOD is aware of the potential for noise to cause annoyance, nuisanceand harm to health and takes these concerns seriously through its own policy.
3.2 MOD PolicyThe MOD, despite its exemptions, endeavours to act as a ‘good neighbour’ to their localcommunities and has implemented its own Departmental policy, defence regulations andguidance covering environmental impacts. These are recorded in a series of Joint ServicePublications (JSP).
JSP 815 describes in high-level terms the corporate system for the management ofenvironmental protection and safety in the MOD. JSP 815 is a live document and is updated ona rolling basis. It is owned and published by the Defence Safety and Environment Authority(DSEA)2.
The fundamental objective of this planning statement is that risk to the health and safety ofanyone conducting or affected by defence activities is reduced ‘as low as reasonablypracticable’ (ALARP).
Embedded within this are a series of environmentally related manuals including JSP 418 theMOD Corporate Environmental Protection Manual (which is publically available). JSP 418outlines that MOD activities shall, as far as reasonably practicable be conducted:
2 https://www.gov.uk/government/publications/jsp-815-defence-environment-and-safety

9
z:\mod projects\35357 lea brize norton environmental appraisal subfile\d design\noise\stage 2\35357 a400m comparisonreport.docx
October 2014
“so as to minimise the noise generated whilst achieving operationalimperatives (including those which are an operational necessity), toreduce disturbance to local communities including residential areas(both Service and public) together with impacts on domestic animals andwildlife and their habitat.”

10
z:\mod projects\35357 lea brize norton environmental appraisal subfile\d design\noise\stage 2\35357 a400m comparisonreport.docx
October 2014
4. Methodology
4.1 Noise survey methodologyAs part of this assessment, new noise measurements were carried out for the A330 and C17whilst undertaking EGR. These have been compared with data collected as described inprevious AMEC reports from October 2011-May 2012. The methodology used for theSeptember 2014 surveys was comparable with that of the previous measurements.
Measurements were undertaken using Rion NA28 ‘Class 1’ integrating sound level meters. Theinstrumentation was set up to simultaneously log LAeq, LA90, LA10, LAmin and LAmax, (in additionto other) parameters over 1 minute sampling periods. The noise measurements were undertakenin one-third octave frequency bands between 12.5 Hz to 20 KHz in order to identify any tonal orpotentially annoying characteristics of the engine running noise.
All measurements were undertaken, where possible, in accordance with BS 7445: Part 1:20033
and BS 4142:19974 and during dry and calm weather conditions.
The measurements were taken in the form of a ‘round robin’ as shown in Figure 4.1EGR Measurement Locations. Figure 4.1, with measurements taken at each until such
time as the LAeq noise level for the measurement had stabilised.
3 Acoustics - Description and Measurement of Environmental Noise - Part 1: Basic Quantities andProcedures. British Standards Institution, BS 7445:Part 1:2003.
4 Method for rating industrial noise affecting mixed residential and industrial areas. British StandardsInstitution, BS 4142:1997.

11
z:\mod projects\35357 lea brize norton environmental appraisal subfile\d design\noise\stage 2\35357 a400m comparisonreport.docx
October 2014
Figure 4.1 EGR Measurement Locations
The measurements have been corrected to a set distance of 50m and analysed in order to derivesound power level information and a ‘directivity pattern’ for the noise emissions.
4.2 Comparative Analysis methodologyEngine Ground RunningThe main aspects of engine ground running noise are:
• Overall noise emission levels
• Directivity - are noise emissions greater from a particular side or location aroundthe aircraft?
• Tonality – does the EGR noise emit any noticeable tones that would increase therisk of annoyance?
The comparative assessment therefore considers these factors and considers whether anydifferences would necessitate a different approach to noise management.

12
z:\mod projects\35357 lea brize norton environmental appraisal subfile\d design\noise\stage 2\35357 a400m comparisonreport.docx
October 2014
Takeoff and landingNoise-Power-Distance (NPD) has been provided by Airbus for the A400M5. This data has beenpresented in a format along with arrival and departure procedures that make it comparable withthe data held within the Federal Aviation Administration’s (FAA) Integrated Noise Model(INM). INM hold NPD data for a number of aircraft types including the VC10, C17 and C130.Using the NPD held within INM, a rudimentary comparison has been undertaken.
Landing and departure procedures and their profile differ within the INM dataset according toeach aircraft. To facilitate a comparison, focus has been given to initial take-offs and finalapproaches where the aircraft are most likely to be under 4000ft and where aircraftconfigurations are readily understood.
The comparisons use the worst case high power take-off and high power approach settings forengine noise.
It should be noted that these comparisons may differ following a noise modelling exercisewhere other factors such as the following will influence the resultant noise level:
• Altitude between the aircraft and the ground taking into account terrain;
• The airspeed of the aircraft and the duration of the aircraft for a particularprocedure;
• The bank angle of the aircraft (applicable before final approach and after initialdepartures);
• Atmospherics;
• Directivity;
• Ground effects; and
• The aircraft procedure during take-off and landing.
The provide a categorical understanding of the relative differences in the noise emissionsbetween the aircraft, an air noise model constructed using INM could be developed for BrizeNorton and noise event footprints / contours developed to identify the relative impact of a singleevent.
The comparisons consider three parameters, the EPNL, LAmax and SEL. These are definedbelow:
Effective Perceived Noise Level (EPNL)The perceived noise level (PNL) is a rating scale used to determine the subjective noise of anaircraft noise event taking into account any tones such as engine whine. The EffectivePerceived Noise Level (EPNL) modifies the PNL to include a correction for tones and theduration of the noise event. This is used widely in the assessment of aircraft noise.
5 External noise Study Item for UK : A400M ANP data Technical Report Ref M090RP1429764 July 2014

13
z:\mod projects\35357 lea brize norton environmental appraisal subfile\d design\noise\stage 2\35357 a400m comparisonreport.docx
October 2014
LAmax
LAmax is maximum (A-weighted) recorded noise level during the measurement period
SEL (Sound Exposure Level, or Single Event Level)The SEL (Sound Exposure Level, or Single Event Level) is the sound level over one second thatwould have the same energy content as the whole event.

14
z:\mod projects\35357 lea brize norton environmental appraisal subfile\d design\noise\stage 2\35357 a400m comparisonreport.docx
October 2014
5. Results
5.1 Engine Ground RunningAuxiliary Power Unit (APU) Noise LevelsThe results for engine ground running under auxiliary power are shown in Figure 5.1.
Figure 5.1 EGR APU Comparison
This shows that the A400M has lower noise emissions when running its APU than the C130,C17 and VC10. However the directivity of the noise emissions are shown to be to the right ofthe A400M, which contrasts with the C130 where emissions are to the left of the aircraft.
High Power Engine Ground Running Noise LevelsThe results for engine ground running at high power settings are shown in Figure 5.12. Highpower runs were undertaken at the maximum power level allowed on the ground, and the powerlevel is shown in the figure. The A330 could not be run at high power during the AMECmeasurements and so is not included in this comparison.
60.0
70.0
80.0
90.0
100.0
110.0
120.00
26.6
45
63.4
90
116.6
135
153.4180
206.6
225
243.4
270
296.6
315
333.4
A400M APU
C130 APU
VC10 APU
C17 APU
A330 APU

15
z:\mod projects\35357 lea brize norton environmental appraisal subfile\d design\noise\stage 2\35357 a400m comparisonreport.docx
October 2014
Figure 5.2 EGR High Power Comparison
Figure 5.2 demonstrates that there is less directivity of noise emissions during full power EGR.The A400M has higher emissions during high power EGR than was measured for the otheraircraft types.
TonalityPrevious AMEC studies have considered the presence of tones during EGR as well as overallnoise emissions. These have indicated that the C130 emissions can be highly tonal, producing alow frequency tone at 100Hz.
Work undertaken by AMEC in 2012 shows that during Low Speed Ground Idle (LSGI) theA400M produces tones at 160Hz which are most apparent and pronounced to the front and therear of the aircraft. During Normal Ground Idle (NGI) and High Power EGR, the A400Mproduces a tone at around 112Hz at most positions around the aircraft. The locations at whichthis tone is most apparent are those which are nearest to the wing tips. At locations to the rear ofthe aircraft tonal characteristics of the noise level are less apparent.
It is reasonable to conclude that during EGR, the A400M will produce noise levels of similarmagnitude and character to the C130.
60.0
70.0
80.0
90.0
100.0
110.0
120.00
26.6
45
63.4
90
116.6
135
153.4180
206.6
225
243.4
270
296.6
315
333.4
A400M FP
C130 Inboards atFull Power,Outboard atGround IdleVC10 80% FP
C17 79% FP

16
z:\mod projects\35357 lea brize norton environmental appraisal subfile\d design\noise\stage 2\35357 a400m comparisonreport.docx
October 2014
Number of EGRsRAF Brize Norton have advised that each A400M aircraft will need to undertake EGR onceevery two months. Assuming that there will be 22 aircraft and that each ground run lasts forone hour this would equate to 132 hours of EGR annually. If ground runs are extended to twohours the duration would increase to 264 hours. As is the case with the C130, not all of theEGR would be at high power settings.
This figure has been assumed in Table 5.1 for comparison purposes.
Table 5.1 EGR Annual Duration
Aircraft TypeAnnual Duration(hours)
Airbus A330 14
Hercules C130 411
C17 254
A400M* 132 - 264
*Estimated based on assumption of one EGR every two months per aircraft
The estimated duration of EGR for the A400M is therefore lower than for the C130 andcomparable with the C17. The VC10 has not been considered in this comparison as no historicdata has been made available and that is has now retired from service.
5.2 Take-offBased on the rudimentary comparison of NPD curves, Figure 5.3 shows the A400M to bequieter during high power take-offs than the other aircraft becoming comparable with the C130at higher altitudes. The C130 is shown to have lower noise emissions during take-off than theC17 or VC10. At higher altitudes the A400M’s noise emissions become comparable with theC130.

17
z:\mod projects\35357 lea brize norton environmental appraisal subfile\d design\noise\stage 2\35357 a400m comparisonreport.docx
October 2014
Figure 5.3 EPNL Comparison of Maximum Take off Settings
The LAmax comparison in Figure 5.4 shows the A400M to be quieter during takeoff than theother aircraft . The C130 is shown to have lower noise emissions during high power take-offthan the C17 or VC10.
Figure 5.4 LAmax Comparison of Maximum Take off Settings
Figure 5.5 provides the comparison between SEL levels for the aircraft. This shows the A400Mto have lower SEL emissions during take-off than the other aircraft. The C130 is shown to havelower SEL emissions during take-off than the C17 or VC10.
60
80
100
120
140
0 1000 2000 3000 4000 5000
Noi
se L
evel
(EPN
L)
Distance / Altitude (feet)
Maximum Takeoff Power Settings
A400M
C130
VC10
C17
60
80
100
120
140
0 1000 2000 3000 4000 5000
Noi
se L
evel
(LAm
ax)
Distance / Altitude (feet)
Maximum Takeoff Power Settings
A400M
C130
VC10
C17

18
z:\mod projects\35357 lea brize norton environmental appraisal subfile\d design\noise\stage 2\35357 a400m comparisonreport.docx
October 2014
Figure 5.5 SEL Comparison of Maximum Take off Settings
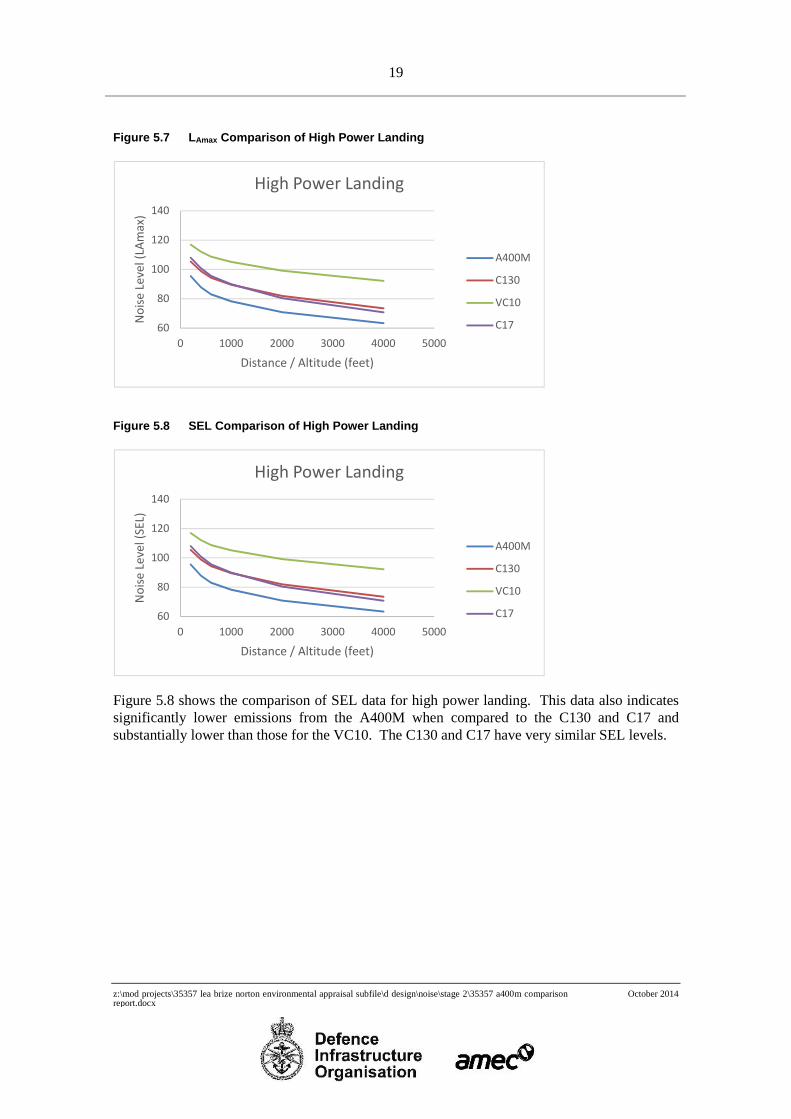
5.3 LandingThe high power landing data in Figure 5.6 shows the A400M to have lower EPNL emissionsthan the VC10, C130 and C17. EPNL levels for the C130, C17 and VC10 are very similar atlower altitudes.
Figure 5.6 EPNL Comparison of High Power Landing
Figure 5.7 shows the LAmax data for high power landing. This indicates significantly loweremissions from the A400M when compared to the C130 and C17. They are substantially lowerthan those for the VC10. The C130 and C17 have very similar LAmax levels.
60
80
100
120
140
0 1000 2000 3000 4000 5000
Noi
se L
evel
(SEL
)
Distance / Altitude (feet)
Maximum Takeoff Power Settings
A400M
C130
VC10
C17
60
80
100
120
140
0 1000 2000 3000 4000 5000
Noi
se L
evel
(EPN
L)
Distance / Altitude (feet)
High Power Landing
A400M
C130
VC10
C17
19
z:\mod projects\35357 lea brize norton environmental appraisal subfile\d design\noise\stage 2\35357 a400m comparisonreport.docx
October 2014
Figure 5.7 LAmax Comparison of High Power Landing
Figure 5.8 SEL Comparison of High Power Landing
Figure 5.8 shows the comparison of SEL data for high power landing. This data also indicatessignificantly lower emissions from the A400M when compared to the C130 and C17 andsubstantially lower than those for the VC10. The C130 and C17 have very similar SEL levels.
60
80
100
120
140
0 1000 2000 3000 4000 5000
Noi
se L
evel
(LAm
ax)
Distance / Altitude (feet)
High Power Landing
A400M
C130
VC10
C17
60
80
100
120
140
0 1000 2000 3000 4000 5000
Noi
se L
evel
(SEL
)
Distance / Altitude (feet)
High Power Landing
A400M
C130
VC10
C17

20
z:\mod projects\35357 lea brize norton environmental appraisal subfile\d design\noise\stage 2\35357 a400m comparisonreport.docx
October 2014
6. Summary
6.1 Comparison of Aircraft Noise EmissionsTable 6.1 provides a simplified summary of the comparative study above by ranking eachaircraft relative to the others. The lowest noise emissions are ranked 1(pale blue), and thehighest are ranked 4 (orange).
Table 6.1 Summary of Comparative study
Activity VC10 C17 C130 A400M
Engine Ground Running
APU 4 2 3 1
High Power 1 2 3 4
High Power Initial Take-off
EPNL 4 3 2 1
LAmax 4 3 2 1
SEL 4 3 2 1
High Power Landing
EPNL 3 2 4 1
LAmax 4 2.5 2.5 1
SEL 4 2.5 2.5 1
1 represents lowest emissions, 4 represents highest emissions
The comparison study indicates that the A400M is quieter in flight during initial take-offs andfinal approaches than the C17, C130 and VC10. However, under high power EGR, the A400Mhas higher noise emissions. This should be considered within the airport noise managementplan. The position of the APU should also be considered when selecting the stands to be usedas the directivity of the A400M is opposite to that of the C130. However, it should be notedthat the A400M EGR requirements are estimated to be lower than for the C130 and C17.
6.2 LimitationsThe above comparative study considers the worst case emissions under specific circumstancesusing INM data for the in-flight data. As outlined in Section 4.2, there are a number oflimitations in the comparison relying on NPD information alone. It is therefore recommendedthat the single events are modelled using INM for each of the aircraft using approach anddeparture procedures that occur at RAF Brize Norton. It is recommended that this takes the formof noise event footprints using the SEL, EPNL and LAmax metrics. When modelled, it is possiblethat the comparison may yield difference results.
21
z:\mod projects\35357 lea brize norton environmental appraisal subfile\d design\noise\stage 2\35357 a400m comparisonreport.docx
October 2014
7. Conclusion
7.1 ConclusionThe comparative analysis indicates that the A400M has lower noise emissions in flight than theC17, VC10 and C130.
However, during high power EGR, the A400M has higher noise emissions than the C17, VC10and C130. This should be considered within the airport noise management plan. The position ofthe APU should also be considered when selecting the stands to be used as the directivity of theA400M is opposite to that of the C130. However, it should be noted that the A400M EGRrequirements (in respect of frequency and annual duration) are estimated to be lower than forthe C130 and C17.
The analysis has also indicated that during EGR, the A400M will produce noise levels of similarmagnitude and character to the C130 with both having a tonal characteristic in the 100Hz range.
7.2 Next StepsA subsequent report will use the data from this, previous AMEC reports and INM to create anoise model which will be used to test and quantify the effects of future refleeting at RAF BrizeNorton on community noise levels from engine ground running. It is understood that RAFCAMwill be undertaking a separate noise modelling exercise regarding the effects on the NAS(M)contours.