Radiological-pathological correlation in Alzheimer’s ...
54
1 Radiological-pathological correlation in Alzheimer’s disease: systematic review of antemortem MRI findings Caroline Dallaire-Théroux 1,2 , Brandy L. Callahan 1,2,3 , Olivier Potvin 1,2 , Stephan Saikali 2,4 , Simon Duchesne 1,2 1 Centre de recherche de l’Institut universitaire en santé mentale de Québec, Quebec City, Quebec, Canada 2 Faculty of Medicine, Université Laval, Quebec City, Quebec, Canada 3 Sunnybrook Health Sciences Centre, Toronto, Ontario, Canada 4 Department of pathology, Centre Hospitalier Universitaire de Quebec, Quebec, Canada Corresponding author: Caroline Dallaire-Théroux Centre recherche Institut universitaire en santé mentale de Québec 2601 de la Canardière / F-4435 Québec, QC, Canada G1J 2G3 Tel: (418) 663-5000 x6714 Fax: (418) 663-5971 Email: [email protected] Running head: Alzheimer’s MRI-pathological correlation
Transcript of Radiological-pathological correlation in Alzheimer’s ...

! 1!
Radiological-pathological correlation in Alzheimer’s disease: systematic
review of antemortem MRI findings
Caroline Dallaire-Théroux1,2, Brandy L. Callahan1,2,3, Olivier Potvin1,2, Stephan Saikali2,4, Simon
Duchesne1,2
1Centre de recherche de l’Institut universitaire en santé mentale de Québec, Quebec City,
Quebec, Canada
2Faculty of Medicine, Université Laval, Quebec City, Quebec, Canada
3Sunnybrook Health Sciences Centre, Toronto, Ontario, Canada
4Department of pathology, Centre Hospitalier Universitaire de Quebec, Quebec, Canada
Corresponding author:
Caroline Dallaire-Théroux Centre recherche Institut universitaire en santé mentale de Québec 2601 de la Canardière / F-4435 Québec, QC, Canada G1J 2G3 Tel: (418) 663-5000 x6714 Fax: (418) 663-5971 Email: [email protected] Running head: Alzheimer’s MRI-pathological correlation

!
Abstract
Background: The standard method of ascertaining Alzheimer’s disease (AD) remains post-
mortem assessment of amyloid plaques and neurofibrillary degeneration. Vascular pathology,
Lewy bodies, TDP-43, and hippocampal sclerosis are frequent comorbidities. There is therefore
a need for biomarkers that can assess these aetiologies and provide a diagnosis in vivo.
Objective: We conducted a systematic review of published radiological-pathological correlation
studies to determine the relationship between antemortem magnetic resonance imaging (MRI)
and neuropathological findings in AD.
Methods: We explored PubMed in June-July 2015 using “Alzheimer’s disease” and
combinations of radiological and pathological terms. After exclusion following screening and
full-text assessment of the 552 extracted manuscripts, three others were added from their
reference list. In fine, we report results based on 27 articles.
Results: Independently of normal age-related brain atrophy, AD pathology is associated with
whole-brain and hippocampal atrophy and ventricular expansion as observed on T1-weighted
images. Moreover, cerebral amyloid angiopathy and cortical microinfarcts are also related to
brain volume loss in AD. Hippocampal sclerosis and TDP-43 are respectively associated with
hippocampal and medial temporal lobe atrophy. Brain volume loss correlates more strongly with
tangles than with any other pathological finding. White matter hyperintensities observed on
proton density, T2-weighted and FLAIR images are strongly related to vascular pathologies, but
are also associated with other histological changes such as gliosis or demyelination.
Discussion: Cerebral atrophy and white matter changes in the living brain reflect underlying
neuropathology and may be detectable using antemortem MRI. In vivo MRI may therefore be an
avenue for AD pathological staging.

! 3!
Keywords: Neuroimaging • Neuropathology • MRI • Antemortem Diagnosis • Alzheimer
Disease • Dementia
Abbreviations
AD = Alzheimer!s disease; Aβ = beta-amyloid; CAA = cerebral amyloid angiopathy; CA1 = cornu ammonis area I; CA4 = cornu
ammonis area IV; CSF = cerebrospinal fluid; DLB = dementia with Lewy bodies; HS = hippocampal sclerosis; MCI = mild
cognitive impairment; MRI = magnetic resonance imaging; NFT = neurofibrillary tangle; NP = neuritic plaque; SP = senile
plaque; WMH = white matter hyperintensities.

! 4!
INTRODUCTION
Alzheimer’s disease (AD), the most prevalent cause of dementia among the elderly, has
significant economic and societal consequences for these patients, their caregivers and the whole
community [1]. A definitive diagnosis of AD can only be established following postmortem
evaluation; an accepted standard follows Montine’s “ABC staging” [2], which requires the
pathological assessment of diffuse amyloid beta (Aβ) plaques, neurofibrillary tangles (NFTs),
and neuritic plaque (NP) burden [3]. Beyond AD-specific pathology, however, evidence from
autopsy studies indicates frequent comorbid conditions in subjects with a clinical diagnosis of
AD [3,4]. These include cerebrovascular disease [4], cerebral amyloid angiopathy![4, 5], region-
specific findings (e.g. hippocampal sclerosis [6]), as well as pathologies associated with other
dementias (e.g. Lewy bodies, TDP-43 inclusions) [7].
Due to this heterogeneity in disease presentation, the clinical diagnosis of AD can be
problematic for clinicians, especially in its early phase, with unsatisfactory concordance with
postmortem pathology. Additional tools and methodologies are therefore needed to improve this
concordance. Non-invasive imaging techniques such as anatomical magnetic resonance imaging
(MRI) have the potential to address this issue by measuring aetiologies in vivo. While the MRI-
clinical relationship in AD has been well-researched [8-11], in this report we provide an
overview of the less abundant literature on MRI-pathological correlation, with the ambition of
highlighting the relevance of clinical MRI as a potential biomarker of pathological processes in
the continuum of AD.
Operational definitions
For the sake of clarity, we elected to provide operational definitions of the pathological

! 5!
features investigated in this review.
Diffuse plaques are typical extracellular Aβ deposits evenly dispersed in the brains.
Found in patients with AD [12], they are also very commonly observed in those of cognitively
intact elderly people [13]. Diffuse plaques usually present as amorphous irregular configurations
with no evidence of neuritic reaction [14]. Neuritic plaques are focal collections, within the
cortical gray matter, of dystrophic neurites surrounding a central extracellular amyloid core,
composed of several abnormal proteins, of which the Aβ peptide is the major component [15].
The neuritic corona of NPs is an area of neuronal accumulation of fibrillar hyperphosphorylated
tau [16]. The terminology “senile plaque (SP)” is an older and more general term that only
refers to focal extracellular Aβ deposit. Both diffuse plaques and NPs are encompassed in the
concept of senile plaque [14, 17].
Neurofibrillary tangles are dense intraneuronal aggregates of characteristic paired
helical filaments, predominantly composed of hyperphosphorylated microtubule-associated tau
protein. Neuropil threads in the adjacent cerebral parenchyma normally accompany these lesions.
Paired helical filaments are also found in the outer portions of NPs, within the dystrophic
neurites [15]. NFTs are commonly found in AD, as well as in other neurodegenerative diseases
(tauopathies) [12], and form an essential part of its pathological diagnosis.
Cerebrovascular disease is commonly found in association with AD pathology [18, 19].
It may manifest in the brain as arteriosclerosis, atherosclerosis, arteriolosclerosis, infarcts, or
bleeds. Arteriosclerosis consists of the thickening, hardening and loss of elasticity of arterial
walls. It is a general term which refers to both medium and large arteries and encompasses both
atherosclerosis and arteriolosclerosis [15]. Atherosclerosis refers to intimal lesions of arteries,
characterized by the formation of fibrofatty (or atheromatous) plaques leading to a progressive

! 6!
luminal occlusion, a limited blood flow and eventual ischemic lesions [15, 20]. Arteriolosclerosis
is the thickening of small vessels and arteriole walls in association with narrowing of the
vascular lumen, which may cause ischemic injury. Arteriolosclerosis is mostly seen in
association with diabetes and hypertension [15, 21]. Lacunar infarcts are caused by the occlusion
of penetrating vessels that supply deep brain structures, and large-vessel infarcts are caused by
the occlusion of major blood vessels on the surface of the brain [22]. These two types of infarcts
can be radiologically detected; microinfarcts, on the other hand, are generally invisible lesions
seen only during microscopic examination [23]. Lastly, cerebral microbleeds are small foci of
chronic brain hemorrhages caused by small vessel structural abnormalities [24]. Although the
articles selected for this review did not specifically select for this pathological feature, it is
important to note that microbleeds have been suspected to contribute to cognitive impairment.
Some interesting articles addressing this topic can be found in the literature [25-27].
Cerebral amyloid angiopathy (CAA) is a neuropathological lesion characteristic of AD,
in which Aβ and other amyloidogenic peptide deposits form in the walls of small- and medium-
caliber meningeal and cortical blood vessels, typically in the interstitium between smooth muscle
cells of the media [15]. These vascular lesions can lead to hematomas, microbleeds and
microinfarcts, contributing to cognitive impairment [12]. CAA is most often found in parieto-
occipital brain regions, and least often found in the hippocampus and subcortical white matter
[28].
Hippocampal sclerosis (HS) refers to important hippocampal neuronal loss and glial
proliferation, with a higher susceptibility in the cornu ammonis 1 (CA1), the cornu ammonis 4
(CA4) and the subiculum subdivisions of the hippocampus [29, 30]. This condition can be
unilateral or bilateral, complete or focal, pure (e.g. related to temporal lobe epilepsy [31]) or in
! 7!
association with a dementia like AD, and typically causes severe memory loss [6]. We include
HS in this review because it is often found in association with cerebrovascular disease [29, 32],
and is believed to result from ischemia in the brain [32] (although this has been disputed; see
[33]). Primarily age-related, HS occurs with high frequency in the oldest-old [33] and may
contribute to misdiagnosis of AD by mimicking its clinical presentation [32].
Lewy bodies are dense eosinophilic cytoplasmic inclusions, mainly containing α-
synuclein, but also parkin and ubiquitin proteins, with a lighter halo. They are found in neurons
of individuals with neurodegenerative conditions like Parkinson’s disease and dementia with
Lewy bodies (DLB) [15]. Lewy bodies are relatively common pathological lesions in patients
with AD as well [34, 35].
TAR DNA-binding protein of 43 kDa (TDP-43) is an intracellular phosphorylated and
proteolytically cleaved protein that typically accumulates in the brain of patients with the
ubiquitine-positive subtype of frontotemporal lobar degeneration and in those with amyotrophic
lateral sclerosis [36, 37]. However, studies have also revealed a high prevalence of these
inclusions in other neurodegenerative diseases, with up to 57% of brains otherwise
pathologically categorized as AD [38]. The amygdala appears to be the first and most common
structure presenting with pathological accumulation of TDP-43 in AD [36, 38-40].
MATERIALS AND METHODS
Eligibility criteria
Studies were included in this review if they collected MRI and postmortem pathological
data in individuals with clinically- or pathologically-diagnosed AD. Since cognitively-silent
lesions are often found in elderly brains [41], cognitive performance was not an inclusion

! 8!
criterion. This is relevant given that the purpose of this research was to report on the correlation
between AD-associated neuropathological features and MRI findings alongside the
neuropathological continuum. Studies had to meet the following criteria:
(a) be an original study (i.e. narrative or systematic reviews or meta-analyses were not included);
(b) use clinical (1.0T-3.0T) MRI scanning, in order to maintain consistency with current practice
standards; and
(c) be an in vivo MRI study, as MRI scanning ex vivo may be affected by formalin fixation,
brain shrinkage and normal changes following death, regardless of the time between death and
scanning [42]. Further, postmortem MRI is less sensitive than in vivo MRI for detecting smaller
white matter hyperintensities (WMH) [25, 43] and perivascular atrophic demyelination [44].
Search strategy and study selection
We explored the PubMed database from June to July 2015 using “Alzheimer’s disease”
combined with the following terms: “postmortem pathology in vivo MRI correlation”, “autopsy
MRI”, “neuropathology MRI correlation”, “postmortem histopathology MRI association”,
“quantitative MRI pathology correlation”, “volumetric MRI histopathology correlation”,
“antemortem MRI autopsy”, “structural neuroimaging postmortem pathology”, “MRI cerebral
amyloid angiopathy postmortem pathology”, “MRI vascular postmortem pathology”, “MRI
Lewy bodies postmortem pathology”, “MRI hippocampal sclerosis postmortem pathology” and
“MRI TDP-43 pathology” as keywords and MeSH headings. No limit was applied to the date of
publication, MRI being a relatively recent technology and the discoveries already made still
applicable to date. The first author (C.D.-T.) screened the articles and selected studies for
inclusion first by examining the title and abstract of each article, then the full text version. The

! 9!
remaining articles were then reviewed by other authors (B.L.C. and S.D.) to confirm their
relevance. This present systematic review was done following Preferred Reporting Items for
Systematic Reviews and Meta-Analyses (PRISMA) guidelines [45] (Figure 1).
Data extraction
We extracted necessary data for description of the collected articles. Study design,
population characteristics (source, number of subjects, selection criteria, age and gender
distribution), imaging characteristics (modality, resolution(s) and sequence(s)), time between
MRI and death, types of dementia, radiologic and histopathologic variables examined and main
study findings were noted in Table 1. We further assessed the articles alongside three main
categories: AD-related findings, cerebrovascular disease-related findings, and incidental
findings.
We extracted relevant significant (p < .05) coefficients from studies included in the
review (Table 2) and performed a general analysis based on significance of correlations between
neuropathological and MRI findings (Figure 2). The interpretation of p-values was based on
recommendations from B. Rosner [46].
RESULTS
Studies description
Our PubMed search yielded 552 articles, from which we excluded 481 at initial screening
and 47 at full-text assessment. The relevance of the remaining 24 articles was confirmed by the
second evaluation. Three articles were added by hand after searching the reference lists of the 24
! 10!
saved articles. Our review is based on a total of 27 studies published between 1995 and 2015
(Table 1 and Figure 1).
Twenty-four were longitudinal studies [7, 47-50] or used subjects from longitudinal
cohort studies but analyzed the data cross-sectionally [6, 38, 40, 51-66]; the remaining three
articles were descriptive cross-sectional studies [67-69]. All studies were published in English;
most of them were conducted in the United States [6, 7, 38, 40, 47-55, 57-60, 62, 63, 65-68], one
in Canada and the United States [61], two in the United Kingdom [56, 64] and one in the
Netherlands [69]. Subjects in all studies were between 43-108 years old from enrollment to
death, and all included both men and women. MRI field strengths of 1.0T to 3.0T were used in
every study, except for five in which field strength was not explicitly reported [40, 48, 52, 55,
60]. One study also compared the sensitivity to neuropathological changes between 7.0T and
3.0T MRI [69]. In total, T1-weighted images were evaluated in 21 studies [7, 38, 40, 47, 48, 50,
51, 53-58, 60, 61, 63, 64, 66-69], T2-weighted images in five studies [50, 59, 62, 67, 69], proton
density images in three studies [50, 59, 67], FLAIR images in four studies [48, 63, 65, 69], and
type of images was unspecified in three of the reviewed articles [6, 49, 52]. Time interval
between last MRI and death varied from 0 to 10.5 years, but information was not available in
two studies [38, 40].
Neuropathological findings
Figures 2 and 3 give a brief overview of results from studies included in the present
review.
AD-related findings

! 11!
Diffuse and neuritic plaques
Radiological-pathological evidence suggests that NPs are associated with brain volumes.
Of the 27 studies reviewed, 10 specifically investigated correlations between brain volumes and
diffuse or neuritic plaques. Eight of these studies reported specifically on NPs [48, 49, 52, 54, 56,
58, 62, 64], and two reported on SPs more generally (i.e., made no distinction between neuritic
and diffuse plaques) [47, 68]. The majority of these studies agree that total brain volume [62],
medial temporal lobe volume [56], hippocampal volume [52, 58], ventricular size [62] or
ventricular expansion over time [49] are significantly associated with NPs in postmortem brain
tissue. NFT and senile plaque burden have also been associated with these measures [47, 68],
and some authors have reported the rate of ventricular volume enlargement as their strongest
correlate [47]. A moderate correlation (ρ=.52) has also been reported between CERAD [70] NP
count and the adjusted STructural Abnormality iNDex (aSTAND) score, which evaluates the
degree and pattern of cerebral atrophy adjusted for age and gender [54]. One study [68] found a
non-significant correlation between left and right HVs and hippocampal senile plaque density,
but a moderate correlation between total cerebral volume and hippocampal senile plaque density
(ρ=-.68). Only one study [48] suggested a lack of association between total Aβ burden (i.e.,
compact and diffuse Aβ) and rates of whole-brain atrophy and ventricular expansion in patients
with low, intermediate or high probability of AD according to the National Institute on Aging
and Reagan Institute Working Group on Diagnostic Criteria for the Neuropathological
Assessment of Alzheimer’s disease [71].
Neurofibrillary tangles and Braak stage
! 12!
Sixteen studies selected for this review focused on NFTs as a pathological variable of
interest [47-52, 54-62, 68] and nearly all reported moderate to strong positive associations
between NFT pathology and brain atrophy. In fact, several authors have suggested that MRI
brain volumes correlate more strongly with NFTs than with NPs [48, 56, 62] or SPs [47].
Selected transversal studies addressing NFT pathology found significant correlations between
whole-brain atrophy on MRI and NFT staging (according to the Braak and Braak scale [72]) [48,
55, 62], as well as between Braak staging and ventricular size [48, 62]. Moreover, a moderate
correlation (ρ=.62) was found between Braak NFT staging and aSTAND scores [54].
Evidence suggests that Braak stage is also significantly associated with hippocampal
atrophy [51, 52, 54, 55, 58, 68], although some authors note that these correlations are weaker
than those involving whole-brain atrophy or aSTAND scores [54]. Importantly, total Braak NFT
score, and not percent area of tangles, appeared to be the only significant predictor of MRI-
measured medial temporal lobe atrophy [56]. These associations may, to some extent, be
influenced by regional distribution of pathology. For example, Burton and colleagues [56]
reported that total (left and right) medial temporal atrophy rating was correlated (ρ=.49) with
percent area of NFTs in the hippocampus. Further, MRI-detected hippocampal atrophy has been
specifically linked to the accumulation of NFTs in the CA1 subfield of the hippocampus [68].
Medial temporal atrophy rating based on a 5-point scale (from absent to severe; based on the
height of hippocampus and the width of cerebrospinal fluid (CSF)-filled spaces) shows high
sensitivity (91%) for autopsy-confirmed AD [56].
According to Whitwell and colleagues [55], the severity of gray matter loss may be more
closely related to quantitative NFT load than to Braak NFT stage. Their study was conducted
using voxel-based morphometry with group-wise comparisons between each Braak stage (III to
! 13!
VI) and the control group (Braak stages 0 to II). Because no regions of grey matter atrophy were
found at Braak stages III or IV when compared to the control group, group analyses were also
performed between subjects with low tau burden (<10%) and high tau burden (≥10%) in subjects
with Braak stages 0 to IV. Those with high tau burden showed greater gray matter loss in medial
and lateral temporal lobes than those with low tau burden. In addition, results from this study
showed a graded pattern of increasing brain atrophy across Braak stages V and VI. In subjects
with Braak stage V, atrophy was found in temporal, parietal and frontal lobes only. In subjects
with Braak stage VI, basal forebrain, posterior cingulate, precuneus, anterior cingulate, insula,
subcortical nuclei, and occipital lobe including the primary visual cortex were also involved. In
other words, the presence of NFTs in the brain tissue is associated with patterns of gray matter
atrophy, with NFT burden playing a more important role in determining the pattern of gray
matter loss at Braak stages III and IV, and Braak stage itself (i.e. regional distribution of NFTs)
having a greater correlation with patterns of brain atrophy at Braak stages V and VI.
Longitudinal data also support associations between repeated structural MRI measures
and AD pathology: ventricular expansion [47-49] and rates of cerebral atrophy [47, 48], but not
hippocampal atrophy [47, 49], have been significantly associated with the amount of NFTs at
autopsy. In fact, the rate of total ventricular CSF volume increase (an indicator of ventricular
expansion) was identified by one study as the best radiological biomarker of AD pathology
(R2=.422 for cortical NFTs and R2=.397 for cortical SPs), when compared to the rate of cerebral
atrophy (R2=.419 for cortical NFTs, and R2=.22 for cortical SPs) [47]. Postmortem pathological
diagnosis of AD has also been associated with whole-brain atrophy rate as measured using
repeated MRI during life [7].

! 14!
In addition to the substantial evidence linking NFTs to cerebral atrophy, one study
reported that more extensive NFT pathology, as rated by Braak staging, was associated with
MRI-evidence of increased longitudinal WMH accumulation [50], while another study reported
an inverse correlation when assessed cross-sectionally [65]. The relationship between Braak
stage and WMH remains to be confirmed by other studies, as no other work included in this
literature review assessed similar associations with WMH.
Cerebrovascular disease – related findings
Arterio-, arteriolo- and atherosclerosis, infarcts and bleeds
Based on results identified in mixed cohorts of both demented and non-demented
participants (see Table 1 for more details), WMH on proton density, T2-weighted and FLAIR
MRI seem to be a good in vivo marker of vascular pathology. In cross-sectional studies, WMH
have been associated with subcortical infarcts [53], cerebral hemorrhages [65], arteriosclerosis
[65, 67], demyelination [53, 65, 67], breakdown of the ventricular lining [65], reduced
periventricular vessels [65], and gliosis [67] in autopsied brains. Microinfarcts, particularly in the
deep nuclei, may also be related to WMH burden on antemortem MRI [62, 65] (but see [63] for
other results). The only longitudinal study found that, of all vascular lesions, arteriolosclerosis
was the most important correlate of accumulating WMH over time [50].
Imaging evidence of vascular disease (e.g., infarcts, hemorrhage, stroke) is also a strong
indicator of underlying vascular pathology at autopsy. Raman and colleagues [63] have shown
that the presence and number of cortical and subcortical infarcts detected on antemortem MRI
are associated with the presence and number of microinfarcts seen on postmortem pathological
examination. One study aiming to detect cortical microinfarcts using in vivo MRI, followed by

! 15!
postmortem pathological validation, found that higher-powered 7.0T MRI is more sensitive than
3.0T MRI, with an ability to detect cortical microinfarcts of ≥1 mm as hyperintensities on
FLAIR and T2-weighted scans [69]. It has been reported that detectable lacunes on MRI (well-
circumscribed foci >2 mm in diameter and hyperintense when compared to CSF on proton
density MRI) are highly reflective of subcortical vascular pathology, representing small-vessel
infarcts and arteriosclerosis [53].
Brain volumetrics have been less extensively studied as correlates of vascular pathology.
Only four of the selected articles cross-sectionally investigated radio-pathological associations
between cerebrovascular disease and total brain volume [57], cortical gray matter volume [53],
ventricular volume [57], and HV [52, 57, 62]. Jagust’s group reported that lower cortical gray
matter volume was associated with gross subcortical infarcts, but not cortical infarcts [53]. Kaur
and colleagues [62] also reported that lower hippocampal volume was associated with higher
number of noncavitated and subcortical microinfarcts, while WMH were associated with more
deep nuclei microinfarcts. In contrast, the two other groups found no significant association
between whole-brain, ventricular and hippocampal volumes and ischemic, hemorrhagic or
vascular pathology [52, 57].
Similarly, only two studies longitudinally assessed vascular correlates of ventricular
expansion [49] and rates of whole-brain and regional atrophy [63]. Gross infarcts at autopsy have
been associated with ventricular volume trajectory, with more ventricular enlargement over time
observed in individuals with this type of vascular lesion [49]. Moreover, Raman and colleagues
[63] found that whole-brain atrophy rate was the only MRI variable that differentiated subjects
with and without microinfarcts after controlling for AD-related pathology, compared to imaging
measures of hippocampal atrophy or WMH accumulation.

! 16!
Cerebral amyloid angiopathy
Despite its vascular involvement, CAA was not significantly associated with WMH in
demented or non-demented individuals in any of the studies reviewed [53, 59, 65]. However,
CAA has been correlated with increased hippocampal atrophy over time with a -0.0008%
volume change as proportion of intracranial volume (p=.009) and also showed a trend for
association with total brain volume atrophy over time with a -0.13% volume change as
proportion of intracranial volume (p=.030; the significance threshold was adjusted for multiple
comparisons to p < .017) [49].
Incidental findings
Lewy bodies
Results from many cross-sectional studies examining both cognitively intact and
cognitively impaired subjects have shown no significant associations between Lewy bodies and
occipital gray matter [61], medial temporal lobe [56] or hippocampal [51, 61, 64] volumes.
Overall, within the selected publications, no MRI-detected changes have been related to this
neuropathological feature, except for a positive correlation between percent area of Lewy bodies
in the hippocampus and total hippocampal volume [64].
Hippocampal sclerosis
Hippocampal atrophy is the most prominent radiological correlate of HS. Several cross-
sectional studies have reported that the presence of HS in AD and non-AD brains is strongly
inversely associated with HV [52, 53, 62] with greater pathologic severity related to greater

! 17!
atrophy on MRI [51]. Moreover, Zarow and colleagues [52] found a moderate negative
correlation (ρ=-.63) between number of neurons in CA1 subfield of the hippocampus and HS.
The same authors also reported a strong association between MRI HV and number of neurons in
CA1 (ρ=.72) as well as volume of CA1 (ρ=.54). Jagust and colleagues [53] have suggested that
hippocampal volume is independently related to both typical AD lesions and HS, as hippocampal
atrophy attributed to HS seems to be more severe in subjects with low levels of AD pathology.
Interestingly, hippocampal atrophy on anatomical MRI was associated with neuronal loss (i.e.,
reduction in number of neurons) and not shrinkage (i.e., change in neuron size), regardless of
etiology [52]. MRI appearance has also been linked to HS in the context of epilepsy [30].
TDP-43
Given the growing literature reporting a high prevalence of TDP-43 in AD brains [36, 40,
73-76], radiological features associated with this pathological lesion have been examined in
many transversal studies captured in the present review [6, 38, 40, 61, 66]. When comparing AD
subjects with and without abnormal TDP-43 immunoreactivity using voxel-based morphometry,
those with TDP-43 pathology showed greater volume loss in the medial temporal lobes [38, 66],
with greatest loss in the hippocampus [66]. Consistent with these findings, additional group
comparisons using MRI segmentation techniques showed similar results: TDP-43 pathology was
associated with lower amygdala [38], hippocampal [38, 40, 61] and entorhinal cortex [38, 40]
volumes. These atrophy sites have been correlated to both increased TDP-43 burden [38] and
higher TDP-43 stage (i.e., regional distribution) [40]. In one study [6], while HS was found in
61% of AD cases, it was found in as many as 92% of HS cases. This finding suggests a possible
association between TDP-43 and HS pathology. However, no differences in hippocampal

! 18!
volume were found between AD TDP-positive subjects with and without HS [6], and
hippocampal volumes remain significantly associated with the presence of TDP-43 even after
accounting for HS [38].
DISCUSSION
Sensitivity of MRI for AD identification
Overall, the results from this systematic review suggest that in vivo clinical-resolution
MRI is sensitive to most neuropathological lesions observed in AD subjects. It has been shown
that AD-related anatomical changes (i.e., SPs and NFTs) are associated with volumetric
measurements of several brain structures on MRI. Whole-brain, medial temporal lobe and
hippocampal atrophy, as well as ventricular enlargement, can predict underlying Aβ and tau
pathologies accumulating in the brain tissue with high sensitivity, with ventricular enlargement
clearly identified by one study as the best radiological biomarker for AD pathology [47].
Interestingly, the association between brain volumes and plaques or tangles may be limited to
individuals with cognitive impairment, and absent in those who are cognitively intact [47, 51].
This might be explained by an existing threshold after which AD neuropathology burden leads to
brain volume loss, similar to the onset of cognitive impairment occurring after many years of
accumulation of these lesions [77]. Unfortunately, two of the studies investigating the
relationship between structural atrophy and amyloid neuropathology [47, 51] did not distinguish
between neuritic and diffuse amyloid plaques, and potential differences between them may
warrant further investigation.
Importantly, neuronal and synaptic losses have primarily been associated in extant
literature with the accumulation of NFTs, rather than with plaque formation [13]. Only one study

! 19!
[62] examined radio-pathologic relationships separately for tau (NFTs) and amyloid (NPs), and
found that although whole-brain volume was associated with both pathological variables, only
NFTs remained a significant correlate when both were entered into linear regression models.
This suggests that the associations between structural atrophy and amyloid plaques reported in
the present review may have been confounded to some extent by the degree of tau pathology,
and that MRI may be more sensitive for detecting tau than amyloid pathology.
The association between vascular pathology and cerebral atrophy is less clear-cut.
Vascular lesions (e.g., arteriosclerotic patterns and infarcts) can generally be easily detected as
WMH on antemortem MRI, except for microinfarcts, which are macroscopically invisible by
definition. Lacunar infarcts may manifest differently, but are still radiologically detectable as
lacunes in the white matter [78].
Underlying HS can also be identified on brain MRI, the most reliable indicator being
significant hippocampal volume loss, particularly in the CA1 and CA2 subfields of the
hippocampus [52]. Studies included in this review did not show any MRI sensitivity for
comorbid Lewy body pathology in individuals with AD, although other authors have identified a
specific pattern of relatively focused atrophy, separate from that exemplified in AD subjects, in
the midbrain and hypothalamus with relative sparing of the hippocampus and temporoparietal
cortices, in individuals with a clinical diagnosis of DLB [79]. There is also increasing evidence
showing that concomitant TDP-43 can be visualized on MRI as medial temporal lobe atrophy,
independently of HS. Overall, MRI has a good sensitivity for AD pathology and most other
frequent comorbidities.
Specificity of MRI for AD identification

! 20!
AD-related pathology
Our results suggest moderate specificity of MRI-defined changes in AD subjects. First,
cerebral atrophy, decidedly the best-known radiological feature of AD, is also common in other
types of neurodegenerative diseases. Increased rates of whole-brain atrophy and ventricular
expansion, two usually associated features, are found in AD as well as other dementias such as
pathologically confirmed cases of mixed AD/DLB, fronto-temporal degeneration, corticobasal
degeneration and progressive supranuclear palsy, when compared to normal aging subjects [7]
and therefore cannot, on their own, serve as reliable or specific biomarkers for AD.
However, Whitwell and colleagues [7] have suggested that longitudinal rates of cerebral
atrophy differ according to the underlying neuropathological process, which may improve
specificity. In their study, the lowest rates were observed in pure DLB pathology, while the
highest rates were observed in corticobasal degeneration, followed by fronto-temporal dementia.
Nonetheless, AD, mixed AD/DLB and progressive supranuclear palsy showed similar
intermediary rates of atrophy, and conventional MRI volumetry could not help differentiate those
three. Relative to whole–brain atrophy, medial temporal lobe atrophy rating based on a 5-point
scale has been shown to be a more accurate diagnostic marker for differentiating AD from DLB
and vascular dementia, with good discriminatory power and 94% specificity [56]. Furthermore,
the capacity of MRI-derived hippocampal volume to differentiate between AD and vascular
dementia has been touted, as neuronal loss in CA1 is more consistently found in AD subjects
than in those with vascular dementia [52]. Additional studies using atrophy maps specific to each
neurodegenerative dementia [80] or more developed techniques such as image appearance [81]
or grading [82], especially focused on medial temporal areas, are needed to confirm these
findings, since other authors have suggested that cumulative ischemia without amyloid pathology

! 21!
(i.e. pure subcortical vascular dementia) might lead to atrophy and shape changes in the CA1 and
subiculum regions of the hippocampus [83].
Structural MRI may also be used to differentiate pathologically-defined subtypes of AD.
For example, the greatest cortical atrophy is seen in hippocampal-sparing AD, followed by
typical AD and then limbic-predominant AD [60]. Conversely, the greatest medial temporal lobe
atrophy is observed with limbic-predominant AD, followed by typical AD, and then
hippocampal-sparing AD [60]. However, the best discriminator of the three subtypes of AD is
the ratio of hippocampal to cortical volumes [60].
One group of researchers found that the estimated number of neurons in both CA1 and
CA2 regions of the hippocampus is decreased in patients with pure AD relative to those with
ischemic vascular dementia or normal controls [52]. This group also reported an evident
correlation between CA1 neuron counts and MRI-derived hippocampal volume. The severity of
CA1 neuron loss (i.e., hippocampal atrophy) might even help to distinguish between different
stages of AD: the authors reported 48% reduction in CA1 neurons in subjects with isocortical
stage AD, and 8% reduction in subjects with limbic stage AD. Unfortunately, hippocampal
atrophy is not specific to AD neurodegeneration. In fact, subjects with a pathologically
confirmed diagnosis of AD, HS, fronto-temporal dementia or NFT-only degeneration usually
have considerable hippocampal atrophy compared to those with normal age-related changes [51].
Concomitant cerebrovascular disease
Regarding radiologically-detectable white matter changes, many studies showed that
there is no relationship between WMH and AD pathology or CAA [42, 43, 53]. As suggested by
myriad radiological-pathological correlation studies, WMH best reflect vascular changes in the

! 22!
brain [42-44, 50, 53, 62]. In fact, WMH are related to age and vascular risk factors, and are
strongly reflective of underlying cerebrovascular disease and complete and incomplete infarction
[53].
Takao and colleagues [42] evaluated the pathologic significance of different types of
WMH on T2-weighted MR images of non-demented subjects. They found that small patchy
WMH (dot-like or confluent lesions not attached to the lateral ventricles) corresponded to
demyelination, gliosis and arteriosclerosis. Neither infarction nor amyloid deposits were found to
be associated with these types of lesions. ‘Caps’ (WMH around the anterior or posterior poles of
the lateral ventricles) represented demyelination, dilated perivascular spaces and arteriosclerosis.
No infarction was noted. ‘Rims’ (thin WMH along the body of the lateral ventricles) accounted
for subependymal gliosis and partial disruption of ependymal lining. Lastly, most histologically-
discovered silent white matter lesions on MRI were found to reflect partial demyelination and
arteriosclerosis. Only two studies reported a positive [59] and a negative [65] relationship
between cross-sectional MRI-detected WMH and AD-related deposits (NPs and NFTs) as
assessed by CERAD score, Braak stage and a composite AD pathology score [59], but these
conflicting findings have yet to be clarified by other research groups. Increased accumulation of
WMH over time was also correlated to NFT pathology, when comparing low (0, I or II) vs. high
(V or VI) Braak stage [50]. The authors from these papers hypothesized that this association may
be explained by the fact that subjects were much older at death than those in most other cohorts!
[50, 59].
The impact of aging on atrophy

! 23!
The moderate specificity of antemortem MRI may at least help differentiate normal aging
from pathological processes, although age at the time of scan seems to influence the rates of
brain volume change. The rates of both brain volume loss and ventricular expansion decrease as
the age at scan increases, which means that greater atrophic effects of AD pathology are seen in
younger individuals [7, 48]. This measure may therefore be particularly useful in detecting cases
of early-onset AD.
Interestingly, cerebral atrophy over time differs in subjects with and without cognitive
impairment even after accounting for the severity of SPs [47], NPs [49] and NFT [47, 49],
suggesting that there may be underlying protective factors or other mechanisms that can lead to
increased brain reserve and resistance to atrophy. Similarly, one study reported that larger total
brain and hippocampal volumes were associated with preserved cognitive function during life
despite a high number of AD-related lesions [57].
Limitations
Several sources of potential bias in this review must be acknowledged. The major
limitation of this research is the publication bias, which may have resulted in incomplete or
inexact conclusions. Since this review is based on published literature, studies that have not been
published because of negative results (no association found or opposite to expectations) are not
included in the analysis. A second factor is related to the populations under study, the vast
majority (23 out of 27 studies) being from the United States. Geographic, ethnic or cultural
differences, such as lifestyle, risk factor exposure and genetics, may influence findings, and thus
the generalizability of these results is limited. Another important limitation is that several studies
have small samples, which reduces the statistical power of observations. Moreover, studies

! 24!
mainly looked at only one type of structural measure in T1-weighted scans (i.e., volume), and
focused in only one region apart from the whole brain and ventricles (i.e., medial temporal lobe,
with specific attention to hippocampal volume). More studies on other cortical and subcortical
regions of the brain and using other techniques such as additional morphological measures
(surfaces, thicknesses) or diffusion are needed in order to draw adequate conclusions.
CONCLUSIONS
In summary, the reviewed studies have demonstrated the capacity of clinical-resolution
MRI (1.0T-3.0T) to detect most pathological alterations due to AD before death with high
sensitivity and moderate specificity. MR-defined cerebral atrophy in the pre-mortem brain
appear to be the most strongly reflective of underlying AD neuropathology and other incidental
neurodegenerative findings such as HS and TDP-43, while WMH correlate better with
concomitant cerebrovascular disease as seen at autopsy. New protocols and especially post-
acquisition image processing techniques should focus on improving the specificity of MRI to
detect pathological lesions related to AD. Should this be achieved, then in vivo pathological
staging of AD will be possible noninvasively, raising the hope of identifying affected patients
well before they develop full-blown dementia.
ACKNOWLEDGMENTS
Contributors: C.D.-T. conceptualized the study, analyzed the data, interpreted the results and
wrote the manuscript. B.L.C. reviewed the data collection process, interpreted the results and
revised the manuscript for important intellectual content. O.P. and S.S. provided manuscript

! 25!
revision for important intellectual content. S.D. conceptualized the study, supervised the study
process, and revised the manuscript for important intellectual content.
Funding: We gratefully acknowledge financial support from the Alzheimer’s Society of Canada
(#13-32). B.L.C. receives financial support from the Alzheimer’s Association (AACF-16-
443540). S.D. is a Research Scholar from the Fonds de recherche du Québec – Santé (#30801).
Conflict of Interest Disclosures: S.D. is officer and shareholder of True Positive Medical
Devices inc.

! 26!
REFERENCES
[1] Alzheimer's A (2010) 2010 Alzheimer's disease facts and figures. Alzheimers Dement 6,
158-194.
[2] Montine TJ, Phelps CH, Beach TG, Bigio EH, Cairns NJ, Dickson DW, Duyckaerts C,
Frosch MP, Masliah E, Mirra SS, Nelson PT, Schneider JA, Thal DR, Trojanowski JQ,
Vinters HV, Hyman BT, National Institute on A, Alzheimer's A (2012) National Institute
on Aging-Alzheimer's Association guidelines for the neuropathologic assessment of
Alzheimer's disease: a practical approach. Acta Neuropathol 123, 1-11.
[3] Braak H, Braak E (1991) Neuropathological stageing of Alzheimer-related changes. Acta
Neuropathol 82, 239-259.
[4] Brenowitz WD, Nelson PT, Besser LM, Heller KB, Kukull WA (2015) Cerebral amyloid
angiopathy and its co-occurrence with Alzheimer's disease and other cerebrovascular
neuropathologic changes. Neurobiol Aging 36, 2702-2708.
[5] Jellinger KA (2010) Prevalence and impact of cerebrovascular lesions in Alzheimer and
lewy body diseases. Neurodegener Dis 7, 112-115.
[6] Zarow C, Weiner MW, Ellis WG, Chui HC (2012) Prevalence, laterality, and
comorbidity of hippocampal sclerosis in an autopsy sample. Brain Behav 2, 435-442.
[7] Whitwell JL, Jack CR, Jr., Parisi JE, Knopman DS, Boeve BF, Petersen RC, Ferman TJ,
Dickson DW, Josephs KA (2007) Rates of cerebral atrophy differ in different
degenerative pathologies. Brain 130, 1148-1158.
[8] Belleville S, Fouquet C, Duchesne S, Collins DL, Hudon C (2014) Detecting early
preclinical Alzheimer's disease via cognition, neuropsychiatry, and neuroimaging:
! 27!
qualitative review and recommendations for testing. J Alzheimers Dis 42 Suppl 4, S375-
382.
[9] Burggren A, Brown J (2014) Imaging markers of structural and functional brain changes
that precede cognitive symptoms in risk for Alzheimer's disease. Brain Imaging Behav 8,
251-261.
[10] Braskie MN, Thompson PM (2014) A focus on structural brain imaging in the
Alzheimer's disease neuroimaging initiative. Biol Psychiatry 75, 527-533.
[11] Weiner MW, Veitch DP, Aisen PS, Beckett LA, Cairns NJ, Cedarbaum J, Green RC,
Harvey D, Jack CR, Jagust W, Luthman J, Morris JC, Petersen RC, Saykin AJ, Shaw L,
Shen L, Schwarz A, Toga AW, Trojanowski JQ, Alzheimer's Disease Neuroimaging I
(2015) 2014 Update of the Alzheimer's Disease Neuroimaging Initiative: A review of
papers published since its inception. Alzheimers Dement 11, e1-120.
[12] Thompson PM, Vinters HV (2012) Pathologic lesions in neurodegenerative diseases.
Prog Mol Biol Transl Sci 107, 1-40.
[13] Serrano-Pozo A, Frosch MP, Masliah E, Hyman BT (2011) Neuropathological alterations
in Alzheimer disease. Cold Spring Harb Perspect Med 1, a006189.
[14] Morris JH, Nagy, Z. Alzheimer's disease In The Neuropathology of Dementia, Press CU,
ed., UK, pp. pp. 161-206.
[15] Kumar VA, Abul K; Fausto, Nelson; Robbins, Stanley Leonard; Cotran, Ramzi S. (2005)
Robbins and Cotran pathologic basis of disease, Elsevier Saunders, Philadelphia, Pa.
[16] Duyckaerts C, Dickson, D. (2011) 10. Neuropathology of Alzheimer's Disease and its
Variants In Neurodegeneration : The Molecular Pathology of Dementia and Movement
Disorders, Wiley-Blackwell, ed., Oxford, UK.
! 28!
[17] Dickson DW (1997) The pathogenesis of senile plaques. J Neuropathol Exp Neurol 56,
321-339.
[18] Chui HC, Ramirez-Gomez L (2015) Clinical and imaging features of mixed Alzheimer
and vascular pathologies. Alzheimers Res Ther 7, 21.
[19] Osborn AGS, Karen L; Jhaveri, Miral D. (2016) Vascular Dementia In Diagnostic
Imaging: Brain, Inc. E, ed., Philadelphia, PA.
[20] Osborn AGS, Karen L; Jhaveri, Miral D. (2016) Intracranial Atherosclerosis In
Diagnostic Imaging: Brain, Inc. E, ed., Philadelphia, PA.
[21] Osborn AGS, Karen L; Jhaveri, Miral D. (2016) Arteriolosclerosis In Diagnostic
Imaging: Brain, Inc. E, ed., Philadelphia, PA.
[22] Blumenfeld H (2010) Neuroanatomy through Clinical Cases, Sinauer Associates, Inc.,
Sunderland, MA.
[23] Smith EE, Schneider JA, Wardlaw JM, Greenberg SM (2012) Cerebral microinfarcts: the
invisible lesions. Lancet Neurol 11, 272-282.
[24] Martinez-Ramirez S, Greenberg SM, Viswanathan A (2014) Cerebral microbleeds:
overview and implications in cognitive impairment. Alzheimers Res Ther 6, 33.
[25] Gouw AA, Seewann A, van der Flier WM, Barkhof F, Rozemuller AM, Scheltens P,
Geurts JJ (2011) Heterogeneity of small vessel disease: a systematic review of MRI and
histopathology correlations. J Neurol Neurosurg Psychiatry 82, 126-135.
[26] Werring DJ (2007) Cerebral microbleeds: clinical and pathophysiological significance. J
Neuroimaging 17, 193-203.
[27] Schrag M, McAuley G, Pomakian J, Jiffry A, Tung S, Mueller C, Vinters HV, Haacke
EM, Holshouser B, Kido D, Kirsch WM (2010) Correlation of hypointensities in

! 29!
susceptibility-weighted images to tissue histology in dementia patients with cerebral
amyloid angiopathy: a postmortem MRI study. Acta Neuropathol 119, 291-302.
[28] Vinters HV, Gilbert JJ (1983) Cerebral amyloid angiopathy: incidence and complications
in the aging brain. II. The distribution of amyloid vascular changes. Stroke 14, 924-928.
[29] Dickson DW, Davies P, Bevona C, Van Hoeven KH, Factor SM, Grober E, Aronson
MK, Crystal HA (1994) Hippocampal sclerosis: a common pathological feature of
dementia in very old (> or = 80 years of age) humans. Acta Neuropathol 88, 212-221.
[30] Blumcke I, Thom M, Aronica E, Armstrong DD, Bartolomei F, Bernasconi A,
Bernasconi N, Bien CG, Cendes F, Coras R, Cross JH, Jacques TS, Kahane P, Mathern
GW, Miyata H, Moshe SL, Oz B, Ozkara C, Perucca E, Sisodiya S, Wiebe S, Spreafico R
(2013) International consensus classification of hippocampal sclerosis in temporal lobe
epilepsy: a Task Force report from the ILAE Commission on Diagnostic Methods.
Epilepsia 54, 1315-1329.
[31] Bernasconi N, Duchesne S, Janke A, Lerch J, Collins DL, Bernasconi A (2004) Whole-
brain voxel-based statistical analysis of gray matter and white matter in temporal lobe
epilepsy. Neuroimage 23, 717-723.
[32] Zarow C, Sitzer TE, Chui HC (2008) Understanding hippocampal sclerosis in the elderly:
epidemiology, characterization, and diagnostic issues. Curr Neurol Neurosci Rep 8, 363-
370.
[33] Nelson PT, Schmitt FA, Lin Y, Abner EL, Jicha GA, Patel E, Thomason PC, Neltner JH,
Smith CD, Santacruz KS, Sonnen JA, Poon LW, Gearing M, Green RC, Woodard JL,
Van Eldik LJ, Kryscio RJ (2011) Hippocampal sclerosis in advanced age: clinical and
pathological features. Brain 134, 1506-1518.

! 30!
[34] Hamilton RL (2000) Lewy bodies in Alzheimer's disease: a neuropathological review of
145 cases using alpha-synuclein immunohistochemistry. Brain Pathol 10, 378-384.
[35] Atiya M, Hyman BT, Albert MS, Killiany R (2003) Structural magnetic resonance
imaging in established and prodromal Alzheimer disease: a review. Alzheimer Dis Assoc
Disord 17, 177-195.
[36] Arai T, Mackenzie IR, Hasegawa M, Nonoka T, Niizato K, Tsuchiya K, Iritani S, Onaya
M, Akiyama H (2009) Phosphorylated TDP-43 in Alzheimer's disease and dementia with
Lewy bodies. Acta Neuropathol 117, 125-136.
[37] Neumann M, Sampathu DM, Kwong LK, Truax AC, Micsenyi MC, Chou TT, Bruce J,
Schuck T, Grossman M, Clark CM, McCluskey LF, Miller BL, Masliah E, Mackenzie
IR, Feldman H, Feiden W, Kretzschmar HA, Trojanowski JQ, Lee VM (2006)
Ubiquitinated TDP-43 in frontotemporal lobar degeneration and amyotrophic lateral
sclerosis. Science 314, 130-133.
[38] Josephs KA, Whitwell JL, Weigand SD, Murray ME, Tosakulwong N, Liesinger AM,
Petrucelli L, Senjem ML, Knopman DS, Boeve BF, Ivnik RJ, Smith GE, Jack CR, Jr.,
Parisi JE, Petersen RC, Dickson DW (2014) TDP-43 is a key player in the clinical
features associated with Alzheimer's disease. Acta Neuropathol 127, 811-824.
[39] Hu WT, Josephs KA, Knopman DS, Boeve BF, Dickson DW, Petersen RC, Parisi JE
(2008) Temporal lobar predominance of TDP-43 neuronal cytoplasmic inclusions in
Alzheimer disease. Acta Neuropathol 116, 215-220.
[40] Josephs KA, Murray ME, Whitwell JL, Parisi JE, Petrucelli L, Jack CR, Petersen RC,
Dickson DW (2014) Staging TDP-43 pathology in Alzheimer's disease. Acta
Neuropathol 127, 441-450.
! 31!
[41] Sonnen JA, Santa Cruz K, Hemmy LS, Woltjer R, Leverenz JB, Montine KS, Jack CR,
Kaye J, Lim K, Larson EB, White L, Montine TJ (2011) Ecology of the aging human
brain. Arch Neurol 68, 1049-1056.
[42] Takao M, Koto A, Tanahashi N, Fukuuchi Y, Takagi M, Morinaga S (1999) Pathologic
findings of silent hyperintense white matter lesions on MRI. J Neurol Sci 167, 127-131.
[43] Fazekas F, Kleinert R, Offenbacher H, Payer F, Schmidt R, Kleinert G, Radner H,
Lechner H (1991) The morphologic correlate of incidental punctate white matter
hyperintensities on MR images. AJNR Am J Neuroradiol 12, 915-921.
[44] Braffman BH, Zimmerman RA, Trojanowski JQ, Gonatas NK, Hickey WF, Schlaepfer
WW (1988) Brain MR: pathologic correlation with gross and histopathology. 2.
Hyperintense white-matter foci in the elderly. AJR Am J Roentgenol 151, 559-566.
[45] Moher D, Liberati A, Tetzlaff J, Altman DG, Group P (2009) Preferred reporting items
for systematic reviews and meta-analyses: the PRISMA Statement. Open Med 3, e123-
130.
[46] Rosner B (2016) Fundamentals of Biostatistics, USA.
[47] Silbert LC, Quinn JF, Moore MM, Corbridge E, Ball MJ, Murdoch G, Sexton G, Kaye
JA (2003) Changes in premorbid brain volume predict Alzheimer's disease pathology.
Neurology 61, 487-492.
[48] Josephs KA, Whitwell JL, Ahmed Z, Shiung MM, Weigand SD, Knopman DS, Boeve
BF, Parisi JE, Petersen RC, Dickson DW, Jack CR, Jr. (2008) Beta-amyloid burden is not
associated with rates of brain atrophy. Ann Neurol 63, 204-212.
! 32!
[49] Erten-Lyons D, Dodge HH, Woltjer R, Silbert LC, Howieson DB, Kramer P, Kaye JA
(2013) Neuropathologic basis of age-associated brain atrophy. JAMA Neurol 70, 616-
622.
[50] Erten-Lyons D, Woltjer R, Kaye J, Mattek N, Dodge HH, Green S, Tran H, Howieson
DB, Wild K, Silbert LC (2013) Neuropathologic basis of white matter hyperintensity
accumulation with advanced age. Neurology 81, 977-983.
[51] Jack CR, Jr., Dickson DW, Parisi JE, Xu YC, Cha RH, O'Brien PC, Edland SD, Smith
GE, Boeve BF, Tangalos EG, Kokmen E, Petersen RC (2002) Antemortem MRI findings
correlate with hippocampal neuropathology in typical aging and dementia. Neurology 58,
750-757.
[52] Zarow C, Vinters HV, Ellis WG, Weiner MW, Mungas D, White L, Chui HC (2005)
Correlates of hippocampal neuron number in Alzheimer's disease and ischemic vascular
dementia. Ann Neurol 57, 896-903.
[53] Jagust WJ, Zheng L, Harvey DJ, Mack WJ, Vinters HV, Weiner MW, Ellis WG, Zarow
C, Mungas D, Reed BR, Kramer JH, Schuff N, DeCarli C, Chui HC (2008)
Neuropathological basis of magnetic resonance images in aging and dementia. Ann
Neurol 63, 72-80.
[54] Vemuri P, Whitwell JL, Kantarci K, Josephs KA, Parisi JE, Shiung MS, Knopman DS,
Boeve BF, Petersen RC, Dickson DW, Jack CR, Jr. (2008) Antemortem MRI based
STructural Abnormality iNDex (STAND)-scores correlate with postmortem Braak
neurofibrillary tangle stage. Neuroimage 42, 559-567.
[55] Whitwell JL, Josephs KA, Murray ME, Kantarci K, Przybelski SA, Weigand SD, Vemuri
P, Senjem ML, Parisi JE, Knopman DS, Boeve BF, Petersen RC, Dickson DW, Jack CR,

! 33!
Jr. (2008) MRI correlates of neurofibrillary tangle pathology at autopsy: a voxel-based
morphometry study. Neurology 71, 743-749.
[56] Burton EJ, Barber R, Mukaetova-Ladinska EB, Robson J, Perry RH, Jaros E, Kalaria RN,
O'Brien JT (2009) Medial temporal lobe atrophy on MRI differentiates Alzheimer's
disease from dementia with Lewy bodies and vascular cognitive impairment: a
prospective study with pathological verification of diagnosis. Brain 132, 195-203.
[57] Erten-Lyons D, Woltjer RL, Dodge H, Nixon R, Vorobik R, Calvert JF, Leahy M,
Montine T, Kaye J (2009) Factors associated with resistance to dementia despite high
Alzheimer disease pathology. Neurology 72, 354-360.
[58] Kantarci K, Lowe VJ, Boeve BF, Weigand SD, Senjem ML, Przybelski SA, Dickson
DW, Parisi JE, Knopman DS, Smith GE, Ferman TJ, Petersen RC, Jack CR, Jr. (2012)
Multimodality imaging characteristics of dementia with Lewy bodies. Neurobiol Aging
33, 2091-2105.
[59] Moghekar A, Kraut M, Elkins W, Troncoso J, Zonderman AB, Resnick SM, O'Brien RJ
(2012) Cerebral white matter disease is associated with Alzheimer pathology in a
prospective cohort. Alzheimers Dement 8, S71-77.
[60] Whitwell JL, Dickson DW, Murray ME, Weigand SD, Tosakulwong N, Senjem ML,
Knopman DS, Boeve BF, Parisi JE, Petersen RC, Jack CR, Jr., Josephs KA (2012)
Neuroimaging correlates of pathologically defined subtypes of Alzheimer's disease: a
case-control study. Lancet Neurol 11, 868-877.
[61] Toledo JB, Cairns NJ, Da X, Chen K, Carter D, Fleisher A, Householder E, Ayutyanont
N, Roontiva A, Bauer RJ, Eisen P, Shaw LM, Davatzikos C, Weiner MW, Reiman EM,
Morris JC, Trojanowski JQ, Alzheimer's Disease Neuroimaging I (2013) Clinical and

! 34!
multimodal biomarker correlates of ADNI neuropathological findings. Acta Neuropathol
Commun 1, 65.
[62] Kaur B, Himali JJ, Seshadri S, Beiser AS, Au R, McKee AC, Auerbach S, Wolf PA,
DeCarli CS (2014) Association between neuropathology and brain volume in the
Framingham Heart Study. Alzheimer Dis Assoc Disord 28, 219-225.
[63] Raman MR, Preboske GM, Przybelski SA, Gunter JL, Senjem ML, Vemuri P, Murphy
MC, Murray ME, Boeve BF, Knopman DS, Petersen RC, Parisi JE, Dickson DW, Jack
CR, Jr., Kantarci K (2014) Antemortem MRI findings associated with microinfarcts at
autopsy. Neurology 82, 1951-1958.
[64] Burton EJ, Mukaetova-Ladinska EB, Perry RH, Jaros E, Barber R, O'Brien JT (2012)
Quantitative neurodegenerative pathology does not explain the degree of hippocampal
atrophy on MRI in degenerative dementia. Int J Geriatr Psychiatry 27, 1267-1274.
[65] Shim YS, Yang DW, Roe CM, Coats MA, Benzinger TL, Xiong C, Galvin JE, Cairns NJ,
Morris JC (2015) Pathological correlates of white matter hyperintensities on magnetic
resonance imaging. Dement Geriatr Cogn Disord 39, 92-104.
[66] Josephs KA, Whitwell JL, Knopman DS, Hu WT, Stroh DA, Baker M, Rademakers R,
Boeve BF, Parisi JE, Smith GE, Ivnik RJ, Petersen RC, Jack CR, Jr., Dickson DW (2008)
Abnormal TDP-43 immunoreactivity in AD modifies clinicopathologic and radiologic
phenotype. Neurology 70, 1850-1857.
[67] Brilliant M, Hughes L, Anderson D, Ghobrial M, Elble R (1995) Rarefied white matter in
patients with Alzheimer disease. Alzheimer Dis Assoc Disord 9, 39-46.

! 35!
[68] Csernansky JG, Hamstra J, Wang L, McKeel D, Price JL, Gado M, Morris JC (2004)
Correlations between antemortem hippocampal volume and postmortem neuropathology
in AD subjects. Alzheimer Dis Assoc Disord 18, 190-195.
[69] van Veluw SJ, Zwanenburg JJ, Engelen-Lee J, Spliet WG, Hendrikse J, Luijten PR,
Biessels GJ (2013) In vivo detection of cerebral cortical microinfarcts with high-
resolution 7T MRI. J Cereb Blood Flow Metab 33, 322-329.
[70] Mirra SS, Heyman A, McKeel D, Sumi SM, Crain BJ, Brownlee LM, Vogel FS, Hughes
JP, van Belle G, Berg L (1991) The Consortium to Establish a Registry for Alzheimer's
Disease (CERAD). Part II. Standardization of the neuropathologic assessment of
Alzheimer's disease. Neurology 41, 479-486.
[71] Hyman BT, Trojanowski JQ (1997) Consensus recommendations for the postmortem
diagnosis of Alzheimer disease from the National Institute on Aging and the Reagan
Institute Working Group on diagnostic criteria for the neuropathological assessment of
Alzheimer disease. J Neuropathol Exp Neurol 56, 1095-1097.
[72] Braak H, Braak E (1995) Staging of Alzheimer's disease-related neurofibrillary changes.
Neurobiol Aging 16, 271-278; discussion 278-284.
[73] Amador-Ortiz C, Lin WL, Ahmed Z, Personett D, Davies P, Duara R, Graff-Radford NR,
Hutton ML, Dickson DW (2007) TDP-43 immunoreactivity in hippocampal sclerosis and
Alzheimer's disease. Ann Neurol 61, 435-445.
[74] Bigio EH, Mishra M, Hatanpaa KJ, White CL, 3rd, Johnson N, Rademaker A, Weitner
BB, Deng HX, Dubner SD, Weintraub S, Mesulam M (2010) TDP-43 pathology in
primary progressive aphasia and frontotemporal dementia with pathologic Alzheimer
disease. Acta Neuropathol 120, 43-54.
! 36!
[75] Davidson YS, Raby S, Foulds PG, Robinson A, Thompson JC, Sikkink S, Yusuf I, Amin
H, DuPlessis D, Troakes C, Al-Sarraj S, Sloan C, Esiri MM, Prasher VP, Allsop D,
Neary D, Pickering-Brown SM, Snowden JS, Mann DM (2011) TDP-43 pathological
changes in early onset familial and sporadic Alzheimer's disease, late onset Alzheimer's
disease and Down's syndrome: association with age, hippocampal sclerosis and clinical
phenotype. Acta Neuropathol 122, 703-713.
[76] Uryu K, Nakashima-Yasuda H, Forman MS, Kwong LK, Clark CM, Grossman M, Miller
BL, Kretzschmar HA, Lee VM, Trojanowski JQ, Neumann M (2008) Concomitant TAR-
DNA-binding protein 43 pathology is present in Alzheimer disease and corticobasal
degeneration but not in other tauopathies. J Neuropathol Exp Neurol 67, 555-564.
[77] Jack CR, Jr., Knopman DS, Jagust WJ, Petersen RC, Weiner MW, Aisen PS, Shaw LM,
Vemuri P, Wiste HJ, Weigand SD, Lesnick TG, Pankratz VS, Donohue MC, Trojanowski
JQ (2013) Tracking pathophysiological processes in Alzheimer's disease: an updated
hypothetical model of dynamic biomarkers. Lancet Neurol 12, 207-216.
[78] Osborn AGS, Karen L; Jhaveri, Miral D. (2016) Lacunar Infarction In Diagnostic
Imaging: Brain, Inc. E, ed., Philadelphia, PA.
[79] Whitwell JL, Weigand SD, Shiung MM, Boeve BF, Ferman TJ, Smith GE, Knopman DS,
Petersen RC, Benarroch EE, Josephs KA, Jack CR, Jr. (2007) Focal atrophy in dementia
with Lewy bodies on MRI: a distinct pattern from Alzheimer's disease. Brain 130, 708-
719.
[80] Vemuri P, Simon G, Kantarci K, Whitwell JL, Senjem ML, Przybelski SA, Gunter JL,
Josephs KA, Knopman DS, Boeve BF, Ferman TJ, Dickson DW, Parisi JE, Petersen RC,

! 37!
Jack CR, Jr. (2011) Antemortem differential diagnosis of dementia pathology using
structural MRI: Differential-STAND. Neuroimage 55, 522-531.
[81] Duchesne S, Valdivia F, Mouiha A, Robitaille N, Alzheimer's Disease Neuroimaging I
(2015) Single time point high-dimensional morphometry in Alzheimer's disease: group
statistics on longitudinally acquired data. Neurobiol Aging 36 Suppl 1, S11-22.
[82] Coupe P, Fonov VS, Bernard C, Zandifar A, Eskildsen SF, Helmer C, Manjon JV,
Amieva H, Dartigues JF, Allard M, Catheline G, Collins DL, Alzheimer's Disease
Neuroimaging I (2015) Detection of Alzheimer's disease signature in MR images seven
years before conversion to dementia: Toward an early individual prognosis. Hum Brain
Mapp.
[83] Kim GH, Lee JH, Seo SW, Kim JH, Seong JK, Ye BS, Cho H, Noh Y, Kim HJ, Yoon
CW, Oh SJ, Kim JS, Choe YS, Lee KH, Kim ST, Hwang JW, Jeong JH, Na DL (2015)
Hippocampal volume and shape in pure subcortical vascular dementia. Neurobiol Aging
36, 485-491.

!
TABLES
Table 1 Radiological-pathological correlation studies of aging and AD using in vivo MRI
Study Subjects Source MRI resolution
Images Interval from last MRI to death
Radiologic variable(s) examined
Histopathologic variable(s) examined
Main findings
Brilliant 1995 [67]
94 probable AD 45 possible AD Diagnoses were clinical *Only 11 participants underwent autopsy *3/11 cases also had a neuropathological diagnosis of Parkinson’s disease
Center for Alzheimer Disease and Related Disorders at Southern Illinois University School of Medicine
1.5T PD T1 T2 *PD and T2 scans were used for WMH
2.5 ± 1.3 years Brain volume (cortical & ventricular), and WMH
Vascular pathology (arterio- and atherosclerosis, infarcts, microinfarcts), CAA, demyelination, gliosis. AD pathology (NFTs, SPs) and Lewy bodies were examined only for pathological confirmation of clinical diagnoses.
Grade 4 WMH (large confluent subcortical areas) (n=2): Axon and myelin loss and gliosis in areas of WMH. Arteriolar hyalinosis without sclerosis. CAA in one case.
Grade 3 WMH (thick, irregular periventricular rim) (n=2): Demyelination, gliosis, arteriolar hyalinosis without sclerosis, Large and micro infarcts and CAA in 1 case.
Grade 2 WMH (thin rim surrounding the lateral ventricles) (n=4): Mild demyelination. CAA, enlarged ventricles and microinfarcts with gliosis in 1 case. Severe atherosclerosis in 1 case.
Grade 1 WMH (small caps at the frontal and occipital horns) (n=2): No significant cerebrovascular disease.
Note. This study did not distinguish neuritic from diffuse plaques. Results are reported separately for each of the 11 autopsied cases in the original article but summarized here for brevity.
Jack 2002 [51]
23 AD 3 HS 3 DLB 2 FTD 1 NFTD 4 AD+DLB
Mayo AD Research Center/AD Patient Registry
1.5T T1 0.1 to 7.1 years
HV Cerebrovascular pathology, NFTs, and HS, as well as pathological evidence of
Lower HV = More hippocampal NFTs in persons with AD.
Lower HV is also found with AD, HS, FTD or NFTD pathologies (but not normal aging). Thus, HV atrophy is not specific to

! 39!
2 AD+HS 1 AD+infarct 2 FTD+HS 1 HS+DLB 25 controls Diagnoses were neuropathological
different dementias (e.g., DLB, FTD, etc.). SPs were examined only for pathological confirmation of AD.
AD.
Note. This study did not distinguish neuritic from diffuse plaques.
Silbert 2003 [47]
24 probable AD 15 nondemented controls Diagnoses were clinical
Oregon Aging and AD Center
1.5T T1 1.2 to 82.8 months
Brain volume (whole-brain, ventricular & individual regions)
AD pathology (NFTs, SPs), vascular disease (infarcts, hemorrhage, and atherosclerotic large vessel narrowing)
Cross-sectionally:
Lower whole-brain and higher ventricular volumes = More cortical NFTs, only if cognitive impairment was present.
Higher ventricular volume = More SPs, only if cognitive impairment was present.
Lower HV = More hippocampal NFTs.
Rates over time:
Faster total ventricular expansion = more cortical NFTs and SPs (best predictor).
Faster rate of cerebral atrophy = more NFTs (less sensitive biomarker).
Rate of HV atrophy = not associated with severity/progression of NFTs.
Note. This study did not distinguish neuritic from diffuse plaques.
Csernansky 2004 [68]
10 AD 3 controls Diagnoses were neuropathological
AD Research Center at Washington University School of Medicine
1.5T T1 2.2 years (range 0.75-4 years)
HV NFTs and senile plaques (total, cored, and NPs together)
Lower HV = More hippocampal NFTs in the CA1 subfield of the hippocampus.
HV = Stronger correlation with hippocampal NFT density than plaque density.
Total cerebral volume = Stronger correlation with hippocampal plaque
! 40!
density than NFT density.
Note. This study did not distinguish neuritic from diffuse plaques.
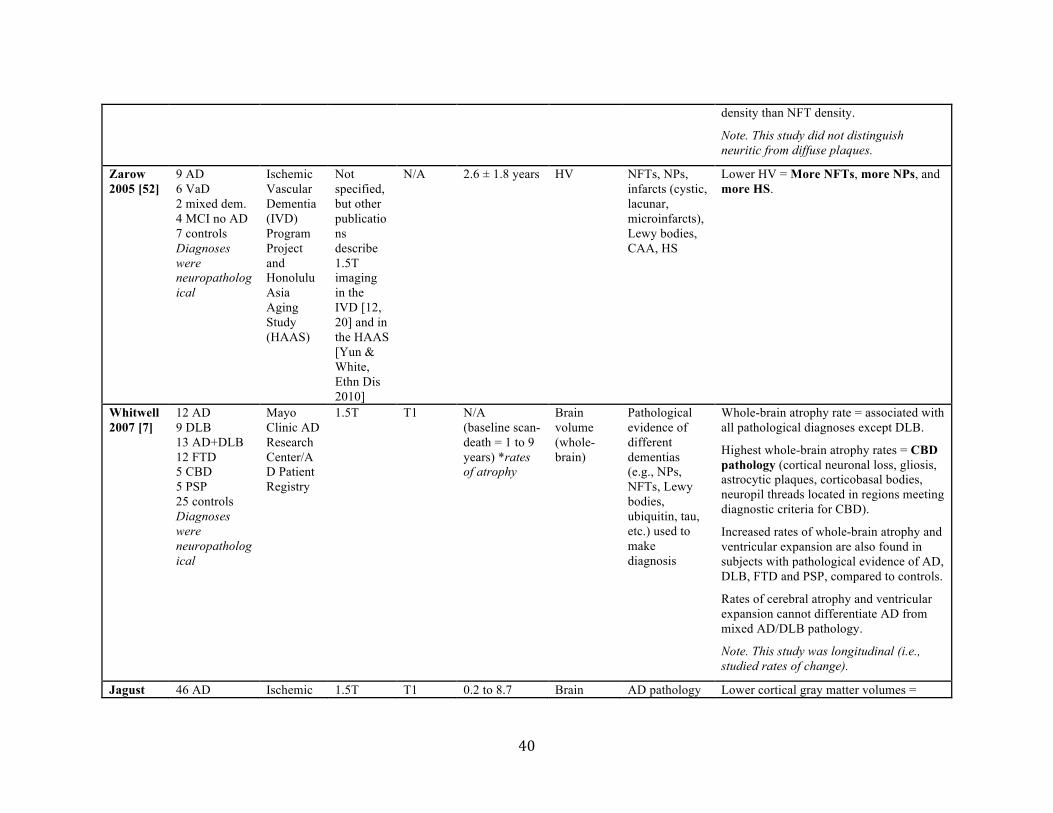
Zarow 2005 [52]
9 AD 6 VaD 2 mixed dem. 4 MCI no AD 7 controls Diagnoses were neuropathological
Ischemic Vascular Dementia (IVD) Program Project and Honolulu Asia Aging Study (HAAS)
Not specified, but other publications describe 1.5T imaging in the IVD [12, 20] and in the HAAS [Yun & White, Ethn Dis 2010]
N/A 2.6 ± 1.8 years HV
NFTs, NPs, infarcts (cystic, lacunar, microinfarcts), Lewy bodies, CAA, HS
Lower HV = More NFTs, more NPs, and more HS.
Whitwell 2007 [7]
12 AD 9 DLB 13 AD+DLB 12 FTD 5 CBD 5 PSP 25 controls Diagnoses were neuropathological
Mayo Clinic AD Research Center/AD Patient Registry
1.5T T1 N/A (baseline scan-death = 1 to 9 years) *rates of atrophy
Brain volume (whole-brain)
Pathological evidence of different dementias (e.g., NPs, NFTs, Lewy bodies, ubiquitin, tau, etc.) used to make diagnosis
Whole-brain atrophy rate = associated with all pathological diagnoses except DLB.
Highest whole-brain atrophy rates = CBD pathology (cortical neuronal loss, gliosis, astrocytic plaques, corticobasal bodies, neuropil threads located in regions meeting diagnostic criteria for CBD).
Increased rates of whole-brain atrophy and ventricular expansion are also found in subjects with pathological evidence of AD, DLB, FTD and PSP, compared to controls.
Rates of cerebral atrophy and ventricular expansion cannot differentiate AD from mixed AD/DLB pathology.
Note. This study was longitudinal (i.e., studied rates of change).
Jagust 46 AD Ischemic 1.5T T1 0.2 to 8.7 Brain AD pathology Lower cortical gray matter volumes =

! 41!
2008 [53]
14 VaD 9 AD/VaD 12 cognitive impairment without significant pathology 12 controls Diagnoses were neuropathological
Vascular Dementia (IVD) Program Project
years volume (whole-brain & HV), as well as MRI evidence of CVD (WMH, lacunes)
(NFTs, NPs), HS, infarcts (cortical, subcortical, cystic, lacunar, microinfarcts), white matter infarcts, demyelination
More AD pathology (composite NFT + NP score), arteriosclerosis and subcortical infarcts.
Lower HV = More AD pathology (composite NFT + NP score) and HS.
More WMH = white matter infarcts and demyelination. No association with AD pathology or CAA.
Josephs 2008(a) [48]
45 subjects with pathological diagnoses of low, intermediate or high probability of AD (32 with clinical dementia, 13 cognitively normal) Pathologies other than AD were excluded (e.g., cortical infarcts, HS)
Mayo AD Research Center/AD Patient Registry
Not specified, but other publications describe 1.5T imaging in the Mayo AD Research Center/AD Patient Registry [2,8,14,26]
T1 FLAIR
0 to 3 years Brain volume (whole-brain & ventricular)
Primary outcome measure was amyloid-beta burden score (both NPs and total SPs considered); NFTs were only considered for diagnostic purposes
No association between NP or total SP amyloid-beta burden score and brain or ventricular volumes.
No association between cerebral atrophy or ventricular expansion and the degree of vascular pathology (assessed by WMH and lacunar infarcts visible on MRI).
Post-hoc findings:
Faster rates of whole-brain atrophy = More NFTs.
Faster ventricular expansion = More NFTs.
Note. This study was longitudinal (i.e., studied rates of change).
Josephs 2008(b) [66]
84 AD (29 with TDP-43 and 55 without TDP-43) 84 controls Diagnoses were neuropathological
Mayo AD Research Center/AD Patient Registry
1.5T T1 3.8 ± 2.6 years (AD with TDP-43) 3.5 ± 2.3 years (AD without TDP-43)
Patterns of gray matter loss *Voxel-based morphometry study.
Main variable of interest was TDP-43 in the medial temporal lobe; NFTs and NPs were examined primarily for pathological confirmation
AD with and without TDP-43 compared to controls = similar pattern of gray matter loss (i.e., medial temporal lobes and temporoparietal neocortex).
AD with TDP-43 compared to AD without TDP-43 = greater volume loss in medial temporal lobe, particularly the hippocampus.
No differences between HS and no HS in

! 42!
*Only AD participants underwent autopsy
of AD. Lewy bodies and HS also recorded.
AD subjects with TDP-43.
Vemuri 2008 [54]
101 AD Diagnoses were neuropathological
Mayo AD Research Center/AD Patient Registry
1.5T T1 0.1 to 10.5 years (within 48 months for patients with Braak stages II-VI)
STAND scores (AD-type atrophy)
NFTs, NPs Higher STAND scores (i.e., more AD-typical atrophy) = More NFT and more NPs.
NFTs correlate better with STAND scores than with HV.
Whitwell 2008 [55]
83 AD 20 controls Diagnoses were neuropathological
Mayo AD Research Center/AD Patient Registry
Not specified, but other publications describe 1.5T imaging in the Mayo AD Research Center/AD Patient Registry [2,8,14,26]
T1 Within 4 years Patterns of gray matter loss *Voxel-based morphometry study.
NFTs, argyrophilic grains, Lewy bodies, tau burden
Braak stages III-IV = no regions of gray matter loss compared to Braak stages 0-II; patterns of gray matter loss associated with tau burden
Braak stages V-VI = graded pattern of increasing atrophy associated with Braak stage
Braak stage V = atrophy in temporal, parietal and frontal lobes only
Braak stage VI = basal forebrain, posterior cingulate, precuneus, anterior cingulate, insula, subcortical nuclei, and occipital lobe including the primary visual cortex also involved
High tau burden (≥10%) = greater gray matter loss in medial and lateral temporal lobes
Burton 2009 [56]
11 AD 23 DLB 12 VCI Diagnoses were neuropathological
Newcastle Brain Tissue Resource
1.0T 1.5T
T1 1.62 ± 1.09 years (AD) 1.53 ± 1.07 years (DLB) 2.04 ± 1.51 years (VCI)
Brain volume (MTL)
NFTs, NPs, Lewy bodies, micro and macroscopic vascular disease
Lower MTL volume = more NFTs, more hippocampal NPs, and more hippocampal NFTs.
No association between MTL volume and Lewy bodies.
Age and NFTs are the only predictors of MTL atrophy.
MTL atrophy = Highly accurate diagnostic

! 43!
marker for AD (91% sensitivity, 94% specificity) compared with DLB and VCI.
Erten-Lyons 2009 [57]
36 subjects with high levels of AD pathology at autopsy (24 with clinical dementia, 12 cognitively intact)
National Institute on Aging (NIA)-OHSU Layton Aging and AD Center
1.5T T1
3.63 ± 2.9 years (AD) 0.86 ± 0.52 years (controls)
Brain volume (whole-brain & individual regions)
Ischemic, hemorrhagic, or vascular pathology, CAA, large vessel strokes, lacunes, Lewy bodies, HS, arteriosclerosis. NFTs and NPs were assessed to recruit subjects with high levels of AD pathology.
Both demented and cognitively intact subjects showed high levels of AD pathology, but different amounts of whole-brain and HV atrophy. This suggests that atrophy is not caused solely by NFTs and NPs.
No significant association between the presence of vasculopathy and whole-brain or regional volumes.
Note. Authors did not examine atrophy in subjects with low pathology burden.
Burton 2012 [64]
8 AD 23 DLB Diagnoses were neuropathological
Newcastle Brain Tissue Resource
1.0T 1.5T
T1 1.5 ± 1.0 years Brain volume (amygdala, hippocampus & entorhinal cortex)
AD pathology (NFTs, NPs, dystrophic neuritis), Lewy bodies
No significant correlation between amygdala, hippocampus and entorhinal cortex and the burden of NFTs, NPs and Lewy bodies, excepted a positive correlation between HV and percent area of Lewy bodies in the hippocampus.
HV can differentiate between AD and DLB (lower HV and amygdala volume in AD).
Kantarci 2012 [58]
21 DLB (only 3 went to autopsy) 21 AD (only 2 went to autopsy) 42 cognitively normal (none went to autopsy)
Mayo Clinic AD Research Center/Mayo Clinic Study of Aging
3.0T T1 10 to 18 months
Brain volume (whole-brain & individual regions) Also PiB and PET imaging, but not
NFTs, NPs Overall, smaller HV = More AD pathology.
Case 1: Significant HV atrophy = Braak Stage IV & frequent NPs.
Case 2: Moderate HV atrophy = Braak Stage II, sparse NPs.
Case 3: Mild HV atrophy = Braak Stage III, sparse NPs.
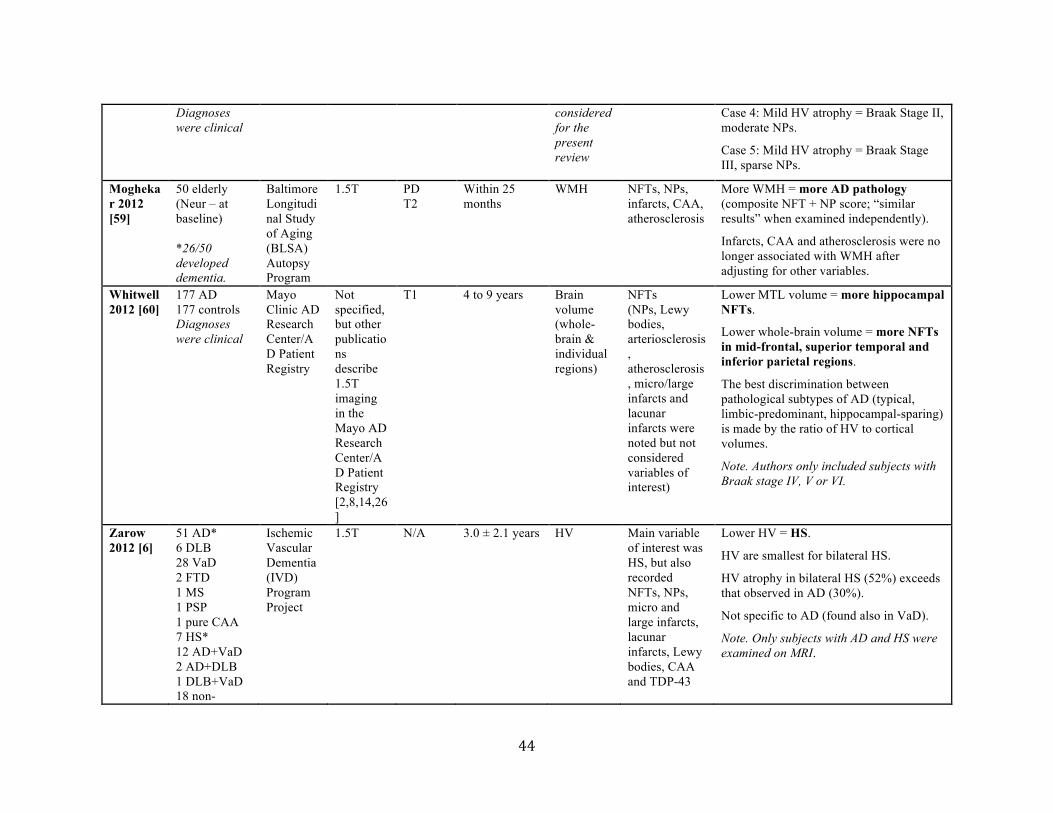
! 44!
Diagnoses were clinical
considered for the present review
Case 4: Mild HV atrophy = Braak Stage II, moderate NPs.
Case 5: Mild HV atrophy = Braak Stage III, sparse NPs.
Moghekar 2012 [59]
50 elderly (Neur – at baseline) *26/50 developed dementia.
Baltimore Longitudinal Study of Aging (BLSA) Autopsy Program
1.5T PD T2
Within 25 months
WMH NFTs, NPs, infarcts, CAA, atherosclerosis
More WMH = more AD pathology (composite NFT + NP score; “similar results” when examined independently).
Infarcts, CAA and atherosclerosis were no longer associated with WMH after adjusting for other variables.
Whitwell 2012 [60]
177 AD 177 controls Diagnoses were clinical
Mayo Clinic AD Research Center/AD Patient Registry
Not specified, but other publications describe 1.5T imaging in the Mayo AD Research Center/AD Patient Registry [2,8,14,26]
T1 4 to 9 years Brain volume (whole-brain & individual regions)
NFTs (NPs, Lewy bodies, arteriosclerosis, atherosclerosis, micro/large infarcts and lacunar infarcts were noted but not considered variables of interest)
Lower MTL volume = more hippocampal NFTs.
Lower whole-brain volume = more NFTs in mid-frontal, superior temporal and inferior parietal regions.
The best discrimination between pathological subtypes of AD (typical, limbic-predominant, hippocampal-sparing) is made by the ratio of HV to cortical volumes.
Note. Authors only included subjects with Braak stage IV, V or VI.
Zarow 2012 [6]
51 AD* 6 DLB 28 VaD 2 FTD 1 MS 1 PSP 1 pure CAA 7 HS* 12 AD+VaD 2 AD+DLB 1 DLB+VaD 18 non-
Ischemic Vascular Dementia (IVD) Program Project
1.5T N/A 3.0 ± 2.1 years HV Main variable of interest was HS, but also recorded NFTs, NPs, micro and large infarcts, lacunar infarcts, Lewy bodies, CAA and TDP-43
Lower HV = HS.
HV are smallest for bilateral HS.
HV atrophy in bilateral HS (52%) exceeds that observed in AD (30%).
Not specific to AD (found also in VaD).
Note. Only subjects with AD and HS were examined on MRI.

! 45!
demented controls Diagnoses were neuropathological *Only subjects with AD and HS were examined on MRI.
Erten-Lyons 2013(a) [49]
71 elderly (Neur – at baseline) *44/71 developed cognitive impairment (20 AD, 5 VaD, 16 MCI, and 3 mixed dementia).
Oregon Brain Aging Study
1.5T N/A 15.36 ± 9.96 months
Brain volume (whole-brain, ventricular & HV)
NFTs, NPs, CAA, lacunar infarcts, large-vessel strokes, gross and microinfarcts, Lewy bodies, HS
Whole-brain atrophy = no pathological correlates.
Ventricular expansion = infarcts, NFTs and NPs.
HV atrophy = CAA.
Ventricular expansion, compared with total brain and HV atrophy, have the strongest association with neuropathological measures of AD and vascular disease.
Note. This study was longitudinal (i.e., studied rates of change).
Erten-Lyons 2013(b) [50]
66 elderly (Neur – at baseline) *42/66 developed cognitive impairment (22 AD, 3 VaD, 16 MCI, 1 mixed dementia).
Oregon Brain Aging Study
1.5T PD T1 T2 *PD and T2 were used for WMH
15.3 ± 9.8 months
WMH NFTs, NPs, CAA, Lewy bodies, lacunar infarcts, large-vessel strokes, microinfarcts, myelin pallor, arteriolosclerosis, atherosclerosis
More WMH = more arteriolosclerosis, myelin pallor and NFTs.
Note. This study was longitudinal (i.e., studied accumulation of WMH over time).
Toledo 22 MCI or Alzheimer 1.5T T1 N/A Brain AD pathology Lower left HV = increased MTL TDP-

! 46!
2013 [61]
AD* Diagnoses were clinical *18/22 cases had another neuropathological diagnosis in addition to AD
’s Disease Neuro-imaging Initiative
(baseline-death = 80.9 to 289.0 weeks)
volume (occipital & HV)
(NFTs, NPs, diffuse plaques) as well as pathological evidence of other dementias (Lewy bodies) or MTL pathology (TDP-43 proteinopathy, argyrophilic grain disease, HS)
43.
No difference in HV or occipital gray matter volume between mixed AD/DLB, compared to AD alone.
van Veluw 2013 [69]
22 elderly (Neur -)
Community Sample, Utrecht (The Netherlands)
3.0T (7.0T)
T1 T2 FLAIR
Not applicable *in vivo MRI study with histopathologic validation of similar appearing lesions on ex vivo MRI
Microinfarcts
Microinfarcts Low correlation between microinfarcts visible on 3.0T MRI and microinfarcts present at autopsy.
Microinfarcts 1mm³ can be detected in vivo with clinical resolution 7.0T MRI as hyperintensities on FLAIR and T2-weighted scans. 3.0T MRI has significantly decreased sensitivity for detecting microinfarcts in vivo.
Josephs 2014(a) [40]
342 AD (195 with TDP-43 and 147 without TDP-43) Diagnoses were neuropathological *Only 248 AD participants had antemortem
Mayo AD Research Center/AD Patient Registry
Not specified, but other publications describe 1.5T imaging in the Mayo AD Research Center/AD Patient Registry
T1 SPGR
N/A Brain volume (amygdala, hippocampus, entorhinal cortex, occipitotemporal cortex, lateral temporal lobe & lateral
Main variable of interest was TDP-43; but also recorded NFTs, NPs, Lewy bodies and HS
Lower hippocampal and entorhinal cortex volumes = higher TDP-43 stage (based on regional distribution).

! 47!
MRI [2,8,14,26]
frontal lobe)
Josephs 2014(b) [38]
342 AD (195 with TDP-43 and 147 without TDP-43) 46 controls Diagnoses were neuropathological *Only 248 AD participants had antemortem MRI
Mayo AD Research Center/AD Patient Registry
1.5T (for 220 subjects; not specified for the others)
T1 SPGR
N/A Brain volume (medial temporal regions & association cortices) & patterns of gray matter loss (voxel-based morphometry)
Main variable of interest was TDP-43; but also recorded NFTs, NPs, Lewy bodies, infarcts and HS
AD with TDP-43 compared to AD without TDP-43 = lower hippocampus, amygdala and entorhinal cortex volumes after accounting for other variables & greater medial temporal loss on voxel-based morphometry.
Lower hippocampal volume remains significantly associated with the presence of TDP-43 even after accounting for HS.
Higher TDP-43 burden = increased volume loss.
Higher TDP-43 distribution = increased volume loss.
Kaur 2014 [62]
59 elderly (11 with clinical dementia, 48 nondemented)
Framingham Heart Study
1.0T T2 2.67 ± 1.76 years (controls) 4.82 ± 2.24 years (dementia)
Brain volume (whole-brain & individual regions) & WMH
NFTs, NPs, HS, gross infarcts, microinfarcts, lacunes, atherosclerosis, arteriosclerosis, white matter disease
Lower whole-brain volume = More NFTs and more NPs.
Lower HV = More cortical NFTs, more noncavitated & subcortical microinfarcts, and more HS.
More ventricular expansion = More NFTs and more NPs.
More WMH = More deep nuclei microinfarcts.
MRI volumes correlate better with NFTs than SPs.
Raman 2014 [63]
66 elderly (22 with microinfarcts at autopsy, 44 without microinfarcts)
Mayo Clinic AD Research Center/AD Patient Registry/ Mayo Clinic
1.5T 3.0T
T1 FLAIR
0.11 to 3.29 years
Brain volume (whole-brain & HV), WMH and infarcts
Main variable of interest was microinfarcts; but also recorded NFTs, NPs, and CAA
Whole-brain atrophy rate of change = Greater in subjects with microinfarcts.
HV atrophy = No association with microinfarcts.
WMH = No association with microinfarcts.
The presence and number of cortical and

! 48!
Study of Aging
subcortical infarcts detected on MRI are related to microinfarcts at autopsy.
Shim 2015 [65]
26 AD 17 advanced risk for CVD 14 controls Diagnoses were clinical *Only brains from 14 participants were used to study neuropathological correlates of WMH
Washington University School of Medicine Memory and Aging Project
1.5T FLAIR N/A (last clinical evaluation-autopsy = 6.12 ± 3.26 years)
WMH (total, periventricular & subcortical), ventricular volume
NFTs, NPs, vascular pathology (atherosclerosis, arteriolosclerosis, CAA, infarcts, microinfarcts, lacunes, hemorrhages, subcortical arteriosclerotic leukoencephalopathy)
Higher total and periventricular WMH volume = lower Braak NFT stage, more arteriosclerosis, more severe breakdown of the ventricular lining and less periventricular vessels
Higher subcortical WMH volume = less SPs, more demyelination, more microinfarcts and more cerebral hemorrhages
Higher ventricular volume = less deep white matter demyelination.
AD Alzheimer’s disease; CA1 cornu ammonis area 1; CBD corticobasal degeneration; CJD Creutzfeldt-Jakob disease; CSF cerebrospinal fluid; CVD cerebrovascular disease; DLB dementia with Lewy bodies; FTD fronto-temporal degeneration; HS hippocampal sclerosis; HV hippocampal volume; MCI mild cognitive impairment; MRI magnetic resonance imaging; MTL medial temporal lobe; Neur - no neurological disease; NFT neurofibrillary tangle; NFTD neurofibrillary tangle-only degeneration; NP neuritic plaque; PD proton density; PSP progressive supranuclear palsy; SP senile plaque; VaD vascular dementia; VCI vascular cognitive impairment; WMH white matter hyperintensities.

! 49!
Table 2 Relevant coefficients from studies included in the review
MRI Biomarker
Num
ber
of su
bjec
ts
Diff
use
plaq
ues
Neu
ritic
pla
ques
NFT
Bra
ak st
age
Art
erio
scle
rosi
s
Art
erio
losc
lero
sis
Mic
roin
farc
ts
Cer
ebra
l he
mor
rhag
es
Cer
ebra
l Am
yloi
d A
ngio
path
y
Hip
poca
mpa
l Sc
lero
sis
TD
P-43
Los
s of v
entr
icul
ar
linin
g
Dee
p W
M
dem
yelin
atio
n
P-va
lue
Rem
arks
Ref
eren
ce
Whole-Brain Volume
59
12
45 59
39
39
71
-0.03(β)
-0.68(ρ)
0.419 (R2)
0.192 (R2)
-0.54(ρ)
-0.15(β)
-0.13(β)
0.01
0.01
<0.001
0.016
<0.001
<0.01
0.03
SPs density in the hippocampus
Whole-brain boundary shift integral, adjusted for age at second scan and
tome from second scan to death
Rate of CNS volume decrease and
cortical NFTs
Final CNS volume and cortical NFTs
Age x CAA and total brain volume change as proportion of intracranial volume (%) – mixed-effect model
[62]
[68] [48]
[62]
[47]
[47]
[49]
aSTAND-Score 101 101
0.52(ρ) 0.62(ρ)
<0.0001 <0.0001
CERAD NP counts [54] [54]
Ventricular Volume
59
39
39
71
59
39
39
45 14
0.03(β)
0.397 (R2)
0.254 (R2)
0.05(β)
0.422 (R2)
0.371 (R2)
0.22(β)
0.39(ρ)
-0.509 (ρ)
0.001 <0.001
<0.01
0.001
0.001
<0.001
<0.0001
0.022
0.032
Logarithm of temporal horn volume
Rate of ventricular CSF volume increase and cortical SPs
Final ventricular CSF volume and
cortical SPs
Age x CERAD SP burden moderate of frequent and ventricular volume
change as proportion of intracranial volume (%) – mixed-effect model
Logarithm of temporal horn volume
Rate of ventricular CSF volume
increase and cortical NFTs
Final ventricular CSF volume and cortical NFTs
Ventricular boundary shift integral, adjusted for age at second scan and
tome from second scan to death
Ventricular Index
[62]
[47]
[47] [49]
[62]
[47] [47] [48]
[65]
Medial Temporal Lobe
46
0.365(ρ)
0.014
Medial temporal lobe atrophy rating and percent area of Aβ plaques in the
hippocampus
[56]

! 50!
Volume 46
46
195
0.486(ρ)
0.504(ρ)
-0.024 -0.012 -0.005
(β)
<0.001
0.001
0.02 <0.001
0.02
Medial temporal lobe atrophy rating
Medial temporal lobe atrophy rating
and percent area of NFT in the hippocampus
Hippocampus, entorhinal cortex and amygdala volumes (respectively) as a percentage of total intracranial volume
and quantitative TDP-43 burden
[56] [56]
[38]
Hippocampal Volume
28
67
28
12
12
101
12
12
59
59
71
93
59
28
-0.75(ρ) -0.39(ρ)
-0.73(ρ) -0.80(ρ)
-0.76(ρ)
-0.4(ρ)
-0.62(ρ) -0.55(ρ)
0.64(β)
0.57(β)
-0.0008
(β)
-0.02(β)
-1.23(β) -0.63(ρ)
0.0001
<0.01
0.0002
0.002
0.004 0.0001
0.03
0.06
0.015
0.036
0.009
0.009
<0.001
0.003
Association with number of neurons in CA1, which is associated with
hippocampal atrophy
Bilateral hippocampal W score Association with number of neurons in
CA1, which is associated with hippocampal atrophy
Left hippocampus
Right hippocampus
Hippocampal W-score
Left hippocampus volume, NFT
pathology in CA1
Right hippocampus volume, NFT pathology in CA1
Noncavitated microinfarcts
Subcortical microinfarcts
Age x CAA and hippocampal volume change as proportion of intracranial volume (%) – mixed-effect model
Association with number of neurons in
CA1, which is associated with hippocampal atrophy
[52]
[51] [52]
[68]
[68] [54] [68]
[68]
[62] [62] [49]
[53]
[62] [52]
Total WMH Volume
66
66
59
57
57
14
0.05(β)
-0.268
(ρ)
0.213(ρ)
0.05(β)
0.53(β)
0.559(ρ)
0.008
<0.0001
0.016
0.023
0.058
0.019
Braak (5 or 6 vs 0,1, or 2) x time – mixed-effect model
Arteriolosclerosis (high vs low) x time
– mixed-effect model
Logarithm of WMH volume and deep nuclei microinfarcts
[50]
[50]
[62] [65]
[65]
[65] Periventricular 57 -0.276 0.02 [65]

! 51!
WMH Volume
57
14
(ρ)
0.260(ρ)
0.559(ρ)
0.027
0.019
[65]
[65]
Deep (subcortical)
WMH Volume
57
57
57
14
-0.234 (ρ)
0.259(ρ)
0.344(ρ)
0.571(ρ)
0.041
0.027
0.004
0.016
Cortical microinfarcts
[65]
[65]
[65]
[65]
Aβ amyloid beta; CAA cerebral amyloid angiopathy; CA1 cornu ammonis area 1; CNS central nervous system; CSF cerebrospinal fluid; HS hippocampal sclerosis; HV hippocampal volume; MRI magnetic resonance imaging; MTL medial temporal lobe; NFT neurofibrillary tangle; NP neuritic plaques; SP senile plaque; TDP-43 TAR DNA-binding protein of 43 kDa; WM white matter; WMH white matter hyperintensities.

! 52!
FIGURES
Figure 1 PRISMA flow diagram through the different phases of the systematic review

! 53!
Figure 2 Significance of radiological-pathological correlations in Alzheimer’s disease using in vivo MRI (n=27 studies).
CAA cerebral amyloid angiopathy; HS hippocampal sclerosis; HV hippocampal volume; MTL medial temporal lobe atrophy; NFT neurofibrillary tangle; NP neuritic plaque; TDP-43 TAR DNA-binding protein of 43 kDa; WM white matter; WMH white matter hyperintensities.

! 54!
Figure 3 Neuropathology and assessment of Alzheimer’s disease.
Aβ amyloid beta; CAA cerebral amyloid angiopathy; HS hippocampal sclerosis; NFT neurofibrillary tangle; TDP-43 TAR DNA-binding protein of 43 kDa; WMH white matter hyperintensities.
AD-related anatomic changes
Vascular lesions
Aβ plaques NFTs
Arterio/arteriolo/atherosclerosis Infarcts Bleedings
CAA
Medial temporal lobe
atrophy
WMH
Neuropathologicallesions
Lacunes
Ventricular expansion
Whole-brain atrophy
In vivo MRI-detected changes Clinicaldiagnosis
Cognitive impairment Death
Autopsy
HS
TDP-43