Radiological characterisation by means of 3D-laser ...
35
Transcript of Radiological characterisation by means of 3D-laser ...


Radiological characterisation by means of 3D-laser modelling and positioning
of measurements
Robert Hedvall1, Patrik Johansson
1, Peter Erixon
1, Fredrik Ekenborg
1, Feng Quanhong
2 and PA
Andersson3
1AB SVAFO,
2MultiInfo 3D Laser Scan Solution AB and
34A Consulting AB, Sweden
Abstract
AB SVAFO is a nuclear waste technology and decommissioning company based in Sweden in
the scenic surroundings of Studsvik on the Baltic coast. SVAFO is owned by the Swedish nuclear
power industry.
MultiInfo 3D Laser Scan Solution AB is a technical consult company focusing on the
development and solution of 3D laser scanning techniques and its applications in different fields.
For better viewing we are using a 3D-laser modelling of a building, national coordinates and using
radiological measurements from a database. It is then possible to visualize the contamination
situation in the whole building using a CAD-program. The results will be used for the upcoming
R2-reactor decommissioning and for visualisation of doserates and contamination levels in other
nuclear buildings.
For better documentation of radioactivity distribution of a decommissioned facility any object in a
building can be accurately measured in 3D and visualized in 3D-laser image in a CAD program
(e.g. AutoCAD), and then link to a database (e.g. SVALA), which have stored the measurements
of radioactivity by other tools (e.g. RFID-tags). The position of any measured object can also be
identified in 3D model and laser image, so the situation of contamination levels and distribution
can be monitored and visualized in 3D. The results will be used for visualisation of dose rates and
contamination levels in other nuclear buildings.
AB SVAFO’s main business is to take care of formerly state-owned spent nuclear waste at the site,
including small amounts of nuclear fuel. Buildings are also included, mainly nuclear waste storage
buildings and a research reactor. Some buildings have already been decommissioned with results
of contamination shown in long and not very clear tables. With 3D-modelling the results are
shown more clear.

1
Workshop on Radiological Characterisation for Decommissioning, Studsvik, Nyköping, Sweden 17 - 19 April 2012
Radiological characterisation by means of 3D-laser modelling and positioning
of measurements
Robert Hedvall1, Patrik Johansson
1, Peter Erixon
1, Fredrik Ekenborg
1, Feng Quanhong
2
1AB SVAFO,
2MultiInfo 3D Laser Scan Solution AB, Sweden
Introduction
AB SVAFO (SVAFO) is a nuclear waste technology and decommissioning company based in
Sweden in the scenic surroundings of Studsvik on the Baltic coast. SVAFO is owned by the
Swedish nuclear power industry. The company was created in 1992 by Sydsvenska Värmekraft
AB, Vattenfall AB, Forsmarks Kraftgrupp AB and Oskarshamns Kraftgrupp AB as a
consequence of the Act on the Financing of the Management of Certain Radioactive Waste, etc.
from 1988.
SVAFO’s main business is to take care of formerly state-owned spent nuclear waste at the site,
including small amounts of nuclear fuel. Buildings are also included, mainly nuclear waste
storage buildings and a research reactor. Some buildings have already been decommissioned with
results of contamination shown in long tables that are difficult to survey.
MultiInfo 3D Laser Scan Solution AB is a technical consulting company focused on the
development of 3D laser scanning techniques and their applications in different fields. The
specialist in the company has more than 12 years’ experience in 3D laser scanning techniques,
and has worked on some decommissioning projects in UK in particular, as well as experience of
working on the documentation and characterisation of some nuclear facilities like the nuclear
plant and the disposal tunnel of nuclear wastes.
In order to prepare better documentation and do a better characterisation of decommissioned (and
operative) facilities, the techniques of 3D laser scanning and control surveying are used for a case
study. The building was scanned by laser scanning, and all the scanning data was transformed into
the Swedish national coordinate system by control surveying, so the 3D model and 3D images of
the scanned building are in their real position in space. By using a 3D CAD model together with
3D panoramic laser images, the building can be visualised in 3D in much more detail in reality,
and the building and the objects in the building can be digitally viewed in 3D. Therefore, as the
location of radiological measurements are known, the contamination of the building can be
visualised in 3D CAD models and 3D images with its as-built situation. The results of this case
study can be used for upcoming decommissioning projects for documentation and visualisation of
dose rates and contamination levels.
3D laser scanning techniques have developed since the late 1990s, and are now more useful for
recording the as-built situation of an object in three dimensions. Compared to other techniques, 3D
laser scanning can quickly capture the 3D digital data, both 3D coordinates and 3D digital images,
with high scanning speed (e.g. up to more than 1 million points per second) and high resolution (at

2
the millimetre level). By control surveying, the as-built building can be quickly scanned and
converted into a global coordinate system, so any objects in the building have their exact position
in space. Based upon the laser scanning data, any object can be accurately measured in 3D, and
recognised in the high-resolution 3D laser image. In addition, the scanner is developed with
infrared laser, so there is no need for illumination during scanning, and the grey-scale laser image
can be captured in the dark. By using software, the scanning data can be processed with different
results such as a 3D digital model, 2D and 3D laser images, 3D coordinates of a point or an object
in a known coordinate system (e.g. national coordinate system), and these results are useful for
facility documentation and visualisation in 3D.
For better visualisation of the radioactivity distribution of a decommissioned (or operative) facility,
3D laser scanning techniques are used to capture the scanning point clouds first, and then created
both 3D digital models and 3D laser images with software, so any object in a building can be
accurately measured in the 3D model and visualised in 3D laser images in a CAD program (e.g.
AutoCAD), and then linked to a database (e.g. SVALA), in which the stored measurements of
radioactivity are stored.
Results
By using laser scanning, the building and objects can be scanned and visualised in the as-built
model in a 3D CAD model and 3D panoramic images, see Figure 1 and Figure 2, and then the
position of any parts of the building and objects can be captured as coordinates and linked to the
radiological measurements in the database, SVALA.
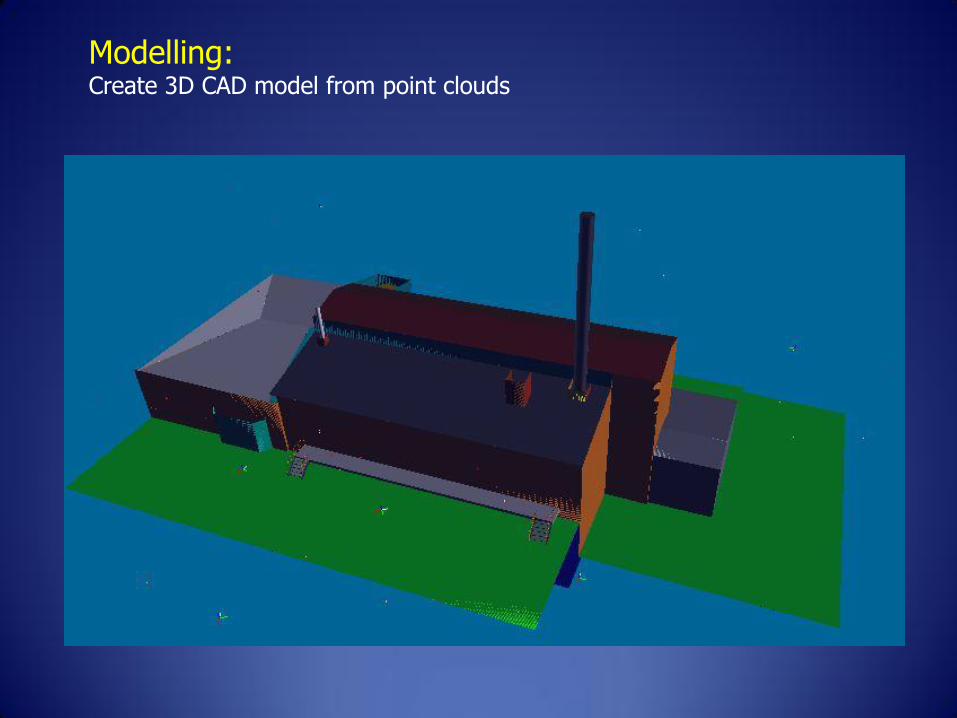
Figure 1. 3D CAD model of a part on the top floor (HM building)

3
Figure 2. 3D Laser image of a part on the top floor (HM building)
Combining the position coordinates and the radiological measurements, the contamination
situation of a building can be visualised in the scanned 3D model with different symbols in colours
and sizes, see Figure 3.

4
Figure 3. Different symbols show radiological measurements in a 3D model of a room
Summary
The technique of 3D laser scanning and 3D visualisation methods can be used for upcoming
decommissioning projects, and improve the documentation and characterisation methods.
More benefits are provided by using 3D digital models compared to traditional methods, like
taking photos and taking notes in a notebook etc. There are also more benefits for project planning
and administration.
Measure distances
The distance between objects can be measured directly on a 3D digital model, and the position of
the object can be shown with its coordinates. In addition, if the objects are not physically
accessible, like an object on the roof, or thickness of a room, it can be measured in the 3D model.
Show changes
For a decommissioning project, it is often required to design and optimise the dismantling
procedure for a facility. This is often done by obtaining a design model and then conducting
simulations with virtual reality software. However, the design model is often quite different from
the as-built situation, because many changes and renovations are made during operation. In this
case, a 3D model from laser scanning is useful and can provide the detailed information on the as-
built situation and even help in updating the dismantling situation in an on-going decommissioning
project. The dismantling procedure can then be optimised, and the simulation becomes closer to
reality.

5
Simulating the dismantling
The laser scanning results can be useful when simulating the dismantling procedure with a 3D
CAD model. In a 3D CAD model from laser scanning, any part, like a pipe or a wall, can be
removed or hidden (not permanently removed), making it useful in simulating the dismantling
procedure.
Design and optimise
It can also be useful when using scanning data, including point clouds and 3D images, to design
and optimise the dismantling procedure. In addition, a 3D CAD model only shows the large parts,
but laser scanning can provide the relationship information in a 3D CAD model by linking to point
clouds and 3D images, which are important as a reference to show the detailed surroundings. This
can help in monitoring the progressing condition and optimising the dismantling procedure.
Training
A 3D model and laser images can help in training the new employees to be familiar with the
environmental conditions in a real situation. After looking through a 3D CAD model, the 3D laser
image and point clouds not only show the detailed situation of a facility, but also show the exact
position in the model so training can be provided in the virtual reality of the digital model, instead
of visiting the place, which can minimise radiation doses. In addition, the as-built situation of a
facility is also useful to educate the student and technical personnel to understand the installation
and the detailed arrangement of a nuclear facility, because the design model is often different from
the as-built model.
Waste volumes
For a decommissioning project, the scanning results can be used to calculate and estimate the
volume of the waste, like volume of pipes and tanks or length of beams, which is useful for waste
management. A pipe in a 3D CAD model shows more information, like diameter and length so the
volume of the pipe can be calculated.

AB SVAFO MultiInfo 3D Laser Scan Solution AB

Field work:
GPS measuring:
- 4 points
- Coordinate system:
Sveref99 (X-Y), RH00 (Z)
Reference surveying with TS:
- 275
Laser scanning:
- 108


4
Pre-processing: Register all scans into the same coordinate system as a point cloud
Modelling:
Create 3D CAD model
Create 3D laser image
Link 3D CAD model and 3D laser image
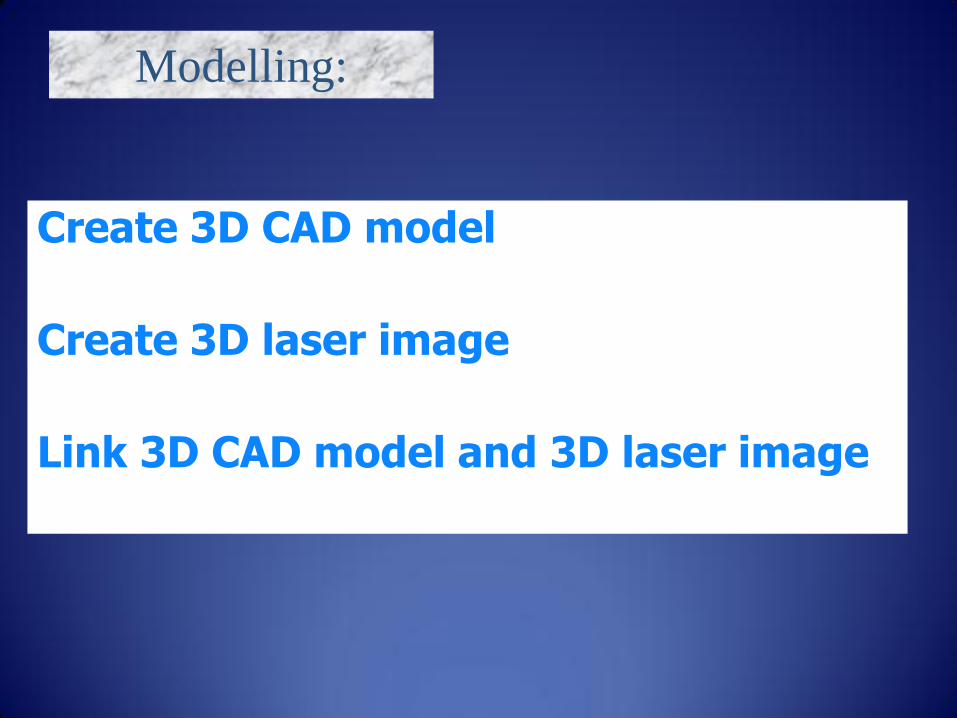
Modelling: Create 3D CAD model from point clouds

7

8

9

10

11

12
Potential possibility: 3D measurement in point clouds and 3D model

13

14

15

AutoCAD platform
Laserscanning SVALA-database
Different 3D data: - 3D CAD model - 3D laser image - 3D coordinates - Point cloud - Cross-section
3D visualizing with Data i Svala
3D visualisation of radiological measurement:

Different methods for 3D visualization of radiation measurements: 1) Classify radioactivity level with colour for different rooms 2) Capture position data (x-y-z) from laser scanning, and 3D visualization of radioation measurement with different symbols - Different types of symbols represent different types of measuring methods - Size of the symbol represent radiation levels - Colour of the symbol represent different measuring time
18

19

Different measuring methods: 1) Drilling samples 2) Grab samples 3) Smear samples

21

22

23
Trend surface analysis of radioactivity level for whole floor

24
Ideas about classification of radioactivity measurements: 1)Classify radioactivity level for different objects, e.g. ventilation, drains, rooms. 2)Classify measuring data of alpha-, beta- and gamma radiation with different radioactivity levels 3)Different radioactivity levels corresponding to different colours Capture position data (x-y-z) from laser scanning: 1)If RFID-tags can be identified, the position data are captured from laser scanning data 2)If no tags are used, but position description is available, e.g. on the ground, distances from the door and above the floor.

25
Visualization of gamma measurements:

26

28