radioactive micro-time-projection chamber · sensitive alpha detector is required to select...
10
Development of an alpha-particle imaging detector based on a low radioactivity micro-time-projection chamber H. Ito a* , T. Hashimoto a , K. Miuchi a , K. Kobayashi b,c ,Y. Takeuchi a,c , K. D. Nakamura a ,T. Ikeda a , and H. Ishiura a a Kobe University, Kobe, Hyogo 657-8501, Japan. b Institute for Cosmic Ray Research (ICRR), the University of Tokyo, Kashiwa, Chiba 277-8582 Japan. c Kavli Institute for the Physics and Mathematics of the Universe (WPI), The University of Tokyo Institutes for Advanced Study, University of Tokyo, Kashiwa, Chiba 277-8583, Japan. Abstract An important issue for rare-event-search experiments, such as the search for dark matter or neutrinoless double beta decay, is to reduce radioactivity of the detector materials and the experimental environment. The selection of materials with low radioactive impurities, such as isotopes of the uranium and thorium chains, requires a precise measurement of surface and bulk radioactivity. Focused on the first one, an alpha- particle detector has been developed based on a gaseous micro-time-projection chamber. A low-αμ-PIC with reduced alpha-emission background was installed in the detector. The detector offers the advantage of position sensitivity, which allows the alpha-particle contamination of the sample to be imaged and the background to be measured at the same time. The detector performance was measured by using an alpha- particle source. The measurement with a sample was also demonstrated and the sensitivity is discussed. Keywords: Alpha-particle detector, Position sensitivity, Time projection chamber, μ-PIC, Low background 1. Introduction Approximately 27% of the universe is domi- nated by non-baryonic matter, called dark mat- ter. Although many experimental groups have been searching for dark matter, arguably a direct detec- tion has not been observed. Typical experiments that search for dark matter are performed by using massive, low-background detectors. Although the DAMA group has observed the presumed annual modulation of dark matter particles in the galac- tic halo with a significance of 9.3σ [1], other groups such as XENON1T [2] and LUX [3] were unable to confirm these results. Meanwhile, a direction- sensitive method has been focused because of an expected clear anisotropic signal due to the motion of the solar system in the galaxy [4]. The NEWAGE group precedes a three-dimensionally sensitive dark * Corresponding author. E-mail address: [email protected] (H. Ito). matter search with a micro-time-projection cham- ber (micro-TPC), being the main background sur- face alpha particles from 238 U and 232 Th in the de- tector materials or in the μ-PIC [5]. Neutrinoless double beta (0νββ) decay is a lepton-number-violating process, which suggests the neutrino as a Majorana particle (i.e. it is its own antiparticle). Experiments like GERDA [6] and KamLAND-Zen [7] have been able to set a lower limit on the half-life over 10 25 yr and 10 26 yr at 90%CL by using 76 Ge and 136 Xe, re- spectively, but no positive signal of the 0νββ pro- cess has been observed yet. Conversely, a track- ing system for two electrons provides strong ev- idence of the 0νββ decay process. The 0νββ background has been well investigated as radioac- tive impurities such as 238 U and 232 Th decay-chain isotopes, 40 K, 60 Co, 137 Cs including in the de- tector material, which emit γ with around MeV [8, 9]. The NEMO3 group set lower limits at Preprint submitted to Nucl. Instr. Meth. A 25, Oct 2019 arXiv:1903.01090v3 [physics.ins-det] 30 Oct 2019
Transcript of radioactive micro-time-projection chamber · sensitive alpha detector is required to select...
Development of an alpha-particle imaging detector based on a lowradioactivity micro-time-projection chamber
H. Itoa∗, T. Hashimotoa, K. Miuchia, K. Kobayashib,c,Y. Takeuchia,c, K. D. Nakamuraa,T. Ikedaa, and H.Ishiuraa
aKobe University, Kobe, Hyogo 657-8501, Japan.
bInstitute for Cosmic Ray Research (ICRR), the University of Tokyo, Kashiwa, Chiba 277-8582 Japan.
cKavli Institute for the Physics and Mathematics of the Universe (WPI), The University of Tokyo Institutes for AdvancedStudy, University of Tokyo, Kashiwa, Chiba 277-8583, Japan.
Abstract
An important issue for rare-event-search experiments, such as the search for dark matter or neutrinolessdouble beta decay, is to reduce radioactivity of the detector materials and the experimental environment.The selection of materials with low radioactive impurities, such as isotopes of the uranium and thoriumchains, requires a precise measurement of surface and bulk radioactivity. Focused on the first one, an alpha-particle detector has been developed based on a gaseous micro-time-projection chamber. A low-α µ-PICwith reduced alpha-emission background was installed in the detector. The detector offers the advantageof position sensitivity, which allows the alpha-particle contamination of the sample to be imaged and thebackground to be measured at the same time. The detector performance was measured by using an alpha-particle source. The measurement with a sample was also demonstrated and the sensitivity is discussed.
Keywords: Alpha-particle detector, Position sensitivity, Time projection chamber, µ-PIC, Lowbackground
1. Introduction
Approximately 27% of the universe is domi-nated by non-baryonic matter, called dark mat-ter. Although many experimental groups have beensearching for dark matter, arguably a direct detec-tion has not been observed. Typical experimentsthat search for dark matter are performed by usingmassive, low-background detectors. Although theDAMA group has observed the presumed annualmodulation of dark matter particles in the galac-tic halo with a significance of 9.3σ [1], other groupssuch as XENON1T [2] and LUX [3] were unableto confirm these results. Meanwhile, a direction-sensitive method has been focused because of anexpected clear anisotropic signal due to the motionof the solar system in the galaxy [4]. The NEWAGEgroup precedes a three-dimensionally sensitive dark
∗Corresponding author. E-mail address:[email protected] (H. Ito).
matter search with a micro-time-projection cham-ber (micro-TPC), being the main background sur-face alpha particles from 238U and 232Th in the de-tector materials or in the µ-PIC [5].
Neutrinoless double beta (0νββ) decay is alepton-number-violating process, which suggeststhe neutrino as a Majorana particle (i.e. it isits own antiparticle). Experiments like GERDA[6] and KamLAND-Zen [7] have been able to seta lower limit on the half-life over 1025 yr and1026 yr at 90%CL by using 76Ge and 136Xe, re-spectively, but no positive signal of the 0νββ pro-cess has been observed yet. Conversely, a track-ing system for two electrons provides strong ev-idence of the 0νββ decay process. The 0νββbackground has been well investigated as radioac-tive impurities such as 238U and 232Th decay-chainisotopes, 40K, 60Co, 137Cs including in the de-tector material, which emit γ with around MeV[8, 9]. The NEMO3 group set lower limits at
Preprint submitted to Nucl. Instr. Meth. A 25, Oct 2019
arX
iv:1
903.
0109
0v3
[ph
ysic
s.in
s-de
t] 3
0 O
ct 2
019
T1/2(0νββ) > 2.5× 10²³ yr (90%CL) for 82Se [10],and T1/2(0νββ) > (1.1− 3.2)× 1021 yr (90%CL)for 150Nd [11]. For this experiment background isdominated by the 208Tl and 214Bi contaminationpresent in the double beta emitter source foils. TheSuperNEMO group has developed the BiPo-3 de-tector to measure the radioactive impurities in thesefoils with a sensitivity less than 2 µBq/kg (90%CL)for 208Tl and 140 µBq/kg (90%CL) for 214Bi [12].Therefore, the background of 0νββ decay is notonly a contamination by the end point of continu-ous energy in an ordinary 2νββ decay process, butalso the radiative impurities such as 238U and 232Thin the detector.
To estimate the radioactive impurities in thedetector materials, the XMASS group measured210Pb and 210Po in the bulk of copper by using acommercial alpha-particle detector (Ultra-Lo 1800,XIA) [13]. The alpha detector has a good energyresolution (as explained in Sec. 3.2) and a mecha-nism to reduce the background by waveform anal-ysis, and thus its sensitivity is ∼ 10−4 α/cm2/hr.However, it has no position sensitivity. A samplesuch as a micro pattern gas detector board doesnot have a uniform radioactive contamination. Forexample the impurities can be in a particular loca-tion due to the manufacturing process. Therefore,a position-sensitive alpha detector is required in or-der to determine the site and perhaps the processassociated with the materials contamination.
This paper is organized as follows. The detailsof the alpha-particle detector, setup, low-α micropixel chamber (µ-PIC), gas circulation system, elec-tronics, and trigger and data acquisition systemsare described in Sec. 2. The performance checkthat uses the alpha-particle source, a sample test,and background estimation are described in Sec. 3.The remaining background of the detector and fu-ture prospects are discussed in Sec. 4. Finally, mainconclusions are presented in Sec. 5.
2. Alpha-particle imaging detector based ongaseous micro-TPC
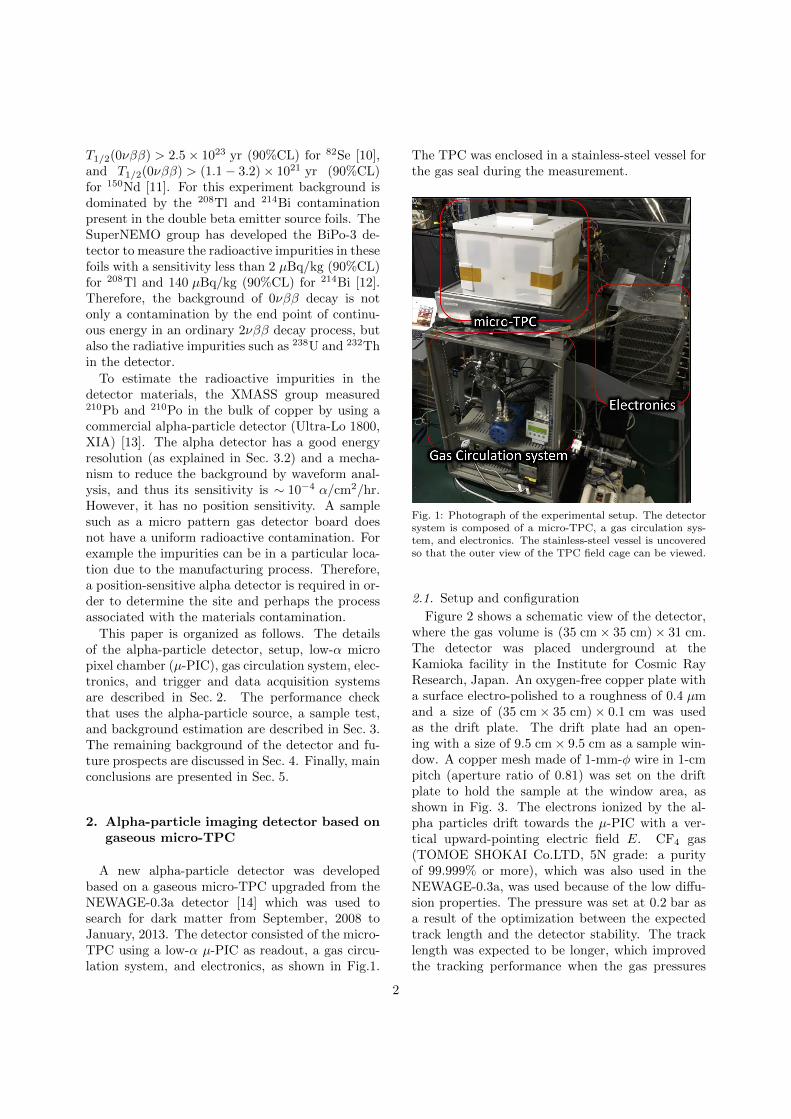
A new alpha-particle detector was developedbased on a gaseous micro-TPC upgraded from theNEWAGE-0.3a detector [14] which was used tosearch for dark matter from September, 2008 toJanuary, 2013. The detector consisted of the micro-TPC using a low-α µ-PIC as readout, a gas circu-lation system, and electronics, as shown in Fig.1.
The TPC was enclosed in a stainless-steel vessel forthe gas seal during the measurement.
Fig. 1: Photograph of the experimental setup. The detectorsystem is composed of a micro-TPC, a gas circulation sys-tem, and electronics. The stainless-steel vessel is uncoveredso that the outer view of the TPC field cage can be viewed.
2.1. Setup and configuration
Figure 2 shows a schematic view of the detector,where the gas volume is (35 cm× 35 cm)× 31 cm.The detector was placed underground at theKamioka facility in the Institute for Cosmic RayResearch, Japan. An oxygen-free copper plate witha surface electro-polished to a roughness of 0.4 µmand a size of (35 cm× 35 cm)× 0.1 cm was usedas the drift plate. The drift plate had an open-ing with a size of 9.5 cm× 9.5 cm as a sample win-dow. A copper mesh made of 1-mm-φ wire in 1-cmpitch (aperture ratio of 0.81) was set on the driftplate to hold the sample at the window area, asshown in Fig. 3. The electrons ionized by the al-pha particles drift towards the µ-PIC with a ver-tical upward-pointing electric field E. CF4 gas(TOMOE SHOKAI Co.LTD, 5N grade: a purityof 99.999% or more), which was also used in theNEWAGE-0.3a, was used because of the low diffu-sion properties. The pressure was set at 0.2 bar asa result of the optimization between the expectedtrack length and the detector stability. The tracklength was expected to be longer, which improvedthe tracking performance when the gas pressures
2
were low, while the discharge rate of the µ-PICincreased. The range of 5 MeV alpha particle is∼8 cm in 0.2 bar CF4 gas, which would provide areasonable detection efficiency considering the de-tector size. The electric field in the drift volume,E = 0.4 kV/cm/bar, was formed by supplying anegative voltage of 2.5 kV and placing field-shapingpatterns with chain resistors every centimeter [15].The drift velocity was 7.4± 0.1 cm/µs. The µ-PICanode was connected to +550 V. The typical gasgain of µ-PIC was 103 at ∼ 500 V.
Fig. 2: Schematic cross section of detector setup. Samplewindow size is 9.5 cm × 9.5 cm. Electric field is formed bya drift plate biased at -2.5 kV and copper wires with 1 cmpitch connecting with chain registers.
Fig. 3: Drift plate with a sample window (hole size is9.5 cm × 9.5 cm) and copper support mesh.
2.2. Low-α µ-PIC
The background study for the direction-sensitivedark matter search suggests that µ-PIC has ra-dioactive impurities of 238U and 232Th which emitalpha particles [5]. A survey with a HPGe detec-tor revealed that µ-PIC’s glass cloth was the mainbackground source, and so the impurities were re-moved. The polyimide with glass cloth in the µ-PICwas replaced with a new material of polyimide andepoxy. Details of the device with the new material,a low-α µ-PIC, will be described in Ref [16, 17].
2.3. Gas circulation system
A gas circulation system that uses activated char-coal pellets (Molsievon, X2M4/6M811) was de-veloped for the suppression of radon backgroundand a prevention of gain deterioration due to theoutgassing. A pump (EMP, MX-808ST-S) and aneedle-type flow-meter (KOFLOC, PK-1250) wereused to flow the gas at a rate of ∼ 500 cm3/min.The gas pressure was monitored to ensure the sta-ble operation of the circulation system, operatingwithin ±2% for several weeks.
2.4. Electronics and trigger and data acquisitionsystems
The electronics for the µ-PIC readout consistedof amplifier-shaper discriminators [18] for 768 anodeand 768 cathode signals and a position-encodingmodule [19] to reconstruct the hit pattern. A dataacquisition system consisted of a memory boardto record tracks and a flash analog-to-digital con-verter (ADC) for the energy measurement. Theflash ADC with 100 MHz sampling recorded thesum signal of the cathode strips with a full timerange of 12 µs. The anode sum signal issued thetrigger. The trigger occurred when the electronsclosest to the detection plane (indicated with thelargest circle (e−) in Fig. 2) reach the µ-PIC. Sincethe main purpose of the detector is the alpha parti-cle detection from the sample, the emission positionof the alpha particle in the anode-cathode plane wasdetermined at the position most distant from the µ-PIC in the track (the smallest circle in Fig. 2).
3. Performance check
3.1. Alpha-particle source
A 10 cm× 10 cm copper plate with 210Pb ac-cumulated on the surface was used as an alpha-particle source for the energy calibration and
3
energy-resolution measurement [13]. The sourceemits alpha particles with an energy of 5.3 MeV asa decay of 210Po. The alpha-particle emission rate(hereinafter called the α rate) of the entire sourceplate was calibrated to be 1.49± 0.01 α s−1 for 4.8–5.8 MeV by using the Ultra-Lo 1800 [13].
3.2. Energy calibration
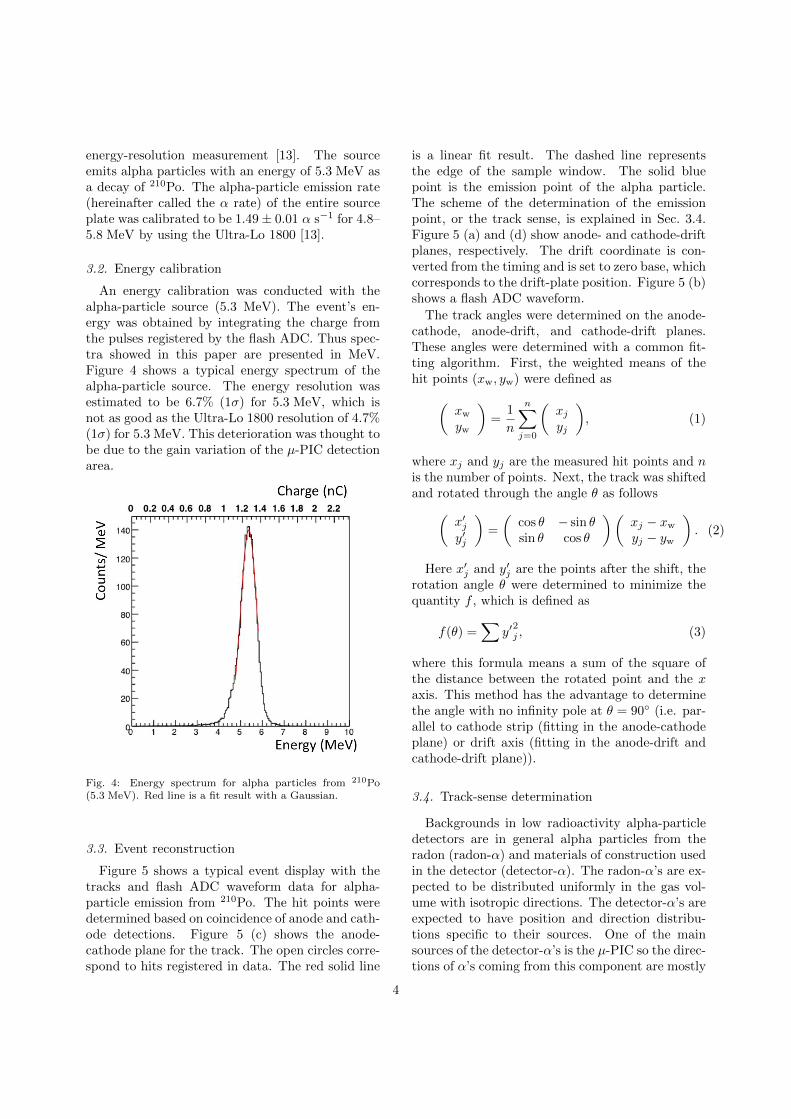
An energy calibration was conducted with thealpha-particle source (5.3 MeV). The event’s en-ergy was obtained by integrating the charge fromthe pulses registered by the flash ADC. Thus spec-tra showed in this paper are presented in MeV.Figure 4 shows a typical energy spectrum of thealpha-particle source. The energy resolution wasestimated to be 6.7% (1σ) for 5.3 MeV, which isnot as good as the Ultra-Lo 1800 resolution of 4.7%(1σ) for 5.3 MeV. This deterioration was thought tobe due to the gain variation of the µ-PIC detectionarea.
Fig. 4: Energy spectrum for alpha particles from 210Po(5.3 MeV). Red line is a fit result with a Gaussian.
3.3. Event reconstruction
Figure 5 shows a typical event display with thetracks and flash ADC waveform data for alpha-particle emission from 210Po. The hit points weredetermined based on coincidence of anode and cath-ode detections. Figure 5 (c) shows the anode-cathode plane for the track. The open circles corre-spond to hits registered in data. The red solid line
is a linear fit result. The dashed line representsthe edge of the sample window. The solid bluepoint is the emission point of the alpha particle.The scheme of the determination of the emissionpoint, or the track sense, is explained in Sec. 3.4.Figure 5 (a) and (d) show anode- and cathode-driftplanes, respectively. The drift coordinate is con-verted from the timing and is set to zero base, whichcorresponds to the drift-plate position. Figure 5 (b)shows a flash ADC waveform.
The track angles were determined on the anode-cathode, anode-drift, and cathode-drift planes.These angles were determined with a common fit-ting algorithm. First, the weighted means of thehit points (xw, yw) were defined as(
xwyw
)=
1
n
n∑j=0
(xjyj
), (1)
where xj and yj are the measured hit points and nis the number of points. Next, the track was shiftedand rotated through the angle θ as follows(
x′jy′j
)=
(cos θ − sin θsin θ cos θ
)(xj − xwyj − yw
). (2)
Here x′j and y′j are the points after the shift, therotation angle θ were determined to minimize thequantity f , which is defined as
f(θ) =∑
y′2j , (3)
where this formula means a sum of the square ofthe distance between the rotated point and the xaxis. This method has the advantage to determinethe angle with no infinity pole at θ = 90◦ (i.e. par-allel to cathode strip (fitting in the anode-cathodeplane) or drift axis (fitting in the anode-drift andcathode-drift plane)).
3.4. Track-sense determination
Backgrounds in low radioactivity alpha-particledetectors are in general alpha particles from theradon (radon-α) and materials of construction usedin the detector (detector-α). The radon-α’s are ex-pected to be distributed uniformly in the gas vol-ume with isotropic directions. The detector-α’s areexpected to have position and direction distribu-tions specific to their sources. One of the mainsources of the detector-α’s is the µ-PIC so the direc-tions of α’s coming from this component are mostly
4
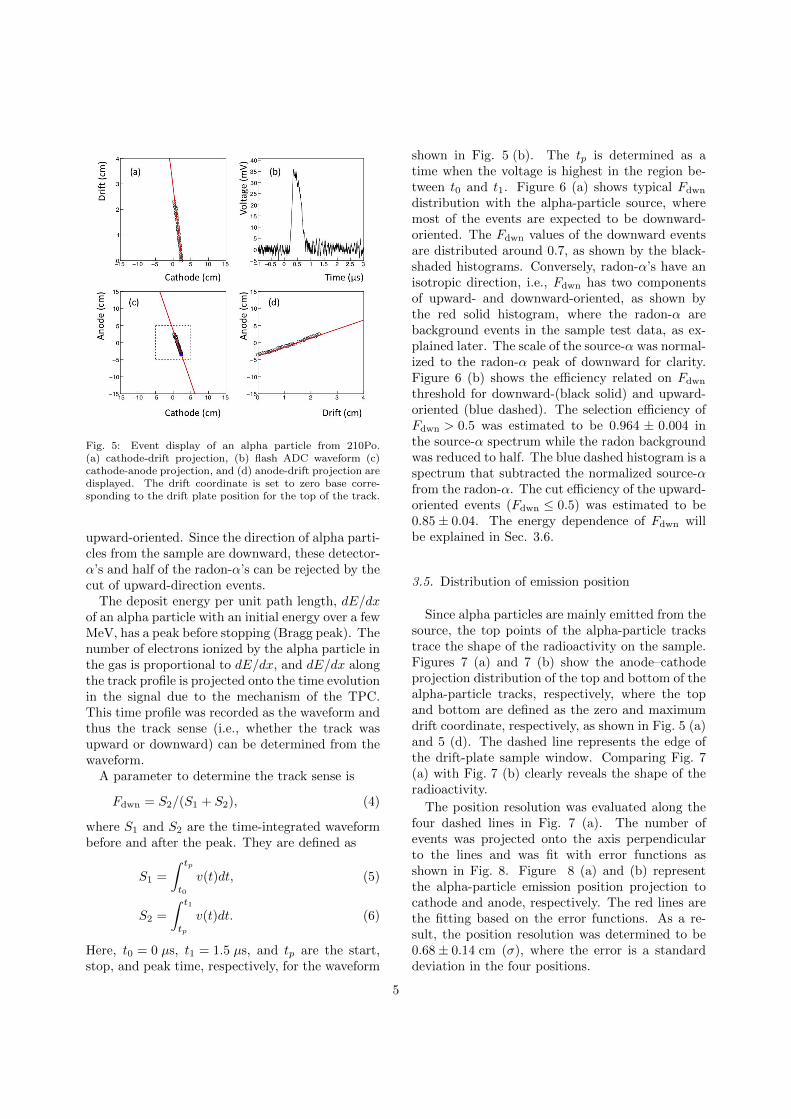
Fig. 5: Event display of an alpha particle from 210Po.(a) cathode-drift projection, (b) flash ADC waveform (c)cathode-anode projection, and (d) anode-drift projection aredisplayed. The drift coordinate is set to zero base corre-sponding to the drift plate position for the top of the track.
upward-oriented. Since the direction of alpha parti-cles from the sample are downward, these detector-α’s and half of the radon-α’s can be rejected by thecut of upward-direction events.
The deposit energy per unit path length, dE/dxof an alpha particle with an initial energy over a fewMeV, has a peak before stopping (Bragg peak). Thenumber of electrons ionized by the alpha particle inthe gas is proportional to dE/dx, and dE/dx alongthe track profile is projected onto the time evolutionin the signal due to the mechanism of the TPC.This time profile was recorded as the waveform andthus the track sense (i.e., whether the track wasupward or downward) can be determined from thewaveform.
A parameter to determine the track sense is
Fdwn = S2/(S1 + S2), (4)
where S1 and S2 are the time-integrated waveformbefore and after the peak. They are defined as
S1 =
∫ tp
t0
v(t)dt, (5)
S2 =
∫ t1
tp
v(t)dt. (6)
Here, t0 = 0 µs, t1 = 1.5 µs, and tp are the start,stop, and peak time, respectively, for the waveform
shown in Fig. 5 (b). The tp is determined as atime when the voltage is highest in the region be-tween t0 and t1. Figure 6 (a) shows typical Fdwn
distribution with the alpha-particle source, wheremost of the events are expected to be downward-oriented. The Fdwn values of the downward eventsare distributed around 0.7, as shown by the black-shaded histograms. Conversely, radon-α’s have anisotropic direction, i.e., Fdwn has two componentsof upward- and downward-oriented, as shown bythe red solid histogram, where the radon-α arebackground events in the sample test data, as ex-plained later. The scale of the source-α was normal-ized to the radon-α peak of downward for clarity.Figure 6 (b) shows the efficiency related on Fdwn
threshold for downward-(black solid) and upward-oriented (blue dashed). The selection efficiency ofFdwn > 0.5 was estimated to be 0.964 ± 0.004 inthe source-α spectrum while the radon backgroundwas reduced to half. The blue dashed histogram is aspectrum that subtracted the normalized source-αfrom the radon-α. The cut efficiency of the upward-oriented events (Fdwn ≤ 0.5) was estimated to be0.85± 0.04. The energy dependence of Fdwn willbe explained in Sec. 3.6.
3.5. Distribution of emission position
Since alpha particles are mainly emitted from thesource, the top points of the alpha-particle trackstrace the shape of the radioactivity on the sample.Figures 7 (a) and 7 (b) show the anode–cathodeprojection distribution of the top and bottom of thealpha-particle tracks, respectively, where the topand bottom are defined as the zero and maximumdrift coordinate, respectively, as shown in Fig. 5 (a)and 5 (d). The dashed line represents the edge ofthe drift-plate sample window. Comparing Fig. 7(a) with Fig. 7 (b) clearly reveals the shape of theradioactivity.
The position resolution was evaluated along thefour dashed lines in Fig. 7 (a). The number ofevents was projected onto the axis perpendicularto the lines and was fit with error functions asshown in Fig. 8. Figure 8 (a) and (b) representthe alpha-particle emission position projection tocathode and anode, respectively. The red lines arethe fitting based on the error functions. As a re-sult, the position resolution was determined to be0.68± 0.14 cm (σ), where the error is a standarddeviation in the four positions.
5
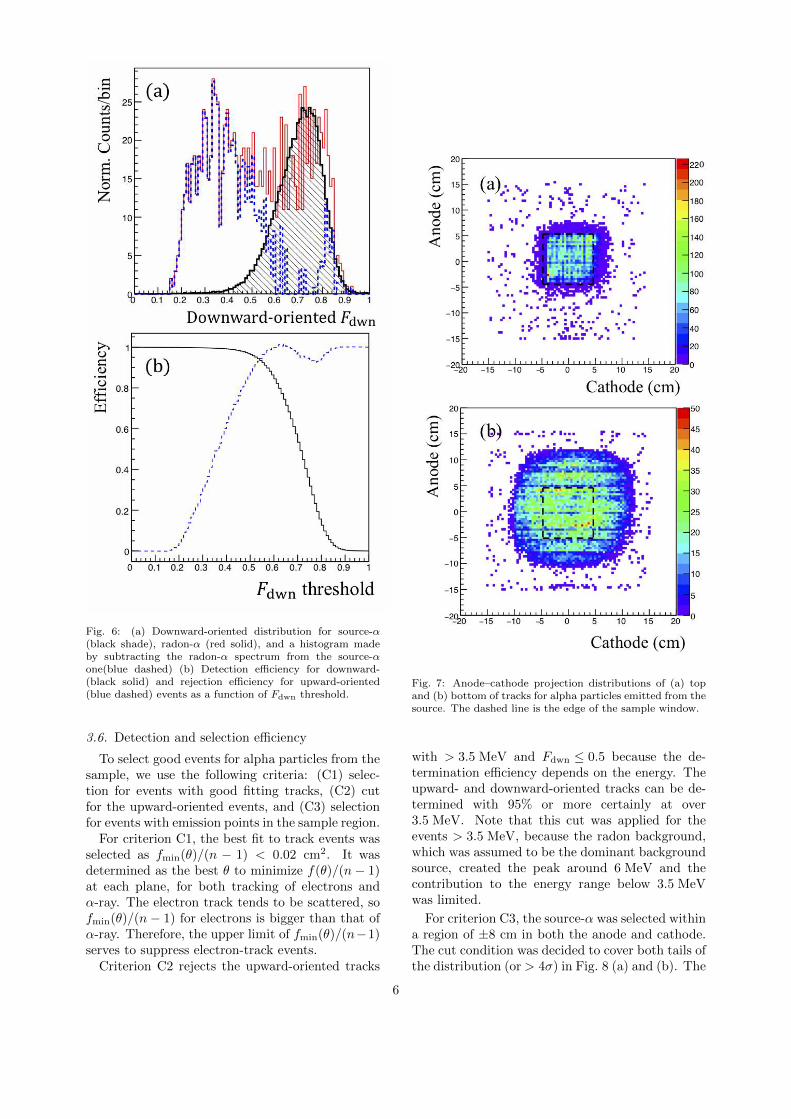
Fig. 6: (a) Downward-oriented distribution for source-α(black shade), radon-α (red solid), and a histogram madeby subtracting the radon-α spectrum from the source-αone(blue dashed) (b) Detection efficiency for downward-(black solid) and rejection efficiency for upward-oriented(blue dashed) events as a function of Fdwn threshold.
3.6. Detection and selection efficiency
To select good events for alpha particles from thesample, we use the following criteria: (C1) selec-tion for events with good fitting tracks, (C2) cutfor the upward-oriented events, and (C3) selectionfor events with emission points in the sample region.
For criterion C1, the best fit to track events wasselected as fmin(θ)/(n − 1) < 0.02 cm2. It wasdetermined as the best θ to minimize f(θ)/(n− 1)at each plane, for both tracking of electrons andα-ray. The electron track tends to be scattered, sofmin(θ)/(n− 1) for electrons is bigger than that ofα-ray. Therefore, the upper limit of fmin(θ)/(n−1)serves to suppress electron-track events.
Criterion C2 rejects the upward-oriented tracks
Fig. 7: Anode–cathode projection distributions of (a) topand (b) bottom of tracks for alpha particles emitted from thesource. The dashed line is the edge of the sample window.
with > 3.5 MeV and Fdwn ≤ 0.5 because the de-termination efficiency depends on the energy. Theupward- and downward-oriented tracks can be de-termined with 95% or more certainly at over3.5 MeV. Note that this cut was applied for theevents > 3.5 MeV, because the radon background,which was assumed to be the dominant backgroundsource, created the peak around 6 MeV and thecontribution to the energy range below 3.5 MeVwas limited.
For criterion C3, the source-α was selected withina region of ±8 cm in both the anode and cathode.The cut condition was decided to cover both tails ofthe distribution (or > 4σ) in Fig. 8 (a) and (b). The
6
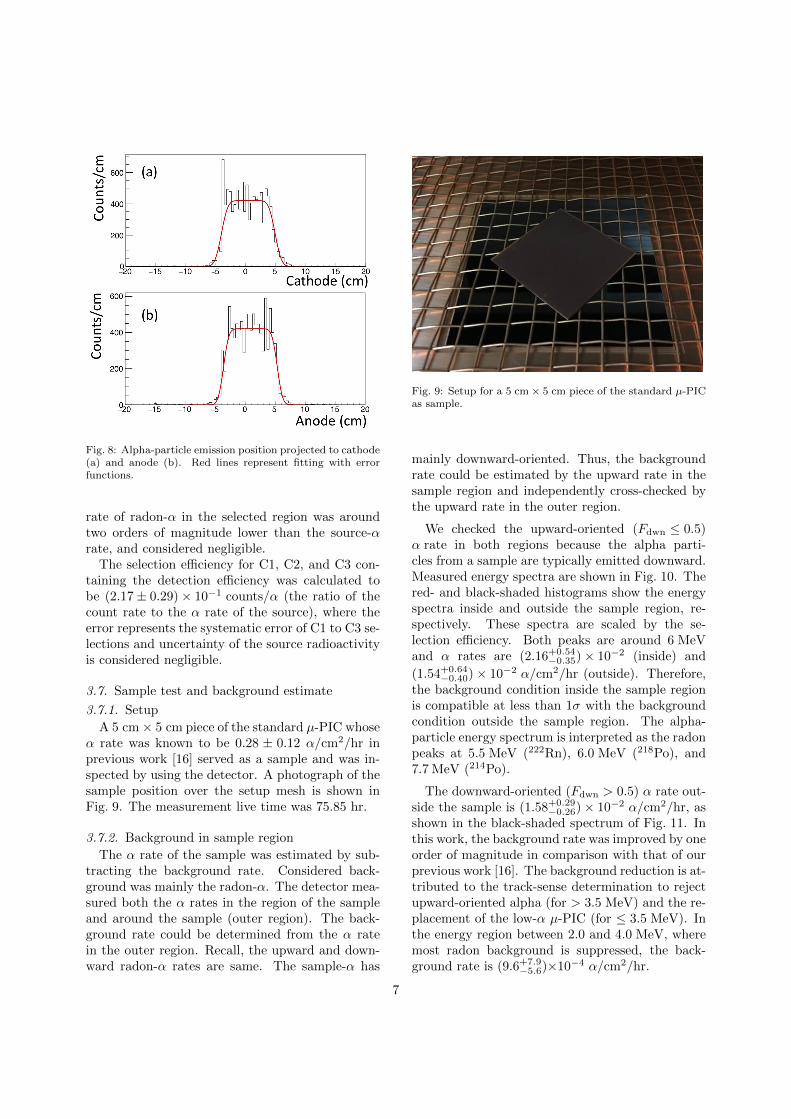
Fig. 8: Alpha-particle emission position projected to cathode(a) and anode (b). Red lines represent fitting with errorfunctions.
rate of radon-α in the selected region was aroundtwo orders of magnitude lower than the source-αrate, and considered negligible.
The selection efficiency for C1, C2, and C3 con-taining the detection efficiency was calculated tobe (2.17± 0.29)× 10−1 counts/α (the ratio of thecount rate to the α rate of the source), where theerror represents the systematic error of C1 to C3 se-lections and uncertainty of the source radioactivityis considered negligible.
3.7. Sample test and background estimate
3.7.1. Setup
A 5 cm× 5 cm piece of the standard µ-PIC whoseα rate was known to be 0.28 ± 0.12 α/cm2/hr inprevious work [16] served as a sample and was in-spected by using the detector. A photograph of thesample position over the setup mesh is shown inFig. 9. The measurement live time was 75.85 hr.
3.7.2. Background in sample region
The α rate of the sample was estimated by sub-tracting the background rate. Considered back-ground was mainly the radon-α. The detector mea-sured both the α rates in the region of the sampleand around the sample (outer region). The back-ground rate could be determined from the α ratein the outer region. Recall, the upward and down-ward radon-α rates are same. The sample-α has
Fig. 9: Setup for a 5 cm × 5 cm piece of the standard µ-PICas sample.
mainly downward-oriented. Thus, the backgroundrate could be estimated by the upward rate in thesample region and independently cross-checked bythe upward rate in the outer region.
We checked the upward-oriented (Fdwn ≤ 0.5)α rate in both regions because the alpha parti-cles from a sample are typically emitted downward.Measured energy spectra are shown in Fig. 10. Thered- and black-shaded histograms show the energyspectra inside and outside the sample region, re-spectively. These spectra are scaled by the se-lection efficiency. Both peaks are around 6 MeVand α rates are (2.16+0.54
−0.35)× 10−2 (inside) and
(1.54+0.64−0.40)× 10−2 α/cm2/hr (outside). Therefore,
the background condition inside the sample regionis compatible at less than 1σ with the backgroundcondition outside the sample region. The alpha-particle energy spectrum is interpreted as the radonpeaks at 5.5 MeV (222Rn), 6.0 MeV (218Po), and7.7 MeV (214Po).
The downward-oriented (Fdwn > 0.5) α rate out-side the sample is (1.58+0.29
−0.26)× 10−2 α/cm2/hr, asshown in the black-shaded spectrum of Fig. 11. Inthis work, the background rate was improved by oneorder of magnitude in comparison with that of ourprevious work [16]. The background reduction is at-tributed to the track-sense determination to rejectupward-oriented alpha (for > 3.5 MeV) and the re-placement of the low-α µ-PIC (for ≤ 3.5 MeV). Inthe energy region between 2.0 and 4.0 MeV, wheremost radon background is suppressed, the back-ground rate is (9.6+7.9
−5.6)×10−4 α/cm2/hr.
7
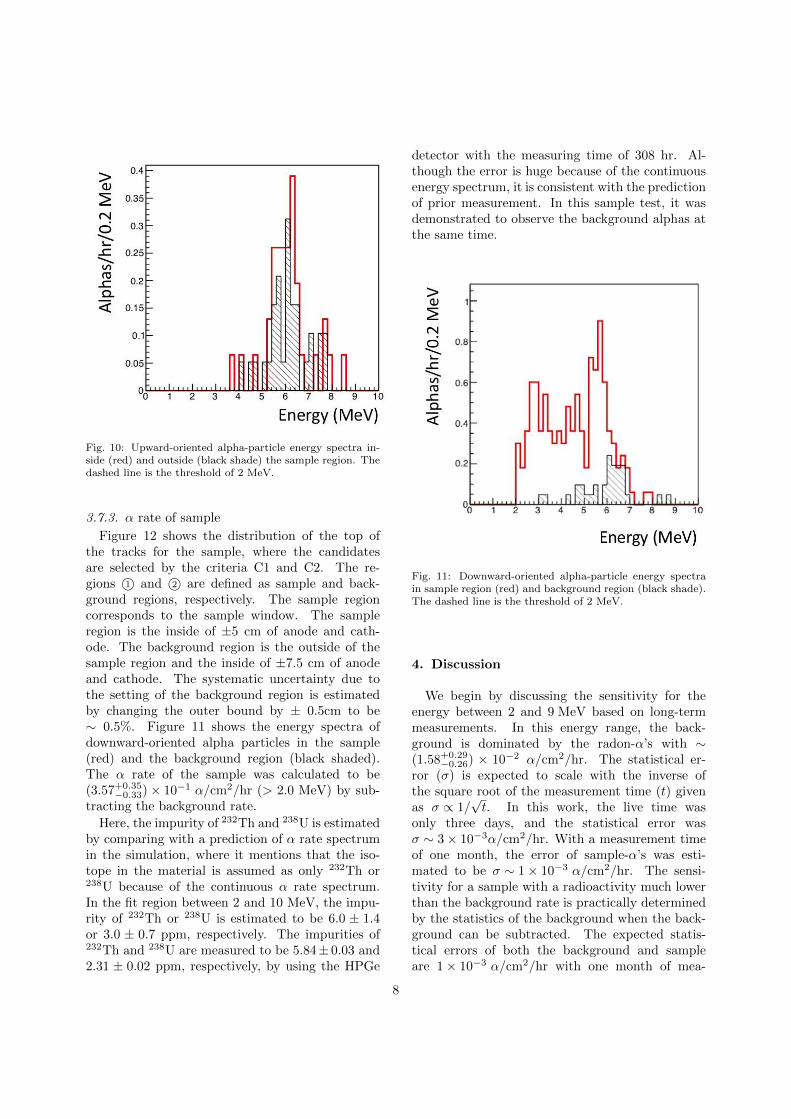
Fig. 10: Upward-oriented alpha-particle energy spectra in-side (red) and outside (black shade) the sample region. Thedashed line is the threshold of 2 MeV.
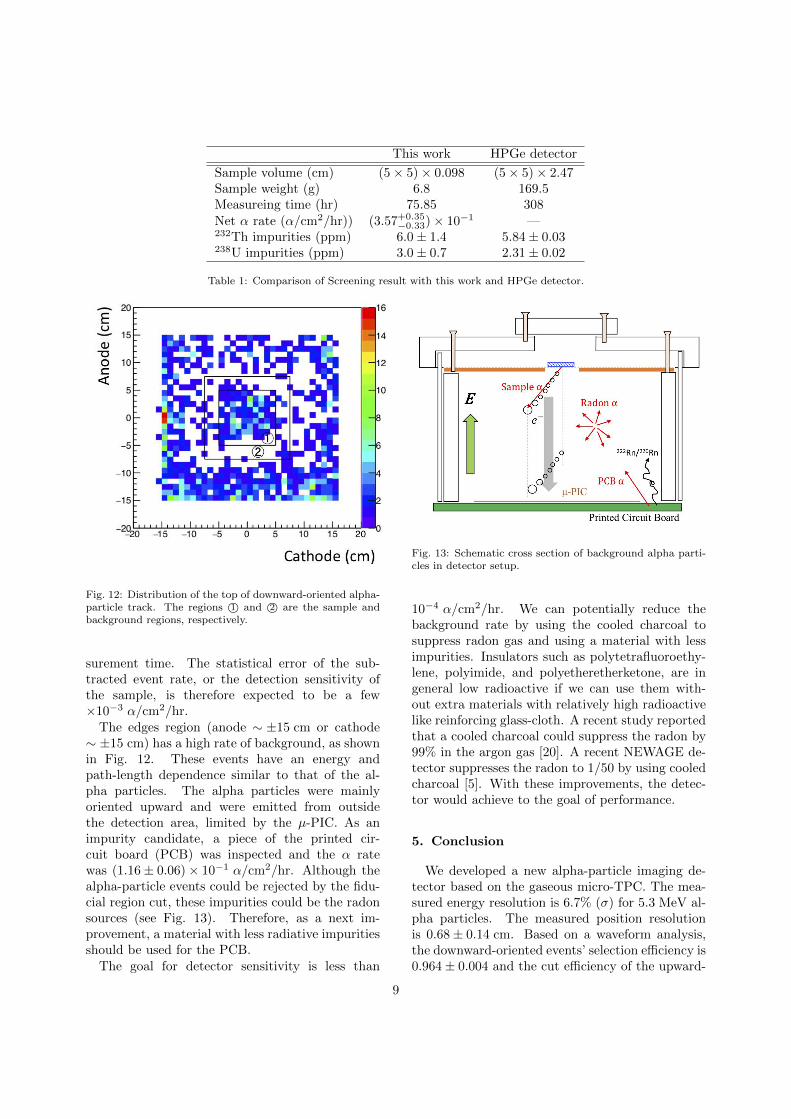
3.7.3. α rate of sample
Figure 12 shows the distribution of the top ofthe tracks for the sample, where the candidatesare selected by the criteria C1 and C2. The re-gions 1© and 2© are defined as sample and back-ground regions, respectively. The sample regioncorresponds to the sample window. The sampleregion is the inside of ±5 cm of anode and cath-ode. The background region is the outside of thesample region and the inside of ±7.5 cm of anodeand cathode. The systematic uncertainty due tothe setting of the background region is estimatedby changing the outer bound by ± 0.5cm to be∼ 0.5%. Figure 11 shows the energy spectra ofdownward-oriented alpha particles in the sample(red) and the background region (black shaded).The α rate of the sample was calculated to be(3.57+0.35
−0.33)× 10−1 α/cm2/hr (> 2.0 MeV) by sub-tracting the background rate.
Here, the impurity of 232Th and 238U is estimatedby comparing with a prediction of α rate spectrumin the simulation, where it mentions that the iso-tope in the material is assumed as only 232Th or238U because of the continuous α rate spectrum.In the fit region between 2 and 10 MeV, the impu-rity of 232Th or 238U is estimated to be 6.0 ± 1.4or 3.0 ± 0.7 ppm, respectively. The impurities of232Th and 238U are measured to be 5.84± 0.03 and2.31 ± 0.02 ppm, respectively, by using the HPGe
detector with the measuring time of 308 hr. Al-though the error is huge because of the continuousenergy spectrum, it is consistent with the predictionof prior measurement. In this sample test, it wasdemonstrated to observe the background alphas atthe same time.
Fig. 11: Downward-oriented alpha-particle energy spectrain sample region (red) and background region (black shade).The dashed line is the threshold of 2 MeV.
4. Discussion
We begin by discussing the sensitivity for theenergy between 2 and 9 MeV based on long-termmeasurements. In this energy range, the back-ground is dominated by the radon-α’s with ∼(1.58+0.29
−0.26) × 10−2 α/cm2/hr. The statistical er-ror (σ) is expected to scale with the inverse ofthe square root of the measurement time (t) givenas σ ∝ 1/
√t. In this work, the live time was
only three days, and the statistical error wasσ ∼ 3× 10⁻³α/cm2/hr. With a measurement timeof one month, the error of sample-α’s was esti-mated to be σ ∼ 1× 10⁻³ α/cm2/hr. The sensi-tivity for a sample with a radioactivity much lowerthan the background rate is practically determinedby the statistics of the background when the back-ground can be subtracted. The expected statis-tical errors of both the background and sampleare 1× 10⁻³ α/cm2/hr with one month of mea-
8
This work HPGe detector
Sample volume (cm) (5× 5)× 0.098 (5× 5)× 2.47Sample weight (g) 6.8 169.5Measureing time (hr) 75.85 308Net α rate (α/cm2/hr)) (3.57+0.35
−0.33)× 10−1 —232Th impurities (ppm) 6.0± 1.4 5.84± 0.03238U impurities (ppm) 3.0± 0.7 2.31± 0.02
Table 1: Comparison of Screening result with this work and HPGe detector.
Fig. 12: Distribution of the top of downward-oriented alpha-particle track. The regions 1© and 2© are the sample andbackground regions, respectively.
surement time. The statistical error of the sub-tracted event rate, or the detection sensitivity ofthe sample, is therefore expected to be a few×10−3 α/cm2/hr.
The edges region (anode ∼ ±15 cm or cathode∼ ±15 cm) has a high rate of background, as shownin Fig. 12. These events have an energy andpath-length dependence similar to that of the al-pha particles. The alpha particles were mainlyoriented upward and were emitted from outsidethe detection area, limited by the µ-PIC. As animpurity candidate, a piece of the printed cir-cuit board (PCB) was inspected and the α ratewas (1.16± 0.06)× 10−1 α/cm2/hr. Although thealpha-particle events could be rejected by the fidu-cial region cut, these impurities could be the radonsources (see Fig. 13). Therefore, as a next im-provement, a material with less radiative impuritiesshould be used for the PCB.
The goal for detector sensitivity is less than
Fig. 13: Schematic cross section of background alpha parti-cles in detector setup.
10−4 α/cm2/hr. We can potentially reduce thebackground rate by using the cooled charcoal tosuppress radon gas and using a material with lessimpurities. Insulators such as polytetrafluoroethy-lene, polyimide, and polyetheretherketone, are ingeneral low radioactive if we can use them with-out extra materials with relatively high radioactivelike reinforcing glass-cloth. A recent study reportedthat a cooled charcoal could suppress the radon by99% in the argon gas [20]. A recent NEWAGE de-tector suppresses the radon to 1/50 by using cooledcharcoal [5]. With these improvements, the detec-tor would achieve to the goal of performance.
5. Conclusion
We developed a new alpha-particle imaging de-tector based on the gaseous micro-TPC. The mea-sured energy resolution is 6.7% (σ) for 5.3 MeV al-pha particles. The measured position resolutionis 0.68± 0.14 cm. Based on a waveform analysis,the downward-oriented events’ selection efficiency is0.964± 0.004 and the cut efficiency of the upward-
9

oriented events is 0.85± 0.04 at > 3.5 MeV. Also,a piece of the standard µ-PIC was measured as asample, and the result is consistent with the oneobtained by a measurement done with a HPGe de-tector. A measurement of the alpha particles from asample and background was also established at thesame time. A background rate near the radon-α((1.58+0.51
−0.42)× 10−2 α/cm2/hr) was achieved.
Acknowledgments
This work was supported by a Grant-in-Aid forScientific Research on Innovative Areas, 26104004and 26104008, from the Japan Society for the Pro-motion of Science in Japan. This work was sup-ported by the joint research program of the Insti-tute for Cosmic Ray Research (ICRR), the Univer-sity of Tokyo. We thank Dr. Y. Nakano of theICRR, University of Tokyo, Japan for providing uswith a helium-gas leak detector.
References
[1] R Bernabei, et al., J. Phys. Conf. Ser. 1056 (2018)012005.
[2] XENON Collaboration, Eur. Phys. J. 77 881 (2017).[3] D. S. Akerib, et al., Phys. Rev. Lett. 118 021303 (2017).[4] T. Tanimori, et al., Phys. Lett. B 578 (2004) 241.[5] K. Nakamura, et al., Prog. Theo. Exp. Phys. (2015)
043F01.[6] The GERDA Collaboration, Nature 544 (2017) 47.[7] A. Gando, et al., Phys. Rev. Lett. 117 082503 (2016).[8] D. S. Leonard, et al., Nucl. Instr. Meth. A 871 (2017)
169.[9] N. Abgrall, et al., Nucl. Instr. Meth. A 828 (2016) 22.[10] R. Arnold, et al., Eur. Phys. J. C 78 (2018) 821.[11] R. Arnold, et al., PRL 119, 041801 (2017).[12] A. S. Barabash, et al., JINST 12 (2017) P06002.[13] K. Abe, et al., Nucl. Instr. Meth. A 884 (2018) 157.[14] K. Miuchi, et al., Phys. Lett. B 686 (2010).[15] K. Miuchi, et al., Phys. Lett. B 654 (2007) 58.[16] T. Hashimoto, et al., AIP Conf. Proc. 1921, 070001
(2018).[17] T. Hashimoto, et al., in preparation.[18] R. Orito, et al., IEEE Trans. Nucl. Scie. 51, 4 (2004)
1337.[19] H. Kubo, et al., Nucl. Instr. Meth. A 513 (2003) 93.[20] M. Ikeda, et al., Radioisotopes, 59, (2010) 29.
10


![Review Article - Hindawidivinylbenzene)(P(MMA-co-DVB))copolymerastheshell material to successfully encapsulate the binary core mate-rials,namely,butylstearateandparaffin[68].eprepared](https://static.fdocuments.in/doc/165x107/61473c4aafbe1968d379ed3e/review-article-hindawi-divinylbenzenepmma-co-dvbcopolymerastheshell-material.jpg)


