Radiator Vibration Fatigue Analysis of fatigue vibration under automobile normal working co ndition....
14
Journal of Electronics Cooling and Thermal Control, 2017, 7, 8-21 http://www.scirp.org/journal/jectc ISSN Online: 2162-6170 ISSN Print: 2162-6162 DOI: 10.4236/jectc.2017.71002 January 18, 2017 Radiator Vibration Fatigue Analysis Toure Ismael, Buyun Sheng Department of Mechanical and Electronic Engineering, Wuhan University of Technology, Wuhan, China Abstract This paper is the second step of our work. The first step presents a set of pa- rametric studies performed on automotive radiators by designing different heat exchanger models. The analysis focuses on the cooling performance for automobile radiator by changing several dimensions of the radiator fin phase (P2.5, P2.4, P2.3, P2.2, and P2.1) as well as the importance of coolant flow lay-out on the radiator global performance [1]. The second step consists on the study of the vibration fatigue of the sample with the best heat dissipation performance we design (radiator P2.1). We use Hyper Mesh to proceed with the finite element model. Frequency response analysis is solved by using MSC. Nastran (MSC. MD. Nastran. v2010.1.3-MAGNiTUDE), fatigue durability ana- lysis by using MSC Fatigue. In this experiment, the frequency response of the unit load (the unit load is 1 g) is analyzed. Based on the analysis of the fre- quency response of the unit load, the fatigue life of the radiator is analyzed by the PSD (power spectral density) curve and the S-N curve. From our experi- ments results, we observe that the radiator we design meets the international requirements of fatigue vibration under automobile normal working condition. Keywords Automobile Radiator, Radiator Fin, S-N and PSD (Power Spectral Density) Curve, Fatigue Durability, Frequency Response 1. Introduction The radiator is one of the most important components of automobile engine cooling system. It has significant influence on the dynamic, economic, reliability of the internal combustion engine, which requires the automotive radiator structure to have better thermal performance and higher structural strength. The radiator is the main component in a cooling package to remove heat from the engines of heavy-duty trucks. Looking at these challenges, an optimization pro- cess is compulsory to obtain the best design compromise among performance, size/shape and weight. This experience objective is to carry out the radiator fati- How to cite this paper: Ismael, T. and Sheng, B.Y. (2017) Radiator Vibration Fa- tigue Analysis. Journal of Electronics Cool- ing and Thermal Control, 7, 8-21. https://doi.org/10.4236/jectc.2017.71002 Received: November 9, 2016 Accepted: January 15, 2017 Published: January 18, 2017 Copyright © 2017 by authors and Scientific Research Publishing Inc. This work is licensed under the Creative Commons Attribution International License (CC BY 4.0). http://creativecommons.org/licenses/by/4.0/ Open Access
-
Upload
duonghuong -
Category
Documents
-
view
247 -
download
0
Transcript of Radiator Vibration Fatigue Analysis of fatigue vibration under automobile normal working co ndition....

Journal of Electronics Cooling and Thermal Control, 2017, 7, 8-21 http://www.scirp.org/journal/jectc
ISSN Online: 2162-6170 ISSN Print: 2162-6162
DOI: 10.4236/jectc.2017.71002 January 18, 2017
Radiator Vibration Fatigue Analysis
Toure Ismael, Buyun Sheng
Department of Mechanical and Electronic Engineering, Wuhan University of Technology, Wuhan, China
Abstract This paper is the second step of our work. The first step presents a set of pa-rametric studies performed on automotive radiators by designing different heat exchanger models. The analysis focuses on the cooling performance for automobile radiator by changing several dimensions of the radiator fin phase (P2.5, P2.4, P2.3, P2.2, and P2.1) as well as the importance of coolant flow lay-out on the radiator global performance [1]. The second step consists on the study of the vibration fatigue of the sample with the best heat dissipation performance we design (radiator P2.1). We use Hyper Mesh to proceed with the finite element model. Frequency response analysis is solved by using MSC. Nastran (MSC. MD. Nastran. v2010.1.3-MAGNiTUDE), fatigue durability ana- lysis by using MSC Fatigue. In this experiment, the frequency response of the unit load (the unit load is 1 g) is analyzed. Based on the analysis of the fre-quency response of the unit load, the fatigue life of the radiator is analyzed by the PSD (power spectral density) curve and the S-N curve. From our experi-ments results, we observe that the radiator we design meets the international requirements of fatigue vibration under automobile normal working condition.
Keywords Automobile Radiator, Radiator Fin, S-N and PSD (Power Spectral Density) Curve, Fatigue Durability, Frequency Response
1. Introduction
The radiator is one of the most important components of automobile engine cooling system. It has significant influence on the dynamic, economic, reliability of the internal combustion engine, which requires the automotive radiator structure to have better thermal performance and higher structural strength. The radiator is the main component in a cooling package to remove heat from the engines of heavy-duty trucks. Looking at these challenges, an optimization pro- cess is compulsory to obtain the best design compromise among performance, size/shape and weight. This experience objective is to carry out the radiator fati-
How to cite this paper: Ismael, T. and Sheng, B.Y. (2017) Radiator Vibration Fa- tigue Analysis. Journal of Electronics Cool- ing and Thermal Control, 7, 8-21. https://doi.org/10.4236/jectc.2017.71002 Received: November 9, 2016 Accepted: January 15, 2017 Published: January 18, 2017 Copyright © 2017 by authors and Scientific Research Publishing Inc. This work is licensed under the Creative Commons Attribution International License (CC BY 4.0). http://creativecommons.org/licenses/by/4.0/
Open Access

T. Ismael, B. Y. Sheng
9
gue damage, which is one of the major engineering structures and mechanical failures. Structure leads to the cycle of high cycle fatigue, and the failure load of the peak is often far less according to the estimate of the static fracture analysis “safe” load. Therefore, to carry out research on the fatigue design has important significance [2].
Some previous references were found with experimental analysis of the fatigue damage of automotive radiators. Quin Li et al. explained the fatigue life estima-tion using a fatigue life curve and a fatigue damage parameter that could be de-termined from specimen tests and component analysis was needed for the fati-gue design [3]. R. K. Luo et al. performed FEA (Finite Element Analysis) to ob-tain an improved fatigue life of the spring using nonlinear software that could provide a good indication of product design and failure analysis [4]. Fatigue life prediction equation can be effectively represented by a single function using the Green-Lagrange strain. Allen N. Gent explained different approaches for pre- dicting the fatigue life of rubber-like materials [5].
Automotive radiator needs to bear the vibration of the engine excitation, and the vibration of the road. The fatigue vibration failure caused by structural vi-bration is often encountered during the using process of the radiator. To a cer-tain extent, it affects the reliability of the radiator, so the research on the vibra-tion fatigue performance of the radiator is particularly important.
2. Frequency Response Analysis Model Preparation
The finite element mesh used in the frequency response analysis is consistent with the mesh of the modal analysis. Because the enterprise vibration experi-mental platform is filled with water inside the radiator, the radiator has a certain hydraulic pressure. In addition, the rubber bushing stiffness of the frequency response analysis is the same as the bushing stiffness of the modal analysis.
The difference between the finite element model and the finite element model is the counterweight fan on the radiator outside, PSD excitation loading point is located in the structure of the center of gravity.
External fan counterweight process: External fan counterweight process is as follows: First find the center of gravi-
ty of the external wind turbine, then use RBE2 to connect the four support points to the wind turbine center of gravity, the distribution of a mass unit in the center of the wind turbine is 3.6 kg. The counterweight is completed, the quality of the radiator assembly is 6.898 Kg, and it fulfill the requirements of the overall quality of the radiator.
Introduction to constrain and load profile: In this part, we first find the center of gravity of the radiator assembly, and
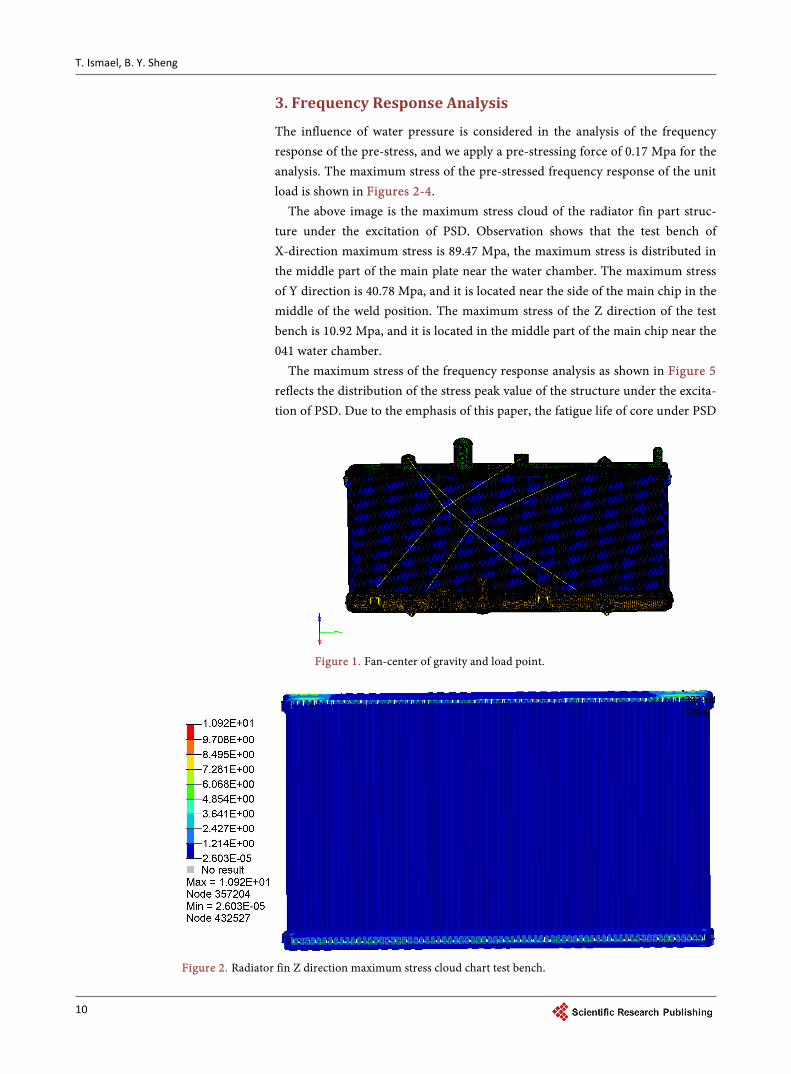
then use the RBE2 to connect the free end of the four spring elements to the center of gravity of the radiator assembly. The center node is fully constrained, in order to show the fixed, in addition to the acceleration of the excitation is also applied in the center of gravity. External fan of the radiator core position and load plus point as shown in Figure 1.
T. Ismael, B. Y. Sheng
10
3. Frequency Response Analysis
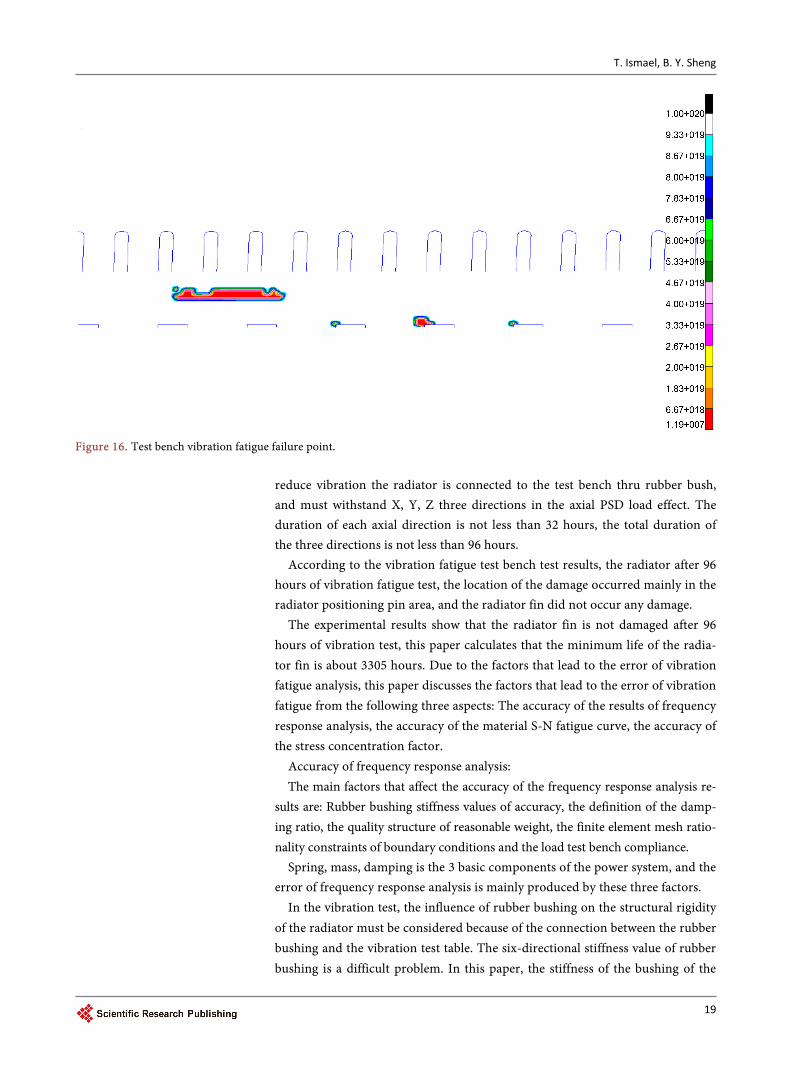
The influence of water pressure is considered in the analysis of the frequency response of the pre-stress, and we apply a pre-stressing force of 0.17 Mpa for the analysis. The maximum stress of the pre-stressed frequency response of the unit load is shown in Figures 2-4.
The above image is the maximum stress cloud of the radiator fin part struc-ture under the excitation of PSD. Observation shows that the test bench of X-direction maximum stress is 89.47 Mpa, the maximum stress is distributed in the middle part of the main plate near the water chamber. The maximum stress of Y direction is 40.78 Mpa, and it is located near the side of the main chip in the middle of the weld position. The maximum stress of the Z direction of the test bench is 10.92 Mpa, and it is located in the middle part of the main chip near the 041 water chamber.
The maximum stress of the frequency response analysis as shown in Figure 5 reflects the distribution of the stress peak value of the structure under the excita-tion of PSD. Due to the emphasis of this paper, the fatigue life of core under PSD
Figure 1. Fan-center of gravity and load point.
Figure 2. Radiator fin Z direction maximum stress cloud chart test bench.

T. Ismael, B. Y. Sheng
11
Figure 3. Radiator fin Y direction maximum stress cloud chart test bench.
Figure 4. Radiator fin X direction maximum stress cloud chart test bench.
excitation is mainly concerned, therefore, the stress response of the structure is observed. The frequency response of the unit load is analyzed to provide the structural stress distribution for the following vibration fatigue analysis. Because

T. Ismael, B. Y. Sheng
12
Figure 5. The displacement amplitude-frequency curve of X direction fan constraint the test bench.
the radiator upper and lower water chamber are in plastic, and it was unable to get the fatigue characteristics parameters of plastics materials, in this paper the vibration fatigue life of the plastic material is not calculated.
The results obtained from frequency response analysis have the stress, dis-placement, velocity and acceleration response of a node or element [6] [7] [8]. The frequency response of the unit load is analyzed to provide the stress distri-bution for the vibration fatigue analysis.
4. Radiator Vibration Fatigue Analysis Study
Load excitation signal can be divided into time domain load signal and frequen-cy domain load signal, which can be used to describe the periodic load signal. However, it is very difficult to record random vibration loading process by using time domain load signal, but it is also very difficult to deal with the finite ele-ment. At this time, the frequency domain signal is used to record the random vibration load signal, and the power spectral density (PSD) function is used to describe the random load. For a complex finite element model of random vibra-tion analysis, a frequency response analysis is much more convenient than a time domain transient dynamic analysis, because of a large amount of computa-tion [9].
A finite element analysis based on frequency domain can greatly simplify the calculation. Designers can now perform on the finite element model frequency response analysis, in order to obtain the transfer function between the input and the structural stress, then multiplied by the transfer function of the input power spectral density, to obtain spectral density stress. In this paper, the fatigue dam-age is calculated according to the stress power spectrum density.

T. Ismael, B. Y. Sheng
13
4.1. Parametric Analysis of Stress Fatigue Characteristic Curve
1) Parameter analysis of S-N curve The S-N curve is described by a power exponent function, which is presented
in the logarithmic coordinate. The equation is ( )b1S SRI1 N= , where SRI1 is the interpolation of Y and b1 is the slope. The curve actually has two slopes and a turning point, if the second slope is zero, it will appear as a fatigue limit. Wherein the slope of line b is obtained by the famous Basquin criterion [10] [11].
1b
00
SN NS
=
(1)
Under the usual conditions, the fatigue transition point is 10e6, and the cor-responding fatigue limit is 0S . If the fatigue data for fatigue life points and be-fore fatigue life points are known, we can determine the slope b1 of Basquin. The main chip, fatigue test data of the water pipeline material are as follows:
Using Table 1 fatigue strength data of two fatigue life points N = 10e5, N = 10e6, combined with the Basquin criterion, to obtained the Basquin slope of the winning piece b1 = −0.07704. Taking the main piece of fatigue cycle has 10e6 and by using the formula ( )bS SRI1 N= , combined with the fatigue strength of N = 10e6, with b1 = −0.077041, the SRI1 value is 597.19.
Some metal materials (such as aluminum alloy or the like non-ferrous metal) fatigue limit is not obvious. Their fatigue limit will never be close to the hori-zontal straight line; we refer to the S-N curve of the similar aluminum material in the fatigue material library. In this paper b2 and b1 main chip is equal.
2) MSC. Fatigue drawing process of stress fatigue characteristic curve as shown in Figures 6-8.
The S-N data of the main chip is shown in Table 2. 3) Material fatigue properties Figure 9 as the main chip of the fatigue characteristics of the interface, the
significance of each parameter is shown below. Material-Predefined material: Finish-polishing surface is divided into: Untreated, polishing, grinding, etc.
(this paper did not process with it). Treatment-Surface treatment is divided into: No treatment, nitriding, cold
rolling, etc. (this paper did not process with it). Region-Predefined material components: Kf-Stress concentration factor (in this paper it is defined as 1.8).
Table 1. Material fatigue test data.
Aluminum Cycle times 10e5 Cycle times 10e6 Test stress ratio
Main piece 123 103 0.1
Water pipeline 129 106 0.1
Water pipeline 142 118 0.1

T. Ismael, B. Y. Sheng
14
Figure 6. Definition of the S-N curve of the main sheet material.
Figure 7. Definition of the S-N curve of the main sheet material.
Figure 8. S-N curve of main material.

T. Ismael, B. Y. Sheng
15
Table 2. S-N data of the main sheet material.
Material parameters Metric
(Stress Range Intercept) SRI1 597
(First fatigue strength exponent) b1 −0.07704
(Fatigue transition point) Nc1 1E6
(Second fatigue strength exponent) b2 −0.07704
(R-Ratio of test) RRAT 0.1
(Yield Strength) YS 57
(Ultimate Tensile Strength) UTS 156
(Elastic modulus) E 68,000
Figure 9. Fatigue characteristic of main blade material.
4.2. Random Vibration PSD Excitation Curve
MSC. Fatigue in the drawing of the PSD curve as shown in Figures 10-12. The above data is provided by the vibration test table. The horizontal coordi-
nate is the excitation frequency (Hz), and the longitudinal coordinate is the ex-citation amplitude ( 2g Hz ).
4.3. Fatigue Vibration Analysis
The frequency of random vibration fatigue analysis first makes the unit load frequency response analysis in Nastran, then the time load curve and the material

T. Ismael, B. Y. Sheng
16
Figure 10. Z direction amplitude frequency excitation curve test bench.
Figure 11. Y direction amplitude frequency excitation curve test bench.
S-N fatigue characteristic parameters are input in the fatigue software MSC. Fa-tigue, and at the last proceed to the after-fatigue treatment.
1) fatigue vibration analysis results In this paper, we mainly consider the radiator structure under random vibra-
tion excitation, fatigue life of radiator structure. So, in this paper, the fatigue analysis method (vibration fatigue analysis method) is used to analyze the ran-dom vibration fatigue life of the radiator. Based on the fatigue analysis software MSC Fatigue, the Dirlik method was adopted to carry out the average stress cor-rection of the Goodman method, to load the S-N curve of the main chip. The PSD load curve of the vibration test table is used as the load input, and then the fatigue life analysis and prediction of the radiator are carried out based on the probability Miner linear fatigue cumulative damage theory.

T. Ismael, B. Y. Sheng
17
The fatigue analysis of the cloud chart shown in Figures 13-16 can be known, the main cause of fatigue failure of the radiator is X direction minimum vibra-tion structure life. X direction is 1.19e7 seconds (3305 hours), the minimum life point appears in the middle of the main piece near the water chamber.
Radiator test bench requirements, under the restraint of the damping pad, the heat sink is subjected to the axial load of PSD in X, Y and Z three directions. In addition, the water chamber is connected with the cooling liquid pipe, the pressure of the internal coolant is 1.7 Mpa, and the duration of each axial time is 32 hours.
Figure 12. X direction amplitude frequency excitation curve test bench.
Figure 13. Radiator main chip Z direction test bench lifetime cloud chart.

T. Ismael, B. Y. Sheng
18
Figure 14. Radiator main chip Y direction test bench lifetime cloud chart.
Figure 15. Radiator main chip X direction test bench lifetime cloud chart.
2) Error analysis of vibration fatigue According to the experimental requirements of vibration fatigue test bench, to
T. Ismael, B. Y. Sheng
19
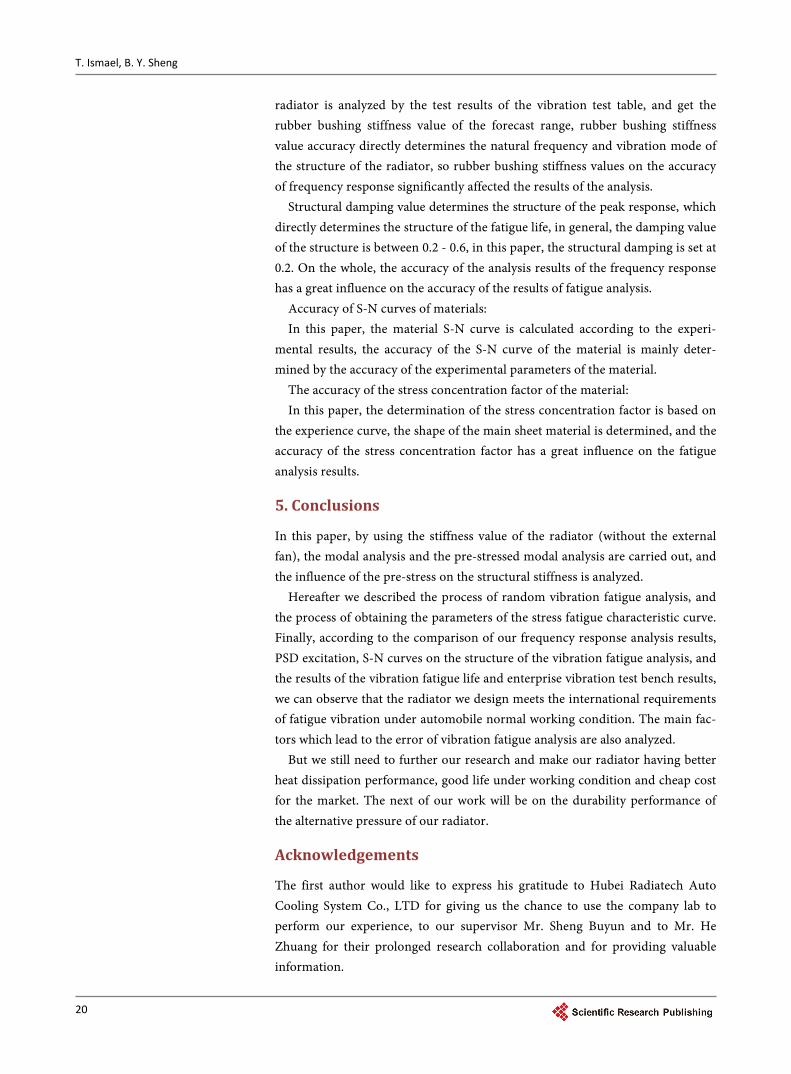
Figure 16. Test bench vibration fatigue failure point.
reduce vibration the radiator is connected to the test bench thru rubber bush, and must withstand X, Y, Z three directions in the axial PSD load effect. The duration of each axial direction is not less than 32 hours, the total duration of the three directions is not less than 96 hours.
According to the vibration fatigue test bench test results, the radiator after 96 hours of vibration fatigue test, the location of the damage occurred mainly in the radiator positioning pin area, and the radiator fin did not occur any damage.
The experimental results show that the radiator fin is not damaged after 96 hours of vibration test, this paper calculates that the minimum life of the radia-tor fin is about 3305 hours. Due to the factors that lead to the error of vibration fatigue analysis, this paper discusses the factors that lead to the error of vibration fatigue from the following three aspects: The accuracy of the results of frequency response analysis, the accuracy of the material S-N fatigue curve, the accuracy of the stress concentration factor.
Accuracy of frequency response analysis: The main factors that affect the accuracy of the frequency response analysis re-
sults are: Rubber bushing stiffness values of accuracy, the definition of the damp-ing ratio, the quality structure of reasonable weight, the finite element mesh ratio-nality constraints of boundary conditions and the load test bench compliance.
Spring, mass, damping is the 3 basic components of the power system, and the error of frequency response analysis is mainly produced by these three factors.
In the vibration test, the influence of rubber bushing on the structural rigidity of the radiator must be considered because of the connection between the rubber bushing and the vibration test table. The six-directional stiffness value of rubber bushing is a difficult problem. In this paper, the stiffness of the bushing of the
T. Ismael, B. Y. Sheng
20
radiator is analyzed by the test results of the vibration test table, and get the rubber bushing stiffness value of the forecast range, rubber bushing stiffness value accuracy directly determines the natural frequency and vibration mode of the structure of the radiator, so rubber bushing stiffness values on the accuracy of frequency response significantly affected the results of the analysis.
Structural damping value determines the structure of the peak response, which directly determines the structure of the fatigue life, in general, the damping value of the structure is between 0.2 - 0.6, in this paper, the structural damping is set at 0.2. On the whole, the accuracy of the analysis results of the frequency response has a great influence on the accuracy of the results of fatigue analysis.
Accuracy of S-N curves of materials: In this paper, the material S-N curve is calculated according to the experi-
mental results, the accuracy of the S-N curve of the material is mainly deter-mined by the accuracy of the experimental parameters of the material.
The accuracy of the stress concentration factor of the material: In this paper, the determination of the stress concentration factor is based on
the experience curve, the shape of the main sheet material is determined, and the accuracy of the stress concentration factor has a great influence on the fatigue analysis results.
5. Conclusions
In this paper, by using the stiffness value of the radiator (without the external fan), the modal analysis and the pre-stressed modal analysis are carried out, and the influence of the pre-stress on the structural stiffness is analyzed.
Hereafter we described the process of random vibration fatigue analysis, and the process of obtaining the parameters of the stress fatigue characteristic curve. Finally, according to the comparison of our frequency response analysis results, PSD excitation, S-N curves on the structure of the vibration fatigue analysis, and the results of the vibration fatigue life and enterprise vibration test bench results, we can observe that the radiator we design meets the international requirements of fatigue vibration under automobile normal working condition. The main fac-tors which lead to the error of vibration fatigue analysis are also analyzed.
But we still need to further our research and make our radiator having better heat dissipation performance, good life under working condition and cheap cost for the market. The next of our work will be on the durability performance of the alternative pressure of our radiator.
Acknowledgements
The first author would like to express his gratitude to Hubei Radiatech Auto Cooling System Co., LTD for giving us the chance to use the company lab to perform our experience, to our supervisor Mr. Sheng Buyun and to Mr. He Zhuang for their prolonged research collaboration and for providing valuable information.

T. Ismael, B. Y. Sheng
21
References [1] Ismael, T., Bu Yun, S. and Ulugbek, F. (2016) Radiator Heat Dissipation Perfor-
mance. Journal of Electronics Cooling and Thermal Control, 6, 88-96. https://doi.org/10.4236/jectc.2016.62008
[2] Zhang, H. (2005) FPSO Structural Fatigue Analysis. Tianjin University, Tianjin.
[3] Li, Q., Zhao, J.-C. and Zhao, B. (2009) Fatigue Life Prediction of a Rubber Mount Based on Test of Material Properties and Finite Element Analysis. Engineering Failure Analysis, 16, 2304-2310. https://doi.org/10.1016/j.engfailanal.2009.03.008
[4] Luo, R.K. and Wu, W.X. (2006) Fatigue Failure Analysis of Anti-Vibration Rubber Spring. Engineering Failure Analysis, 13, 110-116. https://doi.org/10.1016/j.engfailanal.2004.10.012
[5] Gent, A.N. (2007) Engineering with Rubber. Hanser Gardner Publications, Ohio.
[6] Shen, K. (2008) Finite Element Dynamic Analysis and Fatigue Life Prediction of a Gun Cradle. Nanjing University of Science and Technology, Nanjing.
[7] Dolinski (1993) Comparison of a Stochastic Model of Fatigue Crack Growth with Experiments. Engine Fracture Mechanicals, 16, 1021-1034. https://doi.org/10.1111/j.1460-2695.1993.tb00075.x
[8] Scbczy, K. (1986) Modeling of Random Fatigue Crack Growth. Engine Fracture Mechanicals, 24, 609-623. https://doi.org/10.1016/0013-7944(86)90234-1
[9] Li, D.Y. (2011) Nominal Stress Method for Vibration Fatigue Life Analysis of Notched Specimens. Nanjing University of Aeronautics & Astronautics, Nanjing.
[10] Chapman, C.B. and Pinfold, M. (2001) The Application of a Knowledge Based En-gineering Approach to the Rapid Design and Analysis of an Automotive Structure. Advances in Engineering Software, 32, 903-912. https://doi.org/10.1016/S0965-9978(01)00041-2
[11] Wang, M.Z. (2009) Study on Fatigue Life Analysis of Structural Vibration. Nanjing University of Aeronautics & Astronautics, Nanjing.
Submit or recommend next manuscript to SCIRP and we will provide best service for you:
Accepting pre-submission inquiries through Email, Facebook, LinkedIn, Twitter, etc. A wide selection of journals (inclusive of 9 subjects, more than 200 journals) Providing 24-hour high-quality service User-friendly online submission system Fair and swift peer-review system Efficient typesetting and proofreading procedure Display of the result of downloads and visits, as well as the number of cited articles Maximum dissemination of your research work
Submit your manuscript at: http://papersubmission.scirp.org/ Or contact [email protected]