Radiation Doses Received by the Irish Population · Radiation Doses Received by the Irish...
64
Radiation Doses Received by the Irish Population 2014 Cosmic Medical Radon & Thoron Artificial Food Gamma
Transcript of Radiation Doses Received by the Irish Population · Radiation Doses Received by the Irish...
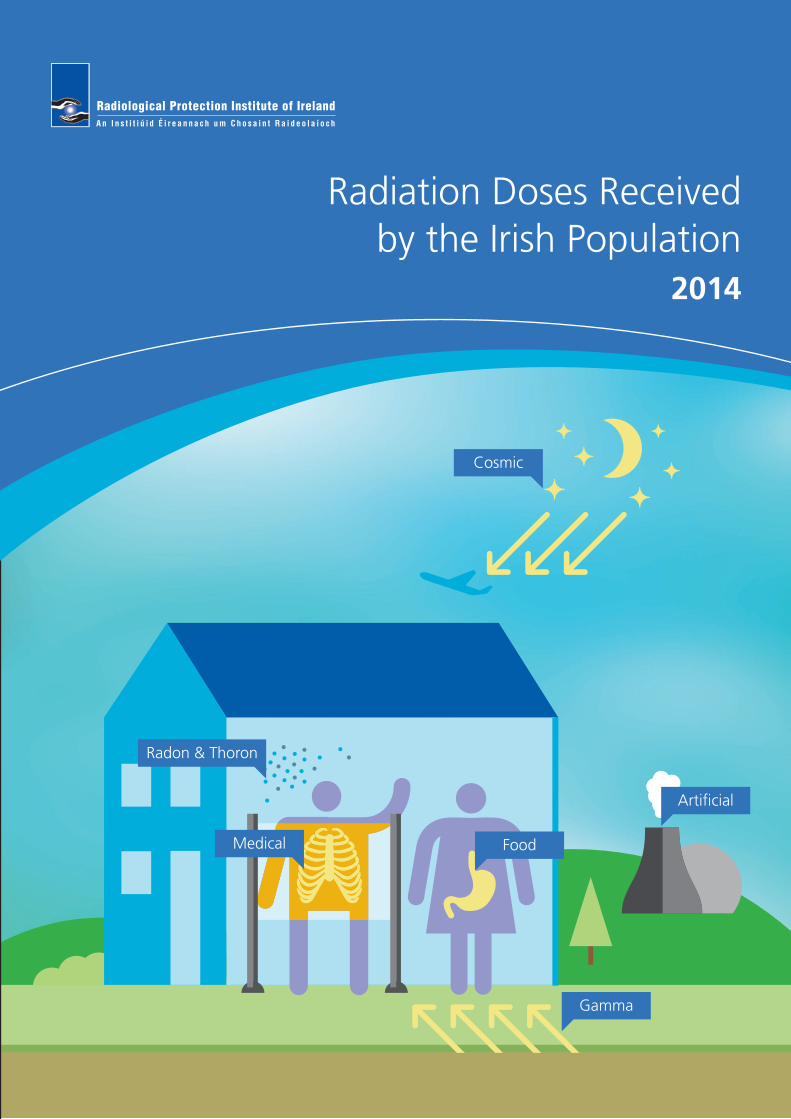
Radiation Doses Received by the Irish Population
2014
Cosmic
Medical
Radon & Thoron
Artificial
Food
Gamma

Radiation UnitsRadioactivity is measured in units called becquerels (Bq). One becquerel corresponds to one radioactive disintegration per second.
When measuring radioactive discharges to the environment or referring to the content of radioactive sources used in medicine, industry and education, it is more usual to talk in terms of kilobecquerels (kBq), megabecquerels (MBq), gigabecquerels (GBq) or terabecquerels (TBq)
1 kBq = 1000 Bq
1 MBq = 1,000,000 Bq
1 GBq = 1,000,000,000 Bq
1 TBq = 1,000,000,000,000 Bq
Much lower concentrations of radioactivity are normally found in the environment and so the measurement is often reported in units of millibecquerels (mBq). There are one thousand millibecquerels in a becquerel.
1 Bq = 1000 mBq
Radiation Dose When radiation interacts with body tissues and organs, the radiation dose received is a function of factors such as the type of radiation, the part of the body affected, the exposure pathway, etc. This means that one becquerel of radioactivity will not always deliver the same radiation dose. A unit called ‘effective dose’ has been developed to take account of the differences between different types of radiation so that their biological impact can be compared directly. Effective dose is measured in units called sieverts (Sv).
The sievert is a large unit, and in practice it is more usual to measure radiation doses received by individuals in terms of fractions of a sievert.
1 sievert = 1000 millisievert (mSv)
= 1,000,000 microsievert (µSv)
= 1,000,000,000 nanosievert (nSv)
In RPII reports the term ‘effective dose’ is often referred to as ‘radiation dose’ or simply ‘dose’.
Collective dose is the sum of the radiation doses received by each individual in the population. This allows comparison of the total radiation dose received from different sources. Collective dose is reported in units of man sieverts (man Sv) or man millisieverts (man mSv).
Average Annual Dose is the collective dose divided by the total population. Average Annual Dose is reported in units of sieverts, or fractions of a sievert.

Radiation Doses Received by the Irish Population
2014
RPII 14/02
by
C. O’Connor
L. Currivan
N. Cunningham
K. Kelleher
M. Lewis
S. Long
P. McGinnity
V. Smith
C. McMahon
June 2014

Radiation Doses Received by the Irish Population 20142
Contents
Executive Summary 3
1 Introduction 8
2 Radiation exposure pathways 10
2.1 Cosmic radiation 10
2.1.1 Cosmic radiation at sea level 10
2.1.2 Cosmic radiation due to air travel 10
2.2 Radioactivity in the environment 14
2.2.1 Natural radioactivity in the ground 14
2.2.2 Artificial radioactivity in soils 16
2.2.3 Artificial radioactivity in air 16
2.3 Radon in air 17
2.3.1 The National Radon Survey 19
2.3.2 Study of variation in radon concentrations in North Kerry 21
2.4 Thoron in indoor air 22
2.4.1 Thoron in Ireland 23
2.5 Radioactivity in food and drinking water 23
2.5.1 Natural radioactivity in food 24
2.5.2 Artificial radioactivity in food 29
2.5.3 Summary of radiation doses due to ingestion 31
2.6 Occupational exposure 33
2.6.1 Occupational exposure to natural radiation 33
2.6.2 Occupational exposure to artificial radiation 36
2.6.3 Occupational exposure to naturally occurring radioactive material (NORM) 38
2.6.4 Summary of occupational doses 38
2.7 Medical exposure of patients 39
2.7.1 Surveys and dose calculations 40
2.7.2 Total population dose from diagnostic medical imaging 43
3 Summary of doses 46
3.1 Collated results of this study 46
3.2 Comparison to 2008 population dose report 48
4 Conclusions 50
5 Acknowledgements 51
6 References 52
Appendix 1 – Summary of surveys of outdoor gamma radiation levels in Ireland 56
Appendix 2 – Radon measurements 57
Radiation Doses Received by the Irish Population 2014 3
Executive Summary
People are constantly exposed to a variety of sources of both natural and artificial radioactivity. The radiation dose received by the population
from such sources is periodically estimated by the Radiological Protection Institute of Ireland (RPII). This report is an update of a population
dose assessment undertaken in 2008 and includes the most recent data available on the principal radiation exposure pathways.
The average annual dose to a person in Ireland from all sources of radiation is now estimated as 4037 microsievert (µSv) which is consistent
with the value, 3950 µSv, estimated in 2008. Natural sources of radioactivity account for 86% of all radiation exposures in Ireland. Artificial
sources contribute approximately 14% and are dominated by the beneficial use of radiation in medicine. Doses from other artificial sources
such as Sellafield, Chernobyl, occupational exposure, etc., account for less than 1%.
Radon is the principal source of radiation exposure in Ireland, representing just over 55% of the average radiation dose. Most of this dose
is received in people’s homes although radon exposure at work accounts for the largest contribution to occupational exposure. For the
individual, exposure to radon is extremely variable with a measured range of exposure in Irish homes of between 250 µSv and 1,225,000 µSv
per annum.
This assessment includes data on pathways of exposure for which few Irish data were available in 2008, including: the results of a new study
of radioactivity in the Irish diet; new data on thoron in Irish homes; and a detailed evaluation of medical exposures which was undertaken
by the Health Service Executive (HSE). Wherever possible, the collective dose (i.e. the sum of the radiation doses received by the entire
population) and the resulting average annual dose to an individual living in Ireland, based on the most recently published figure for the
population of Ireland, have been calculated for each of the pathways of exposure.
Sources of radioactivityNatural sources include external radiation coming from outer space (cosmic radiation); external radiation produced by naturally occurring
radioactive elements contained in the earth’s crust (terrestrial radiation); the radioactive gases radon and thoron which can accumulate in
buildings; and radioactivity transferred to food and water which are consumed.
Artificial sources of radioactivity include nuclear weapons testing, nuclear accidents such as those at Chernobyl and Fukushima and
authorised releases from nuclear facilities abroad. Irish hospitals and research facilities also release small amounts of radioactivity into the Irish
marine environment.
Ionising radiation is used in medicine, industry and education and can result in radiation doses being received by some workers. In the
medical field, patients undergoing certain procedures will also receive measurable radiation doses.
Cosmic RadiationThe earth is continuously bombarded by high energy particles of extra-terrestrial origin. Collectively these particles are referred to as cosmic
radiation. Cosmic radiation is absorbed by the earth’s atmosphere and its intensity decreases strongly with decreasing altitude, but some of
it still reaches the earth’s surface. People receive a radiation dose from cosmic radiation both on the ground and while flying. The radiation
dose estimated for cosmic radiation (343 µSv) is consistent with the value found in the 2008 study.
Natural and Artificial Radioactivity in SoilsNaturally occurring radioactive elements have been present in rocks and soils since the formation of the earth. External exposure due to
gamma radiation from natural radionuclides in the ground varies with location and is mainly due to differences in the local geology and/
or soil type. There is an additional small contribution from artificial radioactivity present as a result of deposition following nuclear weapons
testing in the 1950s and 1960s and the Chernobyl accident in 1986. Gamma radiation is normally higher indoors than outdoors due to
radioactivity in building materials. The estimate of radiation dose from gamma radiation in the environment (301 µSv) is consistent with that
from the 2008 study.
Indoor Radon in Homes and WorkplacesRadon is a naturally occurring radioactive gas constantly formed in the soil by the radioactive decay of radium-226, a component of the
uranium-238 decay series. Outdoors, radon quickly dilutes to harmless levels, but when it enters a house or other building, it can sometimes
accumulate to unacceptably high levels.

Radiation Doses Received by the Irish Population 20144
The degree to which radon seeps indoors from these rocks and soil depends on a number of factors, including the type of underlying rocks
and soil, the porosity of the soil, the composition and condition of the foundation materials, and the ventilation rate of the building.
The public are exposed to radon at home and at work. Radon in the home is the largest component of the public’s exposure because of the
time spent at home compared to the workplace. The total average annual dose from radon is 2224 µSv, taking into account exposure at
home and in work. However, for the individual, exposure to radon is extremely variable depending on the concentration of radon to which
they are exposed.
Thoron in HomesThoron is a naturally occurring radioactive gas that is produced by the radioactive decay of radium-224, a component of the thorium-232
decay series. Where thoron differs from radon is that thoron has a very short half-life of 56 seconds and can only migrate a short distance
before it decays. For this reason, building materials rather than the soil beneath the house are usually the principal source of thoron in indoor
air.
The population dose assessment undertaken in 2008 estimated the average annual dose from thoron based on a pilot study of 40 Irish
homes. Since then, a more comprehensive study of thoron and its decay products has been completed in 205 Irish homes. In addition, new
estimates for dose coefficients for thoron and its decay products have been calculated. The current estimate of the average annual dose from
thoron is 350 µSv, which is an increase from 280 µSv in 2008. This increase is due to the updated dose conversion coefficients rather than
from increased thoron levels.
Radioactivity in food and drinking waterRadioactivity is present in all plants, animals and water from both natural and artificial sources. The radiation dose received from the
consumption of food and drinking water is dependent on the concentration of radionuclides in the food and water and on consumption
rates. In order to provide a representative figure for the average level of key radionuclides in the Irish diet, analysis of these levels of key
radionuclides in complete meals was conducted. The naturally occurring radionuclides included in the assessment were potassium-40,
carbon-14, radium-228, radium-226, polonium-210, lead-210 and rubidium-87. In addition, radionuclides present in seafood as a result of
discharges from the Sellafield reprocessing plant are analysed on an ongoing basis. The current estimate of the average annual dose from
radioactivity in food and water is 267 µSv which is marginally higher than the figure estimated in 2008 which was mainly based on data from
UK studies. Naturally occurring radioactivity in food accounts for 98% of the radiation dose with 2% as a result of artificial radioactivity.
Occupational ExposureIn addition to radon in all indoor workplaces, other groups of workers that are exposed to radiation include air crew who are occupationally
exposed to cosmic radiation, workers in mines and show caves who are exposed to enhanced levels of radon and staff working with
radioactive sources and X-rays in medicine, industry and education/research. Data from radon measurement companies, airlines, previous
RPII studies of certain classes of workplaces and the measurement of doses to staff who wear personal dosimeters were used to estimate the
collective occupational exposure to radiation, and hence the annual average to the whole population.
More than 99.9% of the radiation dose due to occupational exposure is attributable to exposure to natural radiation – mainly from radon in
above-ground workplaces but with a small contribution from the cosmic ray exposure of aircrew. Occupational exposure to artificial radiation
accounts for just 0.01% of the average dose estimate of 235 µSv.
Medical Exposure of PatientsMedical exposures are typically the largest component of the average dose from artificial sources of radiation. Estimating these exposures
requires information on the typical dose per investigation and the frequency of each investigation. Since the 2008 population dose report
was published, the HSE has carried out national surveys of a number of different diagnostic imaging modalities, including computed
tomography (CT) and dental radiography in 2010, general X-ray imaging and nuclear medicine in 2011 and PET-CT in 2013. A pilot survey
for interventional radiology (including cardiology) was also carried out in 2013.
Radiation Doses Received by the Irish Population 2014 5
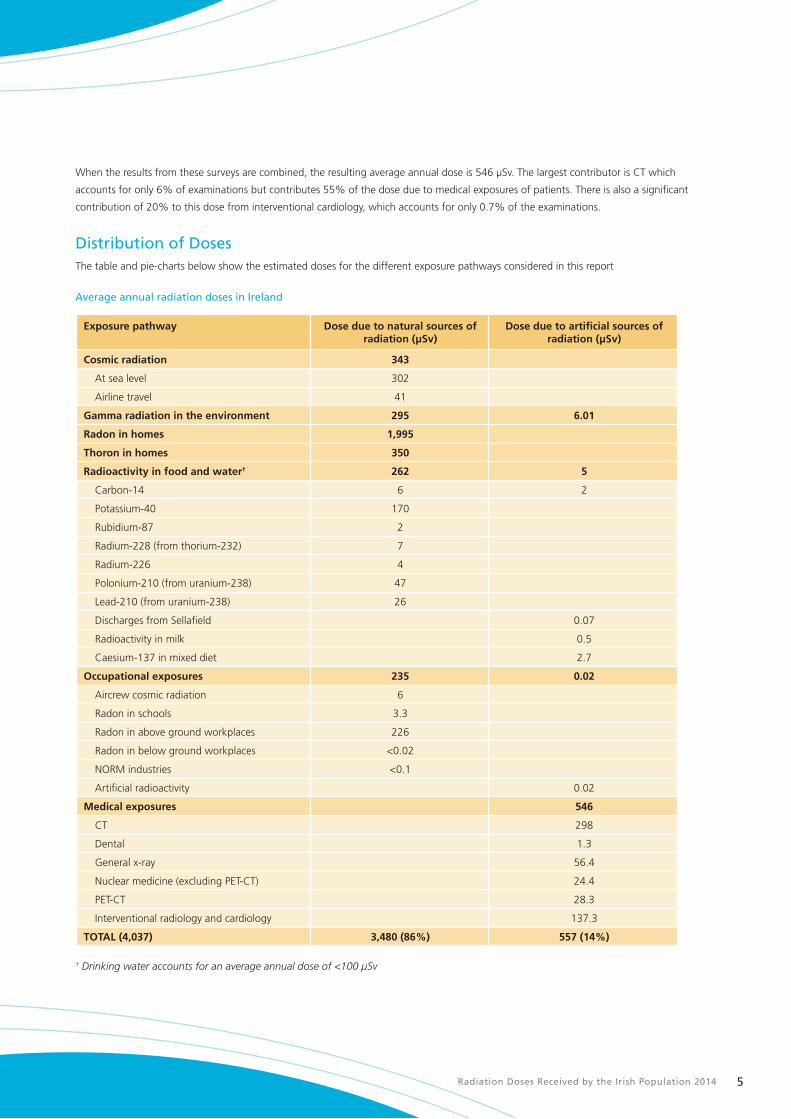
When the results from these surveys are combined, the resulting average annual dose is 546 µSv. The largest contributor is CT which
accounts for only 6% of examinations but contributes 55% of the dose due to medical exposures of patients. There is also a significant
contribution of 20% to this dose from interventional cardiology, which accounts for only 0.7% of the examinations.
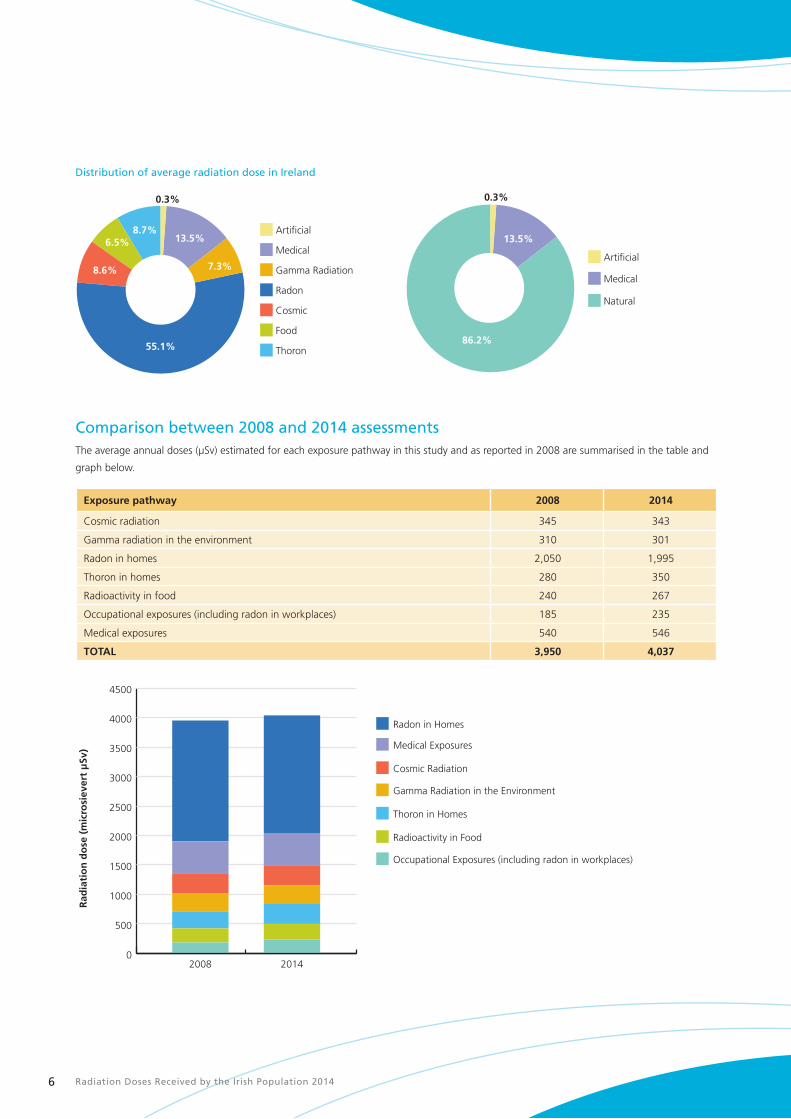
Distribution of Doses The table and pie-charts below show the estimated doses for the different exposure pathways considered in this report
Average annual radiation doses in Ireland
Exposure pathway Dose due to natural sources of radiation (µSv)
Dose due to artificial sources of radiation (µSv)
Cosmic radiation 343
At sea level 302
Airline travel 41
Gamma radiation in the environment 295 6.01
Radon in homes 1,995
Thoron in homes 350
Radioactivity in food and water† 262 5
Carbon-14 6 2
Potassium-40 170
Rubidium-87 2
Radium-228 (from thorium-232) 7
Radium-226 4
Polonium-210 (from uranium-238) 47
Lead-210 (from uranium-238) 26
Discharges from Sellafield 0.07
Radioactivity in milk 0.5
Caesium-137 in mixed diet 2.7
Occupational exposures 235 0.02
Aircrew cosmic radiation 6
Radon in schools 3.3
Radon in above ground workplaces 226
Radon in below ground workplaces <0.02
NORM industries <0.1
Artificial radioactivity 0.02
Medical exposures 546
CT 298
Dental 1.3
General x-ray 56.4
Nuclear medicine (excluding PET-CT) 24.4
PET-CT 28.3
Interventional radiology and cardiology 137.3
TOTAL (4,037) 3,480 (86%) 557 (14%)
† Drinking water accounts for an average annual dose of <100 µSv
Radiation Doses Received by the Irish Population 20146
Distribution of average radiation dose in Ireland
Thoron
Food
Cosmic
Radon
Gamma Radiation
Medical
Artificial
55.1%86.2%
7.3%
13.5% 13.5%
8.6%
6.5%8.7%
0.3% 0.3%
Natural
Medical
Artificial
Comparison between 2008 and 2014 assessmentsThe average annual doses (µSv) estimated for each exposure pathway in this study and as reported in 2008 are summarised in the table and
graph below.
Exposure pathway 2008 2014
Cosmic radiation 345 343
Gamma radiation in the environment 310 301
Radon in homes 2,050 1,995
Thoron in homes 280 350
Radioactivity in food 240 267
Occupational exposures (including radon in workplaces) 185 235
Medical exposures 540 546
TOTAL 3,950 4,037
0
500
1000
1500
2000
2500
3000
3500
4000
4500
Radon in Homes
Medical Exposures
Cosmic Radiation
Gamma Radiation in the Environment
Thoron in Homes
Radioactivity in Food
Occupational Exposures (including radon in workplaces)
20142008
Rad
iati
on
do
se (
mic
rosi
ever
t μ
Sv)

Radiation Doses Received by the Irish Population 2014 7
Main findingsThe main findings were as follows:
n Radon continues to be the principal source of radiation exposure in Ireland, representing just over
55% of the radiation dose received by the Irish population. Radon is also the most variable source
of radiation exposure with radon concentrations in Irish homes ranging from 10 Bq/m3 up to
49,000 Bq/m3, corresponding to annual doses of 250 µSv to 1,225,000 µSv.
n Medical exposure of patients remains by far the largest man-made contributor to the collective dose.
n No significant increase has been observed in the collective and average annual doses from medical
exposure since 2008, however, the HSE surveys that were conducted between 2010 and 2013 now
provide a comprehensive set of national baseline data against which future surveys may be compared
to track changes to the population’s radiation doses from medical exposure.
n Other sources such as fallout from nuclear accidents and weapons tests or discharges of nuclear or
radioactive waste to the environment remain at very low levels

Cosmic
Medical
Radon & Thoron
Artificial
Food
Gamma
Radiation Doses Received by the Irish Population 20148
1 Introduction
People are constantly exposed to radiation from a variety of sources, natural and artificial.
Natural sources include external radiation coming from outer space (cosmic radiation); external radiation produced by naturally occurring
radioactive elements contained in the earth’s crust (terrestrial radiation); the radioactive gases radon and thoron, which can accumulate in
buildings; and radioactivity transferred to food and water that are then consumed by humans.
Artificial (or man-made) sources of radioactivity include nuclear weapons testing, nuclear accidents such as those at Chernobyl and
Fukushima, and authorised releases from nuclear facilities abroad. All these have resulted in radioactivity reaching Ireland. Irish hospitals and
research facilities located along the coastline also release small amounts of radioactivity into the Irish marine environment. As with sources of
natural radioactivity, artificial radioactivity can give an external radiation dose and can also be transferred through the food chain to give an
internal radiation dose.
Radioactivity and radiation sources are used in medicine, industry and education. This can result in radiation doses being received by some
workers in all these sectors. In the medical field, patients undergoing certain procedures will also receive measurable radiation doses.
Radiation Doses Received by the Irish Population 2014 9
Under Statutory Instrument No. 125 of 2000 (Stationery Office, 2000) the Radiological Protection Institute of Ireland is obliged to make
periodic assessments of the radiation dose received by the population. This report is an update of the 2008 population dose assessment
(Colgan et al., 2008) and includes the most recent available data on all of the principal radiation pathways. This report also includes data on
pathways for which few Irish data was available in 2008. Where possible, the collective dose (i.e. the sum of the radiation doses received
by the entire population) is calculated for the pathway, which allows comparison of the total radiation dose received from each pathway.
The average annual dose to an individual person living in Ireland is also estimated based on the most recently published figure for the total
population of 4.59 million (Central Statistics Office, 2012b). The collective and average annual doses are compared to those in the 2008
population dose assessment to determine if there has been any significant change since the previous evaluation was done.
Some radiation sources involve exposure to radiation both out-of-doors and inside buildings. Estimates of radiation doses in the home have
traditionally been based on an occupancy rate of 80% recommended by international organisations (ICRP, 1993) (UNSCEAR, 2000). For the
sake of consistency, this 80% value is applied throughout this report.
The report also presents some additional information to explain how doses to the population are assessed; these include, for example, a
radon prediction map and methodologies for screening drinking water. The report deals only with ionising radiation. Exposure to other types
of radiation such as that from microwaves, mobile telephones and overhead power lines is not considered.

Radiation Doses Received by the Irish Population 201410
2 Radiation exposure pathways
2.1 Cosmic radiationCosmic radiation refers both to energetic, charged particles of extra-terrestrial origin that strike the earth’s atmosphere (primary particles) and
particles generated by the interaction of these with stable nuclides in the atmosphere (secondary particles) (UNSCEAR, 2000).
2.1.1 Cosmic radiation at sea level
As the primary particles from cosmic radiation (mainly protons) are quickly attenuated by the earth’s atmosphere, at sea level the cosmic rays
that irradiate humans are mainly secondary particles, such as muons, electrons and neutrons (Bouville & Lowder, 1988).
Cosmic radiation is generally categorised into a neutron component and a directly ionising component. The intensity of the directly ionising
component decreases strongly with decreasing altitude: the mass of air available for attenuation of incident particles decreases with height
above sea level. The intensity is also affected, to a lesser extent, by the (geomagnetic) latitude, with the intensity of the lower-energy primary
cosmic ray charged particles highest at the poles and lowest at the equator. The intensity of the neutron component on the other hand does
not vary significantly with altitude or latitude.
Ireland is centred at a latitude of approximately 54ºN. According to the United Nations Scientific Committee on the Effects of Atomic
Radiation (UNSCEAR, 2000), at sea level between the latitudes of 50° and 60° the directly ionising component of cosmic radiation delivers a
dose rate of 32 nSv/h while that due to neutrons is 9 nSv/h. This gives a total of 41 nSv/h.
The directly ionising component of cosmic radiation can be calculated (see the insert Cosmic radiation and altitude on page 13) or
measured. A small number of such measurements have been made in Ireland, with the values obtained ranging from 27 to 49 nSv/h, with
a mean value of 35 nSv/h (Colgan, 1980). Thus, the results obtained are consistent with the values quoted in international reviews, such as
UNSCEAR (2000).
Based on the recommended UNSCEAR value of 41 nSv/h, the individual annual dose outdoors arising from cosmic radiation is 360 µSv. This
figure must be adjusted to take account of the shielding effect of building materials, which absorb cosmic radiation with the consequence
that exposures are lower indoors compared with outdoors. UNSCEAR (2000) recommends the use of an average building shielding factor
of 0.8 along with an indoor occupancy factor of 0.8. Applying these correction factors, the individual annual dose caused by to exposure to
cosmic radiation at sea level in Ireland is typically 302 µSv.
2.1.2 Cosmic radiation due to air travel
As cosmic radiation increases with altitude, those who travel by air have an additional radiation dose. This section considers the dose to air
passengers caused by cosmic radiation. Air crew doses are discussed in Section 2.6.1 on occupational exposures.
The Central Statistics Office publishes detailed information on the frequency of air trips abroad each year by Irish residents to the most
popular destinations. This information has been used to calculate the collective dose on each route for 2012 (Central Statistics Office, 2013a
and Central Statistics Office, 2013b) and the average annual individual dose has been calculated from that. As a first step, a ‘typical’ routing
was chosen for each country or region – this was normally the capital city or, if this was considered unrepresentative, either a large city close
to the centre of the country or region, or a well-known holiday destination. In the case of Spain, calculations were made both for Madrid, as
a location typical of the mainland, and for Tenerife, because of the large number of holiday flights from Ireland to the Canary Islands. Dublin
has been used as the departure point for all the calculations. In the case of routes that are not served by a direct flight, doses were calculated
for travel via London, with the exception of Sydney (via Abu Dhabi) and Los Angeles (via New York).
A number of computer programs have been developed to estimate the doses from cosmic radiation received by air crew. The same programs
can be used to calculate the doses received by passengers. For this study, all calculations have been made using EPCARD (European Package
for the Calculation of Aviation Route Doses), a model approved and tested by the European Commission for use in estimating occupational
radiation exposure of air crew (European Commission, 2004) (European Commission, 2012). EPCARD can be found online at
http://www.helmholtz-muenchen.de/en/epcard-portal/.

Radiation Doses Received by the Irish Population 2014 11
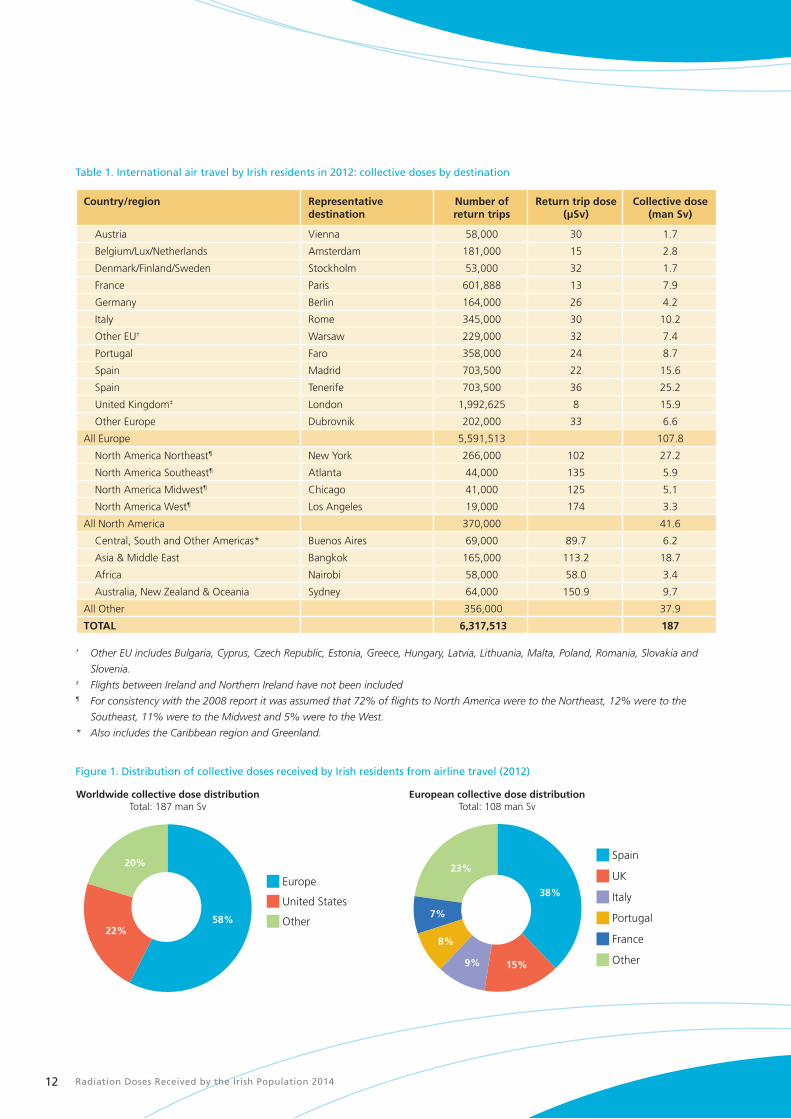
The distribution of collective doses as a result of passenger airline travel by Irish residents is summarised in Table 1, and worldwide and
European collective dose distributions are shown in Figure 1. While trips to Europe account for approximately 88% of all the trips taken in
2012, they account for only 58% of the collective dose. In contrast, trips to the United States account for only 6% of all flights but for 22%
of the collective dose.
Flights from Ireland to Spain, including the Canary Islands, account for 38% of the collective dose on European routes. This is followed by
the United Kingdom (15%) and the popular holiday destinations of Italy (9%), Portugal (8%) and France (7%). The distribution is broadly
similar to that observed in the 2008 population dose assessment (Colgan et al., 2008) though with a considerable increase in the collective
dose from trips to the UK and Portugal (UK routes increased by 53%, from 10.4 man Sv to 15.9 man Sv; and Portugal routes by 67% from
5.2 man Sv to 8.7 man Sv). The increase in the collective dose from flights to the UK and Portugal is due to a significant increase in the total
number of journeys to each of these countries.
The overall collective dose for flights to North America was found to be 36% lower than that calculated for the 2008 assessment – this was
due to a large drop in the number of return trips made by Irish residents to the US since the previous study. A similar trend was evident in
the number of return trips to Africa which have also decreased resulting in a collective dose that is 25% lower than in the 2008 assessment
(Colgan et al., 2008). In contrast, there has been a significant increase in the number of return trips to Asia and the Middle East as well as to
Central, South and Other Americas, resulting in the collective dose increasing by 80% and 67%, respectively for flights to those regions.
Differences between the return trip doses calculated for this assessment and that of 2008 may be attributable to variations in the intensity of
the cosmic ray flux for the years being assessed and, in some cases, to changes in the airline routings being operated within Europe.
The total collective dose from airline travel undertaken by Irish residents in 2012 is estimated to be approximately 187 man Sv which is very
similar to that estimated for the 2008 assessment (189 man Sv). The contribution that airline travel makes to the average annual dose is
arrived at by dividing the total collective dose from airline travel (187 man Sv) by the total population of 4.59 million (Central Statistics Office,
2012b), giving 41 µSv.
While the average annual dose for the whole population is 41 µSv, those people who never fly will receive no dose while those who
fly regularly may receive a higher dose from cosmic radiation. The Radiation Dose Calculator application on the RPII website allows the
calculation of individual doses that are caused by air travel.
Radiation Doses Received by the Irish Population 201412
Table 1. International air travel by Irish residents in 2012: collective doses by destination
Country/region Representativedestination
Number of return trips
Return trip dose (µSv)
Collective dose(man Sv)
Austria Vienna 58,000 30 1.7
Belgium/Lux/Netherlands Amsterdam 181,000 15 2.8
Denmark/Finland/Sweden Stockholm 53,000 32 1.7
France Paris 601,888 13 7.9
Germany Berlin 164,000 26 4.2
Italy Rome 345,000 30 10.2
Other EU† Warsaw 229,000 32 7.4
Portugal Faro 358,000 24 8.7
Spain Madrid 703,500 22 15.6
Spain Tenerife 703,500 36 25.2
United Kingdom‡ London 1,992,625 8 15.9
Other Europe Dubrovnik 202,000 33 6.6
All Europe 5,591,513 107.8
North America Northeast¶ New York 266,000 102 27.2
North America Southeast¶ Atlanta 44,000 135 5.9
North America Midwest¶ Chicago 41,000 125 5.1
North America West¶ Los Angeles 19,000 174 3.3
All North America 370,000 41.6
Central, South and Other Americas* Buenos Aires 69,000 89.7 6.2
Asia & Middle East Bangkok 165,000 113.2 18.7
Africa Nairobi 58,000 58.0 3.4
Australia, New Zealand & Oceania Sydney 64,000 150.9 9.7
All Other 356,000 37.9
TOTAL 6,317,513 187
† Other EU includes Bulgaria, Cyprus, Czech Republic, Estonia, Greece, Hungary, Latvia, Lithuania, Malta, Poland, Romania, Slovakia and
Slovenia.‡ Flights between Ireland and Northern Ireland have not been included¶ For consistency with the 2008 report it was assumed that 72% of flights to North America were to the Northeast, 12% were to the
Southeast, 11% were to the Midwest and 5% were to the West.
* Also includes the Caribbean region and Greenland.
Figure 1. Distribution of collective doses received by Irish residents from airline travel (2012)
Other
United States
Europe
Other
France
Portugal
Italy
UK
Spain
58%
20%
22%
38%
15%9%
8%
7%
23%
Worldwide collective dose distributionTotal: 187 man Sv
European collective dose distributionTotal: 108 man Sv
Radiation Doses Received by the Irish Population 2014 13
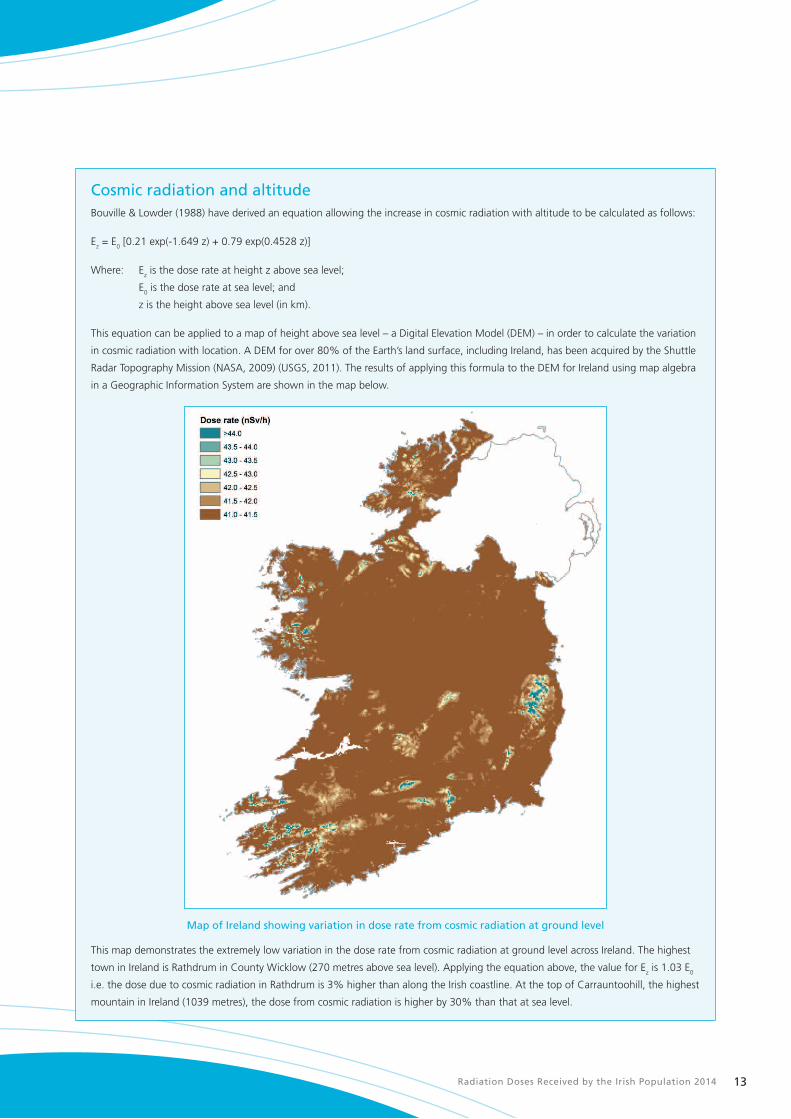
Cosmic radiation and altitudeBouville & Lowder (1988) have derived an equation allowing the increase in cosmic radiation with altitude to be calculated as follows:
Ez = E0 [0.21 exp(-1.649 z) + 0.79 exp(0.4528 z)]
Where: Ez is the dose rate at height z above sea level;
E0 is the dose rate at sea level; and
z is the height above sea level (in km).
This equation can be applied to a map of height above sea level – a Digital Elevation Model (DEM) – in order to calculate the variation
in cosmic radiation with location. A DEM for over 80% of the Earth’s land surface, including Ireland, has been acquired by the Shuttle
Radar Topography Mission (NASA, 2009) (USGS, 2011). The results of applying this formula to the DEM for Ireland using map algebra
in a Geographic Information System are shown in the map below.
Map of Ireland showing variation in dose rate from cosmic radiation at ground level
This map demonstrates the extremely low variation in the dose rate from cosmic radiation at ground level across Ireland. The highest
town in Ireland is Rathdrum in County Wicklow (270 metres above sea level). Applying the equation above, the value for Ez is 1.03 E0
i.e. the dose due to cosmic radiation in Rathdrum is 3% higher than along the Irish coastline. At the top of Carrauntoohill, the highest
mountain in Ireland (1039 metres), the dose from cosmic radiation is higher by 30% than that at sea level.
Radiation Doses Received by the Irish Population 201414
2.2 Radioactivity in the environment
2.2.1 Natural radioactivity in the ground
Naturally occurring radioactive elements have been present in rocks and soils since the formation of the earth. The amount of external
exposure from natural radionuclides in the ground varies with location and is mainly due to differences in the local geology and/or soil type.
Outdoor gamma radiation levels in Ireland have been surveyed by a number of researchers. The contributions from cosmic radiation and
from instrument electronic noise were eliminated from the results of each survey in order to provide extensive datasets of radiation levels due
solely to radioactivity in the ground, both of natural and artificial origin. Further details on the surveys that were carried out can be found in
Appendix 1.
As in the 2008 population dose report, the best estimate for an average external gamma dose rate used here is found by weighting the two
national surveys by Colgan (1980) and by Marsh (1991) in accordance with the number of measurements in each. This results in an average
external gamma dose rate of 0.037 µGy/h. Following UNSCEAR’s recommendation that a factor of 0.7 be used to convert absorbed gamma
dose rate in air (in μGy/h) to units of radiation dose (in μSv/h) (UNSCEAR, 2000), we arrive at an average radiation dose of 0.026 µSv/h.
Account has to be taken of the fact that gamma radiation is normally higher indoors than outdoors. This is because while the materials
from which buildings are made tend to absorb the ambient terrestrial gamma radiation (and so reduce the dose received indoors), this is
counterbalanced by the additional contribution from the radioactivity contained in the building materials themselves.
The concentrations of radium-226 (Ra-226), thorium-232 (Th-232) and potassium-40 (K-40) in a range of building materials commonly used
in Ireland have been previously evaluated (Lee et al., 2004). The final results of the study were published in 2006 (Doorly, 2006) and have
been summarised in the 2008 population dose report (Colgan et al., 2008). The authors concluded that the normal use of these materials
would not result in radiation doses in excess of 1000 µSv per year, and that in the majority of cases the doses would be less than 300 µSv per
year to occupants.
McAulay and Colgan assessed the effect of building materials on gamma dose rate by performing measurements inside and outside 119 Irish
houses of different ages and construction materials (McAulay & Colgan, 1984). Measurements were made in the open air outside each house
and in three inside rooms. Surveys were carried out in two separate regions – one of known low background gamma radiation and the other
with relatively high natural background radioactivity. After the elimination of the cosmic radiation component, the average gamma dose rates
measured were 0.055 µGy/h indoors and 0.040 µGy/h outdoors. Therefore, in Ireland on the basis of this study, terrestrial gamma dose rates
arising from radioactivity in the soil are on average higher indoors than outdoors by a factor of 1.38. By comparison, the worldwide average
terrestrial gamma dose rate indoors is 1.4 times higher than outdoors, with regional values ranging from 0.8 to 2.0 (UNSCEAR, 1993).
Using an indoor occupancy factor of 0.8 (and therefore an outdoor occupancy factor of 0.2) and assuming a 38% higher dose rate indoors
compared with outdoors, the average annual individual dose, D, in Ireland due to terrestrial gamma radiation is:
D = 0.026 µSv/hr x 24 hrs x 365 days x [(0.8 x 1.38) + 0.2]
This gives a value of 297 µSv.
The work reported by Colgan and by McAulay & Colgan was carried out before the 1986 Chernobyl accident. For that reason, the
figures quoted above do not take into account the radioactivity deposited in Ireland following that accident. On the other hand, artificial
radioactivity deposited as a result of the atmospheric nuclear weapons tests carried out between 1954 and 1963 does contribute to the
measured gamma dose rates. This contribution is estimated to be 2 µSv annually (see Section 2.2.2). Therefore the representative annual
dose due to natural radioactivity present in the ground (terrestrial gamma radiation) has been taken as 295 µSv, with a typical range of 50 to
1200 µSv.
Radiation Doses Received by the Irish Population 2014 15
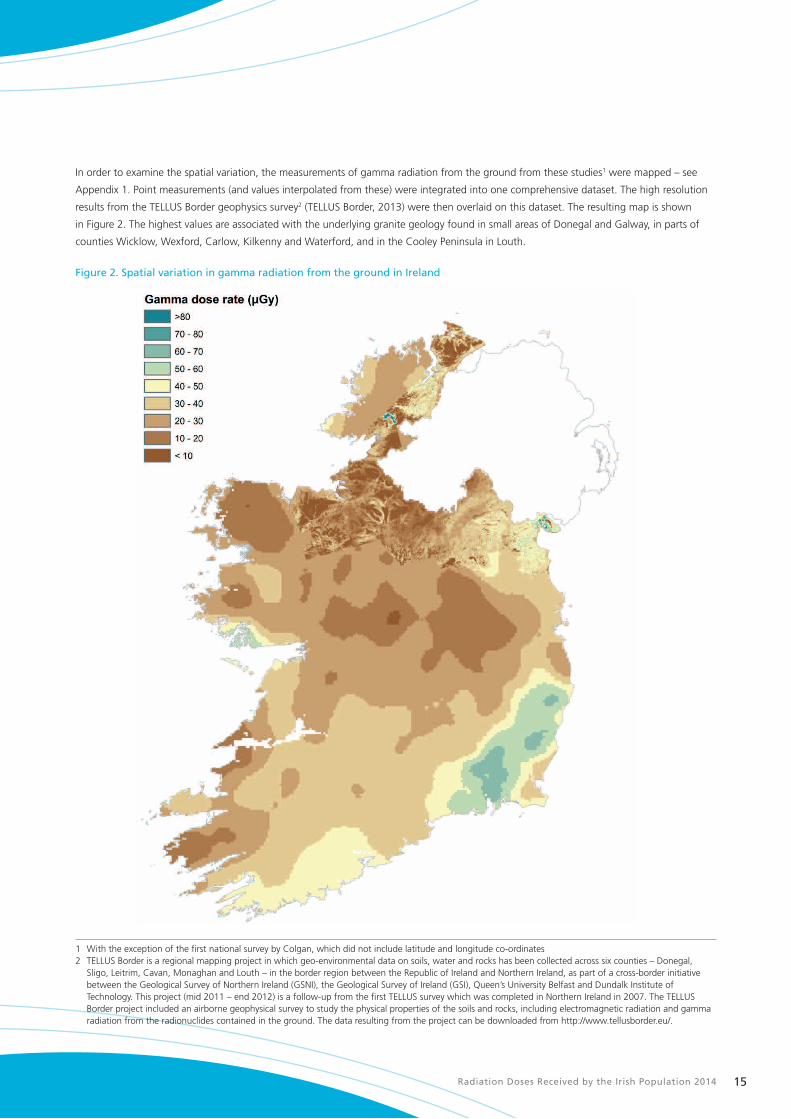
In order to examine the spatial variation, the measurements of gamma radiation from the ground from these studies1 were mapped – see
Appendix 1. Point measurements (and values interpolated from these) were integrated into one comprehensive dataset. The high resolution
results from the TELLUS Border geophysics survey2 (TELLUS Border, 2013) were then overlaid on this dataset. The resulting map is shown
in Figure 2. The highest values are associated with the underlying granite geology found in small areas of Donegal and Galway, in parts of
counties Wicklow, Wexford, Carlow, Kilkenny and Waterford, and in the Cooley Peninsula in Louth.
Figure 2. Spatial variation in gamma radiation from the ground in Ireland
1 With the exception of the first national survey by Colgan, which did not include latitude and longitude co-ordinates 2 TELLUS Border is a regional mapping project in which geo-environmental data on soils, water and rocks has been collected across six counties – Donegal,
Sligo, Leitrim, Cavan, Monaghan and Louth – in the border region between the Republic of Ireland and Northern Ireland, as part of a cross-border initiative between the Geological Survey of Northern Ireland (GSNI), the Geological Survey of Ireland (GSI), Queen’s University Belfast and Dundalk Institute of Technology. This project (mid 2011 – end 2012) is a follow-up from the first TELLUS survey which was completed in Northern Ireland in 2007. The TELLUS Border project included an airborne geophysical survey to study the physical properties of the soils and rocks, including electromagnetic radiation and gamma radiation from the radionuclides contained in the ground. The data resulting from the project can be downloaded from http://www.tellusborder.eu/.
Radiation Doses Received by the Irish Population 201416
2.2.2 Artificial radioactivity in soils
In addition to the dose from natural radioactivity, there is an additional contribution from artificial radioactivity present in Irish soils. Artificial
radionuclides are present mainly as a result of deposition following the Chernobyl accident and to a lesser extent from nuclear weapons
testing in the 1950s and 1960s. The most significant artificial radionuclide from the point of view of radiation dose is caesium-137 (Cs-137) –
this is due to its relatively long half-life (approximately 30 years).
The distribution of artificial radioactivity in Irish soils has been studied by Ryan (1991); the Cs-137 deposition data from both nuclear
weapons testing and from the Chernobyl accident are summarised in Table 2 below.
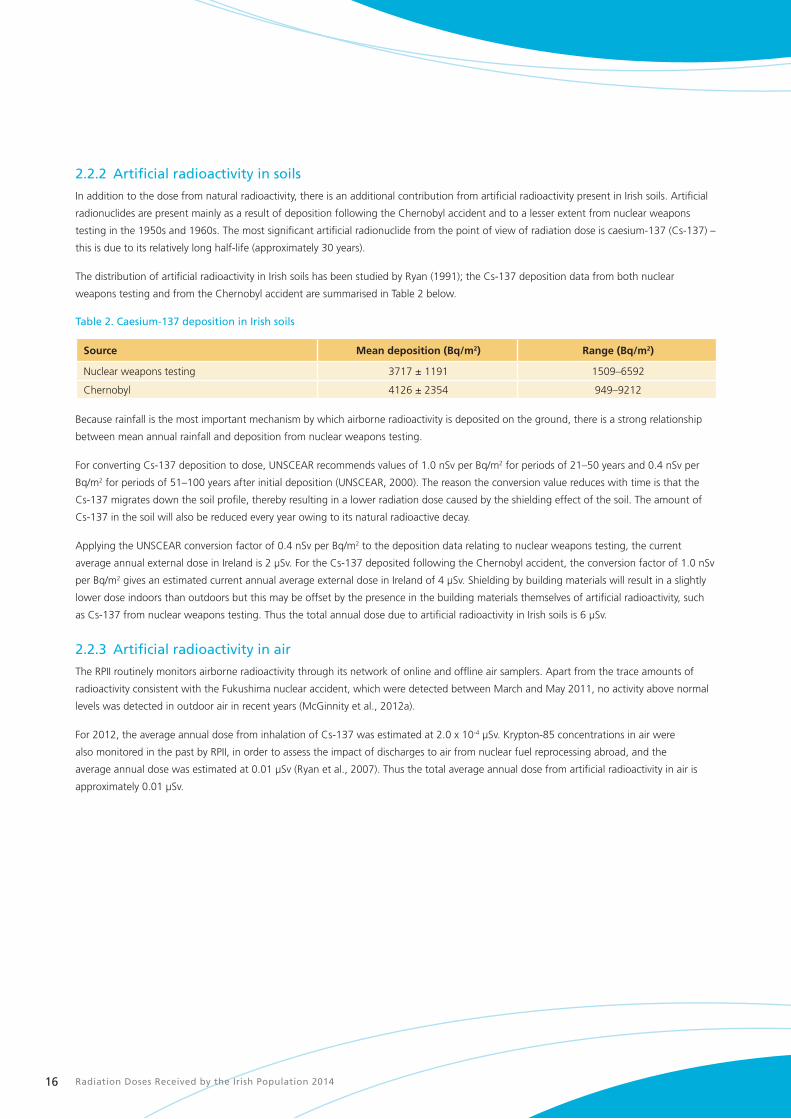
Table 2. Caesium-137 deposition in Irish soils
Source Mean deposition (Bq/m2) Range (Bq/m2)
Nuclear weapons testing 3717 ± 1191 1509–6592
Chernobyl 4126 ± 2354 949–9212
Because rainfall is the most important mechanism by which airborne radioactivity is deposited on the ground, there is a strong relationship
between mean annual rainfall and deposition from nuclear weapons testing.
For converting Cs-137 deposition to dose, UNSCEAR recommends values of 1.0 nSv per Bq/m2 for periods of 21–50 years and 0.4 nSv per
Bq/m2 for periods of 51–100 years after initial deposition (UNSCEAR, 2000). The reason the conversion value reduces with time is that the
Cs-137 migrates down the soil profile, thereby resulting in a lower radiation dose caused by the shielding effect of the soil. The amount of
Cs-137 in the soil will also be reduced every year owing to its natural radioactive decay.
Applying the UNSCEAR conversion factor of 0.4 nSv per Bq/m2 to the deposition data relating to nuclear weapons testing, the current
average annual external dose in Ireland is 2 μSv. For the Cs-137 deposited following the Chernobyl accident, the conversion factor of 1.0 nSv
per Bq/m2 gives an estimated current annual average external dose in Ireland of 4 μSv. Shielding by building materials will result in a slightly
lower dose indoors than outdoors but this may be offset by the presence in the building materials themselves of artificial radioactivity, such
as Cs-137 from nuclear weapons testing. Thus the total annual dose due to artificial radioactivity in Irish soils is 6 μSv.
2.2.3 Artificial radioactivity in air
The RPII routinely monitors airborne radioactivity through its network of online and offline air samplers. Apart from the trace amounts of
radioactivity consistent with the Fukushima nuclear accident, which were detected between March and May 2011, no activity above normal
levels was detected in outdoor air in recent years (McGinnity et al., 2012a).
For 2012, the average annual dose from inhalation of Cs-137 was estimated at 2.0 x 10⁻⁴ µSv. Krypton-85 concentrations in air were
also monitored in the past by RPII, in order to assess the impact of discharges to air from nuclear fuel reprocessing abroad, and the
average annual dose was estimated at 0.01 µSv (Ryan et al., 2007). Thus the total average annual dose from artificial radioactivity in air is
approximately 0.01 µSv.
Radiation Doses Received by the Irish Population 2014 17
2.3 Radon in airRadon-222, commonly referred to as radon, is a naturally occurring radioactive gas constantly formed in the soil by the radioactive decay
of radium-226 (Ra-226), a component of the uranium-238 decay series. You cannot smell it, see it or taste it and it can only be measured
with special equipment. Outdoors, radon quickly dilutes to harmless levels, but when it enters a house or other building, it can sometimes
accumulate to unacceptably high levels. The degree to which radon seeps indoors from these rocks and soil depends on a number of factors,
including the type of underlying rocks and soil, the porosity of the soil, the composition and condition of the foundation materials, and the
ventilation rate in the rooms. Small cracks in the floors or foundation of a building or gaps around pipes or cables may allow high levels of
radon to enter a building.
A research project carried out by RPII and Trinity College Dublin during 2011–2012 measured the concentration of radon in outdoor air at a
number of locations throughout Ireland. The average concentration measured was 5.6 Bq/m3 (Gunning et al., [in press]), which tallies closely
with the previous estimate of 6 Bq/m3 which was based on the extrapolation of data analysed during the National Radon Survey (Fennell et
al., 2002), rather than on direct measurements.
The concentration of radon in indoor air is normally higher and more variable than that found outdoors and depends on several factors such
as the concentration present in the underlying soil, the existence of entry routes in the foundations and the substructure of the building, and
on the prevailing weather conditions. In addition, the pressure differential between outdoors and indoors leads to a pressure-driven flow
of radon into buildings. Considering the shorter time that people spend outdoors and the low concentrations of radon, the radiation dose
received from radon outdoors is considered to be negligible relative to that received indoors.
As mentioned in Section 2.2.1, Ra-226 is also present in most building materials. This is an additional source of radon in indoor air.
However, in situations where high indoor radon concentrations are present, it is normally the soil rather than the building materials that is
the primary source (ICRP, 1993). There can also be a small additional contribution to the radon concentration in air from domestic water
supplies. Relatively high radon concentrations have previously been identified in a small number of private Irish groundwater supplies (Ryan
et al., 2003). However, a recent study of radon in groundwater has shown that none of the samples measured exceeded the recommended
maximum (500 Bq/l) for public drinking water supplies (Dowdall et al., 2013). Surface water supplies normally contain little or no radon
because agitation of the water releases any radon present into the air. Overall, radon dissolved in drinking water generally makes a small
contribution to the indoor radon concentrations relative to that derived from the soil beneath the building.
What is referred to as ‘radon’ is in fact a mixture of radon gas and associated decay products (see Figure 3). When inhaled, radon gas may
decay within the body, thereby giving rise directly to a radiation dose. However, of much more significance from the point of view of dose
are the radon decay products, in particular those that emit alpha radiation. These daughter products can attach themselves to microscopic
particles in the air and, when inhaled, can be deposited in the lungs and deliver high radiation doses to a small volume of lung tissue. It has
been estimated that only 2% of the dose from radon is actually due to radon gas, with the remainder attributable to the inhalation of its
decay products (Peterman & Perkins, 1988).

Radiation Doses Received by the Irish Population 201418
Figure 3. Uranium-238 decay series
The symbols α and β indicate alpha and beta decay, and the times shown are half-lives.
4.5 billion years 240,000 years
77,000 years
1,600 years
3.8 days
3.1 minutes 160 microseconds 140 days
α α
α
α
α
α α α
24 days
1.2 minutes
β
β
20 minutes 5.0 days
27 minutes 22 years
β β
β β
Uranium-238 Uranium-234
Protactinium-234m
Thorium-234 Thorium-230
Radium-226
Radon-222
Polonium-218 Polonium-214 Polonium-210
Lead-214 Lead-210
Bismuth-210Bismuth-214
Lead-206 (stable)

Radiation Doses Received by the Irish Population 2014 19
2.3.1 The National Radon Survey
Between 1992 and 1999 the RPII carried out the National Radon Survey (NRS), a comprehensive survey of radon concentrations in Irish
houses (Fennell et al., 2002). The NRS measured radon in houses on a geographical basis using the Irish 10 km x 10 km national grid as the
basic geographical unit. The principal objective of the survey was to quantify the scale of the radon problem in Ireland and to identify areas
where there was a higher risk of finding high indoor radon concentrations.
Radon measurements were completed in 11,319 houses, representing a sampling frequency of 1 in 116 of the national housing stock at the
time. All measurements were made for a continuous 12-month period in two rooms of each house surveyed, normally the main living area
and a bedroom. The two measurement results from each house were averaged. The data generated by the NRS is summarised on a county
basis in Table 3.
Table 3. Results of the national survey of radon in Irish houses
County measured Number of houses Number of houses > 200 Bq/m3
Radon concentration (Bq/m3)
Average Maximum
Carlow 194 30 (15%) 123 1,562
Cavan 180 5 (3%) 67 780
Clare 742 66 (9%) 88 1,489
Cork 1,211 71 (6%) 76 1,502
Donegal 487 18 (4%) 69 512
Dublin 155 6 (4%) 73 260
Galway 1,213 181 (15%) 112 1,881
Kerry 932 52 (6%) 70 1,924
Kildare 480 29 (6%) 90 1,114
Kilkenny 181 16 (9%) 100 717
Laois 334 17 (5%) 83 565
Leitrim 145 6 (5%) 60 433
Limerick 524 41 (8%) 77 1,102
Longford 132 8 (6%) 75 450
Louth 124 14 (11%) 112 751
Mayo 1,184 152 (13%) 100 1,214
Meath 233 18 (8%) 102 671
Monaghan 120 4 (3%) 68 365
Offaly 286 7 (2%) 68 495
Roscommon 235 17 (7%) 91 1,387
Sligo 270 54 (20%) 145 969
Tipperary 852 63 (7%) 79 1,318
Waterford 162 20 (12%) 119 1,359
Westmeath 289 20 (7%) 91 699
Wexford 469 54 (12%) 99 1,124
Wicklow 185 24 (13%) 131 1,032
Radon concentrations in the measured houses ranged from 10 to 1,924 Bq/m3. The average indoor radon concentration was 89 Bq/m3, with
a population-weighted average of 91 Bq/m3. Using the current population figure of 4.59 million and an indoor occupancy factor of 0.8, this
corresponds to a collective dose of 10,210 man Sv. This does not take account of the time that people spend in their work buildings. The
collective dose from radon in workplaces is estimated to be 1,052 man Sv. The collective dose in homes is therefore approximately 9,158
(10,210 – 1,052) man Sv. The corresponding average annual dose is obtained by dividing by the total population, giving a value of 1,995 µSv.
For more details, see Radon in workplaces on page 34.

Radiation Doses Received by the Irish Population 201420
The results of the NRS were used to produce a map which predicts high radon areas across the country. National grid squares classified
as high radon areas (squares where 10% or more of the houses are predicted to have an annual average radon concentration above the
national reference level of 200 Bq/m3) have been identified in every county as displayed in Figure 4.
An interactive version of the map in Figure 4 is available on the RPII website at www.rpii.ie/radon-map.aspx. Users can input their address
and see the predicted level of radon risk in their area.
Figure 4. Map of Ireland showing predicted high radon areas.

Radiation Doses Received by the Irish Population 2014 21
Apart from the measurements made for the NRS, the RPII has also completed measurements in over 44,000 additional houses. Many of
these measurements were for a period of three months and cannot be compared directly with NRS measurements which were made for
a continuous period of one year. In addition, for the majority of these measurements there is no information on the exact location of the
house. For all these reasons, these additional measurements have not been included in the calculation of the average radon concentration
in Irish homes. They are, however, included in the summary of all the radon measurements available to the RPII up to 31 December 2013 in
Appendix 2 (Table A.1). Table A.2 of the Appendix also shows that, of the 50 homes with the highest indoor radon concentrations, 20 were
in Castleisland or Tralee in County Kerry.
2.3.2 Study of variation in radon concentrations in North Kerry
The National Radon Survey identified parts of County Kerry as high radon areas (Figure 5). In July 2003, the RPII found a house in the
Castleisland area with an estimated average radon concentration of 49,000 Bq/m3 (Organo et al., 2004). This corresponds to an annual
radiation dose to the occupants of 1.2 Sv (or 1,200,000 µSv) and to a daily dose of about 3,400 µSv. Subsequent radon measurements in
and around the town of Castleisland identified other homes with high radon concentrations. In 2011, a second house in Castleisland (about
4 km from the first house) was found to have an average radon concentration of 37,000 Bq/m3.
To date, radon measurements have been carried out in 1,947 homes with postal addresses in Castleisland or Tralee. The results of these
measurements are summarised in Table 4. In many cases, the postal address encompasses an area that extends well beyond the immediate
town or village. This is particularly the case for Tralee, where the postal district covers well over 1,000 km2. This area contains a mix of high
radon areas and low radon areas.
Figure 5. Map of Kerry showing predicted High Radon Areas.
An analysis of the data for these 1,947 homes gives an average radon concentration of 196 Bq/m3, more than twice the national average of
89 Bq/m3. This is likely to be related to the high density of karst features in the limestone geology. It is also likely that there are other areas of
the country with similar geology where homes may have exceptionally high radon concentrations. The RPII is involved in ongoing work with
the Geological Survey of Ireland to identify such areas.

Radiation Doses Received by the Irish Population 201422
Table 4. Summary of RPII radon measurements carried out in houses in Castleisland and Tralee
Number of results
Average(Bq/m3)
No. above 200 Bq/m3
No. above 1,000 Bq/m3
Highest(Bq/m3)
Castleisland 593 193 80 (13%) 12 (2.0%) 4,310
Tralee 1,353 197 366 (27%) 76 (5.6%) 18,850
Total 1,946 196 446 (23%) 88 (4.5%)
Note: The data in this table does not include the two homes that had extremely high measurements – 49,000 Bq/m3 in one case and 37,000
Bq/m3 in the other.
2.4 Thoron in indoor airThoron (radon-220) is a naturally occurring radioactive gas that is produced by the radioactive decay of radium-224 (Ra-224), a component
of the thorium decay series – see Figure 6. Thoron has a half-life of 56 seconds and can only migrate a short distance before it decays.
For this reason, building materials rather than the soil beneath the house are usually the principal source of thoron in indoor air. The
concentration of thoron gas indoors varies significantly with the distance from walls and floors while thoron decay products are uniformly
distributed within the room.
Figure 6 Thorium-232 decay series
14 billion years
The symbols α and β indicate alpha and beta decay, and the times shown are half-lives.
56 seconds
3.7 days
1.9 years
0.15 seconds
61 minutes (36%)
310 nanoseconds
6.1 hours
5.8 years
α
α
α
α
α
α
α
β
β
3.1 minutes
61 minutes (64%)
11 hours
β
β
β
Thorium-232
Radium-228
Thorium-228
Actinium-228
Radon-220
Lead-212
Polonium-216 Polonium-212
Lead-208 (stable)
Bismuth-212
Thallium-208
Radium-224
Radiation Doses Received by the Irish Population 2014 23
As with radon, it is the thoron decay products rather than the gas itself that constitute the main source of radiation dose. Thoron decay
products can also be inhaled and deposited in the respiratory tract where they give rise to a radiation dose. No direct studies have been
carried out on the health effects of human exposure to thoron.
Except in extreme circumstances, the concentrations of thoron in indoor air are much lower than those of radon. Examples of extreme
circumstances are the use of building materials with high concentrations of thorium or, as is the case in some countries, living in houses
where the floors and/or walls are made of earth.
Thoron may decay almost completely in indoor air while significant concentrations of its decay products remain. Unlike the situation with
radon, direct measurements of thoron gas are not a reliable indicator of the presence of its decay products, and therefore do not provide an
estimate of the dose. Thoron daughters are difficult to measure and Ireland is one of very few countries to have carried out surveys to assess
the radiation dose from thoron and its decay products.
2.4.1 Thoron in Ireland
The naturally occurring radioactive gas thoron and its decay products were first measured in Irish homes in a pilot study of 40 houses in
2005 (Ní Choncubhair, 2007). The average concentration of thoron decay products reported in units of equilibrium equivalent thoron
concentrations (EETC) was 1 Bq/m3. This value was used in the 2008 population dose report along with a dose conversion factor of 40 nSv
per (Bq/m3.h) (UNSCEAR, 2000) to estimate an average annual dose of 280 µSv (Colgan et al., 2008).
A more recent study measured thoron and its decay products in 205 homes in Ireland between 2007 and 2009 in a collaborative project
between RPII, University College Dublin (UCD) and the National Institute of Radiological Sciences (NIRS) in Japan (McLaughlin et al., 2011).
This study found the average concentration of thoron decay products to be 0.47 Bq/m3, which is approximately half the average value
reported in the pilot study.
In addition, new estimates for dose coefficients for thoron and its decay products have been calculated in recent years (Kendall & Phipps,
2007) (Ishikawa et al., 2007) using ICRP models such as the Human Respiratory Tract Model for Radiological Protection (ICRP, 1994).
Assuming a typical breathing rate of 0.78 m3/h and an indoor occupancy factor of 0.8, the estimated average annual doses to an adult
breathing air containing thoron decay products at a concentration of 1 Bq/m3 (EETC) calculated using the Kendall & Phipps and the Ishikawa
et al. models are close at approximately 700 µSv and 800 µSv, respectively. Therefore, it is estimated that exposure to air containing thoron
decay products at a concentration of 1 Bq/m3 (EETC) gives rise to an average annual dose of approximately 750 µSv.
Taking the average concentration of thoron decay products of 0.47 Bq/m3 (McLaughlin et al., 2011) we can assume an average annual dose
of 350 µSv, which is higher than the 280 µSv reported in the 2008 dose assessment report (Colgan et al., 2008).
2.5 Radioactivity in food and drinking waterAs already discussed radioactivity has been around since the earth was formed and it exists naturally in the atmosphere, soil, seas and rivers.
It is also created by human activity during energy production and military operations and is dispersed in the environment. Inevitably some of
this gets into the food and water we ingest.
The level of ingestion of radioactivity is dependent on the concentration of radionuclides in the food and water being ingested and on
consumption rates.
Concentrations of naturally occurring radionuclides in foods vary because of the differing levels of naturally occurring radioactivity in
the environment, climate and agricultural conditions that exist in any given area (UNSCEAR 2000). Plants and animals routinely take in
radioactivity because of the similar chemical properties of radionuclides and essential nutrients. The amount of radioactivity taken up by
plants and animals is dependent upon the radioactivity of the source media – for example, the soil or water, the nutrients present, and
other conditions at the location of the plants or animals. The ingestion by humans of plant and animal products that contain radionuclides
contributes to their overall dose.
Radiation Doses Received by the Irish Population 201424
Similarly, the levels of man-made radioactivity in foodstuffs arise from the levels of this radioactivity in any given environment. The levels of
man-made radioactivity in the environment are dependent on discharges from nuclear facilities, on nuclear accidents and nuclear weapons
tests.
Naturally occurring radioactivity in drinking water arises from radionuclides in the natural decay series, uranium-238 and thorium-232. When
a source of drinking water comes in contact with rocks bearing these naturally occurring radionuclides, radioactivity may accumulate in the
water and enter the water cycle (Dowdall et al., 2013).
Monitoring programmes for radionuclides in food and water are carried out annually by RPII and results are published in its monitoring
reports – see, for example, McGinnity et al., (2012a). In addition RPII has carried out a study of natural radioactivity in food, the results of
which are presented below.
2.5.1 Natural radioactivity in food
Carbon-14
Cosmic radiation (see Section 2.1) produces neutrons that interact with nitrogen in the upper atmosphere to produce carbon-14 at a fairly
constant rate (Lehto & Hou, 2011). This carbon-14 is distributed throughout the environment worldwide and, because carbon is a key
component of all living material, carbon-14 is present in plants and animals and also throughout the food chain.
Foods high in fatty acids normally contain a large amount of carbon, and therefore also carbon-14 (C-14). Examples of such foods are milk
and milk products, oils, almonds, walnuts, avocados and fish such as mackerel, trout and salmon.
In order to provide a representative figure for the average level of C-14 and other key radionuclides in the Irish diet, RPII conducted an
analysis of complete meals sourced over a five-day period from a large university restaurant in Dublin, and found that they contained an
average C-14 concentration of 31 Bq/kg. The typical Irish diet consists of 440 kg of foodstuffs and 560 kg of water annually (IUNA, 2011). A
dose conversion factor of 5.8 x 10⁻¹⁰ Sv/Bq (ICRP, 1995) was applied to the food component of the diet (drinking water was assumed to have
a zero carbon-14 content), yielding an average annual dose due to carbon-14 in the Irish diet of 8 µSv, which is consistent with the range
8–12 µSv estimated by Colgan (2008).
Alongside its naturally produced component, C-14 is also present in the environment as a result of the atmospheric nuclear weapons tests
that took place in the 1950s and 1960s. UNSCEAR has estimated that the worldwide average annual dose from carbon-14 in the diet from
nuclear weapons testing is 1.7 µSv (UNSCEAR, 2000). Artificial C-14 is also produced by various nuclear fuel cycle activities, including the
routine operation of nuclear power plants, fuel reprocessing activities and the decommissioning of old or disused nuclear facilities. UNSCEAR
quotes the worldwide annual collective dose from C-14 released as part of nuclear fuel cycle activities as being of the order of 200 man Sv
(UNSCEAR, 2000). Assuming a worldwide population of 7 x 10⁹ persons (Worldometers, 2013), the average annual dose from ingestion of
C-14 from this pathway is approximately 0.03 µSv, which added to the 1.7 µSv from weapons testing, gives a rounded total average annual
dose from ingestion of artificial C-14 of 2 µSv.
As the total average annual dose due to C-14 in the Irish diet is 8 µSv, and the average annual dose from ingestion of artificial C-14 is 2 µSv,
it can therefore be concluded that approximately 6 µSv (75% of the carbon-14 in the Irish diet) is of natural origin.
Potassium-40
Potassium is a key element involved in regulating body functions such as digestion, heart rate and the water content of cells. For that reason,
the potassium content of the body is held constant by metabolic processes, although some variability between men and women as well
as with age has been observed. Natural potassium is made of 0.012% by weight of potassium- 40 (K-40) which is naturally radioactive.
The K-40 content of the body is therefore also constant. UNSCEAR (2000) quotes an average annual dose of 170 µSv from this exposure
pathway.

Radiation Doses Received by the Irish Population 2014 25
Potassium-40 in foodTypical concentrations of potassium-40 in food
Foodstuff Typical concentration (Bq/kg)
Lettuce 20–40
Milk (low fat) 40–60
Yoghurt 40–60
Tomatoes (fresh) 60–80
Orange juice 60–80
Melon (fresh) 60–90
Bananas (fresh) 80–100
Chicken 80–100
Sardines 100–150
Spinach (cooked) 100–150
Muesli 100–150
Potatoes (raw) 140–180
Gammon 140–180
Cod 140–170
Beef 150–200
Raisins 200–250
Wheatgerm 300–350
Seaweed (dried) 1,000–1,500
Potassium levels in the body are controlled by metabolic processes. This means that, regardless of the amount of potassium consumed
with the diet, the dose to an individual from potassium-40 will be relatively constant. There will also be little variability between
individuals in terms of the dose received.
Rubidium-87
Rubidium is the 16th most abundant element in the earth’s crust and is made of two isotopes: rubidium-85 (Rb-85) and rubidium-87 (Rb-87).
Only rubidium-87 is radioactive. It represents just under 30% of the total abundance of the element.
Meats, dairy products and certain nuts tend to have the highest natural content of rubidium. The typical human dietary intake of rubidium is
4 to 5 milligrams per day while humans contain approximately 300 mg of rubidium in total, distributed between various tissues.
There are no data currently available on the rubidium content of the typical Irish diet. Watson (2005) quotes an average annual dose from
ingestion of Rb-87 in the UK of 2 µSv. In the absence of national data on rubidium exposure in Ireland, the UK value was used as it is likely to
approximate to the dose in Ireland.
Radium-228 (from thorium-232)
Thorium-232 (Th-232) is found in the earth’s crust and is, on average, three times more abundant than uranium and as abundant as lead.
The highest thorium concentrations are usually found in igneous rocks such as granites, while the lowest concentrations are found in
carbonate rocks such as limestones. The Th-232 decay chain ends with stable lead-208. Most of the dose attributed to Th-232 is produced
by one of its decay products, radium-228 (Ra-228).
There is currently no data available on the thorium content of the Irish diet. Watson (2005) quotes an average annual dose from the
ingestion of thorium in the United Kingdom of 7 µSv. In the absence of Irish national data, the UK value has been used in this report and
assumed to be representative of the dose received by the Irish population.

Radiation Doses Received by the Irish Population 201426
Radium-226 (from uranium-238)
People may ingest radium that is naturally contained in food and/or water, and may also inhale it in dust particles suspended in the air.
Radium can also be produced in the body from its parent radionuclide (uranium) that has been inhaled or swallowed, but this is not normally
a significant source.
Calculating doses from the consumption of foodstuffsThree pieces of information are required to assess the doses received from the consumption of foodstuffs: the radioactivity content
(or concentration) in the food consumed, the amount of food consumed, and the dose received per unit intake of the radionuclides
present in the food.
Different radionuclides are found in varying amounts in different foods. This is due to several factors, one of which is the chemical
properties of the radionuclide in question. For example, strontium-90 (Sr-90) concentrates in milk because of its chemical similarity to
calcium, one of the main constituent elements found in milk. Several radionuclides may be present in any given food and specialised
analytical techniques are necessary to isolate each of them.
Identifying the type and amount of food consumed by the general population or by a specific group of individuals (consumption
habits) is normally evaluated by carrying out a habit survey which often involves directly interviewing individuals and asking them to
identify the types of food and quantities of it they consume.
The dose received following ingestion of radioactivity will depend on the characteristics of the radionuclide ingested – for example,
its biological behaviour, its half-life, and the type of radiation it emits. There can often be considerable variability in the dose received
by different age groups for the same intake, and this is another factor that must be taken into account when undertaking a dose
assessment.
Dose conversion factors allow the dose received per unit intake of a given radionuclide to be calculated. These factors are derived
from a combination of theoretical calculations and experimental observations. They are published by the International Commission on
Radiological Protection (ICRP) who update them regularly as more information becomes available.
Once all three input parameters are known, the dose D (Sv) received by an individual in any given year is calculated from the following
equation:
D = Σ (A x B x C)
where A is the activity of a given radionuclide in the foodstuff in question (Bq/kg)
B is the amount of food consumed (kg)
C is the dose conversion factor for the individual or population group being assessed (Sv/Bq).
Σ indicates that the calculation has to be carried out and summed for every radionuclide and for every food being considered.
Example: A mixed diet sample has been analysed and the average concentrations of C-14, Po-210 and Pb-210 are
31 Bq/kg, 0.089 Bq/kg and 0.086 Bq/kg (fresh weight), respectively.
The corresponding dose conversion factors as published by the ICRP (1995) are 5.8 x 10⁻¹⁰, 1.2 x 10⁻⁶ and
6.9 x 10⁻⁷ Sv/Bq.
The Irish Universities Nutrition Alliance Survey (IUNA, 2011) indicates that the annual average consumption by the adult population is
440 kg of food.
The annual dose per adult is therefore:
D = 31 x 440 x 5.8 x 10-10 = 8 µSv from C-14
D = 0.089 x 440 x 1.2 x 10-6 = 47 µSv from Po-210
D = 0.086 x 440 x 6.9 x 10-7 = 26 µSv from Pb-210.
Hence the total annual dose for an adult from the consumption of this mixed diet sample from C-14, Po-210 and Pb-210 is 81 µSv.

Radiation Doses Received by the Irish Population 2014 27
The recent study carried out by RPII on analysis of complete meals yielded an average annual dose from ingestion of radium-226 of 4 µSv.
Polonium-210 and Lead-210
Uranium-238 is also found in the earth’s crust in concentrations that vary from a few to several thousand ppm. Uranium-238 decays through
a series of steps to produce stable lead-206. The radioactive decay of uranium-238 produces radon gas (Rn-222) which, in turn, produces
Pb-210 and Po-210. Pb-210 and Po-210 are relatively long-lived radionuclides with half-lives of 22 years and 140 days respectively, and both
occur widely in nature. The main pathway for exposure to Pb-210 and Po-210 is through ingestion. Indeed, most of the ingestion dose from
the U-238 series is due to the presence of Po-210 in foodstuffs (UNSCEAR, 2000). Pb-210 also contributes significantly to the total radiation
dose received by the population because of its long residence time in the human body, particularly in the skeleton (Swift, 1998).
Polonium-210
Analysis of complete meals (as described previously) led to the determination of an average Po-210 activity concentration of 0.089 Bq/kg.
Based on an annual food consumption of 440 kg, the annual intake of Po-210 in the Irish diet is 39 Bq, which is within the range of reported
values (28–55 Bq) for other European countries (UNSCEAR, 2000).
Applying a dose conversion factor of 1.2 x 10⁻⁶ Sv/Bq (ICRP, 1995) to the above annual intake, we arrive at an average annual ingestion dose
of 47 µSv, which is similar to the value of 45 µSv estimated in 2008 (Colgan et al., 2008) and that of 42 µSv calculated for the UK population
(Watson et al., 2005).
Lead-210
Analysis of typical Irish meals led to the determination of an average Pb-210 activity concentration of 0.086 Bq/kg. Based on an average
annual consumption of 440 kg (IUNA, 2011), the calculated annual intake of Pb-210 in the Irish diet is 38 Bq. Applying a dose conversion
factor of 6.9 x 10⁻⁷ Sv/Bq (ICRP, 1995), the corresponding average annual ingestion dose is typically 26 µSv. This value is comparable to those
found in other European and worldwide studies that ranged between 22 and 32 µSv (Watson et al., 2005) (UNSCEAR, 2000) (Ham et al.,
1998).

Radiation Doses Received by the Irish Population 201428
Lead-210 and Polonium-210Lead-210 (Pb-210) has a half-life of 22.3 years and is part of the uranium-238 (U-238) natural decay chain. Radon gas (Rn-222)
exhalation from the ground is the main source of Pb-210 in the environment. Pb-210 decays (via beta and gamma decay) to
bismuth-210 (Bi-210), which is the immediate parent of polonium-210 (Po-210).
Lead-206 (stable)
5.0 days
22 years
140 days
β
β
α
Polonium-210
Lead-210
Bismuth-210
The dose arising from the ingestion of Pb-210 is mainly due to the high-energy alpha radiation emitted from its daughter product
polonium-210 (Po-210). The beta rays arising from the disintegration of Pb-210 and Bi-210 contribute to only about 10% of the total
radiation dose (Yamamoto et al., 2009).
While Po-210 occurs naturally, it can also be produced artificially in a nuclear reactor when bismuth-209 is bombarded with neutrons.
Concentrations of Pb-210 and Po-210 are usually low in meat and milk products and relatively high in marine organisms. Intermediate
concentrations are found in cereals and vegetables. Typical concentrations of Po-210 and Pb-210 worldwide are shown in the table
below.
Foodstuff Pb-210 Po-210
Bq/kg
Milk Products 0.015 0.015
Meat Products 0.08 0.06
Grain Products 0.05 0.06
Leafy Vegetables 0.08 0.10
Root Vegetables and Fruits 0.03 0.04
Fish Products 0.20 2
Drinking Water 0.01 0.005
Po-210 accumulates in tobacco leaves and smokers will receive a higher radiation dose than non-smokers. For smokers, much of
Po-210 will concentrate in the lungs rather than in other parts of the body and will then contribute to an increased risk of lung cancer.
Radiation Doses Received by the Irish Population 2014 29
2.5.2 Artificial radioactivity in food
Nuclear discharges into the Irish Sea
During the routine operation of nuclear installations such as nuclear power plants and reprocessing plants, radioactive material is released into
the environment. For Ireland’s environment, the most significant source of artificial radioactivity is the discharge of low-level radioactive waste
into the Irish Sea from the Sellafield reprocessing plant.
Sellafield is located approximately 180 km east of Ireland on the west coast of England. Reprocessing activities at the site have resulted in
the discharge of radioactive material into the Irish Sea since the 1950s. These discharges peaked in the 1970s and early 1980s. Subsequently,
modern abatement techniques have been introduced that significantly reduced the discharges of most radionuclides, in some cases by factors
in excess of 100.
The RPII assesses the radiation doses to the Irish population from the Sellafield discharges as part of its annual marine monitoring programme.
Because the main dose pathway is the consumption of seafood, samples of a wide range of fish and shellfish species are collected from
commercial landings at major Irish fishing ports and aquaculture areas and the activity concentrations of the key radionuclides are determined.
The 2008 population dose report (Colgan et al., 2008) considered two types of consumers: a ‘heavy’ consumer who eats 73 kg of fish and
7.3 kg of shellfish annually, and a ‘typical’ consumer, who eats 15 kg of fish and 1.8 kg of shellfish annually. Since then, a habits survey
carried out in 2008 along the north-east coast of Ireland (Cefas, 2008) identified two groups of ‘most exposed’ people: commercial fishermen
(Group A) who consume large amounts of fish (26 kg) and crustaceans (10 kg), and commercial oyster and mussel farmers working along the
north-east coast (Group B) who consume large amounts of molluscs (25kg). The annual average doses for members of Group A and Group
B have been calculated respectively at 0.17 µSv and 0.21 µSv in 2010, and 0.12 µSv and 0.56 µSv in 2011. These doses include contributions
from the artificial radionuclides technetium-99 (Tc-99), caesium-137 (Cs-137), plutonium-238,239,240 (Pu-238,239,240) and americium-241
(Am-241). The annual average dose to Group B was found to have increased in 2011 compared to 2010. This increase can be attributed to
changes in the sampling protocol introduced to the 2011 monitoring programme, particularly the inclusion of winkles, as molluscs are known
to concentrate actinides such as plutonium and americium.
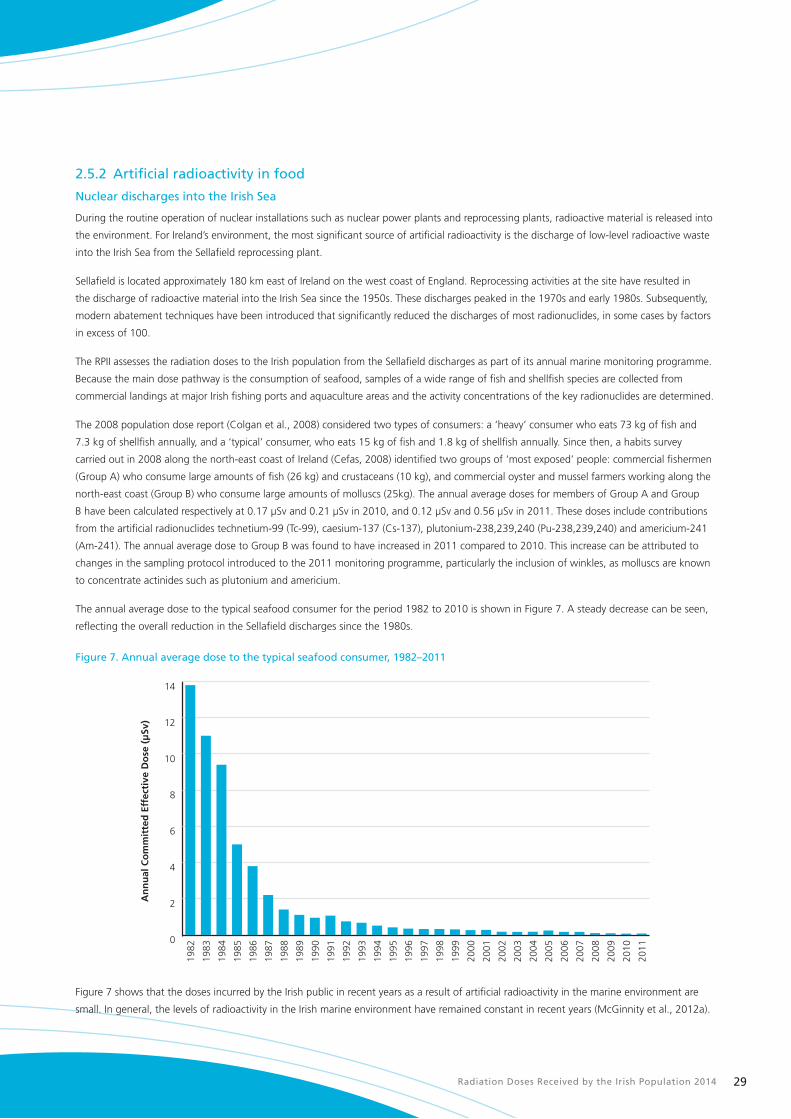
The annual average dose to the typical seafood consumer for the period 1982 to 2010 is shown in Figure 7. A steady decrease can be seen,
reflecting the overall reduction in the Sellafield discharges since the 1980s.
Figure 7. Annual average dose to the typical seafood consumer, 1982–2011
0
2
4
6
8
10
12
14
2011
2010
2009
2008
2007
2006
2005
2004
2003
2002
2001
2000
1999
1998
1997
1996
1995
1994
1993
1992
1991
1990
1989
1988
1987
1986
1985
1984
1983
1982
An
nu
al C
om
mit
ted
Eff
ecti
ve D
ose
(µ
Sv)
Figure 7 shows that the doses incurred by the Irish public in recent years as a result of artificial radioactivity in the marine environment are
small. In general, the levels of radioactivity in the Irish marine environment have remained constant in recent years (McGinnity et al., 2012a).
Radiation Doses Received by the Irish Population 201430
Radioactivity in milk
The European Commission recommends that member states carry out routine measurements of radioactivity in milk, particularly levels of
Cs-137 and Sr-90. This is because these radionuclides tend to concentrate in this particular food product in the event of an accidental release
of radioactivity to the atmosphere (European Commission, 2000). Milk is of particular importance as a foodstuff for infants and children. The
RPII regularly collects milk samples from Irish dairies and analyses them in line with the Commission’s recommendations.
Estimates for 2011 (McGinnity et al., 2012a) show that Cs-137, Sr-90 and its daughter radionuclide yttrium-90 (Y-90) in milk jointly result in
an average annual dose of 1.76 µSv to infants and 0.47 µSv to adults. The higher dose received by infants is due to the greater percentage of
their total diet that comes from milk and milk products as well as a threefold higher dose per unit intake.
Artificial radioactivity in complete meals
As part of RPII’s routine monitoring programme, complete meals (mixed diet) from a restaurant in Dublin are sampled and analysed for
gamma-emitting radionuclides on an approximately monthly basis. In 2011, all radionuclides, except Cs-137, were found to be below the
limit of detection. The maximum Cs-137 concentration measured was 0.21 Bq/kg (McGinnity et al., 2012a). Assuming average annual
consumption of foodstuffs and water of 1,000 kg (IUNA, 2011) and applying a dose conversion factor of 1.3 x 10⁻⁸ Sv/Bq, the average
annual dose from Cs-137 in food is 2.7 µSv, which is consistent with that reported in 2008 (2.6 µSv) (Colgan et al., 2008).
Drinking water
The RPII monitors radioactivity in surface drinking water supplies (McGinnity et al., 2012a) for compliance with parameters set out in the
European Communities Drinking Water Directive (European Commission, 2013a). Between 2007 and 2011, in collaboration with the
Environmental Protection Agency (EPA), the RPII undertook a national survey of radioactivity in groundwater supplies. Over 200 samples were
screened for radioactivity (Dowdall et al., 2013). In 2012 the RPII undertook a study of radioactivity levels in bottled water produced in Ireland
– this involved analysis of 21 samples collected by Environmental Health Officers to assess compliance with the Drinking Water Directive
(Currivan et al., 2013).
Due to the type of screening analysis performed (as shown in Figure 8), it is not possible to quantify the average radiation dose received as
a result of consumption of drinking water. The results of these surveys do show, however, that all drinking sources tested complied with the
Drinking Water Directives parametric guideline of less than 100 µSv per annum.
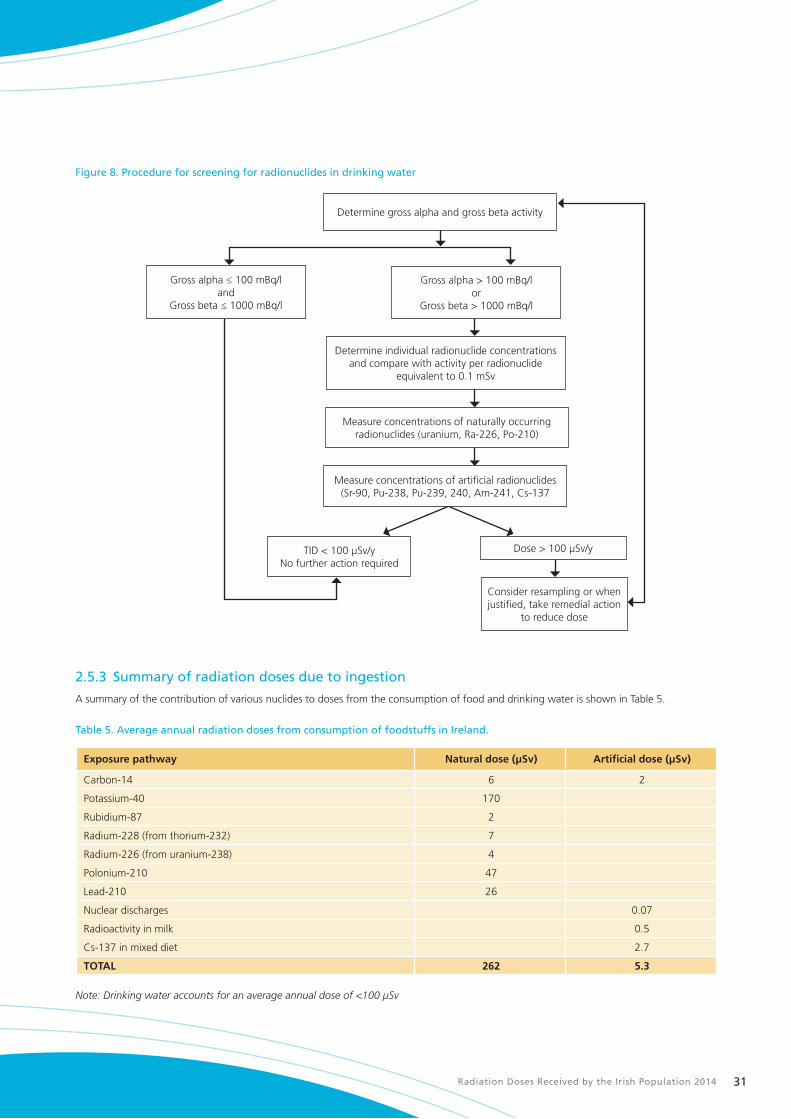
Radiation Doses Received by the Irish Population 2014 31
Figure 8. Procedure for screening for radionuclides in drinking water
Determine gross alpha and gross beta activity
Consider resampling or when justified, take remedial action
to reduce dose
TID < 100 µSv/yNo further action required
Determine individual radionuclide concentrations and compare with activity per radionuclide
equivalent to 0.1 mSv
Gross alpha > 100 mBq/lor
Gross beta > 1000 mBq/l
Gross alpha ≤ 100 mBq/land
Gross beta ≤ 1000 mBq/l
Measure concentrations of artificial radionuclides (Sr-90, Pu-238, Pu-239, 240, Am-241, Cs-137
Dose > 100 µSv/y
Measure concentrations of naturally occurring radionuclides (uranium, Ra-226, Po-210)
2.5.3 Summary of radiation doses due to ingestion
A summary of the contribution of various nuclides to doses from the consumption of food and drinking water is shown in Table 5.
Table 5. Average annual radiation doses from consumption of foodstuffs in Ireland.
Exposure pathway Natural dose (µSv) Artificial dose (µSv)
Carbon-14 6 2
Potassium-40 170
Rubidium-87 2
Radium-228 (from thorium-232) 7
Radium-226 (from uranium-238) 4
Polonium-210 47
Lead-210 26
Nuclear discharges 0.07
Radioactivity in milk 0.5
Cs-137 in mixed diet 2.7
TOTAL 262 5.3
Note: Drinking water accounts for an average annual dose of <100 µSv
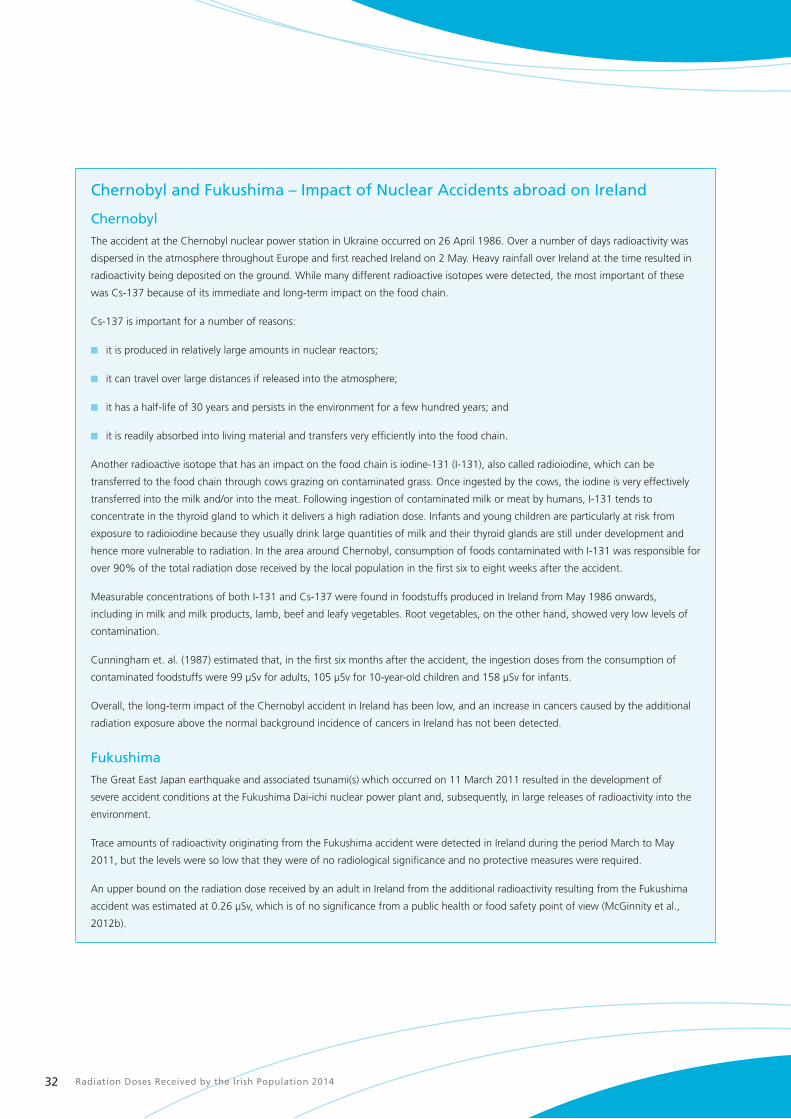
Radiation Doses Received by the Irish Population 201432
Chernobyl and Fukushima – Impact of Nuclear Accidents abroad on Ireland
Chernobyl
The accident at the Chernobyl nuclear power station in Ukraine occurred on 26 April 1986. Over a number of days radioactivity was
dispersed in the atmosphere throughout Europe and first reached Ireland on 2 May. Heavy rainfall over Ireland at the time resulted in
radioactivity being deposited on the ground. While many different radioactive isotopes were detected, the most important of these
was Cs-137 because of its immediate and long-term impact on the food chain.
Cs-137 is important for a number of reasons:
n it is produced in relatively large amounts in nuclear reactors;
n it can travel over large distances if released into the atmosphere;
n it has a half-life of 30 years and persists in the environment for a few hundred years; and
n it is readily absorbed into living material and transfers very efficiently into the food chain.
Another radioactive isotope that has an impact on the food chain is iodine-131 (I-131), also called radioiodine, which can be
transferred to the food chain through cows grazing on contaminated grass. Once ingested by the cows, the iodine is very effectively
transferred into the milk and/or into the meat. Following ingestion of contaminated milk or meat by humans, I-131 tends to
concentrate in the thyroid gland to which it delivers a high radiation dose. Infants and young children are particularly at risk from
exposure to radioiodine because they usually drink large quantities of milk and their thyroid glands are still under development and
hence more vulnerable to radiation. In the area around Chernobyl, consumption of foods contaminated with I-131 was responsible for
over 90% of the total radiation dose received by the local population in the first six to eight weeks after the accident.
Measurable concentrations of both I-131 and Cs-137 were found in foodstuffs produced in Ireland from May 1986 onwards,
including in milk and milk products, lamb, beef and leafy vegetables. Root vegetables, on the other hand, showed very low levels of
contamination.
Cunningham et. al. (1987) estimated that, in the first six months after the accident, the ingestion doses from the consumption of
contaminated foodstuffs were 99 µSv for adults, 105 µSv for 10-year-old children and 158 µSv for infants.
Overall, the long-term impact of the Chernobyl accident in Ireland has been low, and an increase in cancers caused by the additional
radiation exposure above the normal background incidence of cancers in Ireland has not been detected.
Fukushima
The Great East Japan earthquake and associated tsunami(s) which occurred on 11 March 2011 resulted in the development of
severe accident conditions at the Fukushima Dai-ichi nuclear power plant and, subsequently, in large releases of radioactivity into the
environment.
Trace amounts of radioactivity originating from the Fukushima accident were detected in Ireland during the period March to May
2011, but the levels were so low that they were of no radiological significance and no protective measures were required.
An upper bound on the radiation dose received by an adult in Ireland from the additional radioactivity resulting from the Fukushima
accident was estimated at 0.26 µSv, which is of no significance from a public health or food safety point of view (McGinnity et al.,
2012b).

Radiation Doses Received by the Irish Population 2014 33
2.6 Occupational exposureThis section considers the doses incurred by individuals as a result of their work. These include, for example: air crew who are exposed to
higher levels of cosmic radiation than the general population; indoor workers who are exposed to higher levels of radon in their workplaces
than those whose work is predominantly outdoors; and miners and show cave workers who may also be exposed to higher levels of radon as
their workplaces are underground. In addition, there are people who may potentially be exposed to artificial sources of radiation in the fields
of medicine, industry and education/research.
Data on individual and average doses, along with statistical information on employee numbers for various sectors are used to estimate the
collective dose for the entire relevant workforce. This collective dose is then averaged over the entire population to estimate the average
annual occupational dose.
2.6.1 Occupational exposure to natural radiation
Cosmic radiation
Since 2000, Statutory Instrument No. 125 of 2000 (Stationery Office, 2000) requires all airlines holding an Air Operator’s Certificate issued by
the Irish Aviation Authority to evaluate the extent of exposure of their air crew to cosmic radiation. These regulations apply only in situations
where air crew are likely to receive doses greater than 1 mSv in any 12-month period. Air crew who fly exclusively below altitudes of 8,000m
are unlikely to receive such doses (Bartlett et al., 1997), and for that reason do not fall within the scope of the regulations.
Occupational exposure of air crew to cosmic radiation, based on data reported annually by the airlines to the RPII, is summarised in Table 6.
Table 6. Distribution of air crew doses (2006–2012)
Year Number of airlines
Number of aircrew†
1000–2000 µSv 2000–4000 µSv 4000–6000 µSv
2006 7 5,692 2,794 (49.1%) 2,592 (45.5%) 306 (5.4%)
2007 8 8,199 4,077 (49.7%) 3,939 (48.0%) 183 (2.2%)
2008 7 9,726 3,695 (40.0%) 5,779 (59.4%) 252 (2.6%)
2009 7 9,666 2,917 (30.2%) 6,035 (62.4%) 714 (7.4%)
2010 7 11,077 4,415 (39.9%) 6,549 (59.1%) 113 (1.0%)
2011 7 11,362 4,175 (36.7%) 7,001 (61.6%) 186 (1.6%)
2012 5 12,036 5,315 (44.2%) 6,601 (54.8%) 120 (1.0%)
† Those receiving doses less than 1 mSv are excluded.
The average dose received per aircrew worker in 2012 was 2326 µSv. This compares with 2000 µSv in 2008 (Colgan et al., 2008). By analysis
of the data we arrive at a collective dose of 28 man Sv for 2012, which is a significant increase on the dose calculated for 2008 (12 man Sv).
The contribution this makes to the average annual dose for the whole population is 6 µSv.
The increase in the collective dose is directly related to the increase in the number of aircrew employed by Irish airlines, which has more
than doubled since the 2008 report was published. Passenger numbers and air traffic have grown each year from 2006 to 2012 as
airlines continue to open new bases and routes. It should be noted that the data reported annually by the airlines to the RPII includes
all staff employed by Irish airlines regardless of whether or not they are resident in Ireland, so the collective dose figure is likely to be an
overestimation.
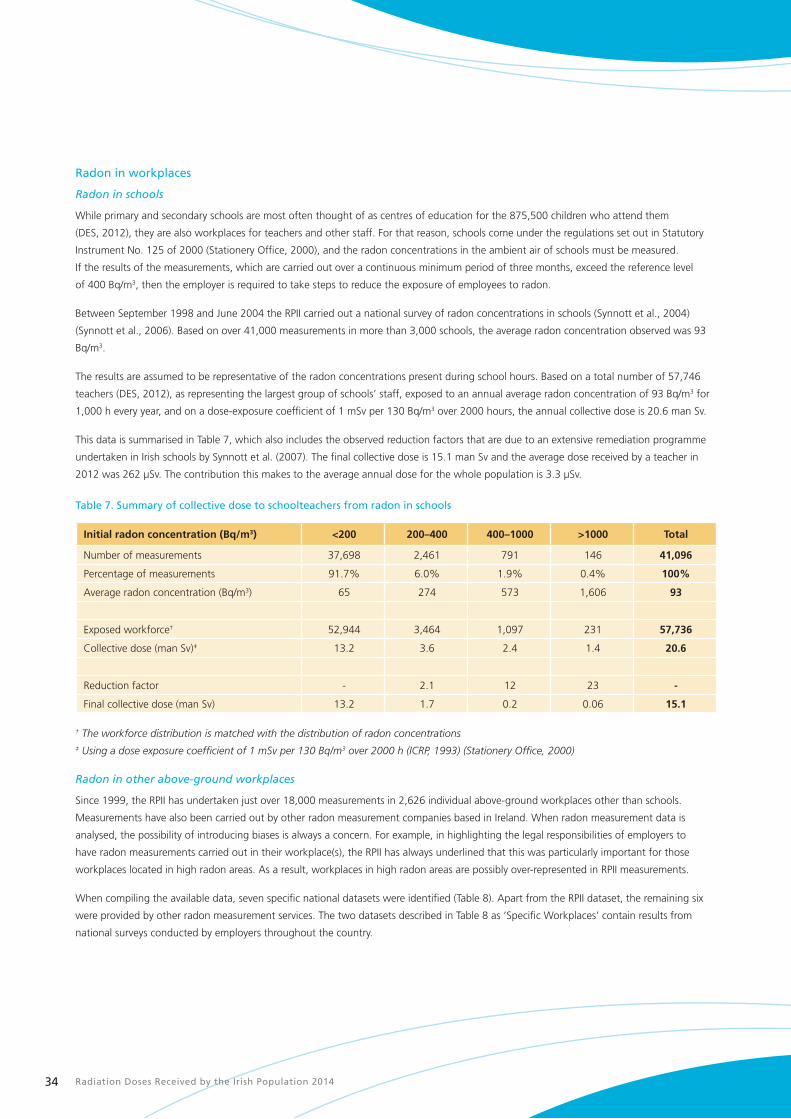
Radiation Doses Received by the Irish Population 201434
Radon in workplaces
Radon in schools
While primary and secondary schools are most often thought of as centres of education for the 875,500 children who attend them
(DES, 2012), they are also workplaces for teachers and other staff. For that reason, schools come under the regulations set out in Statutory
Instrument No. 125 of 2000 (Stationery Office, 2000), and the radon concentrations in the ambient air of schools must be measured.
If the results of the measurements, which are carried out over a continuous minimum period of three months, exceed the reference level
of 400 Bq/m3, then the employer is required to take steps to reduce the exposure of employees to radon.
Between September 1998 and June 2004 the RPII carried out a national survey of radon concentrations in schools (Synnott et al., 2004)
(Synnott et al., 2006). Based on over 41,000 measurements in more than 3,000 schools, the average radon concentration observed was 93
Bq/m3.
The results are assumed to be representative of the radon concentrations present during school hours. Based on a total number of 57,746
teachers (DES, 2012), as representing the largest group of schools’ staff, exposed to an annual average radon concentration of 93 Bq/m3 for
1,000 h every year, and on a dose-exposure coefficient of 1 mSv per 130 Bq/m3 over 2000 hours, the annual collective dose is 20.6 man Sv.
This data is summarised in Table 7, which also includes the observed reduction factors that are due to an extensive remediation programme
undertaken in Irish schools by Synnott et al. (2007). The final collective dose is 15.1 man Sv and the average dose received by a teacher in
2012 was 262 µSv. The contribution this makes to the average annual dose for the whole population is 3.3 µSv.
Table 7. Summary of collective dose to schoolteachers from radon in schools
Initial radon concentration (Bq/m3) <200 200–400 400–1000 >1000 Total
Number of measurements 37,698 2,461 791 146 41,096
Percentage of measurements 91.7% 6.0% 1.9% 0.4% 100%
Average radon concentration (Bq/m3) 65 274 573 1,606 93
Exposed workforce† 52,944 3,464 1,097 231 57,736
Collective dose (man Sv)‡ 13.2 3.6 2.4 1.4 20.6
Reduction factor - 2.1 12 23 -
Final collective dose (man Sv) 13.2 1.7 0.2 0.06 15.1
† The workforce distribution is matched with the distribution of radon concentrations ‡ Using a dose exposure coefficient of 1 mSv per 130 Bq/m3 over 2000 h (ICRP, 1993) (Stationery Office, 2000)
Radon in other above-ground workplaces
Since 1999, the RPII has undertaken just over 18,000 measurements in 2,626 individual above-ground workplaces other than schools.
Measurements have also been carried out by other radon measurement companies based in Ireland. When radon measurement data is
analysed, the possibility of introducing biases is always a concern. For example, in highlighting the legal responsibilities of employers to
have radon measurements carried out in their workplace(s), the RPII has always underlined that this was particularly important for those
workplaces located in high radon areas. As a result, workplaces in high radon areas are possibly over-represented in RPII measurements.
When compiling the available data, seven specific national datasets were identified (Table 8). Apart from the RPII dataset, the remaining six
were provided by other radon measurement services. The two datasets described in Table 8 as ‘Specific Workplaces’ contain results from
national surveys conducted by employers throughout the country.
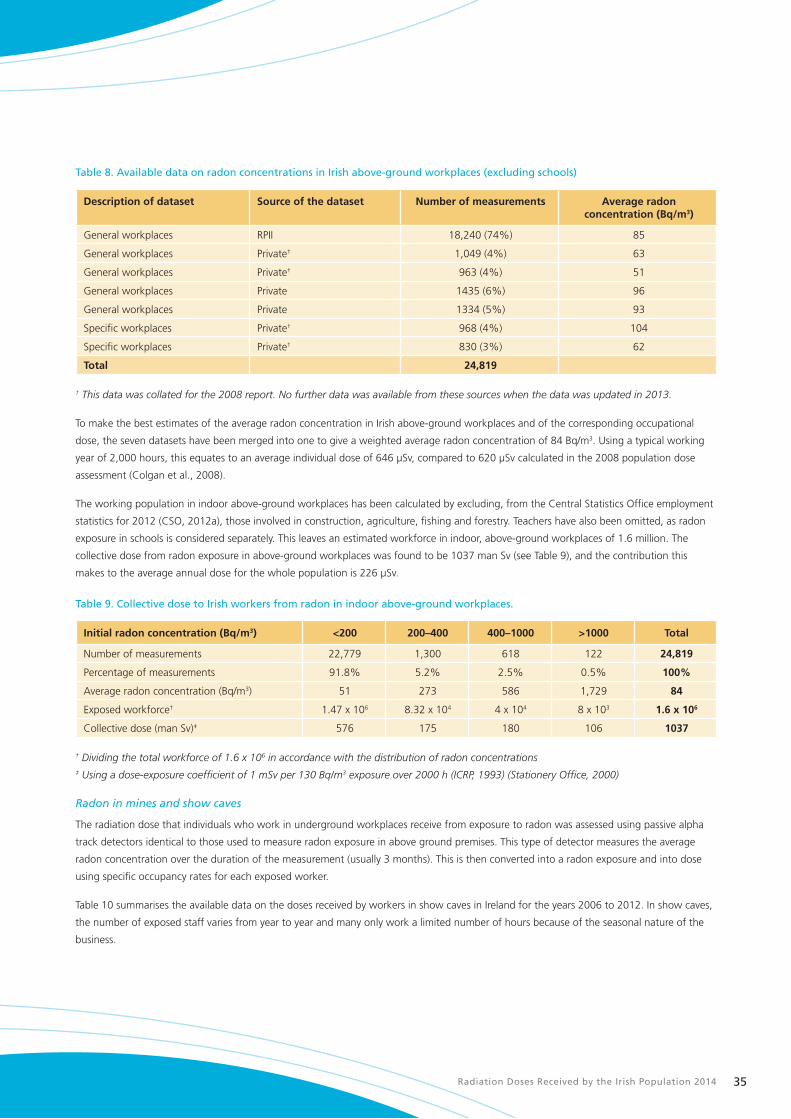
Radiation Doses Received by the Irish Population 2014 35
Table 8. Available data on radon concentrations in Irish above-ground workplaces (excluding schools)
Description of dataset Source of the dataset Number of measurements Average radon concentration (Bq/m3)
General workplaces RPII 18,240 (74%) 85
General workplaces Private† 1,049 (4%) 63
General workplaces Private† 963 (4%) 51
General workplaces Private 1435 (6%) 96
General workplaces Private 1334 (5%) 93
Specific workplaces Private† 968 (4%) 104
Specific workplaces Private† 830 (3%) 62
Total 24,819
† This data was collated for the 2008 report. No further data was available from these sources when the data was updated in 2013.
To make the best estimates of the average radon concentration in Irish above-ground workplaces and of the corresponding occupational
dose, the seven datasets have been merged into one to give a weighted average radon concentration of 84 Bq/m3. Using a typical working
year of 2,000 hours, this equates to an average individual dose of 646 µSv, compared to 620 µSv calculated in the 2008 population dose
assessment (Colgan et al., 2008).
The working population in indoor above-ground workplaces has been calculated by excluding, from the Central Statistics Office employment
statistics for 2012 (CSO, 2012a), those involved in construction, agriculture, fishing and forestry. Teachers have also been omitted, as radon
exposure in schools is considered separately. This leaves an estimated workforce in indoor, above-ground workplaces of 1.6 million. The
collective dose from radon exposure in above-ground workplaces was found to be 1037 man Sv (see Table 9), and the contribution this
makes to the average annual dose for the whole population is 226 µSv.
Table 9. Collective dose to Irish workers from radon in indoor above-ground workplaces.
Initial radon concentration (Bq/m3) <200 200–400 400–1000 >1000 Total
Number of measurements 22,779 1,300 618 122 24,819
Percentage of measurements 91.8% 5.2% 2.5% 0.5% 100%
Average radon concentration (Bq/m3) 51 273 586 1,729 84
Exposed workforce† 1.47 x 10⁶ 8.32 x 10⁴ 4 x 10⁴ 8 x 10³ 1.6 x 10⁶
Collective dose (man Sv)‡ 576 175 180 106 1037
† Dividing the total workforce of 1.6 x 10⁶ in accordance with the distribution of radon concentrations ‡ Using a dose-exposure coefficient of 1 mSv per 130 Bq/m3 exposure over 2000 h (ICRP, 1993) (Stationery Office, 2000)
Radon in mines and show caves
The radiation dose that individuals who work in underground workplaces receive from exposure to radon was assessed using passive alpha
track detectors identical to those used to measure radon exposure in above ground premises. This type of detector measures the average
radon concentration over the duration of the measurement (usually 3 months). This is then converted into a radon exposure and into dose
using specific occupancy rates for each exposed worker.
Table 10 summarises the available data on the doses received by workers in show caves in Ireland for the years 2006 to 2012. In show caves,
the number of exposed staff varies from year to year and many only work a limited number of hours because of the seasonal nature of the
business.
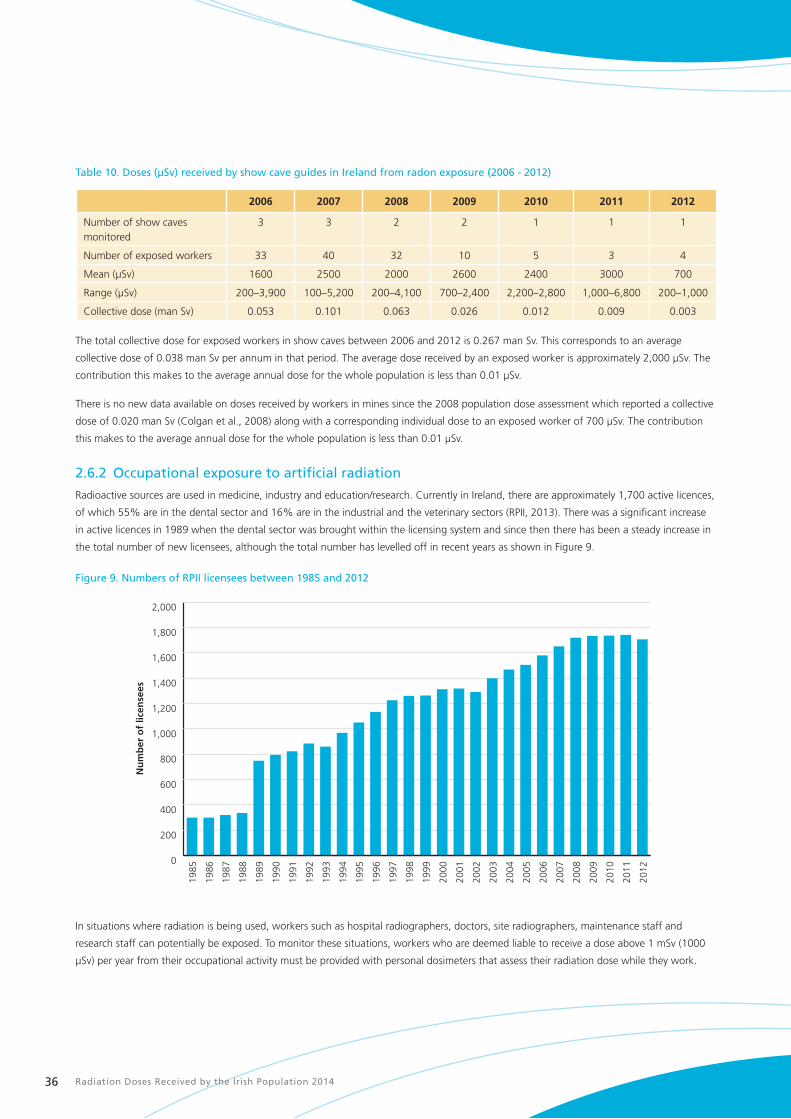
Radiation Doses Received by the Irish Population 201436
Table 10. Doses (µSv) received by show cave guides in Ireland from radon exposure (2006 - 2012)
2006 2007 2008 2009 2010 2011 2012
Number of show caves monitored
3 3 2 2 1 1 1
Number of exposed workers 33 40 32 10 5 3 4
Mean (µSv) 1600 2500 2000 2600 2400 3000 700
Range (µSv) 200–3,900 100–5,200 200–4,100 700–2,400 2,200–2,800 1,000–6,800 200–1,000
Collective dose (man Sv) 0.053 0.101 0.063 0.026 0.012 0.009 0.003
The total collective dose for exposed workers in show caves between 2006 and 2012 is 0.267 man Sv. This corresponds to an average
collective dose of 0.038 man Sv per annum in that period. The average dose received by an exposed worker is approximately 2,000 µSv. The
contribution this makes to the average annual dose for the whole population is less than 0.01 µSv.
There is no new data available on doses received by workers in mines since the 2008 population dose assessment which reported a collective
dose of 0.020 man Sv (Colgan et al., 2008) along with a corresponding individual dose to an exposed worker of 700 µSv. The contribution
this makes to the average annual dose for the whole population is less than 0.01 µSv.
2.6.2 Occupational exposure to artificial radiation
Radioactive sources are used in medicine, industry and education/research. Currently in Ireland, there are approximately 1,700 active licences,
of which 55% are in the dental sector and 16% are in the industrial and the veterinary sectors (RPII, 2013). There was a significant increase
in active licences in 1989 when the dental sector was brought within the licensing system and since then there has been a steady increase in
the total number of new licensees, although the total number has levelled off in recent years as shown in Figure 9.
Figure 9. Numbers of RPII licensees between 1985 and 2012
0
200
400
600
800
1,000
1,200
1,400
1,600
1,800
2,000
Nu
mb
er o
f lic
ense
es
2011
2012
2010
2009
2008
2007
2006
2005
2004
2003
2002
2001
2000
1999
1998
1997
1996
1995
1994
1993
1992
1991
1990
1989
1988
1987
1986
1985
In situations where radiation is being used, workers such as hospital radiographers, doctors, site radiographers, maintenance staff and
research staff can potentially be exposed. To monitor these situations, workers who are deemed liable to receive a dose above 1 mSv (1000
µSv) per year from their occupational activity must be provided with personal dosimeters that assess their radiation dose while they work.

Radiation Doses Received by the Irish Population 2014 37
Between 2005 and 2008 the RPII Dosimetry Service provided personal dosimeters to approximately 9,000 Irish workers annually. This
number decreased to approximately 8,000 workers in 2009 owing to the increased presence of other dosimetry services in the Irish market.
In 2012, the number of workers provided with personal dosimeters by the RPII Dosimetry Service fell by approximately 17% from 8,151
workers in 2011 to 6,747 in 2012, mainly because of a fall-off in the number of workers being monitored in the dental sector. In June 2011
the licensing requirements for users of dental X-ray equipment changed. From that date personal dosimetry was no longer a mandatory
requirement where a risk assessment carried out by a Radiation Protection Adviser (RPA) indicated that operators of X-ray equipment, or
other relevant staff, were unlikely to be exposed to a dose exceeding 1 mSv (1000 µSv) in any 12-month period. The effect of this change on
the number of dental workers being monitored can clearly be seen in Figure 10.
Figure 10. Number of workers in the dental sector monitored by the RPII Dosimetry Service during 2011 and 2012
0
200
400
600
800
1,000
1,200
1,400
1,600
1,800
2,000
2,200
2,400
2,600
2,800
3,000
01 Oct 1201 May 1201 Dec 1101 Jul 1101 Feb 11
Nu
mb
er o
f d
enta
l wo
rker
s b
ein
g m
on
ito
red
The number of workers receiving measurable doses (above 100 µSv) between 2006 and 2012 is presented in Table 11 and it shows a clear
decline in all sectors, particularly since 2007. In the industrial sector the number of workers receiving doses above 100 µSv reduced by
approximately 50%, mainly because of the decline in activity in this sector as a result of the economic downturn after 2007.
Table 11. Number of exposed workers in Ireland receiving a measurable radiation dose from artificial sources of radiation
(2006–2012).
Sector 2006 2007 2008 2009 2010 2011 2012
Medical 114 216 162 95 71 85 74
Industrial 85 119 84 79 51 34 42
Education/research 7 10 6 7 5 2 10
TOTAL 206 345 252 181 127 121 126
The collective dose from occupational exposure in the medical, industrial and education/ research sectors is presented in Figure 11. The
collective dose in the medical and education/ research sectors has remained relatively constant over this period. In the industrial sector, the
collective dose displays a downward trend from 2007, in line with the reduction in the number of workers receiving measurable doses in this
sector.

Radiation Doses Received by the Irish Population 201438
Figure 11. Collective dose (man Sv) from artificial sources of radiation per sector (2006–2012)
Co
llect
ive
Do
se (
man
Sv)
0.00
0.01
0.02
0.03
0.04
0.05
0.06
0.07
0.08
0.09
0.10
Education/ResearchIndustrialMedical
2012201120102009200820072006
The average annual collective doses for the medical, industrial and education sectors over the period 2006-2012 were 0.051, 0.047 and
0.002 man Sv respectively. This corresponds to a total average annual collective dose of 0.1 man Sv, and the contribution this makes to the
average annual dose for the whole population is 0.02 µSv.
2.6.3 Occupational exposure to naturally occurring radioactive material (NORM)
Natural radioactivity can sometimes be found in certain types of rocks and soils in enhanced concentrations. Natural radioactivity can also
accumulate as part of some industrial processes, and to such an extent that it may pose a risk to both humans and to the environment if it
is not controlled. Such naturally occurring radioactive materials are usually referred to by the acronym NORM and the industries dealing with
such materials are known as NORM industries.
In 2001, the RPII initiated a programme to identify industries active in Ireland which, on the basis of the available literature, were involved in
work activities which could result in exposure to diffuse NORM sources, and to quantify the associated radiation doses. The following Irish
industries were assessed: the extraction of natural gas, the combustion of peat and coal in power plants for electricity production, and the
processing of bauxite for the production of alumina.
The overall conclusion from this work was that no worker is likely to receive a dose in excess of 1 mSv and that doses likely to be received by
members of the public are considerably lower and well within limits set in national legislation. The annual collective dose to workers from the
four NORM industries considered was estimated to be approximately 0.35 man Sv (Organo et al., 2007) (Organo & Fenton, 2008), and the
contribution this makes to the average annual dose for the whole population is less than 0.1 µSv.
2.6.4 Summary of occupational doses
The data on occupational exposure described in previous sections is summarised in Table 12 and Figure 12. More than 99.9% of the
collective dose is attributable to exposure to natural radiation, mainly from radon in above-ground workplaces but with a small contribution
from the cosmic ray exposure of aircrew. Occupational exposure to artificial radiation accounts for just 0.01% of the collective dose. This is
consistent with the distribution observed in the 2008 population dose assessment (Colgan et al., 2008). The average annual dose received
per worker in each of the exposed population groups ranges from 226 µSv to 2326 µSv.

Radiation Doses Received by the Irish Population 2014 39
Table 12. Estimated annual dose from occupational radiation exposure in Ireland
Pathway Number of workers
receiving doses†
Dose per worker (µSv)
Year(s) of observation
Collective dose (man Sv)
Contribution to average annual
dose (µSv)
Natural Sources
Air crew 12,000 2326 2012 28 6
Radon – schools 57,000 262 2012 15.1 3.3
Radon – general 1,600,000 646 2012 1037 226
Show cave guides 18 2000 2006–2012 0.038 0.008
Underground miners 27 700 2002–2005‡ 0.020 0.004
NORM industries 1560 224 2001–2006 0.35 0.08
Artificial Sources
Medical 117 435 2006–2012 0.051 0.01
Industrial 71 662 2006–2012 0.047 0.01
Education/Research 7 286 2006–2012 0.002 0.0004
All Pathways 1080 235
† Approximate numbers (variable year to year) ‡ No data for 2003.
Figure 12. Distribution of radiation doses in workplaces in Ireland
0.01% 3%
Artificial Sources
Cosmic Radiation
Radon
97%
2.7 Medical exposure of patientsEstimating the collective and average annual doses from medical examinations involving exposure to ionising radiation requires information
on the typical dose per investigation and the frequency of each investigation. The collective dose is the sum for all modalities (types of
examinations e.g. general X-ray, computed tomography, nuclear medicine) of the average effective dose per examination multiplied by the
frequency of the examination. The average annual dose is the collective dose distributed across the entire population.
Hospitals using X-ray equipment and/or radioactive substances are required to hold a licence issued by the RPII. For this reason, there is a
comprehensive database of all diagnostic medical radiological equipment and nuclear medicine sources in use in Ireland. In addition, the
Health Services Executive (HSE) has a legal obligation, under Article 12 of the European Commission Medical Exposures directive (EU Council,
1997) and Article 22.6 of Statutory Instrument No. 478 (Stationery Office, 2002), to collect and publish statistics on population dose levels
from the use of medical ionising radiation.
Since the 2008 population dose report was published, the Population Dose Sub-Committee of the HSE’s National Radiation Safety
Committee has carried out national surveys of a number of different diagnostic imaging modalities, including computed tomography (CT)
and dental radiography in 2010, general X-ray imaging and nuclear medicine in 2011 and PET-CT in 2013. A pilot survey for interventional
radiology (including cardiology) was also carried out in 2013.

Radiation Doses Received by the Irish Population 201440
All CT, X-ray, dental and PET-CT holders, both public and private, on the HSE register of ionising radiation installations with those modalities
were surveyed. Nuclear medicine holders known to the HSE were also surveyed. Due to the complex nature of interventional radiology, a
subset of hospitals was selected to participate in the pilot survey and the results of this are included in this report.
For each modality a subset of examinations was selected for the survey, in line with recommendations from the European Commission
(European Commission, 2008), and with the 2008 UK Population dose survey (Hart et al., 2010). In addition, some examinations known to
have a high frequency or to deliver higher doses were also included. While conducting the surveys it became clear that, in some cases, the
data on the frequency of examination was challenging to collect, as many examinations include multiple body parts, multiple scan phases,
and also because the methodology for coding and collating statistics varies from centre to centre.
As in the 2008 population dose report (Colgan et al., 2008), doses from radiotherapy procedures were not considered. This is because
radiotherapy involves the intentional delivery to specific organs and tissues of high doses of radiation designed to kill targeted cells. It is not,
therefore, considered appropriate to include these doses in surveys designed to indicate the distribution of radiation exposure across the
population and the risks from generally much lower doses.
2.7.1 Surveys and dose calculations
Computed tomography
The HSE’s survey on population dose from CT scanning (HSE, 2011a) gathered data on patient and examination frequency, CT dose index
(CTDIvol) and dose length product (DLP) for six scan types in the 12-month period from January to December 2009. A 100% response rate
was achieved. Effective dose was determined by applying published conversion factors to the DLP data submitted. Data on the frequency of
examinations, rounded to the nearest 10, and on the average effective dose per examination is tabulated in Table 13.
Table 13. Results from Computed Tomography Survey (2009)
Frequency of examinations per year Average effective dose per examination (µSv)
Adult CT examinations
Brain 79,030 1,700
C spine 3,210 1,900
High resolution thorax 7,710 3,800
Thorax 28,660 7,300
Abdomen/pelvis 50,310 8,400
Thorax/abdomen/pelvis 42,800 12,900
Paediatric CT examinations
Brain 3,130 3,100
Abdomen/pelvis 400 10,300
The collective effective dose to the population from CT scans was found to be 1,368 man Sv, of which less than 1% is attributed to
people under 15 years of age. This collective dose is higher than the value reported for the same type of dose in the 2008 population
dose assessment (1,165 man Sv). Although it is in keeping with international evidence of increasing use of CT and the trend for increasing
collective effective dose from CT over time (Borretzen et al., 2007) (Brenner & Hall, 2007) (Berrington et al., 2009), the increase in the
collective dose from CT scans in Ireland since 2008 may also be due in part to the difference in scan types included in the surveys.
Dental radiology
The HSE’s survey on population dose from dental radiology (HSE, 2011b) combined the results of the 2010 HSE Survey of Dental Compliance
with SI 478 (Stationery Office, 2002), which calculated the estimated annual frequency of dental X-ray examinations, with published data on
the dose from dental examinations, and together these give an estimate of the collective dose from dental radiology. Data on the frequency
of examinations (rounded to the nearest 10), and an estimate of the effective dose per examination are tabulated in Table 14.

Radiation Doses Received by the Irish Population 2014 41
Table 14. Dental radiology data (2010)
Type of dental examination Frequency of examinations per year Estimated effective dose per examination (µSv)
Intraoral 737,780 5
Occlusal 14,960 7
Panoramic 97,670 19
CBCT 1,190 126
Lateral cephalometry 10,790 6
The collective effective dose to the population from dental radiology was found to be 6 man Sv Dental radiology was not included in the
scope of the 2008 population dose report (Colgan et al., 2008). The data outlined above is similar to that in other European surveys on
population dose (European Commission, 2008) that have included dental radiology, which indicate that dental radiology contributes less than
1% to the total collective dose from diagnostic medical exposures.
General X-ray
The HSE’s survey on population dose from General Radiology and Nuclear Medicine (HSE, 2013) gathered data on examination frequency
and average dose area product (DAP) (with the exception of mammography where the mean glandular dose (MGD) was returned) for 23
general X-ray examination types. The response rate amongst holders of general X-ray installations was 64%. Fourteen percent of those that
responded provided only partial information, citing resource issues for their incomplete response.
Effective dose was determined from the DAP or MGD data submitted by applying the published conversion factors based on ICRP-103 (ICRP,
2007). Data on frequency of examinations, rounded to the nearest 10, and estimated effective dose per examination are tabulated in Table 15.
Table 15. General radiology data
Type of examination Frequency of examinations per year Average effective dose per examination (µSv)
Chest PA 637,590 20
Chest AP 154,734 40
Cervical spine AP 51,670 40
Cervical spine lat. 37,970 30
Thoracic Spine AP 22,810 220
Thoracic spine lat. 16,990 170
Lumbar spine AP 78,870 350
Lumbar spine lat. 57,370 220
Lumbar sacral junction 12,530 190
Full Spine (T+L) 1,320 1,220
Full Spine (C+T+L) 770 920
Skeletal survey 1,460 800
Abdominal AP 108,630 400
Pelvic AP 127,380 290
Single hip AP 42,800 180
Both hips 23,090 270
Femur AP 12,570 30
Femur lat. 8,420 2.2
Mammography screening 17,430 570
Mammography symptomatic 50,580 540
Feet/Ankles/Wrist/Hand 390,920 0.2
Knees AP/Lateral 138,590 0.58

Radiation Doses Received by the Irish Population 201442
The total number of general X-ray examinations was extrapolated from the data returned, using the relative frequency of the examinations
surveyed supplemented by data on the total number of X-ray examinations carried out in each centre in 2010, giving an estimated total
number of 2,575,180 X-rays.
The collective dose from general X-ray was found to be 259 man Sv, a decrease from that reported in the 2008 population dose report
(Colgan et al., 2008). This decrease may be a reflection of the increased use of both direct and indirect digital radiography (as the values
for average effective dose per examination are lower than those reported in the 2008 study), and also the more comprehensive list of
examinations included in the 2010 survey.
Nuclear medicine
The HSE’s survey on population dose from General Radiology and Nuclear Medicine (HSE, 2013) also gathered data on the frequency of
examination and the average administered activity (MBq) for 14 nuclear medicine examination types. The survey response rate from nuclear
medicine centres was 100%. The effective dose was determined from the submitted administered activities and based on the methodology
of the ICRP (ICRP, 2000), with conversion factors taken from the Administration of Radioactive Substances Advisory Committee (ARSAC)
Guidance notes (HPA, 2006). Data on frequency, rounded to the nearest 10, and estimated effective dose are tabulated in Table 16.
Table 16. Nuclear medicine data
Examination Frequency of examinations per year Average effective dose per examination (µSv)
Tc-99m bone scan 14,980 3,540
Tc-99m thyroid scan 1,140 1,320
I-131 thyroid uptake 110 47,200
I-131 thyroid metastases 330 7,370
Tc-99m V/Q lung perfusion scan 940 1,420
Tc-99m Aerosol V/Q lung ventilation scan 220 1,780
Tc-99m Technegas V/Q lung ventilation scan 350 1,880
Tc-99m DTPA renogram scan 570 1,260
Tc-99m MAG3 renogram scan 530 730
I-123 DaTSCAN 430 3,720
I-123 MIBG scan 80 2,890
In-111 octreoscan 120 9,030
Tc-99m myocardial scan 670 7,020
Tc-99m cerebral blood flow 40 6,650
The total number of nuclear medicine examinations was calculated using the relative frequency of the 14 examinations surveyed,
supplemented by data on the total number of nuclear examinations carried out in each centre in 2010. A total number of 29,993 nuclear
medicine examinations were estimated to have been performed in 2010.
The total collective dose from nuclear medicine scans was found to be 112 man Sv.
Positron Emission Tomography (PET) – Computed Tomography (CT)
In 2013, a survey of all PET-CT installations, both public and private, was instigated by the HSE. The survey response rate amongst licence
holders was 88%.
The effective dose for the PET component of each examination was determined from the submitted administered activities while the
effective dose for the CT component was determined using the methodology previously reported (HSE, 2011a). The total frequency has been
extrapolated from submitted data, supplemented by knowledge of the number of patient doses delivered nationally.

Radiation Doses Received by the Irish Population 2014 43
By analysis of the responses to the 2013 survey of PET-CT installations, estimates of the collective dose are found to be of the order of 130
man Sv (MERU, Personal communication, 5 September 2013). Whole-body PET-CT constituted 95% of the examinations with 40% of those
utilising a full diagnostic CT examination. PET-CT was not included in the 2008 population dose report (Colgan et al., 2008) as it was an
emerging technology at the time of the survey.
Interventional radiology and cardiology
In 2013 a pilot survey of selected installations, both public and private, was instigated by the HSE for interventional radiology and cardiology.
A subset of examinations, based on frequent examinations identified in the European Union Dose Datamed Project (European Commission,
2013), were selected for this survey and are listed in Table 17.
Due to the complex nature of the examinations and the varying levels of interventional radiology and cardiology between installations,
hospitals were grouped according to the level of fluoroscopy or cardiology equipment on the HSE register of ionising radiation installations.
A subset of hospitals in each group provided data, from which an estimate of the frequency of examinations nationwide was extrapolated.
The average effective dose from the surveyed installations in each group was then applied to all hospitals within the group.
Table 17. Fluoroscopy and interventional radiology procedures
Procedure Sub-procedure
Fluoroscopy GI tract Oesophageal & stomach & small intestine
Colon
Biliary tract Biliary tract
Theatre Orthopaedics All orthopaedics
Other (abdomen, spine, etc.) Other (abdomen, spine, etc.)
Interventional Radiology /cardiology Cerebral procedures, high dose studies, e.g., embolisation
Cerebral procedures, all other
Cardiac procedures including electrophysiology (EP) studies
All thoracic procedures
All abdominal procedures
All pelvic procedures
All peripheral procedures
Percutaneous transluminal coronary angioplasty (PTCA)
Pacemaker
All IV lines, e.g. Hickman
Transjugular intrahepatic portosystemic shunt (TIPS)
Analysis of the responses to the 2013 survey gives a collective dose of around 630 man Sv, including those fluoroscopy studies surveyed
as part of the general X-ray and nuclear medicine survey (MERU, Personal communication, 5 September 2013). Interventional cardiology
accounts for 80% of this dose.
2.7.2 Total population dose from diagnostic medical imaging
The collective doses for each modality have been summarised in Table 18. Collective doses per diagnostic imaging modality. The total
collective dose from diagnostic medical imaging is 2505 man Sv. The resulting average annual dose is 546 µSv which is consistent with the
value obtained in 2008 (540 µSv) (Colgan et al., 2008). The distribution of collective dose from the various modalities is illustrated in Figure
13 while the distribution of examination frequency from the various modalities is illustrated in Figure 14.
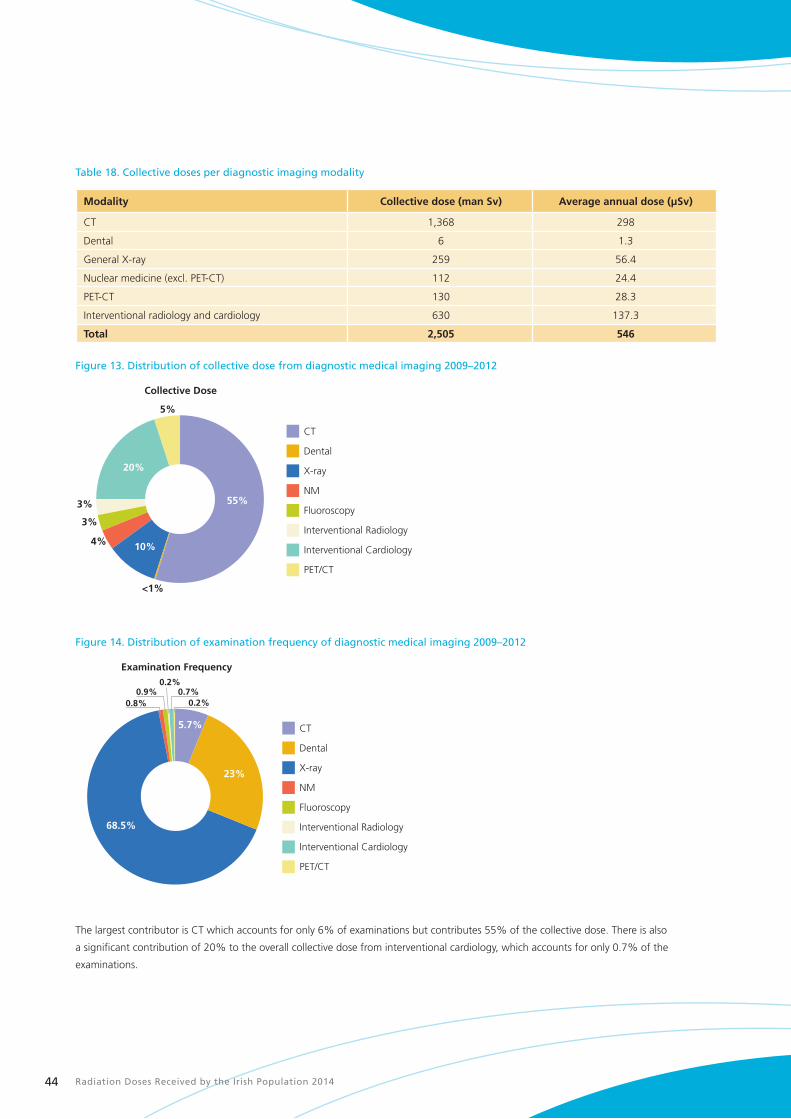
Radiation Doses Received by the Irish Population 201444
Table 18. Collective doses per diagnostic imaging modality
Modality Collective dose (man Sv) Average annual dose (µSv)
CT 1,368 298
Dental 6 1.3
General X-ray 259 56.4
Nuclear medicine (excl. PET-CT) 112 24.4
PET-CT 130 28.3
Interventional radiology and cardiology 630 137.3
Total 2,505 546
Figure 13. Distribution of collective dose from diagnostic medical imaging 2009–2012
PET/CT
Interventional Cardiology
Interventional Radiology
Fluoroscopy
NM
X-ray
Dental
CT
55%
10%
20%
5%
Collective Dose
3%
3%
4%
<1%
Figure 14. Distribution of examination frequency of diagnostic medical imaging 2009–2012
PET/CT
Interventional Cardiology
Interventional Radiology
Fluoroscopy
NM
X-ray
Dental
CT
23%
68.5%
5.7%
0.2%0.8%0.9%
0.2%0.7%
Examination Frequency
The largest contributor is CT which accounts for only 6% of examinations but contributes 55% of the collective dose. There is also
a significant contribution of 20% to the overall collective dose from interventional cardiology, which accounts for only 0.7% of the
examinations.

Radiation Doses Received by the Irish Population 2014 45
The average annual dose across the modalities from other EU countries published in the Draft Report of the EU Dose Datamed Project
(European Commission, 2013b) is illustrated in Figure 15. The respective contributions from the various modalities in Ireland are similar to or
lower than those in the other European countries shown.
Figure 15. Comparison of average annual dose (mSv) per modality across EU countries
0.0
0.2
0.4
0.6
0.8
1.0
1.2
1.4
Ireland
Switzerland
France
Germany
UK
Belgium
Finland
NMFluoroscopy*CT X-ray
Ave
rag
e an
nu
al d
ose
(m
Sv)
*Including interventional radiology and cardiology
The overall average annual dose of 546 μSv from all diagnostic medical procedures in Ireland is higher than the value reported in the UK (419
µSv (Hart et al., 2010), but lower than in other countries such as France (660–830 µSv (Scanff et al., 2008)) or Norway (1090 µSv (Borretzen
et al., 2007)).
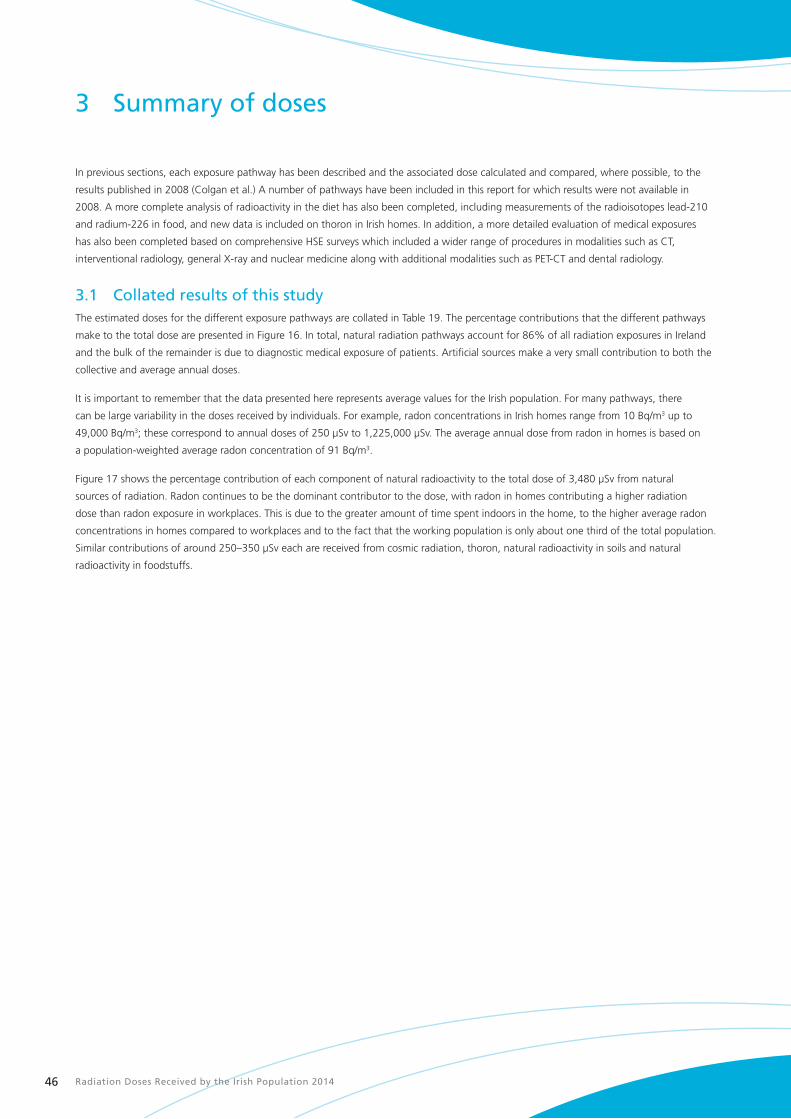
Radiation Doses Received by the Irish Population 201446
3 Summary of doses
In previous sections, each exposure pathway has been described and the associated dose calculated and compared, where possible, to the
results published in 2008 (Colgan et al.) A number of pathways have been included in this report for which results were not available in
2008. A more complete analysis of radioactivity in the diet has also been completed, including measurements of the radioisotopes lead-210
and radium-226 in food, and new data is included on thoron in Irish homes. In addition, a more detailed evaluation of medical exposures
has also been completed based on comprehensive HSE surveys which included a wider range of procedures in modalities such as CT,
interventional radiology, general X-ray and nuclear medicine along with additional modalities such as PET-CT and dental radiology.
3.1 Collated results of this studyThe estimated doses for the different exposure pathways are collated in Table 19. The percentage contributions that the different pathways
make to the total dose are presented in Figure 16. In total, natural radiation pathways account for 86% of all radiation exposures in Ireland
and the bulk of the remainder is due to diagnostic medical exposure of patients. Artificial sources make a very small contribution to both the
collective and average annual doses.
It is important to remember that the data presented here represents average values for the Irish population. For many pathways, there
can be large variability in the doses received by individuals. For example, radon concentrations in Irish homes range from 10 Bq/m3 up to
49,000 Bq/m3; these correspond to annual doses of 250 µSv to 1,225,000 µSv. The average annual dose from radon in homes is based on
a population-weighted average radon concentration of 91 Bq/m3.
Figure 17 shows the percentage contribution of each component of natural radioactivity to the total dose of 3,480 µSv from natural
sources of radiation. Radon continues to be the dominant contributor to the dose, with radon in homes contributing a higher radiation
dose than radon exposure in workplaces. This is due to the greater amount of time spent indoors in the home, to the higher average radon
concentrations in homes compared to workplaces and to the fact that the working population is only about one third of the total population.
Similar contributions of around 250–350 µSv each are received from cosmic radiation, thoron, natural radioactivity in soils and natural
radioactivity in foodstuffs.

Radiation Doses Received by the Irish Population 2014 47
Table 19. Average annual radiation doses in Ireland
Exposure pathway Dose due to natural sources of radiation (µSv)
Dose due to artificial sources of radiation (µSv)
Cosmic radiation 343
At sea level 302
Airline travel 41
Gamma radiation in the environment 295 6.01
Radon in homes 1995
Thoron in homes 350
Radioactivity in food and water† 262 5
Carbon-14 6 2
Potassium-40 170
Rubidium-87 2
Radium-228 (from thorium-232) 7
Radium-226 4
Polonium-210 (from uranium-238) 47
Lead-210 (from uranium-238) 26
Discharges from Sellafield 0.07
Radioactivity in milk 0.5
Caesium-137 in mixed diet 2.7
Occupational exposures 235 0.02
Aircrew cosmic radiation 6
Radon in schools 3.3
Radon in above ground workplaces 226
Radon in below ground workplaces <0.02
NORM industries <0.1
Artificial radioactivity 0.02
Medical exposures 546
CT 298
Dental 1.3
General X-ray 56.4
Nuclear medicine (excluding PET-CT) 24.4
PET-CT 28.3
Interventional radiology and cardiology 137.3
TOTAL (4037) 3480 (86%) 557 (14%)
† Drinking water accounts for an average annual dose of <100 µSv
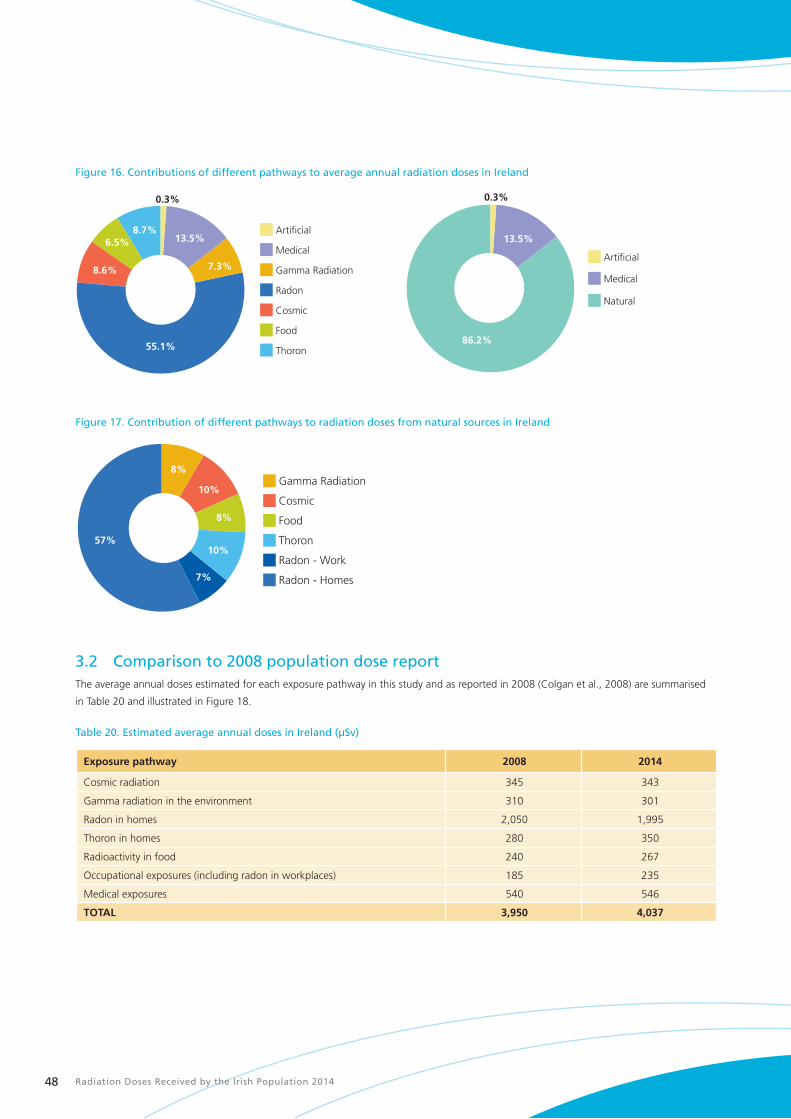
Radiation Doses Received by the Irish Population 201448
Figure 16. Contributions of different pathways to average annual radiation doses in Ireland
Thoron
Food
Cosmic
Radon
Gamma Radiation
Medical
Artificial
55.1%86.2%
7.3%
13.5% 13.5%
8.6%
6.5%8.7%
0.3% 0.3%
Natural
Medical
Artificial
Figure 17. Contribution of different pathways to radiation doses from natural sources in Ireland
Radon - Homes
Radon - Work
Thoron
Food
Cosmic
Gamma Radiation
57%10%
7%
8%
10%
8%
3.2 Comparison to 2008 population dose reportThe average annual doses estimated for each exposure pathway in this study and as reported in 2008 (Colgan et al., 2008) are summarised
in Table 20 and illustrated in Figure 18.
Table 20. Estimated average annual doses in Ireland (µSv)
Exposure pathway 2008 2014
Cosmic radiation 345 343
Gamma radiation in the environment 310 301
Radon in homes 2,050 1,995
Thoron in homes 280 350
Radioactivity in food 240 267
Occupational exposures (including radon in workplaces) 185 235
Medical exposures 540 546
TOTAL 3,950 4,037
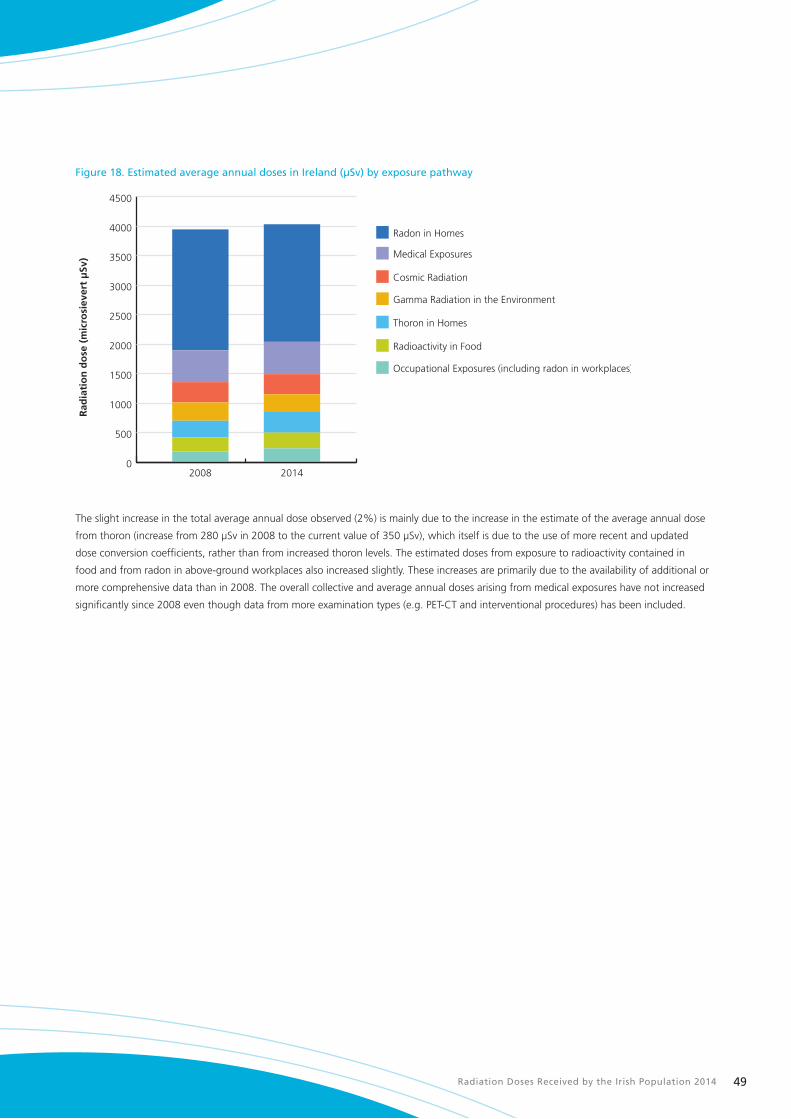
Radiation Doses Received by the Irish Population 2014 49
Figure 18. Estimated average annual doses in Ireland (µSv) by exposure pathway
0
500
1000
1500
2000
2500
3000
3500
4000
4500
Radon in Homes
Medical Exposures
Cosmic Radiation
Gamma Radiation in the Environment
Thoron in Homes
Radioactivity in Food
Occupational Exposures (including radon in workplaces)
20142008
Rad
iati
on
do
se (
mic
rosi
ever
t μ
Sv)
The slight increase in the total average annual dose observed (2%) is mainly due to the increase in the estimate of the average annual dose
from thoron (increase from 280 µSv in 2008 to the current value of 350 µSv), which itself is due to the use of more recent and updated
dose conversion coefficients, rather than from increased thoron levels. The estimated doses from exposure to radioactivity contained in
food and from radon in above-ground workplaces also increased slightly. These increases are primarily due to the availability of additional or
more comprehensive data than in 2008. The overall collective and average annual doses arising from medical exposures have not increased
significantly since 2008 even though data from more examination types (e.g. PET-CT and interventional procedures) has been included.
Radiation Doses Received by the Irish Population 201450
4 Conclusions
The estimated average annual dose in Ireland from all sources of radiation of 4,037 µSv is consistent with the value of 3,950 µSv which was
estimated in the 2008 assessment (Colgan et al., 2008).
Radon continues to be the principal source of radiation exposure in Ireland, representing just over 55% of the radiation dose received by
the Irish population. Most of this dose is received in people’s homes although radon exposure at work continues to account for the largest
contribution to all occupational exposure. Radon is also the most variable source of radiation exposure with radon concentrations in Irish
homes ranging from 10 Bq/m3 up to 49,000 Bq/m3, corresponding to annual doses of 250 µSv to 1,225,000 µSv. It is hoped that there will
be a significant reduction in radiation exposure from radon over the coming years – this can be achieved by raising awareness of the radon
problem and promoting prevention and remediation through the recently published National Radon Control Strategy.
Medical exposure of patients remains by far the largest man-made contributor to the collective dose. However, the collective and average
annual doses from medical exposure have not increased significantly since 2008 despite the fact that we now have data from a wider range
of modalities. Because of the significant differences in the range of data available to this assessment and that of 2008, it is difficult to be
definitive about the existence of any trend in radiation doses attributable to medical procedures. The HSE surveys that were conducted
between 2010 and 2013 now provide a comprehensive set of national baseline data against which future surveys may be compared to track
changes to the population’s radiation doses from medical exposure.
The remaining contributions to the total radiation exposure in Ireland come primarily from natural sources such as cosmic radiation,
thoron and radioactivity in the ground and in food. While the contributions from cosmic radiation and radioactivity in the ground remain
the same as in the 2008 assessment, the contributions from thoron and radioactivity in food have increased, predominantly as a result of
the availability of additional data for this assessment. These sources make a relatively small contribution to the collective dose or are not
amenable to control. Other sources such as fallout from nuclear accidents and weapons tests or discharges of nuclear or radioactive waste to
the environment remain at very low levels.
Radiation Doses Received by the Irish Population 2014 51
5 Acknowledgements
The RPII wishes to express its appreciation to the following for their assistance in various ways towards the preparation of this report.
n Radon Measurement Services
n The First Restaurant, University College Dublin
n Dr Janette Walton of the Irish Universities Nutrition Alliance
n Health Service Executive
The report was prepared under the direction of Dr Ciara McMahon, Director, Environmental Surveillance and Assessment Division. The project
was managed by Ms Lorraine Currivan and the principal author was Ms Collette O’Connor, Environmental Surveillance and Assessment
Division.
Special thanks are due to the following RPII and HSE staff that provided material for the report and commented on specific aspects:
n Dr Kevin Kelleher, RPII
n Dr Paul McGinnity, RPII
n Ms Veronica Smith, RPII
n Ms Stephanie Long, RPII
n Ms Noeleen Cunningham, RPII
n Ms Mandy Lewis, HSE
Advice and comment on the report were also received from, Dr Ann McGarry, Chief Executive Officer, RPII, Dr Catherine Organo, RPII, and
Prof. Ian Mc Aulay, TCD.
Production of the report was managed by the Communications section of the RPII, in particular, Mr David Dawson and Ms Linda Coyne.
Finally, many thanks to other RPII staff who provided invaluable technical support and assistance in the preparation of this report.
Radiation Doses Received by the Irish Population 201452
6 References
Bartlett, D. et al., 1997. Dosimetry for occupational exposure to cosmic radiation. Radiation Protection Dosimetry, Volume 70, pp. 394–404.
Berrington et al., 2009. Projected Cancer Risks from Computed Tomography Scans Performed in the United States in 2007. Archives of
Internal Medicine, 169(22), pp. 2071–2077.
Borretzen, I., Lysdahl, K. & Olerud, H., 2007. Diagnostic radiology in Norway - trends in examination frequency and collective effective dose.
Radiation Protection Dosimetry, 124(4), pp. 337–347.
Bouville, A. & Lowder, W., 1988. Human population exposure to cosmic radiation. Radiation Protection Dosimetry, Volume 24, pp. 293–298.
Brenner, D. & Hall, E., 2007. Computed Tomography - An Increasing Source of Radiation Exposure. New England Journal of Medicine,
Volume 357, pp. 2277–2284.
Cefas, 2008. An assessment of aquatic radiation pathways in Ireland, 2008. Lowestoft: Environment Report RL 16/08, Cefas contract C3030.
Central Statistics Office, 2012a. Principal statistics: employment and unemployment. [Online]
Available at: http://www.cso.ie/en/statistics/labourmarket/principalstatistics/
[Accessed 03 02 2014].
Central Statistics Office, 2012b. Statistical Yearbook of Ireland 2012 Edition. [Online]
Available at: http://www.cso.ie/en/releasesandpublications/statisticalyearbookofireland/statisticalyearbookofireland2012edition/
[Accessed 06 03 2014].
Central Statistics Office, 2013a. Household Travel Survey 2012. [Online]
Available at: http://www.cso.ie/en/media/csoie/releasespublications/documents/tourismtravel/2012/hotra2012.pdf
[Accessed 5 March 2014].
Central Statistics Office, 2013b. Tourism and Travel 2012. [Online]
Available at: http://www.cso.ie/en/media/csoie/releasespublications/documents/tourismtravel/2012/tata_2012.pdf
[Accessed 6 March 2014].
Colgan, P., 1980. Environmental radiation in Ireland and its possible health implications. PhD Thesis. Dublin: Trinity College.
Colgan, P., Organo, C., Hone, C. & Fenton, D., 2008. Radiation Doses Received by the Irish Population. Dublin: Radiological Protection
Institute of Ireland.
Cunningham, J., MacNeill, G. & Pollard, D., 1987. Chernobyl: Its effect on Ireland. Dublin: Nuclear Energy Board.
Currivan, L., Kelleher, K., Solodovnik, E. & McMahon, C., 2013. Radioactivity in bottled water produced in Ireland. RPII 13/05. Dublin:
Radiological Protection Institute of Ireland.
DECLG, 2014. National Radon Control Strategy. Dublin:Department of Environment, Community and Local Government.
DES, 2012. Key Statistics 2011/2012. [Online]
Available at: http://www.education.ie/en/Publications/Statistics/Key-Statistics-2012.pdf
[Accessed 15 10 2013].
Doorly, E., 2006. Radioactivity from building materials in the Republic of Ireland. Ph.D. Thesis. Dublin: Trinity College Dublin.
Dowdall, A. et al., 2013. Radioactivity levels in groundwater sources in Ireland. Dublin: Radiological Protection Institute of Ireland.
EPA, 2010a. Water Quality in Ireland 2007 – 2009. Wexford: Environmental Protection Agency.
EPA, 2010b. The Provision and Quality of Drinking Water in Ireland. A Report for the Years 2008–2009. Wexford: Environmental Protection
Agency.
EU Council, 1997. Directive 97/43/Euratom of 30 June 1997 On the health protection of individuals against the dangers of ionising radiation
in relation to medical exposure and repealing Directive 84/466/Euratom. Luxembourg: Council of the European Union.

Radiation Doses Received by the Irish Population 2014 53
European Commission, 2000. Commission Recommendation 2000/473/EURATOM on the application of Article 36 of the Euratom Treaty
concerning the monitoring of the levels of radioactivity in the environment for the purpose of assessing the exposure of the population as a
whole. Official Journal of the European Communities, L191, 277.7.2000, pp.37–51.
European Commission, 2004. Radiation Protection 140. Cosmic Radiation Exposure of Aircraft Crew. Luxembourg: European Commission.
European Commission, 2008. Radiation Protection No. 154. European Guidance on estimating population doses from medical X-rays.
Luxembourg: European Commission.
European Commission, 2012. Radiation Protection No.173. Comparison of Codes Assessing Radiation Exposure of Aircraft Crew due to
Galactic Cosmic Radiation. Luxembourg: European Commission.
European Commission, 2013a. Council Directive 2013/15/EURATOM of 22 October 2013 laying down requirements for the protection of
the health of the general public with regard to radioactive substances in water intended for human consumption. Luxembourg: European
Commission.
European Commission, 2013b. Draft Report: Study on European Population Doses from Medical Exposure (Dose Datamed II). Luxembourg:
European Commission.
European Communities, 1998. Council Directive 98/83/EC of 3 November 1998 on the quality of water intended for human consumption.
Official Journal of the European Communities, L330, 05/12/1998, pp. 32–54.
Fennell, S. et al., 2002. Radon in dwellings. The Irish national radon survey. Dublin: Radiological Protection Institute of Ireland.
Gunning, G.A.; Pollard, D.; Finch, E.C., In press. An outdoor radon survey and minimizing the uncertainties in low level measurements using
CR-39 detectors. Journal of Radiological Protection.
Ham, G., Ewers, L. & Wilkins, B., 1998. Variations in concentrations of naturally occurring radionuclides in foodstuffs. Chilton: National
Radiological Protection Board.
Hart, D., Wall, B., Hillier, M. & Shrimpton, P., 2010. Frequency and Collective Dose for Medical and Dental X-ray Examinations in the UK.
Chilton: Health Protection Agency.
Hayes, A., An Investigation of the Relationship between Soil Composition and External Radiation Dose Rates in Selected Parts of Ireland.
M.Sc. Thesis. Dublin: National University of Ireland.
HPA, 2006. Notes for Guidance on the Clinical Administration of Radiopharmaceuticals and Use of Sealed Radioactive Sources. Chilton:
Health Protection Agency.
HSE, 2008. National Radiation Safety Committee Annual Report. Dublin: Health Services Executive.
HSE, 2011a. Population Dose from CT Scanning: 2009. Dublin: Health Services Executive.
HSE, 2011b. Population Dose from Dental Radiology: 2010. Dublin: Health Services Executive.
HSE, 2013. Population Dose from General Radiology and Nuclear Medicine: 2011. Dublin: Health Services Executive.
ICRP, 1993. Protection against Radon-222 at Home and at Work. International Commission on Radiological Protection. Publication 65.
Oxford: Pergamon Press.
ICRP, 1994. Human Respiratory Tract Model for Radiological Protection. International Commission on Radiological Protection. Publication 66.
Oxford: Pergamon Press.
ICRP, 1995. Age-dependent Doses to Members of the Public from Intake of Radionuclides: Part 5: Compilation of Ingestion and Inhalation
Dose Coefficients. International Commission on Radiological Protection. Publication 72. Oxford: Pergamon Press.
ICRP, 2000. Radiation dose to patients from radiopharmaceuticals. International Commission on Radiological Protection. Publication 80.
Oxford: Pergamon Press.
Radiation Doses Received by the Irish Population 201454
ICRP, 2007. The 2007 recommendations of the International Commission on Radiation Protection. International Commission on Radiological
Protection. Publication 103. Oxford: Pergamon Press.
Ishikawa, T., Tokonami, S. & Nemeth, C., 2007. Calculation of dose conversion factors for thoron decay products. Journal of Radiological
Protection, 27(4), pp. 447–456.
IUNA, 2011. National Adult Nutrition Survey Summary Report. Cork: Irish Universities Nutrition Alliance.
Kendall, G. & Phipps, A., 2007. Effective and organ doses from thoron decay products at different ages. Journal of Radiological Protection,
27(4), pp. 427–35.
Lee, E., Menezes, G. & Finch, E., 2004. Natural radioactivity in building materials in the Republic of Ireland. Health Physics, Volume 86, pp.
378–383.
Lehto, J. & Hou, X., 2011. Chemistry and Analysis of Radionuclides. Germany: Wiley-VCH.
Madden, J. et al., 1994. Radon in Selected Areas in Ireland. Report RPII 94/3. Dublin: Radiological Protection Institute of Ireland.
Marsh, D., 1991. Radiation mapping and soil radioactivity in the Republic of Ireland. M.Sc. Thesis. Dublin: Trinity College.
McAulay, I. & Colgan, P., 1984. Gamma radiation levels in dwellings in the Republic of Ireland. Radiation Protection Dosimetry, Volume 7, pp.
309–311.
McGinnity, P. et al., 2012a. Radioactivity Monitoring of the Irish Environment 2010–2011. Report RPII 12/02. Dublin: Radiological Protection
Institute of Ireland.
McGinnity, P. et al., 2012b. Assessment of the Impact on Ireland of the 2011 Fukushima Nuclear Accident. Report RPII 12/01. Dublin:
Radiological Protection Institute of Ireland.
McLaughlin, J. et al., 2011. Long-term Measurements of Thoron, its Airborne Progeny and Radon in 205 Dwellings in Ireland. Radiation
Protection Dosimetry, 145(2–3), pp. 189–193.
NASA, 2009. Shuttle Radar Topography Mission - The Mission to Map the World. [Online]
Available at: http://www2.jpl.nasa.gov/srtm
[Accessed 18 September 2013].
Ní Choncubhair, O., 2007. Passive detection of environmental thoron gas and its progeny. M.Sc. Thesis. Dublin: National University of Ireland.
Organo, C. et al., 2007. Occupational exposure to natural sources of radiation in Ireland. Presented at: 8th International Conference on the
Natural Radiation Environment, Buzios, Brazil, 7–12 October 2007.
Organo, C. et al., 2004. High radon concentrations in a house near Castleisland, county Kerry (Ireland) - identification, remediation and post-
remediation. Journal of Radiological Protection, Volume 24, pp. 107–120.
Organo, C. & Fenton, D., 2008. Radiological assessment of NORM Industries in Ireland – Radiation doses to workers and members of the
public. Dublin: Radiological Protection Institute of Ireland.
Peterman, B. & Perkins, C., 1988. Dynamics of radioactive chemically inert gases in the human body. Radiation Protection Dosimetry, Volume
22, pp. 5–12.
RPII, 2013. RPII Inspection and Licensing Activities and Annual Inspection Programme for 2013. Dublin: Radiological Protection Institute of
Ireland.
Ryan, R. et al., 2007. Radioactivity Monitoring of the Irish Environment 2003–2005. Report RPII-07/1. Dublin: Radiological Protection Institute
of Ireland.
Ryan, T., 1991. Nuclear fallout in the Irish terrestrial environment. Ph.D. Thesis. Dublin: National University of Ireland.
Radiation Doses Received by the Irish Population 2014 55
Ryan, T., Sequeira, S., McKittrick, L. & Colgan, P., 2003. Radon in Drinking Water in Co. Wicklow - A Pilot Study. Report RPII-03/1. Dublin:
Radiological Protection Institute of Ireland.
Scanff et al., 2008. Population exposure to ionizing radiation from medical examinations in France. British Journal of Radiology, Volume 81,
pp. 204–213.
Stationery Office, 2000. Radiological Protection Act, 1991 (Ionising Radiation) Order, 2000 (Statutory Instrument No. 125 of 2000). Dublin:
Stationery Office.
Stationery Office, 2002. European Communities (Medical Ionising Radiation Protection) Regulations 2002 (Statutory Instrument No. 478 of
2000). Dublin: Stationery Office.
Swift, B., 1998. Dating human skeletal remains: Investigating the viability of measuring the equilibrium between Po-210 and 210Pb as a
means of estimating the post-mortem interval. Forensic Science International, 98(1–2), pp. 119–126.
Synnott., H., Colgan, P., Hanley, O. & Denton, D., 2007. The effectiveness of radon remediation in Irish schools. Health Physics, Volume 92,
pp. 50–57.
Synnott, H. et al., 2004. Radon in Irish Primary and post-Primary schools. The Results of a National Survey. Report RPII-04/02. Dublin:
Radiological Protection Institute of Ireland.
Synnott, H., Hanley, O., Fenton, D. & Colgan, P., 2006. Radon in Irish Schools: the results of a national survey. Journal of Radiological
Protection, Volume 26, pp. 85-96.
TELLUS Border, 2013. TELLUS Border. [Online]
Available at: http://www.tellusborder.eu/
[Accessed 17 September 2013].
UNSCEAR, 1993. Sources and Effects of Ionising Radiation. United Nations Scientific Committee on the Effects of Atomic Radiation.
New York: United Nations.
UNSCEAR, 2000. Sources and Effects of Ionising Radiation. United Nations Scientific Committee on the Effects of Atomic Radiation.
New York: United Nations.
USGS, 2011. Shuttle Radar Topography Mission (SRTM). [Online]
Available at http://srtm.usgs.gov/index.php
[Accessed 14 March 2014]
Watson, S., Jones, A., Oatway, W. & Hughes, J., 2005. Ionising Radiation Exposure of the UK Population:2005 review. HPA-RPD-001.
Chilton: Health Protection Agency.
WHO, 1993. Guidelines for Drinking Water Quality, 2nd edition. Geneva: World Health Organization.
Worldometers, 2013. Worldometers - real time world statistics. [Online]
Available at: http://www.worldometers.info/world-population/
[Accessed 02 October 2013].
Yamamoto, M. et al., 2009. Measurements of 210Po and 210Pb in total diet samples: Estimate of dietary intakes of 210Po and 210Pb for Japanese.
Journal of Radioanalytical and Nuclear Chemistry, 279(1), pp. 93–103.
Radiation Doses Received by the Irish Population 201456
Appendix 1Summary of surveys of outdoor gamma radiation levels in Ireland
Marsh carried out a survey of outdoor gamma dose rate levels based on the 10 x 10 km2 Irish national grid (Marsh, 1991). In total, 650
measurements were made throughout the country, one close to the centre of each accessible grid square. The results indicated an average
outdoor absorbed dose rate in air for the whole country of 31 nGy/h.
Hayes followed up the study by Marsh and measured gamma dose rate levels at 64 locations distributed along 5 different transects (Hayes,
1995). Four transects were located in regions previously known to contain high levels of the natural radionuclide Ra-226 while the fifth
transect was located in a contrasting region that had previously shown low activities of Ra-226. An average value of 34 nGy/h was calculated
based on this supplementary dataset.
An earlier study by Colgan considered two gamma dose rate datasets (Colgan, 1980). The first comprised measurements taken at 264
locations throughout Ireland and yielded an average value of 51 nGy/h. While the measurement points were not randomly selected and the
sample size was considerably smaller than Marsh’s, the data was relatively uniformly distributed across the country.
The second survey reported by Colgan was a more detailed assessment of eight eastern counties. The average of at least three individual
gamma dose rate measurements were reported for each District Electoral Division (DED) in Carlow, Kildare, Kilkenny, Meath, Waterford,
Westmeath, Wexford, Wicklow, leading to some 2,756 measurements in total and 622 aggregated results.
More recently, gamma radiation from the ground has been derived from airborne gamma spectrometry measurements carried out with a
spatial resolution of 50m conducted as part of TELLUS Border geophysics survey discussed in Section 2.2.1 (TELLUS Border, 2013). Based
on this survey, the average value for gamma radiation across six border counties between the Republic of Ireland and Northern Ireland -
Donegal, Sligo, Leitrim, Cavan, Monaghan and Louth – was found to be 35 nGy/h.
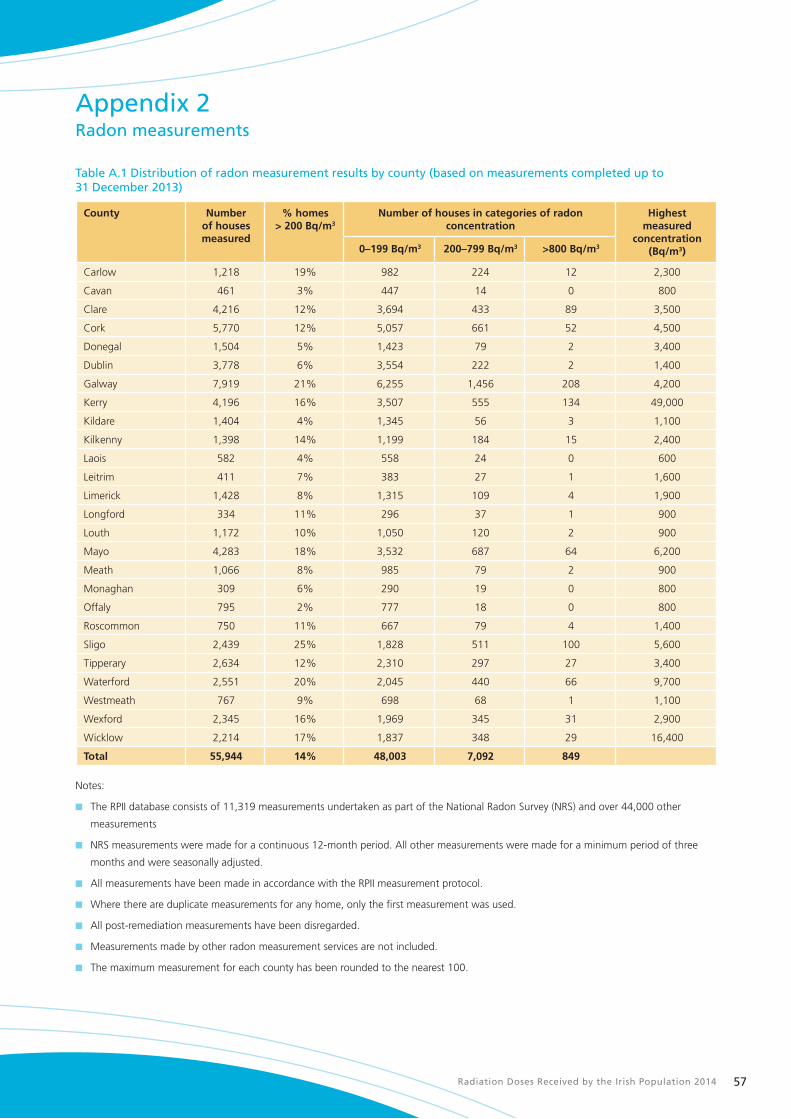
Radiation Doses Received by the Irish Population 2014 57
Appendix 2Radon measurements
Table A.1 Distribution of radon measurement results by county (based on measurements completed up to 31 December 2013)
County Numberof houses measured
% homes> 200 Bq/m3
Number of houses in categories of radon concentration
Highest measured
concentration (Bq/m3)0–199 Bq/m3 200–799 Bq/m3 >800 Bq/m3
Carlow 1,218 19% 982 224 12 2,300
Cavan 461 3% 447 14 0 800
Clare 4,216 12% 3,694 433 89 3,500
Cork 5,770 12% 5,057 661 52 4,500
Donegal 1,504 5% 1,423 79 2 3,400
Dublin 3,778 6% 3,554 222 2 1,400
Galway 7,919 21% 6,255 1,456 208 4,200
Kerry 4,196 16% 3,507 555 134 49,000
Kildare 1,404 4% 1,345 56 3 1,100
Kilkenny 1,398 14% 1,199 184 15 2,400
Laois 582 4% 558 24 0 600
Leitrim 411 7% 383 27 1 1,600
Limerick 1,428 8% 1,315 109 4 1,900
Longford 334 11% 296 37 1 900
Louth 1,172 10% 1,050 120 2 900
Mayo 4,283 18% 3,532 687 64 6,200
Meath 1,066 8% 985 79 2 900
Monaghan 309 6% 290 19 0 800
Offaly 795 2% 777 18 0 800
Roscommon 750 11% 667 79 4 1,400
Sligo 2,439 25% 1,828 511 100 5,600
Tipperary 2,634 12% 2,310 297 27 3,400
Waterford 2,551 20% 2,045 440 66 9,700
Westmeath 767 9% 698 68 1 1,100
Wexford 2,345 16% 1,969 345 31 2,900
Wicklow 2,214 17% 1,837 348 29 16,400
Total 55,944 14% 48,003 7,092 849
Notes:
n The RPII database consists of 11,319 measurements undertaken as part of the National Radon Survey (NRS) and over 44,000 other
measurements
n NRS measurements were made for a continuous 12-month period. All other measurements were made for a minimum period of three
months and were seasonally adjusted.
n All measurements have been made in accordance with the RPII measurement protocol.
n Where there are duplicate measurements for any home, only the first measurement was used.
n All post-remediation measurements have been disregarded.
n Measurements made by other radon measurement services are not included.
n The maximum measurement for each county has been rounded to the nearest 100.

Radiation Doses Received by the Irish Population 201458
Table A.2 Highest indoor radon concentrations identified by the RPII (based on measurements completed up to 31 December 2013)
County Location Radon concentration (Bq/m3)
1 Kerry Castleisland 49,000
2 Kerry Castleisland 37,000
3 Kerry Tralee 18,850
4 Wicklow Aughrim 16,438
5 Waterford Butlerstown 9,714
6 Kerry Tralee 8,490
7 Kerry Tralee 8,056
8 Mayo Crossmolina 6,203
9 Kerry Tralee 6,184
10 Sligo Ballisodare 5,619
11 Sligo Knocknarea 5,508
12 Kerry Tralee 5,185
13 Kerry Tralee 5,142
14 Kerry Ardfert 4,913
15 Kerry Tralee 4,772
16 Kerry Tralee 4,759
17 Cork Mallow 4,516
18 Cork Carrigaline 4,444
19 Kerry Castleisland 4,310
20 Galway Castlerea 4,189
21 Kerry Tralee 4,156
22 Carlow Borris 4,050
23 Kerry Tralee 3,986
24 Galway Galway City 3,750
25 Sligo Ballymote 3,733
26 Cork Mallow 3,726
27 Galway Castlegar 3,708
28 Kerry Castleisland 3,677
29 Kerry Tralee 3,667
30 Kerry Tralee 3,593
31 Clare Lisdoonvarna 3,541
32 Sligo Sligo Town 3,515
33 Kerry Tralee 3,452
34 Galway Rahoon 3,434
35 Mayo Ballinrobe 3,416
36 Donegal Lifford 3,402
37 Tipperary Clonmel 3,364
38 Galway Castlerea 3,357
39 Mayo Claremorris 3,261
40 Cork Mallow 3,227
41 Mayo Claremorris 3,216
42 Sligo Boyle 3,191
43 Waterford Fenor 3,140
44 Sligo Castlebaldwin 3,102
45 Kerry Castleisland 3,075
46 Kerry Tralee 3,038
47 Kerry Tralee 3,036
48 Waterford Cappagh 3,023
49 Sligo Hazelwood 3,009
50 Sligo Knocknarea 3,004

Radiation Doses Received by the Irish Population 2014 59

Radiation Doses Received by the Irish Population 201460


Contact Us
Radiological Protection Institute of Ireland
3 Clonskeagh Square
Dublin 14
Ireland
Tel: 01 2697766
Fax: 01 2697437
Website: www.rpii.ie
Email: [email protected]
Opening hours: 9:00am to 5:00pm