Radiation Balance at TOA - University College...
47
Radiation Balance at TOA
Transcript of Radiation Balance at TOA - University College...
Radiation Balance at TOA

Radiation Balance at TOAWe conclude with a brief survey of some of the global fieldsrelating to the energy balance at the top of the atmosphere.

Radiation Balance at TOAWe conclude with a brief survey of some of the global fieldsrelating to the energy balance at the top of the atmosphere.
These fields have been extracted from an analysis of a fullyear of satellite observations.
Radiation Balance at TOAWe conclude with a brief survey of some of the global fieldsrelating to the energy balance at the top of the atmosphere.
These fields have been extracted from an analysis of a fullyear of satellite observations.
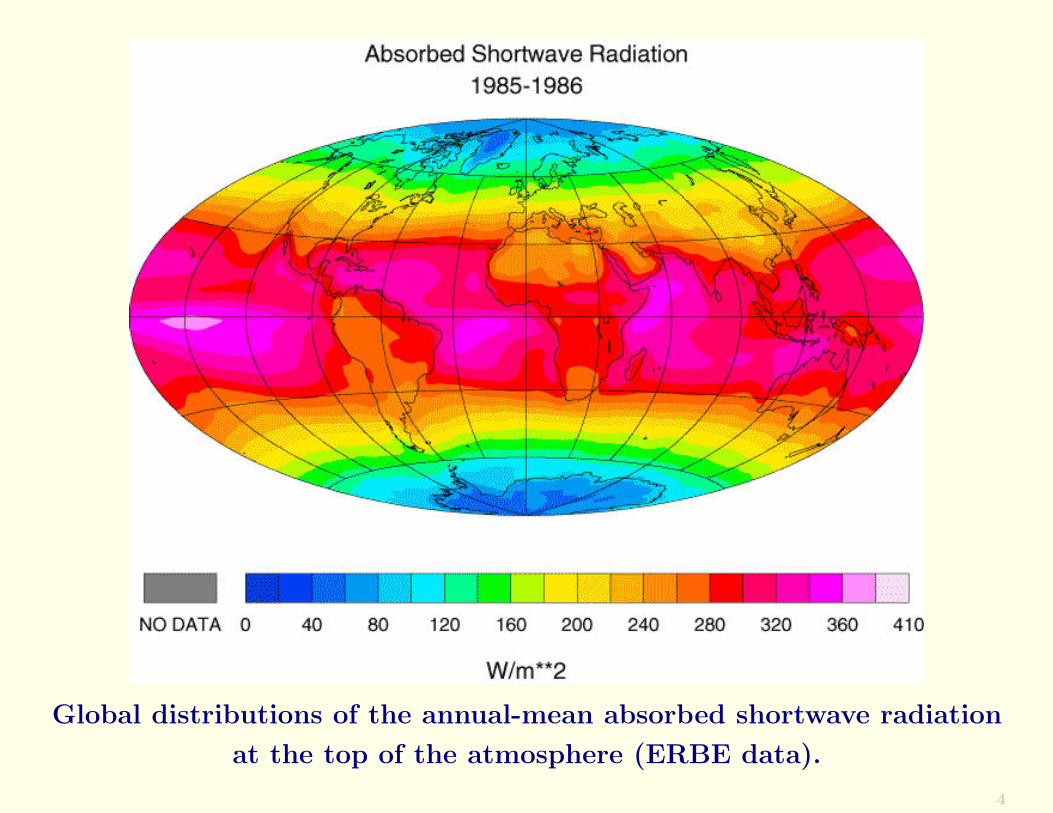
The first figure shows the annual mean net downward short-wave radiation.
Radiation Balance at TOAWe conclude with a brief survey of some of the global fieldsrelating to the energy balance at the top of the atmosphere.
These fields have been extracted from an analysis of a fullyear of satellite observations.
The first figure shows the annual mean net downward short-wave radiation.
This takes into account the geographical variations in solardeclination angle and local albedo.

Global distributions of the annual-mean absorbed shortwave radiation
at the top of the atmosphere (ERBE data).
2

Incoming Shortwave Radiation
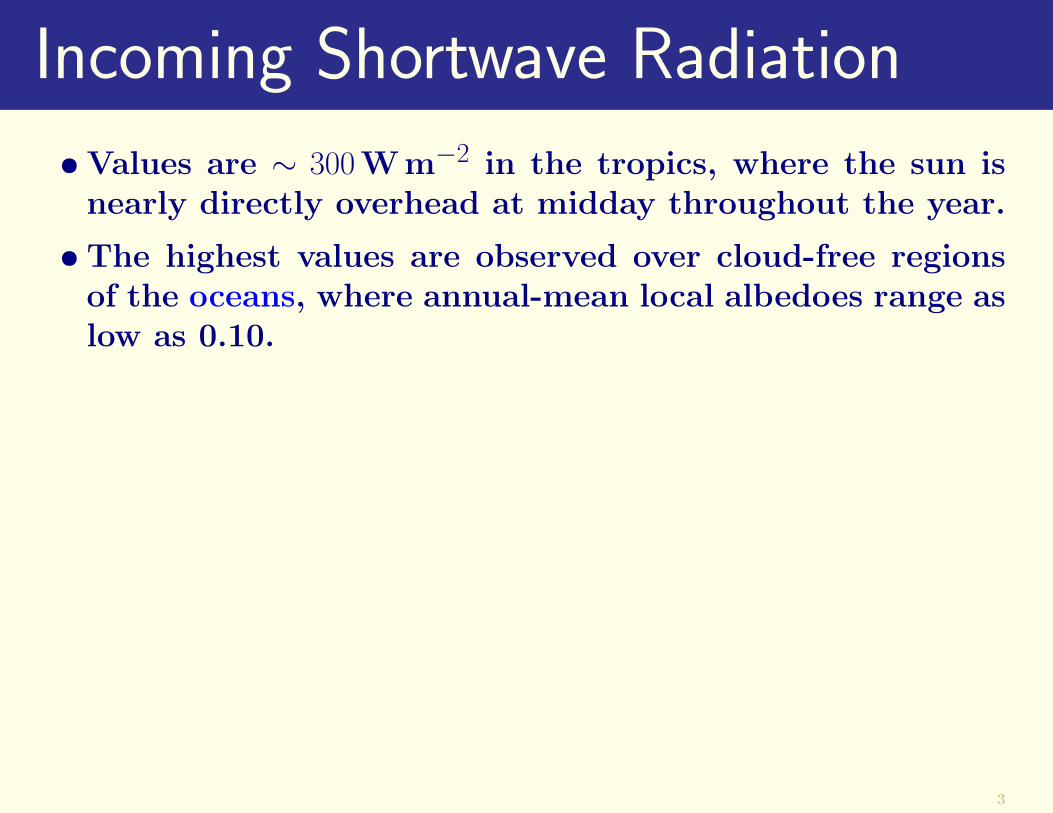
• Values are ∼ 300Wm−2 in the tropics, where the sun isnearly directly overhead at midday throughout the year.
3
Incoming Shortwave Radiation
• Values are ∼ 300Wm−2 in the tropics, where the sun isnearly directly overhead at midday throughout the year.
• The highest values are observed over cloud-free regionsof the oceans, where annual-mean local albedoes range aslow as 0.10.
3

Incoming Shortwave Radiation
• Values are ∼ 300Wm−2 in the tropics, where the sun isnearly directly overhead at midday throughout the year.
• The highest values are observed over cloud-free regionsof the oceans, where annual-mean local albedoes range aslow as 0.10.
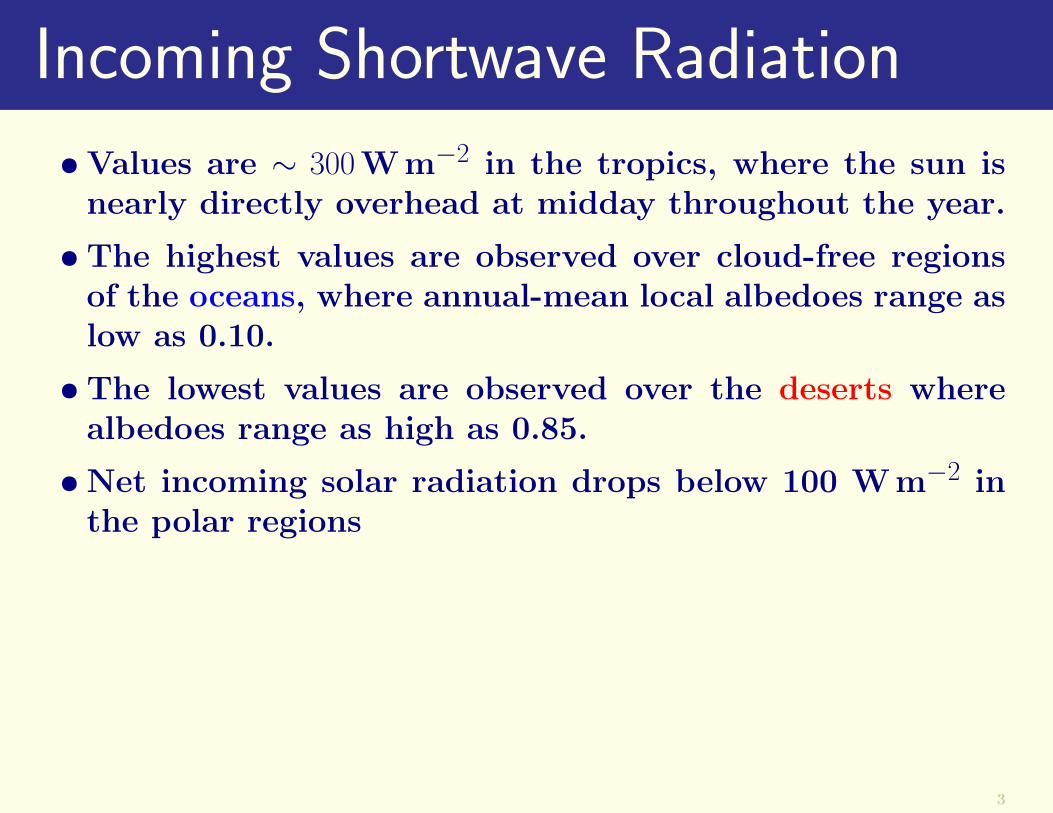
• The lowest values are observed over the deserts wherealbedoes range as high as 0.85.
3
Incoming Shortwave Radiation
• Values are ∼ 300Wm−2 in the tropics, where the sun isnearly directly overhead at midday throughout the year.
• The highest values are observed over cloud-free regionsof the oceans, where annual-mean local albedoes range aslow as 0.10.
• The lowest values are observed over the deserts wherealbedoes range as high as 0.85.
• Net incoming solar radiation drops below 100 Wm−2 inthe polar regions
3

Incoming Shortwave Radiation
• Values are ∼ 300Wm−2 in the tropics, where the sun isnearly directly overhead at midday throughout the year.
• The highest values are observed over cloud-free regionsof the oceans, where annual-mean local albedoes range aslow as 0.10.
• The lowest values are observed over the deserts wherealbedoes range as high as 0.85.
• Net incoming solar radiation drops below 100 Wm−2 inthe polar regions
• Here the winters are dark and the continuous summerdaylight is offset by the high solar zenith angles, widespreadcloudiness and the high albedo of ice covered surfaces.
3
Global distributions of the annual-mean absorbed shortwave radiation
at the top of the atmosphere (ERBE data).
4

Outgoing Longwave Radiation
5

Outgoing Longwave RadiationThe corresponding distribution of outgoing longwave radi-ation (OLR) at the top of the atmosphere, is shown next.
It exhibits a gentler equator-to-pole gradient and more re-gional variability within the tropics.
5
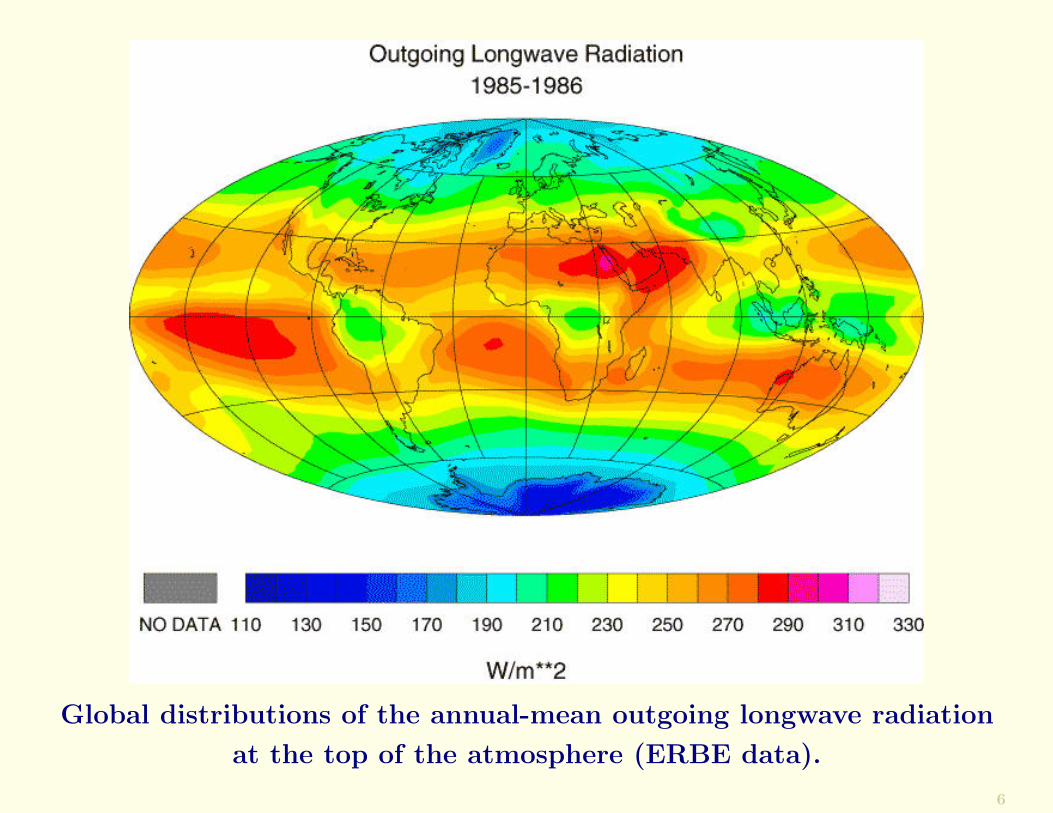
Global distributions of the annual-mean outgoing longwave radiation
at the top of the atmosphere (ERBE data).
6
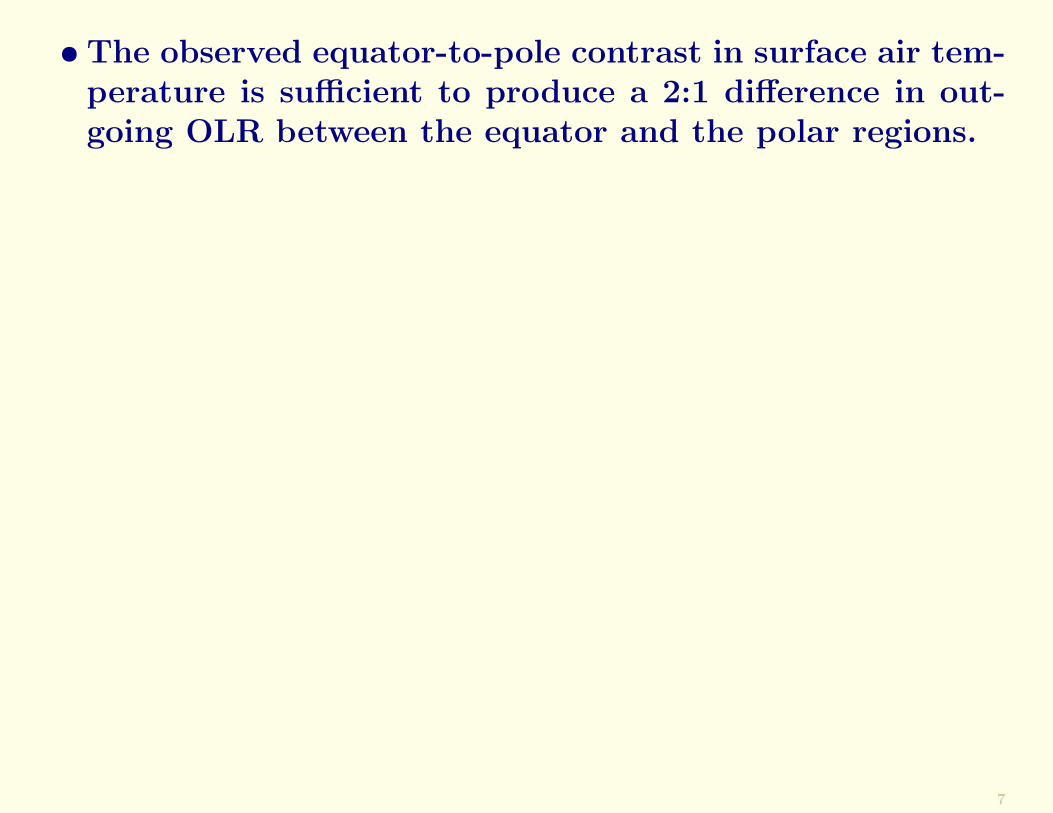
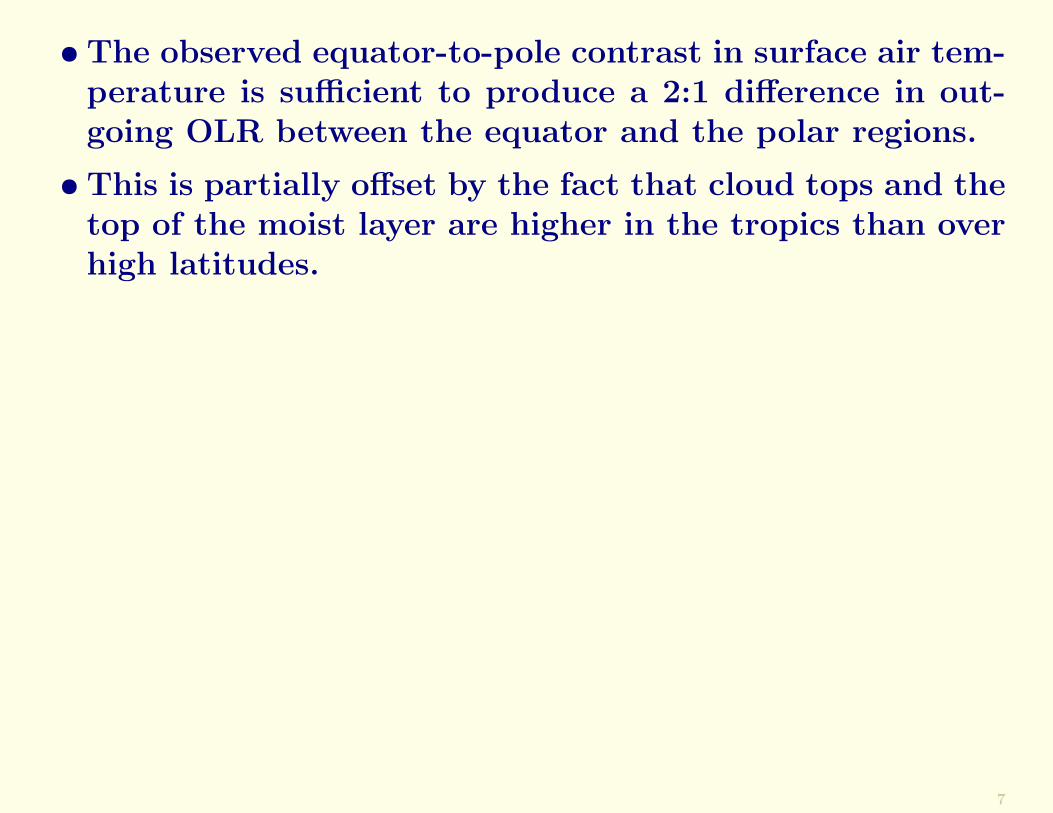
• The observed equator-to-pole contrast in surface air tem-perature is sufficient to produce a 2:1 difference in out-going OLR between the equator and the polar regions.
7
• The observed equator-to-pole contrast in surface air tem-perature is sufficient to produce a 2:1 difference in out-going OLR between the equator and the polar regions.
• This is partially offset by the fact that cloud tops and thetop of the moist layer are higher in the tropics than overhigh latitudes.
7

• The observed equator-to-pole contrast in surface air tem-perature is sufficient to produce a 2:1 difference in out-going OLR between the equator and the polar regions.
• This is partially offset by the fact that cloud tops and thetop of the moist layer are higher in the tropics than overhigh latitudes.
• The regions of conspicuously low OLR over Indonesia andparts of the tropical continents reflect the prevalence ofdeep convective clouds with high, cold tops.
• the intertropical convergence zone is also evident as alocal OLR minimum.
• The areas with the highest annual mean OLR are thedeserts and the equatorial dry zones over the tropicalPacific, where the atmosphere is relatively dry and cloudfree.
7

Global distributions of the annual-mean outgoing longwave radiation
at the top of the atmosphere (ERBE data).
8
Net Radiation at TOA
9
Net Radiation at TOAThe net downward radiation at the top of the atmosphere(i.e., the imbalance between net solar and outgoing long-wave radiation at the top of the atmosphere) is obtainedby taking the difference between the two distributions seenalready.
9
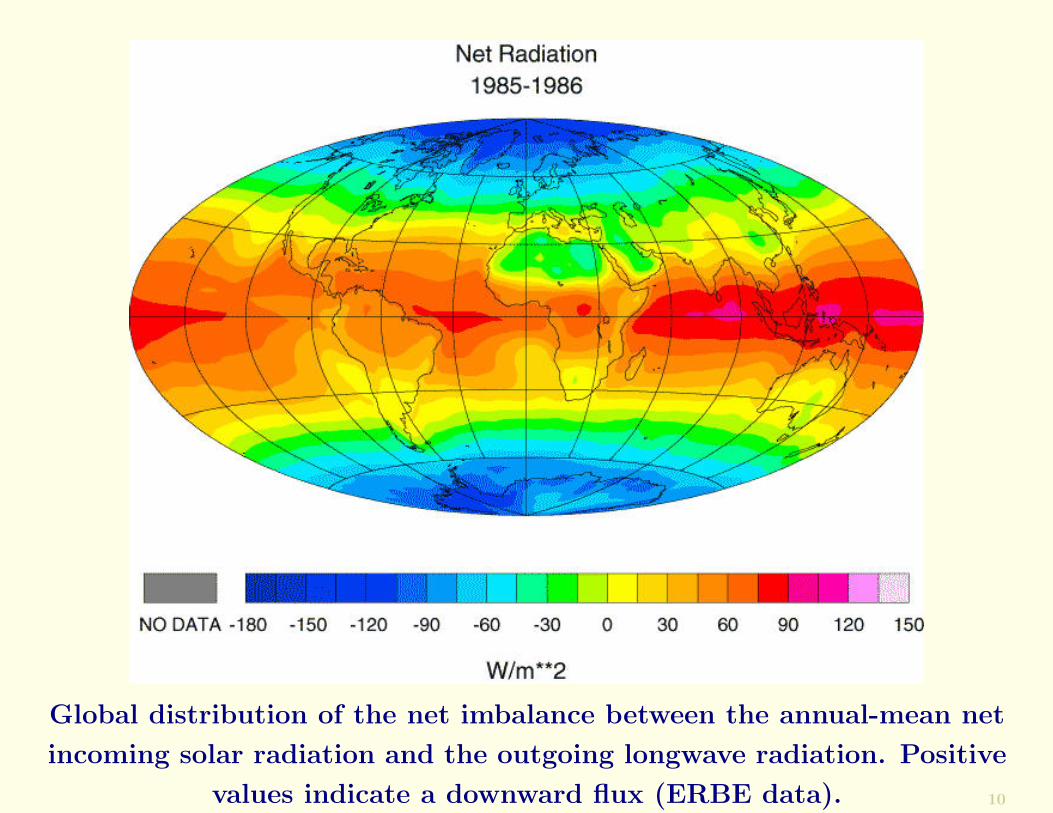
Global distribution of the net imbalance between the annual-mean net
incoming solar radiation and the outgoing longwave radiation. Positive
values indicate a downward flux (ERBE data). 10
There is a surplus of incoming solar radiation over outgoinglongwave radiation in low latitudes and a deficit in highlatitudes
11

There is a surplus of incoming solar radiation over outgoinglongwave radiation in low latitudes and a deficit in highlatitudes
This has important implications for the global energy bal-ance.
11
There is a surplus of incoming solar radiation over outgoinglongwave radiation in low latitudes and a deficit in highlatitudes
This has important implications for the global energy bal-ance.
It is notable that over some of the world’s hottest desertregions, the outgoing longwave radiation exceeds absorbedsolar radiation. Radiation deficits prevail over these regionseven during summer.
11

Global distribution of the net imbalance between the annual-mean net
incoming solar radiation and the outgoing longwave radiation. Positive
values indicate a downward flux (ERBE data). 12

Zonally averaged radiation balance in the atmosphere.
13
Effects of Clouds
14

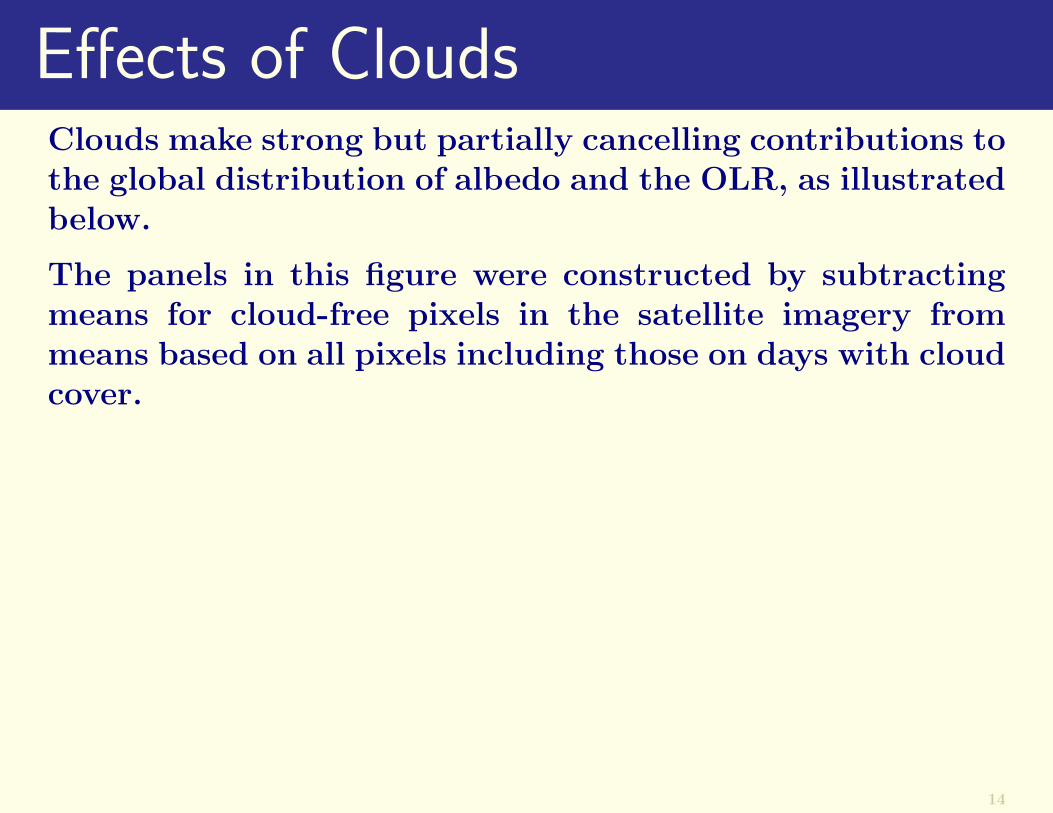
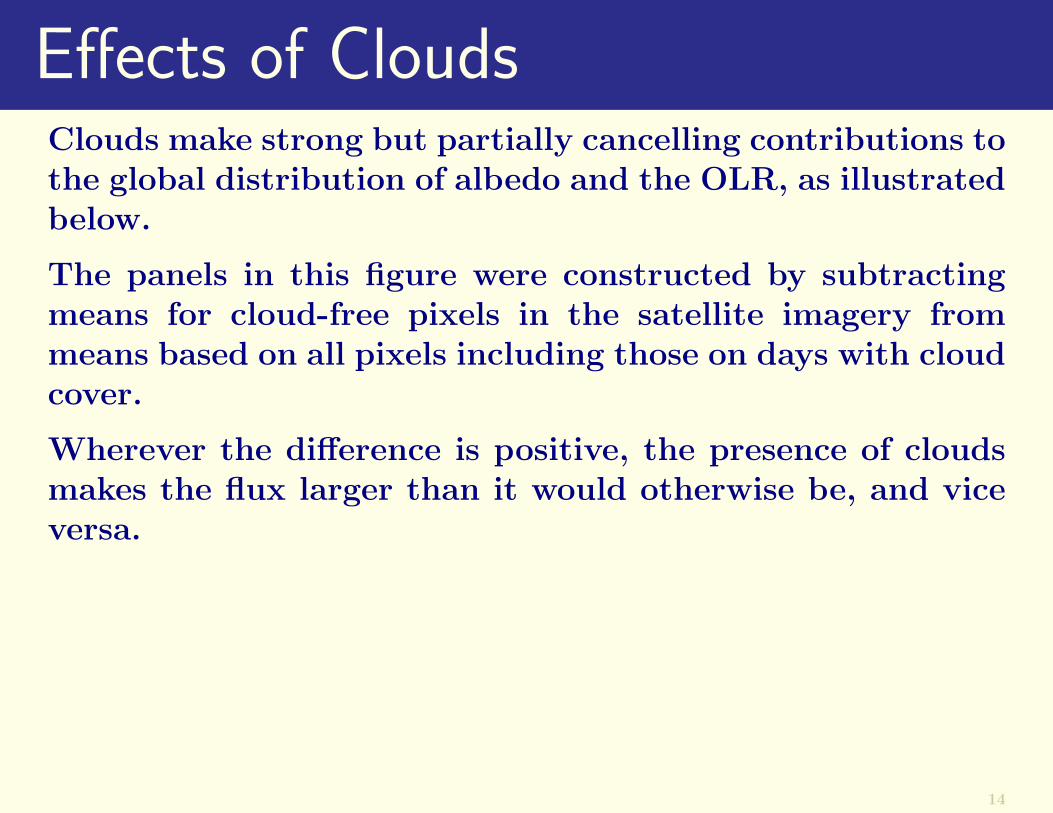
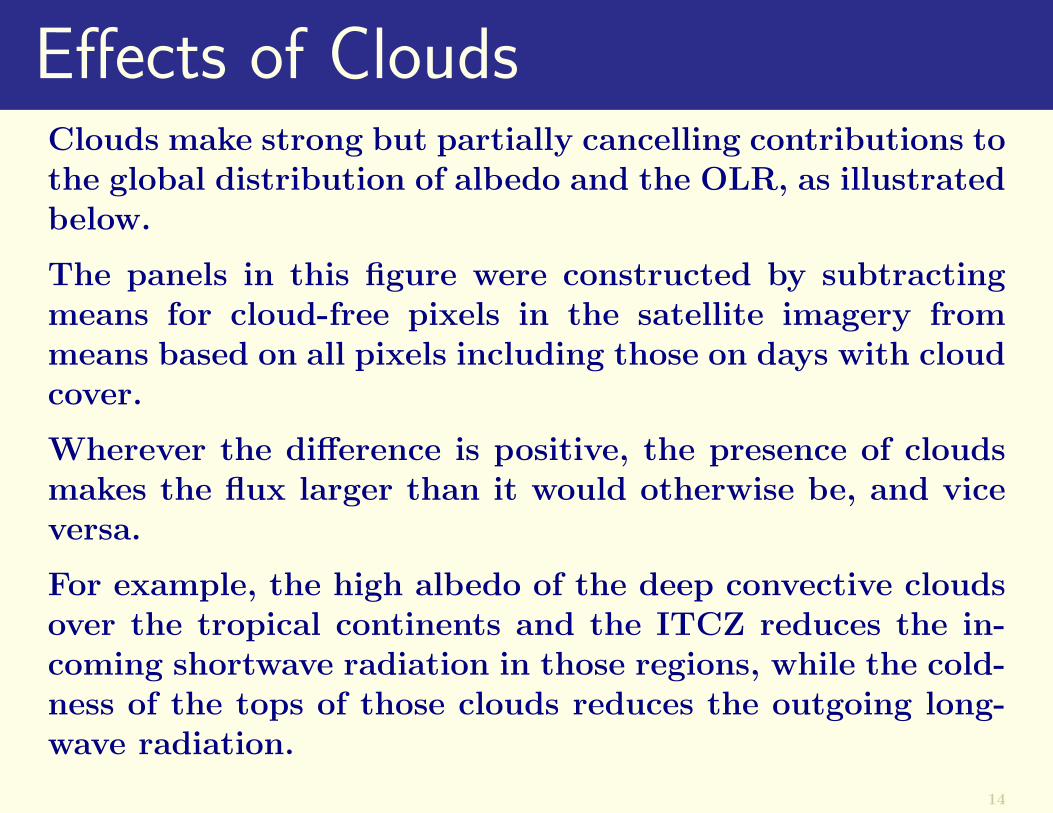
Effects of CloudsClouds make strong but partially cancelling contributions tothe global distribution of albedo and the OLR, as illustratedbelow.
14
Effects of CloudsClouds make strong but partially cancelling contributions tothe global distribution of albedo and the OLR, as illustratedbelow.
The panels in this figure were constructed by subtractingmeans for cloud-free pixels in the satellite imagery frommeans based on all pixels including those on days with cloudcover.
Wherever the difference is positive, the presence of cloudsmakes the flux larger than it would otherwise be, and viceversa.
For example, the high albedo of the deep convective cloudsover the tropical continents and the ITCZ reduces the in-coming shortwave radiation in those regions, while the cold-ness of the tops of those clouds reduces the outgoing long-wave radiation.
14
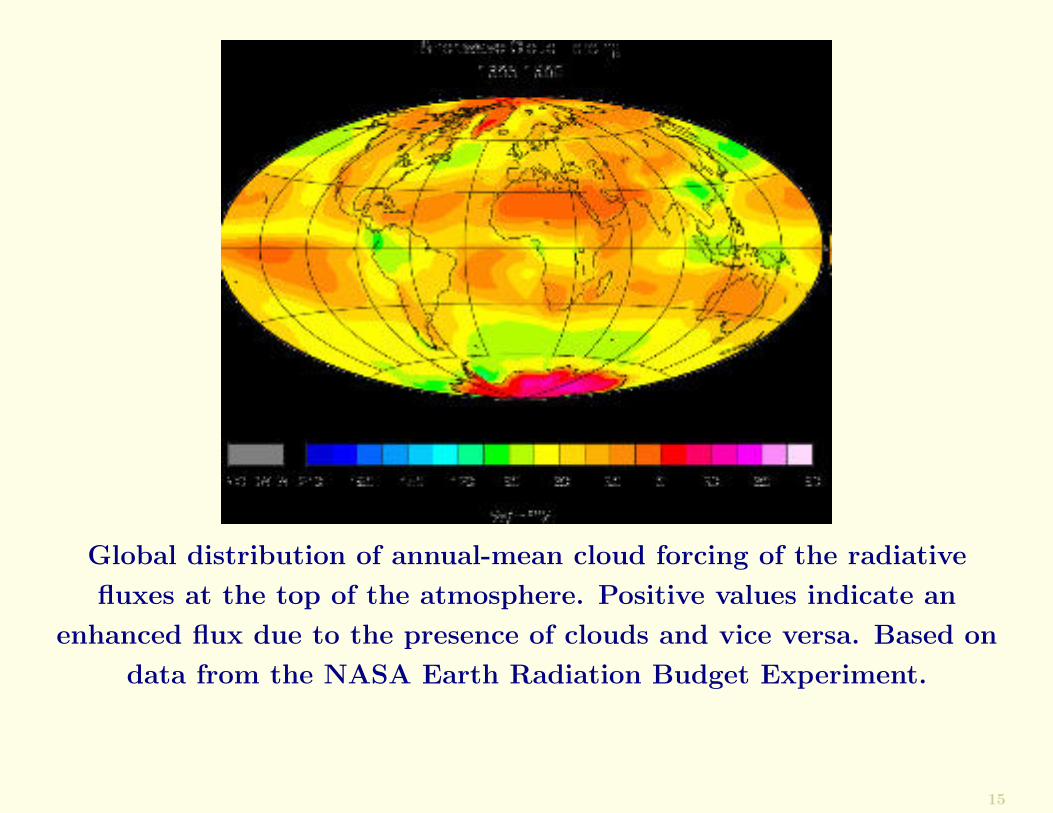
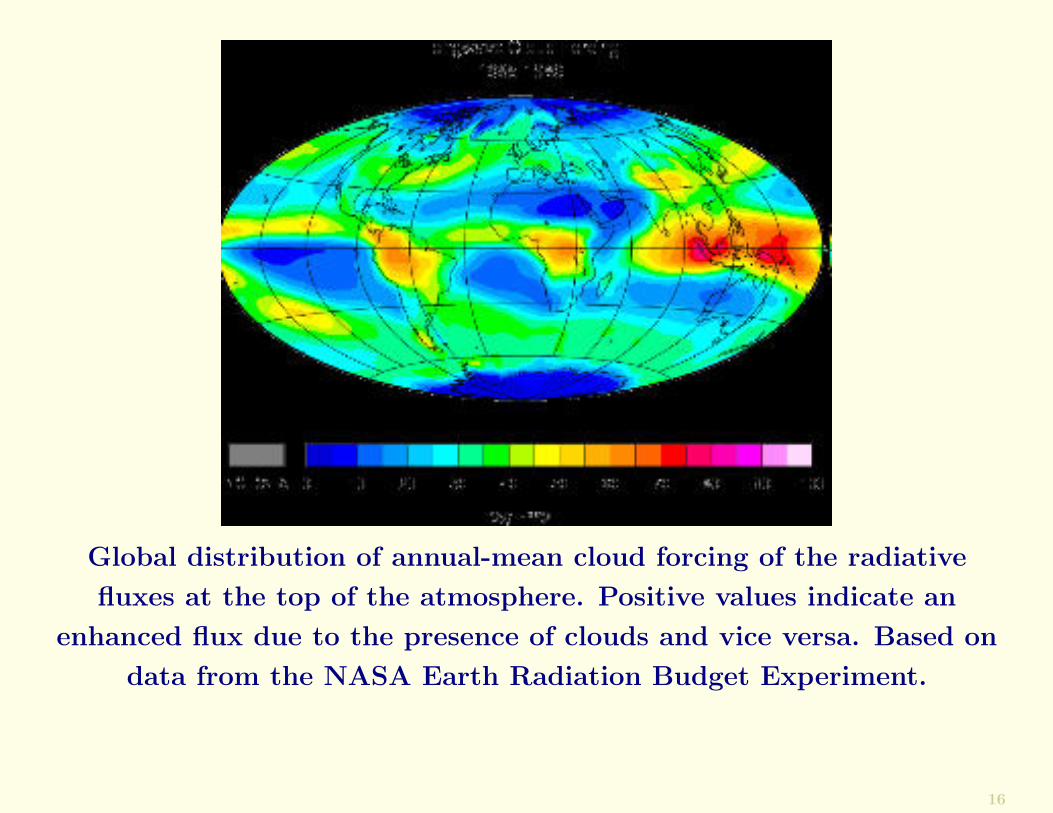
Global distribution of annual-mean cloud forcing of the radiative
fluxes at the top of the atmosphere. Positive values indicate an
enhanced flux due to the presence of clouds and vice versa. Based on
data from the NASA Earth Radiation Budget Experiment.
15
Global distribution of annual-mean cloud forcing of the radiative
fluxes at the top of the atmosphere. Positive values indicate an
enhanced flux due to the presence of clouds and vice versa. Based on
data from the NASA Earth Radiation Budget Experiment.
16
Cloud ForcingThe net cloud forcing by these clouds is relatively small.
17
Cloud ForcingThe net cloud forcing by these clouds is relatively small.
This reflects the high degree of cancellation between thesecompensating effects.
17

Cloud ForcingThe net cloud forcing by these clouds is relatively small.
This reflects the high degree of cancellation between thesecompensating effects.
Over most of the oceans the cloud forcing is negative.
17
Cloud ForcingThe net cloud forcing by these clouds is relatively small.
This reflects the high degree of cancellation between thesecompensating effects.
Over most of the oceans the cloud forcing is negative.
The largest negative values correspond to regions of persis-tent low cloud decks that are of sufficient optical thickness toreflect much of the incoming solar radiation back to space,but whose tops are low, and warm enough so that they emitalmost as much longwave radiation as the underlying oceansurface.
17
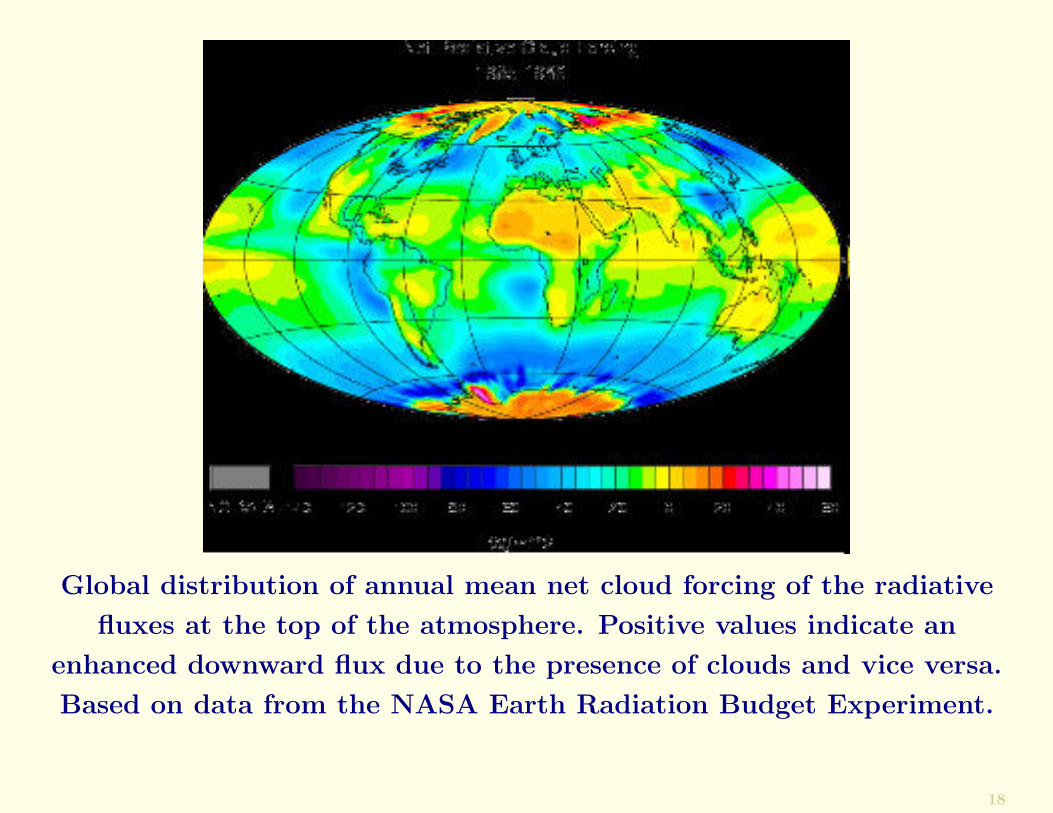
Global distribution of annual mean net cloud forcing of the radiative
fluxes at the top of the atmosphere. Positive values indicate an
enhanced downward flux due to the presence of clouds and vice versa.
Based on data from the NASA Earth Radiation Budget Experiment.
18

Conclusion
19

ConclusionWe have focused exclusively on radiative fluxes in this sec-tion.
19

ConclusionWe have focused exclusively on radiative fluxes in this sec-tion.
This is justified by the fact that radiative transfer is the onlyprocess capable of exchanging energy between the earth andthe rest of the universe.
19

ConclusionWe have focused exclusively on radiative fluxes in this sec-tion.
This is justified by the fact that radiative transfer is the onlyprocess capable of exchanging energy between the earth andthe rest of the universe.
The energy balance at the earth’s surface is more compli-cated because conduction of latent and sensible heat acrossthe earth’s surface also play important roles.
19
ConclusionWe have focused exclusively on radiative fluxes in this sec-tion.
This is justified by the fact that radiative transfer is the onlyprocess capable of exchanging energy between the earth andthe rest of the universe.
The energy balance at the earth’s surface is more compli-cated because conduction of latent and sensible heat acrossthe earth’s surface also play important roles.
Likewise, the distribution of temperature within the atmo-sphere is determined not by radiation alone but by the inter-play between radiative transfer, turbulent convection, andlarge-scale motions.
19
End of §4.4
20


![world.toagroup.com...the natural world and is very effective in creating a country style. TOA Prairie TOA TOA TOA 851B TOA C] TOA 12 04 Make you feel like adventures in Africa. with](https://static.fdocuments.in/doc/165x107/5f0a99557e708231d42c6c3c/world-the-natural-world-and-is-very-effective-in-creating-a-country-style.jpg)