Radial dispersion of red blood cells in blood flowing through glass capillaries: The role of...
9
Journal of Biomechanics 41 (2008) 2188–2196 Radial dispersion of red blood cells in blood flowing through glass capillaries: The role of hematocrit and geometry Rui Lima a,b, , Takuji Ishikawa a , Yohsuke Imai a , Motohiro Takeda a,c , Shigeo Wada d , Takami Yamaguchi e a Department of Bioengineering and Robotics, Graduate School of Engineering, Tohoku University, 6-6-01 Aoba, 980-8579 Sendai, Miagi, Japan b Department of Mechanical Technology, ESTiG, Braganc - a Polytechnic Institute, C. Sta. Apolonia, 5301-857 Braganc - a, Portugal c Division of Surgical Oncology, Graduate School of Medicine, Tohoku University, 2-1 Seiryo-machi, Aoba-ku, 980-8575 Sendai, Japan d Department of Mechanical Science and Bioengineering, Graduate School of Engineering Science, Osaka University, Toyonaka, 560-8531 Osaka, Japan e Department of Biomedical Engineering, Graduate School of Biomedical Engineering, Tohoku University, 6-6-01, Aoba, 980-8579 Sendai, Miagi, Japan Accepted 22 April 2008 Abstract The flow properties of blood in the microcirculation depend strongly on the hematocrit (Hct), microvessel geometry, and cell properties. Previous in vitro studies have measured the radial displacement of red blood cells (RBCs) at concentrated suspensions using conventional microscopes. However, to measure the RBCs motion they used transparent suspensions of ghost red cells, which may have different physical properties than normal RBCs. The present study introduces a new approach (confocal micro-PTV) to measure the motion of labeled RBCs flowing in concentrated suspensions of normal RBCs. The ability of confocal systems to obtain thin in-focus planes allowed us to measure the radial position of individual RBCs accurately and to consequently measure the interaction between multiple labeled RBCs. All the measurements were performed in the center plane of both 50 and 100 mm glass capillaries at Reynolds numbers (Re) from 0.003 to 0.005 using Hcts from 2% to 35%. To quantify the motion and interaction of multiple RBCs, we used the RBC radial dispersion (D yy ). Our results clearly demonstrate that D yy strongly depends on the Hct. The RBCs exhibited higher D yy at radial positions between 0.4 and 0.8 R and lower D yy at locations adjacent to the wall (0.8–1 R) and around the middle of the capillary (0–0.2 R). The present work also demonstrates that D yy tends to decrease with a decrease in the diameter. The information provided by this study not only complements previous investigations on microhemorheology of both dilute and concentrated suspensions of RBCs, but also shows the influence of both Hct and geometry on the radial dispersion of RBCs. This information is important for a better understanding of blood mass transport mechanisms under both physiological and pathological conditions. r 2008 Elsevier Ltd. All rights reserved. Keywords: Blood flow; Microcirculation; Red blood cells; Confocal micro-PTV; Radial dispersion 1. Introduction The primary function of red blood cells (RBCs) is to transport oxygen and carbon dioxide bound to intracellu- lar hemoglobin. In the microcirculation, the flow behavior of RBCs plays a crucial role in many physiological and pathological phenomena. For example, the random-like transverse motion and rotation of RBCs in shear flow is believed to play an important role in thrombogenesis. However, the role of RBCs in the mass transport mechanism of cells and proteins to the thrombus is still not completely understood (Goldsmith and Turitto, 1986; Wootton and Ku, 1999; Miyazaki and Yamaguchi, 2003). As a consequence, many studies have been performed on both the rheological and microrheological behavior of RBCs flowing through glass capillaries (Chien et al., 1984; Goldsmith and Turitto, 1986; Shiga et al., 1990; Pries et al., 1992; Mchedlishvili and Maeda, 2001). ARTICLE IN PRESS www.elsevier.com/locate/jbiomech www.JBiomech.com 0021-9290/$ - see front matter r 2008 Elsevier Ltd. All rights reserved. doi:10.1016/j.jbiomech.2008.04.033 Corresponding author at: Yamaguchi and Ishikawa Laboratory (PFSL), Department of Bioengineering and Robotics, Graduate School of Engineering, Tohoku University, 6-6-01 Aoba, 980-8579 Sendai, Miagi, Japan. Tel.: +81 22 7956958; fax: +81 22 7956959. E-mail addresses: [email protected], [email protected] (R. Lima).
Transcript of Radial dispersion of red blood cells in blood flowing through glass capillaries: The role of...

ARTICLE IN PRESS
0021-9290/$ - se
doi:10.1016/j.jb
�Correspond(PFSL), Depar
of Engineering,
Japan. Tel.: +8
E-mail addr
(R. Lima).
Journal of Biomechanics 41 (2008) 2188–2196
www.elsevier.com/locate/jbiomech
www.JBiomech.com
Radial dispersion of red blood cells in blood flowing through glasscapillaries: The role of hematocrit and geometry
Rui Limaa,b,�, Takuji Ishikawaa, Yohsuke Imaia, Motohiro Takedaa,c,Shigeo Wadad, Takami Yamaguchie
aDepartment of Bioengineering and Robotics, Graduate School of Engineering, Tohoku University, 6-6-01 Aoba, 980-8579 Sendai, Miagi, JapanbDepartment of Mechanical Technology, ESTiG, Braganc-a Polytechnic Institute, C. Sta. Apolonia, 5301-857 Braganc-a, Portugal
cDivision of Surgical Oncology, Graduate School of Medicine, Tohoku University, 2-1 Seiryo-machi, Aoba-ku, 980-8575 Sendai, JapandDepartment of Mechanical Science and Bioengineering, Graduate School of Engineering Science, Osaka University, Toyonaka, 560-8531 Osaka, JapaneDepartment of Biomedical Engineering, Graduate School of Biomedical Engineering, Tohoku University, 6-6-01, Aoba, 980-8579 Sendai, Miagi, Japan
Accepted 22 April 2008
Abstract
The flow properties of blood in the microcirculation depend strongly on the hematocrit (Hct), microvessel geometry, and cell
properties. Previous in vitro studies have measured the radial displacement of red blood cells (RBCs) at concentrated suspensions using
conventional microscopes. However, to measure the RBCs motion they used transparent suspensions of ghost red cells, which may have
different physical properties than normal RBCs. The present study introduces a new approach (confocal micro-PTV) to measure the
motion of labeled RBCs flowing in concentrated suspensions of normal RBCs. The ability of confocal systems to obtain thin in-focus
planes allowed us to measure the radial position of individual RBCs accurately and to consequently measure the interaction between
multiple labeled RBCs. All the measurements were performed in the center plane of both 50 and 100 mm glass capillaries at Reynolds
numbers (Re) from 0.003 to 0.005 using Hcts from 2% to 35%. To quantify the motion and interaction of multiple RBCs, we used the
RBC radial dispersion (Dyy). Our results clearly demonstrate that Dyy strongly depends on the Hct. The RBCs exhibited higher Dyy at
radial positions between 0.4 and 0.8R and lower Dyy at locations adjacent to the wall (0.8–1R) and around the middle of the capillary
(0–0.2R). The present work also demonstrates that Dyy tends to decrease with a decrease in the diameter. The information provided by
this study not only complements previous investigations on microhemorheology of both dilute and concentrated suspensions of RBCs,
but also shows the influence of both Hct and geometry on the radial dispersion of RBCs. This information is important for a better
understanding of blood mass transport mechanisms under both physiological and pathological conditions.
r 2008 Elsevier Ltd. All rights reserved.
Keywords: Blood flow; Microcirculation; Red blood cells; Confocal micro-PTV; Radial dispersion
1. Introduction
The primary function of red blood cells (RBCs) is totransport oxygen and carbon dioxide bound to intracellu-lar hemoglobin. In the microcirculation, the flow behaviorof RBCs plays a crucial role in many physiological and
e front matter r 2008 Elsevier Ltd. All rights reserved.
iomech.2008.04.033
ing author at: Yamaguchi and Ishikawa Laboratory
tment of Bioengineering and Robotics, Graduate School
Tohoku University, 6-6-01 Aoba, 980-8579 Sendai, Miagi,
1 22 7956958; fax: +81 22 7956959.
esses: [email protected], [email protected]
pathological phenomena. For example, the random-liketransverse motion and rotation of RBCs in shear flow isbelieved to play an important role in thrombogenesis.However, the role of RBCs in the mass transportmechanism of cells and proteins to the thrombus is stillnot completely understood (Goldsmith and Turitto, 1986;Wootton and Ku, 1999; Miyazaki and Yamaguchi, 2003).As a consequence, many studies have been performed onboth the rheological and microrheological behavior ofRBCs flowing through glass capillaries (Chien et al., 1984;Goldsmith and Turitto, 1986; Shiga et al., 1990; Pries et al.,1992; Mchedlishvili and Maeda, 2001).

ARTICLE IN PRESSR. Lima et al. / Journal of Biomechanics 41 (2008) 2188–2196 2189
Most studies on the microhemorheological behavior ofRBCs in shear flow were performed in dilute suspensions.Using video microscopy, the motions of individual RBCshave been analyzed in detail in several studies, leading toextensive knowledge on this topic (Goldsmith, 1971a, b;Fischer et al., 1978; Bitbol, 1986; Shiga et al., 1990; Suzukiet al., 1996; Lominadze and Mchedlishvili, 1999; Pries andSecomb, 2003; Abkarian et al., 2006). However, one of thebiggest scientific challenges in this field is related to thebehavior of RBCs flowing in relatively high concentrationsclose to the hematocrits (Hcts) that exist in microvessels(Hct 10–26%) (Fung, 1997). Despite the relevance of thisphenomenon on blood mass transport, few studies havebeen performed, partly due to the lack of visualizationtechniques capable of obtaining both direct and quantita-tive measurements on multi-RBC motions in concentratedsuspensions. An extremely important body of work in thisfield was carried out by Goldsmith and his coworkers(Goldsmith, 1971a, b; Goldsmith and Karino, 1977; Gold-smith and Marlow, 1979; Goldsmith and Turitto, 1986;Cokelet and Goldsmith, 1990). By using a travelingmicroscope, they were able to study the behavior of RBCsin concentrated suspensions. However, to achieve anadequate signal-to-noise ratio to permit the detection oftracer RBCs at Hct levels larger than 10%, they used ghostcells as models of erythrocytes. The preparation of ghostcells requires the rupture of the RBC membrane to allowthe diffusion of hemoglobin (Hb) into the surroundingfluid (hemolysis) (Burton, 1966; Caro et al., 1978). Thepreparation procedure of the ghost cells and also theremoval of the Hb may contribute to differences inthe membrane mechanical properties between ghost RBCs,and normal RBCs, and consequently, the dynamicbehavior of RBCs might be affected (Caro et al., 1978;Goldsmith and Marlow, 1979; Nash and Meiselman,1983). The controversy as to whether ghost cell suspensionsare good physical models for blood remains mainlybecause experimental evidence has not been obtainedregarding this question. Thus, it is important to re-examinethe work of Goldsmith and his colleagues by using aphysiological fluid containing normal RBCs. In this way,the present study introduces a new approach to measurethe radial dispersion of labeled RBCs flowing in concen-trated suspensions of normal RBCs.
The main limitation with measuring high concentrationsof normal RBCs has traditionally been due to theattenuation of incident light by hemoglobin absorptionand RBC light scattering. However, by combining aspinning disk confocal microscope (SDCM) with a laser,the emitted light intensity improves significantly, and, as aresult, it is possible to obtain an adequate signal-to-noiseratio to detect the motion of RBCs in concentratedsuspensions (Tanaani et al., 2002; Park et al., 2004; Limaet al., 2006, 2007, 2008b; Kinoshita et al., 2007). Moreover,in contrast to conventional microscopes, in which the entireflow region is illuminated, confocal systems have the abilityto obtain in-focus images with an optical thickness of less
than 1 mm (optical sectioning effect). As a result, confocalsystems provide superior spatial resolution that allowsdirect measurements of the motion of RBCs in concen-trated suspensions at several optically sectioned planesalong the microchannel depth. In our recent work, we useda confocal system combined with a cross-correlationtechnique (confocal micro-PIV) to obtain the velocityprofiles of in vitro blood flowing through a 100 mm squaremicrochannel. However, we were only able to obtainaccurate measurements with Hcts up to 17% with thiscombination, mainly due to the low density of tracerparticles available on the captured images. In the presentstudy, however, we integrated our confocal system with asingle particle method (SPT) to measure the motion ofindividual RBCs at Hcts up to 35%.In this report, we introduce a new approach (confocal
micro-PTV) to obtain direct and quantitative detaileddescriptions of the flow behavior of RBCs in concentratedsuspensions of normal RBCs. This approach eliminates theproblems and concerns of methods used in the past andprovides additional detailed descriptions of RBC motionnot obtainable by other methods. The ability of our systemto obtain thin in-focus planes along the microchannelallows us to obtain the radial position of the RBCsaccurately and to consequently measure the interactionbetween multiple labeled RBCs. The information providedby this study not only complements previous investigationson the microhemorheology of RBCs, but also shows theinfluence of both Hct and geometry on the radialdispersion of RBCs. This information is important fordeveloping a better understanding of blood mass transportmechanisms under both physiological and pathologicalconditions, because the fluid particles as well as chemicalsubstances in the plasma are mixed by the movement ofRBCs. The experiments were performed in 50 and 100 mmglass capillaries at Reynolds numbers (Re) from 0.003 to0.005 using Hcts from 2% to 35%. Although it is possibleto obtain measurements at several planes with our confocalsystem, particular emphasis was devoted to the radialdispersion of RBCs located in the middle plane.
2. Materials and methods
2.1. Working fluids, RBC labeling and experimental setup
The present study examined several working fluids with Hcts from 2%
to 35%. A confocal micro-PTV (Lima, 2007; Lima et al., 2008a) was used
to measure the motions of labeled RBCs in the center plane of both 50 and
100mm glass capillaries (see Fig. 1) at Re from 0.003 to 0.005. For a
detailed description, see Supplementary methods online.
2.2. RBC radial dispersion coefficient and displacement
In the present study, we sought to obtain further insights into the flow
behavior of RBCs in glass capillaries. Using a confocal PTV system, the
paths of hundreds of labeled RBCs were measured mainly in the center
plane of two different 100 and 50 mm capillaries. In addition, to elucidate
the effect of hematocrit on the motions of individual RBCs, several Hcts
(2–35%) were analyzed using Re values ranging from 0.003 to 0.005. Fig. 2

ARTICLE IN PRESS
Fig. 1. Recorded images in the middle plane of a 100mm glass capillary (left side) with 35% Hct, 24% Hct, 9% Hct, and 3% Hct; and in the middle plane
of a 50mm glass capillary (right side) with 32% Hct, 23% Hct, 8% Hct, and 2% Hct. The non-labeled RBCs are observed as dark gray rings, whereas the
labeled RBCs are observed as bright dots.
R. Lima et al. / Journal of Biomechanics 41 (2008) 2188–21962190
shows a typical halogen and confocal image recorded in the middle plane
of the 100mm glass capillary with 15% Hct.
Detailed measurements of the motion of individual RBCs at the
microscopic level are crucial to elucidate both mesoscopic and macro-
scopic blood flow properties. One accepted way to correlate the
microscopic events with the macroscopic flow behavior is by calcula-
ting the radial dispersion coefficient (Dyy) (Goldsmith, 1971a, b;
Goldsmith and Turitto, 1986). In the present study, we analyzed the
motions of RBCs using Dyy (Goldsmith and Turitto, 1986; Ishikawa and
Pedley, 2007) given by
DyyðtÞ ¼1
NSN
i¼1
hðRi;yðtÞ � Ri;yð0ÞÞ2i
2t, (1)
where Ri,y(t)–Ri,y(0) is the radial distance traveled by individual RBC i
over some time interval of length t and the radial squared displacement is
averaged (indicated by /S) over several such time intervals). The radial
dispersion coefficient is then averaged over all RBCs (N) measured by the
confocal system.
3. Results
3.1. Blood flow visualization
Examples of recorded images with both labeled andnon-labeled RBCs measured in the center plane ofthe 100 and 50 mm capillaries at several Hcts (2–35%)are presented online in Supplementary results. Forvideos of in vitro blood (3% and 20% Hct, Re �0.005)flowing around the center plane, see Supplementary Videos1 and 2.
ARTICLE IN PRESS
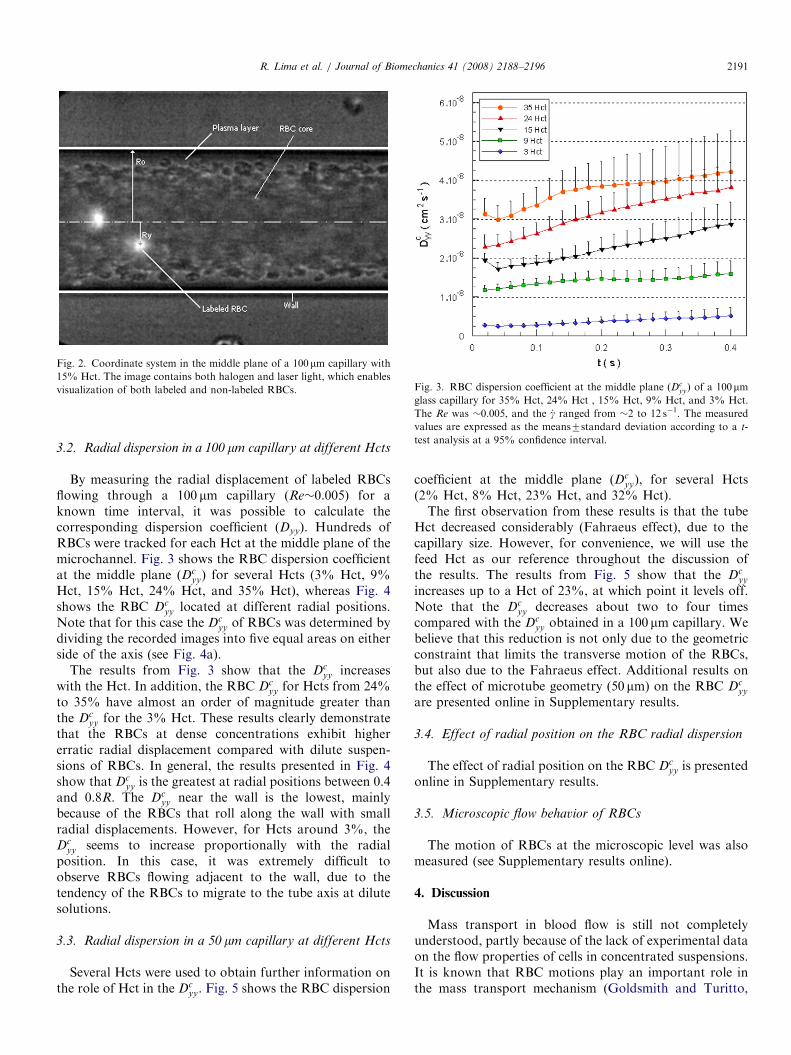
Fig. 2. Coordinate system in the middle plane of a 100mm capillary with
15% Hct. The image contains both halogen and laser light, which enables
visualization of both labeled and non-labeled RBCs. Fig. 3. RBC dispersion coefficient at the middle plane (Dcyy) of a 100mm
glass capillary for 35% Hct, 24% Hct , 15% Hct, 9% Hct, and 3% Hct.
The Re was �0.005, and the _g ranged from �2 to 12 s�1. The measured
values are expressed as the means7standard deviation according to a t-
test analysis at a 95% confidence interval.
R. Lima et al. / Journal of Biomechanics 41 (2008) 2188–2196 2191
3.2. Radial dispersion in a 100 mm capillary at different Hcts
By measuring the radial displacement of labeled RBCsflowing through a 100 mm capillary (Re�0.005) for aknown time interval, it was possible to calculate thecorresponding dispersion coefficient (Dyy). Hundreds ofRBCs were tracked for each Hct at the middle plane of themicrochannel. Fig. 3 shows the RBC dispersion coefficientat the middle plane (Dc
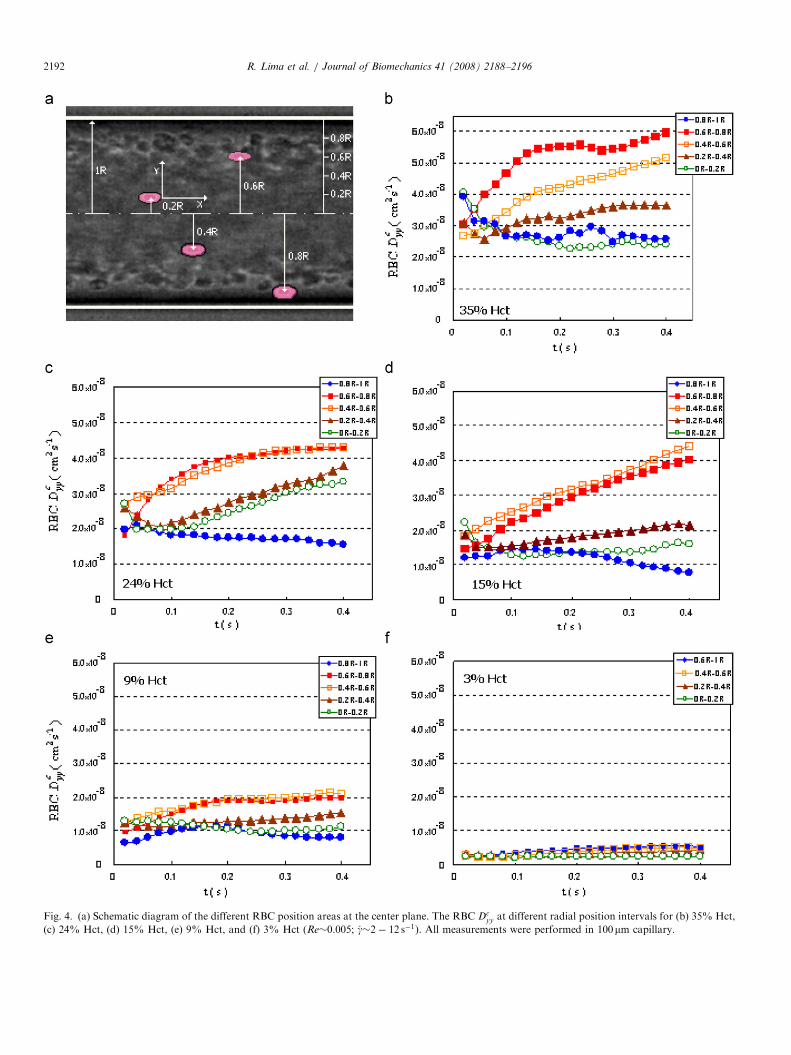
yy) for several Hcts (3% Hct, 9%Hct, 15% Hct, 24% Hct, and 35% Hct), whereas Fig. 4shows the RBC Dc
yy located at different radial positions.Note that for this case the Dc
yy of RBCs was determined bydividing the recorded images into five equal areas on eitherside of the axis (see Fig. 4a).
The results from Fig. 3 show that the Dcyy increases
with the Hct. In addition, the RBC Dcyy for Hcts from 24%
to 35% have almost an order of magnitude greater thanthe Dc
yy for the 3% Hct. These results clearly demonstratethat the RBCs at dense concentrations exhibit highererratic radial displacement compared with dilute suspen-sions of RBCs. In general, the results presented in Fig. 4show that Dc
yy is the greatest at radial positions between 0.4and 0.8R. The Dc
yy near the wall is the lowest, mainlybecause of the RBCs that roll along the wall with smallradial displacements. However, for Hcts around 3%, theDc
yy seems to increase proportionally with the radialposition. In this case, it was extremely difficult toobserve RBCs flowing adjacent to the wall, due to thetendency of the RBCs to migrate to the tube axis at dilutesolutions.
3.3. Radial dispersion in a 50 mm capillary at different Hcts
Several Hcts were used to obtain further information onthe role of Hct in the Dc
yy. Fig. 5 shows the RBC dispersion
coefficient at the middle plane (Dcyy), for several Hcts
(2% Hct, 8% Hct, 23% Hct, and 32% Hct).The first observation from these results is that the tube
Hct decreased considerably (Fahraeus effect), due to thecapillary size. However, for convenience, we will use thefeed Hct as our reference throughout the discussion ofthe results. The results from Fig. 5 show that the Dc
yy
increases up to a Hct of 23%, at which point it levels off.Note that the Dc
yy decreases about two to four timescompared with the Dc
yy obtained in a 100 mm capillary. Webelieve that this reduction is not only due to the geometricconstraint that limits the transverse motion of the RBCs,but also due to the Fahraeus effect. Additional results onthe effect of microtube geometry (50 mm) on the RBC Dc
yy
are presented online in Supplementary results.
3.4. Effect of radial position on the RBC radial dispersion
The effect of radial position on the RBC Dcyy is presented
online in Supplementary results.
3.5. Microscopic flow behavior of RBCs
The motion of RBCs at the microscopic level was alsomeasured (see Supplementary results online).
4. Discussion
Mass transport in blood flow is still not completelyunderstood, partly because of the lack of experimental dataon the flow properties of cells in concentrated suspensions.It is known that RBC motions play an important role inthe mass transport mechanism (Goldsmith and Turitto,
ARTICLE IN PRESS
Fig. 4. (a) Schematic diagram of the different RBC position areas at the center plane. The RBC Dcyy at different radial position intervals for (b) 35% Hct,
(c) 24% Hct, (d) 15% Hct, (e) 9% Hct, and (f) 3% Hct (Re�0.005; _g�2� 12 s�1). All measurements were performed in 100mm capillary.
R. Lima et al. / Journal of Biomechanics 41 (2008) 2188–21962192

ARTICLE IN PRESS
Fig. 5. RBC Dyy at the middle plane (Dcyy) of a 50 mm glass capillary for
32% Hct, 23% Hct, 8% Hct, and 2% Hct. The Re was �0.003, and the _granged from �3 to 25 s�1. The measured values are expressed as the
means7standard deviation according to a t-test analysis at a 95%
confidence interval.
Fig. 6. The effect of Hct and microtube geometry on the RBC Dcyy in 100
and 50 mm glass capillaries.
R. Lima et al. / Journal of Biomechanics 41 (2008) 2188–2196 2193
1986; Munn et al., 1996; Wootton and Ku, 1999; Miyazakiand Yamaguchi, 2003) and can be quantified by the radialdispersion coefficient (Dc
yy). In the present study, weexamined the effect of Hct and microtube geometry onthe Dc
yy of RBCs using a confocal micro-PTV system.
4.1. Effect of Hct on the RBC radial dispersion
A previous study performed by Goldsmith and Marlow(1979) measured the effect of volume concentrations(10–93%) on the radial displacements of tracer RBCs inghost cell suspensions. The present work extended theirinvestigations by using labeled RBCs in normal cellsuspensions and added the effect of Hcts on the RBCradial dispersion coefficient at the center plane (Dc
yy). Fig. 6illustrates the Hct effect on Dc
yy for both 100 and 50 mmglass capillaries. Note that the Dc
yy values presented inFig. 6 were averaged with respect to the last three valuesobtained in Figs. 3 and 5. This procedure is frequently usedto determine the diffusion coefficient. However, in ourstudy, the diffusion coefficient was not always completelyconstant at t=0.4 s, so we decided to call it the radialdispersion coefficient in accordance with the previousstudies (Goldsmith, 1971a, b; Goldsmith and Marlow,1979; Goldsmith and Turitto, 1986).
It is qualitatively evident that the RBC radial dispersionrises with the Hct, but that it tends to level off atHcts around 25%. These results suggest that the plasmalayer plays an important role in the increase of RBCtransverse motion. Direct qualitative measurements at Hctshigher than 30% have shown almost no plasma layer.Moreover, previous results preformed by Goldsmith(1971a, b), Goldsmith and Marlow (1979) and Goldsmith
and Turitto (1986) have shown that the radial displace-ments tend to decrease at Hcts greater than 50%,because extremely high concentrations of ghost cells limitthe amplitude of the RBC’s radial movements. Inaccordance with these consistent results, the developmentof a plasma layer at Hcts lower than 30% and thedecrease in the local cell density surrounding the RBCsmay be the main causes of the enhanced radial dispersionof the cells.
4.2. Effect of microtube geometry on the RBC
radial dispersion
Since identifying the Fahraeus–Lindqvist effect(Fahraeus and Lindqvist, 1931), many studies haveattempted to clarify the main causes for the decrease inthe apparent viscosity as the diameter of the microtubedecreases (Chien, 1970; Gaehtgens, 1980; Chien et al.,1984; Goldsmith and Turitto, 1986; Reinke et al., 1987;Pries et al., 1992). The present work provides quantitativedata on the effect of the microtube diameter on the RBCDc
yy. The results from Fig. 6 clearly demonstrate that RBCDc
yy tends to decrease with the diameter. The reasons forthis phenomenon may be the Hct reduction with thediameter (Fahraeus effect) and also the geometric con-straint. However, according to Pries et al. (1992), the latterreason is more likely to be mainly responsible for theattenuation of the RBC transverse motion. The presentdata seem to indicate that the reduction of RBC Dc
yy andhence the continuous multibody collisions may be linked tothe decrease in the apparent viscosity described in theprevious studies (Fahraeus and Lindqvist, 1931; Reinkeet al., 1987; Pries et al., 1992).The RBC Dc
yy is also influenced by the radial positionand corresponding shear rate. Generally, our results for
ARTICLE IN PRESS
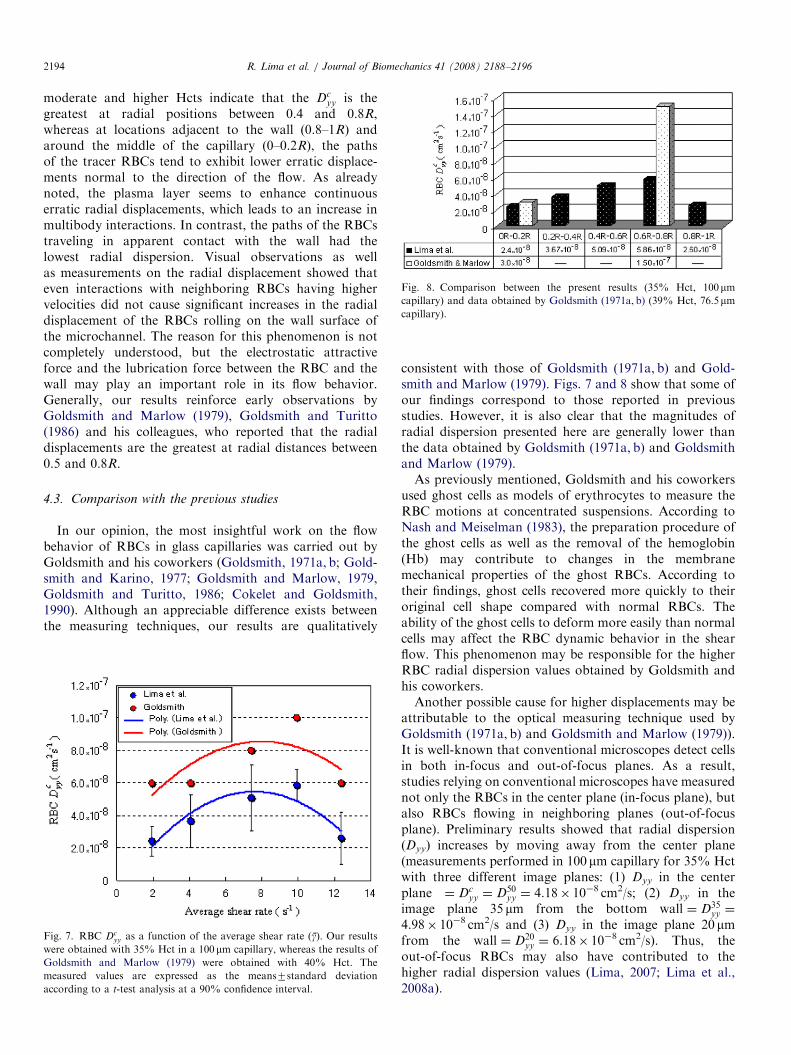
Fig. 8. Comparison between the present results (35% Hct, 100mmcapillary) and data obtained by Goldsmith (1971a, b) (39% Hct, 76.5mmcapillary).
R. Lima et al. / Journal of Biomechanics 41 (2008) 2188–21962194
moderate and higher Hcts indicate that the Dcyy is the
greatest at radial positions between 0.4 and 0.8R,whereas at locations adjacent to the wall (0.8–1R) andaround the middle of the capillary (0–0.2R), the pathsof the tracer RBCs tend to exhibit lower erratic displace-ments normal to the direction of the flow. As alreadynoted, the plasma layer seems to enhance continuouserratic radial displacements, which leads to an increase inmultibody interactions. In contrast, the paths of the RBCstraveling in apparent contact with the wall had thelowest radial dispersion. Visual observations as wellas measurements on the radial displacement showed thateven interactions with neighboring RBCs having highervelocities did not cause significant increases in the radialdisplacement of the RBCs rolling on the wall surface ofthe microchannel. The reason for this phenomenon is notcompletely understood, but the electrostatic attractiveforce and the lubrication force between the RBC and thewall may play an important role in its flow behavior.Generally, our results reinforce early observations byGoldsmith and Marlow (1979), Goldsmith and Turitto(1986) and his colleagues, who reported that the radialdisplacements are the greatest at radial distances between0.5 and 0.8R.
4.3. Comparison with the previous studies
In our opinion, the most insightful work on the flowbehavior of RBCs in glass capillaries was carried out byGoldsmith and his coworkers (Goldsmith, 1971a, b; Gold-smith and Karino, 1977; Goldsmith and Marlow, 1979,Goldsmith and Turitto, 1986; Cokelet and Goldsmith,1990). Although an appreciable difference exists betweenthe measuring techniques, our results are qualitatively
Fig. 7. RBC Dcyy as a function of the average shear rate (g). Our results
were obtained with 35% Hct in a 100mm capillary, whereas the results of
Goldsmith and Marlow (1979) were obtained with 40% Hct. The
measured values are expressed as the means7standard deviation
according to a t-test analysis at a 90% confidence interval.
consistent with those of Goldsmith (1971a, b) and Gold-smith and Marlow (1979). Figs. 7 and 8 show that some ofour findings correspond to those reported in previousstudies. However, it is also clear that the magnitudes ofradial dispersion presented here are generally lower thanthe data obtained by Goldsmith (1971a, b) and Goldsmithand Marlow (1979).As previously mentioned, Goldsmith and his coworkers
used ghost cells as models of erythrocytes to measure theRBC motions at concentrated suspensions. According toNash and Meiselman (1983), the preparation procedure ofthe ghost cells as well as the removal of the hemoglobin(Hb) may contribute to changes in the membranemechanical properties of the ghost RBCs. According totheir findings, ghost cells recovered more quickly to theiroriginal cell shape compared with normal RBCs. Theability of the ghost cells to deform more easily than normalcells may affect the RBC dynamic behavior in the shearflow. This phenomenon may be responsible for the higherRBC radial dispersion values obtained by Goldsmith andhis coworkers.Another possible cause for higher displacements may be
attributable to the optical measuring technique used byGoldsmith (1971a, b) and Goldsmith and Marlow (1979)).It is well-known that conventional microscopes detect cellsin both in-focus and out-of-focus planes. As a result,studies relying on conventional microscopes have measurednot only the RBCs in the center plane (in-focus plane), butalso RBCs flowing in neighboring planes (out-of-focusplane). Preliminary results showed that radial dispersion(Dyy) increases by moving away from the center plane(measurements performed in 100 mm capillary for 35% Hctwith three different image planes: (1) Dyy in the centerplane ¼ Dc
yy ¼ D50yy ¼ 4.18� 10�8 cm2/s; (2) Dyy in the
image plane 35 mm from the bottom wall ¼ D35yy ¼
4.98� 10�8 cm2/s and (3) Dyy in the image plane 20 mmfrom the wall ¼ D20
yy ¼ 6.18� 10�8 cm2/s). Thus, theout-of-focus RBCs may also have contributed to thehigher radial dispersion values (Lima, 2007; Lima et al.,2008a).

ARTICLE IN PRESSR. Lima et al. / Journal of Biomechanics 41 (2008) 2188–2196 2195
4.4. Future directions
In our confocal system, we used a confocal scanning unit(CSU22, Yokogawa, Japan) with a temporal resolution ofup to 1000 frames/s (exposure time of 0.99ms). However,for in vitro blood with Hcts bigger than 9%, due to the lightabsorbed and scattered by RBCs, we need high exposuretime in order to obtain adequate quality images to beprocessed by the micro-PTV technique (Lima et al., 2006,2007). In the present study, we used a high exposure time(9.4ms), which corresponds to low temporal resolution(100 frames/s) and consequently to Re about one order ofmagnitude lower when compared with in vivo observations(Caro et al., 1978; Fung, 1997). We expect to analyze theeffect of the Re on RBC radial dispersion in the nearfuture.
Here, we compare our results with the former numericalstudies on diffusivity of particles in a suspension. Theshear-induced diffusion of rigid spheres in a concentratedsuspension has been investigated numerically by Drazer etal. (2002) and Foss and Brady (2000). These studiesdemonstrated that nonzero components of the diffusiontensor are strongly dependent on the volume fraction ofspheres. In the rather dilute regime, they showed that thediffusivity is almost proportional to the shear rate and theconcentration of spheres. These tendencies qualitativelyagree with our observation shown in Figs. 6 and 7.In Fig. 6, we showed that the Dyy increases about linearlywith Hct (volume fraction of RBCs) in the low Hct regime.Moreover, in Fig. 7, the Dyy increases with the radialposition, where shear rate also increases with the radialposition. (However, in the cell free layer, the Dyy decreasesdue to the low local Hct.) To our knowledge, the shear-induced diffusion of RBCs has not been clarified numeri-cally. Since Lac et al. (2007) showed that the shear-induceddisplacement of interacting spherical capsules is stronglydependent on the capillary number, the Dyy of RBCs mayalso be dependent on it. We need more theoretical andnumerical data for further comparison.
Fortunately, there has been substantial progressin modeling the rheological properties of blood(Chakraborty, 2005, 2007; Das and Chakraborty, 2006;Yamaguchi et al., 2006). In the future, therefore, ourexperimental results will be compared with the most recenttheoretical findings in this field. It is expected that bycombining both results with the help of sophisticatedcomputational methods a better understanding to theoverall properties of blood flow, from cellular motionto the resulting rheological properties of whole blood,will be provided.
5. Conclusions
Direct and quantitative detailed descriptions of the flowbehavior of labeled RBCs in both dilute and concentratedsuspensions were studied under a confocal micro-PTVsystem. The experiments were performed in the middle
plane of 50 and 100 mm glass capillaries at low Reynoldsnumbers (Re 0.003–0.005) using Hcts ranging from 2% to35%. Several microscale phenomena of the flow behaviorof RBCs, such as the RBC–RBC interaction and the RBCtendency for radial migration, were analyzed using theRBC radial dispersion coefficient (Dyy) approach. Hence,the present study examined the effect of hematocrit (Hct)and microtube geometry on the RBC’s Dyy. Our resultsdemonstrate that the Dyy tends to increase with the Hct,but tends to level off at Hcts of about 25%. These findings,which agree with the past results, suggest that thedevelopment of the plasma layer and consequentdecrease in the local cell density surrounding the RBCsmay enhance the radial dispersion of RBCs. Generally,our results for moderate and higher Hcts indicate that theDyy is the greatest at radial positions between 0.4 and0.8R, whereas the paths of the tracer RBCs tend toexhibit lower radial displacements at locations adjacent tothe wall (0.8–1R) and around the middle of the capillary(0–0.2R). Although evidence exists that the latter phenom-enon is mainly due to the low shear rate and high RBCconcentrations in the center of the microtube, the formerphenomenon is still not completely understood. Our resultssuggest that at regions near the wall the motions ofRBCs are dominated not only by hydrodynamic forcesbut also by other forces such as electrostatic attractiveforces and lubrication forces that develop at the wallboundary layer.Our findings also demonstrated that Dyy tends to
decrease with the diameter. This phenomenon is believedto be caused by Hct reduction with the diameter (Fahraeuseffect) and also due to the geometric constraints thatnaturally limit the amplitude of the RBC’s radial displace-ments. Hence, this finding seems to indicate that thereduction of RBC radial dispersion and the continuousmultibody collisions may be linked to the decrease inapparent viscosity with decreasing diameter (Fahraeus–Lindqvist effect).
Conflict of interest statement
The authors declare that they have no competingfinancial interests.
Acknowledgments
This study was supported in part by the followingGrants: International Doctoral Program in Engineeringfrom the Ministry of Education, Culture, Sports, Scienceand Technology of Japan (MEXT), ‘‘RevolutionarySimulation Software (RSS21)’’ next-generation IT pro-gram of MEXT; Grants-in-Aid for Scientific Researchfrom MEXT and JSPS Scientific Research in PriorityAreas (768) ‘‘Biomechanics at Micro- and NanoscaleLevels,’’ Scientific Research (A) No.16200031 ‘‘Mechanismof the formation, destruction, and movement of thrombiresponsible for ischemia of vital organs’’.

ARTICLE IN PRESSR. Lima et al. / Journal of Biomechanics 41 (2008) 2188–21962196
Appendix A. Supplementary materials
The online version of this article contains additionalsupplementary data. Please visit doi:10.1016/j.jbiomech.2008.04.033
References
Abkarian, M., Magalie Faivre, M., Stone, H., 2006. High-speed
microfluidic differential manometer for cellular-scale hydrodynamics.
Proccedings of the National Academy of Science 103, 538–542.
Bitbol, M., 1986. Red blood cell orientation in orbit C ¼ 0. Biophysical
Journal 49, 1055–1068.
Burton, A., 1966. Physiology and Biophysics of the Circulation. Year
Book Medical Publishers.
Caro, C., Pedley, T., Schroter, R., Seed, W., 1978. The Mechanics of the
Circulation. Oxford University Press, Oxford (London/Melbourne).
Chakraborty, S., 2005. Dynamics of capillary flow of blood into a
microfluidic channel. Lab on a Chip 5, 421–430.
Chakraborty, S., 2007. Electroosmotically driven capillary transport of
typical non-Newtonian bio-fluids in rectangular microchannels.
Analytica Chimica Acta 605, 175–184.
Chien, S., 1970. Shear dependence of effective cell volume as a
determinant of blood viscosity. Science 168, 977–979.
Chien, S., Usami, S., Skalak, R., 1984. Blood flow in small tubes.
In: Handbook of Physiology—The Cardiovascular System IV,
pp. 217–249.
Cokelet, G., Goldsmith, H., 1990. Decreased hydrodynamic resistance in
the two-phase flow of blood through small vertical tubes at low flow
rates. Circulation Research 68, 1–17.
Das, S., Chakraborty, S., 2006. Analytical solutions for velocity,
temperature and concentration distribution in electroosmotic micro-
channel flows of a non-Newtonian bio-fluid. Analytica Chimica Acta
559, 15–24.
Drazer, G., Koplik, J., Khusid, B., Acrivos, A., 2002. Deterministic and
stochastic behaviour of non-Brownian spheres in sheared suspension.
Journal of Fluid Mechanics 460, 307–335.
Fahraeus, R., Lindqvist, T., 1931. The viscosity of the blood in narrow
capillary tubes. American Journal of Physiology 96, 562–568.
Fischer, T., Stohr-Lissen, M., Schmid-Schonbein, H., 1978. The red cell as
a fluid droplet: tank tread-like motion of the human erythrocyte
membrane in shear flow. Science 202, 894–896.
Foss, D., Brady, J.F., 2000. Structure, diffusion and rheology of Brownian
suspensions by Stokesian dynamics simulation. Journal of Fluid
Mechanics 407, 167–200.
Fung, Y., 1997. Biomechanics–Circulation, second ed. Springer,
New York.
Gaehtgens, P., 1980. Flow of blood through narrow capillaries;
rheological mechanisms determining capillary hematocrit and appar-
ent viscosity. Biorheology 17, 183–189.
Goldsmith, H., 1971a. Deformation of human red cells in tube flow.
Biorheology 7, 235–242.
Goldsmith, H., 1971b. Red cell motions and wall interactions in tube flow.
Federation Proceedings 30, 1578–1588.
Goldsmith, H., Karino, T., 1977. Microscopic considerations: the motions
of individual particles. Annals of the New York Academy of Sciences
283, 241–255.
Goldsmith, H., Marlow, J., 1979. Flow behavior of erythrocytes. II.
Particles motions in concentrated suspensions of ghost cells. Journal of
Colloid and Interface Science 71, 383–407.
Goldsmith, H., Turitto, V., 1986. Rheological aspects of thrombosis
and haemostasis: basic principles and applications. ICTH-Report-
Subcommittee on Rheology of the International committee on
thrombosis and haemostasis. Thrombosis and Haemostasis 55,
415–435.
Ishikawa, T., Pedley, T., 2007. Diffusion of swimming model micro-
organisms in a semi-dilute suspensions. Journal of Fluid Mechanics
588, 437–462.
Kinoshita, H., Kaneda, S., Fujii, T., Oshima, M., 2007. Three-dimensional
measurement and visualization of internal flow of a moving droplet
using confocal micro-PIV. Lab on a Chip 7, 338–346.
Lac, E., Morel, A., Barthes-Biesel, D., 2007. Hydrodynamic interaction
between two identical capsules in simple shear flow. Journal of Fluid
Mechanics 573, 149–169.
Lima, R., 2007. Analysis of the blood flow behavior through micro-
channels by a confocal micro-PIV/PTV system. Ph.D. Thesis, Tohoku
University, Japan.
Lima, R., Wada, S., Tsubota, K., Yamaguchi, T., 2006. Confocal micro-
PIV measurements of three dimensional profiles of cell suspension flow
in a square microchannel. Measurement Science and Technology 17,
797–808.
Lima, R., Wada, S., Takeda, M., Tsubota, K., Yamaguchi, T., 2007. In
vitro confocal micro-PIV measurements of blood flow in a square
microchannel: the effect of the haematocrit on instantaneous velocity
profiles. Journal of Biomechanics 40, 2752–2757.
Lima, R., Ishikawa, T., Imai, Y., Takeda, M., Wada, S., Yamaguchi, T.,
2008a. Microhaemodynamic measurements in concentrated suspen-
sions of erythrocytes using a confocal micro-PTV system. Annals of
Biomedical Engineering, submitted for publication.
Lima, R., Wada, S., Tanaka, S., Takeda, M., Ishikawa, T., Tsubota, K.,
Imai, Y., Yamaguchi, T., 2008b. In vitro blood flow in a rectangular
PDMS microchannel: experimental observations using a confocal
micro-PIV system. Biomedical Microdevices 10, 153–167.
Lominadze, D., Mchedlishvili, G., 1999. Red blood cell behavior at low
flow rate in microvessels. Microvascular Research 58, 187–189.
Mchedlishvili, G., Maeda, N., 2001. Blood flow structure related to red
cell flow: a determination of blood fluidity in narrow microvessels.
Japanese Journal of Physiology 51, 19–30.
Miyazaki, H., Yamaguchi, T., 2003. Formation and destruction of
primary thrombi under the influence of blood flow and von willebrand
factor analysed by a D.E.M. Biorheology 40, 265–272.
Munn, L., Melder, R., Jain, R., 1996. Role of erythrocytes in
leukocyte–endothelial interactions: mathematical model and experi-
mental validation. Biophysical Journal 71, 466–478.
Nash, G., Meiselman, H., 1983. Red cell and ghost viscoelasticity. Effects
of hemoglobin concentration and in vivo aging. Biophysical Journal
43, 63–73.
Park, J., Choi, C., Kihm, K., 2004. Optically sliced micro-PIV using
confocal laser scanning microscopy (CLSM). Experiments in Fluids
37, 105–119.
Pries, A., Secomb, T., 2003. Rheology of the microcirculation. Clinical
Hemorheology and Microcirculation 29, 143–148.
Pries, A., Neuhaus, D., Gaehtgens, P., 1992. Blood viscosity in tube flow:
dependence on diameter and hematocrit. American Journal of
Physiology 263, H1770–H1778.
Reinke, W., Gaehtgens, W., Johnson, P., 1987. Blood viscosity in small
tubes: effect of shear rate, aggregation, and sedimentation. American
Journal of Physiology 253, H540–H547.
Shiga, T., Maeda, N., Kon, K., 1990. Erythrocyte rheology. Critical
Review in Oncology/Hematology 10, 9–48.
Suzuki, Y., Tateishi, N., Soutani, M., Maeda, N., 1996. Deformation of
erythrocytes in microvessels and glass capillaries: effects of erythrocyte
deformability. Microcirculation 3, 49–57.
Tanaani, T., Otsuki, S., Tomosada, N., Kosugi, Y., Shimizu, M., Ishida,
H., 2002. High-speed 1-frame/ms scanning confocal microscope with a
microlens and Nipkow disks. Applied Optics 41, 4704–4708.
Wootton, D., Ku, D., 1999. Fluid mechanics of vascular systems, diseases,
and thrombosis. Annual Review of Biomedical Engineering 1,
299–329.
Yamaguchi, T., Ishikawa, T., Tsubota, K., Imai, Y., Nakamura, M.,
Fukui, T., 2006. Computational blood flow analysis—new trends and
methods. Journal of Biomechanical Science and Engineering 1, 29–50.