Radaro Global Screener
12
For more information on MubasherTrade, please visit our website at www.MubasherTrade.com or contact us at [email protected] . Please read the important disclosure and disclaimer at the end of this document. Page 1 Radaro Technical Analysis | Global | Equities Monday, 1 30 May 2016 Ramy Rashad, CMT, ACSI Head of Advisory Mubasher Financial Services, LLC (UAE) [email protected] A - LEGD B - CEY C - ABC D - LAD E - BIDU F - CHKP G - BFb H - CCE Contents ويات المحتPage صفحةA. Stocks With A Strong Up-side Momentum أ. قويجابييز بزخم إي تتم أسهم2 B. Stocks With A Strong Downside Momentum ب. قويز بزخم سلبي تتمي أسهم3 C. Stocks Near Buying Pressure ج. لقرب من ضغوط شرائية أسهم با4 D. Stocks Near Selling Pressure د. من ضغوط بيعيةالقرب أسهم ب5 E. Stocks Surging With Heavy Relative Volume ه. ول مرتفعة نسبيام تدا تندفع مع أحجا أسهم6 F. Stocks Slipping With Heavy Relative Volume و. ول مرتفعة نسبيام تدا تنزلق مع أحجا أسهم7 G. Technical Signals Map ز. رات الفنيةشا خريطة ا8 H. Technical Trends Map ح. ت الفنيةتجاها خريطة ا9
-
Upload
ramy-rashad -
Category
Documents
-
view
43 -
download
2
Transcript of Radaro Global Screener
For more information on MubasherTrade, please visit our website at www.MubasherTrade.com or contact us at [email protected]. Please read the important disclosure and disclaimer at the end of this document.
Page 1
RadaroTechnical Analysis | Global | Equities
Monday, 1 30 May 2016
Ramy Rashad, CMT, ACSIHead of Advisory
Mubasher Financial Services, LLC (UAE)[email protected]
A - LEGD
B - CEY
C - ABC
D - LAD
E - BIDU
F - CHKP
G - BFb
H - CCE
Contentsالمحتويات
Pageصفحة
A. Stocks With A Strong Up-side Momentumأسهم تتميز بزخم إيجابي قوي. أ
2
B. Stocks With A Strong Downside Momentumأسهم تتميز بزخم سلبي قوي. ب
3
C. Stocks Near Buying Pressureأسهم بالقرب من ضغوط شرائية.ج
4
D. Stocks Near Selling Pressureأسهم بالقرب من ضغوط بيعية. د
5
E. Stocks Surging With Heavy Relative Volumeأسهم تندفع مع أحجام تداول مرتفعة نسبيا . ه
6
F. Stocks Slipping With Heavy Relative Volumeأسهم تنزلق مع أحجام تداول مرتفعة نسبيا . و
7
G. Technical Signals Mapخريطة اإلشارات الفنية. ز
8
H. Technical Trends Mapخريطة اإلتجاهات الفنية. ح
9
For more information on MubasherTrade, please visit our website at www.MubasherTrade.com or contact us at [email protected]. Please read the important disclosure and disclaimer at the end of this document.
Page 2
Radaro | Technical Analysis | Global | Equities
Monday, 1 30 May 2016
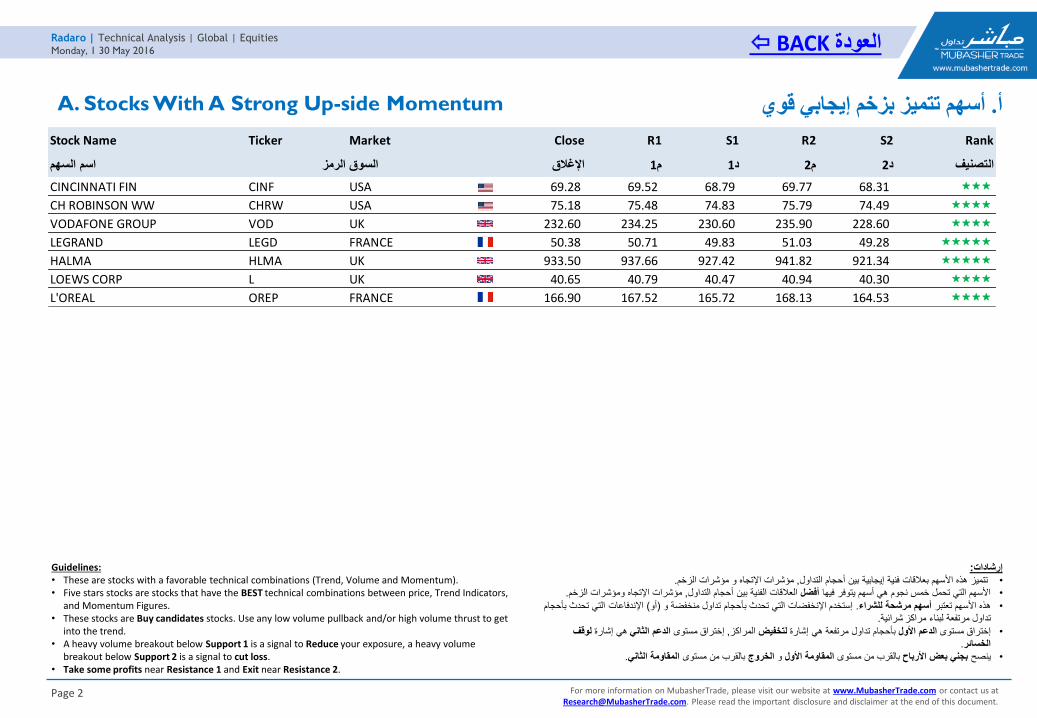
A. Stocks With A Strong Up-side Momentum أسهم تتميز بزخم إيجابي قوي. أ
Guidelines:• These are stocks with a favorable technical combinations (Trend, Volume and Momentum).• Five stars stocks are stocks that have the BEST technical combinations between price, Trend Indicators,
and Momentum Figures.• These stocks are Buy candidates stocks. Use any low volume pullback and/or high volume thrust to get
into the trend.• A heavy volume breakout below Support 1 is a signal to Reduce your exposure, a heavy volume
breakout below Support 2 is a signal to cut loss.• Take some profits near Resistance 1 and Exit near Resistance 2.
:إرشادات
.مؤشرات الزخممؤشرات اإلتجاه و , فنية إيجابية بين أحجام التداولبعالقات هذه األسهم تتميز •.الزخمومؤشراتمؤشرات اإلتجاه , العالقات الفنية بين أحجام التداولأفضلاألسهم التي تحمل خمس نجوم هي أسهم يتوفر فيها •
حدث بأحجام اإلندفاعات التي ت( أو)إستخدم اإلنخفضات التي تحدث بأحجام تداول منخفضة و . أسهم مرشحة للشراءهذه األسهم تعتبر •.شرائيةمراكزتداول مرتفعة لبناء
لوقفهي إشارة الدعم الثاني إختراق مستوى , المراكزلتخفيضبأحجام تداول مرتفعة هي إشارة الدعم األولإختراق مستوى •.الخسائر
.الثانيالمقاومة بالقرب من مستوى الخروجو المقاومة األولبالقرب من مستوىبجني بعض األرباحينصح•
BACK العودة
Stock Name Ticker Market Close R1 S1 R2 S2 Rank
اسم السهم الرمز السوق اإلغالق م1 د1 م2 د2 التصنيف
CINCINNATI FIN CINF USA 69.28 69.52 68.79 69.77 68.31
CH ROBINSON WW CHRW USA 75.18 75.48 74.83 75.79 74.49
VODAFONE GROUP VOD UK 232.60 234.25 230.60 235.90 228.60
LEGRAND LEGD FRANCE 50.38 50.71 49.83 51.03 49.28
HALMA HLMA UK 933.50 937.66 927.42 941.82 921.34
LOEWS CORP L UK 40.65 40.79 40.47 40.94 40.30
L'OREAL OREP FRANCE 166.90 167.52 165.72 168.13 164.53
For more information on MubasherTrade, please visit our website at www.MubasherTrade.com or contact us at [email protected]. Please read the important disclosure and disclaimer at the end of this document.
Page 3
Radaro | Technical Analysis | Global | Equities
Monday, 1 30 May 2016
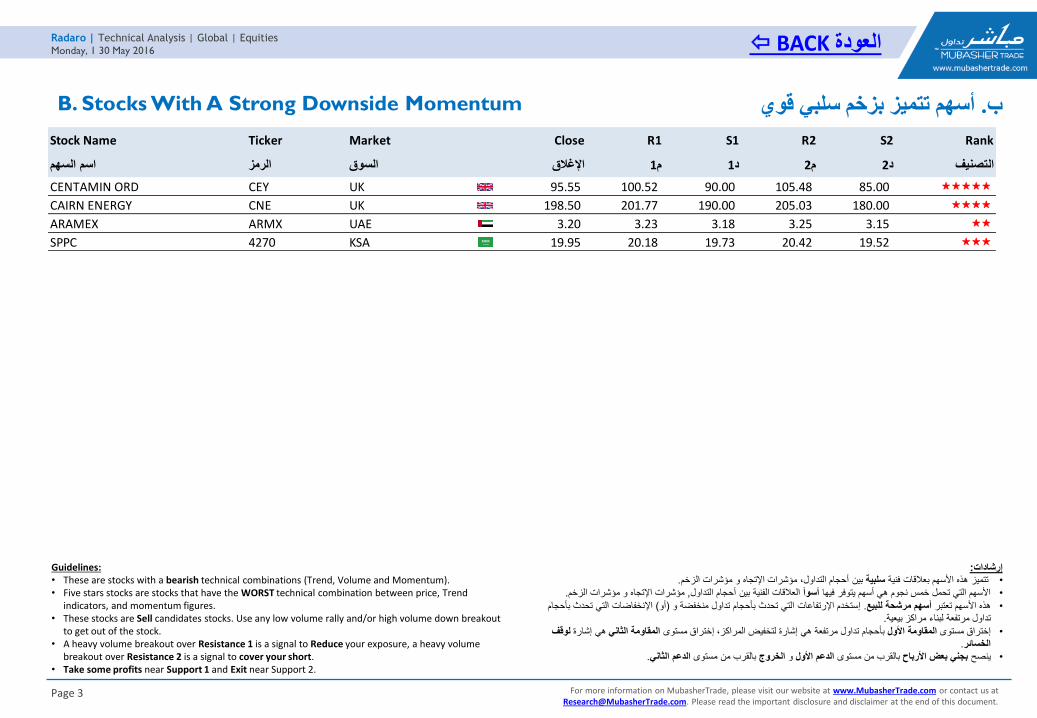
B. Stocks With A Strong Downside Momentum أسهم تتميز بزخم سلبي قوي. ب
Guidelines:• These are stocks with a bearish technical combinations (Trend, Volume and Momentum).• Five stars stocks are stocks that have the WORST technical combination between price, Trend
indicators, and momentum figures.• These stocks are Sell candidates stocks. Use any low volume rally and/or high volume down breakout
to get out of the stock.• A heavy volume breakout over Resistance 1 is a signal to Reduce your exposure, a heavy volume
breakout over Resistance 2 is a signal to cover your short.• Take some profits near Support 1 and Exit near Support 2.
:إرشادات.مؤشرات الزخممؤشرات اإلتجاه و ،التداولبين أحجام سلبيةفنية تتميز هذه األسهم بعالقات •
.لزخمامؤشرات اإلتجاه و مؤشرات , العالقات الفنية بين أحجام التداولأسوأاألسهم التي تحمل خمس نجوم هي أسهم يتوفر فيها •
تحدث بأحجام اإلنخفاضات التي( أو)إستخدم اإلرتفاعات التي تحدث بأحجام تداول منخفضة و . أسهم مرشحة للبيعهذه األسهم تعتبر •.بيعيةمراكزتداول مرتفعة لبناء
لوقف هي إشارةالمقاومة الثاني إختراق مستوى ،المراكزبأحجام تداول مرتفعة هي إشارة لتخفيض المقاومة األولإختراق مستوى •.الخسائر
.الثانيالدعم بالقرب من مستوى الخروجو الدعم األولبالقرب من مستوىبجني بعض األرباح ينصح •
BACK العودة
Stock Name Ticker Market Close R1 S1 R2 S2 Rank
اسم السهم الرمز السوق اإلغالق م1 د1 م2 د2 التصنيف
CENTAMIN ORD CEY UK 95.55 100.52 90.00 105.48 85.00
CAIRN ENERGY CNE UK 198.50 201.77 190.00 205.03 180.00
ARAMEX ARMX UAE 3.20 3.23 3.18 3.25 3.15
SPPC 4270 KSA 19.95 20.18 19.73 20.42 19.52
For more information on MubasherTrade, please visit our website at www.MubasherTrade.com or contact us at [email protected]. Please read the important disclosure and disclaimer at the end of this document.
Page 4
Radaro | Technical Analysis | Global | Equities
Monday, 1 30 May 2016
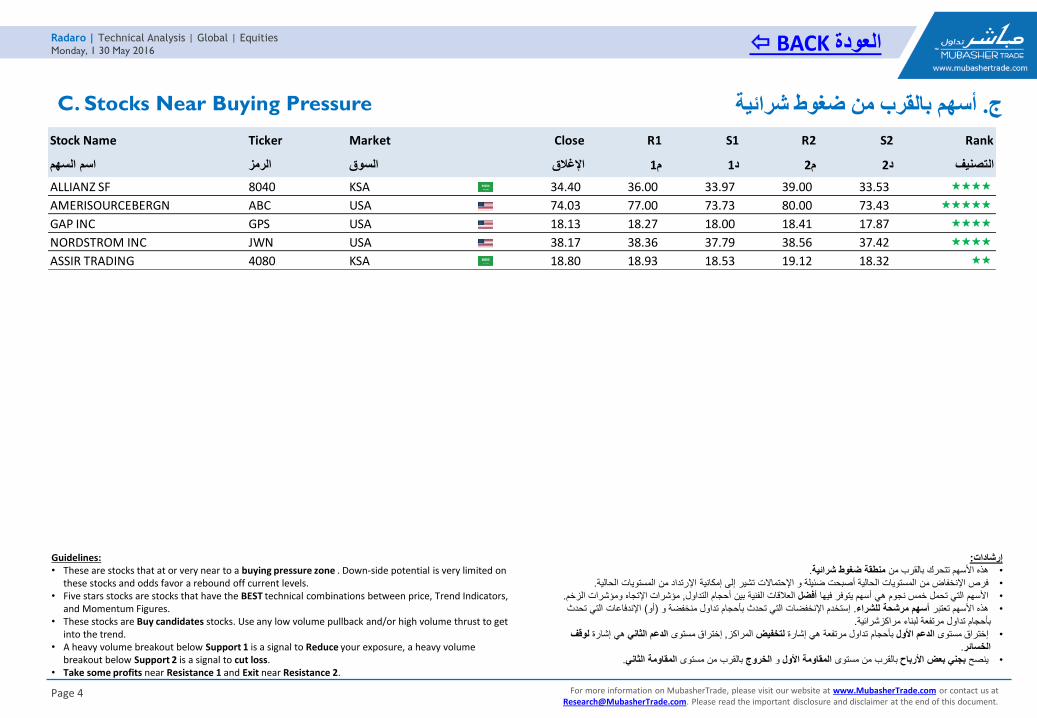
C. Stocks Near Buying Pressure أسهم بالقرب من ضغوط شرائية. ج
Guidelines:• These are stocks that at or very near to a buying pressure zone . Down-side potential is very limited on
these stocks and odds favor a rebound off current levels.• Five stars stocks are stocks that have the BEST technical combinations between price, Trend Indicators,
and Momentum Figures.• These stocks are Buy candidates stocks. Use any low volume pullback and/or high volume thrust to get
into the trend.• A heavy volume breakout below Support 1 is a signal to Reduce your exposure, a heavy volume
breakout below Support 2 is a signal to cut loss.• Take some profits near Resistance 1 and Exit near Resistance 2.
:إرشادات.منطقة ضغوط شرائيةمن بالقرب األسهم تتحرك هذه •
.يةالحالاإلنخفاض من المستويات الحالية أصبحت ضئيلة و اإلحتماالت تشير إلى إمكانية اإلرتداد من المستويات فرص •
.الزخمومؤشراتمؤشرات اإلتجاه , العالقات الفنية بين أحجام التداولأفضلالتي تحمل خمس نجوم هي أسهم يتوفر فيها األسهم •
تحدث اإلندفاعات التي( أو)إستخدم اإلنخفضات التي تحدث بأحجام تداول منخفضة و . أسهم مرشحة للشراءاألسهم تعتبر هذه •
.مراكزشرائيةبأحجام تداول مرتفعة لبناء
لوقفهي إشارة الدعم الثاني إختراق مستوى , المراكزلتخفيضبأحجام تداول مرتفعة هي إشارة الدعم األولمستوى إختراق •
.الخسائر
.الثانيالمقاومة بالقرب من مستوى الخروجو المقاومة األولبالقرب من مستوىبجني بعض األرباحينصح•
BACK العودة
Stock Name Ticker Market Close R1 S1 R2 S2 Rank
اسم السهم الرمز السوق اإلغالق م1 د1 م2 د2 التصنيف
ALLIANZ SF 8040 KSA 34.40 36.00 33.97 39.00 33.53
AMERISOURCEBERGN ABC USA 74.03 77.00 73.73 80.00 73.43
GAP INC GPS USA 18.13 18.27 18.00 18.41 17.87
NORDSTROM INC JWN USA 38.17 38.36 37.79 38.56 37.42
ASSIR TRADING 4080 KSA 18.80 18.93 18.53 19.12 18.32
For more information on MubasherTrade, please visit our website at www.MubasherTrade.com or contact us at [email protected]. Please read the important disclosure and disclaimer at the end of this document.
Page 5
Radaro | Technical Analysis | Global | Equities
Monday, 1 30 May 2016
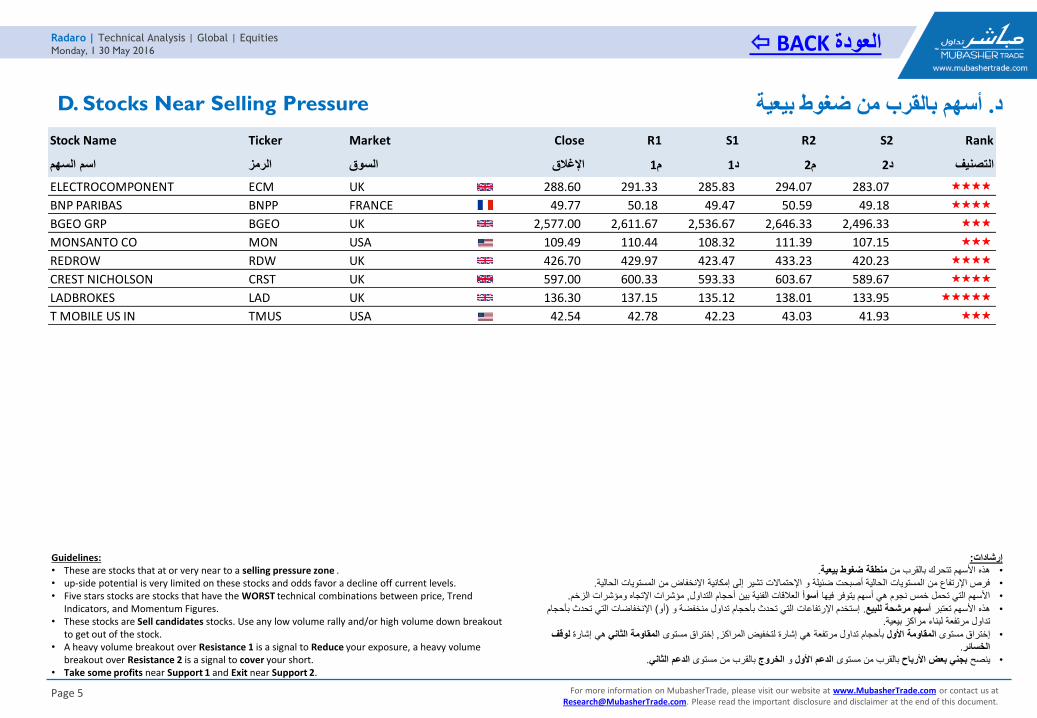
D. Stocks Near Selling Pressure أسهم بالقرب من ضغوط بيعية. د
Guidelines:• These are stocks that at or very near to a selling pressure zone .• up-side potential is very limited on these stocks and odds favor a decline off current levels.• Five stars stocks are stocks that have the WORST technical combinations between price, Trend
Indicators, and Momentum Figures.• These stocks are Sell candidates stocks. Use any low volume rally and/or high volume down breakout
to get out of the stock.• A heavy volume breakout over Resistance 1 is a signal to Reduce your exposure, a heavy volume
breakout over Resistance 2 is a signal to cover your short.• Take some profits near Support 1 and Exit near Support 2.
:إرشادات.منطقة ضغوط بيعيةهذه األسهم تتحرك بالقرب من •
.ليةفرص اإلرتفاع من المستويات الحالية أصبحت ضئيلة و اإلحتماالت تشير إلى إمكانية اإلنخفاض من المستويات الحا•
.زخممؤشرات اإلتجاه ومؤشرات ال, العالقات الفنية بين أحجام التداولأسوأاألسهم التي تحمل خمس نجوم هي أسهم يتوفر فيها •
تحدث بأحجام اإلنخفاضات التي( أو)إستخدم اإلرتفاعات التي تحدث بأحجام تداول منخفضة و . أسهم مرشحة للبيعهذه األسهم تعتبر •.بيعيةتداول مرتفعة لبناء مراكز
لوقف ة هي إشارالمقاومة الثاني إختراق مستوى , بأحجام تداول مرتفعة هي إشارة لتخفيض المراكزالمقاومة األولإختراق مستوى •.الخسائر
.الدعم الثانيبالقرب من مستوى الخروجو الدعم األولبالقرب من مستوىبجني بعض األرباح ينصح •
BACK العودة
Stock Name Ticker Market Close R1 S1 R2 S2 Rank
اسم السهم الرمز السوق اإلغالق م1 د1 م2 د2 التصنيف
ELECTROCOMPONENT ECM UK 288.60 291.33 285.83 294.07 283.07
BNP PARIBAS BNPP FRANCE 49.77 50.18 49.47 50.59 49.18
BGEO GRP BGEO UK 2,577.00 2,611.67 2,536.67 2,646.33 2,496.33
MONSANTO CO MON USA 109.49 110.44 108.32 111.39 107.15
REDROW RDW UK 426.70 429.97 423.47 433.23 420.23
CREST NICHOLSON CRST UK 597.00 600.33 593.33 603.67 589.67
LADBROKES LAD UK 136.30 137.15 135.12 138.01 133.95
T MOBILE US IN TMUS USA 42.54 42.78 42.23 43.03 41.93
For more information on MubasherTrade, please visit our website at www.MubasherTrade.com or contact us at [email protected]. Please read the important disclosure and disclaimer at the end of this document.
Page 6
Radaro | Technical Analysis | Global | Equities
Monday, 1 30 May 2016
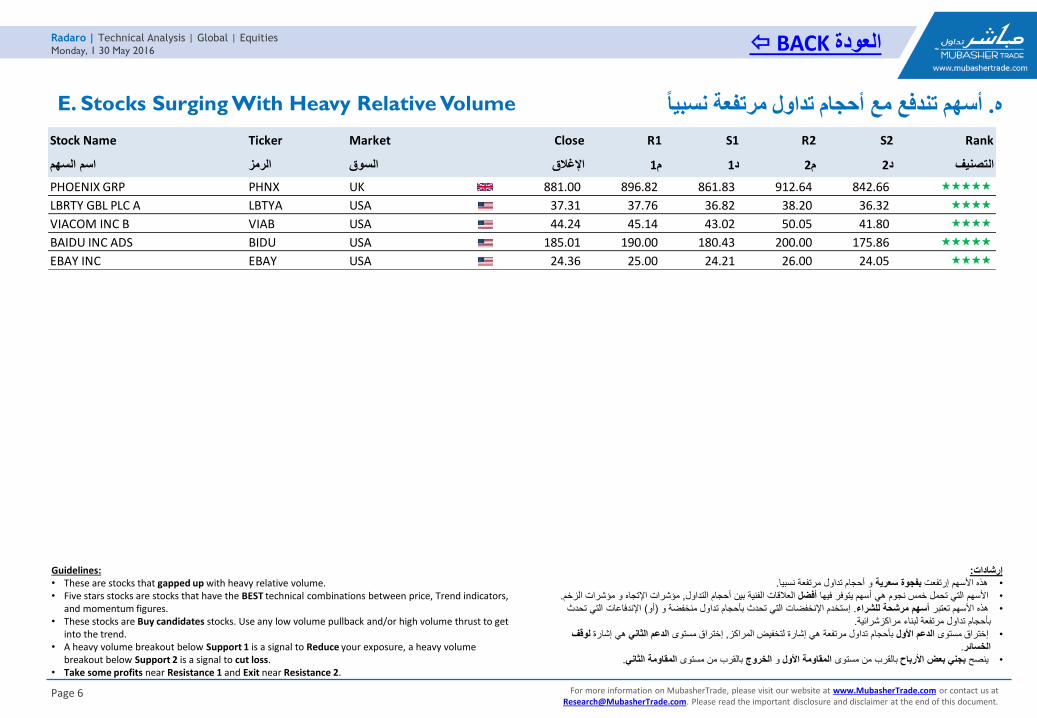
E. Stocks Surging With Heavy Relative Volume أسهم تندفع مع أحجام تداول مرتفعة نسبيا . ه
Guidelines:• These are stocks that gapped up with heavy relative volume. • Five stars stocks are stocks that have the BEST technical combinations between price, Trend indicators,
and momentum figures.• These stocks are Buy candidates stocks. Use any low volume pullback and/or high volume thrust to get
into the trend.• A heavy volume breakout below Support 1 is a signal to Reduce your exposure, a heavy volume
breakout below Support 2 is a signal to cut loss.• Take some profits near Resistance 1 and Exit near Resistance 2.
:إرشادات.نسبياو أحجام تداول مرتفعة سعرية بفجوة األسهم إرتفعت هذه •
.الزخممؤشرات اإلتجاه و مؤشرات, العالقات الفنية بين أحجام التداولأفضلالتي تحمل خمس نجوم هي أسهم يتوفر فيها األسهم •
تحدث اإلندفاعات التي( أو)إستخدم اإلنخفضات التي تحدث بأحجام تداول منخفضة و . أسهم مرشحة للشراءاألسهم تعتبر هذه •
.مراكزشرائيةبأحجام تداول مرتفعة لبناء
ف لوقهي إشارة الدعم الثاني إختراق مستوى , بأحجام تداول مرتفعة هي إشارة لتخفيض المراكزالدعم األولمستوى إختراق •
.الخسائر
.الثانيالمقاومة بالقرب من مستوى الخروجو المقاومة األولبالقرب من مستوىبجني بعض األرباحينصح•
BACK العودة
Stock Name Ticker Market Close R1 S1 R2 S2 Rank
اسم السهم الرمز السوق اإلغالق م1 د1 م2 د2 التصنيف
PHOENIX GRP PHNX UK 881.00 896.82 861.83 912.64 842.66
LBRTY GBL PLC A LBTYA USA 37.31 37.76 36.82 38.20 36.32
VIACOM INC B VIAB USA 44.24 45.14 43.02 50.05 41.80
BAIDU INC ADS BIDU USA 185.01 190.00 180.43 200.00 175.86
EBAY INC EBAY USA 24.36 25.00 24.21 26.00 24.05
For more information on MubasherTrade, please visit our website at www.MubasherTrade.com or contact us at [email protected]. Please read the important disclosure and disclaimer at the end of this document.
Page 7
Radaro | Technical Analysis | Global | Equities
Monday, 1 30 May 2016
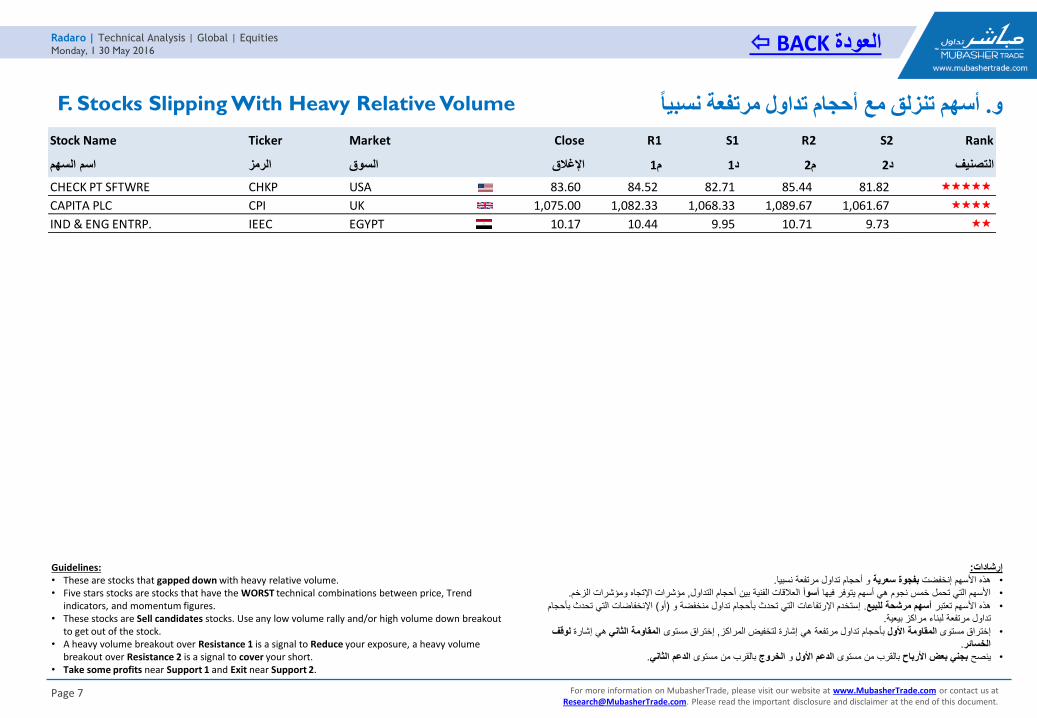
F. Stocks Slipping With Heavy Relative Volume أسهم تنزلق مع أحجام تداول مرتفعة نسبيا . و
Guidelines:• These are stocks that gapped down with heavy relative volume. • Five stars stocks are stocks that have the WORST technical combinations between price, Trend
indicators, and momentum figures.• These stocks are Sell candidates stocks. Use any low volume rally and/or high volume down breakout
to get out of the stock.• A heavy volume breakout over Resistance 1 is a signal to Reduce your exposure, a heavy volume
breakout over Resistance 2 is a signal to cover your short.• Take some profits near Support 1 and Exit near Support 2.
:إرشادات
.و أحجام تداول مرتفعة نسبيابفجوة سعرية هذه األسهم إنخفضت •
.زخمومؤشرات المؤشرات اإلتجاه , العالقات الفنية بين أحجام التداولأسوأاألسهم التي تحمل خمس نجوم هي أسهم يتوفر فيها •
تحدث بأحجام اإلنخفاضات التي( أو)إستخدم اإلرتفاعات التي تحدث بأحجام تداول منخفضة و . أسهم مرشحة للبيعهذه األسهم تعتبر •.بيعيةمراكزتداول مرتفعة لبناء
لوقف هي إشارةالمقاومة الثاني إختراق مستوى , بأحجام تداول مرتفعة هي إشارة لتخفيض المراكزالمقاومة األولإختراق مستوى •.الخسائر
.الثانيالدعم بالقرب من مستوى الخروجو الدعم األولبالقرب من مستوىبجني بعض األرباح ينصح •
BACK العودة
Stock Name Ticker Market Close R1 S1 R2 S2 Rank
اسم السهم الرمز السوق اإلغالق م1 د1 م2 د2 التصنيف
CHECK PT SFTWRE CHKP USA 83.60 84.52 82.71 85.44 81.82
CAPITA PLC CPI UK 1,075.00 1,082.33 1,068.33 1,089.67 1,061.67
IND & ENG ENTRP. IEEC EGYPT 10.17 10.44 9.95 10.71 9.73
For more information on MubasherTrade, please visit our website at www.MubasherTrade.com or contact us at [email protected]. Please read the important disclosure and disclaimer at the end of this document.
Page 8
Radaro | Technical Analysis | Global | Equities
Monday, 1 30 May 2016
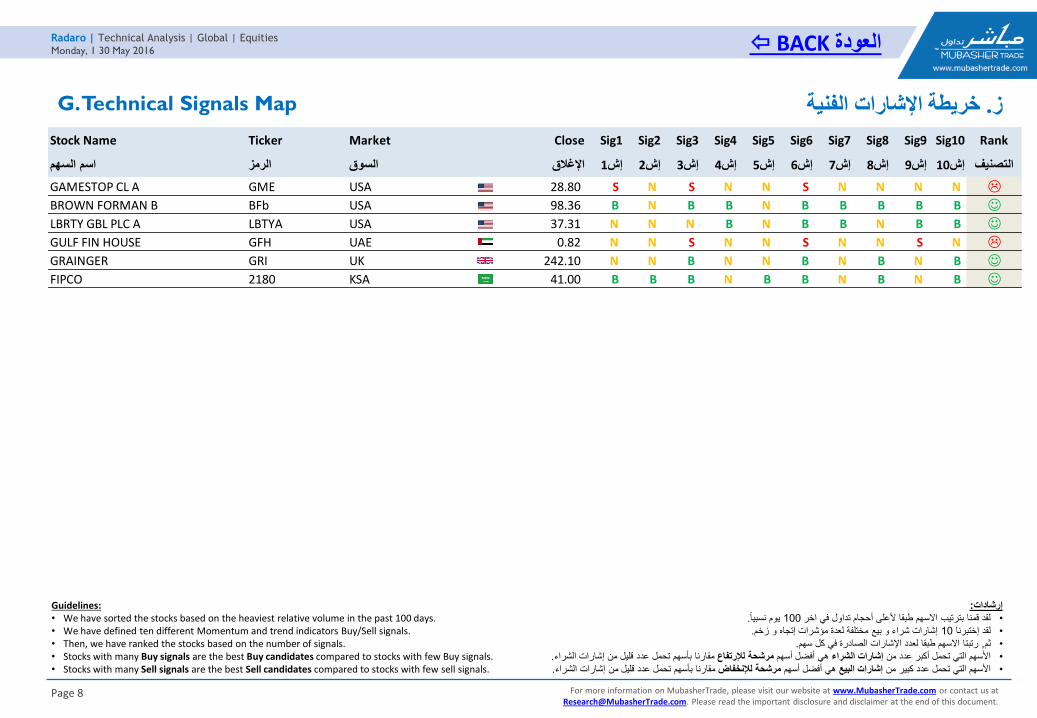
G. Technical Signals Map خريطة اإلشارات الفنية. ز
Guidelines:• We have sorted the stocks based on the heaviest relative volume in the past 100 days.• We have defined ten different Momentum and trend indicators Buy/Sell signals.• Then, we have ranked the stocks based on the number of signals.• Stocks with many Buy signals are the best Buy candidates compared to stocks with few Buy signals.• Stocks with many Sell signals are the best Sell candidates compared to stocks with few sell signals.
:إرشادات
.نسبيا يوم 100لقد قمنا بترتيب االسهم طبقا ألعلى أحجام تداول في اخر •
.زخمإشارات شراء و بيع مختلفة لعدة مؤشرات إتجاه و 10لقد إختبرنا •
.سهمرتبتا االسهم طبقا لعدد اإلشارات الصادرة في كل , ثم•
.شراءالمن إشارات قليلمقارنا بأسهم تحمل عدد مرشحة لإلرتفاع هي أفضل أسهم إشارات الشراءاألسهم التي تحمل أكبر عدد من •
.الشراءإشاراتمن قليل مقارنا بأسهم تحمل عدد مرشحة لإلنخفاض هي أفضل أسهم إشارات البيع األسهم التي تحمل عدد كبير من •
BACK العودة
Stock Name Ticker Market Close Sig1 Sig2 Sig3 Sig4 Sig5 Sig6 Sig7 Sig8 Sig9 Sig10 Rank
اسم السهم الرمز السوق اإلغالق إش1 إش2 إش3 إش4 إش5 إش6 إش7 إش8 إش9 إش10 التصنيف
GAMESTOP CL A GME USA 28.80 S N S N N S N N N N L
BROWN FORMAN B BFb USA 98.36 B N B B N B B B B B J
LBRTY GBL PLC A LBTYA USA 37.31 N N N B N B B N B B J
GULF FIN HOUSE GFH UAE 0.82 N N S N N S N N S N L
GRAINGER GRI UK 242.10 N N B N N B N B N B J
FIPCO 2180 KSA 41.00 B B B N B B N B N B J
For more information on MubasherTrade, please visit our website at www.MubasherTrade.com or contact us at [email protected]. Please read the important disclosure and disclaimer at the end of this document.
Page 9
Radaro | Technical Analysis | Global | Equities
Monday, 1 30 May 2016
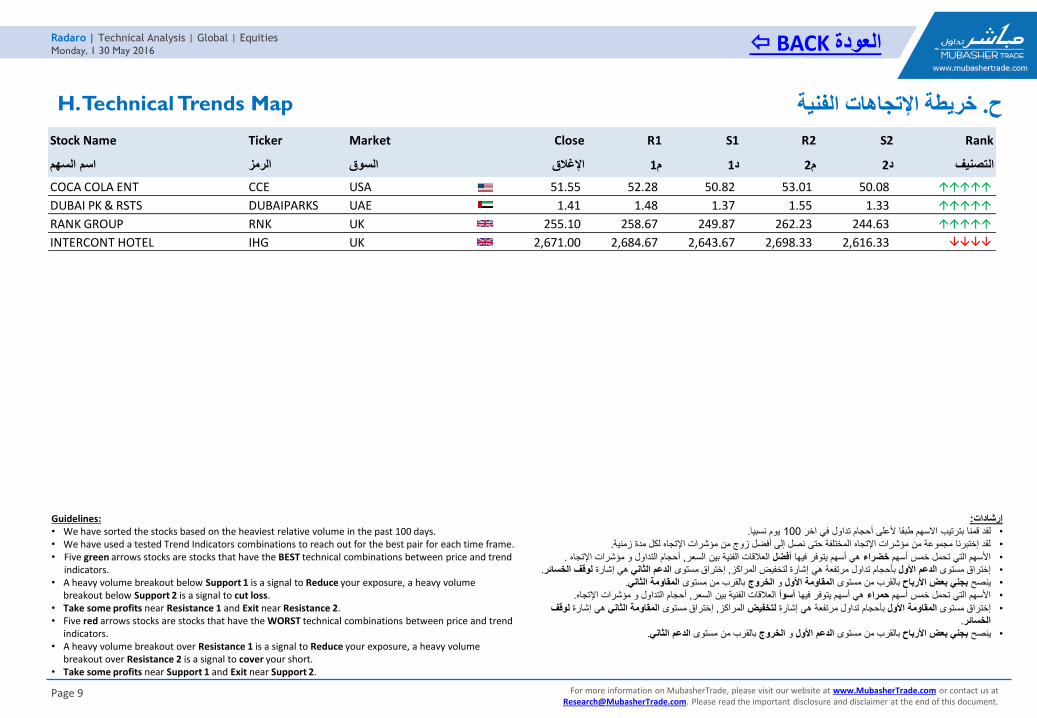
H. Technical Trends Map خريطة اإلتجاهات الفنية. ح
Guidelines:• We have sorted the stocks based on the heaviest relative volume in the past 100 days.• We have used a tested Trend Indicators combinations to reach out for the best pair for each time frame.• Five green arrows stocks are stocks that have the BEST technical combinations between price and trend
indicators.• A heavy volume breakout below Support 1 is a signal to Reduce your exposure, a heavy volume
breakout below Support 2 is a signal to cut loss.• Take some profits near Resistance 1 and Exit near Resistance 2.• Five red arrows stocks are stocks that have the WORST technical combinations between price and trend
indicators.• A heavy volume breakout over Resistance 1 is a signal to Reduce your exposure, a heavy volume
breakout over Resistance 2 is a signal to cover your short.• Take some profits near Support 1 and Exit near Support 2.
:إرشادات
.نسبيايوم 100قمنا بترتيب االسهم طبقا ألعلى أحجام تداول في اخر لقد •.زمنيةلقد إختبرنا مجموعة من مؤشرات اإلتجاه المختلفة حتى نصل إلى أفضل زوج من مؤشرات اإلتجاه لكل مدة •. تجاه أحجام التداول و مؤشرات اإل, العالقات الفنية بين السعرأفضلهي أسهم يتوفر فيها خضراءاألسهم التي تحمل خمس أسهم •.لخسائرالوقف هي إشارة الدعم الثاني إختراق مستوى , بأحجام تداول مرتفعة هي إشارة لتخفيض المراكزالدعم األولمستوى إختراق •.الثانيالمقاومة بالقرب من مستوى الخروجو المقاومة األولبالقرب من مستوىبجني بعض األرباحينصح•.اهأحجام التداول و مؤشرات اإلتج, العالقات الفنية بين السعرأسوأهي أسهم يتوفر فيها حمراءاألسهم التي تحمل خمس أسهم •
وقف لهي إشارة المقاومة الثاني إختراق مستوى , المراكزلتخفيضبأحجام تداول مرتفعة هي إشارة المقاومة األولمستوى إختراق •.الخسائر
.الثانيالدعم بالقرب من مستوى الخروجو الدعم األولبالقرب من مستوىبجني بعض األرباح ينصح •
BACK العودة
Stock Name Ticker Market Close R1 S1 R2 S2 Rank
اسم السهم الرمز السوق اإلغالق م1 د1 م2 د2 التصنيف
COCA COLA ENT CCE USA 51.55 52.28 50.82 53.01 50.08
DUBAI PK & RSTS DUBAIPARKS UAE 1.41 1.48 1.37 1.55 1.33
RANK GROUP RNK UK 255.10 258.67 249.87 262.23 244.63
INTERCONT HOTEL IHG UK 2,671.00 2,684.67 2,643.67 2,698.33 2,616.33
MethodologyTechnical market analysis is, at its essence, a study of crowd behavior and market psychology. We enhance this analysis by studying chart patterns, overlaying a large suite of technical indicators, volatility and volumedata to gauge sentiment and trend strength, looking for divergences and confirmation. It is vitally important to view indicators in relation to where the market is in its wave cycle.Our methodology is to focus on stocks that are suitable for active traders, swing traders and proactive investors focusing on these stocks for long positions and, when appropriate, for shorting. The technical analysisprocess we use is based on the ‘pure’ price and volume, rule-based analysis of the Elliott Wave Principle and to overlay a broad suite of technical indicators, positioning and sentiment evidence in order to recommend atrade. The time horizon is normally short- to medium-term (days, multi-week/month). Translating our analysis into actual trading ideas and positions, our investment process combines a trend following tradingmethodology and its discipline with the technical analysis of the Elliott Wave Principle. A potential trade set-up is given by the wave structure and supporting technical analysis such as Japanese candlesticks, trendextension and exhaustion measures, momentum oscillators and sentiment. However, the trade is only executed when there is an objective movement of momentum in the direction the technical analysis suggests. Thetrade entry and trade exit are governed by the moving averages acting as both a trailing stop loss and take profit discipline. By overlaying a disciplined, proven investment strategy such as Trend Following on technicalanalysis we seek to run winning trades and cut losing trades early.
Other DisclosuresMFS does not have any proprietary holding in any securities. Only as a nominee, MFS holds shares on behalf of its clients through Omnibus accounts. MFS is not currently a market maker for any listed securities.
Disclosure Appendix
Analyst CertificationI (we) Ramy Rashad, Head of Advisory, employed with Mubasher Financial Services LLC (UAE), a company under the National Technology Group of Saudi Arabia being a shareholder of Mubasher Financial Services BSC(c) and author(s) of this report, hereby certify that all the views expressed in this research report accurately reflect my (our) views about the subject issuer(s) or security(ies). I (we) also certify that no part of my (our)compensation was, is or will be directly or indirectly related to the specific recommendation(s) or view(s) expressed in this report. Also, I (we) certify that neither myself (ourselves) nor any of my (our) close relativeshold or trade into the subject securities.
Head of Research CertificationI, Amr Hussein Elalfy, Global Head of Research of Mubasher Financial Services BSC (c) confirm that I have vetted the information, and all the views expressed by the Analyst in this research report about the subjectissuer(s) or security(ies). I also certify that the author(s) of this report, has (have) not received any compensation directly related to the contents of the Report.
DisclaimerThis document is not and should not be construed as an offer to sell or the solicitation of an offer to purchase or subscribe for any investment. Mubasher Financial Services BSC (c) (‘MFS’) has based this document oninformation obtained from sources it believes to be reliable but which it has not independently verified; MFS makes no guarantee, representation or warranty and accepts no responsibility or liability as to its accuracyor completeness. The opinions contained within the document are based upon publicly available information at the time of publication and are subject to change without notice. This document is not intended for allrecipients and may not be suitable for all investors. Securities described in this document are not available for sale in all jurisdictions or to certain category of investors. The document is not substitution forindependent judgment by any recipient who should evaluate investment risks. Additionally, investors must regard this document as providing stand-alone analysis and should not expect continuing analysis oradditional documents relating to the issuers and/or securities mentioned herein. Past performance is not necessarily a guide to future performance. Forward-looking statements are not predictions and may besubject to change without notice. The value of any investment or income may go down as well as up and you may not get back the full amount invested. Where an investment is denominated in a currency other thanthe local currency of the recipient of the research report, changes in the exchange rates may have an adverse effect on the value, price or income of that investment. In case of investments for which there is norecognized market, it may be difficult for investors to sell their investments or to obtain reliable information about its value or the extent of the risk to which it is exposed. References to ratings/recommendations arefor informational purposes only and do not imply that MFS adopts, supports or confirms in any way the ratings/recommendations, opinions or conclusions of the analysts. This document is not directed or intended fordistribution to, or use by, any person or entity who is a citizen or resident of or located in any locality, state, country, or other jurisdiction where such distribution, publication, availability or use would be contrary tolaw, regulation or which would subject MFS or its affiliates to any registration or licensing requirements within such jurisdiction. MFS accepts no liability for any direct, indirect, or consequential damages or lossesincurred by third parties including its clients from any use of this document or its contents.
Copyright© Copyright 2016, Mubasher Financial Services BSC (MFS), ALL RIGHTS RESERVED. No part or excerpt of this document may be redistributed, reproduced, stored in a retrieval system, or transmitted, on any form or byany means, electronic, mechanical, photocopying, recording, or otherwise, without the prior written permission of MFS. MubasherTrade is a trademark of Mubasher Financial Services BSC. Mubasher FinancialServices BSC (c) is an Investment Business Firm Category 1, licensed and regulated by the Central Bank of Bahrain.
Issuer of ReportMubasher Financial Services BSC (c) is an Investment Business Firm Category 1, licensed and regulated by the Central Bank of Bahrain.Website: www.MubasherTrade.comE-mail: [email protected]
Sales & Research Contact Details
INSTITUTIONAL SALES RETAIL SALES RESEARCH
MENA Bahrain Libya Research [email protected] [email protected] [email protected] [email protected]+971 4 321 1167 (UAE) Call Center: +973 1730 0849 +218923070350+965 97734334 (Kuwait)+962 79 5538806 (Jordan) Egypt UAE
[email protected] [email protected]@Mubasher.net+202 2262 3310
Call Center: 16699 / +202 2262 3230 Call Center: +971 800 567 000