Racial/Ethnic Differences in Perceptions of School Climate ......observations of the prevalence of...
25
Racial/Ethnic Differences in Perceptions of School Climate and Its Association with Student Engagement and Peer Aggression Tim Konold 1 , Dewey Cornell 1 , Kathan Shukla 2 , Francis Huang 3 AERA May 1, 2017 1 University of Virginia, 2 Indian Institute of Management Ahmedabad, 3 University of Missouri
Transcript of Racial/Ethnic Differences in Perceptions of School Climate ......observations of the prevalence of...

Racial/Ethnic Differences in Perceptions of
School Climate and Its Association with Student
Engagement and Peer Aggression
Tim Konold1, Dewey Cornell1, Kathan Shukla2, Francis Huang3
AERAMay 1, 2017
1University of Virginia, 2 Indian Institute of Management Ahmedabad, 3 University of Missouri

School Climate
• School climate has been broadly defined as “the
quality and character of school life” (Cohen, et al.,
2009, p. 182)
• It is a multidimensional construct that describes the
extent to which a school community creates and
maintains a safe school campus, a supportive
academic, disciplinary, and physical environment, and
respectful, trusting, and caring relationships throughout
the school community” (U.S. Department of Education,
2013, p. 2)
2
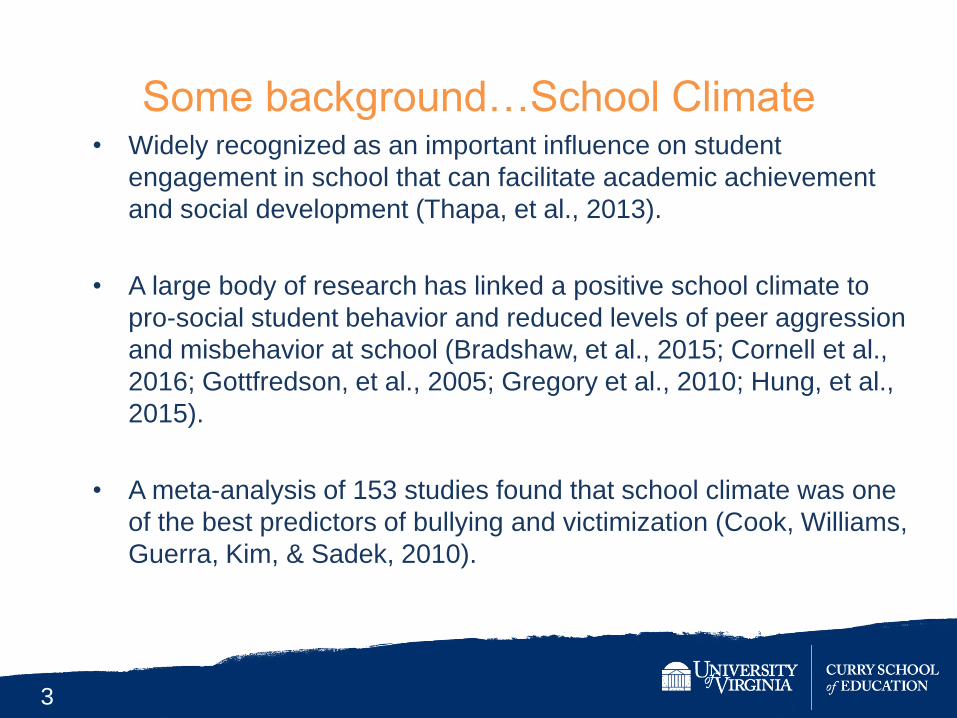
Some background…School Climate• Widely recognized as an important influence on student
engagement in school that can facilitate academic achievement
and social development (Thapa, et al., 2013).
• A large body of research has linked a positive school climate to
pro-social student behavior and reduced levels of peer aggression
and misbehavior at school (Bradshaw, et al., 2015; Cornell et al.,
2016; Gottfredson, et al., 2005; Gregory et al., 2010; Hung, et al.,
2015).
• A meta-analysis of 153 studies found that school climate was one
of the best predictors of bullying and victimization (Cook, Williams,
Guerra, Kim, & Sadek, 2010).
3

Strong National Interest in School Climate
Interventions as a possible way to Increase
Student Achievement and Social-Emotional
Development• The Every Student Succeeds Act (ESSA) encourages states to
assess school climate as an indicator of school quality.
• The U.S. Department of Education (2016) has urged schools to
make deliberate efforts to improve school climate and has taken
steps to provide schools with school climate surveys, action
guides, and other resources.
4

Black and Hispanic students experience both an
achievement gap and a discipline gap in comparison to
White students (Gregory, et al., 2010).
• Black and Hispanic students are more likely to be referred for
discipline violations and subsequently suspended or expelled from
school for disciplinary infractions than White students (USDOE,
Office of Civil Rights, 2014)
• Minority students may experience a less supportive school
environment that weakens their engagement in school and their
willingness to follow school rules (Shirley & Cornell, 2011; Voight,
Hanson, O’Malley, & Adekanye, 2015).
5

What we kind of know…
• Black students perceive less caring climates than White students
attending the same high schools (Bottiani, et al., 2016)
• Black and Hispanic students report significantly poorer
relationships with adults, lower connectedness with their school,
fewer opportunities for participation, and greater concerns about
safety than their White peers (Voight et al., 2015)
• Achievement gaps are typically larger for schools with larger gaps
in climate perceptions
6

What we kind of know…
• A recent CDC (2016) study found that
– “the prevalence of having not gone to school because of safety concerns was higher among Black (6.8%) and Hispanic (7.6%) than White (4.2%) students”
– Black (12.6%) and Hispanic (8.9%) students were more likely to report of having been in a physical fight on school property than White (5.6%) students
– White (23.5%) students reported having been bullied on school property more than Black (13.2%) or Hispanic (16.5%) students
7

What we kind of know…
• Efforts to measure or modify school climate must
consider the possibility that Black and Hispanic
students have different experiences in schools than
White students
• Positive efforts in this direction:
– Intervention efforts to reduce discipline gaps (CDC, 2009)
– School-wide PBI and supports (Bradshaw, 2015)
– Call for education authorities to identify and eliminate discipline practices that intentionally or unintentionally have a discriminatory impact on racial/ethnic minorities (USDOE, 2014)
8

Current Study
• Do Black, Hispanic, and White students differ in their
perceptions of school climate in a state-wide study of
high schools?
• Do the associations between authoritative school
climate and student engagement as well as peer
aggression differ for Black, Hispanic, and White
students?
9

SampleStudent data were obtained from the Virginia School Climate Survey (Cornell et
al., 2014; Konold, et al., 2014.
Multi-stage screening resulted in an analytic sample of N = 48,027 (51.4%
female) participants in ninth (26.1%), tenth (26%), eleventh (24.9%) and twelfth
(23.1%) grade from 323 of the 324 school eligible for participation.
The racial/ethnic breakdown was 56.7% White, 17.9% Black, 10.5% Hispanic,
3.8% Asian American, 1.2% American Indian or Alaska Native, and 0.6% Native
Hawaiian or Pacific Islander, with an additional 9.4% of students identifying
themselves with having more than one race. The distribution of parental
education was 19.9% completed post-graduate studies, 24.1% completed a
four-year college degree, 16% completed a two-year college or technical
education degree, 31.2% graduated from high school, and 8.8% did not
graduate from high school.
10

Measures of ASCStudent Support measures the supportiveness of teacher-student
relationships with items such as how much students perceive that adults
in their school “really care about all students” and whether they would
seek help for problems such as bullying.
Disciplinary Structure was Designed to measure the perceived
fairness and strictness of school discipline with items such as “The
school rules are fair” and “The school rules are strictly enforced.”
Academic Expectations measures student perceptions that their
teachers expected high academic achievement from them (e.g., “My
teachers expect me to work hard” and “My teachers expect me to attend
college”).
11

Measures of Engagement and Peer AggressionStudent Engagement includes items that tap into both affective (e.g., “I
am proud to be a student at this school”) and cognitive (e.g., “I want to
learn as much as I can at school”) aspects of student engagement.
Prevalence of Teasing and Bullying (PTB) measures student
observations of the prevalence of teasing and bullying among other
students, as distinguished from personal victimization.
Victimization Experiences asks students about their general
victimization experiences during the current year.
Bullying Victimization assess personal experiences of being bullied at
school during the current year.
12

Contextual Factors (Covariates)
Perceptions of school climate have been found to be influenced by a
variety of contextual characteristics that are often beyond the
schools’ control (Gottfredson et al., 2005; Konold, 2016)
– School size, SES (Koth, Bradshaw, & Leaf, 2008)
– Neighborhood characteristics (Maume et al, 2010)
– Race (Pedro et al., 2016)
13

Methods / Results
• Question 1: Do Black, Hispanic, and White students
differ in their perceptions of school climate?
Examined through two-level models that accounted for
the nesting of students within schools.
All contrasts controlled for parent education level, student
gender, the percentage of students in the school sharing
the same race as the respondent, the percent of students
in the respondents’ school receiving free- or reduced-
prices meals, and school size.
14
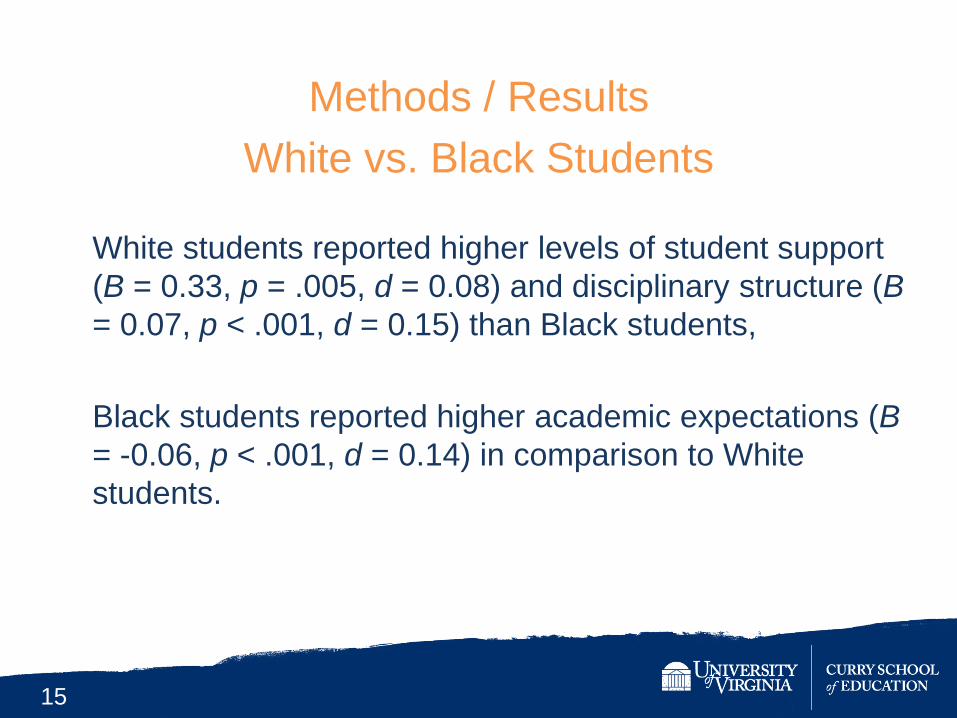
Methods / Results
White vs. Black Students
White students reported higher levels of student support
(B = 0.33, p = .005, d = 0.08) and disciplinary structure (B
= 0.07, p < .001, d = 0.15) than Black students,
Black students reported higher academic expectations (B
= -0.06, p < .001, d = 0.14) in comparison to White
students.
15

Methods / Results
White vs. Hispanic Students
By contrast, differences between reports obtained by
White and Hispanic students were not statistically
different for our measures of student support (B = -0.02, p
= .247, d = 0.05), disciplinary structure (B = -0.03, p =
.081, d = 0.09), and academic expectations (B = -0.01, p
= .561, d = 0.02).
16

Methods / Results
• Question 2: Do the associations between authoritative
school climate and student engagement as well as
peer aggression differ for Black, Hispanic, and White
students?
Examined through two-level hierarchical models that
contrasted Black and Hispanic student groups with White
students, and examined the moderating influence of
racial group membership on the relationships among
these variables.
Three Steps…
17

18
Peer Aggression Student Engagement Prevalence of Teasing and Bullying Victimization Experiences Bullying Experiences
B R2 ΔR
2 B R
2 ΔR
2 B R
2 ΔR
2 B R
2 ΔR
2
Black vs. White
Parent Education 0.07*** -0.02*** < 0.00 < 0.01
Gender -0.06*** -0.12*** 0.07*** -0.06***
% FRPM 0.02 < 0.01 0.03 0.02*
School Size 0.04** 0.08*** < 0.01 -0.02
Race1 0.04*** .037 0.04*** .040 -- -0.02 .009 -0.01 .005
Student Support (SS) 0.28*** -0.11*** -0.09*** -0.14***
Disciplinary Structure (DS) 0.19*** -0.23*** -0.16*** -0.07***
Academic Expectations(AE) 0.13*** .414 .377 0.02 .194 .154 0.03 .094 .085 0.02 .055 .050
Black vs. White (BW) -0.01 0.03** 0.05*** 0.08***
BW x SS 0.03* -0.05*** -0.05* 0.41
BW x DS 0.03** -0.05** -0.04** -0.37
BW x AE 0.04*** .415 .001 -0.02 .196 .002 < 0.01 .098 .004 -0.16 .060 .005
Hispanic vs. White
Parent Education 0.07*** -0.02** -0.01 < 0.01
Gender -0.07*** -0.13*** 0.06*** -0.07***
% FRPM 0.02 0.03 0.01 -0.03*
School Size 0.05** 0.07*** -0.01 -0.04***
Race1 0.06*** .037 0.06** .038 -- -0.05*** .012 -0.03** .008 --
Student Support (SS) 0.32*** -0.16*** -0.15*** -0.20***
Disciplinary Structure (DS) 0.19*** -0.26*** -0.23*** -0.12***
Academic Expectations (AE) 0.16*** .431 .394 0.02 .214 .140 -0.01 .117 .105 -0.04* .076 .068
Hispanic vs. White (HW) -0.03** 0.01 0.02 0.02*
HW x SS -0.01 -0.01 < 0.01 0.04
HW x DS 0.03 0.03 0.01 -0.02
HW x AE 0.02 .432 .001 0.02 .214 .000 0.04* .118 .001 0.09*** .079 .003
Step 1

19
Peer Aggression Student Engagement Prevalence of Teasing and Bullying Victimization Experiences Bullying Experiences
B R2 ΔR
2 B R
2 ΔR
2 B R
2 ΔR
2 B R
2 ΔR
2
Black vs. White
Parent Education 0.07*** -0.02*** < 0.00 < 0.01
Gender -0.06*** -0.12*** 0.07*** -0.06***
% FRPM 0.02 < 0.01 0.03 0.02*
School Size 0.04** 0.08*** < 0.01 -0.02
Race1 0.04*** .037 0.04*** .040 -- -0.02 .009 -0.01 .005
Student Support (SS) 0.28*** -0.11*** -0.09*** -0.14***
Disciplinary Structure (DS) 0.19*** -0.23*** -0.16*** -0.07***
Academic Expectations(AE) 0.13*** .414 .377 0.02 .194 .154 0.03 .094 .085 0.02 .055 .050
Black vs. White (BW) -0.01 0.03** 0.05*** 0.08***
BW x SS 0.03* -0.05*** -0.05* 0.41
BW x DS 0.03** -0.05** -0.04** -0.37
BW x AE 0.04*** .415 .001 -0.02 .196 .002 < 0.01 .098 .004 -0.16 .060 .005
Hispanic vs. White
Parent Education 0.07*** -0.02** -0.01 < 0.01
Gender -0.07*** -0.13*** 0.06*** -0.07***
% FRPM 0.02 0.03 0.01 -0.03*
School Size 0.05** 0.07*** -0.01 -0.04***
Race1 0.06*** .037 0.06** .038 -- -0.05*** .012 -0.03** .008 --
Student Support (SS) 0.32*** -0.16*** -0.15*** -0.20***
Disciplinary Structure (DS) 0.19*** -0.26*** -0.23*** -0.12***
Academic Expectations (AE) 0.16*** .431 .394 0.02 .214 .140 -0.01 .117 .105 -0.04* .076 .068
Hispanic vs. White (HW) -0.03** 0.01 0.02 0.02*
HW x SS -0.01 -0.01 < 0.01 0.04
HW x DS 0.03 0.03 0.01 -0.02
HW x AE 0.02 .432 .001 0.02 .214 .000 0.04* .118 .001 0.09*** .079 .003
Step 2

20
Peer Aggression Student Engagement Prevalence of Teasing and Bullying Victimization Experiences Bullying Experiences
B R2 ΔR
2 B R
2 ΔR
2 B R
2 ΔR
2 B R
2 ΔR
2
Black vs. White
Parent Education 0.07*** -0.02*** < 0.00 < 0.01
Gender -0.06*** -0.12*** 0.07*** -0.06***
% FRPM 0.02 < 0.01 0.03 0.02*
School Size 0.04** 0.08*** < 0.01 -0.02
Race1 0.04*** .037 0.04*** .040 -- -0.02 .009 -0.01 .005
Student Support (SS) 0.28*** -0.11*** -0.09*** -0.14***
Disciplinary Structure (DS) 0.19*** -0.23*** -0.16*** -0.07***
Academic Expectations(AE) 0.13*** .414 .377 0.02 .194 .154 0.03 .094 .085 0.02 .055 .050
Black vs. White (BW) -0.01 0.03** 0.05*** 0.08***
BW x SS 0.03* -0.05*** -0.05* 0.41
BW x DS 0.03** -0.05** -0.04** -0.37
BW x AE 0.04*** .415 .001 -0.02 .196 .002 < 0.01 .098 .004 -0.16 .060 .005
Hispanic vs. White
Parent Education 0.07*** -0.02** -0.01 < 0.01
Gender -0.07*** -0.13*** 0.06*** -0.07***
% FRPM 0.02 0.03 0.01 -0.03*
School Size 0.05** 0.07*** -0.01 -0.04***
Race1 0.06*** .037 0.06** .038 -- -0.05*** .012 -0.03** .008 --
Student Support (SS) 0.32*** -0.16*** -0.15*** -0.20***
Disciplinary Structure (DS) 0.19*** -0.26*** -0.23*** -0.12***
Academic Expectations (AE) 0.16*** .431 .394 0.02 .214 .140 -0.01 .117 .105 -0.04* .076 .068
Hispanic vs. White (HW) -0.03** 0.01 0.02 0.02*
HW x SS -0.01 -0.01 < 0.01 0.04
HW x DS 0.03 0.03 0.01 -0.02
HW x AE 0.02 .432 .001 0.02 .214 .000 0.04* .118 .001 0.09*** .079 .003
Step 3

DiscussionConsistent with past research (Koth et al., 2008; Shukla et al., 2016), Black and White
students within the same schools reported different perceptions of school climate.
Compared to White students, Black students experience a school climate in
which their teachers seem less supportive but more demanding of academic
achievement, and they perceive school discipline as less structured and fair.
Implications for the discipline gap
Gregory and Weinstein (2008) found that Black high school students were most
likely to misbehave in the classroom when they did not trust their teachers and
perceived that they were not caring or concerned.
Gregory et al. (2011) found that Black students experienced the highest
suspension rates in schools that lacked the combination of structure and support.
21

Discussion
Even after controlling for student and school level covariates, SC accounted
for appreciable amounts of variance in student engagement and peer
aggression
The findings support and extend prior research in several ways
Results supports the link between qualities of an ASC and student
engagement in learning that has been reported in previous studies (e.g.,
Wang & Eccles, 2013).
Findings contribute to the substantial body of research linking an
authoritative school climate to lower levels of student aggression (Cornell et
al., 2015; Gregory et al., 2010; Guerra, et al., 2011).
22

Discussion
Importantly, these relationships maintained across race/ethnicity groups
Consequently, a positive school climate appears to hold similar benefits of
higher feelings of engagement in school and lower victimization experiences
for all three groups of students.
Findings support efforts to improve school climate as a means of facilitating
equitable outcomes for all students.
From a psychometric perspective, the measures of disciplinary structure,
student support, and academic expectations revealed comparable criterion-
related validity for Black, Hispanic, and White high school students.
23

Wrapping upResults align with previous research (Cornell et al., 2015; 2016) in showing
that students in authoritative schools are more engaged in school and less
aggressive toward their peers.
Provide new evidence that the positive benefits associated with an
authoritative school climate are found for Black, Hispanic, and White
students.
Results support the U. S. Department of Education’s encouragement for
schools to improve their school climate as a strategy for achieving equitable
outcomes across racial/ethnic groups.
24

Sponsors
This project was supported in part by Grant #NIJ 2014-CK-BX-0004 awarded
by the National Institute of Justice, Office of Justice Programs, U.S.
Department of Justice
And
Grant #2012-JF-FX-0062 awarded by the Office of Juvenile Justice and
Delinquency Prevention, Office of Justice Programs, U.S. Department of
Justice
The opinions, findings, and conclusions or recommendations expressed in
this report are those of the authors and do not necessarily reflect those of the
U.S. Department of Justice or the Virginia Department of Criminal Justice
Services
25