RACIAL AND ETHNIC DISPARITIES IN ARRESTS AND...
42
RACIAL AND ETHNIC DISPARITIES IN ARRESTS AND CONVICTIONS IN THE COUNTIES REPRESENTED BY MEMBERS OF THE NEW YORK STATE LEGISLATIVE CAUCUS OF BLACK, PUERTO RICAN, HISPANIC AND ASIAN LEGISLATORS ___________________________________________ ___________________________________________ New York State Defenders Association Public Defense Backup Center 194 Washington Avenue Albany, NY 12210 May 19, 2014
Transcript of RACIAL AND ETHNIC DISPARITIES IN ARRESTS AND...

RACIAL AND ETHNIC DISPARITIES IN ARRESTS
AND CONVICTIONS IN THE COUNTIES
REPRESENTED BY MEMBERS OF THE
NEW YORK STATE
LEGISLATIVE CAUCUS OF BLACK, PUERTO RICAN,
HISPANIC AND ASIAN LEGISLATORS
___________________________________________
___________________________________________
New York State Defenders Association
Public Defense Backup Center
194 Washington Avenue
Albany, NY 12210
May 19, 2014

i
TABLE OF CONTENTS
Page
Background 1
Counties Represented by Caucus Members Examined 1
Caveats 2
Bronx County 3
Honorable Gustavo Rivera, NYS Senate
Honorable Carmen E. Arroyo, NYS Assembly
Honorable Marcos A. Crespo, NYS Assembly
Honorable Carl E. Heastie, NYS Assembly
Honorable Victor Pichardo, NYS Assembly
Honorable Jose Rivera, NYS Assembly
Honorable Luis R. Sepulveda, NYS Assembly
Erie County 5
Honorable Crystal Peoples-Stokes, NYS Assembly
Kings County 7
Honorable Martin Malave Dilan, NYS Senate
Honorable Velmanette Montgomery, NYS Senate
Honorable Kevin Parker, NYS Senate
Honorable John Sampson, NYS Senate
Honorable Karim Camara, NYS Assembly
Honorable Maritza Davila, NYS Assembly
Honorable Walter T. Mosley, NYS Assembly
Honorable Felix Ortiz, NYS Assembly
Honorable N. Nick Perry, NYS Assembly
Honorable Annette Robinson, NYS Assembly
Monroe County 9
Honorable David Gantt, NYS Assembly
Nassau County 11
Honorable Earlene Hooper, NYS Assembly
Honorable Michaelle Solages, NYS Assembly
New York County 13
Honorable Adriano Espaillat, NYS Senate
Honorable Bill Perkins, NYS Senate
Honorable Jose Serrano, NYS Senate
Honorable Herman Farrell, Jr., NYS Assembly

ii
Honorable Robert Rodriguez, NYS Assembly
Honorable Gabriela Rosa, NYS Assembly
Honorable Keith L. T. Wright, NYS Assembly
Onondaga County 15
Honorable Samuel Roberts, NYS Assembly
Queens County 17
Honorable Jose Peralta, NYS Senate
Honorable James Sanders, Jr., NYS Senate
Honorable Malcolm Smith, NYS Senate
Honorable Jeffrion Aubry, NYS Assembly
Honorable Barbara Clark, NYS Assembly
Honorable Vivian Cook, NYS Assembly
Honorable Ron Kim, NYS Assembly
Honorable Francisco Moya, NYS Assembly
Honorable Nily Rozic, NYS Assembly
Honorable William Scarborough, NYS Assembly
Honorable Michele Titus, NYS Assembly
Suffolk County 19
Honorable Phil Ramos, NYS Assembly
Westchester County 21
Honorable Ruth Hassell-Thompson, NYS Assembly
Honorable Andrea Stewart-Cousins
Albany, Columbia, Delaware, Greene, Otsego, Schoharie & Ulster Counties 23
Honorable Peter Lopez, NYS Assembly
Conclusion 37
Appendix: Average Percent Poverty by Legislative District 38
1
BACKGROUND
The New York State Legislative Caucus of Black, Puerto Rican, Hispanic and Asian Legislators was a
leading voice in the call for passage of the Public Defense Reform of 2009. That bill was modeled on the
2006 recommendations of then-Chief Judge Kaye’s Commission on the Future of Indigent Defense
Services. The Kaye Commission called for the state takeover of the funding and administration of public
defense services. Specifically, it advocated for the creation of an independent, politically-insulated public
defense commission to oversee and administer a new system, and an end to the unconstitutional
system that existed then and which continues today.
Earlier this legislative session NYSDA called on the Legislature and the Caucus to ask the Governor to
settle a pending class action lawsuit over the unconstitutionality of the public defense system, and to
revive Judge Kaye’s call for state takeover and the independent public defense commission.
In conversation with Caucus staff NYSDA was asked to prepare an analysis of the jurisdictions served by
its members to better frame the issue of over-representation of people of color in arrests and convictions.
NYSDA prepared this report using information from the Division of Criminal Justice Services (DCJS)
and the US Census Bureau. The report contains a preliminary assessment of arrest and disposition data for
the 17 counties represented by Caucus members, demonstrates racial/ethnic disparities in the arrests and
convictions experienced by people of color in those counties, and illustrates the disproportionate number
of individual people of color who must rely on New York’s dysfunctional, under-resourced, county-by-
county public defense system.
NYSDA hopes that this data will help rekindle the demand, made in 2009 by the Caucus and others,
for creation of a statewide, fully and adequately state-funded public defense system administered
by an Independent Public Defense Commission.
COUNTIES REPRESENTED BY CAUCUS MEMBERS EXAMINED
Each Caucus member's county is examined. Where the district extends beyond one county's border, each
county is presented separately.
When the data are taken collectively, they show that from 2011 thru 2013, there have been over 1
million felony and misdemeanor arrests of non-White individuals within the 17 Caucus Counties.
Of those one million arrests, more than 600,000 were of African-Americans; more than 375,000 were of
Hispanics/Latinos. By comparison, just over 300,000 White individuals were arrested during that same
time period, 50% fewer than African-Americans and 20% fewer than Hispanics/Latinos. These numbers
are striking even more so when you realize the aggregate population of Whites and Non-Whites in these
counties is fairly similar: 7,152,975 White Non-Hispanic and 7,231,283 Non-Whites (2.5M African-
Americans; 3M Hispanics; 1.3M Asians; 300K other race).
Non-White defendants accounted for 78% of the over 240,000 felony level convictions in the 17
Caucus Counties and 75% of the nearly 500,000 misdemeanor level convictions from 2011 thru
2013. White defendants accounted for only 22% of felony level convictions and 25% of the misdemeanor
level convictions. More specifically, there were twice as many felony convictions of African-American
defendants as there were felony convictions of White defendants.

2
These numbers speak to the vast over-representation of defendants of color within New York State’s
criminal justice system. For example, African-Americans account for only 18% of the population in New
York County, however, 49% of felony arrests and 45% of the misdemeanor arrests in New York County
are of African-Americans. In Monroe County, African-Americans account for 12% of the county
population, however, African-American defendants account for 53% of the felony arrests and 46% of the
misdemeanor arrests within that county. Even in Caucus Counties where African-Americans comprise
less than 10% of the overall population, like Ulster (7%) and Suffolk (8%), they still account for more
than one quarter of the felony arrests (Ulster:25%; Suffolk: 29%) and approximately one-fifth of the
misdemeanor arrests (Ulster:16%; Suffolk:25%).
Once African-American and Hispanic/Latino defendants are arrested and funneled into New York State’s
criminal justice system, there is a significant likelihood that they will be convicted. In Onondaga County,
69% of African-American defendants charged with a felony were convicted as were 68% of Hispanic
felony defendants. In Monroe County, the number jumps to 75% for African-American felony defendants
and reaches 79% for Hispanic defendants.
Given the level of poverty amongst constituents within the Caucus districts, sometimes as high as 40%
(Appendix), a significant majority of these felony and misdemeanor defendants will find themselves
represented by overworked, underfunded attorneys working within public defender offices, legal aid
societies and assigned counsel programs.
CAVEATS
The following charts provide an overview of outcomes for defendants of color in the Caucus Counties.
Because the population of many of the Caucus Counties includes only a very small percentage of people
of Asian ethnicity, any evaluation of the arrest and conviction data with regard to that group is difficult or
impossible. In some Caucus Counties, the low raw numbers of people of Asian, and in some instances
Hispanic, ethnicity also make evaluation problematic.
Without much more information, the data here do not allow for meaningful evaluation or comparison, or
even speculation, between counties as to the cause of arrest or conviction rates. Many factors may be at
play: policing and plea bargain policies; political pressures; resources, experience, skill, and practice
culture of both prosecuting and defense attorneys; personality and practices of judges; and others too
numerous to list. What the data here do show is that in each of the Caucus Counties, a disproportionate
number of people of color are processed through the criminal justice system.

3
BRONX COUNTY
NEW YORK STATE SENATE
HONORABLE GUSTAVO RIVERA
NEW YORK STATE ASSEMBLY
HONORABLE CARMEN E. ARROYO HONORABLE VICTOR PICHARDO
HONORABLE MARCOS A. CRESPO HONORABLE JOSE RIVERA
HONORABLE CARL E. HEASTIE HONORABLE LUIS R. SEPULVEDA
From 2011 thru 2013, more than 225,000 non-White individuals were arrested for
misdemeanors and felonies in Bronx County. During that same time period, over 100,000 defendants of
color were convicted of misdemeanors and felonies.
By contrast, White defendants in Bronx County accounted for just over 10,000 felony and
misdemeanor arrests and only slightly more than 5,000 misdemeanor and felony convictions.
When you examine each racial/ethnic group’s county population percentage compared to their
felony and misdemeanor arrest percentage, you can see that while 11% of Bronx County is White, only
4% of arrests for felonies and misdemeanors were of White defendants. Additionally, Hispanic residents
comprised 54% of the county population however Hispanics only represented 49% of the felony and
misdemeanor arrests. Conversely, Black residents comprised 30% of the county population but Black
defendants accounted for 45% of the felony and misdemeanor arrests from 2011 thru 2013 within Bronx
County.
11%
30%
54%
4% 2% 4%
45% 49%
1% 1% 4%
45% 49%
1% 1% 0%
20%
40%
60%
80%
100%
White Black Hispanic Asian/Indian Other/Unk
Bronx County Population & Arrests
by Race/Ethnicity 2011-2013
County Pop. % Fel. Arrest % Misd. Arrest %
4
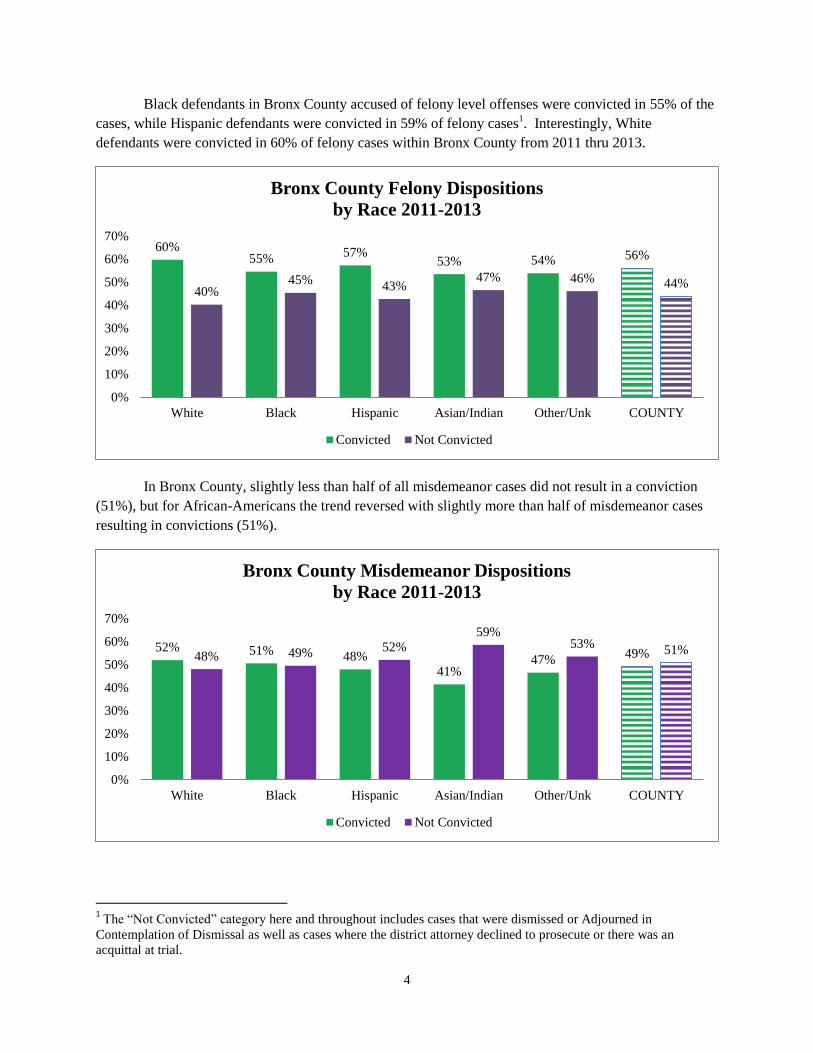
Black defendants in Bronx County accused of felony level offenses were convicted in 55% of the
cases, while Hispanic defendants were convicted in 59% of felony cases1. Interestingly, White
defendants were convicted in 60% of felony cases within Bronx County from 2011 thru 2013.
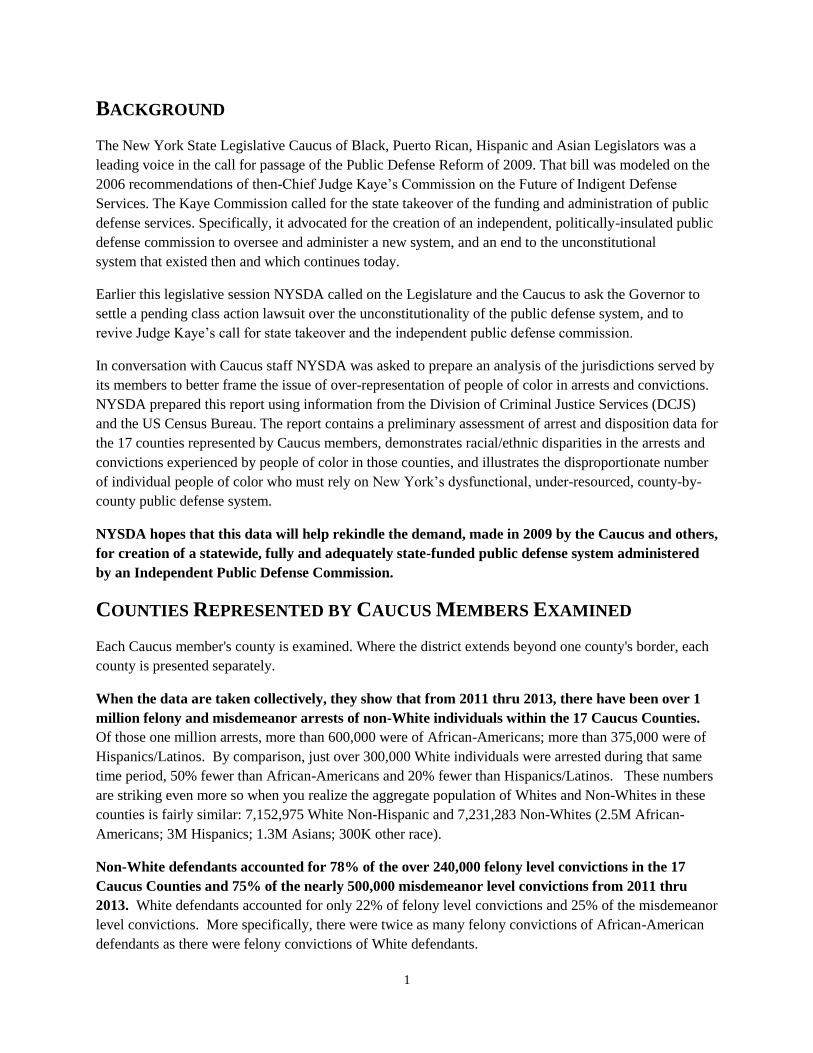
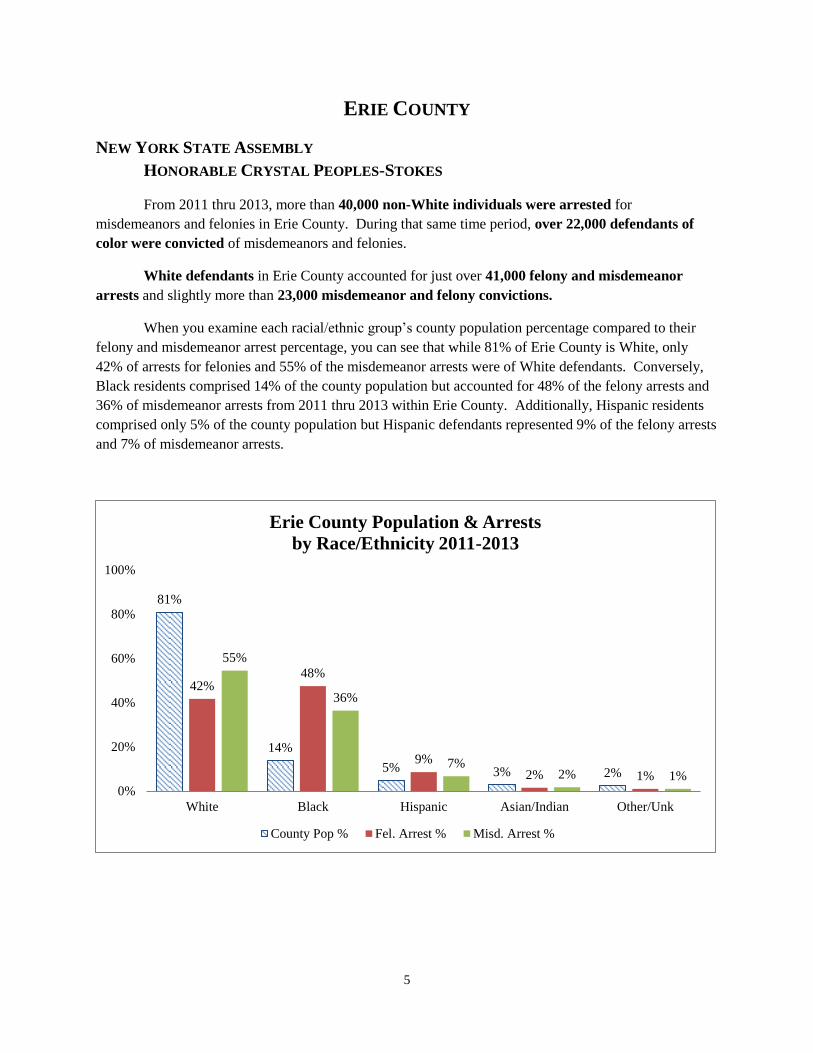
In Bronx County, slightly less than half of all misdemeanor cases did not result in a conviction
(51%), but for African-Americans the trend reversed with slightly more than half of misdemeanor cases
resulting in convictions (51%).
1 The “Not Convicted” category here and throughout includes cases that were dismissed or Adjourned in
Contemplation of Dismissal as well as cases where the district attorney declined to prosecute or there was an
acquittal at trial.
60% 55%
57% 53% 54% 56%
40% 45%
43% 47% 46% 44%
0%
10%
20%
30%
40%
50%
60%
70%
White Black Hispanic Asian/Indian Other/Unk COUNTY
Bronx County Felony Dispositions
by Race 2011-2013
Convicted Not Convicted
52% 51% 48%
41% 47%
49% 48% 49% 52%
59% 53%
51%
0%
10%
20%
30%
40%
50%
60%
70%
White Black Hispanic Asian/Indian Other/Unk COUNTY
Bronx County Misdemeanor Dispositions
by Race 2011-2013
Convicted Not Convicted
5
ERIE COUNTY
NEW YORK STATE ASSEMBLY
HONORABLE CRYSTAL PEOPLES-STOKES
From 2011 thru 2013, more than 40,000 non-White individuals were arrested for
misdemeanors and felonies in Erie County. During that same time period, over 22,000 defendants of
color were convicted of misdemeanors and felonies.
White defendants in Erie County accounted for just over 41,000 felony and misdemeanor
arrests and slightly more than 23,000 misdemeanor and felony convictions.
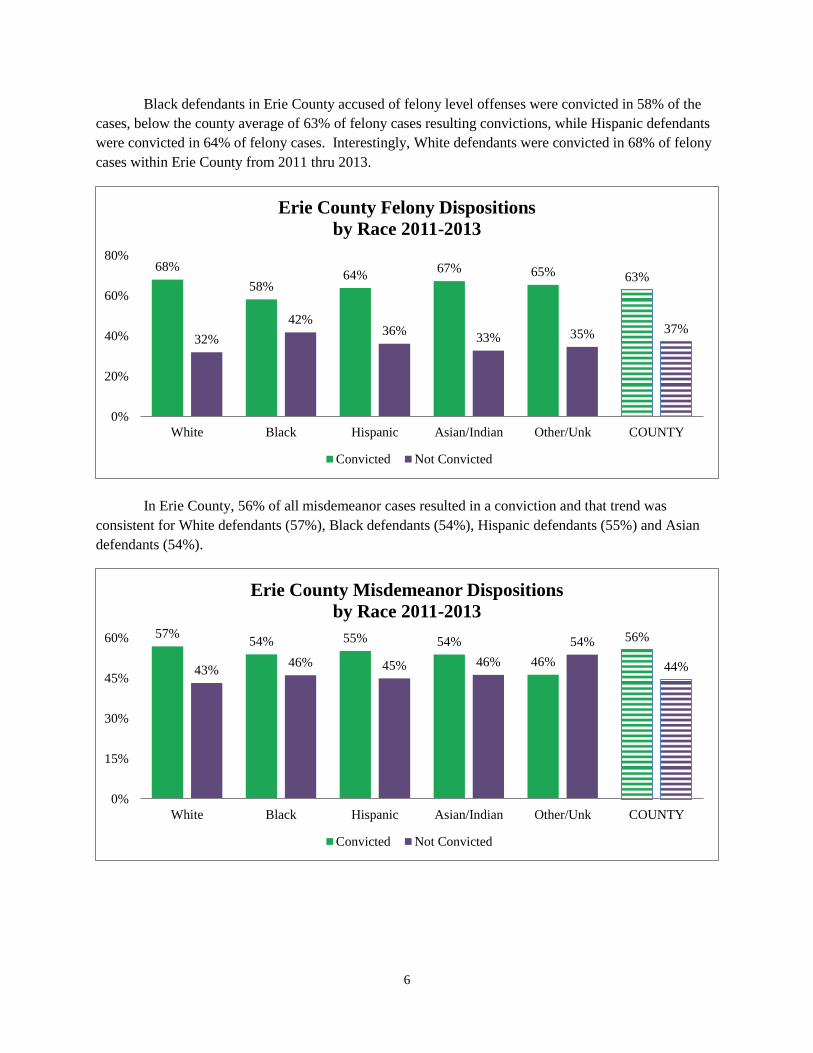
When you examine each racial/ethnic group’s county population percentage compared to their
felony and misdemeanor arrest percentage, you can see that while 81% of Erie County is White, only
42% of arrests for felonies and 55% of the misdemeanor arrests were of White defendants. Conversely,
Black residents comprised 14% of the county population but accounted for 48% of the felony arrests and
36% of misdemeanor arrests from 2011 thru 2013 within Erie County. Additionally, Hispanic residents
comprised only 5% of the county population but Hispanic defendants represented 9% of the felony arrests
and 7% of misdemeanor arrests.
81%
14%
5% 3% 2%
42% 48%
9%
2% 1%
55%
36%
7% 2% 1%
0%
20%
40%
60%
80%
100%
White Black Hispanic Asian/Indian Other/Unk
Erie County Population & Arrests
by Race/Ethnicity 2011-2013
County Pop % Fel. Arrest % Misd. Arrest %
6
Black defendants in Erie County accused of felony level offenses were convicted in 58% of the
cases, below the county average of 63% of felony cases resulting convictions, while Hispanic defendants
were convicted in 64% of felony cases. Interestingly, White defendants were convicted in 68% of felony
cases within Erie County from 2011 thru 2013.
In Erie County, 56% of all misdemeanor cases resulted in a conviction and that trend was
consistent for White defendants (57%), Black defendants (54%), Hispanic defendants (55%) and Asian
defendants (54%).
68%
58% 64%
67% 65% 63%
32%
42% 36%
33% 35% 37%
0%
20%
40%
60%
80%
White Black Hispanic Asian/Indian Other/Unk COUNTY
Erie County Felony Dispositions
by Race 2011-2013
Convicted Not Convicted
57% 54% 55% 54%
46%
56%
43% 46% 45% 46%
54%
44%
0%
15%
30%
45%
60%
White Black Hispanic Asian/Indian Other/Unk COUNTY
Erie County Misdemeanor Dispositions
by Race 2011-2013
Convicted Not Convicted

7
KINGS COUNTY
NEW YORK STATE SENATE
HONORABLE MARTIN MALAVE DILAN HONORABLE KEVIN PARKER
HONORABLE VELMANETTE MONTGOMERY HONORABLE JOHN SAMPSON
NEW YORK STATE ASSEMBLY
HONORABLE KARIM CAMARA HONORABLE FELIX ORTIZ
HONORABLE MARITZA DAVILA HONORABLE N. NICK PERRY
HONORABLE WALTER MOSLEY HONORABLE ANNETTE ROBINSON
From 2011 thru 2013, more than 243,000 non-White individuals were arrested for
misdemeanors and felonies in Kings County. During that same time period, over 112,000 defendants of
color were convicted of misdemeanors and felonies.
By contrast, White defendants in Kings County accounted for just over 33,000 felony and
misdemeanor arrests and just under 15,000 misdemeanor and felony convictions.
When you examine each racial/ethnic group’s county population percentage compared to their
felony and misdemeanor arrest percentage, you can see that while 36% of Kings County is White, only
11% of felony arrests and 12% of misdemeanor arrests were of White defendants. Conversely, Black
residents comprised 32% of the county population but accounted for 63% of the felony arrests and 62% of
misdemeanor arrests from 2011 thru 2013 within Kings County. Of all groups, the Hispanic population
and arrest percentages were most closely aligned: 20% of the county population; 23% of felony arrest;
and 22% of misdemeanor arrests.
36% 32%
20% 11%
2% 11%
63%
23%
3% 1% 12%
62%
22%
3% 1% 0%
20%
40%
60%
80%
100%
White Black Hispanic Asian/Indian Other/Unk
Kings County Population & Arrests
by Race/Ethnicity 2011-2013
County Pop. % Fel. Arrest % Misd. Arrest %

8
Black defendants in Kings County accused of felony level offenses were convicted in 57% of the
cases, a percentage less than both White defendants and Hispanic defendants who were convicted in 61%
of their cases.
The majority of misdemeanor level cases in Kings County do not result in a conviction.
However, both Black and Hispanic defendants were convicted in misdemeanor level cases slightly more
often than White defendants in Kings County from 2011 thru 2013 (44% and 42%, respectively).
61% 57%
61%
50% 46%
58%
39% 43%
39%
50% 54%
42%
0%
10%
20%
30%
40%
50%
60%
70%
White Black Hispanic Asian/Indian Other/Unk COUNTY
Kings County Felony Dispositions
by Race 2011-2013
Convicted Not Convicted
42% 44% 44%
32% 36%
43%
58% 56% 56%
68% 64%
57%
0%
20%
40%
60%
80%
White Black Hispanic Asian/Indian Other/Unk COUNTY
Kings County Misdemeanor Dispositions
by Race 2011-2013
Convicted Not Convicted
9
MONROE COUNTY
NEW YORK STATE ASSEMBLY
HONORABLE DAVID GANTT
From 2011 thru 2013, more than 32,000 non-White individuals were arrested for
misdemeanors and felonies in Monroe County. During that same time period, over 18,000 defendants of
color were convicted of misdemeanors and felonies.
By contrast, White defendants in Monroe County accounted for just over 21,000 felony and
misdemeanor arrests and just over 13,000 misdemeanor and felony convictions.
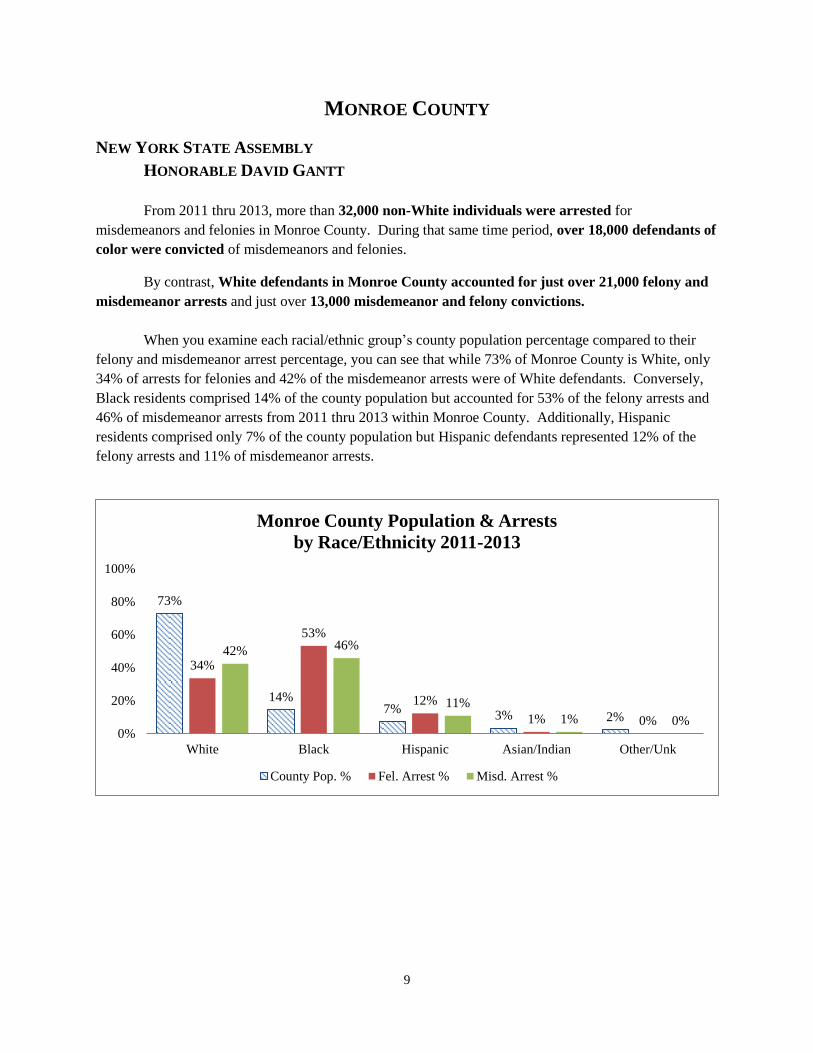
When you examine each racial/ethnic group’s county population percentage compared to their
felony and misdemeanor arrest percentage, you can see that while 73% of Monroe County is White, only
34% of arrests for felonies and 42% of the misdemeanor arrests were of White defendants. Conversely,
Black residents comprised 14% of the county population but accounted for 53% of the felony arrests and
46% of misdemeanor arrests from 2011 thru 2013 within Monroe County. Additionally, Hispanic
residents comprised only 7% of the county population but Hispanic defendants represented 12% of the
felony arrests and 11% of misdemeanor arrests.
73%
14% 7%
3% 2%
34%
53%
12%
1% 0%
42% 46%
11%
1% 0% 0%
20%
40%
60%
80%
100%
White Black Hispanic Asian/Indian Other/Unk
Monroe County Population & Arrests
by Race/Ethnicity 2011-2013
County Pop. % Fel. Arrest % Misd. Arrest %
10
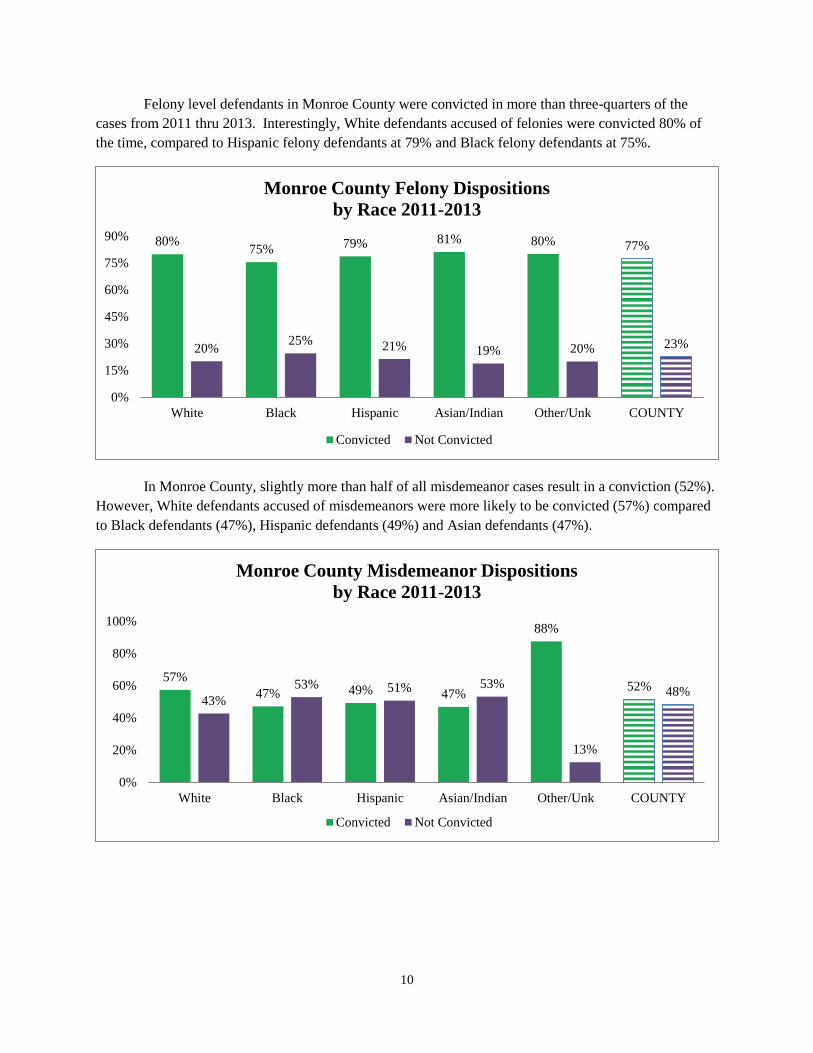
Felony level defendants in Monroe County were convicted in more than three-quarters of the
cases from 2011 thru 2013. Interestingly, White defendants accused of felonies were convicted 80% of
the time, compared to Hispanic felony defendants at 79% and Black felony defendants at 75%.
In Monroe County, slightly more than half of all misdemeanor cases result in a conviction (52%).
However, White defendants accused of misdemeanors were more likely to be convicted (57%) compared
to Black defendants (47%), Hispanic defendants (49%) and Asian defendants (47%).
80% 75% 79% 81% 80% 77%
20% 25% 21% 19% 20% 23%
0%
15%
30%
45%
60%
75%
90%
White Black Hispanic Asian/Indian Other/Unk COUNTY
Monroe County Felony Dispositions
by Race 2011-2013
Convicted Not Convicted
57%
47% 49% 47%
88%
52% 43%
53% 51% 53%
13%
48%
0%
20%
40%
60%
80%
100%
White Black Hispanic Asian/Indian Other/Unk COUNTY
Monroe County Misdemeanor Dispositions
by Race 2011-2013
Convicted Not Convicted

11
NASSAU COUNTY
NEW YORK STATE ASSEMBLY
HONORABLE EARLENE HOOPER
HONORABLE MICHAELLE SOLAGES
From 2011 thru 2013, more than 31,000 non-White individuals were arrested for
misdemeanors and felonies in Nassau County. During that same time period, over 22,000 defendants of
color were convicted of misdemeanors and felonies.
White defendants in Nassau County accounted for just over 21,000 felony and misdemeanor
arrests and just over 15,000 misdemeanor and felony convictions.
When you examine each racial/ethnic group’s county population percentage compared to their
felony and misdemeanor arrest percentage, you can see that while 65% of Nassau County is White, only
34% of arrests for felonies and 44% of the misdemeanor arrests were of White defendants. Additionally,
Hispanic residents comprised 15% of the county population but Hispanic defendants represented only 8%
of the felony and misdemeanor arrests. Conversely, Black residents comprised 11% of the county
population but accounted for 41% of the felony arrests and 31% of misdemeanor arrests from 2011 thru
2013 within Nassau County.
65%
11% 15% 8%
2%
34% 41%
8% 4% 13%
44%
31%
8% 3%
15%
0%
20%
40%
60%
80%
100%
White Black Hispanic Asian/Indian Other/Unk
Nassau County Population & Arrests
by Race/Ethnicity 2011-2013
County Pop. % Fel. Arrest % Misd. Arrest %

12
Felony level defendants in Nassau County were convicted in 85% of cases across all racial/ethnic
categories. However, Black defendants were convicted in 86% of felony level cases and Hispanic
defendants were convicted in 88% of felony level cases.
In Nassau County, 65% of all misdemeanor cases result in a conviction. However, Hispanic
defendants accused of misdemeanors were convicted in 74% of cases, while White and Black defendants
were convicted in 65% of the misdemeanor cases.
82% 86% 88% 83% 85% 85%
18% 14% 12% 17% 15% 15%
0%
20%
40%
60%
80%
100%
White Black Hispanic Asian/Indian Other/Unk COUNTY
Nassau County Felony Dispositions
by Race 2011-2013
Convicted Not Convicted
65% 65%
74%
50%
62% 65%
35% 35%
26%
50%
38% 35%
0%
20%
40%
60%
80%
White Black Hispanic Asian/Indian Other/Unk COUNTY
Nassau County Misdemeanor Dispositions
by Race 2011-2013
Convicted Not Convicted

13
NEW YORK COUNTY
NEW YORK STATE SENATE
HONORABLE ADRIANO ESPAILLAT HONORABLE JOSE SERRANO
HONORABLE BILL PERKINS
NEW YORK STATE ASSEMBLY
HONORABLE HERMAN FARRELL, JR. HONORABLE GABRIELA ROSA
HONORABLE ROBERT RODRIGUEZ HONORABLE KEITH WRIGHT
From 2011 thru 2013, more than 218,000 non-White individuals were arrested for
misdemeanors and felonies in New York County. During that same time period, over 127,000
defendants of color were convicted of misdemeanors and felonies.
By contrast, White defendants in New York County accounted for over 37,000 felony and
misdemeanor arrests and just over 18,000 misdemeanor and felony convictions.
When you examine each racial/ethnic group’s county population percentage compared to their
felony and misdemeanor arrest percentage, you can see that while 48% of New York County is White,
only 12% of arrests for felonies and 16% of the misdemeanor arrests were of White defendants.
Conversely, Black residents comprised 13% of the county population but accounted for 49% of the felony
arrests and 45% of misdemeanor arrests from 2011 thru 2013 within New York County. Additionally,
Hispanic residents comprised 26% of the county population but Hispanic defendants represented 35% of
the felony arrests and 34% of misdemeanor arrests.
48%
13%
26%
11% 3%
12%
49%
35%
3% 1%
16%
45%
34%
4% 1% 0%
20%
40%
60%
80%
100%
White Black Hispanic Asian/Indian Other/Unk
New York County Population & Arrests
by Race/Ethnicity 2011-2013
County Pop. % Fel. Arrest % Misd. Arrest %
14
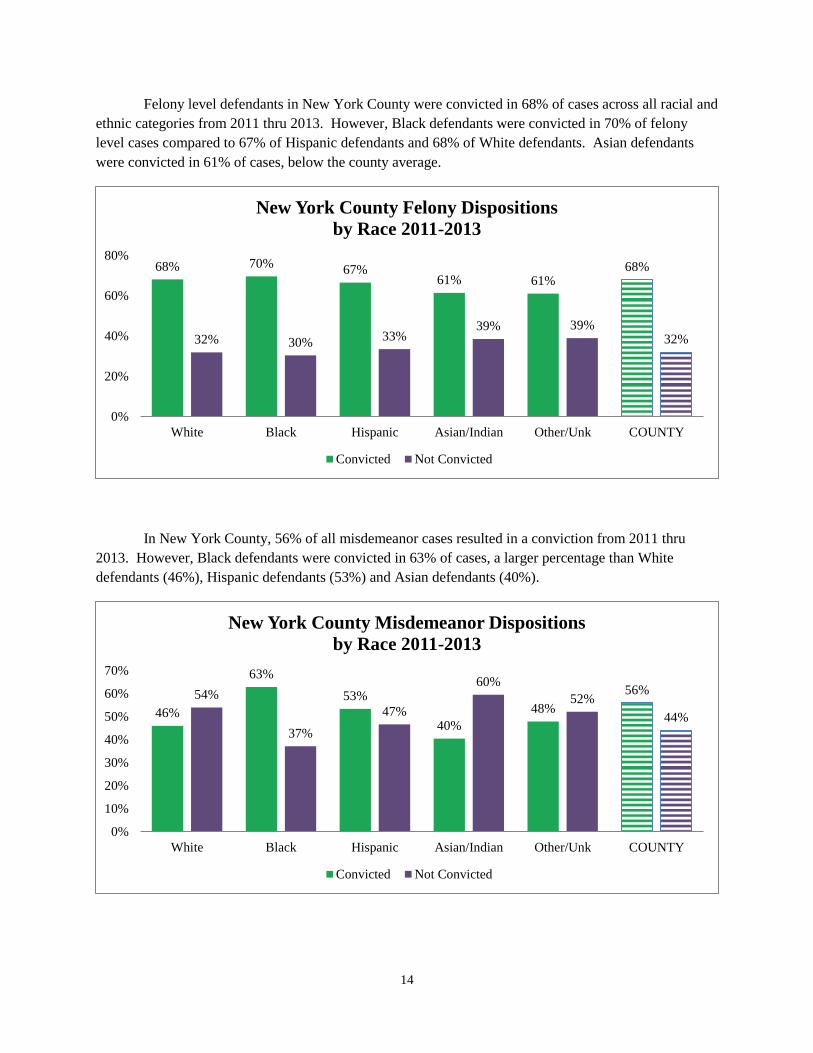
Felony level defendants in New York County were convicted in 68% of cases across all racial and
ethnic categories from 2011 thru 2013. However, Black defendants were convicted in 70% of felony
level cases compared to 67% of Hispanic defendants and 68% of White defendants. Asian defendants
were convicted in 61% of cases, below the county average.
In New York County, 56% of all misdemeanor cases resulted in a conviction from 2011 thru
2013. However, Black defendants were convicted in 63% of cases, a larger percentage than White
defendants (46%), Hispanic defendants (53%) and Asian defendants (40%).
68% 70% 67%
61% 61% 68%
32% 30% 33%
39% 39% 32%
0%
20%
40%
60%
80%
White Black Hispanic Asian/Indian Other/Unk COUNTY
New York County Felony Dispositions
by Race 2011-2013
Convicted Not Convicted
46%
63%
53%
40%
48%
56% 54%
37%
47%
60%
52%
44%
0%
10%
20%
30%
40%
50%
60%
70%
White Black Hispanic Asian/Indian Other/Unk COUNTY
New York County Misdemeanor Dispositions
by Race 2011-2013
Convicted Not Convicted
15
ONONDAGA COUNTY
NEW YORK STATE ASSEMBLY
HONORABLE SAMUEL ROBERTS
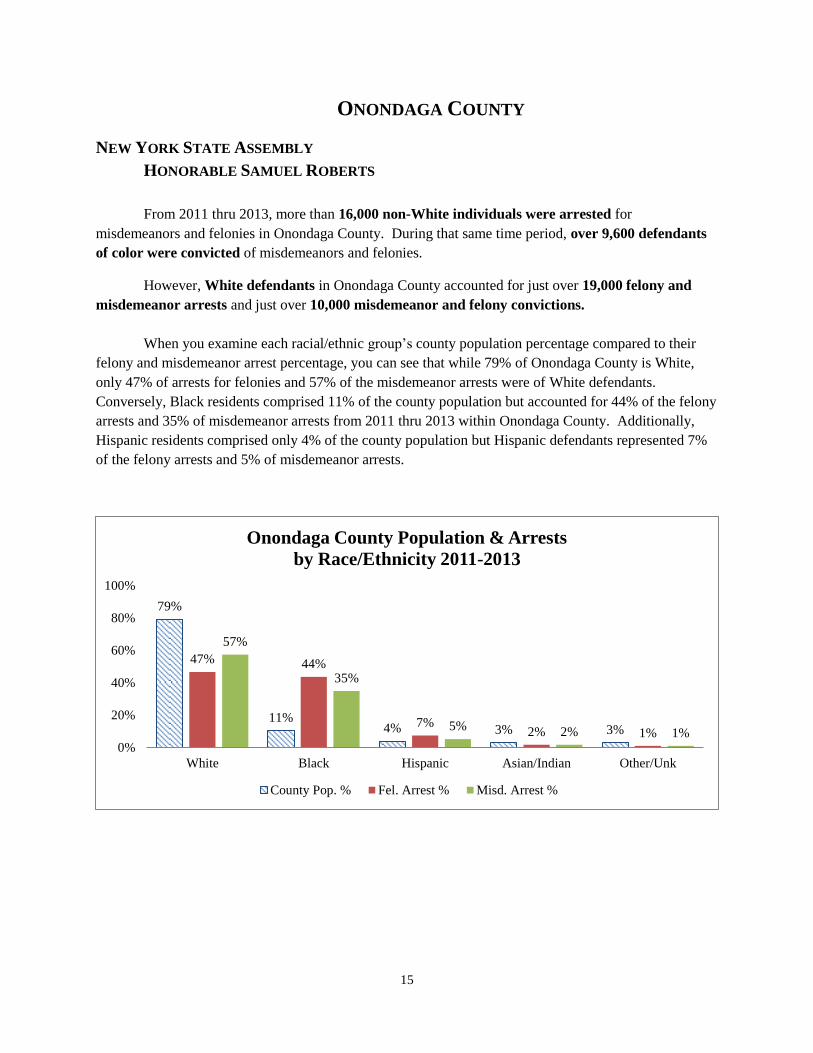
From 2011 thru 2013, more than 16,000 non-White individuals were arrested for
misdemeanors and felonies in Onondaga County. During that same time period, over 9,600 defendants
of color were convicted of misdemeanors and felonies.
However, White defendants in Onondaga County accounted for just over 19,000 felony and
misdemeanor arrests and just over 10,000 misdemeanor and felony convictions.
When you examine each racial/ethnic group’s county population percentage compared to their
felony and misdemeanor arrest percentage, you can see that while 79% of Onondaga County is White,
only 47% of arrests for felonies and 57% of the misdemeanor arrests were of White defendants.
Conversely, Black residents comprised 11% of the county population but accounted for 44% of the felony
arrests and 35% of misdemeanor arrests from 2011 thru 2013 within Onondaga County. Additionally,
Hispanic residents comprised only 4% of the county population but Hispanic defendants represented 7%
of the felony arrests and 5% of misdemeanor arrests.
79%
11% 4% 3% 3%
47% 44%
7% 2% 1%
57%
35%
5% 2% 1% 0%
20%
40%
60%
80%
100%
White Black Hispanic Asian/Indian Other/Unk
Onondaga County Population & Arrests
by Race/Ethnicity 2011-2013
County Pop. % Fel. Arrest % Misd. Arrest %

16
Felony level defendants in Onondaga County were convicted in 68% of cases across all racial and
ethnic categories from 2011 thru 2013. Interestingly, it was Asian defendants (71%) with the highest
percentage rate, followed by Black defendants (69%) and Hispanic defendants (68%).
In Onondaga County, 56% of all misdemeanor cases resulted in a conviction from 2011 thru
2013. Again, Asian defendants (60%) had a higher conviction percentage than White defendants (56%),
Black defendants (55%) and Hispanic defendants (54%).
66% 69% 68% 71%
57%
68%
34% 31% 32% 29%
43%
32%
0%
20%
40%
60%
80%
White Black Hispanic Asian/Indian Other/Unk COUNTY
Onondaga County Felony Dispositions
by Race 2011-2013
Convicted Not Convicted
56% 55% 54% 60%
50% 56%
44% 45% 46% 40%
50% 44%
0%
10%
20%
30%
40%
50%
60%
70%
White Black Hispanic Asian/Indian Other/Unk COUNTY
Onondaga County Misdemeanor Dispositions
by Race 2011-2013
Convicted Not Convicted

17
QUEENS COUNTY
NEW YORK STATE SENATE
HONORABLE JOSE PERALTA HONORABLE MALCOLM SMITH
HONORABLE JAMES SANDERS, JR.
NEW YORK STATE ASSEMBLY
HONORABLE JEFFRION AUBRY HONORABLE FRANCISCO MOYA
HONORABLE BARBARA CLARK HONORABLE NILY ROZIC
HONORABLE VIVIAN COOK HONORABLE WILLIAM SCARBOROUGH
HONORABLE RON KIM HONORABLE MICHELE TITUS
From 2011 thru 2013, more than 149,000 non-White individuals were arrested for
misdemeanors and felonies in Queens County. During that same time period, over 77,000 defendants of
color were convicted of misdemeanors and felonies.
By contrast, White defendants in Queens County accounted for just over 26,000 felony and
misdemeanor arrests and over 13,000 misdemeanor and felony convictions.
When you examine each racial/ethnic group’s county population percentage compared to their
felony and misdemeanor arrest percentage, you can see that while 28% of Queens County is White, only
13% of arrests for felonies and 16% of the misdemeanor arrests were of White defendants. Conversely,
Black residents comprised 18% of the county population but accounted for 43% of the felony arrests and
36% of misdemeanor arrests from 2011 thru 2013 within Queens County. Additionally, Hispanic
residents comprised only 28% of the county population but Hispanic defendants represented 32% of the
felony arrests and 25% of misdemeanor arrests.
28% 18%
28% 23%
4% 13%
43%
32%
11% 1%
16%
36% 35%
12% 2%
0%
20%
40%
60%
80%
100%
White Black Hispanic Asian/Indian Other/Unk
Queens County Population & Arrests
by Race/Ethnicity 2011-2013
County Pop. % Fel. Arrest % Misd. Arrest %

18
Felony level defendants in Queens County were convicted in 67% of cases across all racial and
ethnic categories from 2011 thru 2013 and that trend was consistent for White defendants (67%), Black
defendants (68%) and Hispanic defendants (68%). Asian defendants (62%) in felony level cases had a
slightly lower conviction percentage.
Fewer than half of all misdemeanor level cases resulted in conviction in Queens County from
2011 thru 2013. However, Black defendants were convicted in 51% of misdemeanor cases, the only
racial/ethnic group to experience conviction in more than half of the cases.
67% 68% 68% 62%
68% 67%
33% 32% 32% 38%
32% 33%
0%
20%
40%
60%
80%
White Black Hispanic Asian/Indian Other/Unk COUNTY
Queens County Felony Dispositions
by Race 2011-2013
Convicted Not Convicted
47% 51%
46% 42% 44%
48% 53%
49% 54%
58% 56% 52%
0%
10%
20%
30%
40%
50%
60%
70%
White Black Hispanic Asian/Indian Other/Unk COUNTY
Queens County Misdemeanor Dispositions
by Race 2011-2013
Convicted Not Convicted

19
SUFFOLK COUNTY
NEW YORK STATE ASSEMBLY
HONORABLE PHIL RAMOS
From 2011 thru 2013, more than 33,000 non-White individuals were arrested for
misdemeanors and felonies in Suffolk County. During that same time period, over 23,000 defendants of
color were convicted of misdemeanors and felonies.
However, White defendants in Suffolk County accounted for just over 42,000 felony and
misdemeanor arrests and over 29,000 misdemeanor and felony convictions.
When you examine each racial/ethnic group’s county population percentage compared to their
felony and misdemeanor arrest percentage, you can see that while 72% of Suffolk County is White, only
48% of arrests for felonies and 58% of the misdemeanor arrests were of White defendants. Conversely,
Black residents comprised 7% of the county population but accounted for 29% of the felony arrests and
20% of misdemeanor arrests from 2011 thru 2013 within Suffolk County. Additionally, Hispanic
residents comprised only 17% of the county population but Hispanic defendants represented 21% of the
felony arrests and 20% of misdemeanor arrests.
72%
7%
17%
4% 2%
48%
29% 21%
2% 1%
58%
20% 20%
1% 1% 0%
20%
40%
60%
80%
100%
White Black Hispanic Asian/Indian Other/Unk
Suffolk County Population & Arrests
by Race/Ethnicity 2011-2013
County Pop. % Fel. Arrest % Misd. Arrest %
20
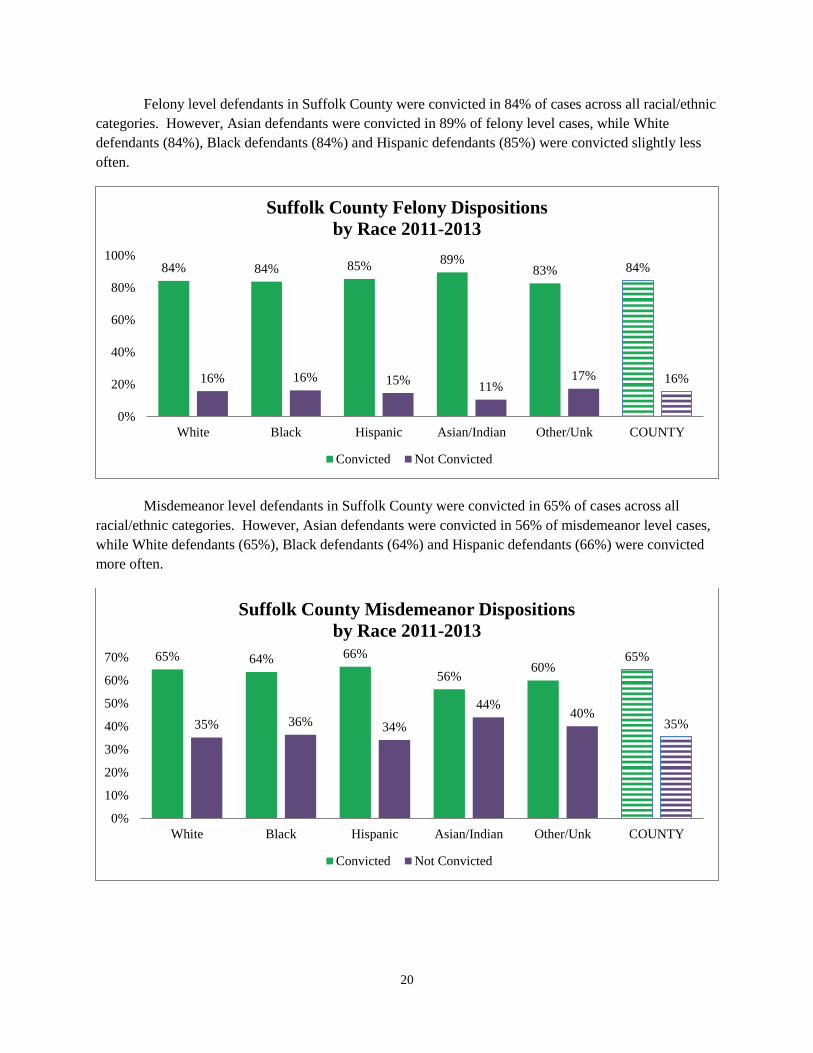
Felony level defendants in Suffolk County were convicted in 84% of cases across all racial/ethnic
categories. However, Asian defendants were convicted in 89% of felony level cases, while White
defendants (84%), Black defendants (84%) and Hispanic defendants (85%) were convicted slightly less
often.
Misdemeanor level defendants in Suffolk County were convicted in 65% of cases across all
racial/ethnic categories. However, Asian defendants were convicted in 56% of misdemeanor level cases,
while White defendants (65%), Black defendants (64%) and Hispanic defendants (66%) were convicted
more often.
84% 84% 85% 89%
83% 84%
16% 16% 15% 11%
17% 16%
0%
20%
40%
60%
80%
100%
White Black Hispanic Asian/Indian Other/Unk COUNTY
Suffolk County Felony Dispositions
by Race 2011-2013
Convicted Not Convicted
65% 64% 66%
56% 60%
65%
35% 36% 34%
44% 40%
35%
0%
10%
20%
30%
40%
50%
60%
70%
White Black Hispanic Asian/Indian Other/Unk COUNTY
Suffolk County Misdemeanor Dispositions
by Race 2011-2013
Convicted Not Convicted
21
WESTCHESTER COUNTY
NEW YORK STATE SENATE
HONORABLE RUTH HASSELL-THOMPSON
HONORABLE ANDREA STEWART-COUSINS
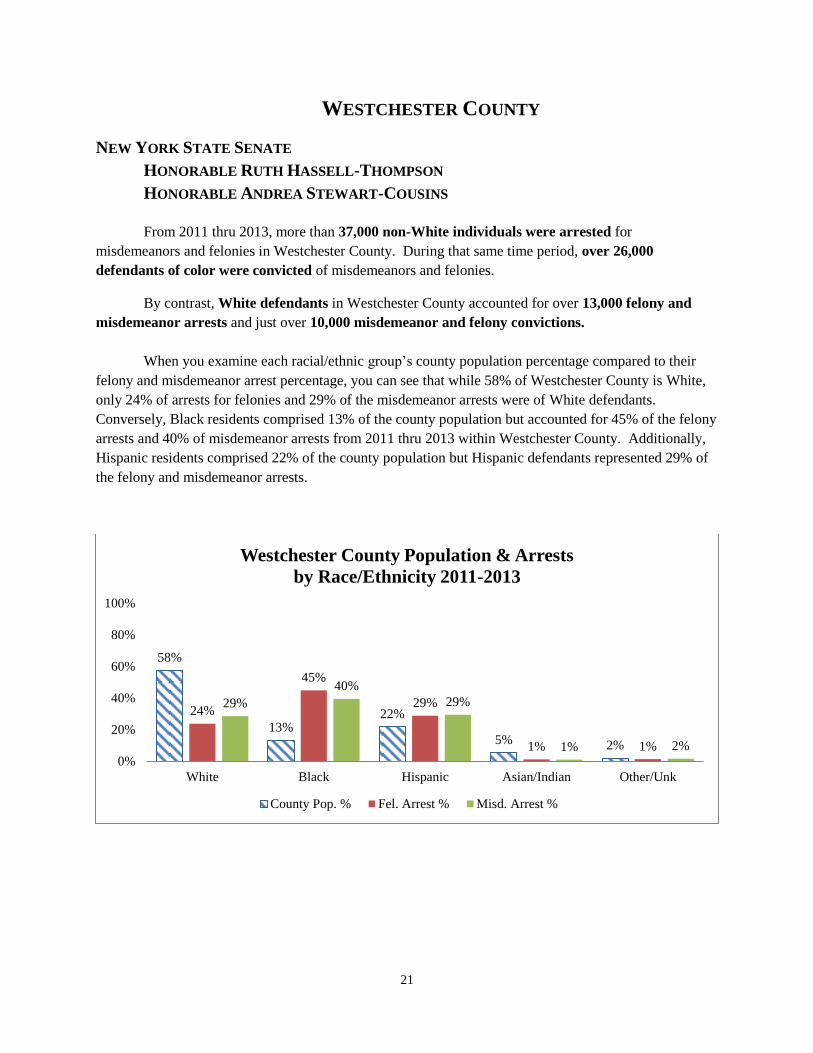
From 2011 thru 2013, more than 37,000 non-White individuals were arrested for
misdemeanors and felonies in Westchester County. During that same time period, over 26,000
defendants of color were convicted of misdemeanors and felonies.
By contrast, White defendants in Westchester County accounted for over 13,000 felony and
misdemeanor arrests and just over 10,000 misdemeanor and felony convictions.
When you examine each racial/ethnic group’s county population percentage compared to their
felony and misdemeanor arrest percentage, you can see that while 58% of Westchester County is White,
only 24% of arrests for felonies and 29% of the misdemeanor arrests were of White defendants.
Conversely, Black residents comprised 13% of the county population but accounted for 45% of the felony
arrests and 40% of misdemeanor arrests from 2011 thru 2013 within Westchester County. Additionally,
Hispanic residents comprised 22% of the county population but Hispanic defendants represented 29% of
the felony and misdemeanor arrests.
58%
13% 22%
5% 2%
24%
45%
29%
1% 1%
29%
40%
29%
1% 2%
0%
20%
40%
60%
80%
100%
White Black Hispanic Asian/Indian Other/Unk
Westchester County Population & Arrests
by Race/Ethnicity 2011-2013
County Pop. % Fel. Arrest % Misd. Arrest %

22
Felony level defendants in Westchester County were convicted in 81% of cases across all
racial/ethnic categories. Interestingly, Black defendants were convicted less often (79%), while White
defendants (83%), Hispanic defendants (83%) and Asian defendants (82%) were convicted slightly more
often.
Misdemeanor level defendants in Westchester County were convicted in 72% of cases across all
racial/ethnic categories. However, Asian defendants were convicted in 63% of misdemeanor level cases,
while White defendants (72%), Black defendants (71%) and Hispanic defendants (72%) were convicted
more often.
83% 79% 83% 82%
78% 81%
17% 21% 17% 18%
22% 19%
0%
15%
30%
45%
60%
75%
90%
White Black Hispanic Asian/Indian Other/Unk COUNTY
Westchester County Felony Dispositions
by Race 2011-2013
Convicted Not Convicted
72% 71% 72%
63% 71% 72%
28% 29% 28%
37% 29% 28%
0%
20%
40%
60%
80%
White Black Hispanic Asian/Indian Other/Unk COUNTY
Westchester County Misdemeanor Dispositions
by Race 2011-2013
Convicted Not Convicted

23
ALBANY, COLUMBIA, DELAWARE, GREENE,
OTSEGO, SCHOHARIE & ULSTER COUNTIES
NEW YORK STATE ASSEMBLY
HONORABLE PETER LOPEZ
From 2011 thru 2013, more than 20,000 non-White individuals were arrested for
misdemeanors and felonies in the seven counties within the NYS 102nd
Assembly District. During that
same time period, over 12,000 defendants of color were convicted of misdemeanors and felonies.
There were over 38,000 arrests of White Defendants in both misdemeanor and felony cases
from 2011 thru 2013 in the NYS 102nd
Assembly District, while over 24,000 White defendants were
convicted of misdemeanors and felonies.
ALBANY COUNTY
There were over 12,000 arrests of non-White individuals for misdemeanors and felonies in
Albany County from 2011 thru 2013, while just over 13,000 White defendants were arrested during the
same time period. However, there are only approximately 73,000 non-White residents in Albany County
compared to more than 230,000 White residents.
76%
12% 5% 5% 2%
41% 46%
9% 1% 2%
56%
34%
7% 1% 2%
0%
20%
40%
60%
80%
100%
White Black Hispanic Asian/Indian Other/Unk
Albany County Population & Arrests
by Race/Ethnicity 2011-2013
County Pop. % Fel. Arrest % Misd. Arrest %
24
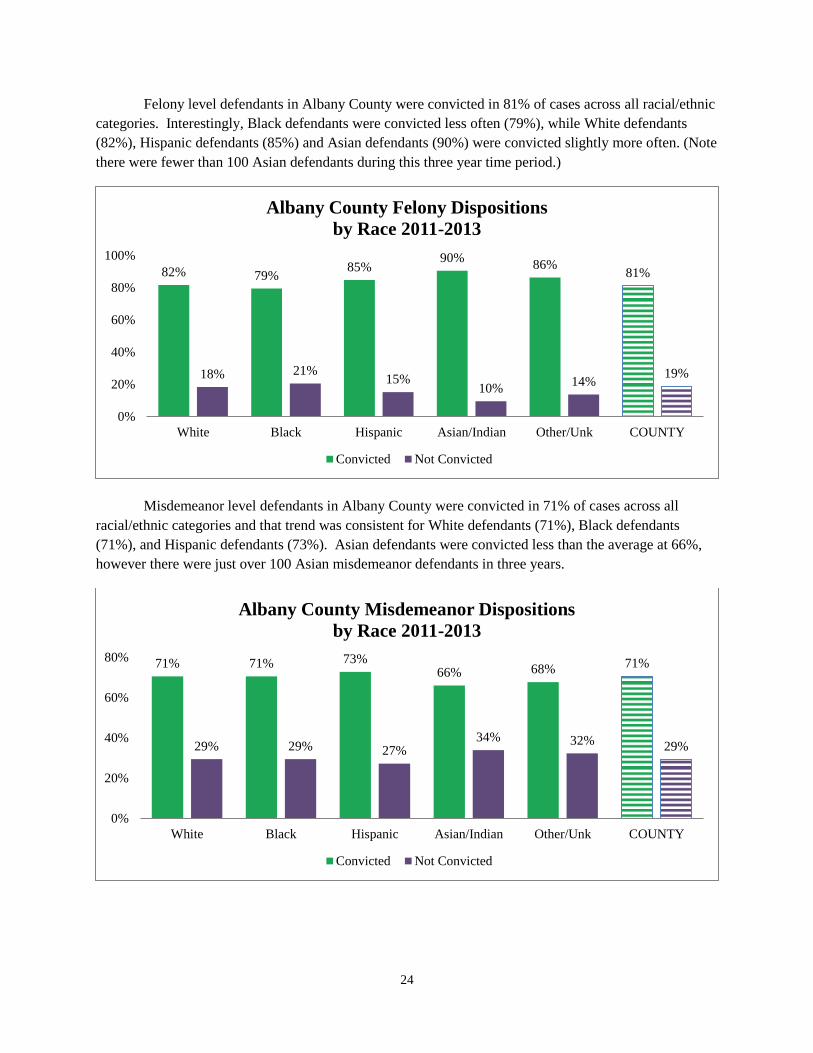
Felony level defendants in Albany County were convicted in 81% of cases across all racial/ethnic
categories. Interestingly, Black defendants were convicted less often (79%), while White defendants
(82%), Hispanic defendants (85%) and Asian defendants (90%) were convicted slightly more often. (Note
there were fewer than 100 Asian defendants during this three year time period.)
Misdemeanor level defendants in Albany County were convicted in 71% of cases across all
racial/ethnic categories and that trend was consistent for White defendants (71%), Black defendants
(71%), and Hispanic defendants (73%). Asian defendants were convicted less than the average at 66%,
however there were just over 100 Asian misdemeanor defendants in three years.
82% 79% 85%
90% 86%
81%
18% 21% 15%
10% 14%
19%
0%
20%
40%
60%
80%
100%
White Black Hispanic Asian/Indian Other/Unk COUNTY
Albany County Felony Dispositions
by Race 2011-2013
Convicted Not Convicted
71% 71% 73% 66% 68% 71%
29% 29% 27% 34% 32% 29%
0%
20%
40%
60%
80%
White Black Hispanic Asian/Indian Other/Unk COUNTY
Albany County Misdemeanor Dispositions
by Race 2011-2013
Convicted Not Convicted
25
COLUMBIA COUNTY
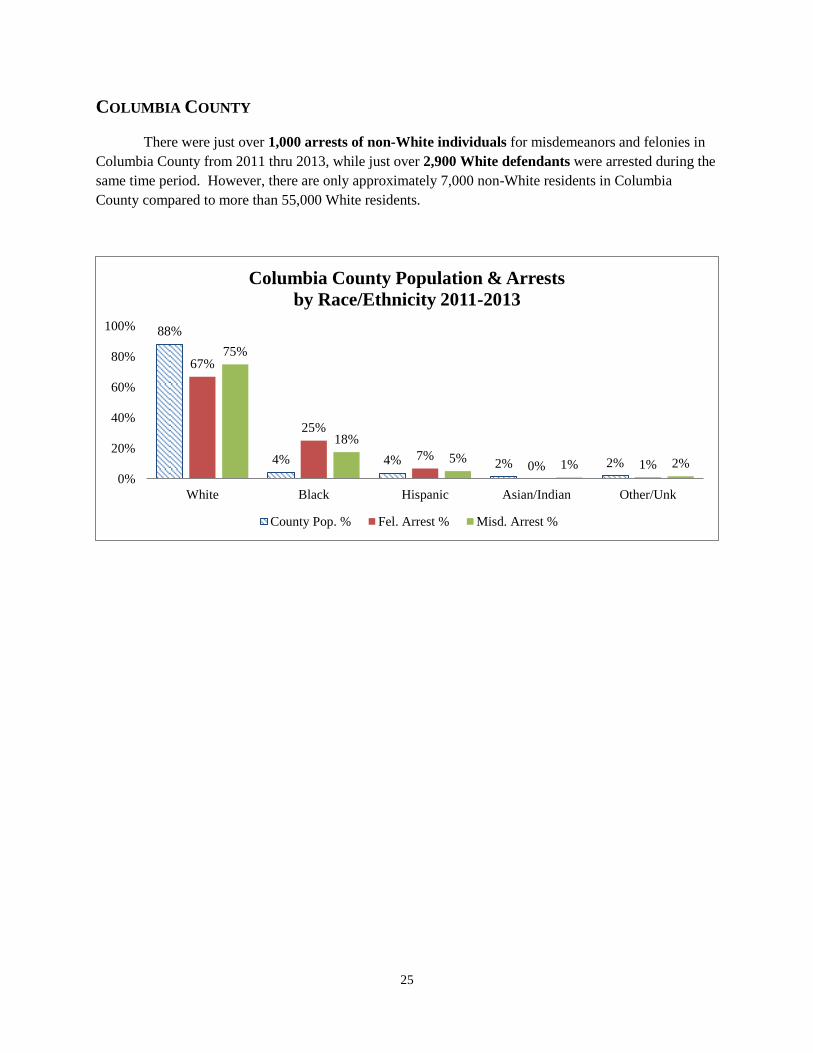
There were just over 1,000 arrests of non-White individuals for misdemeanors and felonies in
Columbia County from 2011 thru 2013, while just over 2,900 White defendants were arrested during the
same time period. However, there are only approximately 7,000 non-White residents in Columbia
County compared to more than 55,000 White residents.
88%
4% 4% 2% 2%
67%
25%
7% 0% 1%
75%
18%
5% 1% 2%
0%
20%
40%
60%
80%
100%
White Black Hispanic Asian/Indian Other/Unk
Columbia County Population & Arrests
by Race/Ethnicity 2011-2013
County Pop. % Fel. Arrest % Misd. Arrest %

26
Felony level defendants in Columbia County were convicted in 80% of cases across all
racial/ethnic categories. Interestingly, Black defendants were convicted less often (72%), while White
defendants (84%) were convicted slightly more often. (Note: the small number of both Hispanic and
Asian defendants makes any comparison of this data problematic.)
Misdemeanor level defendants in Columbia County were convicted in 68% of cases across all
racial/ethnic categories, with White defendants convicted in 70% of their cases and Black defendants
convicted in 67% of their cases from 2011 thru 2013. (Note: the small number of both Hispanic and
Asian defendants makes any comparison of this data problematic.)
84%
72%
81%
67%
38%
80%
16%
28%
19%
33%
63%
20%
0%
10%
20%
30%
40%
50%
60%
70%
80%
90%
White Black Hispanic Asian/Indian Other/Unk COUNTY
Columbia County Felony Dispositions
by Race 2011-2013
Convicted Not Convicted
70% 65% 67%
71% 66% 68%
30% 35% 33%
29% 34% 32%
0%
20%
40%
60%
80%
White Black Hispanic Asian/Indian Other/Unk COUNTY
Columbia County Misdemeanor Dispositions
by Race 2011-2013
Convicted Not Convicted

27
DELAWARE COUNTY
There were just over 300 arrests of non-White individuals for misdemeanors and felonies in
Delaware County from 2011 thru 2013, while just over 2,700 White defendants were arrested during the
same time period. However, there are only approximately 3,200 non-White residents in Delaware County
compared to more than 44,000 White residents.
93%
2% 3% 1% 1%
87%
6% 5% 1% 1%
91%
4% 4% 1% 1% 0%
20%
40%
60%
80%
100%
White Black Hispanic Asian/Indian Other/Unk
Delaware County Population & Arrests
by Race/Ethnicity 2011-2013
County Pop. % Fel. Arrest % Misd. Arrest %
28
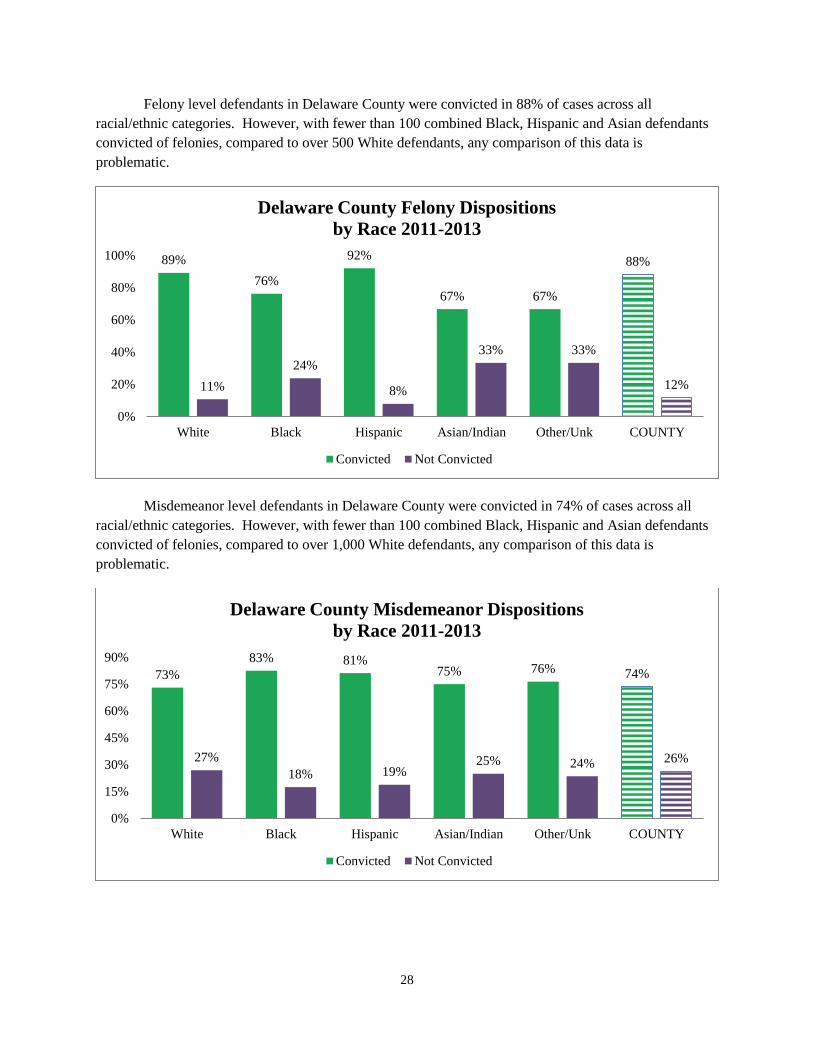
Felony level defendants in Delaware County were convicted in 88% of cases across all
racial/ethnic categories. However, with fewer than 100 combined Black, Hispanic and Asian defendants
convicted of felonies, compared to over 500 White defendants, any comparison of this data is
problematic.
Misdemeanor level defendants in Delaware County were convicted in 74% of cases across all
racial/ethnic categories. However, with fewer than 100 combined Black, Hispanic and Asian defendants
convicted of felonies, compared to over 1,000 White defendants, any comparison of this data is
problematic.
89%
76%
92%
67% 67%
88%
11%
24%
8%
33% 33%
12%
0%
20%
40%
60%
80%
100%
White Black Hispanic Asian/Indian Other/Unk COUNTY
Delaware County Felony Dispositions
by Race 2011-2013
Convicted Not Convicted
73%
83% 81% 75% 76% 74%
27%
18% 19% 25% 24% 26%
0%
15%
30%
45%
60%
75%
90%
White Black Hispanic Asian/Indian Other/Unk COUNTY
Delaware County Misdemeanor Dispositions
by Race 2011-2013
Convicted Not Convicted

29
GREENE COUNTY
There were over 700 arrests of non-White individuals for misdemeanors and felonies in Greene
County from 2011 thru 2013, while over 3,000 White defendants were arrested during the same time
period. However, there are only approximately 6,300 non-White residents in Greene County compared to
more than 42,000 White residents.
87%
6% 5% 1% 2%
78%
13% 7%
0% 1%
82%
11% 5%
0% 2%
0%
20%
40%
60%
80%
100%
White Black Hispanic Asian/Indian Other/Unk
Greene County Population & Arrests
by Race/Ethnicity 2011-2013
County Pop. % Fel. Arrest % Misd. Arrest %
30
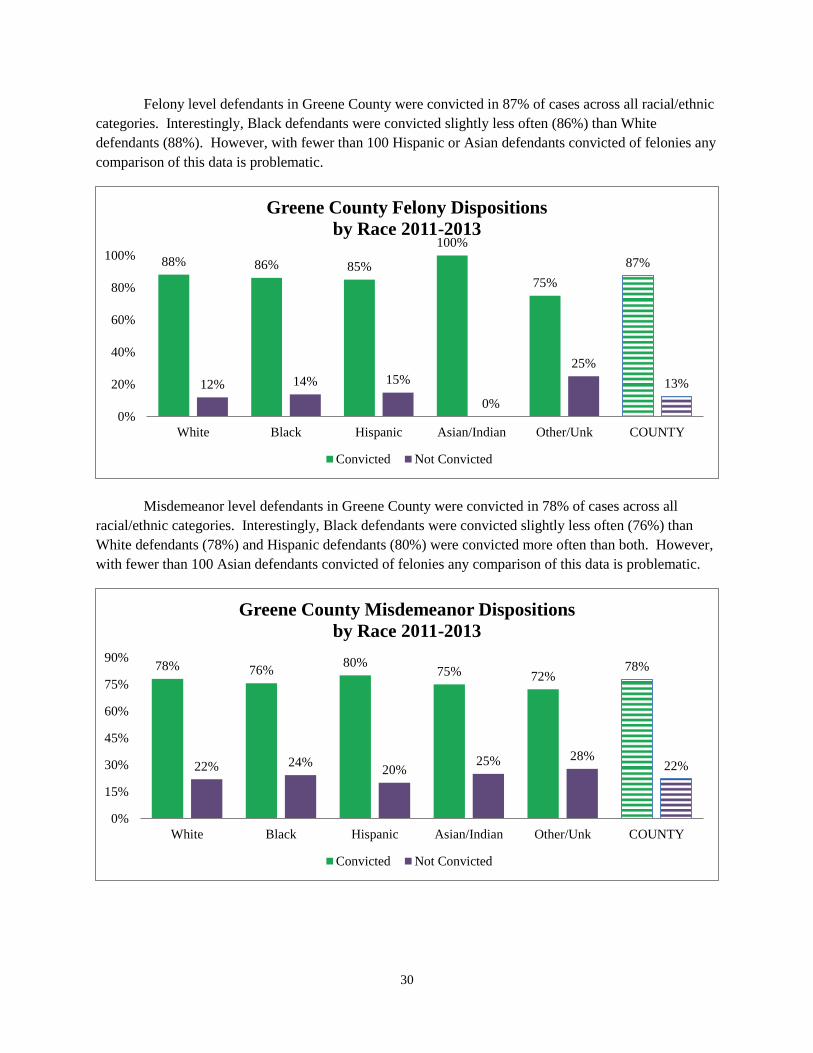
Felony level defendants in Greene County were convicted in 87% of cases across all racial/ethnic
categories. Interestingly, Black defendants were convicted slightly less often (86%) than White
defendants (88%). However, with fewer than 100 Hispanic or Asian defendants convicted of felonies any
comparison of this data is problematic.
Misdemeanor level defendants in Greene County were convicted in 78% of cases across all
racial/ethnic categories. Interestingly, Black defendants were convicted slightly less often (76%) than
White defendants (78%) and Hispanic defendants (80%) were convicted more often than both. However,
with fewer than 100 Asian defendants convicted of felonies any comparison of this data is problematic.
88% 86% 85%
100%
75%
87%
12% 14% 15%
0%
25%
13%
0%
20%
40%
60%
80%
100%
White Black Hispanic Asian/Indian Other/Unk COUNTY
Greene County Felony Dispositions
by Race 2011-2013
Convicted Not Convicted
78% 76% 80%
75% 72% 78%
22% 24% 20%
25% 28% 22%
0%
15%
30%
45%
60%
75%
90%
White Black Hispanic Asian/Indian Other/Unk COUNTY
Greene County Misdemeanor Dispositions
by Race 2011-2013
Convicted Not Convicted

31
OTSEGO COUNTY
There were just over 500 arrests of non-White individuals for misdemeanors and felonies in
Otsego County from 2011 thru 2013, while just over 3,900 White defendants were arrested during the
same time period. However, there are only approximately 4,500 non-White residents in Otsego County
compared to more than 57,000 White residents.
93%
2% 3% 1% 1%
86%
8% 4%
0% 1%
89%
6% 4% 1% 1% 0%
20%
40%
60%
80%
100%
White Black Hispanic Asian/Indian Other/Unk
Otsego County Population & Arrests
by Race/Ethnicity 2011-2013
County Pop. % Fel. Arrest % Misd. Arrest %
32
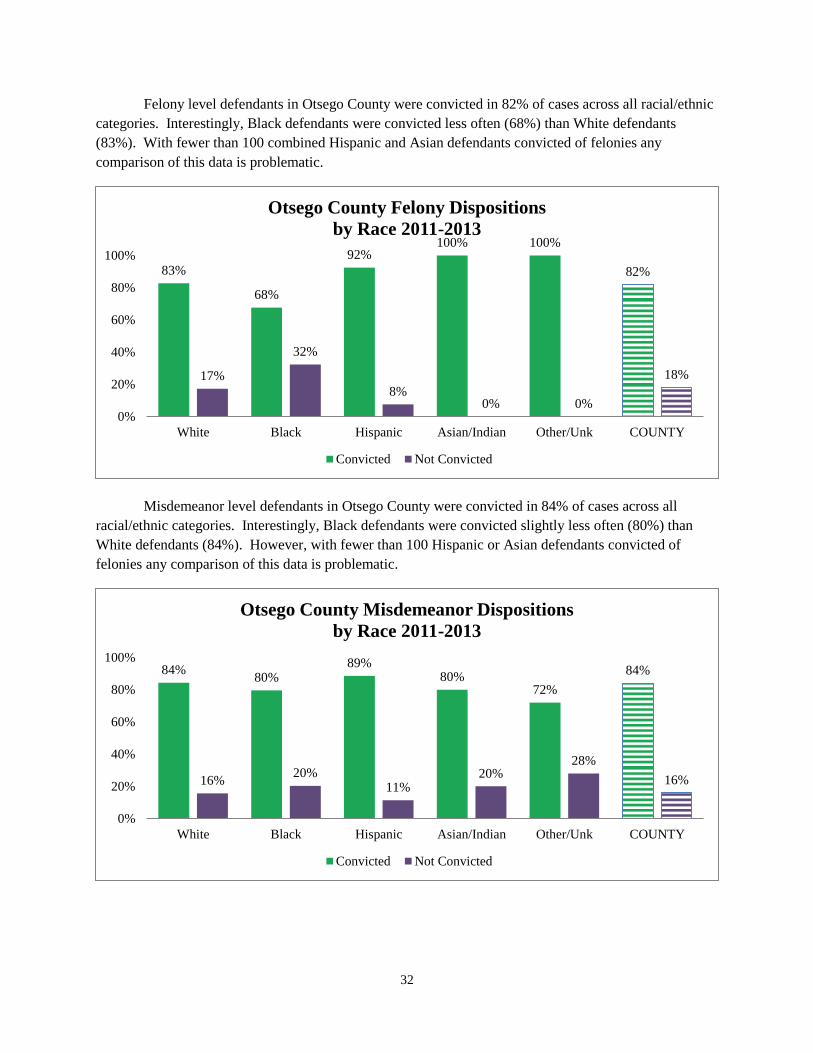
Felony level defendants in Otsego County were convicted in 82% of cases across all racial/ethnic
categories. Interestingly, Black defendants were convicted less often (68%) than White defendants
(83%). With fewer than 100 combined Hispanic and Asian defendants convicted of felonies any
comparison of this data is problematic.
Misdemeanor level defendants in Otsego County were convicted in 84% of cases across all
racial/ethnic categories. Interestingly, Black defendants were convicted slightly less often (80%) than
White defendants (84%). However, with fewer than 100 Hispanic or Asian defendants convicted of
felonies any comparison of this data is problematic.
83%
68%
92% 100% 100%
82%
17%
32%
8% 0% 0%
18%
0%
20%
40%
60%
80%
100%
White Black Hispanic Asian/Indian Other/Unk COUNTY
Otsego County Felony Dispositions
by Race 2011-2013
Convicted Not Convicted
84% 80%
89% 80%
72%
84%
16% 20%
11% 20%
28%
16%
0%
20%
40%
60%
80%
100%
White Black Hispanic Asian/Indian Other/Unk COUNTY
Otsego County Misdemeanor Dispositions
by Race 2011-2013
Convicted Not Convicted

33
SCHOHARIE COUNTY
There were just over 100 arrests of non-White individuals for misdemeanors and felonies in
Schoharie County from 2011 thru 2013, while just over 1,700 White defendants were arrested during the
same time period. However, there are only approximately 1,900 non-White residents in Schoharie
County compared to more than 30,000 White residents.
94%
1% 3% 1% 1%
91%
6% 2% 1% 1%
93%
3% 2% 1% 1% 0%
20%
40%
60%
80%
100%
White Black Hispanic Asian/Indian Other/Unk
Schoharie County Population & Arrests
by Race/Ethnicity 2011-2013
County Pop. % Fel. Arrest % Misd. Arrest %

34
Felony level defendants in Schoharie County were convicted in 81% of cases across all
racial/ethnic categories. However, with fewer than 100 combined Black, Hispanic and Asian defendants
convicted of felonies, and only just over 200 White defendants, any comparison of this data is
problematic.
Misdemeanor level defendants in Schoharie County were convicted in 77% of cases across all
racial/ethnic categories. However, with fewer than 100 combined Black, Hispanic and Asian defendants
convicted of felonies, compared to over 700 White defendants, any comparison of this data is
problematic.
81%
69%
80%
100% 100%
81%
19%
31%
20%
0% 0%
19%
0%
20%
40%
60%
80%
100%
White Black Hispanic Asian/Indian Other/Unk COUNTY
Schoharie County Felony Dispositions
by Race 2011-2013
Convicted Not Convicted
77% 72% 73% 75%
100%
77%
23% 28% 27% 25%
0%
23%
0%
20%
40%
60%
80%
100%
White Black Hispanic Asian/Indian Other/Unk COUNTY
Schoharie County Misdemeanor Dispositions
by Race 2011-2013
Convicted Not Convicted
35
ULSTER COUNTY
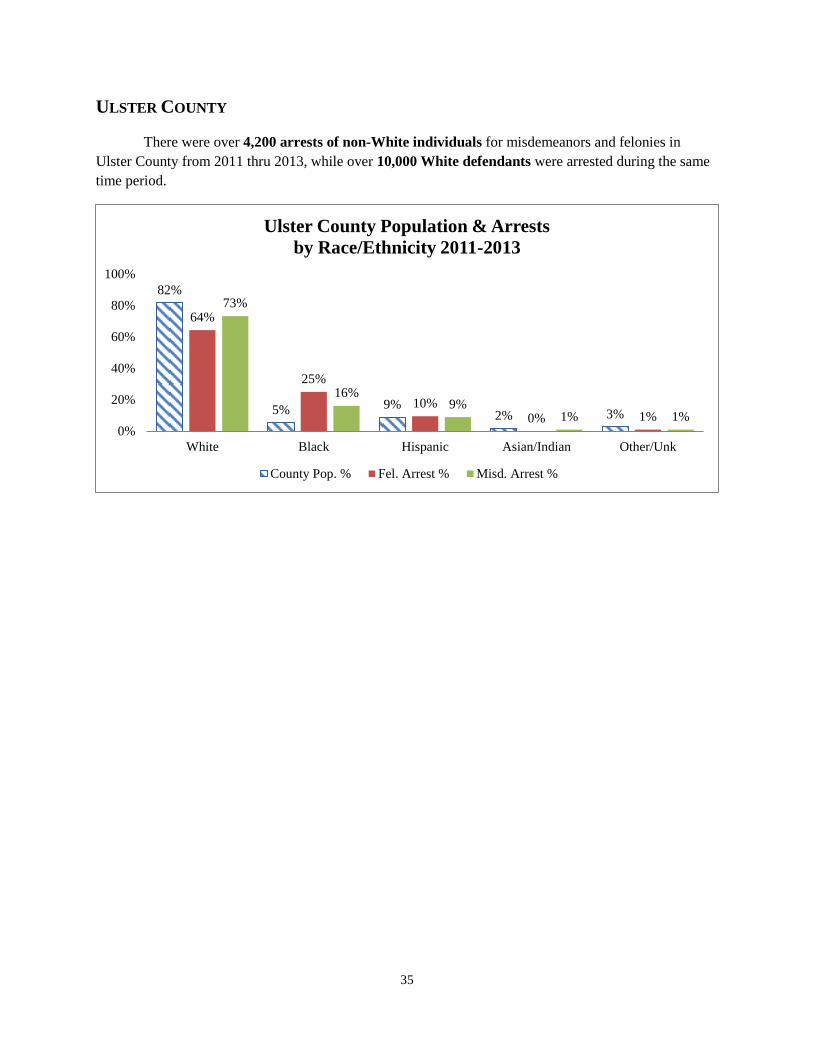
There were over 4,200 arrests of non-White individuals for misdemeanors and felonies in
Ulster County from 2011 thru 2013, while over 10,000 White defendants were arrested during the same
time period.
82%
5% 9% 2% 3%
64%
25%
10% 0% 1%
73%
16% 9%
1% 1% 0%
20%
40%
60%
80%
100%
White Black Hispanic Asian/Indian Other/Unk
Ulster County Population & Arrests
by Race/Ethnicity 2011-2013
County Pop. % Fel. Arrest % Misd. Arrest %
36
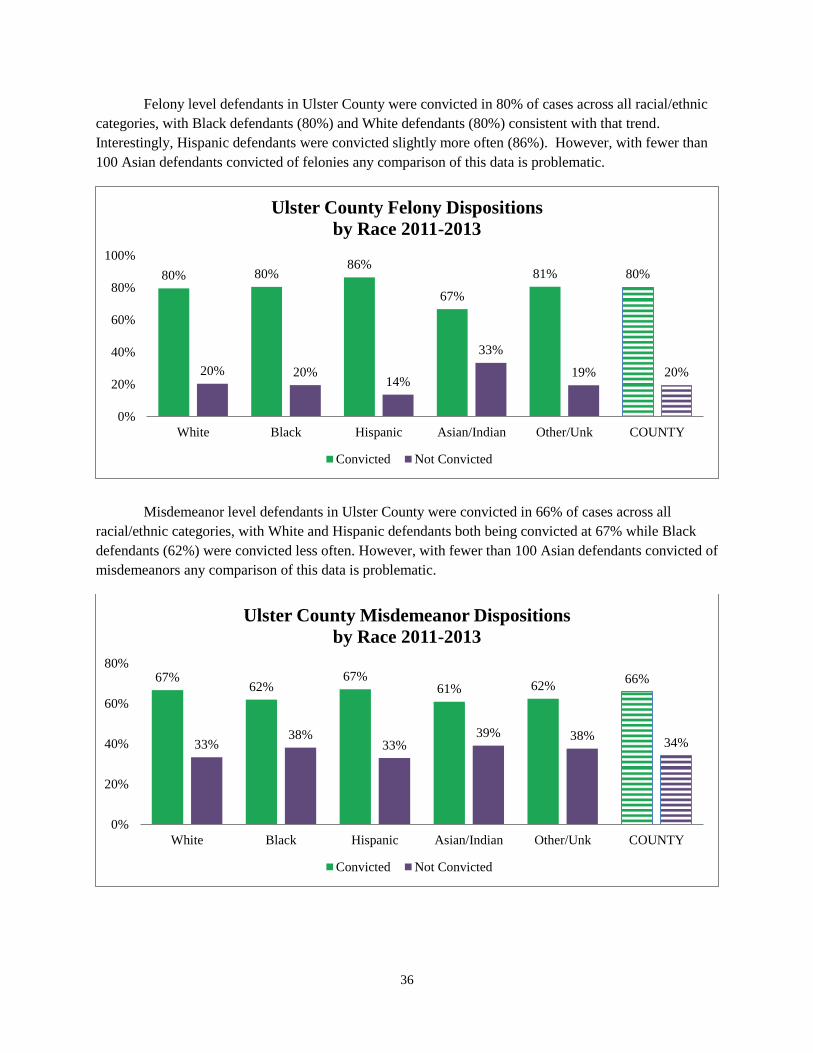
Felony level defendants in Ulster County were convicted in 80% of cases across all racial/ethnic
categories, with Black defendants (80%) and White defendants (80%) consistent with that trend.
Interestingly, Hispanic defendants were convicted slightly more often (86%). However, with fewer than
100 Asian defendants convicted of felonies any comparison of this data is problematic.
Misdemeanor level defendants in Ulster County were convicted in 66% of cases across all
racial/ethnic categories, with White and Hispanic defendants both being convicted at 67% while Black
defendants (62%) were convicted less often. However, with fewer than 100 Asian defendants convicted of
misdemeanors any comparison of this data is problematic.
80% 80% 86%
67%
81% 80%
20% 20% 14%
33%
19% 20%
0%
20%
40%
60%
80%
100%
White Black Hispanic Asian/Indian Other/Unk COUNTY
Ulster County Felony Dispositions
by Race 2011-2013
Convicted Not Convicted
67% 62%
67% 61% 62%
66%
33% 38%
33% 39% 38%
34%
0%
20%
40%
60%
80%
White Black Hispanic Asian/Indian Other/Unk COUNTY
Ulster County Misdemeanor Dispositions
by Race 2011-2013
Convicted Not Convicted

37
CONCLUSION
The data presented in this report is a preliminary examination of the over-representation of people
of color within New York State’s criminal justice system for the counties whose constituents are
represented by members of the New York State Legislative Caucus of Black, Puerto Rican, Hispanic and
Asian Legislators. Across the state, even in counties where a significant percentage of residents are
people of color, arrest statistics demonstrate that people of color are being arrested at a rate that exceeds
their percentage of the county population. The numbers are staggering: within the past three years,
over 1 million people of color were arrested for felonies and misdemeanors in just the 17 Caucus
Counties. With county level felony conviction rates as high as 88% and county level misdemeanor
conviction rates as high as 84%, once people of color are arrested and their cases proceed to the court
system, there is an overwhelming likelihood that they will be found guilty or induced to plead guilty.
While there are many factors that influence case outcomes – e.g., arrest practices, prosecutorial
charging practices, judicial sentencing practices – public defense providers have a critical role to play by
providing a rigorous defense and safeguarding clients’ constitutional rights. However, this role is
compromised by the patchwork system of county-run public defense in New York State that, as the Kaye
Commission noted, inadequately funds local offices and allows the State to shirk its constitutional
responsibilities.
NYSDA asks Caucus Members to renew the call, made this year on Gideon Day (March 18,
2014), for the State to settle the Hurrell vs. Harring class action lawsuit over the unconstitutionality of the
public defense system and use the occasion for the overhaul of public defense services that the Kaye
Commission recommended and that justice requires now. New York needs a statewide, fully and
adequately state funded public defense system overseen by an Independent Public Defense Commission.
38
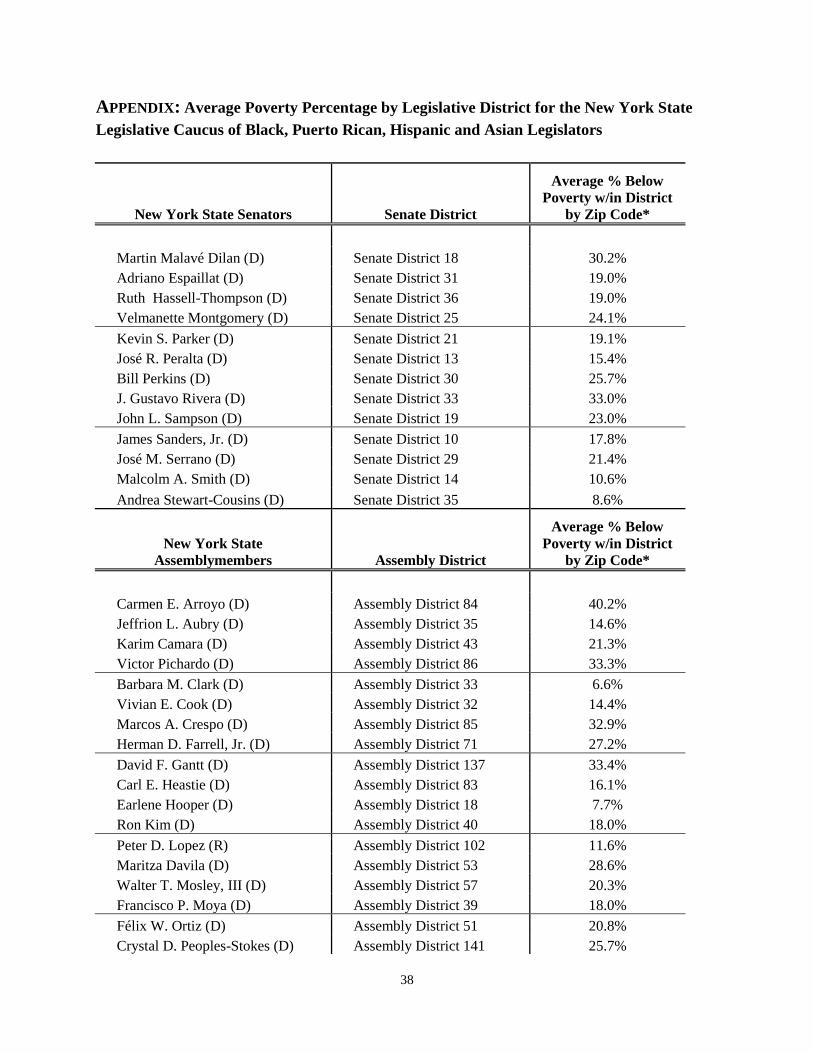
APPENDIX: Average Poverty Percentage by Legislative District for the New York State
Legislative Caucus of Black, Puerto Rican, Hispanic and Asian Legislators
New York State Senators Senate District
Average % Below
Poverty w/in District
by Zip Code*
Martin Malavé Dilan (D) Senate District 18 30.2%
Adriano Espaillat (D) Senate District 31 19.0%
Ruth Hassell-Thompson (D) Senate District 36 19.0%
Velmanette Montgomery (D) Senate District 25 24.1%
Kevin S. Parker (D) Senate District 21 19.1%
José R. Peralta (D) Senate District 13 15.4%
Bill Perkins (D) Senate District 30 25.7%
J. Gustavo Rivera (D) Senate District 33 33.0%
John L. Sampson (D) Senate District 19 23.0%
James Sanders, Jr. (D) Senate District 10 17.8%
José M. Serrano (D) Senate District 29 21.4%
Malcolm A. Smith (D) Senate District 14 10.6%
Andrea Stewart-Cousins (D) Senate District 35 8.6%
New York State
Assemblymembers Assembly District
Average % Below
Poverty w/in District
by Zip Code*
Carmen E. Arroyo (D) Assembly District 84 40.2%
Jeffrion L. Aubry (D) Assembly District 35 14.6%
Karim Camara (D) Assembly District 43 21.3%
Victor Pichardo (D) Assembly District 86 33.3%
Barbara M. Clark (D) Assembly District 33 6.6%
Vivian E. Cook (D) Assembly District 32 14.4%
Marcos A. Crespo (D) Assembly District 85 32.9%
Herman D. Farrell, Jr. (D) Assembly District 71 27.2%
David F. Gantt (D) Assembly District 137 33.4%
Carl E. Heastie (D) Assembly District 83 16.1%
Earlene Hooper (D) Assembly District 18 7.7%
Ron Kim (D) Assembly District 40 18.0%
Peter D. Lopez (R) Assembly District 102 11.6%
Maritza Davila (D) Assembly District 53 28.6%
Walter T. Mosley, III (D) Assembly District 57 20.3%
Francisco P. Moya (D) Assembly District 39 18.0%
Félix W. Ortiz (D) Assembly District 51 20.8%
Crystal D. Peoples-Stokes (D) Assembly District 141 25.7%

39
N.Nick Perry (D) Assembly District 58 16.9%
J. Gary Pretlow (D) Assembly District 89 13.5%
Phillip R. Ramos (D) Assembly District 6 5.7%
Jos Rivera (D) Assembly District 78 27.6%
Sam Roberts (D) Assembly District 128 15.4%
Annette M. Robinson (D) Assembly District 56 29.8%
Robert J. Rodriguez (D) Assembly District 68 25.2%
Gabriela Rosa (D) Assembly District 72 24.3%
Nily Rozic (D) Assembly District 25 12.7%
William Scarborough (D) Assembly District 29 11.0%
Luis R. Sepulveda (D) Assembly District 87 23.0%
Michaelle C. Solages (D) Assembly District 22 4.3%
Michele R. Titus (D) Assembly District 31 19.7%
Keith L.T. Wright (D) Assembly District 70 25.3%
New York State TOTAL 12.4%
* - % of All Residents Living Below Poverty Level