Race, Gender, and Descriptive Representation: An ... · Race, Gender, and Descriptive...
25
Race, Gender, and Descriptive Representation: An Exploratory View of Multicultural Elected Leadership in the United States Carol Hardy-Fanta UNIVERSITY OF MASSACHUSETTS BOSTON Christine Marie Sierra UNIVERSITY OF NEW MEXICO Pei-te Lien UNIVERSITY OF UTAH Dianne M. Pinderhughes UNIVERSITY OF ILLINOIS URBANA-CHAMPAIGN Wartyna L. Davis WILLIAM PATERSON UNIVERSITY Revised 9/4/05 Prepared for delivery at the 2005 Annual Meeting of the American Political Science Association September 1 - September 4, 2005 Washington, D.C. Copyrighted by the American Political Science Association, 2005
Transcript of Race, Gender, and Descriptive Representation: An ... · Race, Gender, and Descriptive...
Race, Gender, and Descriptive Representation: An Exploratory View of Multicultural Elected Leadership in
the United States
Carol Hardy-Fanta UNIVERSITY OF MASSACHUSETTS BOSTON
Christine Marie Sierra UNIVERSITY OF NEW MEXICO
Pei-te Lien UNIVERSITY OF UTAH
Dianne M. Pinderhughes UNIVERSITY OF ILLINOIS URBANA-CHAMPAIGN
Wartyna L. Davis WILLIAM PATERSON UNIVERSITY
Revised 9/4/05
Prepared for delivery at the 2005 Annual Meeting of the American Political Science Association September 1 - September 4, 2005
Washington, D.C. Copyrighted by the American Political Science Association, 2005

Race, Gender and Descriptive Representation: An Exploratory View of Multicultural Elected Leadership in the United States, C. Hardy-Fanta, C. Sierra, P. Lien , D. Pinderhughes, and W. Davis. APSA 9/3/05. 1
Introduction
As the twenty-first century unfolds, two dominant narratives regarding the incorporation of people of color into America’s governing institutions emerge. On the one hand, American democracy has produced dramatic increases in the number of people of color—men and women -- who serve as elected officials. Given the increasingly diverse racial and ethnic composition of the American electorate, the presence and influence of America’s racial and ethnic minorities in its governing structures promise to increase. On the other hand, patterns of underrepresentation at the local, state, and federal levels persist for these populations. Ultimately, the extent to which America’s ethnoracial groups become incorporated into the political system and how that incorporation occurs will test the strength and resilience of American democracy in responding to demographic change.
This paper addresses this two-fold narrative through a descriptive analysis of some broad features of America’s multicultural leadership in elective office. With its main focus on African American, Hispanic, and Asian American elected officials at the federal, state, and local levels (with some information on American Indians serving in state legislatures), the paper presents trends in minority office-holding and preliminary assessments of descriptive representation achieved by each racial group, a look at the geographical or spatial landscape of the nation’s multicultural elected leadership, and discussion of contextual variables associated with minority group representation, particularly the impact of the Voting Rights Act and the role of majority-minority districts.
Emerging from the data are the following propositions. First, overall trends in minority office-holding show increases in elective positions held by all of the groups in the study. At least for one racial group (African Americans), the growth in elected leadership is, in fact, driven by the increase of women in office. Second, the challenge of underrepresentation faces all the groups but there are differences among them in descriptive representation. In this regard, women of color play a significant role in the achievement of descriptive representation for the racial groups. Third, though America’s multicultural leadership is expanding in number, the sharing of leadership space among ethnoracial populations appears limited. At the same time, the local level of politics appears to provide an opportunity structure for inter-minority coalition building. And, fourth, the role of majority-minority districts created from passage of the Voting Rights Act figures prominently in the election of people of color.
This paper emerges as part of a larger project on elected officials of color in the United States. The research project also includes the administration of a telephone survey of a nationwide sample of African American, Latino/a, and Asian American elected officials at the state and local levels to examine their backgrounds, experiences, and perspectives on their representational roles and public policies. An important aspect of the project devotes special attention to the role women of color play in the exercise of representative government and democratic politics. We posit that a theoretical focus on women of color in particular will advance knowledge in new directions with respect to the functioning of American electoral and governing structures and processes. In the end, our research seeks to address both aspects of the democratic challenge—the promise and impact of America’s changing and increasingly

Race, Gender and Descriptive Representation: An Exploratory View of Multicultural Elected Leadership in the United States, C. Hardy-Fanta, C. Sierra, P. Lien , D. Pinderhughes, and W. Davis. APSA 9/3/05. 2
diversified political leadership as well as the limits and constraints on America’s electoral system for the further incorporation of underrepresented groups.
Descriptive Representation: Implications for a Multiracial Leadership
An important body of literature addresses the scope, contours, and consequences of descriptive representation for people of color in the United States (See McClain and Stewart 2002 and Menifield 2001, for good overviews). Though there is some disagreement on the consequences, impact, and implications of descriptive representation for ethnoracial groups (Swain 1995; Gay 2001, 2002; Tate 2003), the importance of descriptive representation remains a significant research question for analyzing group status and power in the American political system. While descriptive representation may not be sufficient for the achievement of political equality and policy responsiveness for marginalized groups, scholars point to its symbolic or material importance as a necessary condition or positive factor towards group empowerment (Button et al. 1998; Mansbridge 1999; Barreto et al. 2004). Moreover, an increasing research focus on women of color in the political system has generated scholarship that places questions of intersectionality into the framework of descriptive representation. That is, how do race and gender intersect in the representational roles and policy priorities of women (and men) of color (Takash 1993; Cohen, Jones and Tronto 1997; Gay and Tate 1998; Manuel 2004)?
In order to interrogate the workings of the political system with regards to ethnoracial
minorities, a systematic examination of those who constitute the formal political leadership of color is warranted, especially as their numbers promise to increase. A reasonable starting point then is an assessment of descriptive racial/ethnic and gender representation.
While much of the scholarship on race/ethnic politics is racial group specific, cross-racial
group analyses of various aspects of descriptive representation are on the rise (Dovi 2002; Jones-Correa 2005). Similarly, scholarship on women of color involves mostly group-specific inquiry (Hardy-Fanta 1993; Sierra and Sosa-Riddell 1994; Barrett 1995; Montoya, Hardy-Fanta, and Garcia 2000; Lien 2001; Ong 2001), although there is a growing literature that addresses more than one ethno-racial group or women of color as a broad category (Ortiz 1994; Lien 1998; Hawkesworth 2003; Scola 2005). This paper incorporates group-specific data as well as some cross-group analysis to capture contemporary features of America’s multicultural leadership. It represents a first-step in providing a baseline of information on elected officials of color, women and men, through an analytical lens that at once addresses the ethnoracial groups separately but also in relation to one another at the intersections of race and gender lines. The National Database
A national database of non-white men and women elected officials at federal, state, and local levels of office was built using directories assembled by NALEO (National Association of Latino Elected and Appointed Officials), the Joint Center for Political and Economic Studies, and the UCLA Asian American Studies Center. The directory information was verified for accuracy, re-coded for consistency across groups, and expanded by linking contextual (e.g., demographic) data from the U.S. Census and other sources. The database of 11,867 elected officials of color includes elected officials who fall into the following categories: elected

Race, Gender and Descriptive Representation: An Exploratory View of Multicultural Elected Leadership in the United States, C. Hardy-Fanta, C. Sierra, P. Lien , D. Pinderhughes, and W. Davis. APSA 9/3/05. 3
officials in congressional, statewide, state legislative, county, municipal, and school board offices. County office refers to members of county legislative bodies, such as commissions. Municipal office includes mayors and members of city legislative bodies, such as city councils and boards of aldermen/selectmen. Our database does not include judicial or law enforcement positions, party officials, or miscellaneous officials elected to boards and commissions such as water, utility, etc. The database was constructed in late 2003, early 2004 and includes, for the most part, officials who were in office in 2003. Our verification process determined that the extent to which the database captures the officials in office at that time was more accurate for different racial groups than others, and for different levels of office. We added American Indian elected officials at the level of state legislature and one congressional seat identified from the National Conference of State Legislators and in McClain and Stewart (2002).
A note on terminology is in order: African American is used interchangeably with Black and Hispanic is used interchangeably with Latino. The Asian (API) category includes native Hawaiians and other Pacific Islanders. We use the term American Indian rather than Native American. The American Indian (AI) category also includes Alaskan natives. For reference to all non-white groups in our study, we sometimes use the term “elected officials of color.” We are aware of the scholarly argument that “white” is itself a “color” in a social and political sense (Ignatiev 1995). We respect the differences in scholarly opinion on this issue. For the purposes of this paper, references to people of color do not include non-Hispanic whites. Trends in Minority Office Holding
Our research project begins with the question: To what extent have women and men of color achieved descriptive representation at various levels of government? Longitudinal data lay the context for our analysis of the contemporary scope and contours of descriptive representation for non-white populations. An overview of non-white groups in public office indicates that all groups have achieved higher levels of formal representation over time, albeit at different rates for each group and level of office.
Data from the Joint Center for Political and Economic Studies (U.S. Census 2005) show a consistent rise in the number of Black elected officials between 1970 and 2000, with the fastest growth rate occurring during the 1970s. The total number of Black officials rose from 1,469 to 9,001 or by more than 6 times in the 30-year period. The number of federal and state legislators grew from 179 to 621 or by 3.5 times and that of education and school board members grew from 362 to 1923 or by 4.3 times. But the most impressive growth occurred in city/county government, where the number of city/county officials rose from 715 to 4,954 or close to 7 times as large.
A similarly large growth occurred in the number of Latino elected officials between the
early 1970s and 2004. An early study by Lemus (1973) focused on six states with significant Latino populations and found 1,280 “Spanish-surnamed elected officials.” Since 1985, the National Association of Latino Elected and Appointed Officials (NALEO) has been regularly collecting and reporting such data. According to their latest figures, the total number of Latino elected officials now stands at approximately 4,800. The number of federal and state legislators steadily grew from 129 in 1985 to 253 in 2004 or by 96 percent. The number of county and

Race, Gender and Descriptive Representation: An Exploratory View of Multicultural Elected Leadership in the United States, C. Hardy-Fanta, C. Sierra, P. Lien , D. Pinderhughes, and W. Davis. APSA 9/3/05. 4
Figure 1. Elected Officials of Color, by RaceN=11,828
AsianN=341 (2.9%)
LatinoN=3,929 (33.1%)
BlackN=7,558 (63.7%)
municipal officials grew from 1,316 to 2,059 or by 56 percent. Latino elected officials at the level of school board also increased by approximately 120 percent (NALEO 1985–2004) but analysis at this level over time is difficult due to methodological issues.1
Asian American elected officials also demonstrate a trend of rapid and uneven growth in federal, state, and key local offices similar to Latinos, with the fastest rate of growth occurring in the second half of the 1980s. The total number of Asian American officials grew from 120 in 1978 to 346 in 2004. The growth rate is particularly high at the local level where the change is from 52 to 260 during the 26 years of study.
Overall, between 1990 and 2000, Latino officials experienced a higher rate of growth (30 percent) than that of Blacks (23 percent) and Asian Americans (4 percent). Reliable statistics for American Indians are only available at the state legislative level. In 1997-99, 28 American Indian (including, as discussed above, Alaskan natives) served in 8 states. In 2003-4, 42 were found to serve in 12 states.
A Contemporary Profile of Non-White Elected Officials
Figure 1 begins to lay out the broad contours of our dataset of non-white elected leadership at the dawn of the 21st century. As observed in this figure, Black elected officials are the most numerous (7,558), comprising 63.7 percent of the total. Latino/a elected officials are the second largest group with 3,929 or one-third of the total. Asian Americans number 341 or 2.9 percent of the total. American Indians are not included because data are only available at the level of state legislature or above, but their total of 43 includes only 42 state legislative officeholders and one member of the U.S. Congress.
1During the 1990s local school boards were created in the City of Chicago which increased the number of Latino
elected school board members reported by the National Association of Latino Elected and Appointed Officials (NALEO). After 2000, NALEO changed their methodology and excluded these Chicago Local School Council members (LSC’s). Thus trend data for Latino elected officials at that level (and as a total) are difficult to obtain.
Race, Gender and Descriptive Representation: An Exploratory View of Multicultural Elected Leadership in the United States, C. Hardy-Fanta, C. Sierra, P. Lien , D. Pinderhughes, and W. Davis. APSA 9/3/05. 5
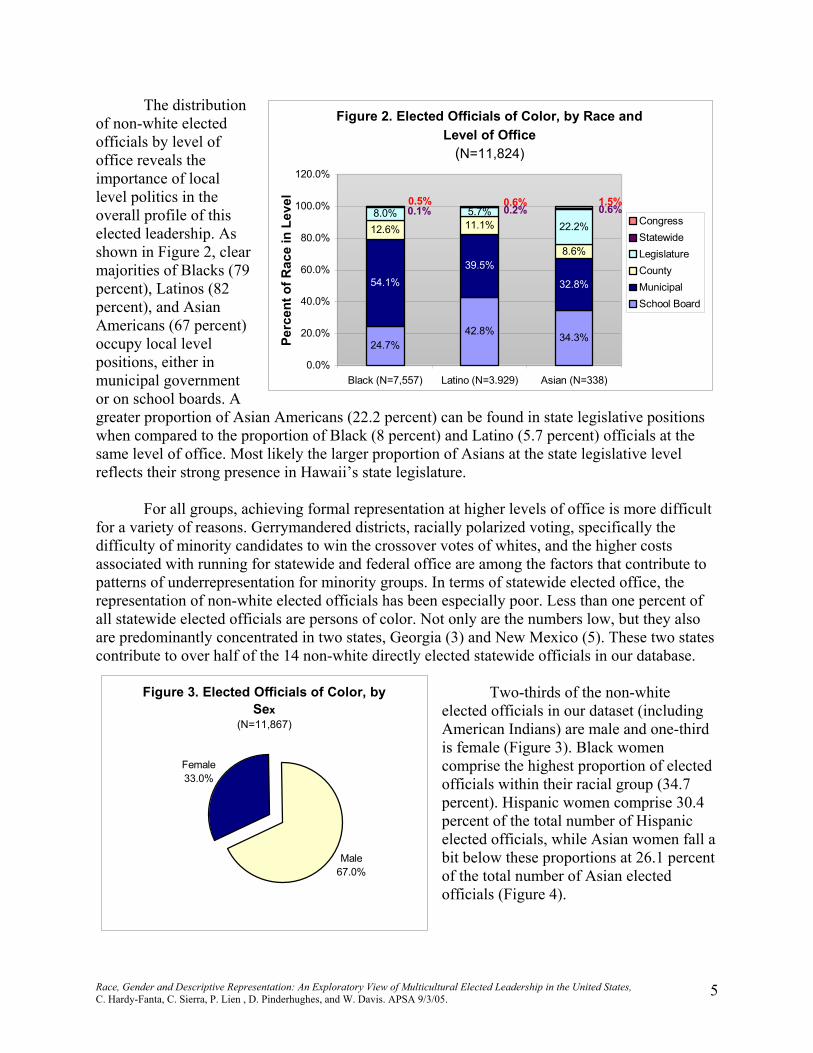
Figure 2. Elected Officials of Color, by Race and Level of Office
(N=11,824)
24.7%42.8% 34.3%
54.1%39.5%
32.8%
12.6% 11.1%
8.6%
8.0% 5.7%22.2%
0.6%0.2%0.1%1.5%0.6%0.5%
0.0%
20.0%
40.0%
60.0%
80.0%
100.0%
120.0%
Black (N=7,557) Latino (N=3.929) Asian (N=338)
Perc
ent o
f Rac
e in
Lev
el
CongressStatewideLegislatureCountyMunicipalSchool Board
Figure 3. Elected Officials of Color, by Sex
(N=11,867)
Female33.0%
Male67.0%
The distribution of non-white elected officials by level of office reveals the importance of local level politics in the overall profile of this elected leadership. As shown in Figure 2, clear majorities of Blacks (79 percent), Latinos (82 percent), and Asian Americans (67 percent) occupy local level positions, either in municipal government or on school boards. A greater proportion of Asian Americans (22.2 percent) can be found in state legislative positions when compared to the proportion of Black (8 percent) and Latino (5.7 percent) officials at the same level of office. Most likely the larger proportion of Asians at the state legislative level reflects their strong presence in Hawaii’s state legislature.
For all groups, achieving formal representation at higher levels of office is more difficult for a variety of reasons. Gerrymandered districts, racially polarized voting, specifically the difficulty of minority candidates to win the crossover votes of whites, and the higher costs associated with running for statewide and federal office are among the factors that contribute to patterns of underrepresentation for minority groups. In terms of statewide elected office, the representation of non-white elected officials has been especially poor. Less than one percent of all statewide elected officials are persons of color. Not only are the numbers low, but they also are predominantly concentrated in two states, Georgia (3) and New Mexico (5). These two states contribute to over half of the 14 non-white directly elected statewide officials in our database.
Two-thirds of the non-white
elected officials in our dataset (including American Indians) are male and one-third is female (Figure 3). Black women comprise the highest proportion of elected officials within their racial group (34.7 percent). Hispanic women comprise 30.4 percent of the total number of Hispanic elected officials, while Asian women fall a bit below these proportions at 26.1 percent of the total number of Asian elected officials (Figure 4).

Race, Gender and Descriptive Representation: An Exploratory View of Multicultural Elected Leadership in the United States, C. Hardy-Fanta, C. Sierra, P. Lien , D. Pinderhughes, and W. Davis. APSA 9/3/05. 6
While women of color do not make up a proportion of elected officials commensurate with their population, scholars have noted that they nevertheless hold office at rates higher than women in general and white women in particular (Pachon and DeSipio 1992; Darcy, Welch, and Clark 1994; Montoya, Hardy-Fanta, and Garcia 2000; Scola 2005). A case in point is state legislative office holding. Women in general make up just 22.4 percent of state
legislators (of all races),2 and, as Table 1 shows, non-Hispanic white women make up just 20.9 percent of state legislators who are non-Hispanic white. In contrast, 35.6 percent of Black state legislators are female. This is not unique to Black elected officials: 29.0 percent of Latino, 24.1 percent of Asian, and 28.6 percent of American Indian state legislators are female. Furthermore, women of color appear to be driving the rate of growth among elected officials of color in recent years. This pattern holds at least for Black elected officials (BEOs). Bositis (2003) noted that in 2001, the election of Black female officeholders accounted for all the gains in the number of BEOs that year. Moreover, while the number of Black women increased, the number of Black men decreased—a pattern that has accelerated since 1998. Overall, since 1970, the number of female BEOs increased 20-fold, while the number of male BEOs increased four-fold. In 1970, women numbered 160, accounting for 10.9 percent of the total number of BEOs. In 2001, they numbered 3,220, 35.4 percent of the total.
2 “Women in Elective Office 2005,” Center for American Women in Politics, Rutgers University. Retrieved from the internet 7/20/05, http://www.cawp.rutgers.edu/Facts/Officeholders/elective.pdf
Table 1. State Legislators by Race and Sex, 2004 (Total N=7,382)
Female Male Black 215
(35.6%) 389
(64.4%) Latino 67
(29.0%) 164
(71.0%) Asian 26
(24.1%) 82
(75.9%) American Indian 10
(28.6%) 25
(73.8%) NonHispanic White 1341
(20.9%) 5063
(79.1%)
Figure 4. Elected Officials of Color, by Race and Sex
(N=11,824)
34.7% 30.4% 26.1%
65.3% 69.6% 73.9%
0
0.2
0.4
0.6
0.8
1
1.2
Black (N=7,557) Latino (N=3,929) Asian (N=338)
Perc
ent o
f Rac
e
MaleFemale
Race, Gender and Descriptive Representation: An Exploratory View of Multicultural Elected Leadership in the United States, C. Hardy-Fanta, C. Sierra, P. Lien , D. Pinderhughes, and W. Davis. APSA 9/3/05. 7
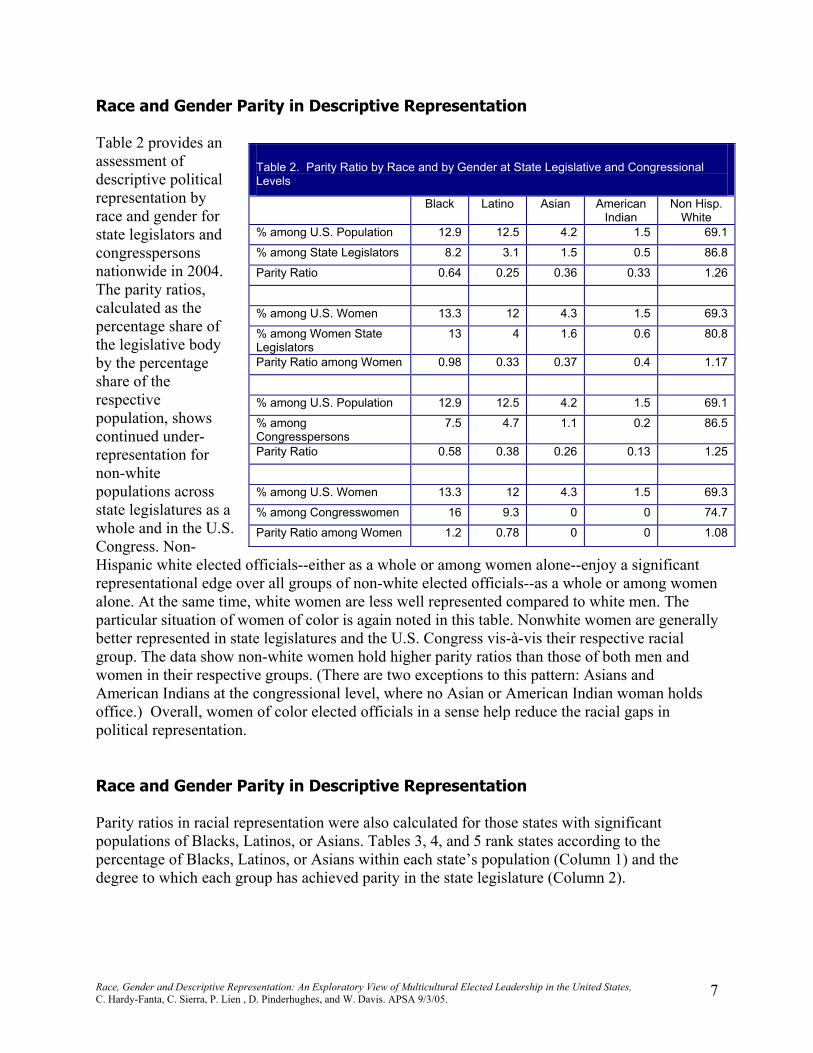
Race and Gender Parity in Descriptive Representation Table 2 provides an assessment of descriptive political representation by race and gender for state legislators and congresspersons nationwide in 2004. The parity ratios, calculated as the percentage share of the legislative body by the percentage share of the respective population, shows continued under-representation for non-white populations across state legislatures as a whole and in the U.S. Congress. Non-Hispanic white elected officials--either as a whole or among women alone--enjoy a significant representational edge over all groups of non-white elected officials--as a whole or among women alone. At the same time, white women are less well represented compared to white men. The particular situation of women of color is again noted in this table. Nonwhite women are generally better represented in state legislatures and the U.S. Congress vis-à-vis their respective racial group. The data show non-white women hold higher parity ratios than those of both men and women in their respective groups. (There are two exceptions to this pattern: Asians and American Indians at the congressional level, where no Asian or American Indian woman holds office.) Overall, women of color elected officials in a sense help reduce the racial gaps in political representation. Race and Gender Parity in Descriptive Representation Parity ratios in racial representation were also calculated for those states with significant populations of Blacks, Latinos, or Asians. Tables 3, 4, and 5 rank states according to the percentage of Blacks, Latinos, or Asians within each state’s population (Column 1) and the degree to which each group has achieved parity in the state legislature (Column 2).
Table 2. Parity Ratio by Race and by Gender at State Legislative and Congressional Levels
Black Latino Asian American Indian
Non Hisp. White
% among U.S. Population 12.9 12.5 4.2 1.5 69.1
% among State Legislators 8.2 3.1 1.5 0.5 86.8
Parity Ratio 0.64 0.25 0.36 0.33 1.26
% among U.S. Women 13.3 12 4.3 1.5 69.3
% among Women State Legislators
13 4 1.6 0.6 80.8
Parity Ratio among Women 0.98 0.33 0.37 0.4 1.17
% among U.S. Population 12.9 12.5 4.2 1.5 69.1
% among Congresspersons
7.5 4.7 1.1 0.2 86.5
Parity Ratio 0.58 0.38 0.26 0.13 1.25
% among U.S. Women 13.3 12 4.3 1.5 69.3
% among Congresswomen 16 9.3 0 0 74.7
Parity Ratio among Women 1.2 0.78 0 0 1.08
Race, Gender and Descriptive Representation: An Exploratory View of Multicultural Elected Leadership in the United States, C. Hardy-Fanta, C. Sierra, P. Lien , D. Pinderhughes, and W. Davis. APSA 9/3/05. 8
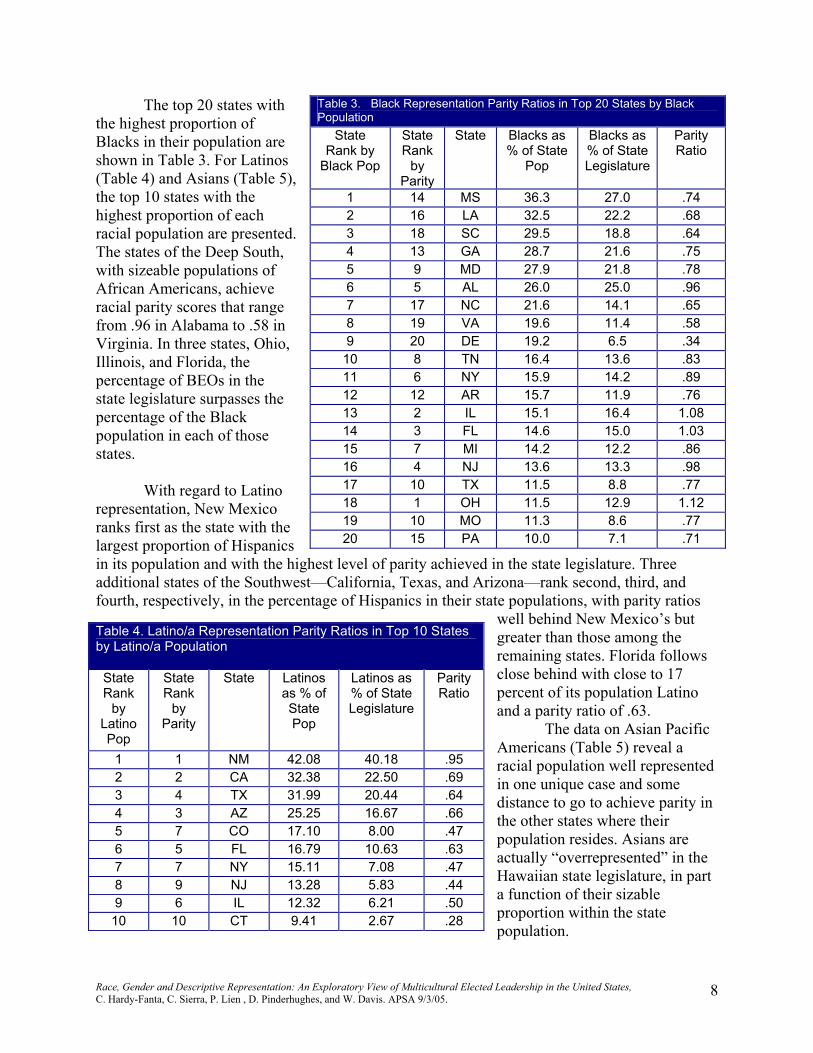
The top 20 states with the highest proportion of Blacks in their population are shown in Table 3. For Latinos (Table 4) and Asians (Table 5), the top 10 states with the highest proportion of each racial population are presented. The states of the Deep South, with sizeable populations of African Americans, achieve racial parity scores that range from .96 in Alabama to .58 in Virginia. In three states, Ohio, Illinois, and Florida, the percentage of BEOs in the state legislature surpasses the percentage of the Black population in each of those states.
With regard to Latino
representation, New Mexico ranks first as the state with the largest proportion of Hispanics in its population and with the highest level of parity achieved in the state legislature. Three additional states of the Southwest—California, Texas, and Arizona—rank second, third, and fourth, respectively, in the percentage of Hispanics in their state populations, with parity ratios
well behind New Mexico’s but greater than those among the remaining states. Florida follows close behind with close to 17 percent of its population Latino and a parity ratio of .63.
The data on Asian Pacific Americans (Table 5) reveal a racial population well represented in one unique case and some distance to go to achieve parity in the other states where their population resides. Asians are actually “overrepresented” in the Hawaiian state legislature, in part a function of their sizable proportion within the state population.
Table 3. Black Representation Parity Ratios in Top 20 States by Black Population
State Rank by
Black Pop
State Rank
by Parity
State Blacks as % of State
Pop
Blacks as % of State Legislature
Parity Ratio
1 14 MS 36.3 27.0 .74 2 16 LA 32.5 22.2 .68 3 18 SC 29.5 18.8 .64 4 13 GA 28.7 21.6 .75 5 9 MD 27.9 21.8 .78 6 5 AL 26.0 25.0 .96 7 17 NC 21.6 14.1 .65 8 19 VA 19.6 11.4 .58 9 20 DE 19.2 6.5 .34
10 8 TN 16.4 13.6 .83 11 6 NY 15.9 14.2 .89 12 12 AR 15.7 11.9 .76 13 2 IL 15.1 16.4 1.08 14 3 FL 14.6 15.0 1.03 15 7 MI 14.2 12.2 .86 16 4 NJ 13.6 13.3 .98 17 10 TX 11.5 8.8 .77 18 1 OH 11.5 12.9 1.12 19 10 MO 11.3 8.6 .77 20 15 PA 10.0 7.1 .71
Table 4. Latino/a Representation Parity Ratios in Top 10 States by Latino/a Population
State Rank
by Latino Pop
State Rank
by Parity
State Latinos as % of State Pop
Latinos as % of State Legislature
Parity Ratio
1 1 NM 42.08 40.18 .95 2 2 CA 32.38 22.50 .69 3 4 TX 31.99 20.44 .64 4 3 AZ 25.25 16.67 .66 5 7 CO 17.10 8.00 .47 6 5 FL 16.79 10.63 .63 7 7 NY 15.11 7.08 .47 8 9 NJ 13.28 5.83 .44 9 6 IL 12.32 6.21 .50 10 10 CT 9.41 2.67 .28

Race, Gender and Descriptive Representation: An Exploratory View of Multicultural Elected Leadership in the United States, C. Hardy-Fanta, C. Sierra, P. Lien , D. Pinderhughes, and W. Davis. APSA 9/3/05. 9
Although they account for 11.3 percent of California’s population, they have yet to approximate parity within the state legislature. Their small percentage of the populations of other states no doubt accounts in part for their lack of representation. But, as their numbers grow, so does the likelihood they will increase in electoral clout and descriptive representation.
In sum, these parity tables are suggestive of the importance of population numbers in achieving parity for racial groups; however, the data also show that population numbers alone do not produce descriptive representation. Structural features of state electoral systems, a group’s political history, population density, political cohesion and mobilization, among other factors, also weigh into this complex story. The Geographical Landscape of Multicultural Elected Leadership
As we analyze key aspects of our nation’s multicultural elected leadership, we seek to examine the possibilities for coalition and or competition among these elected officials across racial and gender lines. Coalition building among groups tends to emerge through the sharing of common ground, i.e. political attitudes, interests, experiences, or crises/grievances. Accordingly, our larger project seeks to assess to what extent elected officials of color, and especially women of color, share common ground through their personal backgrounds, ideologies, policy viewpoints, electoral experiences, and perspectives on representational roles. We are interested in the prospects for coalition (or competition) not only in a general theoretical sense, but also within geographically defined arenas of decision-making. That is, where are the prospects for the exercise of multicultural leadership in a literal sense—where elected officials of color from more than one racial group (in addition to non-Hispanic whites) serve in public office in the same political unit, jurisdiction, or geographical location? State-by-State Analysis
Analysis of the geographical distribution of the elected officials of color in our dataset
provides some initial answers to this question. Figures 5, 6 and 7 show the distributions of Black, Latino, and Asian American elected officials (respectively) across the United States (Alaska and Hawaii are not shown due to limitations of our mapping program). Elected officials of color are distributed in patterns that reflect the distribution of their respective group’s population, but there are significant distinctions as well.
Table 5. API Representation Parity Ratios in Top 10 States by API Population
State Rank by API Pop
State Rank
by Parity
State API as % of State
Pop
API as % of State
Legislature
Parity Ratio
1 1 HI 51.0 68.4 1.34 2 2 CA 11.3 5.0 .44 3 3 WA 5.9 2.0 .34 4 5 NJ 5.8 0.8 .14 5 - NY 5.6 0.0 0.0 6 - NV 4.9 0.0 0.0 7 - AK 4.5 0.0 0.0 8 4 MD 4.0 1.1 .26 9 - MA 3.8 0.0 0.0
10 - VA 3.7 0.0 0.0
Race, Gender and Descriptive Representation: An Exploratory View of Multicultural Elected Leadership in the United States, C. Hardy-Fanta, C. Sierra, P. Lien , D. Pinderhughes, and W. Davis. APSA 9/3/05. 10
llllllllln
n
n --
-
-
-
-
-
---
-
n
-
-
-
-
PhoenixPhoenixPhoenixPhoenixPhoenixPhoenixPhoenixPhoenixPhoenix
WashingtonWashingtonWashingtonWashingtonWashingtonWashingtonWashingtonWashingtonWashingtonIndianapolisIndianapolisIndianapolisIndianapolisIndianapolisIndianapolisIndianapolisIndianapolisIndianapolis
BostonBostonBostonBostonBostonBostonBostonBostonBoston
ChicagoChicagoChicagoChicagoChicagoChicagoChicagoChicagoChicago
DallasDallasDallasDallasDallasDallasDallasDallasDallas
HoustonHoustonHoustonHoustonHoustonHoustonHoustonHoustonHouston
JacksonvilleJacksonvilleJacksonvilleJacksonvilleJacksonvilleJacksonvilleJacksonvilleJacksonvilleJacksonville
Los AngelesLos AngelesLos AngelesLos AngelesLos AngelesLos AngelesLos AngelesLos AngelesLos AngelesMemphisMemphisMemphisMemphisMemphisMemphisMemphisMemphisMemphis
MilwaukeeMilwaukeeMilwaukeeMilwaukeeMilwaukeeMilwaukeeMilwaukeeMilwaukeeMilwaukee New YorkNew YorkNew YorkNew YorkNew YorkNew YorkNew YorkNew YorkNew York
San FranciscoSan FranciscoSan FranciscoSan FranciscoSan FranciscoSan FranciscoSan FranciscoSan FranciscoSan Francisco
Ranges for Black EOs as % of Total Black EOs in USMeans
2.3 to 10 .6 (16)0.7 to 2.3 (8)0.3 to 0.7 (3)0.1 to 0.3 (7)0 to 0.1 (16)
United States
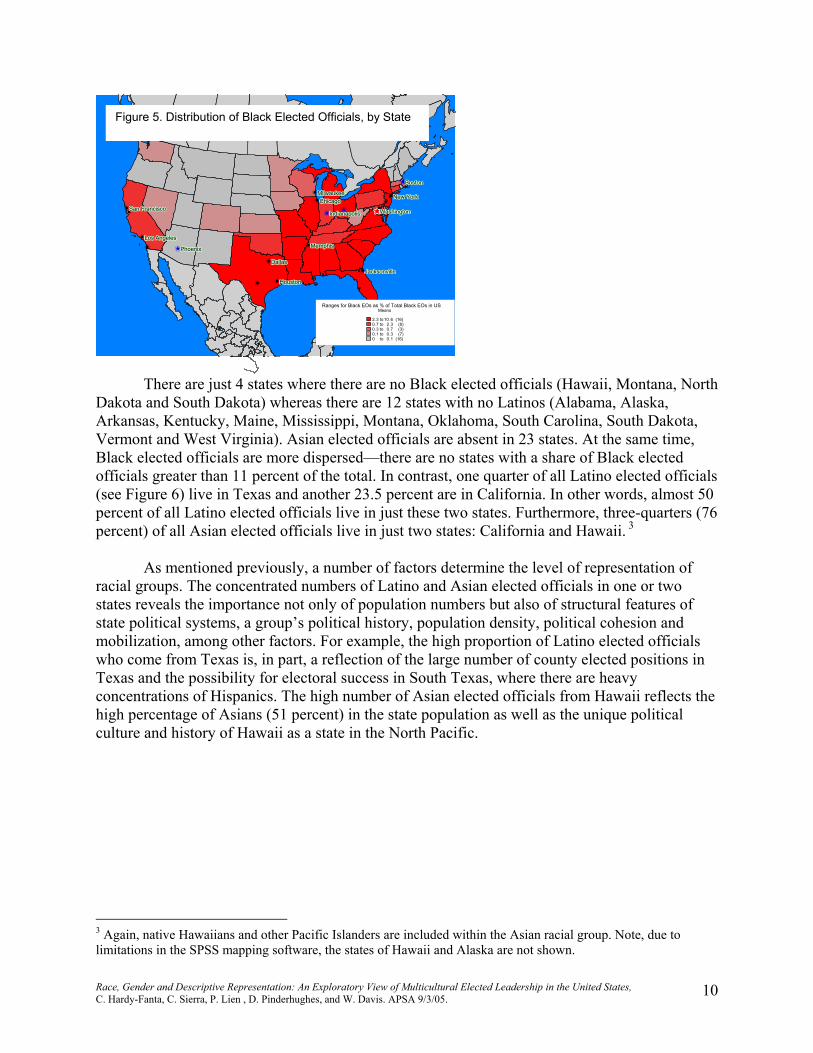
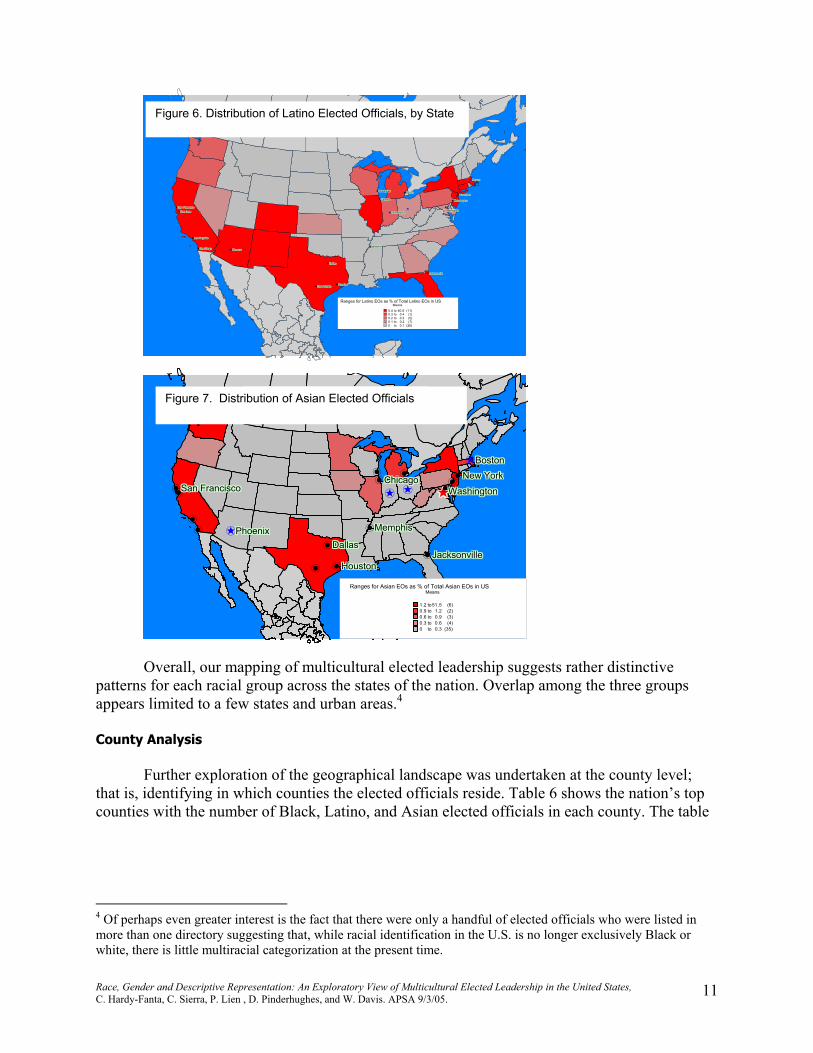
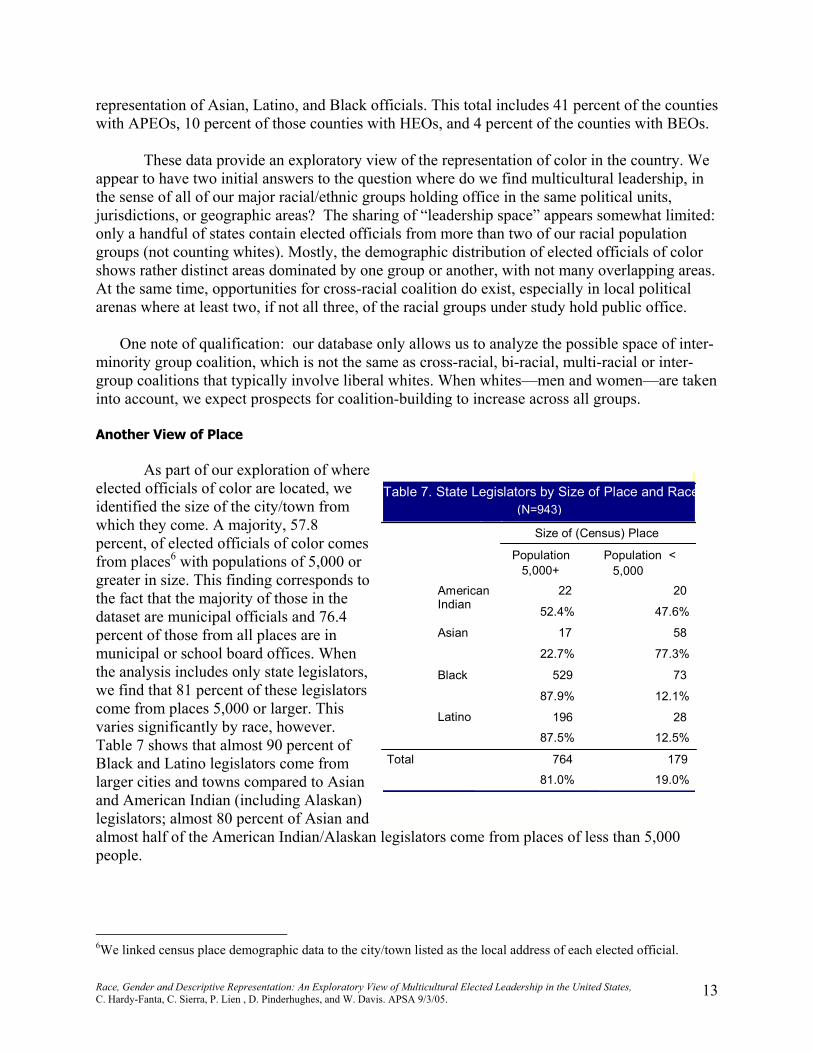
There are just 4 states where there are no Black elected officials (Hawaii, Montana, North Dakota and South Dakota) whereas there are 12 states with no Latinos (Alabama, Alaska, Arkansas, Kentucky, Maine, Mississippi, Montana, Oklahoma, South Carolina, South Dakota, Vermont and West Virginia). Asian elected officials are absent in 23 states. At the same time, Black elected officials are more dispersed—there are no states with a share of Black elected officials greater than 11 percent of the total. In contrast, one quarter of all Latino elected officials (see Figure 6) live in Texas and another 23.5 percent are in California. In other words, almost 50 percent of all Latino elected officials live in just these two states. Furthermore, three-quarters (76 percent) of all Asian elected officials live in just two states: California and Hawaii. 3
As mentioned previously, a number of factors determine the level of representation of racial groups. The concentrated numbers of Latino and Asian elected officials in one or two states reveals the importance not only of population numbers but also of structural features of state political systems, a group’s political history, population density, political cohesion and mobilization, among other factors. For example, the high proportion of Latino elected officials who come from Texas is, in part, a reflection of the large number of county elected positions in Texas and the possibility for electoral success in South Texas, where there are heavy concentrations of Hispanics. The high number of Asian elected officials from Hawaii reflects the high percentage of Asians (51 percent) in the state population as well as the unique political culture and history of Hawaii as a state in the North Pacific.
3 Again, native Hawaiians and other Pacific Islanders are included within the Asian racial group. Note, due to limitations in the SPSS mapping software, the states of Hawaii and Alaska are not shown.
Figure 5. Distribution of Black Elected Officials, by State
Race, Gender and Descriptive Representation: An Exploratory View of Multicultural Elected Leadership in the United States, C. Hardy-Fanta, C. Sierra, P. Lien , D. Pinderhughes, and W. Davis. APSA 9/3/05. 11
llllllllln
n
n-
-
-
-
-
-
-
-
-
-
-
n
-
-
-
-
PhoenixPhoenixPhoenixPhoenixPhoenixPhoenixPhoenixPhoenixPhoenix
WashingtonWashingtonWashingtonWashingtonWashingtonWashingtonWashingtonWashingtonWashingtonIndianapolisIndianapolisIndianapolisIndianapolisIndianapolisIndianapolisIndianapolisIndianapolisIndianapolis
BostonBostonBostonBostonBostonBostonBostonBostonBoston
ChicagoChicagoChicagoChicagoChicagoChicagoChicagoChicagoChicago
DallasDallasDallasDallasDallasDallasDallasDallasDallas
DetroitDetroitDetroitDetroitDetroitDetroitDetroitDetroitDetroit
HoustonHoustonHoustonHoustonHoustonHoustonHoustonHoustonHouston
JacksonvilleJacksonvilleJacksonvilleJacksonvilleJacksonvilleJacksonvilleJacksonvilleJacksonvilleJacksonville
Los AngelesLos AngelesLos AngelesLos AngelesLos AngelesLos AngelesLos AngelesLos AngelesLos Angeles
MemphisMemphisMemphisMemphisMemphisMemphisMemphisMemphisMemphis
MilwaukeeMilwaukeeMilwaukeeMilwaukeeMilwaukeeMilwaukeeMilwaukeeMilwaukeeMilwaukeeNew YorkNew YorkNew YorkNew YorkNew YorkNew YorkNew YorkNew YorkNew York
PhiladelphiaPhiladelphiaPhiladelphiaPhiladelphiaPhiladelphiaPhiladelphiaPhiladelphiaPhiladelphiaPhiladelphia
San AntonioSan AntonioSan AntonioSan AntonioSan AntonioSan AntonioSan AntonioSan AntonioSan Antonio
San DiegoSan DiegoSan DiegoSan DiegoSan DiegoSan DiegoSan DiegoSan DiegoSan Diego
San FranciscoSan FranciscoSan FranciscoSan FranciscoSan FranciscoSan FranciscoSan FranciscoSan FranciscoSan FranciscoSan JoseSan JoseSan JoseSan JoseSan JoseSan JoseSan JoseSan JoseSan Jose
Ranges for Latino EOs as % of Total Latino EOs in USMeans
0.4 to 40.6 (11)0.3 to 0.4 (1)0.2 to 0.3 (5)0.1 to 0.2 (7)0 to 0.1 (26)
United States
llllllllln
n
n --
-
-
--
-
- --
-
n-
-
-
-
PhoenixPhoenixPhoenixPhoenixPhoenixPhoenixPhoenixPhoenixPhoenix
WashingtonWashingtonWashingtonWashingtonWashingtonWashingtonWashingtonWashingtonWashington
BostonBostonBostonBostonBostonBostonBostonBostonBoston
ChicagoChicagoChicagoChicagoChicagoChicagoChicagoChicagoChicago
DallasDallasDallasDallasDallasDallasDallasDallasDallas
HoustonHoustonHoustonHoustonHoustonHoustonHoustonHoustonHoustonJacksonvilleJacksonvilleJacksonvilleJacksonvilleJacksonvilleJacksonvilleJacksonvilleJacksonvilleJacksonville
MemphisMemphisMemphisMemphisMemphisMemphisMemphisMemphisMemphis
New YorkNew YorkNew YorkNew YorkNew YorkNew YorkNew YorkNew YorkNew YorkSan FranciscoSan FranciscoSan FranciscoSan FranciscoSan FranciscoSan FranciscoSan FranciscoSan FranciscoSan Francisco
Ranges for Asian EOs as % of Total Asian EOs in USMeans
1.2 to 51.5 (6)0.9 to 1.2 (2)0.6 to 0.9 (3)0.3 to 0.6 (4)0 to 0.3 (35)
United States
Overall, our mapping of multicultural elected leadership suggests rather distinctive
patterns for each racial group across the states of the nation. Overlap among the three groups appears limited to a few states and urban areas.4
County Analysis
Further exploration of the geographical landscape was undertaken at the county level;
that is, identifying in which counties the elected officials reside. Table 6 shows the nation’s top counties with the number of Black, Latino, and Asian elected officials in each county. The table
4 Of perhaps even greater interest is the fact that there were only a handful of elected officials who were listed in more than one directory suggesting that, while racial identification in the U.S. is no longer exclusively Black or white, there is little multiracial categorization at the present time.
Figure 6. Distribution of Latino Elected Officials, by State
Figure 7. Distribution of Asian Elected Officials

Race, Gender and Descriptive Representation: An Exploratory View of Multicultural Elected Leadership in the United States, C. Hardy-Fanta, C. Sierra, P. Lien , D. Pinderhughes, and W. Davis. APSA 9/3/05. 12
shows county of residence5 by number of elected officials (inclusive of all positions in the study) by racial group.
Table 6. Top Counties of Nonwhite Elected Officials
County Rank (Total Nonwhite Elected Officials)
Black (N=7,557) N Latino (N=3,929) N Asian (N=308) N
1 Cook, IL 248 Los Angeles, CA 263 Los Angeles, CA 49 2 St. Louis, MO 108 Hidalgo, TX 222 Honolulu, HI 45 3 Bolivar, MS 77 Cameron, TX 113 Santa Clara, CA 27 4 St. Clair, IL 71 El Paso, TX 95 Alameda, CA 17 5 Prince George, MD 70 Maricopa, AZ 93 Maui, HI 14 6 Wayne, MI 67 Fresno, CA 90 Hawaii, HI; Kauai, HI 12 7 Crittenden, AR;
Cuyahoga, OH 58 Bexar, TX 71 King, WA 10
8 Jefferson, AL 54 Nueces, TX 61 Queens, NY; San Mateo, CA
9
9 Kings, NY 52 Tulare, CA 54 Orange, CA 8 10 Philips, AR 49 Webb, TX 50 Sacramento, CA; San
Francisco, CA 7
11 Essex, NJ 42 Cook, IL 49 Fresno, CA 6 12 Camden, NJ;
Kankakee, IL; Sumter, AL; Washington, MS
39 Kern, CA 47 San Joaquin, CA; Thurston, WA
5
13 Anne Arundel, MD; Charleston, SC; Los Angeles, CA
38 Duval, TX; Imperial, CA
46 Merced, CA; Solano, CA; Humboldt, CA
4
At first glance, the nation’s top counties of non-white elected officials appear to have
very little interaction in terms of their jurisdictions of representation. Los Angeles and Fresno are the only two top counties where Asian and Latino officials overlap. And Cook is the county where both Blacks and Latinos share a high number of representatives. Los Angeles is the single county where each of the three non-white groups can claim to have a relatively good size of representation.
As we compare the total county distribution of each group of non-white elected officials, the opportunity structure for cross-racial coalition building appears to significantly increase:
• Of the 81 counties with Asian representation, 56 (69 percent) have Latino elected officials and 57 or 70 percent have Black elected officials;
• Of the 326 counties with Latino representation, 154 (47 percent) have Black elected officials and 56 (17 percent) have Asian elected officials;
• Of the 790 counties with Black representation, 154 (19 percent) have Latino elected officials and 57 or (7 percent) have Asian elected officials.
As most of the non-white elected officials are found at the local level, we would assume
that the opportunity for cross-racial coalition is to be found in certain localities where there are racially diverse elected officials in the governing body. In all, 33 counties have multiracial 5 For those officials holding office beyond the county level, we report the county of their local office (in general). We are restricted by the methods used in the national directories, which may not be consistent across the board. We will make the data more consistent and conduct analysis by level of office in future research.
Race, Gender and Descriptive Representation: An Exploratory View of Multicultural Elected Leadership in the United States, C. Hardy-Fanta, C. Sierra, P. Lien , D. Pinderhughes, and W. Davis. APSA 9/3/05. 13
Table 7. State Legislators by Size of Place and Race(N=943)
22 20
52.4% 47.6%
17 58
22.7% 77.3%
529 73
87.9% 12.1%
196 28
87.5% 12.5%
764 179
81.0% 19.0%
American Indian
Asian
Black
Latino
Total
Population5,000+
Population <5,000
Size of (Census) Place
representation of Asian, Latino, and Black officials. This total includes 41 percent of the counties with APEOs, 10 percent of those counties with HEOs, and 4 percent of the counties with BEOs.
These data provide an exploratory view of the representation of color in the country. We appear to have two initial answers to the question where do we find multicultural leadership, in the sense of all of our major racial/ethnic groups holding office in the same political units, jurisdictions, or geographic areas? The sharing of “leadership space” appears somewhat limited: only a handful of states contain elected officials from more than two of our racial population groups (not counting whites). Mostly, the demographic distribution of elected officials of color shows rather distinct areas dominated by one group or another, with not many overlapping areas. At the same time, opportunities for cross-racial coalition do exist, especially in local political arenas where at least two, if not all three, of the racial groups under study hold public office.
One note of qualification: our database only allows us to analyze the possible space of inter-minority group coalition, which is not the same as cross-racial, bi-racial, multi-racial or inter-group coalitions that typically involve liberal whites. When whites—men and women—are taken into account, we expect prospects for coalition-building to increase across all groups. Another View of Place
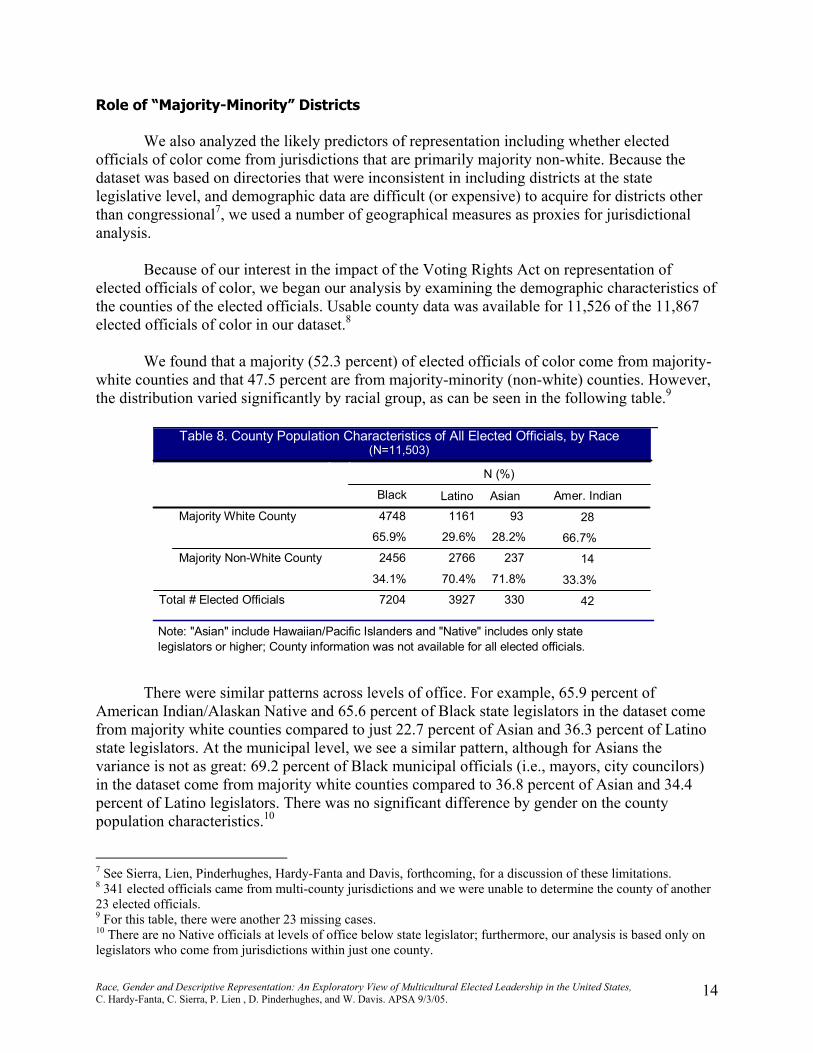
As part of our exploration of where elected officials of color are located, we identified the size of the city/town from which they come. A majority, 57.8 percent, of elected officials of color comes from places6 with populations of 5,000 or greater in size. This finding corresponds to the fact that the majority of those in the dataset are municipal officials and 76.4 percent of those from all places are in municipal or school board offices. When the analysis includes only state legislators, we find that 81 percent of these legislators come from places 5,000 or larger. This varies significantly by race, however. Table 7 shows that almost 90 percent of Black and Latino legislators come from larger cities and towns compared to Asian and American Indian (including Alaskan) legislators; almost 80 percent of Asian and almost half of the American Indian/Alaskan legislators come from places of less than 5,000 people.
6We linked census place demographic data to the city/town listed as the local address of each elected official.
Race, Gender and Descriptive Representation: An Exploratory View of Multicultural Elected Leadership in the United States, C. Hardy-Fanta, C. Sierra, P. Lien , D. Pinderhughes, and W. Davis. APSA 9/3/05. 14
Role of “Majority-Minority” Districts
We also analyzed the likely predictors of representation including whether elected officials of color come from jurisdictions that are primarily majority non-white. Because the dataset was based on directories that were inconsistent in including districts at the state legislative level, and demographic data are difficult (or expensive) to acquire for districts other than congressional7, we used a number of geographical measures as proxies for jurisdictional analysis.
Because of our interest in the impact of the Voting Rights Act on representation of elected officials of color, we began our analysis by examining the demographic characteristics of the counties of the elected officials. Usable county data was available for 11,526 of the 11,867 elected officials of color in our dataset.8
We found that a majority (52.3 percent) of elected officials of color come from majority-white counties and that 47.5 percent are from majority-minority (non-white) counties. However, the distribution varied significantly by racial group, as can be seen in the following table.9
There were similar patterns across levels of office. For example, 65.9 percent of
American Indian/Alaskan Native and 65.6 percent of Black state legislators in the dataset come from majority white counties compared to just 22.7 percent of Asian and 36.3 percent of Latino state legislators. At the municipal level, we see a similar pattern, although for Asians the variance is not as great: 69.2 percent of Black municipal officials (i.e., mayors, city councilors) in the dataset come from majority white counties compared to 36.8 percent of Asian and 34.4 percent of Latino legislators. There was no significant difference by gender on the county population characteristics.10
7 See Sierra, Lien, Pinderhughes, Hardy-Fanta and Davis, forthcoming, for a discussion of these limitations. 8 341 elected officials came from multi-county jurisdictions and we were unable to determine the county of another 23 elected officials. 9 For this table, there were another 23 missing cases. 10 There are no Native officials at levels of office below state legislator; furthermore, our analysis is based only on legislators who come from jurisdictions within just one county.
Table 8. County Population Characteristics of All Elected Officials, by Race (N=11,503)
934748 1161
28.2%65.9% 29.6%
2372456 2766
71.8%34.1% 70.4%
3307204 3927
Majority White County
Majority Non-White County
Total # Elected Officials
AsianBlack Latino
N (%)
Note: "Asian" include Hawaiian/Pacific Islanders and "Native" includes only state legislators or higher; County information was not available for all elected officials.
28 66.7%
14 33.3%
42
Amer. Indian
Race, Gender and Descriptive Representation: An Exploratory View of Multicultural Elected Leadership in the United States, C. Hardy-Fanta, C. Sierra, P. Lien , D. Pinderhughes, and W. Davis. APSA 9/3/05. 15
The Voting Rights Act: A Brief History The mobilization of people of color for access and representation in the political system and key public policies developed to address these demands provide an important context for understanding the ascension of non-white groups into the elected leadership ranks of the nation. Protests and mass mobilizations of the 1950s and 1960s associated with the African American Civil Rights Movement culminated in the passage of the Civil Rights Act of 1964 and the Voting Rights Act (VRA) of 1965. The 1964 Civil Rights Act was especially significant for gender equality because of the introduction of the Smith amendment during Congressional debate. Often referred to as a “killer amendment,” this added the policy area of gender to the domain of civil rights law and required the existing civil rights agencies, including the U.S. Commission on Civil Rights, the Civil Rights Division in the Department of Justice, and the Office for Civil Rights in the Department of Health, Education and Welfare (now Health and Human Services) to address gender as well as racial discrimination. This also led to legislative policy areas, as well as new administrative agencies, for addressing gender discrimination. (See for example, Federal Glass Ceiling Commission 1995.) The Voting Rights Act of 1965 was particularly important in laying the foundation for full electoral participation of African Americans. The Voting Rights Act, as first passed in 1965, applied specifically to African Americans, based on the long history of racial discrimination that was acknowledged by the U.S. Congress. Section 2 of the Act reaffirmed the 15th amendment, passed after the Civil War, establishing the right of the former slaves to vote. The 1965 Act also created special powers for the federal government to intervene in the electoral process to verify that there were states or local governments did not block access to registration and voting by African Americans. Registration and voting are routinely recognized in the federal system to be the purview of state and local governments.
The right of the federal government to intervene in the traditionally state and local electoral processes was recognized in Sections 4 and 5 of the Voting Rights Act. Jurisdictions that met certain criteria, based on the proportion of the population registered to vote and their use of barriers to registration and voting, were designated as “covered jurisdictions” and were consequently subjected to extremes of federal intervention in their electoral process. These included a number of states covered as a whole (Alabama, Georgia, Virginia, South Carolina, Mississippi, and Louisiana) and portions of other states as well as a number of counties in North Carolina. Jurisdictions meeting these criteria were required to submit any voting law changes to the Civil Rights Division of the Department of Justice or to the first district of the federal courts. If proposed changes were found to violate the rights of Black voters the federal agency or court could object to the change.
The Department of Justice’s Civil Rights Division had responsibility for implementation
and enforcement of the Voting Rights Act, which was recognized as constitutional and interpreted by the federal courts. The first impact was felt obviously in terms of the shift upward in the total numbers of Black elected officials, males and females, as noted in earlier sections of this paper.
Race, Gender and Descriptive Representation: An Exploratory View of Multicultural Elected Leadership in the United States, C. Hardy-Fanta, C. Sierra, P. Lien , D. Pinderhughes, and W. Davis. APSA 9/3/05. 16
In time, Olson’s notions of legislation as a resource being used by other racial and ethnic groups developed within a decade of the Act’s first passage (Olson 1971). The legislation’s limited time frame offered the opportunity for new types of racial and ethnic constituencies to be incorporated into the policy. In 1975 the Mexican American Legal Defense and Education Fund, other Latino organizations and other organizations in the Civil Rights coalition supporting the extension of the Voting Rights Act, lobbied the Justice Department. They succeeded in bringing Mexican Americans under coverage, based on their status as language minorities (Pinderhughes 1995; Jones-Correa 2005). The amendment in the 1975 Extension was not based on a specific racial, nationality, or language group, but on the generic category of language minorities. The coverage criteria in this case was in jurisdictions in which language groups reached a sufficient size, and in which the population’s illiteracy rate was 5 percent higher than the national average. So while advocacy groups for Spanish language coverage (i.e., Latino organizations) generated the resources to add a specific group to the policy area, any language group that met the specific criteria, whether Spanish speaking, Japanese, Chinese, Hmong, Haitian Creole, could be incorporated into the legislation. It was in the 1970s and 1980s that the racial, ethnic and new language groups, that were being admitted into the United States by the 1965 immigration act (DeSipio and de la Garza, 1998), also gained protection against possible electoral discrimination. The minority language provisions, Sections 203 and 4(f)4, precipitated coverage of American Indians, Asian Americans, Alaskan Natives, and Spanish-heritage citizens; under these provisions, Alaska, Arizona, and Texas were covered by Section 5 in 1975. A significant number of new counties were also covered. Section 203 referred to written languages and 4(f)4 to unwritten, that is, oral languages. Jurisdictions dealing with language minorities were required to provide registration, voting materials, notices, and ballots in the language of the group as well as in English (Civil Rights Division 2005). After the Voting Rights Act was extended in 1982, the definitions of discrimination that had at first applied primarily to African American access to registration and to voting took on considerably expanded meaning. Minority vote dilution, recognized as a constraint on the election to office of racial, ethnic and language minorities, was addressed and acknowledged in the 1982 legislative campaign. The Supreme Court set criteria for implementation of protections against minority vote dilution in Thornburg v. Gingles, permitting the creation of so-called majority-minority districts in 1986. By 1990 the confluence of the U.S. Census and the constitutional recognition of majority-minority districts led to the creation of a significant number of new electoral districts in the U.S. House of Representatives and in state and local legislative bodies (Parker 1990; Swain 1995; Lublin 1997; Grofman 1998). While this concept began to be challenged in a case arising out of the 1992 North Carolina case, Shaw v. Reno, the expansion of voting rights legislation to address registration and voting and the creation of legislative districts set the stage for substantial expansion in the numbers of elected officials of color among women and men. We now turn to a discussion of our dataset in light of voting rights provisions. While we have not conducted analysis by gender, we can report the particularly striking finding that the vast majority of elected officials of color were elected in jurisdictions covered by the Voting Rights Act.

Race, Gender and Descriptive Representation: An Exploratory View of Multicultural Elected Leadership in the United States, C. Hardy-Fanta, C. Sierra, P. Lien , D. Pinderhughes, and W. Davis. APSA 9/3/05. 17
*Data were missing from 12 cases.
Table 9. Elected Officials of Color, by VRA Statute and Race (N=11, 855)*
1 3 3587 13 3604
2.3% .9% 47.5% .3% 30.4%
7 231 742 1578 2558
16.3% 68.3% 9.8% 40.2% 21.6%
8 2 319 79 408
18.6% .6% 4.2% 2.0% 3.4%
3 3 48 60 114
7.0% .9% .6% 1.5% 1.0%
3 0 0 0 3
7.0% .0% .0% .0% .0%
3 13 194 1901 2111
7.0% 3.8% 2.6% 48.4% 17.8%
18 86 2655 298 3057
41.9% 25.4% 35.2% 7.6% 25.8%
43 338 7545 3929 11855
05
203
05 and 4f4
05 and 203
203 and 4f4
05 and 4f4and 203
Not covered
VRA Statute
Total
Amer. Ind. Asian Black Latino Total
VRA Protections and Descriptive Representation: Findings from National Database
Of the 11,867 non-white elected officials identified nationwide in our database, 74.2 percent were elected from jurisdictions covered by the VRA statutes. As Table 9 shows, that percentage was particularly high among non-Blacks. Up to three-quarters (74.6 percent) of Asian American elected officials were from jurisdictions covered by Section 203 provisions alone or in combination with other provisions (68.3 percent were by Section 203 alone). Whereas about 4 in 10 Latino elected officials were from Section 203-alone jurisdictions, half of Latino elected officials were from jurisdictions covered together by Section 203, Section 5, and Section 4(f)(4). In total, as high as 92.4 percent of Latino elected officials were elected from VRA-covered jurisdictions. In contrast, over half (55 percent) of the 7,548 Black elected officials in our database came from Section 5 jurisdictions (47.5 percent were by Section 5 alone), while just over one-tenth (13 percent) were from Section 203 jurisdictions. In total, 64.8 percent of Black elected officials were from VRA covered jurisdictions.
Among non-white elected officials serving in Congress, 100 percent of Latinos and 80 percent of Asians, but only 71 percent of Blacks, were from VRA covered jurisdictions. In the state legislatures, 57 percent of Blacks, 60 percent of American Indians, 65 percent of Asians, and 85.3 percent of Latinos were elected from jurisdictions covered by the VRA. In city councils, 62.9 percent of Blacks, 79.3 percent of Asians, and 90.6 percent of Latinos were from
Table 10. VRA Coverage by Level of Office and by Race
American Indians
Asians African Americans
Latinos
Congress
80% 71% 100%
State Legislatures 60% 65% 57% 85.3%
Municipal
79.3% 62.9% 90.6%
School Boards
85.4% 65.2% 95.3%
Race, Gender and Descriptive Representation: An Exploratory View of Multicultural Elected Leadership in the United States, C. Hardy-Fanta, C. Sierra, P. Lien , D. Pinderhughes, and W. Davis. APSA 9/3/05. 18
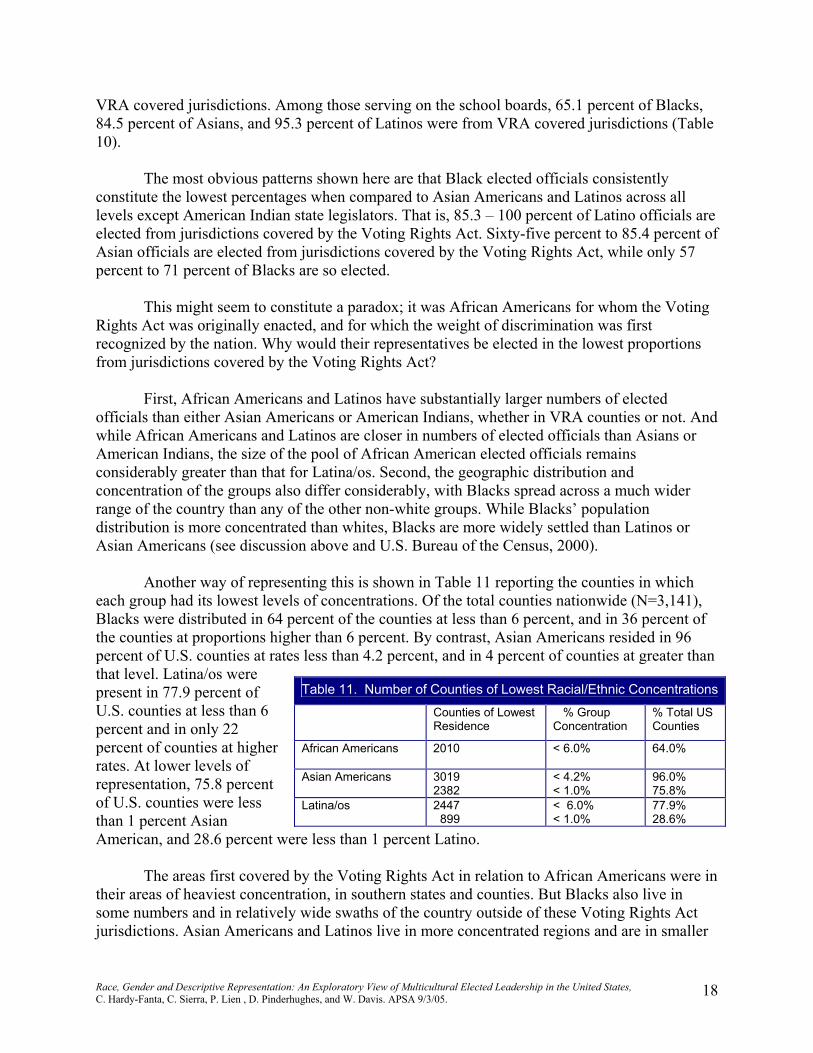
VRA covered jurisdictions. Among those serving on the school boards, 65.1 percent of Blacks, 84.5 percent of Asians, and 95.3 percent of Latinos were from VRA covered jurisdictions (Table 10).
The most obvious patterns shown here are that Black elected officials consistently constitute the lowest percentages when compared to Asian Americans and Latinos across all levels except American Indian state legislators. That is, 85.3 – 100 percent of Latino officials are elected from jurisdictions covered by the Voting Rights Act. Sixty-five percent to 85.4 percent of Asian officials are elected from jurisdictions covered by the Voting Rights Act, while only 57 percent to 71 percent of Blacks are so elected.
This might seem to constitute a paradox; it was African Americans for whom the Voting
Rights Act was originally enacted, and for which the weight of discrimination was first recognized by the nation. Why would their representatives be elected in the lowest proportions from jurisdictions covered by the Voting Rights Act?
First, African Americans and Latinos have substantially larger numbers of elected
officials than either Asian Americans or American Indians, whether in VRA counties or not. And while African Americans and Latinos are closer in numbers of elected officials than Asians or American Indians, the size of the pool of African American elected officials remains considerably greater than that for Latina/os. Second, the geographic distribution and concentration of the groups also differ considerably, with Blacks spread across a much wider range of the country than any of the other non-white groups. While Blacks’ population distribution is more concentrated than whites, Blacks are more widely settled than Latinos or Asian Americans (see discussion above and U.S. Bureau of the Census, 2000).
Another way of representing this is shown in Table 11 reporting the counties in which
each group had its lowest levels of concentrations. Of the total counties nationwide (N=3,141), Blacks were distributed in 64 percent of the counties at less than 6 percent, and in 36 percent of the counties at proportions higher than 6 percent. By contrast, Asian Americans resided in 96 percent of U.S. counties at rates less than 4.2 percent, and in 4 percent of counties at greater than that level. Latina/os were present in 77.9 percent of U.S. counties at less than 6 percent and in only 22 percent of counties at higher rates. At lower levels of representation, 75.8 percent of U.S. counties were less than 1 percent Asian American, and 28.6 percent were less than 1 percent Latino. The areas first covered by the Voting Rights Act in relation to African Americans were in their areas of heaviest concentration, in southern states and counties. But Blacks also live in some numbers and in relatively wide swaths of the country outside of these Voting Rights Act jurisdictions. Asian Americans and Latinos live in more concentrated regions and are in smaller
Table 11. Number of Counties of Lowest Racial/Ethnic Concentrations
Counties of Lowest Residence
% Group Concentration
% Total US Counties
African Americans 2010 < 6.0% 64.0%
Asian Americans
3019 2382
< 4.2% < 1.0%
96.0% 75.8%
Latina/os
2447 899
< 6.0% < 1.0%
77.9% 28.6%

Race, Gender and Descriptive Representation: An Exploratory View of Multicultural Elected Leadership in the United States, C. Hardy-Fanta, C. Sierra, P. Lien , D. Pinderhughes, and W. Davis. APSA 9/3/05. 19
proportions in larger sectors of the country. The language minority provisions are the trigger for Asians and Latinos in areas where they are in greatest concentration. Outside of those areas, their proportions are so small that their opportunities for electing representatives are much lower. Blacks are heavily concentrated in areas not necessarily covered by Section 5 of the VRA and, therefore, are evidently able to elect representatives despite that lack of coverage. Finally, we examine the nation’s elected officials of color by the racial characteristics of their county of residence. Specifically, we compare the extent of descriptive racial representation between officials elected from counties that are covered by the Voting Rights Act and those officials that are elected from all counties, including those not covered by the VRA. Those data are presented in Table 12. In all cases the racial group proportions are higher in VRA-alone than in all counties, suggesting that non-whites are more likely to win offices and receive descriptive representation in counties covered by the voting rights statutes. However, there are significant racial group differences. Latino officials tend to be in counties that were, on average, majority-Latino (53 percent for VRA and 51 percent for all counties) in 2000. Other non-white officials tend to be from counties where their respective race was not in the majority in 2000. For example, Black elected officials (BEOs) tend to be from counties that are on average 38 percent Black-alone in VRA counties and 33 percent Black-alone in all counties. Asian elected officials (APEOs) tend to be from counties that are 21 percent Asian-alone in VRA counties and 19 percent Asian-alone in all counties. American Indian elected officials (AIEOs) tend to be from counties that are 29 percent American Indian-alone in VRA and 25 percent American Indian-alone in all counties that elect American Indian officials.11 This table also shows that Asian officials are most likely to be elected from counties that are 12 percent Asian-alone and that half of APEOs are from VRA counties that are above 18 percent Asian. Black officials are most likely to be found in counties that are 26 percent Black-alone and that half of the BEOs are from VRA counties that are above 37 percent Black. Latino officials are most likely to be elected from counties that are 45 percent Hispanic and that half of the Latino elected officials are from VRA counties that are more than 48 percent Latino/a in the county population. Summary and Conclusions
This paper presents first-stage findings of a larger ongoing study of gender and multicultural leadership in the United States. In it we describe the trends in office-holding of Black, Latino/a, and Asian American elected officials at the congressional, statewide, state 11 Keep in mind that, due to data limitations discussed earlier, only American Indian state legislators are included in our database.
Table 12. Descriptive Racial Representation in VRA and ALL Counties with Nonwhite Elected Officials % Asian in
Counties with APEOs
% Black in Counties
with BEOs
% Latino in counties with HEOs
% Am Indian in Counties with AIEOs
Mean (VRA) 21.05 37.91 53.29 28.83 Median (VRA) 17.56 36.60 48.38 12.71 Mode (VRA) 11.95 26.14 44.56 11.38 Mean (ALL) 18.75 32.55 50.68 24.54 Median (ALL) 11.95 28.80 45.34 11.38 Mode (ALL) 11.95 26.14 44.56 8.70
Race, Gender and Descriptive Representation: An Exploratory View of Multicultural Elected Leadership in the United States, C. Hardy-Fanta, C. Sierra, P. Lien , D. Pinderhughes, and W. Davis. APSA 9/3/05. 20
legislative, municipal and school board levels, and then present a profile of current officials from those three racial groups plus American Indian state legislators. The goal is to offer a descriptive analysis of some broad features of the American elected leadership today with race and gender at its center. The paper also provides a look at the geographical or spatial landscape of the nation’s popularly elected officials of color and makes a preliminary attempt to assess the relationship between the Voting Rights Act and the election of non-white elected officials.
Analysis of our data also suggest that, although America’s multicultural leadership is
expanding in number and as a portion of the governing bodies at many levels of government, the sharing of leadership space among ethnoracial populations appears limited by demographic realities. However, our analysis helps identify places where the opportunity for inter-minority coalition building may be more viable. Finally, our analysis of the impact on the Voting Rights Act produces clear evidence of support for the various facilitating roles the VRA may have played in cultivating the nation’s multicultural elected leadership identified in our database.
In the end, coalitions across the multicultural spectrum may emerge as a function of
ideology, values, policy positions and/or experiences shared by elected officials of color, even if developed in separate and distinct contexts. At the same time it is possible that racial and ethnic politics in America will be defined by more competitive politics, with leadership reflecting separate and distinct political realities where coalitions come about on negotiated and temporal bases.
Being one of the first of its kind, our study generates as many answers as questions
concerning the origin, contours, and impacts of the past and current multicultural leadership and the future status of American democracy. While descriptive representation is important to describe and achieve, of perhaps greater interest is the extent to which elected officials of color offer substantive representation—and whether there are gender differences as we hypothesize. We anticipate tackling some of the puzzles raised in this paper during our next stage of research, which includes a national survey of a selected group of these elected officials.
Race, Gender and Descriptive Representation: An Exploratory View of Multicultural Elected Leadership in the United States, C. Hardy-Fanta, C. Sierra, P. Lien , D. Pinderhughes, and W. Davis. APSA 9/3/05. 21
References Barreto, Matt A., Gary M. Segura, and Nathan D. Woods. 2004. “The Mobilizing Effect of
Majority-Minority Districts on Latino Turnout.” American Political Science Review, Vol. 98, No. 1 (February): 65-75.
Barrett, Edith J. 1995. “The Policy Priorities of African American Women in State
Legislatures.” Legislative Studies Quarterly, Vol. 20, No. 2 (May): 223-247. Bositis, David A. 2003. “Black Elected Officials Reach Historic Highs: Women Drive the
Increase.” Focus: The Magazine of the Joint Center for Political and Economic Studies. Vol. 31, Issue 6 (November/December): 3-4.
Button, James, Scott Richards, and Evelyn Bethune. 1998. “A Look at the Second Generation
of Black Elected Officials in Florida.” State and Local Government Review, Vol. 30, No. 3 (Fall): 181-189.
Civil Rights Division, Dept of Justice. 2005. “About Language Minority Voting Rights.”
Retrieved from http://www.usdoj.gov/crt/voting/ sec_203/activ_203.htm#coveredjuris Cohen, Cathy J., Kathleen B. Jones, and Joan Tronto, eds. 1997. Women Transforming Politics:
An Alternative Reader. New York: New York University Press. Darcy, R., Susan Welch, and Janet Clark. 1994. Women, Elections, and Representation. 2nd
Edition. Lincoln, NE: Nebraska University Press. DeSipio. Louis and Rodolfo O. de la Garza. 1998. Making Americans, Remaking America:
Immigration and Immigrant Policy. Boulder, CO: Westview Press. Dovi, Suzanne. 2002. “Preferable Descriptive Representatives: Will Just Any Woman, Black,
or Latino Do?” American Political Science Review, Vol. 96, No. 4 (December): 729-743. Federal Glass Ceiling Commission. 1995. Good for Business: Making Full Use of the Nation’s
Human Capital. Washington, DC, March. Gay, Claudine. 2001. “The Effect of Black Congressional Representation on Political
Participation.” American Political Science Review, Vol. 95, No. 3 (September): 589-602.
Gay, Claudine. 2002. “Spirals of Trust? The Effect of Descriptive Representation on the
Relationship between Citizens and Their Government.” American Journal of Political Science, Vol. 46, No. 4 (October): 717-732.
Gay, Claudine and Katherine Tate. 1998. “Doubly Bound: The Impact of Gender and Race on
the Politics of Black Women.” Political Psychology, Vol. 19, No. 1: 169-184.
Race, Gender and Descriptive Representation: An Exploratory View of Multicultural Elected Leadership in the United States, C. Hardy-Fanta, C. Sierra, P. Lien , D. Pinderhughes, and W. Davis. APSA 9/3/05. 22
Grofman, Bernard and Lisa Handley. 1998. “Voting Rights in the 1990s: An Overview.” In
Race and Redistricting in the 1990s. Edited by Bernard Grofman. New York: Agathon Press, pp. 69-79.
Hardy-Fanta, Carol. (1993). Latina Politics, Latino Politics: Gender, Culture and Political
Participation in Boston. Philadelphia: Temple University Press. Hawkesworth, Mary. 2003. “Congressional Enactments of Race-Gender: Toward a Theory of
Race-Gendered Institutions.” American Political Science Review, Vol. 97, No. 4 (November): 529-550.
Ignatiev, Noel. 1995. How the Irish Became White. New York: Routledge. Jones-Correa, Michael. 2005. “Language Provisions Under the Voting Rights Act: How
Effective Are They?” Social Science Quarterly, Vol. 86, Issue 3 (September): 549-564. Lemus, Frank. 1973. National Roster of Spanish Surnamed Elected Officials. Los Angeles:
Aztlan Publications. Lien, Pei-te. 1998. “Does the Gender Gap in Political Attitudes and Behavior Vary Across
Racial Groups? Comparing Asians to Whites, Blacks, and Latinos,” Political Research Quarterly, 51(4), 869-894.
______. 2001. The Making of Asian America Through Political Participation. Philadelphia:
Temple University Press.
Lublin, David. 1997. The Paradox of Representation: Racial Gerrymandering and Minority Issues in Congress. Princeton, NJ: Princeton University Press.
Mansbridge, Jane. 1999. “Should Blacks Represent Blacks and Women Represent Women? A
Contingent ‘Yes’.” Journal of Politics, Vol. 61 (August): 628-657. Manuel, Tiffany. (2004). “Becoming Acquainted with Ambivalence: An Intersectionality
Approach to Studying Politics, Public Policy, and Women’s Political Leadership.” Unpublished paper prepared for the Gender and Multicultural Leadership Project. Boston: Center for Women in Politics and Public Policy
McClain, Paula D. and Joseph Stewart, Jr. 2002. “Can We All Get Along?”: Racial and Ethnic
Minorities in American Politics. Boulder, CO: Westview Press, third edition. Menifield, Charles E., ed. 2001. Representation of Minority Groups in the U.S.: Implications
for the Twenty-First Century. Lanham, MD: Austin & Winfield Publishers. Montoya, Lisa, Carol Hardy-Fanta, and Sonia Garcia. 2000. “Latina Politics: Gender,
Participation, and Leadership.” PS: Political Science & Politics, Vol. 33, No. 3 (September): 555-561.

Race, Gender and Descriptive Representation: An Exploratory View of Multicultural Elected Leadership in the United States, C. Hardy-Fanta, C. Sierra, P. Lien , D. Pinderhughes, and W. Davis. APSA 9/3/05. 23
Nakanishi, Donald, and James Lai. 1978-2004. National Asian Pacific American Political
Almanac, First to Ninth Editions. Los Angeles, CA: UCLA Asian American Studies Center.
NALEO (National Association of Latino Elected and Appointed Officials). 1985-2004.
Directory of Latino Elected Officials. 1985 to 2004 editions. Formerly published under National Roster of Hispanic Elected Officials. Los Angeles, CA: NALEO.
Olson, Mancur. 1971. The Logic of Collective Action: Public Goods and the Theory of Groups.
Revised edition. Cambridge, MA: Harvard University Press. Ong, Elena. 2001. “Transcending the Bamboo and Glass Ceilings: Defining the Trajectory to
Empower Asian Pacific American Women in Politics.” In 2001-02 National Asian Pacific American Political Almanac. Edited by Don Nanakishi and James La. Los Angeles: UCLA Asian American Studies Center Press, pp. 96-129.
Ortiz, Vilma. 1994. “Women of Color: A Demographic Overview.” In Women of Color in U.S.
Society. Edited by Maxine Baca Zinn and Bonnie Thornton Dill. Philadelphia: Temple University Press, pp. 13-40.
Pachon, Harry and Louis DeSipio. 1992. “Latino Elected Officials in the 1990s.” PS: Political
Science & Politics, Vol. 25, No. 2 (June): 212-217. Parker, Frank R. 1990. Black Votes Count: Political Empowerment in Mississippi after 1965.
Chapel Hill, NC: The University of North Carolina Press. Pinderhughes, Dianne. 1995. “Black Interest Groups and the 1982 Extension of the Voting
Rights Act.” In Blacks and the American Political System. Edited by Huey L. Perry and Wayne Parent. Gainesville: University Press of Florida, pp. 203-224.
Scola, Becki. 2005. “Women of Color State Legislators: Investigating Variation Across the
States.” Paper presented at the Annual Meeting of the Western Political Science Association, Oakland, California, March 17-19, 2005.
Sierra, Christine and Adaljiza Sosa-Riddell. 1994. “Chicanas as Political Actors: Rare
Literature, Complex Practice.” National Political Science Review. Vol. 4: 297-317. Swain, Carol M. 1995. Black Faces, Black Interests: The Representation of African Americans
in Congress. Enlarged Edition. Cambridge, MA: Harvard University Press. Takash, Paule Cruz. 1993. “Breaking Barriers to Representation: Chicana/Latina Elected
Officials in California.” Urban Anthropology 22 (3-4): 325-360. Tate, Katherine. 2003. Black Faces in the Mirror: African Americans and Their Representation
in Congress. Princeton, NJ: Princeton University Press.
Race, Gender and Descriptive Representation: An Exploratory View of Multicultural Elected Leadership in the United States, C. Hardy-Fanta, C. Sierra, P. Lien , D. Pinderhughes, and W. Davis. APSA 9/3/05. 24
U.S. Bureau of the Census. 2000. “Census Briefs: African American, Asian American, Latino/a, and Native American. Retrieved from the Internet 8/22/05 from http://factfinder.census.gov/servlet/GCTTable?_bm=y&-geo_id=01000US&-_box_head_nbr=GCT-P6&-ds_name=DEC_2000_SF1_U&-_lang=en&-format=US-9&-_sse=on
______. 2005. Table 405. Black Elected Officials by Office, 1970 to 2001, and State, 2001 Statistical Abstract of the United States, 2004-2005. Retrieved from the Internet 8/28/05 from
http://www.census.gov/prod/2004pubs/04statab/election.pdf