RACE FOR THE BUDGET: Diversity and Community in School ...€¦ · effects of diversity on American...
138
1 RACE FOR THE BUDGET: Diversity and Community in School District Elections Presented to the Department of Government in partial fulfillment of the requirements for the degree with honors of Bachelor of Arts Harvard College March 2012
Transcript of RACE FOR THE BUDGET: Diversity and Community in School ...€¦ · effects of diversity on American...

1
RACE FOR THE BUDGET: Diversity and Community in School District
Elections
Presented to the Department of Government
in partial fulfillment of the requirements for the degree with honors
of Bachelor of Arts
Harvard College March 2012

2
Table of Contents
1. Chapter 1: Introduction……………………………….…..............page 3 2. Chapter 2: Literature Review……………………………….……..page 12 3. Chapter 3: School Budget Referenda: An Overview....................page 34 4. Chapter 4: Methods………………..……………….………………page 46 5. Chapter 5: Results…..………………………………………...........page 68 6. Chapter 6: Conclusions…………………………..………...………page 93 7. Bibliography………………………………………………………...page 115 8. Appendix…………………………………………………………….page 125

3
CHAPTER ONE: INTRODUCTION
“Don’t forget, sooner or later, those kids from the private schools are gonna have to come together with the kids from the public schools. To those kids who go to private school, you need to understand that there’s a public world here that you need to live in… I’m not here to say to you that you have to do this or you have to do that. We are obviously aware that you are here because people voted you in. However, there is a bigger responsibility that you have, and that’s as an American… I come here tonight not to plead, not to beg, not even to ask, because I don’t think I should have to ask for what our kids need, and what all kids need. While it may not be a direct part of the budget, it is [a part], because it is that atmosphere, it’s that ambiance that you bring to the table - that says I disrespect you and you’re less than I am. We can talk about the budget, but until you change that mentality about our kids in this district, nothing’s gonna change.”
-Willie J. Trotman, President, Spring Valley NAACP East Ramapo School District Budget Community Forum, March 12, 2010.
Each spring in New York and New Jersey, citizens enter the voting booth
to weigh in on the annual budgets for their community’s public schools. At the
same time that voters elect members of their local school boards, they cast a
“Yes” or “No” vote on the school budget proposed for the upcoming academic
year. This process is fairly uncommon in form in American politics: it is one of
the rare occasions when citizens, organized on a small, community lines, are
granted the opportunity to directly accept or reject their rate of taxation.
School elections are also unique, however, because of the distinct
relationship between the public schools and community life. In some ways, the
institutions of school governance represent one of the last bastions of the “belief
that local government is the most democratically legitimate government”
(McDermott 1999, 13). Citizens and localities have traditionally displayed a
sense of ownership over their schools that is simply unmatched in other public

4
institutions. If the “commitment of resources in support of education by
communities” is a “reasonable measure of social capital,” then one can argue
that votes about school spending are also votes about our communities and social
trust (Goldin and Katz 1999, 687).
Therefore, as a direct behavioral manifestation of attitudes towards public
investment, school budget elections provide a fitting test for my study on the
effects of diversity on American communities. They give us the capacity to
examine how people feel about their neighbors, their schools, and their taxes.
They also allow us to observe how race and heterogeneity affect real-world
outcomes.
Election Day
May 17, 2011 was school election day in New York State.
A somewhat sleepy 12.6% of voting-age citizens in eligible districts across
the state made their way to the polls to choose their representatives on the school
board and approve or reject their school budgets.1 In East Ramapo Central
School District (CSD), however, a hearty 16,946 voters across the district, or at
least 20% of the eligible voting-age population, cast votes at one of ten district
polling places. As voters drove over to Kakiak Elementary, Hillcrest Elementary,
or other school voting sites, they would most likely take Route 59, a busy local
thoroughfare. Along the way, they would pass authentic Mexican Restaurants
like El Bandido and Hacienda, the Royal Caribbean Bakery- a hotspot for Jamaican
1 Unless otherwise noted, all election data are from the New York State Education Department (NYSED) and the New Jersey Department of Education (NJDOE).

5
pastries, Food Mart International- a hub for every kind of ethnic specialty, from
Haitian cornmeal, to Vietnamese rice noodles to okra for Caribbean vegetable
stew. They would see Jing Fong Chinese restaurant, Pupusa Magica Restaurante
Salvadoreno- fine cuisine from El Salvador, a
Polish grocery store, Dera Food- the Indian
market, Pak Khan Halal Meat, and Portuguese
Churrasquiera. Spring Valley, NY, home to
East Ramapo and Spring Valley High
Schools, is the official mailing address for
descendants of over 100 nationalities. 66.4%
of its residents speak a language other than
English at home (U.S. Census).
But if the voters were to continue
westward on Route 59 towards Monsey, they
would begin to notice a visible change in
venues and style of dress. Monsey, New York
is the site of the third-largest concentration of
Orthodox Jews in the world after Israel and
Brooklyn (Berger 1997). As the Orthodox
community has increased with rapid population growth and migration from New
York City, they have expanded into the western-most parts of Spring Valley that
converge with Monsey. The heart of this community, however, still remains in
Monsey. As Route 59 and the school district pass through downtown Monsey,
shop signs are listed in both English and Yiddish: Bais Hasforim, Chai Pizza &
FIGURE 1. School election polling places in East Ramapo CSD (Source: East Ramapo Central School District; District Clerk, Voting and Election Info)

6
Falafel, Esti’s World of Fashion, Tuvia’s Seforim, Judaica, and Gifts, Kosher Castle, Kol
Tov Pizza, Pita Land Chai. Men with traditional pais2 and beards dot the streets.
Women in long skirts push strollers.
A district of approximately 110,000
residents about 35 miles northwest of New
York City, East Ramapo Central School
District has a general population that is 65.2%
white, 21% black, 4.3% Asian, 6.8% other,
and 2.4% multiracial as of the 2010 Census.3
The average homeowner in East Ramapo
occupies a house valued at $215,700. The
district has a median family income of
$61,122 and 18.8% of its residents live below
the poverty line.
The students attending the school
district, however, tell a much different
demographic tale. Out of the approximately 8,100 students that attend public
schools in East Ramapo, 91% of them are students of color, descending primarily
from Haitian, Latino or African-American backgrounds. In contrast to the 18%
of district residents calculated to fall under the poverty line, the poverty levels of
district students reached an all-time high in 2011: 70.3% of students were eligible
for free or reduced-price lunch (Nicosia 2012). In 2007, 62% of high school
2 Pais are ringlets of hair that fall in front of the ears. They are common style in the Hasidic subset of Orthodox Judaism. 3 Unless otherwise noted, all demographic data are supplied by the National Center for Education Statistics.
FIGURE 2. The star indicates the location of East Ramapo CSD in New York State. (Source: County of Rockland)

7
students in East Ramapo were black, 16.5% were Hispanic, and 12% were white,
while at the K-3 level, 51.2% were black, 28.8% were Hispanic, and 12.2% were
white. By 2010, these numbers had shifted to 53.7% black, 30.1% Hispanic, 6.9%
Asian, and 9.1% white. It has been identified as a “high need, low resource”
district by the New York State Education Department (NYSED), based off the
level of student poverty (the percentage of students grades K-6 who quality for
free lunch) and the financial resources of the school district. East Ramapo has a
graduation rate of 71% (NYSED).
Yet, as home to at least 56 yeshivas4 (up from 45 in 1997) and about
20,000 private school students, public school spending in East Ramapo has faced
vociferous opposition (Reddy 2011). The East Ramapo Board of Education is
currently controlled by Orthodox Jews, who hold six out of the nine seats, even
though the children of Orthodox Jews almost always attend private schools. The
"private school community," as it is generally referred to in somewhat veiled
language, took over the school board ten years ago, supported by the power of
the "bloc vote" and rapid population growth (Applebome 2009).
Even with budgets with small tax increases, proposed by a school board
with this ethnic identity, the East Ramapo school budget was voted down in
2008 and 2010 by 59% and 73% of voters respectively, even while 92.5% and
92.2% of budgets statewide passed during those same years. Over a ten-year
period, five out of ten school budgets in East Ramapo were rejected, the highest
rate of rejection in New York State. As context, examine the results of the two
neighboring districts: in Clarkstown, a district with a population that was 81.6%
4 A Yeshiva is a religious Jewish private day school.

8
white and a student body that was 74.2% white, nine out of ten school budgets
passed over the same time period. Directly to the west, Ramapo Central School
District (Suffern, NY) passed all ten of its budgets. Whites represented 83.4% of
residents in the district and 75% of all students in Ramapo schools.
So perhaps the results this past year were wholly unsurprising. On May
17, 2011, 65% of East Ramapo voters voted against the $200.5 million budget, in
spite of the fact that 93.4% of school budgets passed statewide (NYSED). The
percentage of voters who voted “yes” (35%) was almost three standard deviations
below the state’s mean level of support of 63%. On the same ballot, four
Orthodox candidates for the school board also won election, maintaining their
community’s control of the board. All of this was following the budget defeat in
the election of 2010, when two Orthodox candidates were also elected to take the
spots of two other bloc candidates who had dropped out a week before the
election. One of these board members never attended a single campaign event,
skipped out on the interview with the local news, never provided information for
a candidate questionnaire, and did not show up at the candidates’ forums
(Applebome 2009). A reduced version of the 2010 budget eventually passed on a
second try, sparing the sports program, summer school, extracurricular activities,
and the assistant principal that would have been slashed in a mandated austerity
budget, but still cutting 125 full-time staff positions and closing one elementary
school in the process (O’Rourke 2010). In 2011, the reduced contingency budget
eliminated another 87 staff positions (Nicosia 2012).
Times are not looking much brighter in East Ramapo schools in the
immediate future. As the board holds preliminary meetings to sculpt the 2012-

9
2013 budget, the district faces the daunting task of closing a $15 million budget
shortfall, while gaining the approval of a population of voters unlikely to support
any significant increase in local tax burden. At the same time that the prospects
of budget passage don’t appear to be becoming any easier, poor academic
performance has reduced the amount of Title I federal funds for poor students
that the district will receive next year. Superintendent Joel Klein has announced
that another year of layoffs is all but certain (Nicosia 2012).
East Ramapo Central School District may be an unusual case of very
unique circumstances. Still, at the most basic level, this district illuminates some
of the most important questions and issues that this thesis hopes to address. It
shows just why school budget votes provide an ideal testing ground for my study
on the implications of diversity in communities.
A vote in a school budget election is not only a decision of whether to pull
a lever towards “Yes” or “No.” Broadly speaking, I view these small-scale local
school elections as an interesting test of how racial demographics (alongside a
wide host of other local issues and external factors) can affect how people feel
about government, about taxation, and about public institutions.
The results in East Ramapo also highlight, however, that attitudes in
diverse communities are relevant in ways that extend far beyond individual
interactions. In democracy, outcomes matter. These elections help us to think
beyond the way that diversity might affect preferences about public goods. In a
clear and direct manner, we can also observe some of the real-life implications of
those attitudes. School budget votes highlight that communities’ electoral
decisions have significant, tangible consequences for society. In this particular

10
democratic process, the unambiguous linkage between the act of voting and the
provision of public education allows us to examine the ways that diversity affects
the services that a community provides. Moreover, it provides a unique lens to
think about the ways that these varying preferences toward public investment
affect equality of opportunity in America.
In an America that is continually diversifying, the question of how we
deal with increasing heterogeneity seems to be a particularly pressing one (Myers
2007). In diverse communities, the challenges of inducing citizens to coalesce
around common goals and encouraging public investments are even more urgent.
If we don’t reexamine the way that we think about public goods and
political institutions (some which were designed in the context of a very different
demographic reality), we may in the future regret failing to seize the opportunity
we have at present to adjust approaches.
Thesis Outline
This thesis consists of six substantive chapters. Building off of this
introduction, Chapter Two will give a larger theoretical overview of the existing
literature on social capital, the effects of racial heterogeneity, and public goods
provision. This information is crucial to understanding the overall purpose and
rationale behind my examination of these election results
Chapter Three will then highlight the context of the particular
institutional setup of interest, and the relevant details of the education finance
system in these two states. I will explain the mechanics of school budget voting,

11
and provide background information needed to inform understanding of my
quantitative methods, as introduced in Chapter Four.
Chapter Four will briefly present my hypotheses and methodology, while
describing my sources of data and control variables. To my knowledge, it is
relatively rare that political scientists examine this particular type of school
election results, and I am unaware of any pre-existing papers that have cross-
referenced the results of school budget elections over the last decade in New York
and New Jersey with these kinds of demographic data. This chapter then will
explain both my justifications for doing so, and how I execute the task. Chapter
Five will follow directly afterwards as a review of the quantitative evidence,
gauging whether there is support for my contention that racial diversity is an
important part of the story of differing election outcomes across districts.
Finally, in Chapter Six I step back and evaluate my quantitative results in
a larger normative examination of the budget vote institution. In light of my
evidence, I aim to present a particular argument about the best ways to serve the
sometimes-conflicting ideals of democracy and participation, with the bolstering
of social capital and the provision of public education.

12
CHAPTER TWO: Literature Review
How Does Diversity Matter?
In his widely-cited 2006 Johan Skytte Prize Lecture “E Pluribus Unum:
Diversity and Community in the Twenty-First Century,” Robert Putnam
promotes a distinctive vision of the effects of diversity on American communal
life. Using survey data on a variety of measures of social trust, Putnam concludes
that ethnic and racial neighborhood diversity has negative short-term and
medium-run effects on trust and civic attitudes and behaviors in U.S.
communities.
In Putnam’s view, the mechanism by which these outcomes occur is that
ethnic diversity tends to reduce social solidarity and social capital. His findings
extend not only to members of the “out-group”, or inter-racial trust. They also
apply to members of one’s own race. As he writes, “In more diverse settings,
Americans distrust not merely people who do not look like them, but even people
who do” (2007, 148).
The implications of this argument are intentionally broad: Putnam’s
predictions claim that ethnically diverse communities should not only be more
socially isolated. Their lack of social cohesion should also lead them to certain
behavioral outcomes. They should be less likely to make investments in public
goods. They should demonstrate less confidence about those in power.
Moreover, they should turn out to vote in lower numbers. Finally, Putnam
asserts that these results hold true even when controlling for economic inequality.
That is, ethnically diverse communities should display similar behavior

13
regardless of whether they are divided by large economic disparities or
characterized by a relatively egalitarian distribution of wealth. My thesis will use
school budget votes in New York and New Jersey to test his powerful claim. This
is an important contribution to the literature because it allows us to observe
whether his observations about attitudes translate into voting behavior. It is a
particularly good test not only because the voting outcomes are linked to the
provision of a particular service, but it also because the elections take place in the
laboratory of local public education. Schools are unique in that they are part of a
larger demographic and age divide. In comparison to many other government
services, in education, it is easier for voters to recognize and target who the
recipients of the public good will be, how old they are, and what ethnic group
they might belong to.
My Test
In contrast to Putnam’s emphasis on the use of survey data, then, my
thesis will instead focus on a behavioral manifestation of these questions by
looking at the voting process of annual school budget referenda in New York and
New Jersey.
I will attempt to answer whether the variation in outcomes across
communities corresponds with Putnam’s theory of the effects of diversity. If
Putnam’s hypothesis is true, then ethnic diversity should be a significant cause of
variation in these budget vote outcomes. If people in relatively diverse school
districts do indeed trust their neighbors less, does that in fact affect their political
behavior? Is an ethnically heterogeneous community more likely to vote down a

14
school budget? Does a district’s homogeneity make its inhabitants more likely to
come out to vote in these low-turnout, off-cycle local elections, or, as we saw in
East Ramapo, does ethnic division make people more likely to vote? If these
explanations do not hold, what other demographic factors or alternative
explanations could account for variation in school budget vote outcomes? My
research will attempt to solve these puzzles in the context of school budget
referenda, and then apply the broader lessons to the study of institutions and
budgetary decision-making in diverse communities.
The Effects of Heterogeneity
Social capital theorists like Putnam are certainly not alone in looking at
the impact of (what in America are often increasingly) heterogeneous
communities on citizens’ attitudes and behaviors, as well as political and
economic outcomes.5
Many social science scholars accept that there is something important that
distinguishes a relatively heterogeneous community from a relatively
homogenous one, and that there are certain potentially detrimental political and
economic outcomes that accompany this diversity and pose a test to civic and
redistributive values (though, certainly, positive effects are possible as well).6
These themes have spanned a wide range of countries and disciplines, appearing
in economics, political science, and sociological papers.
5 See Daniel Hopkins (2009) for evidence that addresses the effects of increasing heterogeneity in communities. See Bill Bishop (2008), however, for evidence that American communities are actually becoming more homogeneous. 6 See Scott Page (2007) for evidence that diversity produces better outcomes in schools and businesses, particularly with respect to problem-solving.

15
A large and well-established body of scholarship has argued that diversity
often makes political cooperation more difficult, and that voters in diverse
environments generate distinctive attitudes and behaviors about public spending
(Hopkins 2009). Banerjee et al. (2005) even call the relationship between diversity
and outcomes “one of the most powerful hypotheses in political economy” (639).
However, while many socials scientists have accepted the relationship, Putnam’s
characterization of the mechanisms by which this occurs is a popular but
contested explanation. Social capital is one among the many arguments about
the mechanisms dictating the effects of diversity.
The Social Capital Explanation
It has long been maintained that social capital, or, “social networks and
the associated norms of reciprocity and trustworthiness,” influence a wide range
of significant economic and political phenomena (Putnam 2007, 137). For
example, both Arrow (1972) and Fukuyama (1995) argued that the level of trust
in a society strongly predicts its economic success.
However it was really Putnam (1993), in Making Democracy Work, who
began to truly argue for the substantial and meaningful way that “trusts, norms,
and networks” can foster collective action (167).7 A growing body of research
7 It is necessary to note here that social capital and these relationships have not been universally accepted in the field, and at times have been controversial within the political science literature. See Sobel (2002) for a summary of many of the most common critiques of the literature on social capital. For specific results that seem to contradict Putnam’s predictions for social capital theory see: Kaufmann (1999) and Sampson et al. (2005), who find no relationship between connectedness and political participation, and Hill and Matsubayashi (2005), who find no association between bridging social ties and government performance.

16
over the past twenty years has expanded on this proposition of what we know as
‘‘social capital.’’ Perhaps most notably, Putnam’s work in Bowling Alone (2000)
carefully documented a multi-item index of social capital across all fifty states,
detailing the overall decline of social capital in America and issuing a call-to-
action of sorts for the strengthening of social bonds and civic engagement in the
nation. In particular, Putnam’s works emphasize the role that social capital plays
in the efficacy of democratic governance. He argues that citizens who display
more social capital are also more likely to be well informed about the news and
more likely to vote. In his study of regional governments in Italy, Putnam (1993)
found that regions with long-standing traditions of civic engagement among
citizens had much more effective governments.
Homogenous versus Heterogeneous Communities
One necessary condition underlying claims about social capital is that
context matters. As David Campbell (2006) writes in his book Why We Vote,
“Communities shape the civic and political engagement of the people who live
within them, or what you do now depends on where you are now” (5). An
important extension of this assertion, then, is that social environments are
different – their demographic makeup aligns their populations with tendencies
towards certain attitudes and behavior. Indeed, scholars of social capital have
conducted numerous empirical tests to catalog the varying levels of social trust
exhibited in different geographic settings. The results of these studies point to
racial heterogeneity in particular as an important factor in predicting levels of
social trust, and also behavior.

17
As an example of the effect of location, evidence from the General Social
Survey showed that social capital in the U.S. is lowest in the South/Southeast,
and highest in the North/Northwest (Alesina and La Ferrara 2000, 847-848).8
Relevant to my questions of study, the low-social capital regions were
“characterized by a racially homogenous population,” and similarly, the top five
U.S. states by social capital rankings (North Dakota, Utah, Minnesota,
Wyoming, and Montana) were also noteworthy for their level of racial
homogeneity (Alesina and La Ferrara 2000, 848).9 Namely, on a large, state-
level scale, a significant correlation was demonstrated between racial
homogeneity and high levels of social trust.
These results have been echoed the experimental setting as well. For
example, in a study that utilized trust games with monetary rewards to test
whether surveys correctly predicted the behavior of students with regard to trust,
Glaeser, Laibson, Scheinkmen, and Soutter (2000) found that subjects who were
paired with a partner of a different race or nationality sent back less money to
their partner. These results were a “reminder of the continuing barriers that racial
differences may create” (Glaeser et al. 2000, 814).
This study was also indicative of a larger trend about scale. Over time,
social capital’s growing popularity as an explanatory variable has led to its spread
from country and statewide studies to more locally focused questions of
8 The General Social Survey measured social capital by trust, membership in groups, and voting behavior and cataloged the distribution of social capital levels. The specific variables that Alesina and La Ferrara (2000) used from the General Social Survey were the percentage of people in a state who belong to a group, the percentage who trust others, and the percentage who voted in the last presidential election (847). 9 These five states were almost one standard deviation below the national mean for racial fragmentation (Alesina and La Ferrara 2000, 868).

18
neighborhood trust and local networks. In their article surveying existing
scholarship on heterogeneity and participation, economists Dora L. Costa and
Matthew E. Kahn (2003) catalog at least fifteen different empirical economic
papers that have attempted to understand the effects of heterogeneity on
communities and localities, and conclude that “all of these studies have the same
punch line: heterogeneity reduces civic engagement” (104). They also note that
this relationship has been established specifically in settings where there are
multiple racial group membership categories, which provides support for my own
hypotheses on participation.
Alesina and La Ferrara (2000) write that there is “something systematic
about the relationship between heterogeneity of communities (in terms of income
and race) and the level of social capital: more homogeneous communities have a
higher level of social interactions leading to more social capital” (848-849). In her
study of social capital and race in British neighborhoods, Natalia Letki (2008)
goes so far as to declare, “For social capital to emerge, a high degree of
homogeneity is required” (100). And in a later work examining the negative
relationship between racial diversity and levels of interpersonal trust across
Americans states, Alesina and La Ferrara (2002) contend that there is a “natural
aversion to heterogeneity” (225). If these claims are to be believed, then racially
homogenous communities should display much higher levels of social capital,
and also, produce a number of predictable outcomes associated with the
tendency to trust one’s neighbors. My thesis will test these assertions in the
context of school budget voting.

19
The Public Goods Relationship
In the particular context of these budget elections, behavior is the
dependent variable of interest. Rather than measuring trust levels, I am looking
to test how trust might translate into outcomes. If people living in diverse
communities feel differently about their neighbors, how does that manifest in
behavior? Do they vote less, and do they vote differently? Or in other words, do
people “take very different actions when interacting in a ‘homogeneous’
environment versus a ‘heterogeneous’ one?” (Costa and Kahn 104). Much of the
current research indicates that they do, and particularly so when looking at the
provision and allocation of public goods.
Alesina and La Ferrara (2005), in a systematic review of the literature on
the effects of ethnic diversity on public spending, argue explicitly that “one of the
reasons why public policies in racially fragmented communities are worse is that
social capital is lower” (780). However, what they don’t do is reveal actual
preferences about these public goods, which is what my study can achieve by
looking at voting outcomes. By connecting the preferences in diverse
communities to actual spending decisions, I make a contribution to a gap in the
literature in this area.
In doing so, my research supports the contention that “diverse
communities’ lower social capital might in turn dampen their collective
willingness to make public investments” (Hopkins 2009, 165). Hopkins (2009)
frames the scenario in a way that applies quite well to the institution of budget
votes:

20
Imagine two communities, one with dense social networks, the other without. In the well-networked community, there are a variety of informal channels through which local leaders become aware of the public’s priorities. By contrast, diverse and socially fragmented communities might lead local leaders to make proposals that only a subset of constituents support. Hence the prediction that because they are not as closely connected with their constituents, leaders in diverse communities will propose spending initiatives not supported by their constituents—and so will see them fail at the ballot box (165). If school district budget votes follow this model, voters in diverse districts
are less likely to support their budgets because a lack of civic engagement has
translated into a school board that is not representative of the views of the
population. This could be because the diverse public simply has disparate
interests, or because their low social capital has not enabled them to engage in
collective action to advance those interests. This would align well with the line of
reasoning that “localities…with more racial diversity experience substantially
more problems with the creation of various kinds of social capital, cooperation,
trust and support necessary for collective action critical to social welfare” (Stolle
et al. 2008, 57).
Therefore, collective action is an important mechanism that could help
explain the issues that communities with low social trust might encounter with
public goods provision. When Alesina, Baqir and Easterly (1999) tested a model
simulating the way diversity affects collective action in government, they found
heterogeneous tastes across ethnic groups to be the key factor. Their study of city
governments in the United States suggests that diversity worsens collective
actions problems because in diverse communities, benefits are external to the
group. In a behavioral setting, Abigail Barr (2003) came to a similar conclusion:
heterogeneity proved to affect the distribution of resources because of failures of

21
collective action in diverse environments. Using trust games conducted as field
experiments in Zimbabwe,10 Barr observed the interactions of people in ethnically
heterogeneous government-resettled communities and homogenous non-resettled
communities. She found the mechanisms of collective actions to break down in
heterogeneous communities because a lower density of kinship ties made the
villagers in the integrated communities less likely to trust each other. In a study
of school committees in different areas of rural Kenya, Edward Miguel and Mary
Kay Gugerty (2005) show that to perform most effectively, schools have to be
able to enforce obligations within the community, including the duty of
individuals to contribute financially to the schools. The communities that are
more ethnically diverse have less effective social sanctions, and therefore their
attempts at public goods provision are more likely to result in collective action
failures.
Though these results are from the international literature, they translate
well to the domestic setting because of the scale and nature of budget voting.
Like the schools in the Miguel and Gugerty (2005) study, the districts in budget
votes typically represent small jurisdictions, in which the local residents are the
primary source of revenue for the schools. These international findings fit nicely
10 Though my survey of past literature on ethnic diversity in the U.S. centers around race, some of the relevant literature included here comes from an international context. In small villages, “diversity” has a less universally applicable definition, as it generally can refer to language, ethnic groups, and also membership in different clans or tribes (Alesina et. al 2004). For my purposes, though, I will accept the authors’ own contentions of when a place, whether a district, county, or country is “diverse,” meaning an ethnically non-homogeneous area. There are various definitions and derivations of ethnic identity that could require an entire other paper to describe; therefore, I choose not to address directly what encompasses an ethnic group or why someone chooses to identify with it.

22
with the results of Claudia Goldin and Laurence Katz (1999, 2009). In their
studies of the expansion of publicly funded high schools in the United States,
Goldin and Katz found that ethnic homogeneity fostered conditions that
encouraged the growth of universal education provision.
All of these studies could help explain why we might observe lower levels
of voting and lower levels of support for budgets in racially diverse districts: if
lowered social trust social trust in heterogeneous communities leads to collective
action failures, it will be also be harder for those communities to come to
consensus about the distribution of resources.
“Bridging” and “Bonding” Distinctions
These studies about public goods also hint, at a broader level, at the
difficulties and differences between forging what Putnam (2000) calls “bonding”
and “bridging” social capital. If bonding groups “tie together individuals who are
alike” and bridging groups “bring together people of diverse backgrounds,
crossing ethnic, racial, or religious boundaries,” then it seems likely that bonding
social capital is found in abundance in racially homogenous communities, while
bridging, the trickier form, becomes necessary in more diverse ones (Stolle et al.
2008, 60).
The problem is that social science literature tends to predict that it is
much harder for citizens to forge social connections with people that are different
from them, and so, “social capital is inevitably easier to foster within
homogenous communities” (Putnam 2000, 400). Not only then are
heterogeneous communities somewhat disadvantaged in building a broad,

23
generalizable trust that is conducive to collective action. There also exists the
substantial risk that interaction among members of the same racial groups in
diverse communities “may actually make it much harder – or even impossible –
for individuals to transfer their in-group trust to the outside world” (Stolle et al.
2008, 60). As Miguel and Gugerty (2005) note, “social sanctions are imposed
more effectively within ethnic groups than between groups” and therefore “the
inability of ethnically diverse communities to sanction free-riders” adversely
affects collective action in these communities (2327-2328). Even Putnam
acknowledged the "risk that emphasizing community exacerbates division and
exclusion” (2000, 400).
These concerns are particularly relevant in the budget vote context. If we
think back to the East Ramapo example, it could be that overall social capital
was not actually low, but rather that in-group ties were particularly strong and
encouraged members of one ethnic community to reject interacting with
members of other groups. If this is the case, then it wouldn’t be surprising that
white, Jewish voters were highly mobilized to come out to vote against goods
they perceived as benefitting blacks, Hispanics, and Asians (among others).
As Hero (2003) states it: “Perhaps there is a deep tension between
diversity and connectedness, or between having a community of people who are
likely to express very divergent viewpoints and having a community of people
who are likely to participate effectively in shared decision making” (120). The
perceived tension between in-group and out-group networks has been one of the
most potent critiques of attempts to foster social capital. In diverse environments,

24
some argue, this could create a hostile setting for governance and public revenue
collection.
Non-white Difference and Education Provision
Putnam proposes “constrict theory” in his 2007 piece in part to answer
these strategic questions about the bridging and bonding conflict. It is not, he
argues, that in heterogeneous settings, residents stick only to their own group and
neglect bridging ties. Rather, diversity erodes both types of social capital in the
short-term. That is, “in-group and out-group attitudes need not be reciprocally
related …[and] diversity might actually reduce both in-group and out-group
solidarity” (Putnam 2007, 144). This piece of his theory is crucial to my study
because it indicates that all citizens in a district should be affected by these low
levels of social trust. In a racially fragmented district, this would suggest that not
only should white voters be less likely to support school spending, but the other
ethnic groups should be less likely as well. In addition, in contrast to the claims
of conflict theory, where inter-group conflict should inspire people to vote more
in an attempt to prevent the transfer of resources to the out-group, constrict
theory predicts that diversity should have the effect of making people vote less
(Key 1949).
My thesis enters this debate, however, by arguing that schools are a
unique domain in democracy where both constrict theory and elements of in-
group resource preference could be in play. That is, in this setting, social capital
and racial preferences could both be affecting outcomes. As Duncombe, Robbins,
and Stonecash (2003) note, “Since significant portions of school budgets are

25
financed with local property taxes, and property tax increases are often subject to
annual voter approval, education elections are an arena where preference
conflicts may become visible” (47). While diversity could be producing Putnam’s
predicted role of reducing both bridging and bonding social capital, it is also
possible that diversity could be simultaneously affecting individual preferences
about the use of tax dollars. With respect to this particular public good, it means
that voters in heterogeneous districts could be voting less and voting against the
school budgets because of low social capital, but also, that their votes could be
affected by who they perceive are the users of the good (the schools).
As an example, Alesina, Baqir and Easterly’s (1999) model finds evidence
that funding levels for schools (and other “ethnically contentious” public goods)
are lower in more diverse areas. Crucially, they determine that “voters choose
lower public goods when a significant fraction of tax revenues collected on one
ethnic group are used to provide public goods shared with other ethnic groups”
(Alesina, Baqir and Easterly 1999, 1233). If this framework is applied to school
budgets, districts where tax dollars are being visibly distributed to members of
other racial groups should see lower support for funding.
Hence, this isn’t necessarily only a question about engagement and
collective action per se, but also an issue of distributional preferences. In more
diverse school districts, residents may be generally less likely to engage and less
trusting because of heterogeneity. However, their willingness to support the
budget referendum could also be impacted by whom they perceive the service as
benefitting. Public school populations are not anonymous. Their makeup often
reflects local demographic trends, and also which racial groups choose to send

26
their children to the public schools. Therefore, in a school setting, it is
significantly easier to identify which ethnic groups the recipients of the tax
revenue belong to. With schools, voters have perceptions of whom the taxes are
benefitting. This is likely to affect preferences.
In the school election setting in particular, however, it is also easier for
voters to target where the money goes. In budget votes, the tax levy is limited to
one particular public institution, schools. It is uncomplicated for voters to gauge
whether they personally use the public education system. As Dowell Myers
(2007) writes, “Why should we assume that [voters] would vote for future-
oriented investments—such as education and infrastructure—that would require
higher taxes today if they did not benefit personally from these investments?” (8).
Indeed, it seems likely that people are more willing to support services that they
directly consume. This is particularly true in a referendum, since what is unique
about an institution like a budget vote is that voters can directly weigh in on
specific services. For example, Simonsen and Robbins (2000) used a special
decision-making preference and satisfaction survey to gauge the attitudes of
citizens in Eugene Oregon towards local public services. They found that when
individuals were presented with preference surveys, the citizens were less
supportive of public services when they weren’t the users of the public service,
especially senior citizens. Public schools fall within this category for many voters.
There is a healthy literature that addresses this type of claim with an
enlarged focus on larger ethnic group identifications, rather than just individual
interests. In a study of county and state spending on goods and services, Cutler,
Elmendorf and Zeckhauser (1993) found support for the contention that people

27
have “discriminatory community preferences” where they only care about the
welfare of others within their racial community (180). Luttmer (2001) came to a
similar conclusion, showing empirically that citizens tended to have higher
support for welfare spending as “the share of local recipients from their own
racial group rises” (501). He finds that the “same demographic characteristics
that increased the likelihood of voting against welfare cuts in California also
raise[d] the probability of reporting a preference for more welfare spending”
(501). These results indicate that school budgets should have an easier time
passing when both the schools and the district population are relatively racially
homogenous.
Luttmer’s methods are also notable, because in some ways, they provide a
justification for my attempt to connect information about attitudes to behavioral
evidence. By comparing survey data on welfare support “to voting behavior on a
ballot proposition for welfare cuts in California,” Luttmer is able to examine the
relationship between self-reported preferences and “preferences inferred from
observed behavior” (Luttmer 2001, 501). In this way, he is able to directly assess
to what extent people’s proclaimed preferences mirror the way that they actually
act in electoral settings.
It is important to note that these sentiments about public goods provision
are not unique to economics or political science. Sociologist William Julius
Wilson (1996) echoes the claim that racial distributional preferences have
affected the provision of public services in the U.S. He writes, ‘‘Many white
Americans have turned against a strategy that emphasizes programs they
perceive as benefiting only racial minorities... Public services became identified

28
mainly with blacks, private services mainly with whites... [and] white taxpayers
saw themselves as being forced, through taxes, to pay for services that many of
them could not afford’” (1996, 193, 202). Wilson’s observations demonstrate
perhaps most clearly how a budget election exposes the schools to these
frustrations. In communities where very few white children attend the public
schools, whites could perceive the system as only serving blacks or other racial
groups. When presented with the opportunity to vote directly on the taxes that
support the institution, they may react by voting “no” to send a message about
their feelings.
If the identities of the consumers of the services are what matters, then it
is not surprising that researchers studying education spending have become
interested in race and age. Given the current demographic trends of an increasing
share of minorities in the public schools and the aging of the white population,
the race/age cleavage has become an increasingly popular subject of scholarly
study (Berkman and Plutzer 2005; Myers 2007).
In a landmark study addressing this subject, James Poterba (1997) found
that, other factors held constant, the higher proportion of people over 65 in a
state, the less money the state spent (both as a state but also in local spending) per
child on K-12 education. More importantly with respect to my study, though, his
results across all fifty states indicate that the greater the difference between the
share of the elderly in the state and the share of the youth who are minority, the
lower is the support for education. Later, Helen Ladd and Sheila Murray (2001)
applied his hypotheses to county-level, rather than state-level analysis, and
though they disagreed about elderly voters pushing down education spending

29
overall, they confirmed his finding about race. Their data supported the claim
that there is a significant reduction in per-child education spending when the
adults and the school-age population are members of different racial groups.
These studies confirm the existence of the demographic disconnect between
white elderly voters and young minority students that could present itself in the
New York and New Jersey budget elections.
Racial cleavage has also proven to be an important factor in explaining
voting in local school bond and tax referenda elections, even in communities
where overtly divisive racial conflict was absent. Button (1993) found that race
was a statistically significant explanation for variations in education spending
voting preferences, even when controlling for party, income, age, and social
class. His research proposed multiple mechanisms that highlight race-based
based explanations for school referenda outcomes. First, he notes that blacks
were consistently more in favor of school spending than whites, which could be
directly related to the fact that the children of blacks are more likely than the
children of white residents to attend public schools. As the proportion of white
children attending private schools is much higher than those of other races, it
seems logical that their parents would be less supportive of spending on public
education. This relationship could apply to diverse districts in New York and
New Jersey as well.
Also relevant, as mentioned above, is that Button’s results occurred in
counties where there had not been “any reported serious racial friction recently
over school desegregation or other local issues” and where the proportions of
Blacks ranged only from 4% to 14% of the overall population (Button 1993, 39).

30
Notably, however, the proportion of black students in the public schools was
significantly higher, as is also the case in many of the New York and New Jersey
districts. The key distinction here was that the area was a retirement haven
community where aging white citizens voted both in large proportions, and
consistently in opposition to school issues. This age disparity, he argues,
“exacerbate[s] racial cleavages, especially in education” (Button 1993, 39). In a
similarly divided district setting, budget referenda can expose school districts to
the same racial and age cleavages. The difference when compared to a bond
election is that they do so on an annual basis, systematically constraining the
school districts with diverse populations, and forcing them to adjust their budgets
to the electoral reality.
Schools as a Testing Ground
When examining the effects of heterogeneity on democracy, why are
school elections such a good setting for the test? Others, in fact, might contend
that perhaps the most broadly applicable results would come from census tract
results from statewide elections, and other forms of welfare referenda.
After providing evidence that education is a fairly unique public good in
terms of both age and race, I also argue that schools occupy a special role within
the context of social capital. Social capital theorists often refer to the traditional
status of a school as a “functional community,” or as “foundational institutions
for American community and democracy” (Coleman and Hoffer 1987, 24;
Warren 2005, 165-166). Public schools are a place where “neighborhood
frames” are formed; they are, in many ways, the place for the communal

31
conversation about values and networks -- how diversity will be valued, how
people demonstrate moral worth, what kind of public investments are important,
and where the community is going in the future (Small 2002). Goldin and Katz
(1999) argue that strong support for funding of public schools is an “indicator of
community cohesion” (707). If a local public school is, ideally, “an outgrowth of
the community,” then school elections in many ways can embody the feelings of
citizens towards that very same community (Coleman and Hoffer 1987, xxvii).
Schools are also a fitting subject of study because of the way that ethnic
tensions have traditionally manifested themselves in the dialogue about
education in America. Racial dispute has been both visible and divisive in school
bond and other education tax elections over the past fifty years. Hamilton and
Cohen (1974) cite many examples, ranging from Cleveland’s “levy [that]
narrowly escaped defeat” when it “coincided with an intense fracas between the
school board and civil rights groups” to the near-successful attempts of
Oklahoma City busing opponents to “close down the schools by defeating the
school levies” to five school levy defeats in Detroit in 1972 after a busing plan for
desegregation was ordered by federal court mandate (10). In their view, the
“racial cold war” had not been a productive dynamic for school referenda
(Hamilton and Cohen 1974, 10). And in an analysis of school funding politics in
Long Island, New York in the 1990’s, Alan Singer (1999), declared, “At the heart
of many debates [about school politics] are the issue of race and the resistance of
local non- Hispanic White voters to adequately finance the education of those
they perceive of as other people's children” (25). He notes that though arguments
are often framed in language of community control, excessive taxation, and fiscal

32
responsibility, race is often a major issue underlying issue in school voting
(Singer 1999, 30).
These past issues of racial tensions over schools highlight again that levels
of heterogeneity can affect support for education funding because of social
capital. As Goldin and Katz write:
In order to extend education to the secondary level, schools had to be built and teachers had to be hired. These actions were not based simply on the aggregation of individual family choices concerning whether or not to allow children to attend school. Rather the decision was whether a school district, township, county or state would tax everyone regardless whether they had children who would attend the school (2009, 147).
Though Goldin and Katz’s paper addressed public education provision in 19th
century America, the heart of these sentiments about civic engagement and
education still hold true today. Areas with greater homogeneity and higher social
capital are likely to have an easier time coming to consensus about community
decisions, engaging in collective action, and collecting taxes. All of these things
are necessary to provide local youths with resources for education.
These studies show why it is impossible to separate the question of
community relations, public spending, and diversity from the laboratory of
education that it is being tested within. The institution of budget votes falls into
this larger spectrum of local schools as both at best, the birthplace of social ties
and the foundation for a strong civic community for the future, and at worst, a
racial battleground.
School elections, then, provide an ideal testing ground for the behavioral
effects of “norms of reciprocity and trustworthiness” within a community
(Putnam 2000, 19). Citizens in a diverse community are not only more likely to
possess a wide range of differing, and sometimes conflicting, preferences; they are

33
also likely to have different, and at times inconsistent, needs. The communities
that reflect these kinds of serious differences are likely to have more trouble
coming to consensus about levels of public goods provision. These conditions,
coupled with institutions of direct democracy, can create an environment in
which education is underprovided.
Before moving on to the mechanics of school budget voting, it is
important to recognize that decisions about spending levels on education have
major consequences for society, particularly with respect to inequality. The
vicious circle in America, as emphasized most notably by Wilson (1988, 1996)
highlights that poor minorities need effective public schools to advance their
skills and improve their life chances, but public schools provision is low because
of ethnic conflict. Therefore, the relative skill levels of these minority citizens do
not improve, and their poverty increases, exacerbating the area’s problems, and
creating more conflict among races and ethnicities. The institution of budget
referenda could in fact be helping to perpetuate the inequality of opportunity.
The students in schools where budgets fail did not choose themselves to live in
that district, nor did they have the opportunity to vote or not vote in these
elections. And yet, they are the ones who suffer when librarians are laid off,
sports teams are cut, and class sizes are enlarged.
Today, just as in the past, many minority children still “enter the schools
with disadvantages stemming from poverty; yet instead of getting more resources
for these disadvantages, they [get] less” (Neckerman 2007, 106). When we think
about budget votes for schools, it is essential to remember that they inhibit a
policy domain that matters not just in terms of voter preferences and community

34
relations, but also is at the very core of what equality of opportunity means in
America.

35
CHAPTER THREE: SCHOOL BUDGET REFERENDA: AN OVERVIEW
To situate the reader in this particular policy domain, this chapter will
briefly introduce the connection between school boards, budget referenda, and
education governance in the United States. It will then contextualize the
institution of budget voting in New York and New Jersey within the larger state
frameworks of budgeting and school funding mechanisms. I conclude by
examining and comparing the patterns of passage rates in both states.
School Funding in New York and New Jersey
Public education in America is unusual in the extent to which it is locally-
controlled. There are roughly 15,000 local school districts11 in the United States
that are responsible for providing almost half of the funding for education in this
country (Harris et al. 2001). The governing bodies of these districts are composed
of over 100,000 school board members, who collectively oversee expenditures of
more than $500 billion each year (Hess 2008, 137). School districts, however, are
not uniform in structure or power. While some districts remain formally linked
both financially and politically to municipal bodies of government, others are
firmly separate. Those that have maintained autonomy are part of a complex web
of independent school districts that are “independent government entities,
11 There seems to be some dispute as to the exact number of school districts in the U.S.: Harris, Evans, and Schwab (2001) and Hess (2008) say 15,000, while Berkman and Plutzer (2005) cite 14,000 as the hallmark number, but the National Center for Education Statistics uses 17,000, perhaps reflecting that their data also incorporates Regional Boards of Cooperative Educational Services and Public Charter Schools. According to Berkman and Plutzer (2005) there are approximately 10,000 school districts that educate students from kindergarten through high school (2).

36
responsible for both the financing and administration of schools under their
jurisdiction” (Berkman and Plutzer 2005, 63). The school districts that use a
referendum process to approve budgets in New York and New Jersey fall under
this “independent” classification.
As education is a states’ issue in the United States, every state is allowed
to set its own mechanisms to determine the expenditure levels in public schools
(Hamilton and Cohen 1974). Historically, the majority of states have delegated
decision-making about funding levels to town governments (e.g., Connecticut) or
elected school boards (e.g., Pennsylvania), but New York and New Jersey use
school budget referenda (Feld and Grossman 1984, 363). In both of these states,
public elementary and secondary education are financed primarily through a
combination of state aid to local districts and local school district revenues
(Ehrenberg 2004, 111). In certain, typically poor, districts, the federal
government also provides limited aid based on specified criteria. However, my
data indicate that these funds account for an average of only 4.2% and 4.0% of
revenue in New Jersey and New York independent districts, respectively.
Although recent court cases have begun to rule locally-based systems of school
finance unconstitutional, and in the process, to shift some more of the weight of
funding responsibility from the localities to the states,12 most independent
12 In Serrano v. Priest (1971), the California Supreme Court ruled that “if property was deemed relevant to the way schools were funded, it should be the wealth of the state as a whole and not of local school districts” (Trachtenberg 2008, 415). In New Jersey, Robinson v. Cahill (1975) ruled that the state’s system of financing elementary and secondary schools failed to meet the state constitution’s requirement of a “thorough and efficient” system of education, because of discrepancies in per-pupil spending among the state’s school districts and Abbott v. Burke (1985) “forced the state to spend more on poor urban districts to bring them to parity with wealthier suburban ones” (University of Rutgers Newark

37
districts in New York and New Jersey still hold significant financial obligations
for education provision. My data approximate that the average independent New
Jersey district depends on local revenue for 66% of its total revenue, while in
New York the figure is 49%. Although the stated purpose of state government aid
is to “counterbalanc[e] the inequities resulting from uneven local revenue,”
unfortunately, most studies have concluded that the legislatures in both states
have “repeatedly failed to correct the inequities in state school aid” (Pecorella
2006, 265, 263). Therefore, in light of both political conflict over state funding
and the continued inequities in resources, the role and level of district budgeting
remains significant and important.
The primary way that local revenues for education are collected in these
states is through a local tax placed on residential and commercial property. In
New York, these taxes account for approximately 90% of local district revenues
statewide (Ehrenberg et al. 2004, 111). Notably, neither state redistributes local
property tax revenue across districts, though numerous commissions have called
for state takeover of school financing through a statewide property tax as a means
to combat inequity since at least the 1970’s (New York State Department of
Education; University of Rutgers Newark Institute on Education Law and
Institute on Education Law and Policy). In New York, in Levittown v. Nyquist (1978) the State Supreme Court declared that New York's entire school finance system was unconstitutional “because it did not afford pupils equal protection under the law”, but this decision was reversed by the Court of Appeals in 1982, deferring to the “Legislature's responsibility to finance public education” (New York State Department of Education). While the system remains one in which local (rather than state) property taxes are supplemented by state aid formulas, Campaign for Fiscal Equity v. State of New York (2002) found the state’s method of distributing education aid a violation of the State Constitution and of the rights of minority students as defined in Title VI of the 1964 Federal Civil Rights Act (CFE v State of New York 744 NYS 2D 130 [2002]).

38
Policy). As Jonah Rockoff (2010) explains, the states “provide districts with
lump-sum grants in a progressive manner based on district property value and
income, but these grants are funded with statewide income and sales taxes and
lottery revenues” (139). Since some districts are both willing and able to levy
higher taxes, and also because unique interpretations of complicated state aid
formulas are common, it is possible for very large spending disparities to exist,
even across adjacent districts. Fernandez and Rogerson (1996) found, for
example, that in neighboring jurisdictions in both states, spending per pupil could
vary by as much as a factor of two.
These annual budget elections, then, are not just symbolic in meaning.
The local taxpayer bases and their elected representatives, the district school
boards, are vested significant funding powers in New York and Jersey. In more
than half of the districts in these two states, localities are responsible for at least
half of the revenues for school funding, and in some districts up to 97 percent. It
seems reasonable then, to argue that varying demographics from locality to
locality can feasibly help explain some of the major inequalities in school funding
across districts, just as they have been used to explain divergences in public
resources available across America (Hopkins 2009, 160).
School Budget Referenda: The Mechanisms
The institution of school budget voting has a long history in the
Northeast, particularly in New York. Interestingly, even though the progressive
movement has traditionally received credit for popularizing the school initiative
and referenda, school budget voting predates the Progressive Era (Wirt and Kirst

39
2009). A 1795 state statute enabled New York citizens to have direct control
over school funding through town meetings, where “the people voted revenues
for support of schools and selected teachers by popular vote” (New York State
Legislative Commission on Expenditure Review 1978, quoted in La Manque 1994, 4).
The 1812 Common School Act, which aimed to create and fund a system of
schools within walking distance of every child in New York State, called for
mandatory town meetings to “direct by their vote” a levy for the “support of
commons schools” (La Manque 1994, 4). This provision for budget voting was
maintained in a revamped 1853 statute that created union free school districts
and mandated the approval of school budgets by district voters in non-city
districts (NYSED).
So interestingly, while many assume that budget referenda emerged as a
modern, conservative trend to check government spending or as a direct effort to
reign in property taxes, the school budget elections in New York and New Jersey
appear actually to be more of a “residuum of Jacksonian democracy” (Greer
1962, 124). It is also important to note here the differences in demographic
context and school board structure over time. In the early days, referenda on
schools in America likely would have taken place in a large number of “small
districts, with homogenous tastes for education and a narrow distribution of
income and wealth” (Goldin and Katz 2009, 683).
In the modern era, while many states have requirements for electoral
approval of bonds to finance large capital projects for schools or for school tax
increases over a certain percentage, New York and New Jersey are the only states

40
that require popular budget approval across the state regardless of tax rates.13
The budget elections in New York and New Jersey are therefore notable and
unique for both their institutionalized consistency and power. According to
Berkman and Plutzer (2005), the citizen budget powers in New York and New
Jersey’s independent districts are the “most expansive arrangement” in the
country (69).
Although the elections take place on a single day, the budget procedure
itself is a long and protracted process. In each independent district, a school
board composed of district residents is elected directly by the eligible voters of the
district.14 This board, with the help of district administrators, is delegated the task
of sculpting a budget for submission to the public each year.15 Equipped with
estimates of revenue, state funding, and property values, the board proposes a
budget that includes a pre-determined tax rate to be levied upon the population
(Ehrenberg 2004, 111). The levy is used to directly support the district’s schools
during the next school year. The budgets are required by law to be mailed out to
13 Berkman and Plutzer (2005) coded referendum powers for all districts nationwide in the 1990s using information from state school board associations, education departments, superintendents, and education experts. They found that only other place where “Referendum on Full Budgets” takes place annually aside from New York and New Jersey were “dozens” [of independent districts] scattered across towns in four New England states (including many that previously used town meetings)”(70). They also found that almost 2,000 independent districts across the U.S., along with 119 county-dependent districts in North Carolina, used more limited forms of citizen budget power through voter approval, in which a referendum is required only when linked to tax increases: in some cases, any tax increase at all, but more often, for tax increases that would exceed a pre-determined amount (Berkman and Plutzer 2005, 71). 14 Both the size and terms of school boards vary by district (typically five to ten members each with 2-4 year terms) (Feld and Grossman 1984). In large city districts, school boards are often appointed rather than elected (Berkman and Plutzer 2005). 15 The largest city districts in New York and New Jersey do not vote on school budgets. See Chapter 4 for further details.

41
the citizens of the district and then submitted for public approval in the form of
an election (Rockoff 2010).
Historically, school elections in New York and New Jersey have been
held off-cycle; that is, not in November when local, state, or national elections
are held, nor at the time of party primaries. Instead, budget votes are held in May
in New York and April in New Jersey. A certain percentage of members of the
School Board are elected at the same time. While the timing occurs in large part
because schools run on a different calendar than other government bodies (for
practical reasons, funding needs to be determined by academic year, rather than
calendar year, and therefore spring is opportune), many attribute the election
date to be a major factor in making these elections low-turnout, and therefore
non-representative affairs (Feld and Grossman 1984). Governor Chris Christie of
New Jersey in particular has been a high-profile advocate of this notion, arguing
that the “low-turnout April elections are often a rubber stamp that benefit the
teachers unions” (quoted in Fleisher 2011). The low turnout occurs in spite of
the fact that eligibility requirements16 typically dictate that all adults 18 and over
can vote if they have lived in the district for some minimum amount of time and
have registered to vote. According to my data, from 2003-2011, school election
turnout dipped in some districts to levels as low as less than 1% of the voting-age
population, though the average turnout over the period was 12.5% in New York,
and 13.7% in New Jersey.
However, even though turnout for budget referenda can be very low, that
does not mean that the votes are not very competitive. Figure 3 below displays
16 Eligibility requirements are set by the individual districts (NYSED).

42
budget adoption trends in New York and New Jersey since 1976. Although New
York’s annual passage rate has never fallen below 66% (1978), budget approval
has dropped below the 50% threshold twice in New Jersey. New York’s annual
rates of passage have historically been higher, averaging 84.2%, while New
Jersey’s average annual pass rate was 70.2%. Even within the same year, though,
statewide passage rates can vary intensely between the two states. Meanwhile,
each year, while some district budgets pass with near-unanimity, many others
lose (Romer et al. 1992).
FIGURE 3. School Budget Vote Adoption Trends
Source: New Jersey School Boards Association; New York State School Boards Association
In New York, if the budget fails, the district can choose to automatically
adopt an austerity budget. This decision locks them into a predetermined tax rate
use of a state formula, allowing only for contractual increases and leaving little
room for discretionary spending (NYSED). As an alternative, districts can
choose to spend an extra few thousand dollars to resubmit another, typically

43
(though not always) smaller, contingency budget to the public for a second vote
three weeks later. Districts that choose this option hope that revisions and
increased turnout of the school parent constituency after they hear that the
budget failed will usher the budget to approval the second time around. If this
budget fails, the district is forced to adopt the austerity budget.
In New Jersey, if a budget fails, a three-week consultation period begins,
in which the Board of Education, municipal governing bodies, and Executive
County superintendent attempt to find a solution. The districts with defeated
budgets are then required by state law to submit new budgets to their local
municipal councils, which can decide whether to make reductions with a set date
by which they must make a final decision. Ultimately, the municipal governing
body determines the final budget and tax levy (NJDOE 2011).
These structural differences could help explain the historical tendency in
New Jersey for higher rates of rejection statewide. Rather than reverting to a pre-
determined formula that forces districts to cut spending, in New Jersey, town
councils and local municipal boards can choose to demand more cuts or can
leave budgets as is. Those decisions can also be appealed to the state. In New
Jersey, then, it is possible that voters feel more at liberty to use the election to
send a message to those in power, with less concern about the effects on
resources because of the institutional flexibility. Perhaps more importantly,
though, voters in New Jersey on average are also more likely to face a heavier
local tax burden than their neighbors in New York. While the mean proportion
of local revenue for the budget voting districts (which excludes the big cities) in
my data set in New York was 48%, in New Jersey it was almost twenty percent

44
higher at 66%. This implies that districts in New Jersey rely more heavily on
property tax revenues to fund their schools.
Political and economic context, however, can also matter. Both states
faced serious fiscal challenges after the 2008 Financial Crisis. While both
legislatures responded with cuts to education aid, New York had a Democratic
Governor in 2010, while New Jersey had a Republican one. In New Jersey in
2010, “unusually large state aid reductions proposed by Gov. Christie” led to
budgets that proposed “higher property taxes to make up for [them]” (Hu 2010a).
At the same time, Christie actively fostered and used rhetoric that encouraged
voter “resentment towards teachers’ unions for not agreeing to wage freezes or
concessions” and “exhorted New Jerseyans to use the budget votes to take a
stand against school spending” (Hu 2010b). In contrast, even with “a wave of
discontent among economically stressed voters” New York’s Governor at the
time, David Patterson was perceived as “unwilling to risk a confrontation with
teacher unions over compensation” and did not come out against the budgets
(McMahon 2010).
Voters in New Jersey responded to the increased attention by turning out
in unusually high numbers to reject 58 percent of the states’ budgets, the most in
at least 35 years since records are available (Hu 2010b; NJDOE). Some district
administrators directly linked the outcomes to the attention from Governor
Christie. In a statement to the Star-Ledger newspaper, Superintendent Thomas
Morton of Sparta Public Schools stated, "I think the governor’s rhetoric hurt us.
The governor dumping all of the state issues on the local level hurt us" (April 21).
Meanwhile, with regard to turnout, in 2009 only 15 percent of eligible New

45
Jersey residents voted in their school elections, but in 2010, the turnout rate
nearly doubled to 26.7% (coincidentally, the same percentage as in New Jersey’s
November 2011 general election) (Hu 2011).
These results, which stretched across districts from rural small towns to
affluent suburban areas, seem linked to a larger narrative about taxes and politics.
Interestingly, though, in the same year and just one month later, New York
voters passed 92 percent of the school budgets in “a striking contrast to…New
Jersey” (Hu 2010b). Even though both states faced a similarly rough economic
climate, the results in 2010 show that economic conditions cannot be held fully
responsible for explaining results. Instead, both political and local dynamics have
a role to play.
In contrast to the New Jersey results, which have been most commonly
interpreted as a “protest of ever-rising property taxes,” observers of the New
York 2010 election noted that the outcomes showed the “possibility of a growing
demographic divide over public policy — school spending, in particular — that
has been identified elsewhere in the country between an older, white electorate
and a population of voters who are younger and members of minority groups”
(Heininger 2010; Roberts 2010).
In New York, the lack of an outright, widespread rejection of school
budgets illuminated that diversity levels could have explanatory power in
accounting for diverging vote outcomes. By moving the focus away from a
narrative about general aversion to taxes, we can look specifically at the role of
heterogeneity in explaining differing support levels. As the previous chapter
introduced, there are multiple mechanisms by which this might occur: a diverse

46
district may find it more difficult to come up with an acceptable budget for
presentation to the public, the agenda-setter- the school board- may not
representative of community views, or the district could encounter problems with
budget passage related to who turns out to vote. This thesis will examine some of
these explanations in further detail with an eye towards the quantitative
evidence.
Finally, though a larger body of work has emerged exploring the
mechanisms and outcomes of other types of local and state tax referenda, past
scholarly research on school budget referenda has been relatively limited in
scope. The existing literature focused on education spending and school elections
has hinted at varying explanations for variation in outcomes, ranging from the
degree of teachers union activity to the fraction of elderly residents to school
district size to electoral timing (Moe 2005; Poterba 1997; Romer et al. 1992;
Ehrenberg et al. 2004). While local news sources follow these elections and have
at times focused on the racial component of outcomes, quantitative studies
comparing the demographics to the results have been relatively rare.
This thesis, then, inserts itself in a unique place in the limited field on
school budget referenda. As a study of heterogeneity, and also an examination of
the demographic differences between the voting population and the student body,
this project joins the debate of a relatively understudied zone of local American
democracy. The tests of the next chapter can help translate the qualitative
discussion about observed outcomes into quantitative evidence to inform the
current policy debate.

47
CHAPTER FOUR: METHODS
The hypotheses I will test concern the effects of racial diversity on budget
vote outcomes and participation. After considering the literature described in the
previous chapters, I test Putnam’s (2007) contentions that more ethnically diverse
communities exhibit lower social capital, resulting in less civic engagement
(voting) and support for public goods (education).
I tested the predictions for each of the hypotheses in three time frames:
overall (using mean values from 2002-201117 for New York, 2003-201118 for New
Jersey); Pre-Crisis (2002-2008 for New York; 2003-2008 for New Jersey);19 and
Post-Crisis (2008-2011 for both states).20
There are a few important structural characteristics of school elections to
note with respect to the time period of the data. First, because school budget
votes are examples of times when citizens of New York and New Jersey are
empowered to “decide tax rates and levels of public expenditure directly,” we
have the capacity to analyze voters’ intentions and the meaning of their choices
“in a context relatively free of the muddying influence of the many other issues
that come into play in partisan contests for executive and legislative office” (Sears
and Citrin 1982, 3). Second, school budget votes allow us to look at citizens’
behaviors over time, whereas elections that occur less frequently are often
17 2002 results were available in New York only for budget adoption (“Yes” or “No”). Vote totals were not available for this year, so I could not use 2002 data in calculating average levels of support or turnout. 18 New Jersey’s 2002 results were not available at time of data collection. 19 Since school elections take place in the springtime, the 2008 budget elections preceded the onset of the Financial Crisis. 20 For the sake of brevity, the tables shown in the next chapter display the overall time period results, but full results for Pre and Post-Financial Crisis data run separately are available upon request.

48
distorted by the economic climate in that particular year. For example, as Sears
and Citrin (1982) have noted, citizens are likely to be “sanguine about the growth
of the public sector” during periods of economic growth when real personal
income is rising (4). However, when the country is in the midst of an economic
downturn and citizens must adjust, it is logical that people would “act in a way
that urges government to do the same” (Sears and Citrin 1982, 4). The dataset
that I use therefore avoids some of the confounding effects of national economic
context because it presents annual elections during a period that displays a wide
range of economic health: relative well-being across the country before 2008, the
recession of 2008-2009, and the beginnings of an economic recovery thereafter.
Hypotheses
I will test three sets of hypotheses to determine whether increased ethnic
diversity leads to variations in school budget results and turnout.
Budget Passage
If Putnam (2007) is correct, increased racial heterogeneity of a district will
have negative effects on passage rates and support percentages. In other words,
racially homogenous communities will be more likely to pass more of their
budgets.

49
Therefore, my null hypothesis and first alternate hypothesis for budget passage
are as follows:
H01: Increased racial heterogeneity does not negatively affect districts’ support
for school budgets.
HA1: Increased racial heterogeneity negatively affects districts’ support for
school budgets.
I will also test the effects of relative differences in diversity between the
general population and the school population. Putnam (2007) proposes that
ethnic heterogeneity drives lower levels of support for public goods spending. He
uses a Diversity Index21 as his variable of interest, focusing on the significance of
racial heterogeneity rather than racial difference between one group and all
others. This measure puts full “attention…on the distribution” of racial groups,
rather than ascribing significance to any one particular group (Blau 1977, 11,
quoted in Rushton 2008, 447).
I do not wholly accept this premise. While I too am interested in levels of
heterogeneity, I also contend that white voters do not necessarily distinguish
between, say, black and Hispanic children when it comes to funding public
schools. For example, Alan Singer (1999) finds that a major issue underlying
school bond defeats in Long Island was a particular “opposition [of white voters]
to paying for African American and Latino/a children” rather than overall levels
21 Specifically, Putnam (2007) uses a Herfindhal Index. I explain my measure of diversity later in this chapter.

50
of racial heterogeneity (30).22
For these theoretical reasons, I will also test the following hypotheses
with regard to budget passage, generational divide, and in-group preference.
H02: Increased difference in the non-white percentage of the student body and
the non-white percentage of population of the district does not negatively
districts’ support for school budgets.
HA2: Increased difference in the non-white percentage of the student body and
the non-white percentage of population of the district negatively affects
districts’ support for school budgets.
Turnout:
Finally, Putnam and social capital theorists would also propose that
turnout should be higher in more homogenous districts because of increased
social capital. As Costa and Kahn (2003) note, “In a community with more
social capital and more of a civic sense, voting rates are likely to be higher as
22 Like Rushton (2008), I had substantive concerns that perhaps the outcomes were partially determined by the relative size of the different subgroups. I thought there may be a difference between a district that had a population that was almost 100% white with a smaller, but still fairly large white population in schools, and a district whose population was significantly less white, with a school population that was made of a majority of minority students. That is, I was concerned about measuring for “difference” as the only thing that mattered, “regardless of the proportion of subgroups of each ethnic and racial group” (Rushton 448). For that reason, I created an Interaction Term, i, that multiplied the non-white difference by the percentage non-white of the population, to account for the theoretical prediction that minorities should be more likely to support spending on education and welfare. When I used this interaction term as the independent variable, however, the results were not statistically significant. I came to the conclusion, then, that the difference really was the part of this that mattered, rather than the non-white share of the population.

51
residents do not pursue only their own narrow self-interest” (106).
Social capital provides an attractive alternative explanation for voter
turnout because it is a feasible mechanism through which the collective action
problem may be overcome (Olson 1965). Traditional rational choice theorists
contend that voting is not rational because, from a self-interested perspective, the
benefits do not outweigh the costs. However, the “core idea of social capital
theory…that social networks have value” supplies a reason why voters might
indeed overcome these constraints and vote (Downs 1957; Putnam 2000, 18-19).
Scholars have proposed several mechanisms by which social capital
increases turnout (Atkinson and Fowler 2011). I wish to highlight those that are
most closely linked to levels of homogeneity: norms of reciprocity (Putnam 1993;
Campbell 2006) and exposure to the interests of others (Kinder and Kiewiet
1981; Edlin et al. 2007). Both of these categories contend that populations that
have higher levels of social capital should vote more. Campbell (2006) explains,
“If voter turnout has civic underpinnings, we should therefore expect it to fall as
ethnic, racial, and economic heterogeneity rise” (22). In “E Pluribus Unum,”
Putnam (2007) predicts just that: if "residents of all races [in diverse
communities] tend to 'hunker down,'” in the short term, they should “register to
vote less” and “have less faith that they can actually make a difference” (149,
151).

52
Therefore, I will test the following hypotheses for turnout.23 H03: Increased racial heterogeneity does not negatively affect turnout in school
budget elections.
HA3: Increased racial heterogeneity negatively affects turnout in school budget
elections.
Defining Terms of Racial Heterogeneity
Like Putnam (2007), I use racial data to represent ethnic diversity in my
data. This was in part a methodological necessity. Race is the only variable
available on a district level, and it was not feasible to independently collect
religious or other ethnic information across 1,200 individual districts in the two
states. There is also, however, a theoretical precedent for doing so: much of the
previous literature on the effects of ethnic diversity in localities has
predominantly looked at race as the explanatory variable for both behavior and
attitudes (Costa and Kahn 2003; Hero 2003; Letki 2008).
23 Neither the New York nor New Jersey Department of Education was able to provide me with exact voter turnout data on a district level for school elections. However, in order to test these hypotheses, I have constructed a proxy for voter turnout, described in Chapter 5.

53
My measure of racial heterogeneity uses racial fragmentation24 as the
measure of heterogeneity, using a calculated Blau Index.25 The formula for a
Blau Index is as follows:
D = 1 - Σjpj2, sub j
where D is racial diversity and pj is the proportion of the total district population
from racial group j. I use the U.S. Census definition of “race” based on five
categories: (1) white (2) black (3) American Indian, Eskimo, Aleutian (4) Asian,
Pacific Islander, and (5) other. If the all members of the population in the district
belonged to a single racial group, D would equal 0 (perfect racial homogeneity).
The Index increases as heterogeneity increases, so a higher value of D means
more heterogeneity. Therefore, the index accurately “captures the probability of
two randomly chosen individuals” living in the school district being members of
different racial groups (Letki 2008, 112).
In New York, the Blau Index values in my dataset range from .0153 to
.7147. In New Jersey, they span the range of .0174 to .7430. The mean Blau
Index in New York is .1716. The mean Blau Index in New Jersey is .2821.
24 Collier (2001) criticizes the Alesina et al. (2000) study because he argues that the cities studied were ethnically dominated as opposed to fragmented and therefore, the study’s findings might only apply in regions that met these criteria. My test, however, will attempt to test this objection by measuring not just percentage black or white, but also accounting for ethnic fragmentation through the Blau Index. 25 The Blau Index is the diversity index that is most “typically used in social science and policy analysis” (Rushton 446). Blau (1977) introduced the measure in his sociological theory work, though before Blau, “the measure the diversity of butterfly species is found in Fisher, Corbet, and Williams (1943), and some statistical properties of the index were investigated by Simpson (1949)” (quoted in Rushton 446).

54
To provide a more tangible sense of what these different districts might
look like, and what the Blau Index means in different types of racial settings, I
provide a few examples of district demographic makeup, as follows:
Low Blau Index Lavallette School District is a suburban K-8 district, located on the Jersey Shore
in Ocean County, New Jersey. It has a population of just under 2,000 people, a
median family income of $57,778, and a median home value of $317,500. There
are approximately 150 students who attend the district: 93% of them are white,
1% is black, 5% are Hispanic, 1% are Asian, and 1% are multi-racial. The district
population has a Blau Index of .0421, represented by the following demographic
breakdown of residents.
FIGURE 4.
Data Source: National Center for Education Statistics Relatively High Blau Index:
Piscataway Township School District is a K-12 suburban district located in a
college community in Middlesex County in Central New Jersey. It has a

55
population of approximately 55,000, a median family income of $75,218, and a
median home value of $168,400. There are approximately 7,000 students who
attend the district: 29% of them are Asian, 33% are black, 16% are Hispanic, 21%
are white, and 5% are multi-racial. The district population has a Blau Index of
.6949, represented by the following demographic breakdown of residents.
FIGURE 5.
Data Source: National Center for Education Statistics

56
Very High Blau Index:
Westbury Union School District is a K-12 suburban district located in Nassau
County, Long Island, in Old Westbury, NY. It has a population of
approximately 26,000, a median family income of $67,991, and a median home
value of $192,600. There are 4,300 students who attend the district: 1% of them
are Asian, 36% are black, 60% are Hispanic, and 2% are white. The district
population has a Blau Index of .7128, represented by the following demographic
breakdown of residents.
FIGURE 6.
Data Source: National Center for Education Statistics Even without the largest city districts, the distribution of racial groups can
vary dramatically among school districts in both of these states. A Diversity
Index goes beyond measuring percent white. It accurately combines the
population shares of different groups within one district, reflecting the overall level
of district diversity. It is important to remember that, like in the case of
Piscataway, “diversity” does not just mean more blacks and Hispanics, since

57
Asians and Indians are included as their own ethnic groups. It is also interesting
to note that the most racially fragmented districts are not always the poorest, as
the median family incomes in Piscataway Township and Westbury Union both
are above the statewide means, while the median family income in Lavallette is
below ($57,597 in New York; $74,308 in New Jersey).26
Why New York and New Jersey?
I picked New York and New Jersey because they are the only states in the
country that employ budget referenda in the school context to this wide of an
extent across the whole state. As mentioned in Chapter Three, while other states
incorporate certain direct democracy mechanisms often to control education
spending, they are most commonly used for bond measures for construction or
special large-scale spending projects. New York and New Jersey are the only
states that uniformly employ these measures for budgets. Again, according to
Berkman and Plutzer (2005), the citizen budget powers in New York and New
Jersey’s independent districts are the “most expansive arrangement” in education
in the country (69). New York and New Jersey also provide a consistent testing
ground because their budget election procedures are nearly identical: they occur
every year, regardless of tax levy size, and both take place off-cycle, in the spring.
Detailed information on budget outcomes exist in both states, and both states
reflect the relatively more segregated nature of the Northeastern U.S. compared
to the rest of the country (Lankford et al. 2006).
26 In New Jersey, the correlation between Blau Index and Per Capita Income was -.2560. In New York, the correlation was .2661.

58
Finally, while New York and New Jersey are neighboring states, they also
are relatively diverse states, with a wide variety of districts and communities
within their borders. Like California, they are “socially, economically, and
politically heterogeneous, affording the opportunity of studying a fairly
representative subsample of the nation’s population” (Sears and Citrin 1982,
Xiv). This advantage enhances the opportunity to broadly apply my findings.
It is important to note that I am not attempting to analyze or explain the
year-to-year variations in school budgets themselves, neither in aggregate nor at a
district level. Like Feld and Grossman (1984), I acknowledge that a wide variety
of factors contribute to annual changes in budgets from district to district, among
them “yearly changes in the tax base, student enrollment, state aid, union
contracts, fuel costs, and general inflation” (366). The effects of such influences,
though interesting and perhaps deserving of their own study, would make it very
difficult to determine whether the size and expenditures of the budget itself was
affected by ethnic diversity.
In addition, though the budgets themselves are not the target of interest in
my study, I acknowledge that the distribution of funds and priorities within the
budget, along with the tax levy may certainly affect passage. However, I argue
that these considerations should not obscure the effects of feelings about
community that people have when they head out to the voting booth. While the
actual budget certainly has tangible implications for spending and services
provided in the district in the following year, I contend here that it is likely that
many people vote on budgets more symbolically than substantively. This is in
part why I have chosen them as a behavioral manifestation of racial relations in

59
communities. As Steve White, a community activist active in school board
politics in East Ramapo noted in an interview, the budget is “a very divisive issue
[that’s] created a lot of bad feeling... The heart of the issue isn’t the numbers, but
[rather] people feel like one group is using their ability to really just do for their
own and the hell with everyone else. People resent that.”
Sources of Data
My data come from a variety of sources. They were combined into one
dataset through careful construction.
I began with a list of every school district in New York and New Jersey
from the National Center for Education Statistics (NCES). NCES also provided
me with a list of racial data from the 2009 American Community Survey of the
U.S. Census Bureau for all school districts in the United States in the school year
2010-2011. From this information, I was able to calculate a Blau Index as a
measure of a district’s racial heterogeneity.
On the NCES website, they give the public access to the Common Core
of Data (CCD). The CCD is the United States Department of Education’s
primary database on public elementary and secondary education in the country.
It provides both an official listing of all public schools and school districts in the
nation, and also provides basic information and descriptive information (NCES).
It is made up of a set of five surveys that are sent to state education departments.
Most of the information comes from administrative records that are maintained
by state education agencies (NCES).

60
Out of these surveys, I made primary use of the Local Education Agency
Universe, or the “Public Elementary/Secondary School Universe Survey Data,”
and the Local Education Agency (School District) Finance Survey (F-33) Data.
The first survey provided me with student information in the form of school
locations and types, enrollment, classroom ratios, and counts by race and
ethnicity of student bodies. The second survey was my source of fiscal data. It
gave me detailed information about the revenue and expenditures for all of the
school districts in New York and New Jersey, including sources, functions, and
subfunctions of revenues. Specifically, I was able to use these figures to
determine the percent revenue in each district that came from local sources,
rather than from state or federal government aid to the districts. The revenue
percentages used in my regressions are the means of the 2002-2003 to 2008-2009
numbers because State Education Agencies are given time to audit and revise the
data. The 2008-2009 school year is the most recent data available.
In addition, the School District Demographics System of the NCES
provided me with a dataset of racial and economic data broken down on a school
district-level, from the 2005 American Community Survey Briefs of the U.S
Census. Along with measures of racial and ethnic heterogeneity, this survey,
based off of data from 2000 Census, supplied me with many additional
demographic variables including median family income, home values, poverty
rates, occupied housing rates, age breakdowns, and educational attainment of
residents within those districts.
I was then able to obtain school election vote totals from each year dating
from 2003 in New Jersey and 2002 in New York from the New York and New

61
Jersey Departments of Education. The votes are listed by county and then broken
down into “Yes” and “No” votes for each individual district. The voting results
were combined with the NCES statistics to create a dataset of approximately
1,300 school districts originally. There were, however, a few factors that forced
me to remove a number of districts from the final data set.
New Jersey’s 603 school districts in 2011-2012 account for approximately
4% of all school districts in the United States, while representing only 2.8% of the
United States population and 2.7% of American public school students (1.35
million of the 49.3 million American students in public schools) (New Jersey
Department of Education; U.S. Census 2010). New York, with more than double
the population of New Jersey, only has approximately 100 more school districts,
even while operating some of the largest school districts in the country. Part of
the reason for this is because New York has been steadily reducing its number of
school districts over time, through centralization, annexation, or consolidation.
In 1870, New York had 11,372 districts, and in 1920 there were still over 10,000
(NYSED). By the 2011-2012 school year, however, New York had just 697. So
while New York is home to approximately 6.2% of the U.S. population and 6.3%
of all U.S. public school students, it only accounts for approximately 4.6% of its
school districts (NYSED; U.S. Census 2010).
Therefore, there were districts in the dataset that existed at the beginning
of the time period, but literally disappeared by the end. I eliminated both their
results, and the results for the new consolidated districts that were formed,
because the consolidated districts no longer matched up demographically to the
racial Census data from 2000 (when they were separate districts).

62
There were also many districts listed for New York with financial and
student data that were entitled “BOCES”; these are not typical school districts
but “Boards of Cooperative Education Services” that serve to support several
districts and operate schools for children with disabilities (NYSED). In addition,
charter schools, primarily located in New York City, but also existing in pockets
of New Jersey, were present in the original dataset.27 Since these schools are not
linked directly to any geographic area, there were no demographic population
data to match them with, and they also do not hold annual budget elections. All
of these units were deleted.
There were 20 non-operating school districts in New Jersey at the
beginning of the time period and 13 today.28 These districts have students but no
school building. The district sends the children that live there to an outside
district, yet district residents often actively resist dissolution because of fears of
higher taxes once they are incorporated into neighboring districts (Fichter 2007).
While these districts do hold budget votes and are potentially interesting subjects
for a future study on tax attitudes and decision-making institutions, there are no
racial data available for the students in these districts since they attend schools in
other districts. As a result, I removed them from the dataset.
Finally, the five largest cities in New York State—New York City,
Buffalo, Rochester, Syracuse, and Yonkers—by state law do not participate in the
budget voting process. In cities with populations over 125,000, districts are
instead fiscally dependent on their city governments for funding, and educational
27 In New Jersey, there are 75 charter schools in 2011-2012 (New Jersey Department of Education). 28 In New York, the number of non-operating school districts has declined from 7 in 1980 to 1 at the present (New York State Department of Education).

63
appropriations must pass through the municipal budgetary process (La Manque
1993, 8). In New Jersey, the districts that have been classified as “city,” or Type I
school districts29 are exempt from the procedure under state law (Hamilton and
Cohen 1974).
Out of 603 (590 operating) school districts in New Jersey, I was able to
test 505 of them (there were 538 that conducted Budget Votes in 2011). Out of
697 existing school districts in New York, I was able to test 669 of them (there
were 678 Budget elections in 2011).
While the effect of omitting large urban settings from the sample is a
limitation of the data in that many of the most diverse areas in the state are left
out of analysis, the remaining districts are still useful studies of the effects of
heterogeneity. In fact, the exclusion of these large urban districts may add
strength to my project’s results. Leaving New York City out of the sample helps
to ensure that the ethnic categories are sufficiently distinct: it means that I do not
have to account for large numbers of immigrants from an almost infinite range of
backgrounds. Smaller districts can also be better tests of neighborhood effects and
the implications of racial diversity on voting behavior because they are so
compact, guaranteeing a certain degree of consistency and inevitable contact
within their smaller boundaries. Also, as I am interested in the effects of
neighborhood diversity, or limited to a relatively small geographic scale, it is fair
to say that a district like “New York City Schools” is not really an accurate gauge
of how citizens feel about their neighbors and community educational
29 There are 50 Type I School Districts in New Jersey. These districts also have appointed school boards, rather than elected (New Jersey School Board Association).

64
institutions. The sheer size of the largest urban districts means that the direct
linkage that voters can make between their community and their schools is
somewhat weaker.
Strengths of District-Level Data
Using district-level data, representing roughly 1150 school districts in the
states of New York and New Jersey, holds certain key advantages that few, if
any, of the other tests of heterogeneity and social capital effects have tested. The
major advantages of district data relate to scale and to content.
First, district data are important in that they reflect the way that many
spending (particularly on education) decisions are made in this country. Given
the current setup of the education finance system in both states, as described in
Chapter Three, local conditions and attitudes have the potential to make a large
impact on the resources available and spending priorities.
Second, as a smaller collection of citizens, a district more precisely
represents the reality of people’s networks and interactions within their
communities. Or as Stolle, Soroka, and Johnston (2008) explain, “Diversity
measured at the level of country, state, city or even census tract might not
accurately reflect the actual experiences (or perceptions) of heterogeneity in
people’s daily lives” (60). As school districts are fairly compact, they can better
represent the effects of diversity in neighborhoods and every-day environments. I
contend that it is necessary to look at tax money and democratic decision-making
that is directed at schools if we want to understand how people feel about their
schools. For this reason, they are a good unit for testing social capital: “because
educational decisions are made primarily at a local level in the United States,”

65
outcomes in this policy sphere “depend largely on social capital lodged in
communities” (Goldin and Katz 1999, 686).
Third, looking at variations in district-level data allows us to account for
differences that occur in areas with differing levels of heterogeneity. It seems
logical to assume that there is a difference in the constituents, attitudes, and
environment surrounding the public schools of say, a small rural upstate New
York town, and the public schools of a Long Island suburb. Previous studies that
use statewide data like Alesina et al. (2004) are not able to capture these
differences within the state.
Limitations of District-Level Data
One potential problem with using district-level data is linked to the
Tiebout (1956) hypothesis. Tiebout argued that people can resolve the problems
of heterogeneity by sorting themselves into communities that reflect their
preferences towards public good provisions. As Harris, Evans and Schwab (2001)
describe, district data could exhibit some bias in that individuals might choose to
live in communities (in this case, school districts) that are best-suited to their
preferences, thereby potentially also self-selecting by race and economic status.
Poterba (1998) notes that if the elderly “vote with their feet” in the way that
Tiebout would predict, then demographic distributions within districts could be
functions of spending decisions themselves (315). Therefore, budget vote
outcomes could be at least partially determined by the fact that certain
constituencies may deliberately move from higher-spending to low-spending
districts, or vice versa (Harris et al. 2001).

66
Historically, this factor is particularly relevant in the Northeastern United
States. As a collective unit, Northeastern public schools have become markedly
more segregated over time, and schools in the Northeast are more segregated by
race than in any other region of the country (Lankford et al. 2006). New York
and New Jersey independent school districts are likely to be representative of
these trends. Lankford, Wyckoff, Gronberg, and Jansen (2006) found that upstate
New York elementary schools were more segregated in 1995 than they were in
1970. They also observed a significant shift between racial segregation of schools
within districts, and segregation between districts. That is, whites increasingly opted
out of urban districts and settled in suburban districts instead (Lankford et al.
2006). Some scholars have argued that the relatively small sizes and large
numbers of school districts in Northeastern metropolitan areas make it easier for
prospective residents to shop in a Tieboutian fashion (Orfield et al. 1994).
While this background to district selection and district demographics is
important to consider, budget referenda are unique in that they allow the current
residents of a community to have a direct say and electoral input into the
spending decisions for education. My research is able to overcome the Tieboutian
mechanism in some sense: by testing all of the districts with budget votes in the
state, we can see how districts with differing levels of diversity vote on budget
measures, regardless of whether individual decisions to live in a certain district
were dependent upon feelings toward tax expenditures or racial composition.
There are still a healthy number of districts in New York and New Jersey that
display significant amounts of racial diversity within their borders, and in their
schools -- in fact, my data indicate that the general population is sometimes more

67
racially fragmented than the schools are, providing some pushback on the idea
that this kind of racial sorting could account for voting behavior and spending
preferences.

68
CHAPTER FIVE: Results
This section of the thesis employs a quantitative test of the hypotheses
described in the previous section. First, that increased racial heterogeneity
negatively affects levels of support for school budgets, and negatively affects
budget passage rates. Second, that an increased difference in the population share
of minorities in the schools and minorities in the general population negatively
affects levels of support for budgets, and negatively affects budget passage rates.
Third, that increased racial heterogeneity negatively affects turnout in school
budget elections.
I conduct five sets of linear regressions separately for both New York and
New Jersey to test these hypotheses. There were 505 observations (districts) for
New Jersey and 669 for New York.
I use three dependent variables of interest in my regressions. The first is
Average Percent Support. Over the period 2003-2011, I calculate the mean
percentage of “Yes” votes on the budget in each district. This measure is an
expression of the levels of support for the budgets in the communities; it serves as
a good aggregator of the share of the voting population that is willing to support
the budget and accompanying tax levy.
However, I also use another measure related to the election results, which
is my second dependent variable, Budget Passage Rate. I calculated this
dependent variable by adding up a simple “Yes” or “No” tally of whether the
budget passed in each district during each year within the period (2002-2011 in
New York; 2003- 2011 in New Jersey), and then converting that number into a
percentage passage rate. This variable may be less directly linked to civic

69
behavior, but it reflects that these budget elections are a political process where
outcomes matter. That is, whether support for the budget crosses that critical 50%
threshold has meaningful implications for the provision of the public good and
for funding levels of the schools in that community. Therefore, I include this
dependent variable in my models because I am not only interested in what
proportion of voters favored the budget, but also in the policy implications
involved in whether it passes each year.
My final dependent variable of interest is Voter Turnout. I want to
address whether increased racial heterogeneity leads to lower levels of voting in
budget elections. However, neither the New York nor New Jersey Department of
Education was able to provide me with exact voter turnout data on a district level
for school elections. So instead, I constructed a proxy for voter turnout to test the
turnout hypotheses. I divided the number of votes cast in each district election by
the voting-age population (VAP) of the district, which was calculated by adding
the population numbers for residents who fell into the “18-65” to “65 and over”
subgroups of the Census data. This proportion is then averaged over the nine
years. This is an imperfect measure because the numbers are not current and
because they cannot account for year-to-year population changes. The measure
also encounters the problem of a population count that could be inflated by non-
citizens and others that are not eligible to vote, as identified by McDonald and
Popkin (2001) (quoted in Campbell 2006, 223). However, this was the best
measure available, and I assume that significant discrepancies should be
minimized because the measure is used consistently throughout, across all
districts in all regressions.

70
Summary statistics for the dependent variables can be viewed in Table 1.
More detailed summary statistics of Pre-Crisis and Post-Crisis outcomes can be
viewed in the Appendix.
TABLE 1. The tables below summarizes key statistics and dependent variables for the 669 districts in the dataset for this period in New York and the 505 districts in New Jersey from 2003 to 2011. __________________________________________________________________ Variable (NY) Mean SD Min. Max. % Support .6370 .0711 .4492 .9547 % Passage* .9175 .1092 .4000 1.000 % Turnout .1267 .0526 .0265 .3610 *New York’s passage rate data include 2002 in addition to 2003-2011.
__________________________________________________________________ Variable (NJ)) Mean SD Min. Max. % Support .5410 .0682 .1220 .8540 % Passage* .6715 .2538 0.000 1.000 % Turnout .1368 .0580 .0100 .3643
Variables
I use seven variables in each of my models. As described in the previous
chapter, the variable Blau is an index with a minimum possible value of 0 and a
maximum possible value of 1, and serves as the primary independent variable
testing racial heterogeneity. Increasing values mean increasing heterogeneity.
The variable Non-White Difference (NonWhiteDiff) is the primary independent
variable testing for generational out-group aversion. The measure represents the
difference between the population share of non-whites living in the district, and
the population share of non-whites in the public schools. This value is calculated
by subtracting the percentage non-white (% Non-white) of the district population
from the percentage non-white in the schools’ student bodies. The maximum
value for Non-white difference is .7648 in New York and .5603 in New Jersey.

71
The minimum value for Non-white difference is -.3111 in New York and -.2759
in New Jersey. The more negative the value, the larger the proportion of whites
in the schools compared to whites in the population. The more positive, the
larger the proportion of non-whites in the schools compared to non-whites in the
population. These variables were both calculated directly from the data obtained
from the NCES, as described in Chapter 3.
In addition to these primary variables, six control variables are used in
each regression to represent alternative explanations of the budget vote results.
Senior citizens have been commonly cited as an obstacle to the passage of
school bond referenda and recent school budgets in New York and New Jersey
(Button 1993; Roberts 2010). They have also been predicted to have an overall
negative effect on education spending levels (Poterba 1997). For these reasons, I
decided to control for age. I use the proportion of the population over the age of
65 (“% Over 65,” tabulated from Census 2000 age categories) as the age control
variable.30
I use the non-white share of the population (% Non-White), from the
2009 Census data as a control for race.31 Because the proportion of white
children attending private schools is higher than those of other races, it seems
feasible that white parents would be less supportive of spending on public
education. As Berkman and Plutzer note, African-Americans are “consistently
more supportive” of education spending (79). Latinos have also shown to be
30 I would have liked to use more descriptive measure of age, however, the data from the NCES broke down the population of the district only by age distributions of 5 years and younger, 5-18 years, 18-65 years, and 65 and older. 31 Following Miguel and Gugerty (2005), I estimate the relationship between diversity and support for school funding while “also including controls for the local population shares” of the ethnic groups in this area” (2353-2354).

72
“more likely than whites to support higher taxes and spending” (Myers 140). In
contrast, “white voters are much less supportive of higher taxes and sending”
(Myers 141). This control is also useful with regard to turnout because it is
generally accepted in political science literature that minority voters are less likely
both to vote and to register to vote, particularly in referenda (Verba, Schlozman,
and Brady 1995; Vanderleeuw and Engstrom 1987). Controlling for the
percentage of minorities that live in a school district will help me avoid the
argument that race itself is explaining the discrepancies in district support,
passage, or turnout rates, rather than heterogeneity.
I also constructed a variable that shows the share of district revenues that
come from local sources (% Local Revenue) as a means of controlling for state
and federal aid for education. The Local Revenue control variable aims to
account for varying tax burdens. In districts where the local revenue share is
relatively low, this means that the state and federal government are playing a
larger role in subsidizing that district’s expenses. A low local revenue percentage
in a district indicates that the burden of the taxpayers and annual school taxes are
likely lower than other district. Districts with lower local revenue shares are also
likely to be poorer districts because of the way that state and federal formulas
calculate the distribution of aid.32 This variable helps to account for the
explanation that tax levels determine vote outcomes and turnout.
The percentage of college graduates (residents with “All college degrees”,
as tabulated in the 2000 census) and the percentage of residents who have
32 In New Jersey, the correlation between Local Revenue Percentage and Median family income was .5089. In New York, the correlation between Local Revenue Percentage and Median family income was .7032.

73
completed high school, or less education (calculated by adding those who in the
district who have no schooling, completed, up through 8th grade, and up through
a high school graduate) measure educational attainment in the district. Median
family income (Med. Fam Income) from the Census 2000 data serves as a control
for economic status in the different districts. Both of these variables aim to
control for evidence that more educated and wealthier voters tend to vote more
than their less educated, poorer counterparts (Verba, Schlozman, and Brady
1995).
Unfortunately, the income, age, and education controls were not
available on a year-to-year basis because of limitations in the NCES data,33 so
these statistics come from the 2005 American Community Survey data. For local
revenue percentage, I calculated an average for each district from 2003-2009.
This does not account for the federal stimulus money that helped districts balance
their budgets for the 2009-2010 and 2010-2011 school year and could potentially
have raised passage rates by lowering the local tax burden. However, if this
significantly changes the effects of heterogeneity and non-white difference, it
should have appeared when comparing the pre-Recession and post-Recession
results.
Summary statistics for the variables used are provided in Tables 2 and 3.
Extended summary statistics are available in the Appendix.
33 See Chapter Four: Methods for a detailed explanation of the available data.

74
TABLE 2. The table below summarizes control variables for the 669 districts in the dataset for New York. ____________________________________________________________________ Variable Mean SD Min. Max. NonWhiteDiff .0495 .0931 -.2759 .5603 Blau Index .1716 .1515 .0153 .7147 % Over 65 .1896 .0462 .0378 .4669 % Hs Or Less .5941 .1565 .0953 .9647 % College .2978 .1622 .0304 .8773 Med. Fam Income 57,597 23,398 15,372 200,001 % Local Rev .4828 .2147 .0680 .9864 % Non-white .1042 .1209 .0077 .8712
TABLE 3. The table below summarizes control variables for the 505 districts in the dataset for New Jersey. __________________________________________________________________ Variable Mean SD Min. Max. NonWhiteDiff .1048 .1203 -.3111 .7648 Blau Index .2821 .1740 .0174 .7430 % Over 65 .1412 .0568 .0152 .5445 % Hs Or Less .5421 .1822 .0796 .9165 % College .3825 .1837 .0519 .8745 Med. Fam Income 74,308 23,775 26,370 175,000 % Local Rev .6593 .1885 .0595 .8959 % Non-white .1851 .1574 .0421 .9912 Results
Table 4 presents the linear regression models for average percent support
in New York and New Jersey using the Blau Index as the independent variable of
interest. Both regressions produce a negative coefficient of the Blau, signifying a
decrease in community support for a budget as racial heterogeneity increases. All
else held constant, in New York, an increase of one unit of the Blau Index results
in a .112 decrease in support, while in New Jersey, an increase of one unit of the
Blau Index results in a .101 decrease in support.

75
TABLE 4. EFFECTS OF RACIAL HETEROGENEITY ON SUPPORT FOR BUDGETS. ________________________________________________ New York New Jersey __________________________________________________________________________________________________________________________________________________________________________________________________
Blau -0.112 -0.101 fg kj dkljkj d (0.055)* (0.038)** % College 0.422 0.313 (0.109)** (0.183) (0.182) % HS or Less 0.330 0.099 (0.099)** (0.177) % Over 65 0.240 0.104 (0.074)** (0.062) % Local Revenue -0.000 -0.065 (0.000) (0.025)* Med. Fam Income -0.000 -0.000 (0.000)** (0.000) % Non-white -0.035 0.083 (0.067) (0.042) Constant 0.374 0.452 (0.085)** (0.158)** Rsquared 0.17 0.12 N 669 505
________________________________________________ * p<0.05; ** p<0.01
The table above displays the OLS coefficients for average percent support for budgets over the period of 2003 to 2011. Standard errors are listed in parentheses.
In both states, there is a significant and negative effect of racial diversity on
budget support (New York p<.05, New Jersey p<0.01). It is also noteworthy
that the coefficients are so similar in both states, as this implies that racial
heterogeneity is having a similar effect both in direction (negative) and
magnitude in both New York and New Jersey. Notably, these results hold true
even while controlling for the percentage of minority voters in the district. In a
news analysis of the 2010 Budget votes, Queens College sociologist Andrew A.
Beverage noted, “In New York, it appears that white voters in districts with large
numbers of minorities, and minority voters themselves, often voted against school
spending increases,” (quoted in Roberts 2010). The significance of heterogeneity,

76
even while controlling for minorities strengthens the claim that lower social
capital in diverse communities dampens the willingness of all races to make
support public goods (Hopkins 2009, 165).
Before the Financial Crisis, the effect of the Blau Index is even larger in
both states. In New Jersey, the Pre-Crisis coefficient of the Blau Index is more
negative at -.124, and the p-value drops all the way to .003. Post-Crisis, however,
the Blau is no longer significant, as the coefficient is -.056 with a standard error
of 0.41 and a p-value of 0.178. There are few potential explanations for the lack
of significance in the Post-Crisis period: (1) the smaller sample size of elections in
this period (2) the increased turnout observed over this period--particularly with
the increased political attention and publicity in 2010 (see Chapter 3) and (3) the
influx of state and federal aid to poorer, and potentially more diverse, districts
with the Stimulus that could have further lowered their tax burden and made
them more likely to support budgets. In New York a similar dynamic occurs.
The Blau coefficient is more negative (-.129), and again almost identical to the
New Jersey coefficient. The p-value drops to .034 before the Crisis, but the Blau
is no longer significant in the Post-Crisis results.
If we return to the overall results, the coefficients of the controls listed in
Table 4 are in line with some anticipated effects. As income increases, support for
the budget in a district increases, reflecting that those with a higher economic
status may be less resistant to higher taxes and more concerned about
maintaining good schools because of high property values. Interestingly, though,
my findings do not support the contention of Poterba (1997) that the fraction of
older persons in an area should decrease support for spending. I controlled for

77
percentage of the population 65 and older and found that not only did this
variable fail to negate the significance of my results in either state; it actually
appeared to have a positive significant effect in New York. That is, as the
proportion of the population in a district over the age 65 increased, the budget
passage rates and average support levels tended to increase by a significant
amount. Figure 7 below displays the scatterplot for the relationship between
racial heterogeneity and support for the budget in New York. There is a strong
negative relationship between the Blau Index and average percent budget
support. In contrast, the scatterplot for age in New York districts appears to show
no observable relationship between budget support and the proportion of senior
citizens (Figures 7 and 8).
FIGURES 7 AND 8. The scatterplots below show the relationships between racial heterogeneity and budget support, and percentage of senior citizens and budget support, respectively, for the 669 districts in the dataset for New York.
One possible explanation for these results is that senior citizens voting in
New York elections may have lived in their district for large portions of their
lives. New York and New Jersey are hardly tax havens for retirees; in fact, they
are some of the highest taxing states in the nation, and they are known neither for
their temperate climate nor their cheap real estate. Goldin and Katz (2009) note

78
that elderly citizens who “live far away from their community of origin and as a
political unit appear to have far less interest in the use of public resources to
enhance their communities” (162). This could account for the senior citizens that
Button (1993) observed in Florida who voted against education bond measures.
In contrast, though, New York’s elderly voters may show greater support for
budgets because they feel solidarity with their community of origin and view
school funding as “part of an intergenerational loan” (Goldin and Katz 1999,
694). This could explain why the proportions of senior citizens in New York and
New Jersey districts do not seem to negatively affect budget passage.
Table 5 presents two linear regressions models for average pass
percentage, one for New Jersey and one for New York, again using the Blau
Index as the independent variable of interest. This time, although the coefficient
remains negative in New Jersey, the level of racial heterogeneity is not
statistically significant in either state. However, we also find fewer significant
explanations overall. In New York, the coefficient representing the percentage of
senior citizens in a district remains positive and significant, while in New Jersey,
the variable of the college-educated share of the population is highly significant.
In either case, though, racial heterogeneity does not seem to have explanatory
value in predicting the number of budgets passed in districts over the full time
period.

79
TABLE 5. EFFECTS OF RACIAL HETEROGENEITY ON BUDGET PASSAGE RATES. __________________________________________________ New York New Jersey __________________________________________________________________________________________________________________________________________________________________________________________________
Blau -0.000 -.0161 (0.089) (0.137) % College 0.259 1.943 (0.176) (0.669)** % HS or Less 0.108 1.058 (0.160) (0.647) % Over 65 0.357 0.134 (0.119)** (0.226) % Local Revenue -0.001 -0.223 (0.000)* (0.092)* Med. Fam Income -0.000 -0.000 (0.000) (0.000)* % Non-white -0.205 0.105 (0.108) (0.154) Constant 0.805 -.324 (0.137)** (0.578) Rsquared 0.08 0.15 N 669 505
________________________________________________ * p<0.05; ** p<0.01
The table above displays the OLS coefficients for average passage rates for budgets over the period of 2002 to 2011 in New York and 2003 to 2011 in New Jersey. Standard errors are listed in parentheses.
Non-White Difference
My literature review and hypotheses also proposed a generational racial
divide. That is, along with heterogeneity, I argued that a relative demographic
disconnect in age and race between district voters and the students in the public
schools could be an additional handicap to budget support and passage. Table 6
displays the results of regressions that test whether there is a significant
relationship between non-white difference and voter support for budgets.

80
TABLE 6. EFFECTS OF NON-WHITE DIFFERENCE ON SUPPORT FOR BUDGETS. ________________________________________________ New York New Jersey __________________________________________________________________________________________________________________________________________________________________________________________________
NonWhiteDiff -0.140 -0.092 (0.039)** (0.029)** % College 0.413 0.359 (0.108)** (0.184) % HS or Less 0.327 0.126 (0.098)** (0.098) % Over 65 0.264 0.126 (0.074)** (0.061)* % Local Revenue -0.000 -0.072 (0.000) (0.025)** Med. Fam Income -0.000 -0.000 (0.000)** (0.000)* % Non-white -0.088 0.010 (0.031)** (0.022) Constant 0.370 0.370 (0.084)** (0.158)** Rsquared 0.18 0.12 N 669 505
________________________________________________ * p<0.05; ** p<0.01
The table above displays the OLS coefficients for average percent support for budgets over the period of 2003 to 2011. Standard errors are listed in parentheses. In both states, even while controlling for the percentage minority,
education, local revenue, and income, the difference between the non-white
population share of the schools and of the general population is a significant
predictor of support for the school budget. In both cases, the relationship is
negative: as the gap between the proportions grows larger and shifts towards
more non-whites in the schools than in the district, the percent of voters in favor
of the budget decreases. In New York, the coefficient is -.140, while in New
Jersey, the coefficient is -.092. Both of these results are statistically significant
(New York and New Jersey p<.01).34
34 Of course, the variables of percent non-white and non-white difference are highly correlated (.700 in New York and .482 in New Jersey) - however, this

81
Interestingly, in New York, we see a significant negative relationship
between the non-white share of the population and budget vote passage. This
would seem to provide evidence contrary to the predictions of Button (1993).
Button’s results in Florida school bond referenda elections claimed that blacks
were consistently more in favor of school spending than whites, which he linked
to the perception that they have more to gain “from school referendums that
would improve education and ultimately perhaps their children’s economic and
social status” (1993, 38). Though my results are for all minorities and not just
blacks, research has also shown that Hispanics are “far more likely than white
voters to prefer higher taxes and more services over lower taxes and fewer
services” (Myers 2007, 139). Both of these authors’ contentions align nicely with
claims that “minority voters have a more positive impression of government in
general and the school district in particular,” yet they doesn’t seem to hold in my
results for school budget votes (Tedin et. al 2001, 292).
One potential explanation could be that the minority residents are not the
ones showing up to vote in these elections. Evidence for the black community in
particular indicates that blacks are less likely than whites to vote on ballot
propositions (Magleby 1984; Benjamin and Marcus 1990 quoted in Button 1993,
29) and also potentially vote on fewer of the issues on the ballot than whites do
(i.e. only voting for school board members while not voting on the budget)
(Vanderleeuw and Engstrom 1987). In this case, Button (1993) claims that blacks
are “doubly underrepresented when these electoral decisions are made” (29).
multicollinearity would likely inflate the standard errors, thus making the results reported here conservative estimates of the statistical significance of the relationship between each of these variables and the dependent variable.
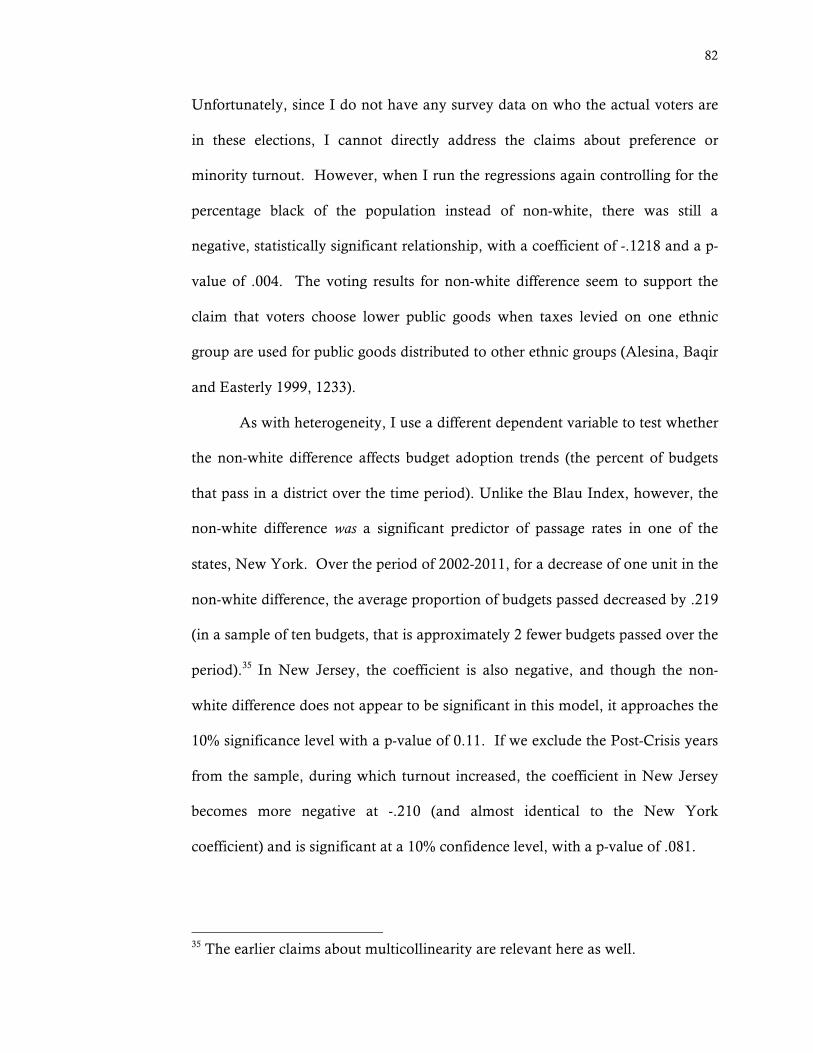
82
Unfortunately, since I do not have any survey data on who the actual voters are
in these elections, I cannot directly address the claims about preference or
minority turnout. However, when I run the regressions again controlling for the
percentage black of the population instead of non-white, there was still a
negative, statistically significant relationship, with a coefficient of -.1218 and a p-
value of .004. The voting results for non-white difference seem to support the
claim that voters choose lower public goods when taxes levied on one ethnic
group are used for public goods distributed to other ethnic groups (Alesina, Baqir
and Easterly 1999, 1233).
As with heterogeneity, I use a different dependent variable to test whether
the non-white difference affects budget adoption trends (the percent of budgets
that pass in a district over the time period). Unlike the Blau Index, however, the
non-white difference was a significant predictor of passage rates in one of the
states, New York. Over the period of 2002-2011, for a decrease of one unit in the
non-white difference, the average proportion of budgets passed decreased by .219
(in a sample of ten budgets, that is approximately 2 fewer budgets passed over the
period).35 In New Jersey, the coefficient is also negative, and though the non-
white difference does not appear to be significant in this model, it approaches the
10% significance level with a p-value of 0.11. If we exclude the Post-Crisis years
from the sample, during which turnout increased, the coefficient in New Jersey
becomes more negative at -.210 (and almost identical to the New York
coefficient) and is significant at a 10% confidence level, with a p-value of .081.
35 The earlier claims about multicollinearity are relevant here as well.

83
The results for the effects of non-white difference on budget adoption are
shown in the table below.
TABLE 7. EFFECTS OF NON-WHITE DIFFERENCE ON BUDGET PASSAGE RATES. ________________________________________________ New York New Jersey ___________________________________________________________________________________________________________________________________________________________________________________________
NonWhiteDiff -0.219 -0.168 (0.063)** (0.107) % College 0.288 2.038 (0.173) (0.674)** % HS or Less 0.137 1.121 (0.158) (0.649) % Over 65 0.403 0.169 (0.118)** (0.223) % Local Revenue -0.001 -0.234 (0.000) (0.092)* Med. Fam Income -0.000 -0.000 (0.000) (0.000)* % Non-white 0.088 -0.005 (0.050) (0.082) Constant 0.772 -0.369 (0.135)** (0.579) Rsquared 0.10 0.15 N 669 505
________________________________________________ * p<0.05; ** p<0.01
The table above displays the OLS coefficients for passage rates for budgets over the period of 2002 to 2011 in New York and 2003 to 2011 in New Jersey. Standard errors are listed in parentheses.
Turnout
One dependent variable that is often used in studies of civic behavior is
political turnout. If we believe that social capital is what is driving these results,
then social capital should also affect turnout. Voters in racially diverse districts
should be less likely to vote in school elections.
When we move to a turnout prediction model, racial heterogeneity does
continue to demonstrate strong effects. Even with all else held constant, ethnic

84
heterogeneity is negatively correlated with turnout. These results indicate that
voters in racially homogenous communities tend to vote more in school budget
elections. For every increase of one unit in the Blau Index, turnout decreased by
.19 in New York and .13 in New Jersey. The results are shown below in Table 8.
The effect is stronger in New York than in New Jersey, but in both cases, the p-
values exceed the requirements for significance at 1%. When the Post-Crisis years
are excluded from the model, effectively removing the high-turnout outlier of
2010, the effect on turnout changes very little, as the coefficients shift slightly to -
.198 in New York and -.128 in New Jersey. These results allow us to reject H03
that racial heterogeneity has no effect on voter turnout and provides strong
support for the contention that more ethnically fragmented communities are less
likely to vote in local school elections.

85
TABLE 8. EFFECTS OF RACIAL HETEROGENEITY ON TURNOUT ________________________________________________ New York New Jersey __________________________________________________________________________________________________________________________________________________________________________________________________
Blau -0.190 -0.130 (0.035)** (0.023)** % College -0.012 -0.314 (0.070) (0.114)** % HS or Less 0.006 -0.341 (0.064) (0.110)** % Over 65 -0.043 0.001 (0.047) (0.038) % Local Revenue 0.001 0.046 (0.000)** (0.016)** Med. Fam Income 0.000 0.000 (0.000)* (0.000)** % NonWhite 0.051 -0.015 (0.043) (0.026) Constant 0.076 0.402 (0.054) (0.099)** Rsquared 0.37 0.53 N 669 505
________________________________________________ * p<0.05; ** p<0.01
The table above displays the OLS coefficients for average percent turnout for school elections over the period of 2003 to 2011. Standard errors are listed in parentheses. Some researchers may contend that the true explanation here is that
minority voters simply turn out in lower numbers than white voters (Verba,
Schlozman, and Brady 1995). However, these results about diversity hold true
even while controlling for the percentage non-white, so this does not appear to be
only a story about the proportion of minorities living in these districts. Rather,
these results tend to lend credence to Putnam’s (2007) claim that all members of a
diverse community tend to “hunker down” and display less civic engagement,
“regardless of the color of their skin” (149-151).
Figures 9 and 10 display scatterplots of average turnout in New York and
New Jersey over the time period of 2003-2011. Quite vividly, both display a

86
strong, negative relationship between ethnic heterogeneity and voting in school
budget elections. The correlation was -.5751 in New Jersey and -.2262 in New
York. As the Blau Index rises, turnout tends to drop fairly dramatically in both
states. These results support prior findings that voter turnout in national elections
decreased in counties as racial heterogeneity increased, and contribute to the
literature by adding evidence from local elections on this point (Campbell 2006;
Costa and Kahn 2003). The results also align with one piece of Campbell’s (2006)
“dual motivations” theory. That is, these results support his contention that in
homogenous communities “people are more likely to go to the polls out of
adherence to a civic norm” (48).
Campbell, however, was testing political heterogeneity, and the data from
school elections indicate that there is something very different about the effects of
political heterogeneity and racial heterogeneity on turnout. My results for racial
heterogeneity do not support the claim that in heterogenous communities
“people are more likely to vote because they feel their interests are threatened”
(2006, 48). The high voting rates in East Ramapo seem to be the exception,
rather than indicative of the larger trend.36 The following scatterplots show
negative linear relationships between heterogeneity and turnout, rather than the
curvilinear relationship that Campbell finds for political heterogeneity.
36 However, the unique circumstances of the Orthodox community and the bloc vote in East Ramapo are important to recall here.

87
FIGURE 9. The scatterplot below shows a negative relationship between racial heterogeneity and turnout for the 669 districts in the dataset for New York.
FIGURE 10. The scatterplot below shows a negative relationship between racial heterogeneity and turnout for the 505 districts in the dataset for New Jersey.
One way of interpreting these results is to think about how they play out
in elections in the most diverse districts. Tables 9 and 10 display the districts with

88
the highest levels of racial heterogeneity in New Jersey and New York
respectively. The mean percent turnout for these districts in New Jersey was
6.25%, which is between one and two standard deviations (5.41%) away from the
New Jersey state mean of 13.67%. In New York, the mean percent turnout for
school elections in the most racially diverse districts was 6.62%, compared to a
statewide mean of 12.67%. The most diverse districts in New York also fell more
than one standard deviation (5.79%) below the state average for turnout. These
tables highlight again that racial heterogeneity does not appear to raise turnout in
any way.
TABLE 9. New Jersey Districts With Highest Blau Index
District %
White %
Black %
Other Blau Index
Average % support
Average % turnout
Woodlynne 0.2817 0.3355 0.2310 0.7430 0.5023 0.0732 Atlantic 0.2665 0.3829 0.1403 0.7361 0.5994 0.0445 Bridgeton 0.3264 0.3549 0.2571 0.6994 0.6768 0.0219 Piscataway Township 0.3846 0.2069 0.0359 0.6949 0.5595 0.0875 Hackensack 0.4667 0.2444 0.1359 0.6914 0.6075 0.0391 North Brunswick Township 0.4661 0.1747 0.0816 0.6857 0.4972 0.0807 Pleasantville 0.2433 0.4594 0.2200 0.6787 0.5535 0.0376 Pennsauken Township 0.4760 0.2687 0.1359 0.6754 0.5062 0.0751 Englewood 0.4528 0.3258 0.0973 0.6713 0.6070 0.0741 Carteret 0.5068 0.1485 0.1118 0.6708 0.4224 0.0920 Average 0.3871 0.2902 14.47 0.6941 0.5532 0.0626
State of New Jersey Mean 0.8148 0.0700 0.0442 0.2821 0.5469 0.1367

89
TABLE 10. New York Districts With Highest Blau Index
District %
White %
Black %
Other Blau Index
Average % support
Average % turnout
Valley Stream 30 Union Free 0.3722 0.3344 0.1005 0.7147 0.5980 0.0738 Westbury Union Free 0.3523 0.3307 0.2231 0.7128 0.5014 0.0899 Elmsford Union Free 0.4527 0.2463 0.1414 0.6999 0.5982 0.0764 Central Islip Union Free 0.4472 0.2429 0.2082 0.6930 0.5506 0.0807 Freeport Union Free 0.4258 0.3046 0.1947 0.6852 0.6747 0.0822 Elmont Union Free 0.3389 0.4257 0.0843 0.6836 0.6042 0.0595 Hempstead Union Free 0.2283 0.4577 0.2396 0.6780 0.5942 0.0406 Brentwood Union Free 0.4895 0.1655 0.2529 0.6651 0.6088 0.0448 Uniondale Union Free 0.3002 0.4680 0.1673 0.6611 0.6560 0.0358 Peekskill City 0.5078 0.2397 0.1580 0.6549 0.5900 0.0524 Average 0.3915 0.3215 0.1770 0.6848 0.5976 0.0636
State of New York Mean 0.8959 4.07 .0190 0.1715 0.6369 0.1267
Table 11 shows a list of the ten New York districts with the greatest non-
white difference. The chart draws attention to the explicit contrast between the
white proportions of the district populations and the schools. It also highlights
that many of these districts had problems with budget passage. All of these
schools’ pass percentages fell below the New York average for the time period,
though two of the districts did succeed in passing nine out of ten of their budgets
over the time period. The mean percent of “yes” votes in these districts fell
almost one standard deviation (7.1%) below the state mean (63.7%).

90
TABLE 11. New York Districts with Greatest Non-white Difference
In New Jersey, I observe similar outcomes in elections in the districts with
the largest demographic gaps. Table 12 shows the ten districts in New Jersey with
the widest percentage difference between the population share of non-whites in
the public schools and non-whites living in the district. The average percent
support over the 9-year period for these districts was close to one standard
deviation below the mean for all New Jersey districts (6.27% vs. 6.82%).
Whereas the mean New Jersey district passed 6.04 of their budgets over the
period, these districts only passed 5.3 on average. Four of these districts failed to
even pass half of their budgets. The votes in these districts, therefore, show how
the non-white difference often does materialize into election outcomes. These
District Total
Population Population % White
Population % Non-white
% White
Student Body
% Non-white
Student Body
% Non-white
difference
Pass Percentage 2002-2011
Average %
support 2003-2011
East Ramapo
Central 113,031 0.6517 0.3483 0.0914 0.9086 0.5603 0.50 0.4677
Lawrence Union Free 35,590 0.7969 0.2031 0.3330 0.6670 0.4639 0.60 0.5729
Port Chester-Rye Union
Free 31,910 0.6296 0.3704 0.1798 0.8202 0.4498 0.90 0.5851
Amityville Union Free 26,210 0.5225 0.4775 0.0894 0.9106 0.4331 0.90 0.5997
Greenburgh Central 21,801 0.5392 0.4608 0.1116 0.8884 0.4276 0.70 0.5592
Bridgehampton Union Free 1,519 0.7465 0.2535 0.3376 0.6624 0.4089 0.90 0.6250
Brentwood Union Free 87,253 0.4895 0.5105 0.0915 0.9085 0.3980 0.80 0.5425
Tuckahoe Common 3,350 0.8531 0.1469 0.4645 0.5355 0.3886 0.90 0.5779
Copiague Union Free 30,505 0.6036 0.3964 0.2170 0.7830 0.3866 0.80 0.6002
Central Islip Union Free 37,383 0.4472 0.5528 0.0652 0.9348 0.3820 0.60 0.5363
Average
38, 855 0.6280 0.3720 0.1981 0.8019 0.4299 0.77 0.5727
New York State Average 15,783 0.8958 0.1042 0.8461 0.1539 0.0496 0.92 0.6370

91
tables illustrate how white voters in districts where minorities are
disproportionately represented in the public education system could be less
willing to support annual school budgets. With regard to school resources, they
highlight that the students in these districts often face a greater risk of budget
rejection and the subsequent cuts in services that come with it.
TABLE 12. New Jersey Districts with Greatest Non-White Difference
Chapter Summary
The patterns illustrated in this chapter suggest that both racial
heterogeneity and non-white difference are having a real impact on outcomes and
participation in school budget voting. Many have proposed this kind of
relationship in other political contexts but few have attempted to directly
demonstrate it within the education policy domain.
District
Total Population
Population % White
Population % Non-white
% White
Student Body
% Non-white
Student Body
% Non-white
difference
Pass Percentage 2003-2011
Average %
support 2003-2011
Lakewood Township 92,843 0.8433 0.1567 0.0785 0.9215 0.7648 0.1111 0.2578
Hoboken 50,005 0.8224 0.1776 0.2164 0.7836 0.6060 0.8889 0.6040
Guttenberg 11,176 0.6744 0.3256 0.0737 0.9263 0.6007 0.3333 0.4619 Dover Town 19,677 0.6592 0.3408 0.1085 0.8915 0.5508 1.0000 0.6320 Union
Township 5,908 0.8321 0.1679 0.2849 0.7151 0.5472 0.8889 0.5664 North Bergen 60,773 0.6698 0.3302 0.1255 0.8745 0.5443 0.0000 0.1220
Red Bank 12,206 0.6320 0.3680 0.1216 0.8784 0.5104 0.7778 0.5304
Perth Amboy 50,814 0.5026 0.4974 0.0245 0.9755 0.4781 0.7778 0.5820
Bound Brook 10,402 0.6973 0.3027 0.2363 0.7637 0.4610 0.2222 0.4121
Elizabeth 124,969 0.5465 0.4535 0.0865 0.9135 0.4600 0.8889 0.6146
Average
43,877 0.6880 0.3120 0.1356 0.8644 0.5523 0.5889 0.4783 New Jersey
State Average
15,783 0.8149 0.1851 0.7101 0.2899 0.1047 0.6715 0.5410

92
The results in this paper are consistent with some of the predictions about
heterogeneity that have preceded it. Others have already predicted that diversity
and in-group and out-group differences affect civic behavior in communities.
These results support arguments that increased diversity dampens turnout,
increases resistance to public goods investments, and makes political cooperation
more difficult.
What is most interesting about these particular results is the relationship
between the setting and the implications. The decisions that voters in these
districts make directly affect education provision. One could argue that these
elections help shape opportunities, attitudes, and certainly resource distribution
for public education in a community. And yet, the vast majority of the direct
recipients of this public good, the students, are unable to participate in the
decision-making process.37 These results highlight an inherent tension between
the goals of public education and the institutions of direct democracy. I will
conclude by exploring this relationship in further detail in Chapter Six.
37 The exception would be public school students over the age of 18.

93
CHAPTER SIX: CONCLUSIONS
The quantitative results in this paper have shown that increased racial
heterogeneity hinders both budget support and turnout in New York and New
Jersey school elections. However, some may remain unconvinced that these
findings should discredit budget referenda more generally. That is, people may
doubt that concerns about diversity should outweigh the democratic
accountability that budget voting provides.
This final chapter seeks to persuade the skeptics that school budget voting
is a normatively undesirable way to make decisions about school funding. I will
argue that there are three main areas in which school budget referenda lack
inherent institutional strength. The first section will focus on the weaknesses of
the general process, scale, and mechanisms of budget voting in a district context.
The second section will revisit the substantive content of education finance, and
the unique challenges that it poses to democracy. The third section will reflect on
my statistical results to specifically address how and why budget votes perform
particularly poorly in diverse settings. Using evidence from these three content
areas, I argue that school budget referenda produce education funding outcomes
that are inequitable and often non-representative across both states. I will
conclude by seeking to propose alternate means of including and better
representing the public in budgetary decisions on education.
The Budget Process: Scale, Mechanisms, and Timing
At first mention, the institution of school budget voting is still
normatively attractive to many citizens in these states. When asked about her

94
opinion on budget referenda, Dawn Smith, a school board member in the West
Essex Regional District in New Jersey stated frankly, “As a taxpayer, I would
want that vote” (quoted in Goldberg 2012, 2). Many voters agree; they distinctly
appreciate the opportunity to vote on their rate of taxation. If school governance
truly represents the “crucible of democracy” in America, this means of extending
budgetary decisions to the general public could seem to enhance democratic
accountability and encourage community participation in public education (Lutz
and Iannaccone 1995). In practice, however, the results of this paper show that
school budget referenda are fundamentally flawed.
The original, and still popular, justification behind independent school
districts was that they served as an important “buffer” from local control,
allowing fiscally and electorally independent school board members to “suppress
public participation” and separate “school policymaking from poorer
neighborhoods and school government from general purpose government”
((Tyack and Cuban 1995; McDermott 1999, 80, 43-44). The school boards are
supposed to look out for the best interests of the schools rather than act within
the constraints of the politically-motivated, normal legislative process. The idea
of both the early proponents of school committees in Massachusetts and, later,
the Progressives, was that the separation of school boards from the public would
remove the institution of education from the other contentious aspects of
community life and political disputes (Berkman and Plutzer 2005, 65). Ideally,
the school board is supposed to be “nonpartisan and nonsectarian;” they are to
“act as an agent of the state for school policy and operations that the state
chooses to delegate” (Wirt and Kirst 2009, 132). The holding of school budget

95
referenda at a separate time from partisan elections has been justified in a similar
light.
It is pertinent, then, to evaluate the referenda process with respect to this
context and these aims. On the one hand, an annual referendum provides a
visible check on these independent bodies, to ensure that the boards don’t veer
too far away from their connection with the public. On the other hand, the
elections could be interpreted to contradict the original intentions of separated
school governance. Leaving the actions of budgetary decision-making vulnerable
to a public veto negates some of the board’s advantages: it brings decision-
making on schools back into the public political sphere, and undermines the
supposed expertise of “trustees” who are supposed to possess a broad sense of the
public interest (Hamilton and Cohen 1974).
The advocates of tax levy votes have argued that referenda, as applied to
school district finances, provide necessary additional fiscal accountability and
checks on “needless” spending by public school districts. To prevent excessive,
unauthorized spending, the argument goes, it is crucial and normatively
important that citizens have an institutionalized means of “checking” the actions
of unelected school officials, by consenting, or rejecting their allocation of
taxpayer funds. This argument is based in a certain larger view of public
bureaucracies, popularized by both scholars and policymakers alike, that that the
structure of public bureaucracies inevitably leads government officials to
maintain and enlarge the economic base of government (Michaelson 1981;
Niskanen 1971). Referenda in education, then, could hypothetically serve two
cost-control functions. First, they could discourage superintendents and school

96
boards from proposing unnecessarily high rates of spending, by incentivizing
them to put forward a prudent, economical budget to minimize the chance of
electoral defeat. If the taxation rates and spending allocation decisions are not in
line with the preferences of the voters, the advocates would argue that it is
democratically just for the budget be rejected in favor of a re-vote or a
contingency budget.
Those who laud budget referenda for providing financial accountability
and citizen participation, however, ignore or are unaware of other evidence that
shows that the election process does not in fact result in a budget that better
reflects the preferences of the community. Balsdon, Brunner, and Reuben (2003),
for example, find that “due to the political and monetary costs associated with
holding an election and uncertainty about voter preferences, school boards
propose spending levels that are smaller than the maximum amount the decisive
voter is willing to accept” (612). In a similar model, Rothstein (1994) concludes
that, in this institution, the setter (the school board) is “poorly informed about
voter preferences” (385). These problems seem particularly pronounced in
racially diverse districts because, as mentioned previously, minorities typically
vote in lower numbers and immigrants with children in the schools are often not
eligible to vote (Verba, Schlozman, and Brady 1995; Myers 2007).
In this light, a key question that this specific institutional set-up poses is
whether it is appropriate to have citizens vote directly on a tax rate, rather than
having their representatives determine it for them. The politically contentious
questions of tax burdens open the referenda up to a number of institutional
problems of representation and accountability. Lutz and Iannaccone (2008)

97
contend that it is dissatisfaction that motivates voters to vote in local school
elections; they argue that citizens “bother to vote…when [they] become
dissatisfied enough that something happens to get [their] attention” (4). They
reason that since voters cannot vote against an unpopular policy itself, they vote
against the incumbent policy makers. However, with the introduction of the
referendum, a seemingly-clearer substitute for policy emerges.
Budget votes, as a direct election on the schools and taxation, provide an
easy target for those dissatisfied with different aspects of education, or even
community life. Many studies have led scholars to conclude that some “may vote
against school levies out of a general feeling that taxes are too high” and that that
school tax levies become “a target for people who wish to express displeasure at
the existing level of taxation” (Philliber 1977, 190; Jennings 1973, 567). While
taxes at a federal or state level are not subject to direct public approval, the
referenda process mandates that school taxes can only be increased with consent
of the people. This imbalance in popular input institutionally disadvantages the
schools, which have to withstand general feelings of distrust and dislike towards
taxes and public bureaucracy.
In addition, the tax framing of a referendum vote also partially shields the
teachers and principals who are responsible for student achievement (and are
protected from electoral demands), the school board members, mayors,
governors, state legislators, even members of Congress. All of these actors affect
the quality of education in a district in some way, yet the referendum deflects
their electoral accountability on school policy. In the process of evaluating the
tax levy, the voters can become distracted from the real policy questions. By

98
using the tax rate as the direct electoral mechanism, then, referenda can obscure
or inhibit true representation on education policy matters.
Hamilton and Cohen (1974) claim that school financial referenda not
only “provide convenient means for disgruntled individuals and interest groups
to vent their displeasure with school policies or taxes” but also that threats or
successful attempts to defeat budget referenda can be used “inflict leverage or
inflict retribution on a school board” (10). The influence of voters vocally
opposed to higher spending can result in lower budgets in subsequent years. In
their study of proposed school budgets and referendum outcomes in 49 Long
Island school districts, Scott Feld and Joel Grossman (1984) found that the
outcomes of budget elections affected future budget proposals. Across the 49
districts, the school boards subsequently proposed lower budget increases in the
years after a referendum defeat to increase the chances of passage (367).
This finding illustrates quite starkly that the choice to connect elections
with the school funding system “affect[s] the fundamental incentives schools face
and thus, over the long term, the goals they pursue” (Hoxby 1996, 51). When
schools must effectively “sell” their budgets to their constituents, their focus must
shift to the political realities of getting the budgets passed each year. It seems
highly feasible that, in order to avoid the possibility of an austerity budget, the
districts could cater their proposals to meet the needs of likely voters rather than
students, hurting representation and equity along the way. Feld and Grossman
(1984) report that as a result of the tendency of referenda to fail
disproportionately in poorer districts, the poorest districts “spend less than they
would have if the budgets were left to school boards without requiring school

99
budget referenda” (374). My results suggest that this conclusion could be applied
to the most diverse districts as well.
There are also certain detrimental direct costs to holding a budget vote for
a small body like a school district. Though conducting a referendum costs
minimally extra if the budget vote is held at the same time as already-scheduled
school board elections in the spring, the responsibility of holding separate school
elections costs districts thousands of dollars in administrative costs each year.38 In
addition, there are the more indirect costs that accompany the “need to convince
voters of the benefits of voting "yes" rather than merely informing voters about
the budget,” whether through fliers, phone calls, and signs (La Manque 1993, 6).
It takes time and resources to produce and distribute budget information, and it
requires the commitment and energy of school officials to attempt to persuade
voters. These costs are hard to quantify, but they are the costs for the district, its
administrators, its taxpayers, and ultimately its students. As Lynne Strickland,
director of the Garden State Coalition of Schools noted, “administrators and
superintendents [are] weary of working months on a budget only to have their
work undone by a handful of the district’s voters — some of whom are against
any increase in spending no matter the size or reason… Administrators [are put]
in the unenviable position of spending months selling their budget instead of
focusing on education” (quoted in Goldberg 2012).
In many cases, the districts where these costs will be the highest are those
that are most vulnerable to budget defeat in the first place – often the most
38 Moving school elections to November, when general elections are held, is estimated by New Jersey nonpartisan state Office of Legislative Services to save the average district 0.08 percent of its budget (Goldberg 2012).

100
diverse districts. As my results showed, many of the most heterogeneous districts
have some of the lowest levels of support for budgets. My findings suggest that
this may be because they have low levels of social capital.
As others have noted, the development and strengthening of social capital
requires the consumption of an important resource, namely, time (Verba et al.
1995; Rupasingha et al. 2006; Atkinson and Fowler 2011). Even in communities
that have comparably high levels of social capital among its residents, these
networks and interactions do not necessarily mean that the citizens are actively
and rightfully informed about the school election. It is fairly easy to envision a
scenario in which a parent uses their social capital to be involved on a local
library board, or a senior citizen to be active in their local chapter of AARP. In
diverse communities in particular, people may find that their time, even if
indirectly dedicated towards a task that builds social capital, is better spent in
another form. Campbell (2006) notes, for example, that in many homogenous
communities, civic engagement may manifest itself in high rates of volunteering
and community service, whereas in heterogeneous communities, participation
more often takes the form of overtly political causes that are attached to party
politics. Meanwhile, when administrators and community leaders are distracted
by attempts to persuade the voters to approve for the budget, they are spending
valuable time that could have been used to strategize on improving student
performance, building social capital, or engaging the community in decision-
making in other ways.
One problematic attribute of the institution that is specific to the context
of the system of local district elections is the relative inaccessibility of information.
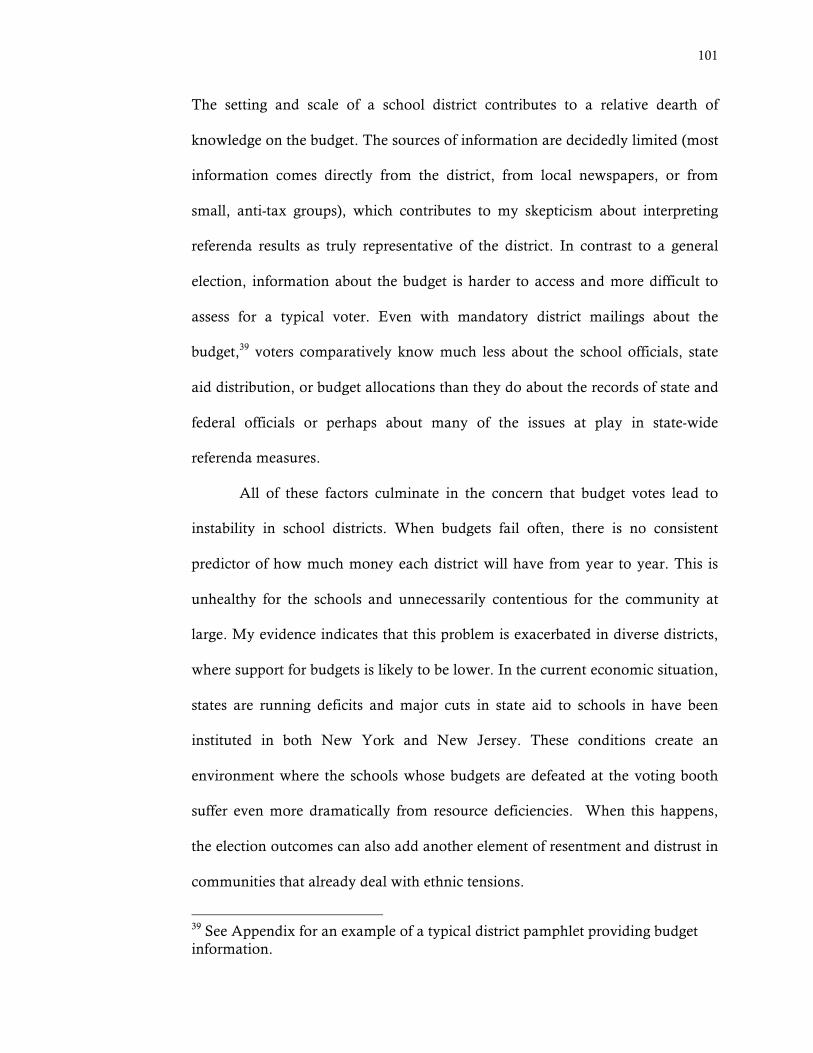
101
The setting and scale of a school district contributes to a relative dearth of
knowledge on the budget. The sources of information are decidedly limited (most
information comes directly from the district, from local newspapers, or from
small, anti-tax groups), which contributes to my skepticism about interpreting
referenda results as truly representative of the district. In contrast to a general
election, information about the budget is harder to access and more difficult to
assess for a typical voter. Even with mandatory district mailings about the
budget,39 voters comparatively know much less about the school officials, state
aid distribution, or budget allocations than they do about the records of state and
federal officials or perhaps about many of the issues at play in state-wide
referenda measures.
All of these factors culminate in the concern that budget votes lead to
instability in school districts. When budgets fail often, there is no consistent
predictor of how much money each district will have from year to year. This is
unhealthy for the schools and unnecessarily contentious for the community at
large. My evidence indicates that this problem is exacerbated in diverse districts,
where support for budgets is likely to be lower. In the current economic situation,
states are running deficits and major cuts in state aid to schools in have been
instituted in both New York and New Jersey. These conditions create an
environment where the schools whose budgets are defeated at the voting booth
suffer even more dramatically from resource deficiencies. When this happens,
the election outcomes can also add another element of resentment and distrust in
communities that already deal with ethnic tensions.
39 See Appendix for an example of a typical district pamphlet providing budget information.

102
Education Finance Questions
Local budgetary decision-making is especially important in New York
and New Jersey because schools in these states are so heavily dependent upon
local revenue.40 Since local funds often make up the majority of the revenue for
school districts, it is essential to examine how the institutions that determine the
level of money either encourage or inhibit the equality of resources for students.
There are a few important factors in the context of the education finance
system that make school budgets unfit subjects for a public veto. In their
assessment of plebiscitary budgeting, Sears and Citrin (1982) call the process “a
little bit like carving a turkey with an ax” (274). I agree with their evaluation. I
argue that an up-or-down vote on spending neglects concerns about equitability
in schooling and fail to reflect the complexity of education funding realities.
One way that the budget voting causes problems within the education
finance framework is its interaction with the politics of state aid. The state
governments of New York and New Jersey, composed of local representatives,
are responsible for determining the formulas and distribution of state aid for
education. As noted earlier in this chapter, the annual budget elections often
serve as a prism through which voters can see the direct linkages of school
funding and their property tax burden. Pecorella (2006) argues that these
conditions incentivize politicians in state government to lobby and bargain in an
attempt to bring in large amounts of state aid to their constituents. The elected
officials that represent jurisdictions with independent school districts often
40 See Chapter 3 for information about local revenue.

103
attempt to manipulate state aid to lower the property tax burden of their
constituents for political gain.
However, the same level of incentives does not exist for the state
representatives and senators based out of urban school districts, in which
revenues are derived from the municipal budget. Voters are less aware of budgets
in these jurisdictions because “the connection between taxes and expenditure [is]
less direct” (Pecorella 2006, 279). This disparity in political relevance for both the
citizens and the politicians can skew funding towards districts and students that
don’t actually need it the most. Holding budget votes in some but not all districts
thus encourages inequities in the appropriation and distribution of state funds.
Hamilton and Cohen (1974) note that tax levy decisions can reflect the
electoral willingness of certain communities to support higher taxes. They also
note, however, that over time, the levels of support for school taxes demonstrated
in elections can affect the distribution of teachers. Homogenous communities
that approve high tax levies can use that money to raise teachers’ salaries. They
also can hint at increased stability for the teachers. Every time that a budget fails,
layoffs become likely. Therefore, if heterogeneous districts have very limited
ability to levy tax increases, they are at “a serious disadvantage in
competition…for hiring teachers” (quoted in Hamilton and Cohen 1974, 18).
One could feasibly imagine these dynamics playing out between heterogeneous
and homogenous districts statewide. The fear of budget failure in diverse districts
could deflate salaries and push the best teachers into the most homogenous
districts. A trend like this would defy the condition of equity among districts.

104
This case highlights the real, tangible consequences of tax levy decisions:
because relative local revenue streams are so important to district resources,
districts with higher levies can place themselves at an institutional advantage.
Though there is an ongoing debate about whether or not higher spending levels
always lead to better outcomes in education, one cannot deny that budget
passage matters substantively – it matters both “to the teachers drawing salaries
and to administrators purchasing additional materials and deciding whether to
fully fund the band or art classes” (Berkman and Plutzer 2005, 145). In West
Orange (NJ), a 57% white district with a 75% non-white student body, the
proposed 2010-2011 budget had already included 39 teacher layoffs, reduced bus
service, music and art instruction cuts, and fewer vocational education courses
and extracurricular activities. When the budget was rejected, the district had to
begin cutting kindergarten to a half day, ending Spanish classes and guidance
counselors in the elementary schools, reducing library and nursing staffs, and
dropping middle school and freshman sports teams (Hu 2010a). Those who vote
against school budgets are likely unaffected by the service cuts that come with a
failed budget, but within the school system, budget rejection has a major impact.
Diversity and Public Goods
The final section of this chapter seeks to bring this thesis back to its initial
claims about heterogeneity, by arguing that diversity exacerbates many of the
aforementioned problems with the school budget referenda. My results about
diversity and non-white difference show us quite starkly how these elections can
contradict the reformers’ original goals for a system that promotes the public
good over politics. The effects of diversity as demonstrated in this paper present

105
some of the strongest evidence for how direct democracy can achieve results that
are adverse to schools’ democratizing goals.
To recall, I found that (1) the more racially diverse a district was, the
lower the support for school budgets, (2) the larger the difference between non-
white students and non-white voters, the lower the support for school budgets,
and (3) voter turnout in districts decreased as racial heterogeneity increased.
These results help to decipher a piece of what determines voter preferences about
school funding and tax levies. However, what they don’t explain is what are
socially optimal levels of education provision. That is, I contend that voter
preferences about education and optimal outcomes in education are not the same
thing.
Budget voting in heterogeneous communities helps expose what Caroline
Hoxby (1996) calls one of the “classic problems of publicly funded goods –the
free rider problem” (55). In her view, schooling often tends to be underprovided
because of the key question of “why should households without children [in the
schools] pay to make the optimal investment in others’ children?” (Hoxby 1996,
55). This problem seems to be more commonly present when there is racial
division within a community; or, in other words, when there is a sense that the
kids that are being educated do not belong to one’s own kin group. My empirical
evidence has supported this claim in application to school tax referenda.
This demographic disconnect between the people who vote and the
citizens who are affected appeared to be a key mechanism in explaining why
voters in diverse communities are often less likely to support school budgets. The
institution, as currently designed, fails to account or compensate for two

106
demographic realities: 1) With the exception of a handful of 18 year-old high-
school seniors, the children, the recipients of this public good, are not eligible to
vote and 2) In districts where demographics are changing, where many parents
are not yet citizens, or with an influx of retirees, the majority of the voting
electorate could belong to one ethnic group, but the majority of students in the
district could belong to another group. As Steve White noted, “The current
system doesn’t address the question of governance with the consent of the
governed,” he said, adding, “It doesn’t feel like America” (quoted in Applebome
2009).
There is a substantial foundation for the concern, then, that in the long-
term, if the voting base continues “to diverge from the school population” it “will
erode willingness to pay taxes” (McDermott 1999, 23). Granted, budget votes
themselves are not responsible for demographic realities. However, the
institutions of direct democracy are ill-suited to address this particular
demographic disconnect on education. Uniformly-administered school budget
referenda across the state fail both to recognize and to mitigate the challenges
posed by diversity. Direct democracy is a poor fit when it comes to addressing
funding needs.
The question, then, is what do we do about it.
Recommendations
If we were to follow the advice of Putnam (2009), whatever action we
take should be striving to “bolster social solidarity in the decades ahead” with the
ultimate goal of “retaining social cohesion in the context of increased ethnic

107
diversity” (3). I agree with his general sentiments, yet I approach the issue with a
focus on institutions, in part because I acknowledge the findings of several
empirical studies that have suggested that good institutions foster social capital
but the reverse relationship does not hold (Letki and Evans 2005; Booth and
Richard 1998).
My aim is not to discredit the idea that communities should strive to build
social capital, particularly of the “bridging” form, but instead, to argue that there
are also actions that government can take to make decision-making processes in
diverse environments a little bit smoother. As Putnam himself acknowledges,
diversity and immigration bring a wide host of benefits to the United States,
including, among other perks, faster economic growth (Putnam 2009, 3). My
contention is that the effective and equal provision of high-quality public
education is a key component to achieving this goal, and therefore, our electoral
institutions should seek to improve and prioritize the provision of education,
particularly in heterogeneous settings.
In pursuit of that goal, then, a final move that this paper seeks to achieve
is to distinguish the general concept of voting, and other forms of locality-based
democratic participation in public schools, which are normatively good, from
decisions on school funding, which, for reasons of equity, should not be subject
to direct electoral rejection or approval. Traditional proponents of school
elections have pointed to two important advantages of public participation in
school decision-making. The first endorses public involvement in the substance of
public education, arguing that elections give citizens the “ability to affect the
quality of school governance and possibly the quality of the schools themselves”

108
(Feuerstein 2002, 16). The second justification relates less to school governance,
but applauds democratic participation as a means of “strengthening social ties
and providing a sense of legitimacy to the decisions of the school board’
(Feuerstein 2002, 16). Both of these roles are important, but I aim to argue that
these goals can be accomplished in alternative ways.
As opposed to attempting to fix the inherent flaws of the referenda
system, then, I advocate for reforms to strengthen the traditional school board
structure, instituting changes that help the board to better meet the challenges of
modern education budgeting. In particular, reforms that address the current
equity and representation problems exposed by the budget referenda are
especially needed. I also contend that school budget voting itself is
democratically problematic, and should be phased out in New York and New
Jersey.
Democracy is symbolically powerful, and the act of voting “links the
individual citizen to the school in a direct and intimate way that is unparalleled
for other major public policies” (Wirt and Kirst 2009, 115). School board
candidate elections, and perhaps even other policy questions on a ballot, then,
can still help citizens feel ownership over the schools, and make public education
more accountable to local constituents, without the inconsistency problems of
direct budget votes. Even if school board elections cannot guarantee deliberation
or representative outcomes, they help keep school boards as the political
institution that is closest to the voters, and education as a policy domain in which
citizens have a great opportunity for democratic participation and democratic
control (Tyack and Cuban 1995). Meanwhile, they have the potential to

109
accomplish these goals without the equal risk of strategically disadvantaging
some districts over others. In spirit, a board election alone can “embody an
aspiration toward popular governance” without sacrificing equity (Plank and
Boyd 1994, quoted in Feuerstein 2002, 14). The same is not true for a school
budget election because of the substantive questions about financial and political
equality.
However, school board elections do face some of the same questions
about representation that are associated with referenda, particularly with regard
to low turnout in diverse districts. One way to attempt to address this is by
increasing turnout in elections, overall, and also by particularly targeting those
who are directly impacted by the governance of public schools. Ehrenberg,
Ehrenberg, Smith, and Zhang (2004) propose the strategy of ensuring that
balloting takes place in every district elementary school to ease voting
convenience for school parents and minimize the time it takes to find and travel
to election locations (122).
An alternative, and more dramatic, method is to move to a system of
consolidated school elections. In a comparison of Michigan school districts that
utilized special elections, and those that held consolidated elections to coincide
with municipal elections, Ann Allen and David Plank (2005) found that
consolidated elections resulted in greater turnout, greater representation of
minority voters, greater election information to voters, and more coordination
between city and school services (522). In particular, I am attracted to their
finding that a greater percentage of minority citizens were represented when they

110
could vote at the same time and in the same places where they elected their
normal political representatives.
Interestingly, New Jersey has begun to move in the direction of my
recommendations (although with little to no mention of equity or diversity
concerns). On January 17, 2012, Governor Chris Christie signed a law that
would allow districts to cease with the process of budget approval altogether. The
new legislation, which was also supported by the Democratic State Senate and
Assembly, institutes two important changes. School districts are now allowed to
move their springtime elections to the November general election either by voter
approval or by resolution of the school board or governing body (Rundquist
2012). If a district moves their election to November, the board is also no longer
required to seek budget approval from the voters so long as the budget falls
within a 2 percent tax levy increase cap.41
The sponsors of the law justified it under two primary categories: one, the
November date would save districts from the costs of having a separate election,
and two, it would accomplish the goal of raising voter turnout. The (Newark)
Star-Ledger, New Jersey’s largest newspaper, applauded the move in an editorial,
citing the current “susceptibil[ity]” of the elections to “influence from special
interest groups, such as the teachers union” and the ability of a general election
to “dilute the impact of special-interest lobbying” (The Star-Ledger, January 9,
2012).
Serious objections remain, however, to the move. First, there are the
practical considerations of budgeting and timing. The move to November puts
41 If the increase were higher than 2 percent, then the districts would still need to seek approval from the public in the November election.

111
the election out of timing with the budget for the school year. This was the
justification for letting districts avoid the vote altogether, rather than concerns
about the legitimacy of the votes or the effects of diversity in direct democracy. In
addition, there are also serious questions about the extent to which school board
elections may become more partisan affairs when they are held at the same time
as general elections. Even the Star-Ledger editorial staff acknowledged this
concern, noting that the move may cause the school board elections “to attract
the attention of the political parties…[and] force school board candidates to be
more sophisticated campaigners, to be noticed among all the other candidates for
state, local, and county office” (The Star-Ledger, January 9, 2012). Still, as of
February 26, 2012, more than 400 New Jersey school districts had already moved
their elections to November, representing “one of the most sweeping changes to
scholastic politics in recent history” (Goldberg 2012, 1).
I applaud the recent moves in New Jersey. However, it is only a first step
in reform. Rather than falling into the common trap in education policy to search
for “’one size fits all’ programs,” a social capital perspective would encourage
schools to look for solutions that seek to channel-up bottom-up discourse
(Warren 2005, 167). A successful reform strategy for diverse communities, then,
would enlist “an engaged community of stakeholders in and around schools” to
“develop a common vision…[that] conforms to values, interests, and
understanding of local conditions” (Warren 2005, 167). By encouraging more
participation among the racial groups, members in the community could gain a
sense of ownership of the schools and feel more personally invested in the
system’s success.

112
Following this model, I could envision a set-up in which school boards
are institutionally conditioned to seek more extensive public input during the
budget-sculpting process. Rather than holding just one or two public meetings
and sending out mailings, school boards could be required to actively solicit the
opinions and feedback of a wide variety of citizen and community groups, in the
mold of Mansbridge’s (1980) vision of a deliberative democracy. Transparency
requirements, which are not currently in place, could also help with
accountability, as citizens could see exactly where funds were going to be
allocated, and actively contest those allocations at public meetings.
Rules of the Game
When explaining some of the positive outcomes that can result from
diversity, Alesina and La Ferrara (2005) note that some “societies have
developed institutional features that allow them to better cope with the conflict
element intrinsic in diversity and moderate its negative effects” (763). According
to this strand of thinking, then, the so-called “rules of the game” become
incredibly important. The way that societies and localities sculpt their processes
to manage diversity can be fundamentally important to minimize inequality and
maximize positive effects. This view is crucial when we think about the issues
involved in budget referenda.
A final overarching weakness of referenda is the degree to which a “yes”
or “no” budget vote is unable to reflect the heterogeneity of opinions in the
diverse communities that they serve. This diversity of preferences and needs are
not well served by an up-or-down vote because the election “accepts, and makes

113
no attempt to change the foundations of selfish desire” (Mansbridge 1980, 18). It
assumes that “citizen’s interests are in constant conflict, need protection, and are
irresolvable without voting” (Feuerstein 2002, 3). The election of representatives,
as voices of the people and “trustees” of the public interest can perhaps better
represent the diversity of voices in a district.
One cannot discuss schools and democracy without acknowledging the
moral implications of education. We accept that inequality exists in America by
reconciling it with a vision of equality of opportunity. And yet, the results of this
paper show that this notion is very much at risk. Students attending schools in
homogenous and heterogeneous communities and provided with different
resources and opportunities simply as a matter of district borders and angry
voters.
Pecorella (2006) writes:
If children in some communities, however, begin the competitive race for success with disadvantages based not only in the uncontrollable lottery of life’s fortunes but in government policies that act to reaffirm the circumstances of these varied fortunes, that is with inequities of fate compounded by failures of public policy, then the very idea of equality of opportunity is called into question (261).
Unfortunately, school budget voting can accomplish just that, by allowing voters
to institutionalize preferences without regard to what is just and right.
Future research, then, should continue to search for ways to engage
heterogeneous communities in budgetary decision-making without abandoning
substantive concerns about equity in the process.

114

115
Bibliography Alesina, Alberto, Reza Baqir, and William Easterly. 1999. “Public Goods and
Ethnic Divisions.” Quarterly Journal of Economics 114(4): 1243-1284. Alesina, Alberto, Reza Baqir, and Caroline Hobby. 2004. “Political Jurisdictions
in Heterogeneous Communities.” Journal of Political Economy 112 (2): 348-396.
Alesina, Alberto and Elaina La Ferrara. 2000. “Participation in Heterogeneous
Communities.” Quarterly Journal of Economics 115 (3): 847-904. Alesina, Alberto and Elaina La Ferrara. 2005. “Ethnic Diversity and Economic
Performance.” Journal of Economic Literature 43 (3): 762-800. Allen, Ann and David Plank. 2005. “School Board Election Structure and
Democratic Representation.” Educational Policy 19 (3): 510. Applebome, Peter. 2009. “Rancor Where Private-School Parents Make Public-
School Decisions.” New York Times, April 25. <www.nytimes.com/2009/04/26/nyregion/26towns.html>
Arrow, Kenneth. 1972. “Gifts and Exchanges.” Philosophy and Public Affairs 1(4):
343-362. Atkinson, Matthew D. and Anthony Fowler. 2011. “The Effect of Social Capital
on Voter Turnout: Evidence from Saint's Day Fiestas in Mexico." Under review.
Balsdon, Ed, Eric J. Brunner, and Kim Rueben. 2003. “Private demands for
public capital: evidence from school bond referenda.” Journal of Urban Economics 54 (3): 610-638.
Banerjee, Abhijit, Lakshmi Iyer, and Rohni Somanathan. 2005. “History, Social
Divisions, and Public Goods in Rural India.” Journal of the European Economic Association 3 (2/3): 639-647.
Barr, Abigail. 2003. "Trust and Expected Trustworthiness: Experimental
Evidence from Zimbabwean Villages." Economic Journal 113 (489): 614-30.
Be’nabou, Roland. 1996. “Heterogeneity, Stratification, and Growth:
Macroeconomic Implications of Community Structure and School Finance.” The American Economic Review 86 (3): 584-609.
Benjamin, G., and R. Marcus. 1990. “Minority Non-voting in the New York
City Charter Referenda: Does the Voting Rights Act reach the referendum process, and should it?” Paper delivered at the annual

116
meeting of the American Political Science Association, San Francisco. Quoted in Button, James. 1993. “Racial Cleavage in Local Voting: The Case of School and Tax Issue Referendums.” Journal of Black Studies 24(1): 29-41.
Berger, Joseph. 1997. “Growing Pains for a Rural Hasidic Enclave.” New York
Times, Jan. 13. Berkman, Michael B. and Eric Plutzer. 2005.Ten Thousand Democracies: Politics
and Public Opinion in America's School Districts. Washington, DC: Georgetown University Press.
Berry, Christopher R. and William G. Howell. 2007. “Accountability and
Local Elections: Rethinking Retrospective Voting.” The Journal of Politics 69(3): 844-858.
Blalock, Hubert M. 1967. Toward a Theory of Minority-Group Relations. New York:
John Wiley and Sons. Blau, P.M. 1977. Inequality and Heterogeneity. New York: The Free Press. Bishop, Bill with Robert G. Cushing. 2008. The Big Sort: Why the Clustering of Like-
Minded America Is Tearing Us Apart. Boston: Houghton Mifflin. Booth, John A., and Patricia Bayer Richard. 1998. “Civil Society, Political
Capital, and Democratization in Central America.” Journal of Politics 60(3): 780-800.
Button, James. 1993. “Racial Cleavage in Local Voting: The Case of School and
Tax Issue Referendums.” Journal of Black Studies 24(1): 29-41. Campbell, David E. 2006. Why We Vote: How Schools and Communities Shape Our
Civic Life. Princeton and Oxford: Princeton University Press. Coleman, James S., and Hoffer, Thomas. 1987. Public and Private High Schools:
The Impact of Communities. New York: Basic Books, Inc. Collier, Paul. 2001. “Implications of Ethnic Diversity.” Economic Policy 16 (32):
127–166. Costa, Dora L.and Matthew Kahn. 2003 “Civic Engagement and Community
Heterogeneity: An Economist's Perspective.” Perspectives on Politics 1(1): 103-111.
Cutler, D.M., Elmendorf, D.W., Zeckhauser, R., 1993. “Demographic
characteristics and the public bundle.” Public Finance 48 (supplement): 178–198.

117
Cutler, David, Douglas W. Elmendorf, and Richard J. Zeckhauser. 1999. ‘‘Restraining the Leviathan: Property Tax Limitation in Massachusetts.’’ Journal of Public Economics 71 (3): 313–34.
Downs, Anthony. 1957. An Economic Theory of Democracy. New York: Harper
and Row. Duncombe, William, Mark Robbins, and Jeffrey Stonecash. 2003. “Measuring
Citizen Preferences for Public Services Using Surveys: Does a “Gray Peril” Threaten Funding for Public Education?” Public Budgeting & Finance 23(1): 47-72.
Edlin, Aaron, Andrew Gelman, and Noah Kaplan. 2007. “Voting as Rational
Choice: Why and How People Vote to Improve the Well-Being of Others.” Rationality and Society 19(3):293-314.
Ehrenberg, Ronald G., Randy A. Ehrenberg, Christopher L. Smith and Liang
Zhang. 2004. “Why do School District Budget Referenda Fail?” Educational Evaluation and Policy Analysis 26(2): 111-125.
Feld, Scott L. and Joel I Grossman. 1984. “Elections and decisions: Negotiations
by school district budget referendum.” Social Forces 63(2): 363-376. Fernandez, Raquel and Richard Rogerson. 1996. “Income Distribution,
Communities, and the Quality of Public Education.” The Quarterly Journal of Economics 111(1): 135-164.
Feuerstein, Abe. 2002. “Elections, Voting and Democracy in Local School
District Governance.” Educational Policy 16 (1): 15-36.
Fichter, Jack. 2007. “Cape May Point School District Won't Be Dissolved, Says Commissioner.” Cape May County Herald, Aug 2. < http://www.capemaycountyherald.com/article/7964-cape- may-point-school-district-wont-be-dissolved-says-commissioner>
Fleisher, Lisa. 2011. “School Vote Changes Weighed.” Wall Street Journal, Dec 8. <http://online.wsj.com/article/SB10001424052970203501304577084943113655640.html?KEYWORDS=jersey&utm_source=Sailthru&utm_medium=email&utm_term=Wake%20Up%20Call%20NJ&utm_campaign=Wake%20Up%20Call>
Fukuyama, Francis. 1995. Trust: The Social Virtues and the Creation of Prosperity. New York: Free Press.
Glaeser, Edward L., David I. Labison, Jose A. Scheinkman, Christine L. Soutter.
2000. “Measuring Trust.”Quarterly Journal of Economics 115(3): 811-846.

118
Goldberg, Dan. 2012. “Scores of NJ school districts moving elections from April to November.” The Record, Feb. 26. <http://www.nj.com/news/index.ssf/2012/02/scores_of_nj_school_districts.html>
Goldin, Claudia and Laurence Katz. 1999. “Human Capital and Social Capital:
The Rise of Secondary Schooling in America 1910 to 1940” Journal of Interdisciplinary History 29(4): 683-723.
Goldin, Claudia and Laurence Katz. 2009. "Why the U.S. Led in Education?
Lessons from Secondary School Expansion, 1910 to 1940."In Human Capital and Institutions Ed. D. Eltis, F. Lewis and K. Sokoloff, 143-78.Cambridge: Cambridge University Press.
Greer, Scott. 1962. Governing the Metropolis. New York: John Wiley. Hakim, Danny. 2011. “Deal Reached in Albany to Cap Property Taxes.” New
York Times, May 24. <http://www.nytimes.com/2011/05/25/nyregion/in-albany-agreement-is-reached-to-cap-property-tax-increases-at-2-percent.html?pagewanted=all>
Hamilton, Howard D. and Sylvan H. Cohen. 1974. Policy Making by Plebiscite:
School Referenda. New Britain, Conn: Lexington Books. Harris, Amy, William Evans, and Robert Schwab. 2001. “Education Spending in
an Aging America.” Journal of Public Economics. 81(3): 449-72. Heininger, Claire. 2010. “NJ Gov. Chris Christie says widespread school budget
defeats show voters want a change.” The Record, April 21. <http://www.northjersey.com/news/politics/042110_Governor_Chris_Christie_will_address_school_budget_results_at_noon.html>
Hero, Rodney E. 2003. “Social Capital and Racial Inequality in America.
Perspectives on Politics 1(1): 113-122. Hess, Frederick. 2008. “Money, Interest Groups, and School Board Elections.”
In The Future of School Board Governance: Relevancy and Revelation. Ed. Thomas L. Alsbury. Lanham, MD: Rowan & Littlefield.
Hopkins, Daniel J. 2009. “The Diversity Discount: When Increasing Ethnic and
Racial Diversity Prevents Tax Increases.” The Journal of Politics 71(1): 160-177.
Hoxby, Caroline M. 1996. “Are Efficiency and Equity in School Finance
Substitutes or Complements.” Journal of Economic Perspectives 10 (4): 51-72.

119
Hu, Winnie. 2010a. “Schools in New Jersey Plan Heavy Cuts After Voters Reject Most Budgets.” New York Times, April 21. <http://www.nytimes.com/2010/04/22/education/22schools.html?pagewanted=1>
Hu, Winnie. 2010b. “New York State Voters Approve 92% of School Budgets.”
New York Times, May 19. <http://www.nytimes.com/2010/05/20/ nyregion/20schools.html>
Hu, Winnie. 2011. “For New Jersey School Budget Votes, Tempers and Tax
Rises Ease.” New York Times, April 25 <http://www.nytimes.com/2011/04/26/education/26njbudget.html?ref=statebudget>
Jennings, Robert E. 1973. “The effects of tax resistance.” Phi Delta Kappa 54(8):
567-568. Kaufmann, Jason. 1999. “Three Views of Associationalism in 19th-Century
America: An Empirical Examination.” American Journal of Sociology 104(5): 1296-1345.
Key, V.O. 1949. Southern Politics in State and Nation. Knoxville: University of
Tennessee Press. Kinder, Donald and D. Roderick Kiewiet. 1981. Sociotropic Politics: The
American Case. British Journal of Political Science 11:129-161. Ladd, Helen and Sheila Murray. 2001. “Intergenerational Conflict Reconsidered:
County Demographic Structure and the Demand for Public Education.” Economics of Education Review 20(4): 343-357.
La Manque, Andrew. 1993. “An Historical Clarification of the New York State
Small City District Budget Voting Policy Debate.” U.S. Department of Education.
Lankford, Hamilton; James Wyckoff, Timothy J. Gronberg, and Dennis W.
Jansen. 2006. “The Effect of School Choice and Residential Location on the Racial Segregation of Students.” Advances in Applied Microeconomics 14: 185-239.
Letki, Natalia. 2008. “Does Diversity Erode Social Cohesion? Social Capital and
Race in British Neighbourhoods.” Political Studies 56 (1): 99-126. Letki, Natalia and Geoffrey Evans. 2005. “Endogenizing Social Trust:
Democratization in East- Central Europe.” British Journal of Political Science 35(3): 515-529.

120
Luttmer, Erzo F.P. 2001. “Group Loyalty and the Taste for Redistribution.” The Journal of Political Economy 109 (3): 500-528.
Lutz, Frank W. and Laurence Iannaconne. 1995. “The crucible of democracy:
The local arena.” In The Study of Educational Politics, ed. J.D. Scribner and D.H London, 39-52. Washington DC: Falmer.
Lutz, Frank W. and Laurence Iannaconne. 2008. “The Dissatisfaction Theory of
American Democracy.” In The Future of School Board Governance: Relevance and Revelation ed. Thomas L. Asbury. Rown and Littlefield.
Mansbridge, Jane. 1980. Beyond Adversary Democracy. New York: Basic Books. Marshall, Melissa and Dietlind Stolle. 2004. “Race and the City. Neighborhood
Context and the Development of Generalized Trust.” Political Behavior 26(2): 125-54.
McDermott, Kathryn A. 1999. Controlling Public Education: Localism versus Equity.
Lawrence: University of Kansas Press. McDonald, Michael P. and Samuel Popkin. 2001. “The Myth of the Vanishing
Voter.” American Political Science Review 95(4): 963-974. McMahon, E.J. 2010. “Reading NY’s School Budget Votes.” New York Post, May
20.<http://www.nypost.com/p/news/opinion/opedcolumnists/reading_ny_school_budget_votes_AIYbKdU2t8BPhkBpUsIt6N>
Michaelson, J.B. 1981. “Decision-Making in the Public Schools: A Public Choice
Approach.” In Organizational Behavior in Schools and School Districts ed. Samuel B. Bacharach. Praeger.
Miguel, Edward and Mary Kay Gugerty. 2005. “Ethnic diversity, social
sanctions, and public goods in Kenya.” Journal of Public Economics 89 (11-12): 2325-2368
Moe, Terry. 2005. “Teachers Unions and School Board Elections.” In Beseiged:
School Boards and the Future of Education Politics. Ed. William G. Howell. Washington, D.C.: Brookings Institution.
Morone, James A. 1998. The Democratic Wish: Popular Participation and the Limits
of American Government. New Haven, Conn: Yale University Press. Murray, Sheila, William Evans, and Robert Schwab. 1998. “Education Finance
Reform and the Distribution of Education Resources.” American Economic Review 88, (4): 789-812.
Myers, Dowell. 2007. Immigrants and Boomers: Forging a New Social Contract for the
Future. New York: Russell Sage Foundation.

121
Nicosia, Mareesa. 2012. “East Ramapo schools chief proposes $202M budget;
layoffs, program cuts likely.” The Journal News, Feb 16. http://www.lohud.com/article/20120216/NEWS03/302150107/East-Ramapo-schools-chief-proposes-202M-budget-layoffs-program-cuts-likely
Neckerman, Kathryn M. 2007. Schools Betrayed: Roots of Failure in Inner-City
Education. Chicago: University of Chiago Press. Niskanen, William A. Jr. 1971. Bureaucracy and Representative Government.
Atherton: Aldine. O’Reilly, C., Williams, R. K. & Barsage, S. 1997. ‘Group Demography and
Innovation: Does Diversity Help?’, in Mannix, E. & Neale, M., eds, Research in the Management of Groups and Teams, vol. 1. Greenwich, CT: JAI Press.
O’Rourke, James. 2010. “East Ramapo Ready for Final vote on $196M Budget
or Austerity.” The Journal News, June 12. Olson, Mancur. 1965. The Logic of Collective Action. Cambridge: Harvard
University Press. Orfield, Gary, Sara Schley, Diane Glass, and Sean Reardon. 1994. “The Growth
of Segregation in American Schools: Changing Patterns of Separation and Poverty Since 1968.” Equity and Excellence in Education 27(1): 5-8.
Page, Scott. 2007. The Difference: How the Power of Diversity Creates Better Groups,
Firms, Schools and Societies. Princeton, NJ: Princeton University Press. Pecorella, Robert F. 2006. “The Politics of State Education Aid: Is Demography
Destiny?” In Governing New York State. Ed. Robert F. Pecorella and Jeffrey M. Stonecash. Albany, NY: State University of New York Press.
Philliber, William W. 1977. “Why Not?: An Analysis of Support for School
Taxation.” Urban Education 12 (2): 189-202. Poterba, James M. 1997. “"Demographic Structure and the Political Economy of
Public Education." Journal of Public Policy and Management 16: 48-66 Poterba, James M. 1998.“Demographic Change, Intergenerational Linkages, and
Public Education.” Journal of Policy Analysis and Management 16 (1): 48-66. Putnam, Robert. 2000. Bowling Alone: the Collapse and Revival of American
Community. New York: Simon and Schuster.

122
Putnam, Robert. 2007. “E Pluribus Unum: Diversity and Community in the Twenty-first Century. The 2006 Johan Skytte Prize Lecture.” Scandinavian Political Studies 30 (2): 134-174.
Putnam, Robert. 2009. “Diversity, Social Capital, and Immigrant Integration:
Introductory Remarks.” National Civic Review 98(1): 3-5. Putnam, Robert, with Robert Leonardi, and Raffaella Nannetti. 1993. Making
Democracy Work: Civic Traditions in Modern Italy. Princeton, NJ: Princeton University Press.
Reddy, Sumathi. 2011. “Orthodox Candidates Win School Vote.” Wall Street
Journal, May 19. Roberts, Sam. 2010. “Racial Patterns Are Found in Recent School Budget
Elections.” The New York Times, Aug. 24. <http://www.nytimes.com/2010/08/25/nyregion/25districts.html>
Rockoff, Jonah. 2010. “Local response to fiscal incentives in heterogeneous
communities.” Journal of Urban Economics 68(2): 138-147. Romer, Thomas, Howard Rosenthal, and Vincent Munley. 1992. “Economic
Incentives and Political Institutions: Spending and Voting in School Budget Referenda.“ Journal of Public Economics 49 (1): 1-33.
Rothstein, Paul. 1994. “Learning the Preferences of Governments and Voters
from Proposed Spending and Aggregate Votes.” Journal of Public Economics 54 (3): 361-389.
Rundquist, Jeanette. 2011. “Christie’s budget cuts left N.J. schools unable to
provide ‘thorough and efficient’ education, Judge rules.” The Star-Ledger, March 22. <http://www.nj.com/news/index.ssf/2011/03/christies_school_aid_cuts_left.html>
Rundquist, Jeanette. 2012. “Gov. Christie signs bill changing school board
elections, budget votes.” The Star-Ledger, Jan. 17. <http://www.nj.com/news/index.ssf/2012/01/gov_christie_signs_bill_changi.html>
Rupasingha, Anil, Stephan Goetz, and David Freshwater. 2006. “The
Production of Social Capital in US Counties.” Journal of Socio-Economics 35(1): 83-101l
Rushton, Michael. 2008. “A Note on the Use and Misuse of the Racial Diversity
Index.” Policy Studies Journal 36(3): 445-459.

123
Sampson, Robert J., Doug McAdam, Heather MacIndoe, and Simón Weffer-Elizondo. 2005. “The Durable Nature and Community Structure of Collective Civic Action.” American Journal of Sociology 111(3): 673-714.
Sears, David O. and Jack Citrin. 1982. Tax revolt: Something for Nothing in
California. Cambridge, Mass: Harvard University Press. Simonsen William and Mark D. Robbins. 2000. Citizen Participation in Resource
Allocation. Boulder, Co: Westview Press. Singer, Allen. 1999. “American Apartheid: Race and the Politics of School
Finance on Long Island, NY.” Equity & Excellence in Education 32ß(3): 25-36.
Small, Mario Luis. 2002. "Culture, Cohorts, and Social Organization Theory:
Understanding Local Participation in a Latino Housing Project." American Journal of Sociology. 108(1): 1-54.
Sobel, Joel. 2002. “Can we trust social capital?” Journal of Economic Literature
40(1): 139-154. Stolle, Dietlind, Stuart Soroka, and Richard Johnston. 2008. “When Does
Diversity Erode Trust? Neighborhood Diversity, Interpersonal Trust and the Mediating Effect of Social Interactions.” Political Studies 56 (1): 57–75.
Tiebout, Charles M. 1956. A Pure Theory of Local Expenditures. Journal of
Political Economy 64 (5): 416-24. Tedin, Kent L., Richard E. Matland, and Gregory R. Weiher. 2001. Age, Race,
Self-Interest and Financing Public Schools through Referenda. Journal of Politics 63(1): 270-94.
Tractenberg, Paul L. 2008. “Beyond Educational Adequacy: Looking Backward
and Forward through the Lens of New Jersey.” Stanford Journal of Civil Rights and Civil Liberties 4(2): 411-446.
Tyack, David B. and Larry Cuban. 1995. Tinkering toward Utopia: A Century of
Public School Reform. Cambridge, Mass.: Harvard University Press. Vanderleeuw, James M., and Richard L. Engstrom. 1987. “Race, referendums,
and roll-off.” Journal of Politics 49(4): 1081-1092. Verba, Sidney, Kay Schlozman, and Henry Brady. 1995. Voice and Equality: Civic
Voluntarism in American Politics. Cambridge MA: Harvard University Press.
Warren, Mark R. 2005. “Communities and Schools: A New View of Urban
Education Reform.” Harvard Educational Review 75 (2): 133-173.

124
Wirt, Frederick M. and Michael W. Kirst. 2009. The Political Dynamics of
American Education (4th ed.). Richmond, CA: McCutchan Publishing Corporation.
Wilson, William Julius. 1987. The Truly Disadvantaged: The Inner City, the
Underclass, and Public Policy. Illinois: University of Chicago Press. Wilson, William Julius. 1996. When Work Disappears: The World of the New Urban
Poor. New York: Knopf. “Willie Trotman SV NAACP at East Ramapo Community Forum.” Video clip.
Accessed September 8, 2011. YouTube. <http://www.youtube.com/watch?v=PNumxbBXo70>
Information on Public Schools and School Districts in the United States, National
Center for Education Statistics, Retrieved August 2011 from http://www.nces.ed.gov/ccd/.
NJ School Election Results. New Jersey Department of Education. Retrieved
August 2011 from http://www.nj.gov/education/data/vote. School Budget Votes. New York State School Boards Association. Retrieved
September 2011 from http://www.nyssba.org/index.php?submenu=budget_votes&src=gendos&ref=SchoolBudgetVote&category=news_media
Statewide School District Budget Voting Results. New York State Education
Department. Retrieved July 2011 from http://www.p12.nysed.gov/mgtserv/votingresults/
Voter Information Center. New Jersey School Boards Association. Retrieved
October 2011 from http://www.njsba.org/elections/index.html

125
APPENDIX TABLE 13. The table below summarizes Budget election results (percentage of budgets approved by voters statewide) in New York from 1969 to 2011

126

127
TABLE 14. The table below summarizes voter turnout in school elections in New Jersey from 1984 to 2010.
Registered Voters – 5,193,965 as of March 2011 (Source: N.J. Division of Elections)
TABLE 15. The table below summarizes Budget election results (percentage of budgets approved by voters statewide) in New Jersey from 1976 to 2010. 2011- 79.7% 2010 – 41.4% 2009 – 73.3% 2008 – 73.5% 2007 – 78.3% 2006 – 53.4% 2005 – 70.7% 2004 – 69.8% 2003 – 62.2% 2002 – 65.4% 2001 – 81.3% 2000 – 88.0% 1999 – 82.8%
1998 – 74.4% 1997 – 76.2% 1996 – 67.8% 1995 – 72.3% 1994 – 51.4% 1993 – 68.9% 1992 – 73.4% 1991 – 55.9% 1990 – 52.0% 1989 – 62.1% 1988 – 71.3% 1987 – 74.1%
1986 – 82.4% 1985 – 86.5% 1984 – 76.9% 1983 – 74.8% 1982 – 67.9% 1981 – 63.8% 1980 – 70.1% 1979 – 76.9% 1978 – 82.4% 1977 – 80.4% 1976 – 44.4%
2010 – 26.7% 2009 – 13.4% 2008 – 14.3% 2007 – 13.9% 2006 – 15.7% 2005 – 13.2% 2004 – 15.8% 2003 – 15.2% 2002 – 14.2%
2001 – 13.3% 2000 – 12.5% 1999 – 13.4% 1998 – 14.2% 1997 – 17.3% 1996 – 18.0% 1995 – 15.5% 1994 – 15.3% 1993 – 12.8%
1992 – 16.8% 1991 – 18.6% 1990 – 15.8% 1989 – 14.7% 1988 – 15.2% 1987 – 10.1% 1986 – 11.5% 1985 – 7.34% 1984 – 10.1%

128
TABLE 16. The table below summarizes key statistics and independent variables for the 669 districts in the dataset for this period in New York from 2002 to 2011, including a variety of indicators of race and economic wealth. ____________________________________________________________________ Variable Mean SD Min. Max. Population 15,783 15,869.9 236 117,965 % White .8958 .1209 .1288 .9923 % Black .0407 .0742 0 .6481 % AmIndian .0048 .0211 0 .4687 % Asian .0220 .0347 0 .3576 % Hawaiian .0003 .0004 0 .0038 % Other .0190 .0330 0 .2529 % Mixed race .0173 .0094 0 .0674 % Non-white .1042 .1209 .0077 .8712 Blau Index .1716 .1515 .0153 .7147 % White students .8464 .1977 .0014 1 % Black students .0540 .0990 0 .7718 % Hispanic students .0656 .1062 0 .7372 % Asian students .0280 .0450 0 .5014 % Non-white students .1536 .1977 0 .9986 Total Students, district 2,363 2,366 18 16,517 VotingAgePop 11,540 11,800 213 89,020 % Over 65 .1896 .0462 .0378 .4669 % No HS diploma .1773 .0672 .0200 .5660 % Hs Or Less .5941 .1565 .0953 .9647 % College .2978 .1622 .0304 .8773 Med. Fam Income 57,597 23,398 15,372 200,001 Median Home Value 136,594 111,104 39,200 980,300 % Below Pov Level .0908 .0537 .0118 .6218 % Above 100K .1744 .1540 0 .8253 % Federal Rev .0401 .0283 0 .3758 % State Rev .4771 .1992 .0109 .8394 % Local Rev .4828 .2147 .0680 .9864

129
TABLE 17. The table below summarizes key statistics and independent variables for the 669 districts in the dataset for this period in New Jersey from 2003 to 2011, including a variety of indicators of race and economic wealth. __________________________________________________________________ Variable Mean SD Min. Max. Population 17,335 20,199 538 191,692 % White .8149 .1574 .0421 .9912 % Black .0700 .1090 0 .8883 % AmIndian .0024 .0035 0 .0510 % Asian .0585 .0737 .0012 .5784 % Hawaiian .0003 .0004 0 .0038 % Other .0325 .0443 0 .33367 % Mixed race .0214 .0105 .0021 .0605 % Non-white .1851 .1574 .0421 .9912 Blau Index .2821 .1740 .0174 .7430 % White students .7101 .2399 .0006 .9867 % Black students .0888 .1346 0 .9435 % Hispanic students .1272 .1543 0 .8965 % Asian students .0666 .0837 0 .5345 % Non-white students .2899 .2399 .0133 .9994 Total Students, district 2,177 2,628 38 21,743 VotingAgePop 5,124 6012 180 54,230 % Over 65 .1412 .0568 .0152 .5445 % No HS diploma .1721 .0978 .0070 .5223 % Hs Or Less .5421 .1822 .0796 .9165 % College .3825 .1837 .0519 .8745 Med. Fam Income 74,307 23,775 26,370 175,000 Median Home Value 202,555 114,323 55,800 1,000,001 % Below Pov Level .0550 .0406 .0065 .3013 % Above 100K .2909 .1647 .0296 .7248 % Federal Rev .0425 .0663 .0070 .5840 % State Rev .3171 .1849 .0920 .8740 % Local Rev .6630 .1885 .0595 .8959

130
TABLE 18. The tables below summarize the key statistics for the dependent variables for the 669 districts in the dataset for this period in New York from 2002 to 2011 and New Jersey from 2003 to 2011. __________________________________________________________________ Variable (NY) Mean SD Min. Max. % Support ’03-’11 .6370 .0711 .4492 .9547 % Support ’03-’08 .6297 .0790 .4109 .9877 % Support ’09-’11 .6517 .0791 .3274 .9699 Passage Rate ’02-’11 .9175 .1092 .4 1 Passage Rate ’02-’08 .9073 .1283 .2857 1 Passage Rate ’09-’11 .9412 .1450 0 1 % Turnout ’03-’11 .1267 .0526 .0265 .3610 % Turnout ’03-’08 .1274 .0539 .0304 .4105 % Turnout ’09-’11 .1253 .0579 .0162 .4473 __________________________________________________________________ Variable (NJ)) Mean SD Min. Max. % Support ’03-‘11 .5410 .0682 .1220 .8540 % Support ’03-’08 .5409 .0752 .1069 .8810 % Support ’09-’11 .5412 .0736 .1522 .7999 % Passage ’03-‘11 .6715 .2538 0 1 % Passage ’03-‘’08 .6822 .2822 0 1 % Passage ’08-’11 .6503 .3085 0 1 % Turnout ’03-‘11 .1368 .0580 .0100 .3643 % Turnout ’03-‘08 .1258 .0550 .0088 .4289 % Turnout ’09-’11 .1587 .0719 .0125 .5450

131
The tables below describe some of the additional coefficients for Pre-Crisis, Post-Crisis Data. More OLS results are available upon request. -------------------------------------------- Average % Support NJ Post-Crisis -------------------------------------------- Blau -0.056 (0.041) percent_college 0.278 (0.202) percent_hs_or_less 0.088 (0.195) percent_popover65 0.054 (0.068) local_revpct -0.036 (0.028) med_fam_income -0.000 (0.000) pct_nonwhite 0.058 (0.046) _cons 0.446 (0.174)* R2 0.08 N 505 --------------------------------------------
p<0.05; ** p<0.01
-------------------------------------------- Average % Support NY Post-Crisis -------------------------------------------- Blau -0.077 (1.19) percent_college 0.314 (2.45)* percent_hs_or_less 0.268 (2.30)* percent_popover65 0.102 (1.18) local_rev_pct -0.000 (0.50) med_fam_income -0.000 (1.64) pct_nonwhite -0.074 (0.94) _cons 0.437 (4.39)** R2 0.07 N 669 -------------------------------------------- * p<0.05; ** p<0.01

132
------------------------------------------------ Average Turnout New Jersey 2003-2008 ------------------------------------------------- Blau Index -0.128 (0.023)** % College -0.251 (0.114)* % HS or Less -0.288 (0.110)** % Over 65 0.050 (0.037) % Local Revenue 0.000 (0.000) Med. Fam Income 0.000 (0.000)** % Non-white -0.015 (0.026) Constant 0.356 (0.098)** Rsquared 0.47 N 505 ------------------------------------------------ * p<0.05; ** p<0.01 ‐‐‐‐‐‐‐‐‐‐‐‐‐‐‐‐‐‐‐‐‐‐‐‐‐‐‐‐‐‐‐‐‐‐‐‐‐‐‐‐‐‐‐‐‐Pass%Pre‐Crisis,NewJersey‐ ‐‐‐‐‐‐‐‐‐‐‐‐‐‐‐‐‐‐‐‐‐‐‐‐‐‐‐‐‐‐‐‐‐‐‐‐‐‐‐‐‐‐‐‐ nonwhitediff‐0.210 (1.75) percent_college2.164 (2.87)** percent_hs_or_less 1.172 (1.61) percent_popover65 0.302 (1.21) local_revpct ‐0.311 (3.03)** med_fam_income ‐0.000 (2.21)* pct_nonwhite‐0.047 (0.51) _cons ‐0.378 (0.58) R2 0.14 N 505 ‐‐‐‐‐‐‐‐‐‐‐‐‐‐‐‐‐‐‐‐‐‐‐‐‐‐‐‐‐‐‐‐‐‐‐‐‐‐‐‐‐‐‐‐‐*p<0.05;**p<0.01

133
------------------------------------------------ Average Turnout New Jersey 2008-2011 ------------------------------------------------ Blau Index -0.125 (0.030)** % College -0.418 (0.147)** % HS or Less -0.474 (0.142)** % Over 65 -0.008 (0.047) % Local Revenue 0.000 (0.000) Med. Fam Income 0.000 (0.000)** % Non-white -0.044 (0.034) Constant 0.538 (0.127)** Rsquared 0.49 N 505 ------------------------------------------------ Average % Support Pre-Crisis New York ------------------------------------------- Blau -0.129 (2.12)* percent_college 0.477 (3.95)** percent_hs_or_less 0.362 (3.30)** percent_popover65 0.307 (3.78)** local_rev_pct -0.001 (2.29)* med_fam_income -0.000 (4.34)** pct_nonwhite -0.016 (0.22) _cons 0.342 (3.64)** R2 0.18 N 669 ------------------------------------------- * p<0.05; ** p<0.01 *p<0.05;**p<0.01

134

135
Figure 11.
Source: New York School Boards Association

136
Figure 12
Proposed 2011-2012 Budget
Dr. Joel M. Klein,
Interim Superintendent
Board of Education
Aron Wieder, Vice President
Moses Friedman Moshe Hopstein
Morris Kohn Stephen Price
Eliyahu Solomon JoAnne Thompson
Suzanne Young-Mercer
Fast Facts
!" Budget Vote -
May 17, 2011 7:00 a.m. - 10:00 p.m.
!" Proposed Budget: $200,520,617
!" 2.31% Budget to Budget increase
East Ramapo Central School District
Phone: 845-577-6000 Website:
http://www.eram.k12.ny.us
East Ramapo Central School District
105 South Madison Avenue Spring Valley, NY 10977
EDUCATION EQUALITY EXCELLENCE The Board of Education will present a proposed budget to the public for a vote on
May 17, 2011. The development of East Ramapo Central School District’s annual spending plan is a year-long process. Throughout the year, financial information is reviewed to address questions regarding how best to meet the needs of both our students and the community. This flyer is a brief outline of items maintained and cut from the current school year’s budget. For more detailed information visit the District website.
Factors driving the budget and tax increase: !" Enrollment - projected to rise a minimum of 123 students !" Federal Aid Cuts - ARRA funds expiring !" Extension of unemployment benefits, and staffing cuts resulting in additional
unemployment benefits payments !" State Aid Cuts - approximately 10.5 million dollars !" Increase in Employer Retirement costs !" Increase in Health Insurance costs !" Unfunded Mandates , including costs of required State testing !" Contractual raises in staff salary rates !" Tax Certioraris and Small Claims Assessment Reviews
What’s still within this Budget: What’s cut from this Budget: !" Kindergarten - the same number of
Full-Day and Half-Day classes as in the current school year.
!" Teaching Assistants for Kindergarten classes
!" Field Trips, including transportation !" Music and Arts programs,
including elementary instrumental music
!" Full Athletic program !" Full Extra-curricular activities program !" 8 Elementary Assistant Principals !" Full complement of Honors and
AP Classes !" Elective courses at High Schools
(except Business Courses) !" Universal Transportation -
all students bused !" Elementary Summer Reading and
Math programs (Supported through Title Funds)
!" Much more - Total budget - $200,520,617 check the website for details.
!" 1 Assistant Superintendent !" 1 Elementary Assistant Principal !" 1 VISION Coordinator !" 1 Assistant Director of Buildings and
Grounds !" 22.4 Elementary Teachers !" 1.4 Instructional Supervisors !" 5 ETC (gifted program) Teachers !" 5.6 Deans at the secondary schools !" 2.5 Business Teachers -
Business Department eliminated !" 10 Special Education
Teaching Assistants !" 9 Custodians !" 6 Maintenance Mechanics !" 1 Systems Analyst !" 9.7 Central Office Secretaries !" 4 Secondary School Secretaries !" 7 days of non-mandated busing for
non-public school students !" Mobile Library
For detailed budget information visit the District website http: //www.eram.k12.ny.us Click on the “Budget 2011/2012 Information” link on the front page.
Source: East Ramapo Central School District

137
Figure 13.
Source: Clarkstown Central School District

138
Source: NYSED