Race and Hispanic Origin of Victims and Offenders, 2012-15 · the same race or Hispanic origin,...
21
U.S. Department of Justice Office of Justice Programs Bureau of Justice Statistics Special Report OCTOBER 2017 NCJ 250747 D uring the 4-year aggregated period from 2012 to 2015, half (51%) of violent victimizations were intraracial—that is both victims and offenders were the same race or both were of Hispanic origin (figure 1). 1 During 2012-15, the percentage of intraracial victimization was higher than the percentage of interracial victimization for all types of violent crime except robbery. ere was no statistically significant difference between the percentages of intraracial and interracial robbery victimization during this period. is report uses data from the Bureau of Justice Statistics’ (BJS) National Crime Victimization Survey (NCVS) to examine the race and Hispanic origin of victims age 12 or older and offenders of violent victimizations. Violent victimization includes rape or sexual assault, robbery, aggravated assault, and simple assault. Intraracial victimizations include victims and offenders who were both or all white; black; American Indian or Alaska Native; Asian, Native Hawaiian, or Other Pacific Islander; or of Hispanic origin. 2 Interracial victimizations include victims and offenders who were not the same race or Hispanic origin, victims of two or more races, single offenders of two or more races, and multiple offenders of various races (mixed race offender group). HIGHLIGHTS During 2012-15, half (51%) of violent victimizations were intraracial, that is both victims and offenders were the same race or both were of Hispanic origin. In the majority of violent victimizations, white victims’ offenders were white (57%) and black victims’ offenders were black (63%). The rates of total violent crime, serious violent crime, and simple assault were higher for intraracial victimizations than for interracial victimizations. From 1994 to 2015, white-on-white violence (down 79%) and black-on-black violence (down 78%) declined at a similar rate. During 2012-15, there were no differences among white, black, and Hispanic intraracial victimizations reported to police. Race and Hispanic Origin of Victims and Offenders, 2012-15 Rachel E. Morgan, Ph.D., BJS Statistician FIGURE 1 Percent of intraracial and interracial victims and offenders of violent victimizations, by type of crime, 2012–2015 *Comparison group. †Significant difference from the comparison group at the 95% confidence level. a Includes victims and single offenders of two or more races, multiple offenders of various races (mixed race group), and victims and offenders who were neither the same race nor were both of Hispanic origin. See appendix table 1 for estimates and standard errors. b Both victims and offenders were the same race or both were of Hispanic origin. Source: Bureau of Justice Statistics, National Crime Victimization Survey, 2012–2015. 0 10 20 30 40 50 60 All violent victimization Rape or sexual assault Robbery Aggravated assault Simple assault Type of crime Unknown race or unknown number of offenders Interracial victim and offender a Intraracial victim and offender b * Percent † † † † † † † † † 1 Unless otherwise noted, comparisons in this report are significant at the 95% confidence level. 2 For single-offender violent victimizations, intraracial victimizations include both victims and offenders who were the same race or were both of Hispanic origin. For multiple-offender violent victimizations, intraracial victimizations include victims and offenders who were all the same race or were all of Hispanic origin.
Transcript of Race and Hispanic Origin of Victims and Offenders, 2012-15 · the same race or Hispanic origin,...

U.S. Department of Justice Office of Justice Programs Bureau of Justice Statistics
Special ReportOCTOBER 2017 NCJ 250747
During the 4-year aggregated period from 2012 to 2015, half (51%) of violent victimizations were intraracial—that is both victims and offenders were
the same race or both were of Hispanic origin (figure 1).1 During 2012-15, the percentage of intraracial victimization was higher than the percentage of interracial victimization for all types of violent crime except robbery. There was no statistically significant difference between the percentages of intraracial and interracial robbery victimization during this period.
This report uses data from the Bureau of Justice Statistics’ (BJS) National Crime Victimization Survey (NCVS) to examine the race and Hispanic origin of victims age 12 or older and offenders of violent victimizations. Violent victimization includes rape or sexual assault, robbery, aggravated assault, and simple assault. Intraracial victimizations include victims and offenders who were both or all white; black; American Indian or Alaska Native; Asian, Native Hawaiian, or Other Pacific Islander; or of Hispanic origin.2 Interracial victimizations include victims and offenders who were not the same race or Hispanic origin, victims of two or more races, single offenders of two or more races, and multiple offenders of various races (mixed race offender group).
HIGHLIGHTS � During 2012-15, half (51%) of violent victimizations were intraracial, that is both victims and offenders were the same race or both were of Hispanic origin.
� In the majority of violent victimizations, white victims’ offenders were white (57%) and black victims’ offenders were black (63%).
� The rates of total violent crime, serious violent crime, and simple assault were higher for intraracial victimizations than for interracial victimizations.
� From 1994 to 2015, white-on-white violence (down 79%)and black-on-black violence (down 78%) declined at a similar rate.
� During 2012-15, there were no differences among white, black, and Hispanic intraracial victimizations reported to police.
Race and Hispanic Origin of Victims and Offenders, 2012-15
Rachel E. Morgan, Ph.D., BJS Statistician
Figure 1Percent of intraracial and interracial victims and offenders of violent victimizations, by type of crime, 2012–2015
*Comparison group.†Significant difference from the comparison group at the 95% confidence level.aIncludes victims and single offenders of two or more races, multiple offenders of various races (mixed race group), and victims and offenders who were neither the same race nor were both of Hispanic origin. See appendix table 1 for estimates and standard errors.bBoth victims and offenders were the same race or both were of Hispanic origin.Source: Bureau of Justice Statistics, National Crime Victimization Survey, 2012–2015.
0 10 20 30 40 50 60
All violent victimization
Rape or sexual assault
Robbery
Aggravated assault
Simple assault
Type of crime
Unknown race or unknown number of o�enders
Interracial victim and o�endera
Intraracial victim and o�enderb*
Percent
††
††
†
††
††
1Unless otherwise noted, comparisons in this report are significant at the 95% confidence level. 2For single-offender violent victimizations, intraracial victimizations include both victims and offenders who were the same race or were both of Hispanic origin. For multiple-offender violent victimizations, intraracial victimizations include victims and offenders who were all the same race or were all of Hispanic origin.

2RACE AND HISPANIC ORIGIN OF VICTIMS AND OFFENDERS, 2012-15 | OCTOBER 2017
The NCVS collects data from victims on their experiences with crime, and offender demographic characteristics are based on the victim's perceptions. (For more information, see Overview of National Crime Victimization Survey data collection on violent offenders text box on page 3 and Methodology.) This report presents aggregate estimates for the 4-year period from 2012 through 2015.
Unless noted, 1993 through 2015 trend estimates were based on 2-year rolling averages centered on the most recent year. For example, estimates reported for 1994 represent the average estimates for 1993 and 1994. By rolling averages and aggregating years, estimates and comparisons of detailed victimization characteristics become more reliable and stable. Data from 2012 to 2015 were aggregated in this report because of a change in the offender race and Hispanic origin categories that occurred in 2012. (See Summary of changes to collecting offender race and Hispanic origin in the National Crime Victimization Survey text box on page 6 for more information.)
In the majority of violent victimizations, white victims’ offenders were white and black victims’ offenders were black
During 2012-15, U.S. residents experienced 5.8 million violent victimizations per year (table 1). About 3.7 million of these violent victimizations were committed against white victims.3 Among white victims, a higher percentage of victimizations were committed by white offenders (57%) than offenders of any other race. White victims perceived the offender to be black in 15% of violent victimizations and Hispanic in 11%.4
Of the 850,720 victimizations committed against black victims, a higher percentage involved black offenders (63%) than offenders of any other race. Black victims perceived the offender to be white in 11% of violent victimizations and Hispanic in nearly 7%.
Fewer than half (40%) of violent victimizations committed against a Hispanic victim were committed by a Hispanic offender. However, the percentage committed by a Hispanic offender was higher than any racial category. An equal percentage of victimizations committed against a Hispanic victim was committed by a white or black offender (20% each).
Table 1Percent of violent victimizations, by race/Hispanic origin of victim and offender, 2012–2015
Race/Hispanic origin of offenderRace/Hispanic origin of victim
Average annual number Total White Black Hispanic Othera
Single offenders of two or more races
Multiple offenders of various racesb
Unknown race or number of offenders
Total violent victimizationsc 5,833,800 100% 43.8% 22.7% 14.4% 2.2% 6.0% 2.8% 8.0%White 3,679,410 100% 56.6* 14.7 † 11.0 † 1.7 † 6.1 † 2.1 † 7.9 †Black 850,720 100% 10.9 † 63.2* 6.6 † 0.5 ! † 7.4 † 4.0 † 7.4 †Hispanic 846,520 100% 20.0 † 20.5 † 40.3* 2.5 † 5.7 † 3.3 † 7.8 †Otherd 198,320 100% 29.6 † 18.9 9.7 ‡ 17.5* 3.6 ! † 6.1 ! † 14.5Persons of two or more races 258,830 100% 60.2* 13.8 † 7.2 † 2.3 ! † 3.9 † 5.5 † 7.1 †Note: Comparison groups are intraracial percentages (white-on-white, black-on-black, Hispanic-on-Hispanic, or other race-on-other race). White, black, and other race categories exclude persons of Hispanic or Latino origin. See appendix table 2 for standard errors.*Comparison group.†Significant difference from comparison group at the 95% confidence level.‡Significant difference from comparison group at the 90% confidence level.! Interpret with caution. Estimate based on 10 or fewer sample cases, or coefficient of variation is greater than 50%. aIncludes offenders perceived to be American Indian or Alaska Native or Asian, Native Hawaiian, or Other Pacific Islander.bMixed race group.cIncludes rape or sexual assault, robbery, aggravated assault, and simple assault. dIncludes victims who were American Indian or Alaska Native, or Asian, Native Hawaiian, or Other Pacific Islander.Source: Bureau of Justice Statistics, National Crime Victimization Survey, 2012–2015.
3White, black, and other race categories exclude persons of Hispanic or Latino origin.4Unless otherwise noted, offender refers to a single offender or a group of offenders who were the same race or were all of Hispanic origin.

3RACE AND HISPANIC ORIGIN OF VICTIMS AND OFFENDERS, 2012-15 | OCTOBER 2017
Table 2 Race/Hispanic origin of violent victimization offenders, by type of victimization, 2012–2015
Total victimizations Single offender victimizations Multiple offenders victimizationsRace/Hispanic origin of violent offender
Average annual number Percent
Average annual number Percent
Average annual number Percent
Total violent victimizations* 5,833,800 100% 4,490,640 100% 1,150,090 100%White 2,557,910 43.8% 2,208,850 49.2% 349,060 30.4%Black 1,324,270 22.7% 1,039,920 23.2% 284,340 24.7%Hispanic 841,500 14.4% 563,060 12.5% 278,450 24.2%Other 127,070 2.2% 120,730 2.7% 6,340 ! 0.6%
American Indian or Alaska Native 23,590 0.4 20,750 0.5 2,830 ! 0.2 !Asian 73,380 1.3 71,020 1.6 2,360 ! 0.2 !Native Hawaiian or Other Pacific Islander 30,110 0.5 28,960 0.6 1,150 ! 0.1 !
Two or more races (single offenders) 352,370 6.0% 352,370 7.8% ~ ~Multiple offenders of various races (mixed race group) 164,190 2.8% ~ ~ 164,190 14.3%Unknown offender race 273,410 4.7% 205,710 4.6% 67,710 5.9%Unknown number of offenders 193,080 3.3% ~ ~ ~ ~Note: Detail may not sum to total due to rounding and missing data. White, black, and other race categories exclude offenders of Hispanic or Latino origin. See appendix table 3 for standard errors.~Not applicable.! Interpret data with caution. Estimate based on 10 or fewer sample cases, or coefficient of variation is greater than 50%. *Includes rape or sexual assault, robbery, aggravated assault, and simple assault. Source: Bureau of Justice Statistics, National Crime Victimization Survey, 2012–2015.
Overview of National Crime Victimization Survey data collection on violent offendersThe National Crime Victimization Survey (NCVS) collects information from victims on their offenders in the Crime Incident Report (CIR). Offender demographic characteristics are based on the victim’s perceptions. The section on offenders begins with a question about the number of offenders. For violent victimizations involving a single offender, respondents are asked questions about the offender’s relationship with the victim, offender demographic characteristics (including sex, race, Hispanic origin, and age), membership in a street gang, use of alcohol or drugs at the time of the incident, and previous crimes committed against the respondent or respondent’s household.
For violent victimizations involving multiple offenders, respondents are asked similar questions that capture whether the demographic characteristics apply to all or most of the offenders (e.g., whether all or most offenders were male).5 BJS statisticians and NCVS data users can tabulate the race and Hispanic origin for offenders of all violent victimizations by combining the race and Hispanic origin of offenders in single offender victimizations with data on the race and Hispanic origin of offenders in multiple offender victimizations.
During 2012-15, U.S. residents experienced an estimated 5.8 million violent victimizations, with 4.5 million of those committed by a single offender (table 2). The offender was perceived to be white in about half (49%) of single offender victimizations. About a quarter (23%) of single offender
victimizations were committed by a black offender, and 13% were committed by a Hispanic offender. Eight percent of single offender violent victimizations were committed by an offender perceived to be of two or more races.6
During this period, U.S. residents experienced an estimated 1.2 million violent victimizations committed by multiple offenders. Fourteen percent of multiple offender violent victimizations were committed by offenders perceived by the victim to be of a mixed race and Hispanic origin group. Because the primary focus of this report is on white, black, and Hispanic victims and offenders, this mixed race group category was not included in most tables in this report.
In the majority (80%) of the 1.2 million multiple offender victimizations, victims perceived all the offenders to be of the same race or all of Hispanic origin. Victims perceived multiple offenders to be all white in 30% of these victimizations, all black in 25%, or all Hispanic in 24%.
During 2012-15, when the single offenders were combined with groups of offenders who were of the same race or who were all of Hispanic origin, fewer than half (44%) of all violent victimizations were committed by an offender perceived to be white by the victim. About a quarter (23%) of violent victimizations were perceived to be committed by a black offender. Fourteen percent of violent victimizations were perceived to be committed by a Hispanic offender.
5See the BJS website for all questions included on the NCVS CIR.6See Methodology for U.S. population of persons age 12 or older by race and Hispanic origin.

4RACE AND HISPANIC ORIGIN OF VICTIMS AND OFFENDERS, 2012-15 | OCTOBER 2017
The rate of violent crime was higher for intraracial victimizations than interracial victimizations during 2012-15
Regardless of the race of the victim, the rate of violent crime was higher for intraracial victimizations than for interracial victimizations during 2012-15. The rate of violent crime committed against a white victim by a white offender was 12.0 victimizations per 1,000 persons, compared to 3.1 per 1,000 for those committed by a black offender (table 3). The rate of violent crime committed against a black victim by a black offender was 16.5 victimizations per 1,000 persons, compared to 2.8 per 1,000 for those committed by a white offender. The rate of violent crime committed against a Hispanic victim by a Hispanic offender was 8.3 victimizations per 1,000 persons, compared to 4.1 per 1,000 for those committed by a white offender and 4.2 per 1,000 for those committed by a black offender.
For intraracial violent victimizations, the rate of black-on-black violence (16.5 victimizations per 1,000 black persons) was higher than the rate of white-on-white violence (12.0 per 1,000 white persons) and Hispanic-on-Hispanic violence (8.3 per 1,000 Hispanic persons). This pattern was similar for intraracial serious violent victimizations. The rate of black-on-black serious violence (6.7 per 1,000 black persons) was higher than the rate of white-on-white (3.7 per 1,000 white persons) and Hispanic-on-Hispanic (3.2 per 1,000 Hispanic persons) serious violence. The rate of black-on-black simple assault victimizations (9.8 per 1,000 black persons) was higher than the rate of Hispanic-on-Hispanic victimizations (5.1 per 1,000 Hispanic persons) but not statistically different from the white-on-white rate (8.4 per 1,000 white persons).
The rate of white-on-white and black-on-black violence declined from 1994 to 2015
From 1994 to 2015, white-on-white and black-on-black violence declined at a similar rate (figure 2). The rate of white-on-white violence declined 79%, from 52.5 victimizations per 1,000 white persons to 10.8 per 1,000. The rate of black-on-black violence declined 78%, from 66.6 victimizations per 1,000 black persons to 14.5 per 1,000.
Table 3 Rate of violent victimization, by type of crime and race/Hispanic origin of victim and offender, 2012–2015
Race/Hispanic origin of victim and offenderRate per 1,000 persons age 12 or older
Total violent crimea Serious violent crime Simple assaultTotal victimizations 22.0 7.4 14.5
White victimWhite offender* 12.0 3.7 8.4Black offender 3.1 † 1.2 † 1.9 †Hispanic offender 2.4 † 0.9 † 1.4 †
Black victimWhite offender 2.8 † 0.8 † 2.0 †Black offender* 16.5 6.7 9.8Hispanic offender 1.7 † 0.5 † 1.2 †
Hispanic victimWhite offender 4.1 † 1.4 † 2.7 †Black offender 4.2 † 2.1 † 2.1 †Hispanic offender* 8.3 3.2 5.1
Note: White and black victims and offenders exclude persons of Hispanic or Latino origin. Excludes victimizations in which the victim or offender was of some other race (American Indian or Alaska Native; Asian, Native Hawaiian, or Other Pacific Islander; or persons of two or more races). See appendix table 4 for standard errors.*Comparison group.†Significant difference from comparison group at the 95% confidence level.aIncludes serious violent crime (rape or sexual assault, robbery, and aggravated assault) and simple assault.Source: Bureau of Justice Statistics, National Crime Victimization Survey, 2012–2015.
Figure 2Rate of nonfatal violent victimization, by race of offender and victim, 1993–2015
Note: Based on 2-year rolling averages centered on the most recent year. Racial categories are shown as offender-on-victim crime. See appendix table 5 for estimates and standard errors.Source: Bureau of Justice Statistics, National Crime Victimization Survey, 1993–2015.
0
10
20
30
40
50
60
70
'15'14'13'12'11'10'09'08'07'06'05'04'03'02'01'00'99'98'97'96'95'94
Rate per 1,000 persons
Black-on-black violence
White-on-white violence
Black-on-white violence
White-on-black violence

5RACE AND HISPANIC ORIGIN OF VICTIMS AND OFFENDERS, 2012-15 | OCTOBER 2017
Similar to the trend for intraracial violent victimization, the rate of interracial violent victimization declined from 1994 to 2015. The rate of white-on-black violence declined 74%, from 10.2 victimizations per 1,000 black persons to 2.6 per 1,000. The rate of black-on-white violence declined 80%, from 14.9 victimizations per 1,000 white persons to 3.0 per 1,000. In 1994, the rate of black-on-white violence was higher than the rate of white-on-black violence. However, the rates converged over time.
Stranger violence accounted for the largest proportion of interracial violence
During 2012-15, among white victims the percentage of violence committed by a white offender (31%) was more often domestic violence than the percentage committed by a black (6%) or Hispanic (7%) offender (table 4). Domestic violence against black and Hispanic victims was also more likely to be intraracial than interracial.
Table 4 Percent of violent victimizations, by victim-offender relationship and race/Hispanic origin of victim and offender, 2012–2015
Race/Hispanic origin of victim and offenderAverage annual number Total Domestic
Well known/casual acquaintance Stranger
Total violent victimizationsa 5,833,800 100% 19.6% 34.9% 37.7%White victim
White offender* 2,081,520 100% 30.7% 41.4% 27.2%Black offender 540,360 † 100% 6.2 † 26.7 † 64.4 †Hispanic offender 406,450 † 100% 7.5 † 36.5 54.9 †
Black victimWhite offender 91,470 † 100% 8.4% ! † 41.7% 49.9% ‡Black offender* 537,470 100% 26.5 32.3 37.6Hispanic offender 55,790 † 100% 7.4 ! † 44.5 47.2
Hispanic victimWhite offender 169,040 † 100% 12.9% † 35.7% 49.6%Black offender 173,120 † 100% 14.1 † 26.2 57.1 †Hispanic offender* 341,420 100% 23.3 31.0 44.0
Note: Estimates may not sum to total because the other race category is not shown. White and black victims and offenders exclude persons of Hispanic or Latino origin. Excludes victimizations in which the victim or offender was of some other race (American Indian or Alaska Native; Asian, Native Hawaiian, or Other Pacific Islander; or persons of two or more races). See appendix table 6 for standard errors.*Comparison group.†Significant difference from comparison group at the 95% confidence level.‡Significant difference from comparison group at the 90% confidence level.! Interpret with caution. Estimate based on 10 or fewer sample cases, or coefficient of variation is greater than 50%. aIncludes rape or sexual assault, robbery, aggravated assault, and simple assault.Source: Bureau of Justice Statistics, National Crime Victimization Survey, 2012–2015.
The percentage of violence committed against a white victim by a white offender (41%) was more often committed by a well-known or casual acquaintance than the percentage committed by a black offender (27%) who was a well-known or casual acquaintance. There were no statistically significant differences in the percentage of violence committed against black and Hispanic victims by a well-known or casual acquaintance.
During 2012-15, among white victims the percentage of violence committed by a white offender who was a stranger (27%) was lower than the percentage committed by a black (64%) or Hispanic (55%) offender who was a stranger. The percentage of violence committed against a black victim by a white offender who was a stranger (50%) was higher (90% confidence level) than the percentage committed by a black offender who was a stranger (38%). In comparison, the percentage of violence committed against a Hispanic victim by a black offender who was a stranger (57%) was greater than the percentage committed by a Hispanic offender who was a stranger (44%).

6RACE AND HISPANIC ORIGIN OF VICTIMS AND OFFENDERS, 2012-15 | OCTOBER 2017
Summary of changes to collecting offender race and Hispanic origin in the National Crime Victimization Survey In 2012, the Bureau of Justice Statistics (BJS) changed the manner in which the National Crime Victimization Survey (NCVS) collects information about the perceived race of offenders. Prior to 2012, the NCVS offender race categories were white, black, or some other race. In 2012, offender race categories were expanded to align with the Office of Management and Budget’s standards for measuring race and ethnicity. Offender race categories now include American Indian or Alaska Native; Asian, Native Hawaiian, or Other Pacific Islander; and persons of two or more races. In 2012, the NCVS also began collecting information on whether the offender was of Hispanic origin.
During 2012-15, more than half (55%) of violent victimizations were committed by someone known to the victim (see table 4). Because most violent crime victims know their offender, most can provide reliable information about their race and Hispanic origin. Even with stranger-perpetrated violent crime, victims may be able to accurately identify the offender’s race and Hispanic origin using cues, such as the location of the crime, language used, mannerisms of the offender, and information from other sources, including police reports or arrest records.
NCVS questions aim to establish general characteristics of offenders instead of unique identities. Research on eyewitness testimony indicates that victims can identify general characteristics of offenders, such as sex, race, Hispanic origin, and age, and are more often correct than incorrect when identifying these characteristics.7
During 2008-11, prior to the implementation of the expanded offender race categories, there were an average of 5.7 million violent victimizations per year (table 5). Of these violent victimizations, the majority (54%) of offenders were white, 22% were black, and 7% were some other race.
During 2012-15, after the implementation of the expanded offender race categories, there were an average of 5.8 million violent victimizations per year. Of these victimizations, 44% involved a white offender, 23% involved a black offender, and 14% involved a Hispanic offender.
Table 5 Percent of nonfatal violent victimizations before and after changes to race/Hispanic origin offender categories, 2008–2015
2008–2011 2012–2015
Race/Hispanic origin of offenderAverage annual number Percent
Average annual number Percent
Total violent victimizationsa 5,702,800 100% 5,833,800 100%Whiteb 3,065,900 53.8% 2,557,910 43.8%Blackb 1,265,720 22.2% 1,324,270 22.7%Hispanic ~ ~ 841,500 14.4%Otherb 389,800 6.8% 127,070 2.2%
American Indian or Alaska Native ~ ~ 23,590 0.4Asian ~ ~ 73,380 1.3Native Hawaiian or Other Pacific Islander ~ ~ 30,110 0.5
Two or more races (single offenders) ~ ~ 352,370 6.0%Multiple offenders of various races (mixed race group) 196,070 3.4% 164,190 2.8%Unknown offender race or number of offenders 484,900 8.5% 466,490 8.0%Note: Estimates may not sum to total due to rounding and missing data. See Methodology. See appendix table 7 for standard errors.~Not applicable.aIncludes rape or sexual assault, robbery, aggravated assault, and simple assault. bDuring 2012–2015, excludes persons of Hispanic or Latino origin. See Methodology.Source: Bureau of Justice Statistics, National Crime Victimization Survey, 2008–2015.
7Van Koppen, P.J., & Lochun, S.K. (1997). Portraying perpetrators: The validity of offender descriptions by witnesses. Law and Human Behavior, 21(6), 661-685.
Continued on next page

7RACE AND HISPANIC ORIGIN OF VICTIMS AND OFFENDERS, 2012-15 | OCTOBER 2017
Summary of changes to collecting offender race and Hispanic origin in the National Crime Victimization Survey (continued)From 2008 to 2011, there was no statistically significant change in the rates of violent victimization committed by whites, blacks, and offenders of some other race (figure 3). From 2012 to 2015, the rate of violent victimizations committed by non-Hispanic whites, non-Hispanic blacks, and non-Hispanic offenders of some other race declined significantly. The rate of violent victimization committed by a non-Hispanic white offender declined 24% from
11.0 victimizations per 1,000 persons to 8.4 per 1,000. The rate for non-Hispanic black offenders declined 35% (from 6.0 victimizations per 1,000 to 4.0 per 1,000). The rate for non-Hispanic offenders of some other race declined 51% (from 3.7 victimizations per 1,000 to 1.8 per 1,000). There was no statistically significant change in the rate of violent victimizations committed by Hispanic offenders from 2012 to 2015.
Figure 3Rate of violent victimization, by race/Hispanic origin of offender, 2008–2015
Note: Estimates are not based on rolling averages because of the change in offender race categories that began in 2012. Dashed lines denote change in coding of race of offender to account for Hispanic or Latino origin. See Methodology. Violent victimizations include rape or sexual assault, robbery, aggravated assault, and simple assault. See appendix table 8 for estimates and standard errors.*Includes American Indian or Alaska Native; Asian, Native Hawaiian or Other Pacific Islander; single offenders of two or more races; and multiple offenders of various races.Source: Bureau of Justice Statistics, National Crime Victimization Survey, 2008–2015.
Rate per 1,000 persons
White
Black
Other
Other race, non-Hispanic*
Hispanic/LatinoBlack, non-Hispanic
White, non-Hispanic
0
3
6
9
12
15
20152014201320122011201020092008
Table 6 Percent of violent victimizations reported to police, by race/Hispanic origin of victim and offender, 2012–2015Race/Hispanic origin of victim and offender
Average annual number Percent
Total violent victimizationsa 5,833,800 45.5%White victim
White offender* 2,081,520 45.9%Black offender 540,350 † 47.2Hispanic offender 406,450 † 45.1
Black victimWhite offender 92,810 † 57.4%Black offender* 537,470 51.7Hispanic offender 55,790 † 47.0
Hispanic victimWhite offender 169,040 † 42.6%Black offender 173,120 † 55.0Hispanic offender* 341,420 48.2
Note: Estimates may not sum to total because the other race category is not shown. White and black victims and offenders exclude persons of Hispanic or Latino origin. Excludes victimizations in which the victim or offender was of some other race (American Indian or Alaska Native; Asian, Native Hawaiian, or Other Pacific Islander; or persons of two or more races). See appendix table 9 for standard errors.*Comparison group.†Significant difference from the comparison group at the 95% confidence level.aIncludes rape or sexual assault, robbery, aggravated assault, and simple assault.Source: Bureau of Justice Statistics, National Crime Victimization Survey, 2012–2015.
During 2012-15, there were no differences among white, black, and Hispanic intraracial victimizations reported to police
During 2012-15, the percentage of violent victimizations reported to police by white victims was not statistically different whether the offenders were white, black, or Hispanic (table 6).8 This pattern was similar for black and Hispanic victims.
Violent victimizations involving a Hispanic victim and white offender (43%) were less likely to be reported to the police than violent victimizations involving a black victim and white offender (57%, 90% confidence level). Victimizations involving white (47%) or Hispanic (55%) victims were equally as likely to be reported to police when the offender was black. White (45%) and black (47%) victims were equally as likely to report their victimization to police when the offender was Hispanic.
8The NCVS allows for examination of crimes reported and not reported to police. Police notification may occur during or immediately following a criminal incident or at a later date. The term police includes municipal police departments, sheriffs’ offices, or other state or local law enforcement agencies.

8RACE AND HISPANIC ORIGIN OF VICTIMS AND OFFENDERS, 2012-15 | OCTOBER 2017
Among white victims, intraracial violence was less likely to involve a weapon than interracial violence
During 2012-15, the percentage of violent victimizations that involved a weapon was lower for a white victim with a white offender (18%) than with a black (25%) or Hispanic (26%) offender (table 7). Among black and Hispanic victims, there were no statistically significant differences in the percentage of violent victimizations that involved a weapon, regardless of the race of the offender.
During 2012-15, a lower percentage of violent victimizations against white victims involved a firearm when the offender was white (3%) than when the offender was black (11%) or Hispanic (7%). The percentage of violent victimizations that involved a firearm was lower for a Hispanic victim with a Hispanic offender (8%) than those committed by a black offender (19%). Among black victims, there were no statistically significant differences in the percentage of violent victimizations that involved a firearm across offender race and Hispanic origin categories.
Table 7 Percent of violent victimizations involving a weapon, by race/Hispanic origin of victim and offender, 2012–2015Race/Hispanic origin of victim and offender Average annual number Any weapona Firearm No weapon Unknown
Total violent victimizationsb 5,833,800 20.9% 6.6% 71.6% 7.5%White victim
White offender* 2,081,520 17.8% 3.5% 76.6% 5.7%Black offender 540,360 † 24.7 † 11.1 † 64.9 † 10.4 †Hispanic offender 406,450 † 25.9 † 6.6 † 66.2 † 8.0
Black victimWhite offender 92,810 † 20.0% 10.1% ! 72.7% † 7.3% ! †Black offender* 537,470 25.8 13.0 59.5 14.7Hispanic offender 55,790 † 25.5 8.7 ! 70.9 3.6 ! †
Hispanic victimWhite offender 169,040 † 24.9% 4.1% ! ‡ 67.5% 7.6%Black offender 173,120 † 30.1 18.5 † 61.0 8.9Hispanic offender* 341,420 25.4 8.4 68.5 6.1
Note: Estimates may not sum to total because the other race category is not shown. White and black victims and offenders exclude persons of Hispanic or Latino origin. Excludes victimizations in which the victim or offender was of some other race (American Indian or Alaska Native; Asian, Native Hawaiian, or Other Pacific Islander; or persons of two or more races). See appendix table 10 for standard errors.*Comparison group.†Significant difference from comparison group at 95% confidence level.‡Significant difference from comparison group at 90% confidence level.! Interpret with caution. Estimate based on 10 or fewer sample cases, or coefficient of variation is greater than 50%.aIncludes firearm, knife, other type of weapon, or unknown weapon type.bIncludes rape or sexual assault, robbery, aggravated assault, and simple assault.Source: Bureau of Justice Statistics, National Crime Victimization Survey, 2012–2015.

9RACE AND HISPANIC ORIGIN OF VICTIMS AND OFFENDERS, 2012-15 | OCTOBER 2017
There were no differences in the likelihood of injury for Hispanic victims across offender race and Hispanic origin categories
During 2012-15, the majority of violent victimizations did not result in injury to the victim. During this period, the percentage of violent victimizations resulting in injury was higher for white victims with white offenders (27%) compared to white victims with black offenders (21%) (table 8). There were no statistically significant differences in the percentage of victimizations that resulted in injury for Hispanic victims across offender race and Hispanic origin categories.
During 2012-15, a third (33%) of violent victimizations committed against a black victim by a black offender resulted in injury to the victim. A quarter (25%) of violent victimizations committed against a Hispanic victim by a Hispanic offender resulted in victim injury during this same period. The percentage of violent victimizations that resulted in injury was higher for black victims and black offenders (33%) than for white victims and black offenders (21%) during 2012-15.
Intraracial violence was higher than interracial violence for victims ages 12 to 49, regardless of victim race
During 2012-15, the percentage of intraracial violence was higher than the percentage of interracial violence for males and females, regardless of victim race or Hispanic origin (table 9). Among white victims, a similar percentage of the
Table 8 Percent of violent victimizations involving victim injury, by race/Hispanic origin of victim and offender, 2012–2015
Race/Hispanic origin of victim and offender
Average annual number Total Injureda Not injured
Total violent victimizationsb 5,833,800 100% 25.1% 74.9%
White victimWhite offender* 2,081,520 100% 27.0% 73.0%Black offender 540,360 † 100% 20.9 † 79.1 ‡Hispanic offender 406,450 † 100% 30.7 69.3
Black victimWhite offender 92,810 † 100% 11.4% ! † 88.6%†Black offender* 537,470 100% 32.7 67.3Hispanic offender 55,790 † 100% 23.4 ! 76.6
Hispanic victimWhite offender 169,040 † 100% 26.2% 73.8%Black offender 173,120 † 100% 26.3 73.7Hispanic offender* 341,420 100% 24.7 75.3
Note: Estimates may not sum to total because the other race category is not shown. White and black victims and offenders exclude persons of Hispanic or Latino origin. Excludes victimizations in which the victim or offender was of some other race (American Indian or Alaska Native; Asian, Native Hawaiian, or Other Pacific Islander; or persons of two or more races). See appendix table 11 for standard errors.*Comparison group.†Significant difference from the comparison group at the 95% confidence level.‡Significant difference from comparison group at 90% confidence level. ! Interpret with caution. Estimate based on 10 or fewer sample cases, or coefficient of variation is greater than 50%.aIncludes serious injuries (sexual violence injuries, gunshot wounds, knife wounds, internal injuries, unconsciousness, and broken bones) and bruises, cuts, or other minor injuries. bIncludes rape or sexual assault, robbery, aggravated assault, and simple assault. Source: Bureau of Justice Statistics, National Crime Victimization Survey, 2012–2015.
Table 9 Percent of violent victimizations, by victim characteristics and race/Hispanic origin of victim and offender, 2012–2015Race/Hispanic origin of victim and offender
Average annual number
Sex of victim Age of victimMale Female 12–17 18–24 25–49 50 or older
White victim 3,028,330 100% 100% 100% 100% 100% 100%White offender* 2,081,520 67.7 69.7 76.6 70.3 67.0 65.9Black offender 540,360 17.8 † 17.9 † 9.8 † 19.0 † 22.0 † 14.8 †Hispanic offender 406,450 14.5 † 12.4 † 13.7 † 10.7 † 11.0 † 19.2 †
Black victim 686,070 100% 100% 100% 100% 100% 100%White offender 92,810 15.7 † 11.7 † 13.0 † 19.9 ! † 13.7 † 8.5 †Black offender* 537,470 73.0 82.8 74.3 75.8 77.8 85.6Hispanic offender 55,790 11.3 † 5.5 † 12.8 † 4.4 ! † 8.6 † 5.9 ! †
Hispanic victim 683,580 100% 100% 100% 100% 100% 100%White offender 169,040 27.7 † 22.1 † 19.5 † 22.1 † 27.3 † 29.7Black offender 173,120 28.9 † 22.1 † 26.6 † 25.2 † 22.3 † 35.7Hispanic offender* 341,420 43.4 55.8 53.9 52.7 50.4 34.6
Note: Estimates may not sum to total because the other race category is not shown. White and black victims and offenders exclude persons of Hispanic or Latino origin. Excludes victimizations in which the victim or offender was of some other race (American Indian or Alaska Native; Asian, Native Hawaiian, or Other Pacific Islander; or persons of two or more races). See appendix table 12 for standard errors.*Comparison group.†Significant difference from comparison group at the 95% confidence level.! Interpret with caution. Estimate based on 10 or fewer sample cases, or coefficient of variation is greater than 50%.Source: Bureau of Justice Statistics, National Crime Victimization Survey, 2012–2015.

10RACE AND HISPANIC ORIGIN OF VICTIMS AND OFFENDERS, 2012-15 | OCTOBER 2017
victimizations against females (70%) and males (68%) were committed by a white offender. Black (83%) and Hispanic (56%) female victims were more likely to experience intraracial victimization than their male counterparts.
For all instances except among Hispanic victims age 50 or older, the percentage of intraracial violence was higher than the percentage of interracial violence for victims of all ages, regardless of victim race or Hispanic origin. Among Hispanic victims ages 50 or older, there were no statistically significant differences in the percentage of violence committed by white, black, and Hispanic offenders.
White and Hispanic youth ages 12 to 17 were more likely to experience intraracial violence than whites and Hispanics ages 50 or older. Among black victims, youth were less likely to experience intraracial violence (74%) than adults ages 50 or older (86%, 90% confidence level).
Intraracial violence was higher than interracial violence for white and black victims, regardless of the victim's location of residence
During 2012-15, the percentage of intraracial violence was higher than the percentage of interracial violence for white and black victims, regardless of the victim’s location of residence (table 10). For Hispanic victims in urban and suburban areas, a higher percentage of violence was committed by a Hispanic offender than a black or white offender. This pattern did not hold true in rural areas.
The percentage of intraracial violence for white victims was lower in urban areas (57%) than in suburban (70%) and rural (86%) areas. The percentage of intraracial violence for black victims was higher in urban (82%) than suburban (72%) areas, but not statistically different than rural areas (77%). There were no statistically significant differences across the victim's location of residence for Hispanic victims of intraracial violence.
Table 10 Percent of violent victimizations, by location of residence and race/Hispanic origin of victim and offender, 2012–2015Race/Hispanic origin of victim and offender Average annual number Urban Suburban RuralWhite victim 3,028,320 100% 100% 100%
White offender* 2,081,520 57.4 70.3 85.7Black offender 540,350 26.3 † 16.1 † 7.4 †Hispanic offender 406,450 16.3 † 13.7 † 6.9 †
Black victim 686,070 100% 100% 100%White offender 92,810 10.5 † 18.8 † 13.0 ! †Black offender* 537,470 82.4 71.6 77.3Hispanic offender 55,790 7.1 † 9.6 † 9.7 ! †
Hispanic victim 683,580 100% 100% 100%White offender 169,040 19.7 † 29.0 † 41.3Black offender 173,120 29.5 † 21.6 † 13.0 ! †Hispanic offender* 341,420 50.8 49.3 45.7
Note: Estimates may not sum to total because the other race category is not shown. White and black victims and offenders exclude persons of Hispanic or Latino origin. Excludes victimizations in which the victim or offender was of some other race (American Indian or Alaska Native; Asian, Native Hawaiian, or Other Pacific Islander; or persons of two or more races). See appendix table 13 for standard errors. *Comparison group.†Significant difference from comparison group at the 95% confidence level.! Interpret with caution. Estimate is based on 10 or fewer sample cases.Source: Bureau of Justice Statistics, National Crime Victimization Survey, 2012–2015.

11RACE AND HISPANIC ORIGIN OF VICTIMS AND OFFENDERS, 2012-15 | OCTOBER 2017
Methodology
Survey coverage
The National Crime Victimization Survey (NCVS) is an annual data collection conducted by the U.S. Census Bureau for the Bureau of Justice Statistics (BJS). The NCVS is a self-report survey in which interviewed persons are asked about the number and characteristics of victimizations experienced during the prior 6 months. The NCVS collects information on nonfatal personal crimes (rape or sexual assault, robbery, aggravated and simple assault, and personal larceny) and household property crimes (burglary, motor vehicle theft, and other theft) both reported and not reported to police. In addition to providing annual level and change estimates on criminal victimization, the NCVS is the primary source of information on the nature of criminal victimization incidents.
Survey respondents provide information about themselves (sex, race, Hispanic origin, age, marital status, education level, and income) and whether they experienced a victimization. For each victimization incident, the NCVS collects information from the victim's perspective about the offender (sex, race, Hispanic origin, age, and victim-offender relationship), characteristics of the crime (including time and place of occurrence, use of weapons, nature of injury, and economic consequences), whether the crime was reported to police, reasons the crime was or was not reported, and victim experiences with the criminal justice system.
The NCVS is administered to persons age 12 or older from a nationally representative sample of households in the United States. The NCVS defines a household as a group of persons who all reside at a sampled address. Persons are considered household members when the sampled address is their usual place of residence at the time of the interview and when they have no usual place of residence elsewhere. Once selected, households remain in the sample for 3 years, and eligible persons in these households are interviewed every 6 months either in person or over the phone for a total of seven interviews.
All first interviews are conducted in person with subsequent interviews conducted either in person or by phone. New households rotate into the sample on an ongoing basis to replace outgoing households that have been in the sample for the 3-year period. The sample includes persons living in group quarters, such as dormitories, rooming houses, and religious group dwellings, and excludes persons living in military barracks and institutional settings, such as correctional or hospital facilities and persons who are homeless.
Nonresponse and weighting adjustments
In 2015, there were 95,760 households and 163,880 persons age 12 or older interviewed for the NCVS. Each household was interviewed twice during the year. The response rate was 82% for households and 86% for eligible persons.
Victimizations that occurred outside the United States were excluded from this report. In 2015, fewer than 1% of the unweighted victimizations occurred outside the United States and were excluded from the analyses.
Estimates in this report use data from the 1993 to 2015 NCVS data files, weighted to produce annual estimates of victimization for persons age 12 or older living in U.S. households. Because the NCVS relies on a sample rather than a census of the entire U.S. population, weights are designed to inflate sample point estimates to known population totals and to compensate for survey nonresponse and other aspects of the sample design.
The NCVS data files include both person and household weights. Person weights provide an estimate of the population represented by each person in the sample. Household weights provide an estimate of the U.S. household population represented by each household in the sample. After proper adjustment, both household and person weights are also typically used to form the denominator in calculations of crime rates.
Victimization weights used in this analysis account for the number of persons present during an incident and for high-frequency repeat victimizations (series victimizations). Series victimizations are similar in type but occur with such frequency that a victim is unable to recall each individual event or describe each event in detail. Survey procedures allow NCVS interviewers to identify and classify these similar victimizations as series victimizations and to collect detailed information on only the most recent incident in the series.
The weight counts series incidents as the actual number of incidents reported by the victim, up to a maximum of 10 incidents. Including series victimizations in national rates results in large increases in the level of violent victimization. However, trends in violent crime are generally similar, regardless of whether series victimizations are included. In 2015, series incidents accounted for about 1% of all victimizations and 4% of all violent victimizations. Weighting series incidents as the number of incidents up to a maximum of 10 incidents produces more reliable estimates of crime levels, while the cap at 10 minimizes the effect of extreme outliers on rates. Additional information on the series enumeration is detailed in the report Methods for Counting High-Frequency Repeat Victimizations in the National Crime Victimization Survey (NCJ 237308, BJS web, April 2012).

12RACE AND HISPANIC ORIGIN OF VICTIMS AND OFFENDERS, 2012-15 | OCTOBER 2017
Standard error computations
When national estimates are derived from a sample, as with the NCVS, caution must be used when comparing one estimate to another estimate or when comparing estimates over time. Although one estimate may be larger than another, estimates based on a sample have some degree of sampling error. The sampling error of an estimate depends on several factors, including the amount of variation in the responses and the size of the sample. When the sampling error around an estimate is taken into account, the estimates that appear different may not be statistically different.
One measure of the sampling error associated with an estimate is the standard error. The standard error may vary from one estimate to the next. Generally, an estimate with a small standard error provides a more reliable approximation of the true value than an estimate with a large standard error. Estimates with relatively large standard errors are associated with less precision and reliability and should be interpreted with caution.
To generate standard errors around numbers and estimates from the NCVS, the U.S. Census Bureau produced generalized variance function (GVF) parameters for BJS. The GVFs take into account aspects of the NCVS complex sample design and represent the curve fitted to a selection of individual standard errors based on the Balanced Repeated Replication (BRR) technique. The GVF parameters were used to generate standard errors for each point estimate (counts, percentages, and rates) in this report.
BJS conducted tests to determine whether differences in estimated numbers, percentages, and rates in this report were statistically significant once sampling error was taken into account. Using statistical programs developed specifically for the NCVS, all comparisons in the text were tested for significance. The primary test procedure was the Student’s t-statistic, which tests the difference between two sample estimates. Unless otherwise noted, the findings described in this report as higher, lower, or different passed a test at the 0.05 level of statistical significance (95% confidence level). Findings that passed a test at the 0.10 level of statistical significance are noted as such in the text (90% confidence level). Caution is required when comparing estimates not explicitly discussed in this report.
Data users can use the estimates and the standard errors of the estimates provided in this report to generate a confidence interval around the estimate as a measure of the margin of error. The following example illustrates how standard errors can be used to generate confidence intervals:
According to the NCVS, during 2012-15, the rate of violent crime committed against a white victim by an offender perceived to be white was 12.0 victimizations per 1,000 persons (see table 3). Using the GVFs, BJS determined that the estimated rate has a standard error of 0.65 (see appendix table 4). A confidence interval around the estimate was generated by multiplying the standard errors by ±1.96 (the t-score of a normal, two-tailed distribution that excludes 2.5% at either end of the distribution). Therefore, the 95% confidence interval around the 12.0 estimate during 2012-15 is 12.0 ± (0.65 × 1.96) or (10.7 to 13.3). In other words, if BJS used the same sampling method to select different samples and computed an interval estimate for each sample, it would expect the true population parameter (rate of violent crime committed against a white victim by an offender perceived to be white) to fall within the interval estimates 95% of the time.
In this report, BJS also calculated a coefficient of variation (CV) for all estimates, representing the ratio of the standard error to the estimate. CVs provide a measure of reliability and a means for comparing the precision of estimates across measures with differing levels or metrics.
Methodological changes to the NCVS in 2006
Methodological changes implemented in 2006 may have affected the crime estimates for that year to such an extent that they are not comparable to estimates from other years. Evaluation of 2007 and later data from the NCVS conducted by BJS and the U.S. Census Bureau found a high degree of confidence that estimates for every year from 2007 to 2015 are consistent with and comparable to estimates for 2005 and previous years. The reports are available on the BJS website:
� Criminal Victimization, 2006 (NCJ 219413, December 2007)
� Criminal Victimization, 2007 (NCJ 224390, December 2008)
� Criminal Victimization, 2008 (NCJ 227777, September 2009)
� Criminal Victimization, 2009 (NCJ 231327, October 2010)
� Criminal Victimization, 2010 (NCJ 235508, September 2011)
� Criminal Victimization, 2011 (NCJ 239437, October 2012)
� Criminal Victimization, 2012 (NCJ 243389, October 2013)
� Criminal Victimization, 2013 (NCJ 247648, September 2014)
� Criminal Victimization, 2014 (NCJ 248973, August 2015)
� Criminal Victimization, 2015 (NCJ 250180, October 2016)

13RACE AND HISPANIC ORIGIN OF VICTIMS AND OFFENDERS, 2012-15 | OCTOBER 2017
Changes to collecting offender race and Hispanic origin in the NCVS
In 2012, BJS changed the manner in which the NCVS collects information about the perceived race of a violent offender. Information on an offender’s race and Hispanic origin is collected from the victim. Therefore, it is based on the victims’ perceptions. Prior to 2012, the NCVS offender race categories were white, black or African American, and some other race. In 2012, offender race categories were expanded to align with the Office of Management and Budget’s standards for measuring race and ethnicity. The race variable now includes categories for American Indian or Alaska Native; Asian, Native Hawaiian, or Other Pacific Islander; and persons of two or more races. In 2012, the NCVS also began collecting information on whether an offender was of Hispanic origin.
The following page lists the NCVS questions on offender race and Hispanic origin prior to 2012 and also lists questions that include the new categories implemented in 2012.
Race and Hispanic origin of victims and offenders in this report
Exclusion of the other race category
BJS has received numerous requests from data users and the media seeking statistics on the race and Hispanic origin of violent crime victims and their offenders. Most requests asked for statistics on white, black, and Hispanic victims and offenders perceived to be white, black, or Hispanic origin. For this reason, this report covers these groups. It excludes victims and offenders perceived to be of some other race (including American Indian or Alaska Native, or Asian, Native Hawaiian, or Other Pacific Islander) and persons of two or more races from the majority of the tables and figures. These other race categories were also excluded because the sample sizes for these categories were small and many estimates were flagged as unreliable.
Perceived Hispanic victims and offenders
Victim and offender racial categories (white, black, or some other race) presented in this report did not include persons of Hispanic origin. If a victim identified as Hispanic or the victim perceived an offender to be Hispanic, they were included in the Hispanic category, regardless of their race.
Violent crime victims were asked whether they perceived their offenders to be of Hispanic origin. Only offenders perceived by the victim to be Hispanic were included as Hispanic. If victims did not know whether the offender was Hispanic, they were not included as Hispanic and were instead coded into their perceived racial category.
Missing data on race and Hispanic origin of offenders
The majority (55%) of violent victimizations were committed by someone known to the victim (current or former intimate partner, other relative, or well-known or casual acquaintance); therefore, it was assumed that the victim knew the approximate sex, race, Hispanic origin, and age of the offender. During 2012-15, the race and Hispanic origin of single and multiple offenders was unknown in 5% of violent victimizations.
Table 11U.S. population of persons age 12 or older, by race/Hispanic origin, 2012–2015Race/Hispanic origin Average annual number Percent
Total 265,649,910 100%White 172,611,780 65.0%Black 32,599,700 12.3%Hispanic 41,364,400 15.6%Other 15,481,100 5.8%
American Indian or Alaska Native 1,376,970 0.5Asian 13,391,180 5.0Native Hawaiian or Other Pacific Islander 712,950 0.3
Persons of two or more races 3,223,550 1.2%Note: Detail may not sum to total due to rounding and missing data. White, black, and other race categories exclude persons of Hispanic or Latino origin. Source: Bureau of Justice Statistics, National Crime Victimization Survey, 2012–2015.

14RACE AND HISPANIC ORIGIN OF VICTIMS AND OFFENDERS, 2012-15 | OCTOBER 2017
9Variable names in 2011 NCVS Public Use File codebook. 10Variable names in 2015 NCVS Public Use File codebook.
Old race questions (prior to 2012) New race and Hispanic origin questions (started in 2012)
Single offender questions and variable names9 Single offender questions and variable names10
[no Hispanic origin question] V4237a: Was the offender Hispanic or Latino?
1. Yes
2. No
3. Don’t know
V4246: Was the offender White, Black, or some other race?
1. White
2. Black
3. Other
4. Don’t know
V4246a: What race or races was the offender? You may select more than one. Was the offender…
(enter all that apply)
V4246b: White
V4246c: Black or African American
V4246d: American Indian or Alaska Native
V4246e: Asian
V4246f: Native Hawaiian or Other Pacific Islander
V4246g: Don’t know
Multiple offender questions and variable names Multiple offender questions and variable names
[no Hispanic origin question] V4252a: Were any of the offenders Hispanic or Latino?
1. Yes
2. No
3. Don’t know
[no Hispanic origin question] [if yes to v4252a]
Were the offenders mostly Hispanic, mostly non-Hispanic, or an equal number of Hispanic and non-Hispanic?
1. Mostly Hispanic
2. Mostly non-Hispanic
3. Equal number of Hispanic and non-Hispanic
4. Don’t know
V4279: Were the offenders White, Black, or some other race?
V4280: White
V4281: Black
V4282: Other
V4283: Don’t know race of any/some
V4279: What race or races were the offenders? Were they—
(enter all that apply)
V4280: White
V4281: Black or African American
V4282a: American Indian or Alaska Native
V4282b: Asian
V4282c: Native Hawaiian or Other Pacific Islander
V4283: Don’t know
[if respondent reported more than one race in previous question]
V4285: What race were most of the offenders?
1. Mostly White
2. Mostly Black
3. Mostly some other race
4. Equal number of each race
5. Don’t know
[if respondent reported more than one race in previous question] V4285a: What race were most of the offenders?
1. Mostly White
2. Mostly Black or African American
3. Mostly American Indian or Alaska Native
4. Mostly Asian
5. Mostly Native Hawaiian or Pacific Islander
6. Equal number of each race
7. Don’t know

15RACE AND HISPANIC ORIGIN OF VICTIMS AND OFFENDERS, 2012-15 | OCTOBER 2017
appendix Table 1Estimates and standard errors for figure 1: Percent of intraracial and interracial victims and offenders of violent victimizations, by type of crime, 2012–2015
Estimate Standard errorRace/Hispanic origin of victim and offender
All violent victimizations
Rape or sexual assault Robbery
Aggravated assault
Simple assault
All violent victimizations
Rape or sexual assault Robbery
Aggravated assault
Simple assault
Total 100% 100% 100% 100% 100% ~ ~ ~ ~ ~Intraracial victim and offender* 51 55 47 52 52 1.5% 3.5% 2.5% 2.1% 1.6%Interracial victim and offender 41 † 39 † 45 42 † 40 † 1.4 3.3 2.5 2.0 1.5Unknown race or unknown number of offenders 8 † 7 † 9 † 6 † 8 † 0.6 1.5 1.2 0.8 0.7
Average annual number 5,833,800 340,790 657,550 974,790 3,860,660 353,035 49,572 68,964 86,439 259,398
*Comparison group.~Not applicable.†Significant difference from the comparison group at the 95% confidence level.Source: Bureau of Justice Statistics, National Crime Victimization Survey, 2012–2015.
appendix Table 2 Standard errors for table 1: Percent of violent victimizations, by race/Hispanic origin of victim and offender, 2012–2015
Race/Hispanic origin of victim
Average annual number
Race/Hispanic origin of offender
White Black Hispanic OtherSingle offender of two or more races
Multiple offenders of various races
Unknown race or number of offenders
Total violent victimizations 353,035 1.41% 1.10% 0.87% 0.28% 0.52% 0.33% 0.62%
White 257,273 1.67 1.02 0.87 0.28 0.62 0.32 0.72Black 96,145 1.46 2.65 1.11 0.26 1.19 0.84 1.19Hispanic 95,833 1.98 2.00 2.59 0.65 1.02 0.75 1.22Other 38,003 4.07 3.39 2.47 3.27 1.47 1.94 3.01Persons of two or more races 44,831 4.12 2.63 1.88 1.03 1.37 1.64 1.87Source: Bureau of Justice Statistics, National Crime Victimization Survey, 2012–2015.
appendix Table 3 Standard errors for table 2: Race/Hispanic origin of violent victimization offenders, by type of victimization, 2012–2015
Total victimizations Single offender victimizations Multiple offender victimizations
Race/Hispanic origin of violent offenderAverage annual number Percent
Average annual number Percent
Average annual number Percent
Total violent victimizations 353,035 ~ 294,913 ~ 117,333 ~White 200,788 1.41% 181,774 1.56% 54,106 2.12%Black 128,879 1.10% 109,757 1.20% 47,547 1.95%Hispanic 95,459 0.87% 73,470 0.87% 46,927 1.93%Other 28,964 0.28% 28,084 0.35% 5,317 0.24%
American Indian or Alaska Native 10,898 0.10 10,147 0.12 3,472 0.16Asian 20,884 0.20 20,487 0.26 3,151 0.14Native Hawaiian or Other Pacific Islander 12,500 0.12 12,229 0.15 2,172 0.10
Two or more races (single offenders) 54,431 0.52% 54,431 0.67% ~ ~Multiple offenders of various races (mixed race group) 33,843 0.33% ~ ~ 33,843 1.50%Unknown offender race 46,394 0.45% 38,870 0.49% 19,921 0.93%Unknown number of offenders 37,380 0.36% ~ ~ ~ ~~Not applicable. Source: Bureau of Justice Statistics, National Crime Victimization Survey, 2012–2015.

16RACE AND HISPANIC ORIGIN OF VICTIMS AND OFFENDERS, 2012-15 | OCTOBER 2017
appendix Table 4Standard errors for table 3: Rate of violent victimization, by type of crime and race/Hispanic origin of victim and offender, 2012–2015
Race/Hispanic origin of victim and offender
Rate per 1,000 persons age 12 or olderTotal violent crime
Serious violent crime Simple assault
Total victimizations 0.86 0.34 0.63White victim
White offender 0.65 0.24 0.49Black offender 0.26 0.11 0.18Hispanic offender 0.21 0.10 0.15
Black victimWhite offender 0.43 0.17 0.33Black offender 1.32 0.60 0.92Hispanic offender 0.31 0.13 0.24
Hispanic victimWhite offender 0.49 0.20 0.37Black offender 0.50 0.27 0.31Hispanic offender 0.78 0.35 0.55
Source: Bureau of Justice Statistics, National Crime Victimization Survey, 2012–2015.
appendix Table 5 Estimates and standard errors for figure 2: Rate of nonfatal violent victimization, by race of offender and victim, 1993–2015
Estimate Standard error
YearWhite-on-white violence
Black-on-black violence
White-on-black violence
Black-on-white violence
White-on-white violence
Black-on-black violence
White-on-black violence
Black-on-white violence
1994 52.5 66.6 10.2 14.9 2.11 4.32 1.35 0.921995 48.7 63.6 9.1 14.3 1.74 3.59 1.06 0.771996 44.3 54.9 10.5 11.8 1.74 3.42 1.18 0.711997 43.5 53.6 8.8 10.1 1.93 3.76 1.17 0.721998 41.5 49.5 6.6 8.3 2.28 4.27 1.15 0.761999 36.9 42.7 5.5 7.2 2.01 3.69 0.96 0.652000 30.0 37.3 4.9 6.5 1.78 3.43 0.92 0.622001 23.6 30.3 3.9 5.4 1.42 2.82 0.74 0.522002 23.0 27.8 4.7 4.2 1.55 2.93 0.92 0.482003 23.5 26.1 5.4 3.5 1.60 2.86 1.00 0.432004 20.7 25.0 3.3 3.9 1.33 2.62 0.73 0.432005 18.3 23.9 2.2 4.3 1.15 2.40 0.55 0.432006 19.5 27.6 3.5 4.2 1.12 2.44 0.66 0.402007 18.6 29.3 3.5 4.2 1.11 2.49 0.60 0.392008 16.0 23.2 2.6 3.9 1.09 2.36 0.57 0.412009 15.0 20.3 4.0 3.2 1.20 2.55 0.91 0.432010 13.4 19.2 4.3 2.7 1.11 2.35 0.86 0.372011 13.4 16.0 2.7 2.5 1.02 1.88 0.57 0.322012 14.1 17.9 2.6 3.1 0.90 1.78 0.52 0.322013 13.3 18.4 3.1 3.3 1.03 2.11 0.66 0.392014 12.1 15.4 2.2 3.2 0.88 1.68 0.47 0.352015 10.8 14.5 2.6 3.0 0.81 1.65 0.55 0.34Source: Bureau of Justice Statistics, National Crime Victimization Survey, 1993–2015.
17RACE AND HISPANIC ORIGIN OF VICTIMS AND OFFENDERS, 2012-15 | OCTOBER 2017
appendix Table 6 Standard errors for table 4: Percent of violent victimizations, by victim-offender relationship and race/Hispanic origin of victim and offender, 2012–2015
Race/Hispanic origin of victim and offenderAverage annual number Domestic
Well known/casual acquaintance Stranger
Total violent victimizations 353,035 1.02% 1.32% 1.36%White victim
White offender 174,619 1.74% 1.92% 1.66%Black offender 71,543 1.28 2.65 3.09Hispanic offender 59,600 1.59 3.29 3.51
Black victimWhite offender 23,788 3.22% 6.15% 6.30%Black offender 71,296 2.65 2.85 2.99Hispanic offender 17,795 3.76 7.67 7.73
Hispanic victimWhite offender 34,450 3.04% 4.60% 4.90%Black offender 34,957 3.13 4.11 4.85Hispanic offender 53,354 2.99 3.34 3.68
Source: Bureau of Justice Statistics, National Crime Victimization Survey, 2012–2015.
appendix Table 7 Standard errors for table 5: Percent of nonfatal violent victimizations before and after changes to race/Hispanic origin offender categories, 2008–2015
2008–2011 2012–2015
Race/Hispanic origin of offenderAverage annual number Percent
Average annual number Percent
Total violent victimizations 393,966 ~ 353,035 ~White 256,847 1.66% 200,788 1.41%Black 140,788 1.24% 128,879 1.10%Hispanic ~ ~ 95,459 0.87%Other 64,854 0.64% 28,964 0.28%
American Indian or Alaska Native ~ ~ 10,898 0.10Asian ~ ~ 20,884 0.20Native Hawaiian or Other Pacific Islander ~ ~ 12,500 0.12
Two or more races (single offenders) ~ ~ 54,431 0.52%Multiple offenders of various races (mixed race group) 41,970 0.42% 33,843 0.33%Unknown offender race or number of offenders 74,676 0.73% 65,088 0.62%~Not applicable.Source: Bureau of Justice Statistics, National Crime Victimization Survey, 2008–2015.

18RACE AND HISPANIC ORIGIN OF VICTIMS AND OFFENDERS, 2012-15 | OCTOBER 2017
appendix Table 8 Estimates and standard errors for figure 3: Rate of violent victimization, by race/Hispanic origin of offender, 2008–2015
Estimate Standard error
Year WhiteWhite, non-Hispanic Black
Black, non-Hispanic
Other race
Other race, non-Hispanic
Hispanic/Latino origin White
White, non-Hispanic Black
Black, non-Hispanic
Other race
Other race, non-Hispanic
Hispanic/Latino origin
2008 12.9 ~ 5.4 ~ 2.4 ~ ~ 1.11 ~ 0.62 ~ 0.37 ~ ~2009 11.9 ~ 5.4 ~ 2.6 ~ ~ 1.18 ~ 0.68 ~ 0.41 ~ ~2010 10.9 ~ 4.7 ~ 1.8 ~ ~ 1.09 ~ 0.60 ~ 0.30 ~ ~2011 12.4 ~ 4.3 ~ 2.4 ~ ~ 1.05 ~ 0.50 ~ 0.33 ~ ~2012 13.0 11.0 6.3 6.0 3.8 3.7 3.3 0.94 0.84 0.58 0.56 0.42 0.41 0.382013 12.7 10.2 5.1 5.0 2.6 2.3 4.0 1.23 1.05 0.65 0.63 0.40 0.37 0.542014 10.6 9.0 5.0 5.0 2.1 2.0 2.6 0.93 0.83 0.56 0.56 0.31 0.29 0.352015 9.9 8.4 4.2 4.0 2.1 1.8 2.8 0.92 0.82 0.51 0.49 0.32 0.29 0.39~Not applicable.Source: Bureau of Justice Statistics, National Crime Victimization Survey, 2008–2015.
appendix Table 9Standard errors for table 6: Percent of violent victimizations reported to police, by race/Hispanic origin of victim and offender, 2012–2015Race/Hispanic origin of victim and offender
Average annual number Percent
Total violent victimizations 353,035 1.42%White victim
White offender 174,619 1.97%Black offender 71,543 3.14Hispanic offender 59,600 3.46
Black victimWhite offender 23,995 6.23%Black offender 71,296 3.17Hispanic offender 17,795 7.72
Hispanic victimWhite offender 34,450 4.81%Black offender 34,957 4.86Hispanic offender 53,354 3.73
Source: Bureau of Justice Statistics, National Crime Victimization Survey, 2012–2015.
19RACE AND HISPANIC ORIGIN OF VICTIMS AND OFFENDERS, 2012-15 | OCTOBER 2017
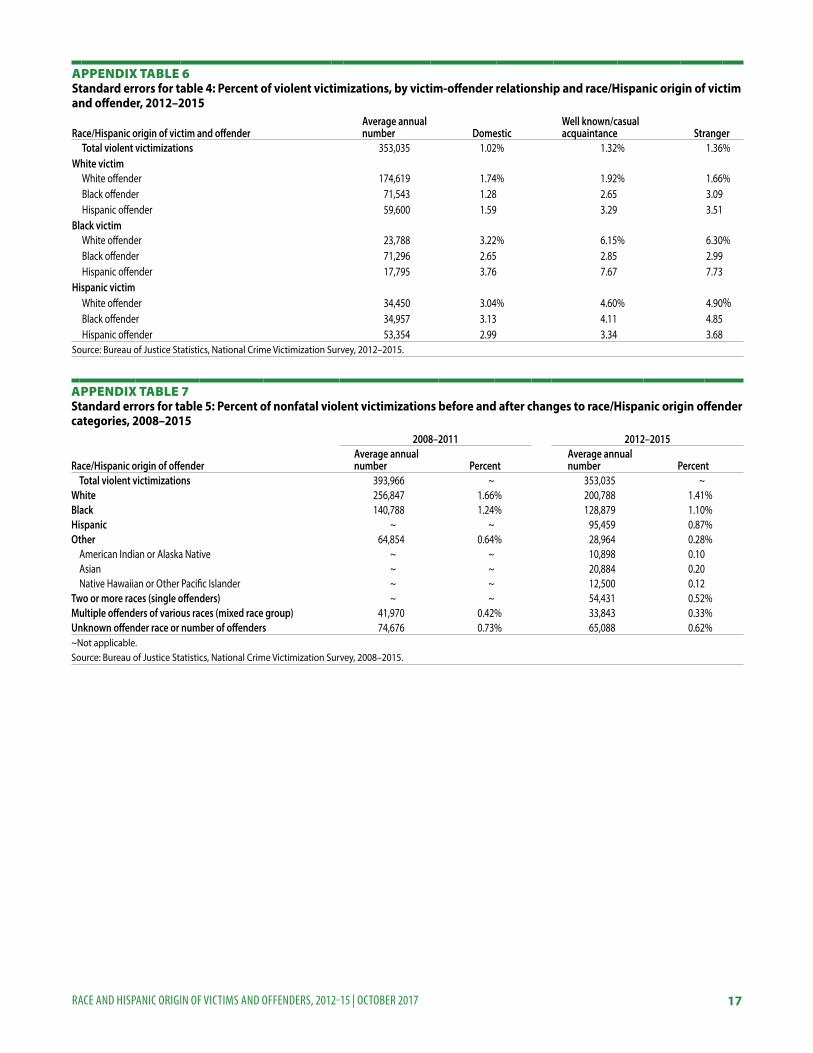
appendix Table 11 Standard errors for table 8: Percent of violent victimizations involving victim injury, by race/Hispanic origin of victim and offender, 2012–2015Race/Hispanic origin of victim and offender Average annual number Injured Not injured
Total violent victimizations 353,035 1.15% 1.31%White victim
White offender 174,619 1.65% 1.84%Black offender 71,543 2.39 2.66Hispanic offender 59,600 3.11 3.31
Black victimWhite offender 23,995 3.70% 4.08%Black offender 71,296 2.86 3.04Hispanic offender 17,795 6.37 6.69
Hispanic victimWhite offender 34,450 4.15% 4.41%Black offender 34,957 4.12 4.38Hispanic offender 53,354 3.06 3.32
Source: Bureau of Justice Statistics, National Crime Victimization Survey, 2012–2015.
appendix Table 10 Standard errors for table 7: Percent of violent victimizations involving a weapon, by race/Hispanic origin of victim and offender, 2012–2015Race/Hispanic origin of victim and offender Average annual number Any weapon Firearm No weapon Unknown
Total violent victimizations 353,035 1.06% 0.55% 1.36% 0.60%White victim
White offender 174,619 1.36% 0.55% 1.76% 0.72%Black offender 71,543 2.57 1.76 3.08 1.70Hispanic offender 59,600 2.92 1.50 3.39 1.65
Black victimWhite offender 23,995 4.78% 3.50% 5.68% 2.97%Black offender 71,296 2.62 1.90 3.15 2.02Hispanic offender 17,795 6.58 4.08 7.15 2.61
Hispanic victimWhite offender 34,450 4.07% 1.69% 4.68% 2.33%Black offender 34,957 4.32 3.56 4.80 2.50Hispanic offender 53,354 3.10 1.83 3.55 1.54
Source: Bureau of Justice Statistics, National Crime Victimization Survey, 2012–2015.

20RACE AND HISPANIC ORIGIN OF VICTIMS AND OFFENDERS, 2012-15 | OCTOBER 2017
appendix Table 13 Standard errors for table 10: Percent of violent victimizations, by location of residence and race/Hispanic origin of victim and offender, 2012–2015Race/Hispanic origin of victim and offender Average annual number Urban Suburban RuralWhite victim 225,232 ~ ~ ~
White offender 174,619 2.62% 2.03% 2.43%Black offender 71,543 2.17 1.40 1.50Hispanic offender 59,600 1.74 1.29 1.45
Black victim 83,522 ~ ~ ~White offender 23,995 1.92% 3.17% 5.10%Black offender 71,296 2.78 4.00 6.81Hispanic offender 17,795 1.56 2.29 4.43
Hispanic victim 83,325 ~ ~ ~White offender 34,450 2.71% 3.51% 8.98%Black offender 34,957 3.20 3.12 5.90Hispanic offender 53,354 3.65 4.02 9.12
~Not applicable. Source: Bureau of Justice Statistics, National Crime Victimization Survey, 2012–2015.
appendix Table 12 Standard errors for table 9: Percent of violent victimizations, by victim characteristics and race/Hispanic origin of victim and offender, 2012–2015
Race/Hispanic origin of victim and offenderAverage annual number
Sex of victim Age of victimMale Female 12–17 18–24 25–49 50 or older
White victim 225,233 ~ ~ ~ ~ ~ ~White offender 174,619 2.14% 2.08% 2.92% 3.05% 2.25% 2.71%Black offender 71,543 1.53 1.51 1.74 2.36 1.77 1.78Hispanic offender 59,600 1.38 1.25 2.07 1.77 1.25 2.02
Black victim 83,523 ~ ~ ~ ~ ~ ~White offender 23,995 2.60% 2.08% 3.58% 4.53% 2.35% 2.78%Black offender 71,296 3.54 2.83 5.11 5.21 3.23 3.95Hispanic offender 17,795 2.21 1.40 3.56 2.17 1.85 2.30
Hispanic victim 83,325 ~ ~ ~ ~ ~ ~White offender 34,450 3.28% 2.85% 3.77% 4.28% 3.27% 6.19%Black offender 34,957 3.34 2.85 4.28 4.52 3.02 6.55Hispanic offender 53,354 3.76 3.66 5.03 5.41 3.84 6.49
~Not applicable. Source: Bureau of Justice Statistics, National Crime Victimization Survey, 2012–2015.

NCJ250747
The Bureau of Justice Statistics of the U.S. Department of Justice is the principal federal agency responsible for measuring crime, criminal victimization, criminal offenders, victims of crime, correlates of crime, and the operation of criminal and civil justice systems at the federal, state, tribal, and local levels. BJS collects, analyzes, and disseminates reliable and valid statistics on crime and justice systems in the United States, supports improvements to state and local criminal justice information systems, and participates with national and international organizations to develop and recommend national standards for justice statistics. Jeri M. Mulrow is acting director.
This report was written by Rachel E. Morgan. Erika Harrell verified the report.
Brigitte Coulton and Jill Thomas edited the report. Steve Grudziecki produced the report.
October 2017, NCJ 250747
Office of Justice ProgramsBuilding Solutions • Supporting Communities • Advancing Justice
www.ojp.usdoj.gov