
RA VEIN VEIN - Nc State University · Numerical sim ulations are p ... system and the o ccurence of...
48
Transcript of RA VEIN VEIN - Nc State University · Numerical sim ulations are p ... system and the o ccurence of...

MODELING INSTABILITY IN THE CONTROL SYSTEM FOR
HUMAN RESPIRATION: APPLICATIONS TO INFANT NON-REM
SLEEP �
J. J. BATZELy AND H. T. TRANz
Abstract. Mathematical models of the human respiratory control system have been developedsince 1940 to study a wide range of features of this complex system. The phenomena collectivelyreferred to as periodic breathing (including Cheyne Stokes respiration and apneustic breathing) haveimportant medical implications. The hypothesis that periodic breathing is the result of delay in thefeedback signals to the respiratory control system has been studied since the work of Grodins et al.in the early 1950's [36]. The purpose of this paper is to extend the model presented by Khoo et al.[60] in 1991 to include variable delay in the feedback control loop and to study the phenomena ofperiodic breathing and apnea as they occur during quiet sleep in infant sleep respiration at around4 months of age. The nonlinear mathematical model consists of a feedback control system of �vedelay di�erential equations. Numerical simulations are performed to study instabilities in the controlsystem and the occurence of periodic breathing and apnea in the above case which is a time frameof high incidence of sudden infant death syndrome (SIDS).
1. Introduction. In the absence of voluntary control of breathing or neurolog-
ically induced changes in breathing, the respiratory control system varies the ventila-
tion rate in response to the levels of CO2 and O2 in the body. Models of the respiratory
control system date back to 1905 when Haldane and Priestly discussed the negative
feedback nature of ventilation control and CO2 regulation [43]. Quantitative studies
began with Gray and his multiple factor theory of the control of ventilation in 1946
[33]. The �rst dynamic model of CO2 regulation using control theory was given by
Grodins et al in a seminal paper in 1954 [37]. A number of important models have
been proposed since then. Horgan and Lange 1963 [51] introduced transport delays
into a model with a Gray type controller. This model could produce Cheyne-Stokes
respiration. Later, Milhorn et al. (1965) [77] included cerebral blood ow and a
Gray type controller responsive to Paco2in the brain and Pao2
in the arteries. The
simulated response to a step increase in CO2 was higher than that observed exper-
imentally. In 1967, Grodins et al. [35, 36] extended the earlier model to include
variable delays, cerebral blood ow and a cerebral spinal uid compartment modeling
the e�ects of pH on ventilation. About the same time, Longobardo et al. (1966)
[71] included a Lloyd and Cunningham type controller [67] among other features and
could produce Cheyne-Stokes respiration under various conditions such as congestive
heart condition. However, a large disturbance in ventilation was necessary to precip-
itate these responses. During the eighties, Longobardo et al. (1982) [72] introduced
transitioning to the sleep state and a model for sleep apnea. Khoo et al. (1982) [60]
developed a model in the same family as the Longobardo model which was used to
study the stability properties of the respiratory control system. All of these models
deal only with chemical control of respiration, not neural control. Comprehensive
reviews of the history of respiratory models can be found in Khoo and Yamashiro
[62] and Swanson et al. [112]. The model we are studying was proposed by Khoo,
Kronauer, Strohl and Slutsky [60] and consists of a nonlinear system of delay di�er-
ential equations with multiple delays. One application of this model is to study the
� Version January 26, 1999.y Department of Mathematics, Box 8205, North Carolina State University, Raleigh, North Car-
olina, 27695-8205, ([email protected])z Center for Research in Scienti�c Computation, Box 8205, North Carolina State University,
Raleigh, North Carolina, 27695-8205, ([email protected]).
1

mechanisms producing unstable patterns of breathing such as periodic breathing and
apnea, and speci�cally to investigate the hypothesis that such phenomena represent
the manifestation of feedback-induced instabilities in the respiratory control system
(see e.g. [57, 118, 69, 72, 90, 8, 4]). In 1991, Khoo extended the model to simulate
respiration during sleep. Into this basic model we have incorporated in this paper: a)
variable cardiac output using a model given in [28] thereby allowing the inclusion of
variable delay in the feedback control loop. b) we extended the model to study infant
sleep respiratory patterns including obstructive apnea and central apnea which may
play a role in sudden infant death syndrome (SIDS).
The organization of the paper is as follows. We �rst review the physiology of the
human respiratory system in sections 2 and 3. Section 4 discusses periodic breathing
and apnea. Section 5 describes the derivation of the mathematical model for the basic
human respiration control system. In section 6 we extend the model to include variable
cardiac output and variable delay. Numerical simulations of various physiological
conditions are carried out in section 7 to study instability in respiratory control.
Section 7.1 models the normal adult awake case. Section 7.2 simulates the congestive
heart condition condition. Section 7.3 describes the adaptation of the model to include
respiration during sleep including some aspects of the phenomenon of sleep apnea.
Finally, section 7.4 describes the modeling of infant respiration. The normal awake
condition is simulated in sec 7.4.1. The transition from the awake state to stage four
sleep is simulated in section 7.4.2 and includes instabilities in respiration produced by
apnea due to this transition. An analysis of the infant simulations is given in section
8 and several conclusions are drawn from this analysis.
2. The Human Respiratory System. The purpose of the respiratory system
is to exchange the unwanted gas byproducts of metabolism, such as CO2, for O2, which
is necessary for metabolism. The site of this exchange is the alveoli, small bubble-like
sacs which are found in the lungs. There are approximately 300 million alveoli with
a roughly spherical shape and a diameter of .3 mm. The alveoli represent a surface
area of 50 to 100 square meters, by far the largest surface area of the body interfacing
with the environment. Amazingly, this surface area encompasses a volume of only
four liters. Intertwined among the alveoli are the smallest level of blood vessel, the
capillaries. The blood-gas barrier between alveolus and capillary is extremely thin,
allowing for e�cient di�usion of gases in both directions. The lung generates this large
di�usion area by branching the air pathway through approximately 23 generations of
branches, terminating in the respiratory bronchioles which contain the alveolar ducts
lined with alveoli where the gas transfer occurs. The pulmonary blood vessels also
form a series of branching tubes starting from the pulmonary artery and terminating
in the capillaries which are intertwined with the alveoli and then recombined into
the pulmonary venous system. Gas transfer occurs between the capillaries and the
alveoli. The capillaries form a dense network of tubes 10 microns in diameter in the
walls of the alveoli resulting in an extremely thin blood-gas barrier. Mixed venous
blood collected in the right ventricle of the heart is pumped into the pulmonary
artery which branches successively, terminating in the capillaries. Each red blood
cell spends approximately one second passing through two to three alveoli. The gas
exchange boundary is so e�cient that this is all the time needed for the red blood
cells to completely exchange CO2 for O2 by passive di�usion. The blood is then
collected back in the pulmonary veins and returned to the left auricle and then to
the left ventricle where the blood is pumped to the systemic circulatory system (see
Figure 1). Gas exchange is accomplished solely by passive di�usion ofgases across the
2

RV LV
RA
CAPCAP
PULMONARY SYSTEMIC
VEIN VEIN
ARTERY ARTERY
LUNGTISSUE
LA
Fig. 1.
blood/gas barrier between capillaries and alveoli. The primary determiner of di�usion
is the partial pressure gradients across this barrier. O2 di�uses into the capillaries and
CO2 into the alveoli. O2 is carried in the red blood cell both in a simple dissolve state
and bound to hemoglobin which increases the e�ciency of absorption and storage.
CO2 is carried in three di�erent ways by the blood but, being twenty times more
soluble than O2, the simple dissolved state is more signi�cant for CO2. For e�cient
gas exchange, it is important that blood ow rate and ventilation (air ow) rate be
matched within the various regions of the lung. For comprehensive references on
respiratory physiology, see, for example [80, 126, 18, 82, 47, 104, 5].
3. Summary of the Control System for Respiration. The control mecha-
nism which responds to the changing needs of the body to acquire oxygen and expel
CO2 acts to maintain the levels of these gases within very narrow limits (and to a
less understood degree match ventilation and blood ow). The means by which this
is accomplished is fairly well understood and consists of three components:
� sensors which gather information;
� e�ectors which are nerve/muscle groups which control ventilation; and
� the control processor located in the brain which organizes information and
sends commands to the e�ectors.
The sensory system consists of two main components: the central sensors and the
peripheral sensors; see Figure 2. Since the control processor response to the central
and peripheral sensor information is additive it is common practice to refer to the
peripheral sensory system as the peripheral control and the central sensory system as
the central control. The central sensors are found in the medulla area of the brain
and respond to the level of CO2 partial pressure (and to pH levels as well, though
the mechanism is not well understood [126]). CO2 partial pressure is the main factor
stimulating ventilation [40]. The peripheral chemoreceptors are found in the carotid
bodies located at the bifurcation of the common carotid arteries and the aortic bodies
above and below the aortic arch [40]. These receptors respond to both O2 partial
3

CONTROL OF VENTILATION
CONTROL PROCESSOR
SENSORS EFFECTORS
PONS,MEDULLA
CHEMORECEPTORS RESPIRATORY
MUSCLES
AREAS OF BRAIN
CENTRAL AND PERIPHERAL
INPUT
OUTPUT
Fig. 2.
pressures and CO2 partial pressures. The carotid bodies also respond to pH levels
and are much more important than the aortic bodies in respiratory control. Both
the aortic and carotid bodies act to regulate the cardiovascular system as well [80].
The response of the peripheral receptors is swift due to the relatively high blood ow
through the carotid bodies. The peripheral response to CO2 accounts for only 20 % of
the overall response due to CO2 partial pressure. The other 80 % is due to the central
receptors [69, 126]. There are di�erences in the response pro�les of peripheral and
central receptors to CO2 and O2 levels resulting in a highly intricate set of possible
response signals to the myriad of possible levels of CO2 and O2. The control system
can thus respond successfully to a wide range of conditions. The sensitivity of this
control is such that, regardless of the variation in the daily levels of rest and activity,
the CO2 partial pressure remains within 3 mm of its normal level of 40 mm Hg [126].
We refer the reader to [126, 65, 13, 4, 25] for general references. Delay is introduced
into the control system due to the physical distance which CO2 and O2 levels must be
transported to the sensory sites before the ventilatory response can be adjusted. The
delay in transfer of partial pressure information from lung to chemosensors depends
on cardiac output in general and blood ow rate to the brain in particular. Thus it is
important to know how cardiac output and blood ow rates to various tissue centers
are controlled and in particular how they vary with Paco2, Pao2
and pH (which
are the quantities controlled by the respiratory system). A basic model proposed by
Finchman and Tehrani [28] which describes cardiac output in terms of Paco2and Pao2
is incorporated into the model discussed here (again the pH issue is omitted). This
cardiac output model allows for variable delay in the feedback control loop. There is
an independent and local mechanism by which cerebral blood ow varies with CO2
and O2 levels in the brain. A model of this mechanism was developed by Khoo and
is included in the model.
4. Periodic Breathing . Periodic breathing (PB) is the generic name given to
a number of breathing patterns which are involuntary and have a regular pattern.
The most important forms of PB [57] are:
� Cheyne-Stokes breathing which is illustrated in Figure 3;
4
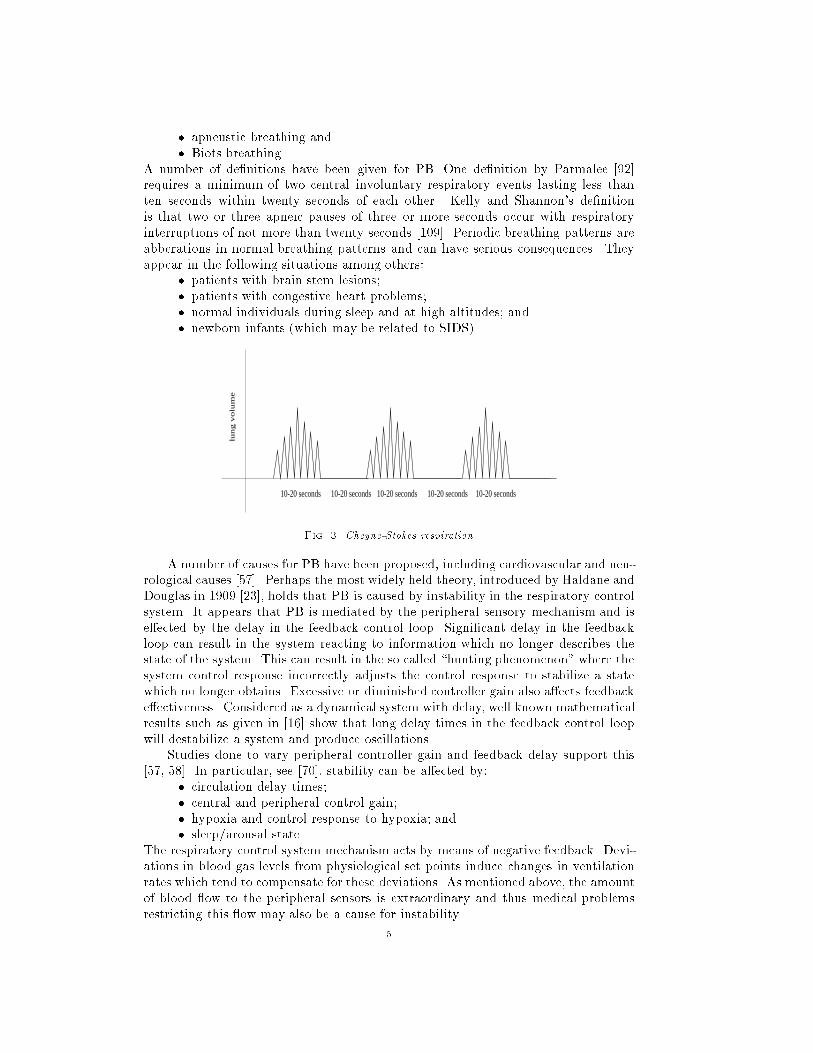
� apneustic breathing and
� Biots breathing.
A number of de�nitions have been given for PB. One de�nition by Parmalee [92]
requires a minimum of two central involuntary respiratory events lasting less than
ten seconds within twenty seconds of each other. Kelly and Shannon's de�nition
is that two or three apneic pauses of three or more seconds occur with respiratory
interruptions of not more than twenty seconds [109]. Periodic breathing patterns are
abberations in normal breathing patterns and can have serious consequences. They
appear in the following situations among others:
� patients with brain stem lesions;
� patients with congestive heart problems;
� normal individuals during sleep and at high altitudes; and
� newborn infants (which may be related to SIDS).
10-20 seconds 10-20 seconds 10-20 seconds 10-20 seconds 10-20 seconds
lung v
olu
me
Fig. 3. Cheyne-Stokes respiration
A number of causes for PB have been proposed, including cardiovascular and neu-
rological causes [57]. Perhaps the most widely held theory, introduced by Haldane and
Douglas in 1909 [23], holds that PB is caused by instability in the respiratory control
system. It appears that PB is mediated by the peripheral sensory mechanism and is
e�ected by the delay in the feedback control loop. Signi�cant delay in the feedback
loop can result in the system reacting to information which no longer describes the
state of the system. This can result in the so called \hunting phenomenon" where the
system control response incorrectly adjusts the control response to stabilize a state
which no longer obtains. Excessive or diminished controller gain also a�ects feedback
e�ectiveness. Considered as a dynamical system with delay, well known mathematical
results such as given in [16] show that long delay times in the feedback control loop
will destabilize a system and produce oscillations.
Studies done to vary peripheral controller gain and feedback delay support this
[57, 58]. In particular, see [70], stability can be a�ected by:
� circulation delay times;
� central and peripheral control gain;
� hypoxia and control response to hypoxia; and
� sleep/arousal state.
The respiratory control system mechanism acts by means of negative feedback. Devi-
ations in blood gas levels from physiological set points induce changes in ventilation
rates which tend to compensate for these deviations. As mentioned above, the amount
of blood ow to the peripheral sensors is extraordinary and thus medical problems
restricting this ow may also be a cause for instability.
5
The sensory mechanisms and the e�ector organs are separated by a physical
distance and thereby introduce transport delays into the control system (see the above
diagrams on the sensory and control systems). Corrective adjustments to ventilation
will be thus delayed and together with changes in controller gain may lead to damped
or sustained oscillations in the control system. Modeling studies have been done to test
this hypothesis. See, for example, [71, 60]. Apnea (lack of ventilation) can occur when
the oscillations in the ventilatory control signal drive the signal to the cuto� point.
Apnea has been associated with the phenomenon of Sudden Infant Death Syndrome
SIDS and thus a fuller understanding of mechanisms producing it is important [111].
5. Model Equations.
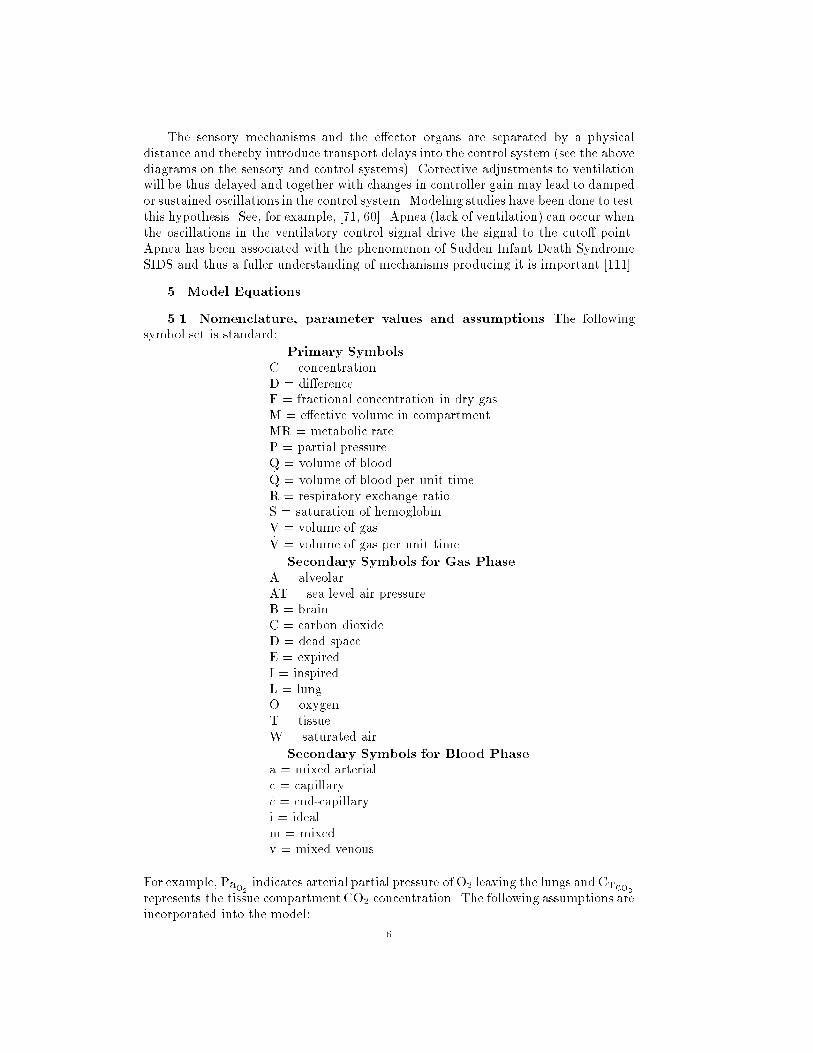
5.1. Nomenclature, parameter values and assumptions. The following
symbol set is standard:
Primary Symbols
C = concentration
D = di�erence
F = fractional concentration in dry gas
M = e�ective volume in compartment
MR = metabolic rate
P = partial pressure
Q = volume of blood_Q = volume of blood per unit time
R = respiratory exchange ratio
S = saturation of hemoglobin
V = volume of gas_V = volume of gas per unit time
Secondary Symbols for Gas Phase
A = alveolar
AT = sea level air pressure
B = brain
C = carbon dioxide
D = dead space
E = expired
I = inspired
L = lung
O = oxygen
T = tissue
W = saturated air
Secondary Symbols for Blood Phase
a = mixed arterial
c = capillary
c = end-capillary
i = ideal
m = mixed
v = mixed venous
For example, Pao2indicates arterial partial pressure of O2 leaving the lungs and CTco2
represents the tissue compartment CO2 concentration. The following assumptions are
incorporated into the model:
6

� Partial pressure assumptions unless otherwise noted (time dependencies are
suppressed for clarity):
PAo2= Pao2
,
PAco2= Paco2
,
PBco2= PB
Vco2,
PBo2= PB
Vo2,
PTco2= PT
Vco2,
PTo2= PT
Vo2
where v = mixed venous blood.
� The alveoli and pulmonary capillaries are single well-mixed spaces.
� Constant temperature, pressure, and humidity are maintained in the gas com-
partment.
� Gas exchange is by di�usion.
� Acid/base bu�ering,material transfer across the blood brain barrier, and tis-
sue bu�ering e�ects are ignored or greatly simpli�ed [36].
� It is assumed that the left and right lungs behave alike, that air ows are
the same in each lung and that the respiratory quotient (RQ is the ratio of
inspired and expired air) is 0.8. The e�ective lung volume is .75 of minute
volume.
� No signi�cant (2 %) intercardiac shunting occurs.
The parameter values in the tables (given in the Appendix) are traditional metric
units:
pressure in mm Hg,
temperature in centigrade,
volume in liters,
ambient pressure 760 mm Hg.
Note that ventilation is conventionally reported at BTPS (body temperature, ambient
pressure, saturated). In contrast, gas volumes in the blood are expressed as STPD
(standard temperature and pressure dry). To convert a gas volume at STPD to
BTPS the adjustment factor of 863
PAT
�PW
is used. The parameter values used in
simulations are found in Tables 1 to 6 (see the Appendix) and sources for these
values are indicated by references in the bibliography. The equations of the studied
model arise from straight-forward development of mass balance equations which are
rearranged through the application of basic physical laws.
5.2. Discussion of lung compartment model equations. We set up the
basic mass transfer equation for alveolar volume and concentration of CO2 using
Fick's law of di�usion:
dVAco2dt
= _Q[CVco2�Caco2
] + _VA[FIco2� FAco2
];
wheredV
Aco2dt
= change in lung CO2 volume,_Q = cardiac output ,_VA = alveolar ventilation (volume of gas entering/min),
FA = alveolar molar fractional part,
7

FI = inspired gas molar fractional part,
Ca = concentration of pulmonary blood leaving lungs,
Cv = concentration of systemic venous blood entering the lungs.
Now using Dalton's Law:
FAco2=
PAco2PAT
�PW
=VAco2MLco2
,
FIco2=
PIco2
PAT
�PW
=VIco2LV
,
we get:
PAco2=
VAco2
MLco2
(PAT � PW).
Substituting into the above mass balance equation yields:
dPAco2dt
=1
MLco2
dVAco2dt
(Pa � PW)
=1
MLco2
f _Q[CVco2� Caco2
](PAT � PW) + _VA[PIco2� PAco2
]g:
Dissociation laws describe the concentration of a chemical carried in solution as a
function of partial pressure and re ect such additional factors as hemoglobin binding
or mitochondrial uptake. These laws represent a modi�cation of Henry's Law. The
same dissociation relationships are assumed to hold in mixed venous blood, body
tissues and the brain. Kco2 , the slope for CO2 dissociation, is assumed to be the
same for all compartments. Now, for concentration measurements in dissociation
laws, CVco2and Caco2
are experimentally measured in STPD. However, BTPS units
are standard for ventilation values. Thus to match the parameter values to BTPS
values, in the �rst term above we introduce the adjustment factor 863
PAT
�PW
which
converts the concentration levels from STPD to BTPS (see, e.g., [126, 12]). We
therefore get:
dPAco2dt
=1
MLco2
h_Q[CVco2
�Caco2]863 + _VA[PIco2
� PAco2]i
=1
MLco2
h863 _QKco2 [PVco
2
� Paco2
] + _VA[PIco2
� PAco2
]i
where the units are BTPS and we use a linear dissociation law:
Caco2= Kco2Paco2
+K1;
CVco2= Kco2PVco2
+K1:
Kco2 and K1 are constants. We now assume that:
PAco2= Paco2
.
8
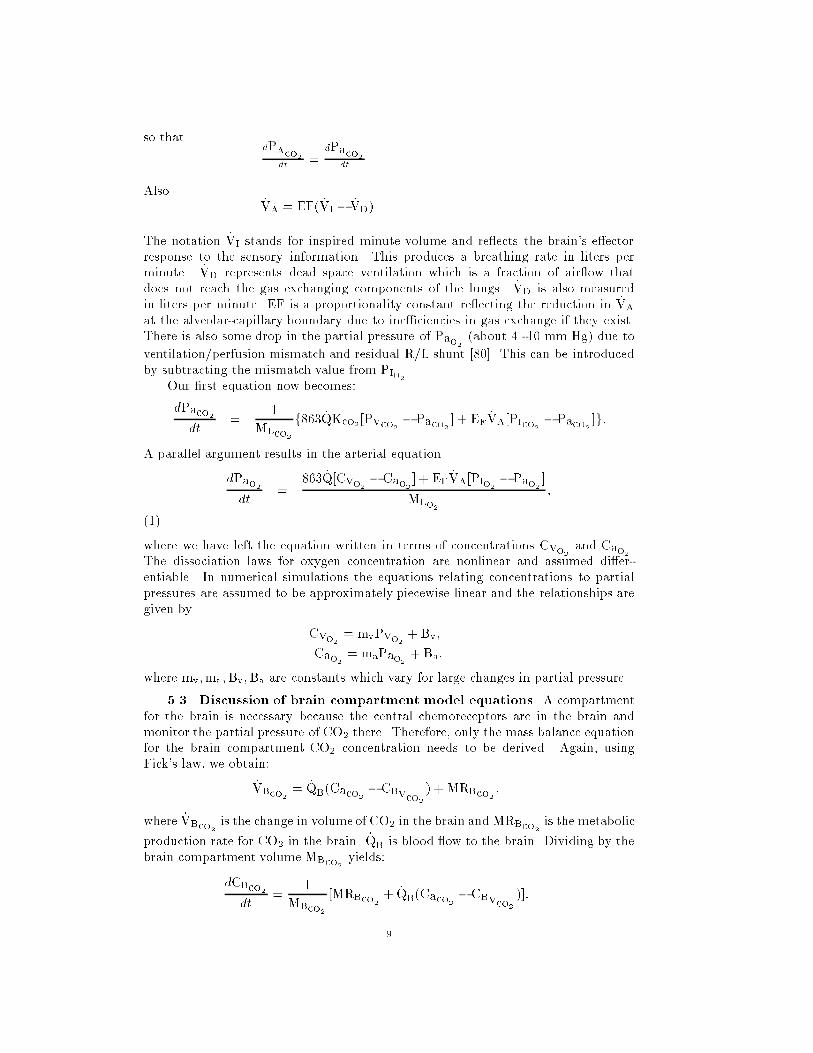
so thatdP
Aco2dt
=dPaco2
dt.
Also_VA = EF( _VI � _VD).
The notation _VI stands for inspired minute volume and re ects the brain's e�ector
response to the sensory information. This produces a breathing rate in liters per
minute. _VD represents dead space ventilation which is a fraction of air ow that
does not reach the gas exchanging components of the lungs. _VD is also measured
in liters per minute. EF is a proportionality constant re ecting the reduction in _VA
at the alveolar-capillary boundary due to ine�ciencies in gas exchange if they exist.
There is also some drop in the partial pressure of Pao2(about 4 -10 mm Hg) due to
ventilation/perfusion mismatch and residual R/L shunt [80]. This can be introduced
by subtracting the mismatch value from PIo2.
Our �rst equation now becomes:
dPaco2dt
=1
MLco2
f863 _QKco2 [PVco2� Paco2
] + EF _VA[PIco2� Paco2
]g:
A parallel argument results in the arterial equation
dPao2dt
=863 _Q[CVo2
� Cao2] + EF _VA[PIo2
� Pao2]
MLo2
;
(1)
where we have left the equation written in terms of concentrations CVo2and Cao2
.
The dissociation laws for oxygen concentration are nonlinear and assumed di�er-
entiable. In numerical simulations the equations relating concentrations to partial
pressures are assumed to be approximately piecewise linear and the relationships are
given by
CVo2= mvPVo2
+Bv;
Cao2= maPao2
+Ba:
where mv;ma;Bv;Ba are constants which vary for large changes in partial pressure.
5.3. Discussion of brain compartment model equations. A compartment
for the brain is necessary because the central chemoreceptors are in the brain and
monitor the partial pressure of CO2 there. Therefore, only the mass balance equation
for the brain compartment CO2 concentration needs to be derived. Again, using
Fick's law, we obtain:
_VBco2= _Q
B(Caco2
� CBVco2
) + MRBco2;
where _VBco2is the change in volume of CO2 in the brain and MRBco2
is the metabolic
production rate for CO2 in the brain. _QBis blood ow to the brain. Dividing by the
brain compartment volume MBco2yields:
dCBco2dt
=1
MBco2
[MRBco2+ _Q
B(Caco2
�CBVco2
)]:
9
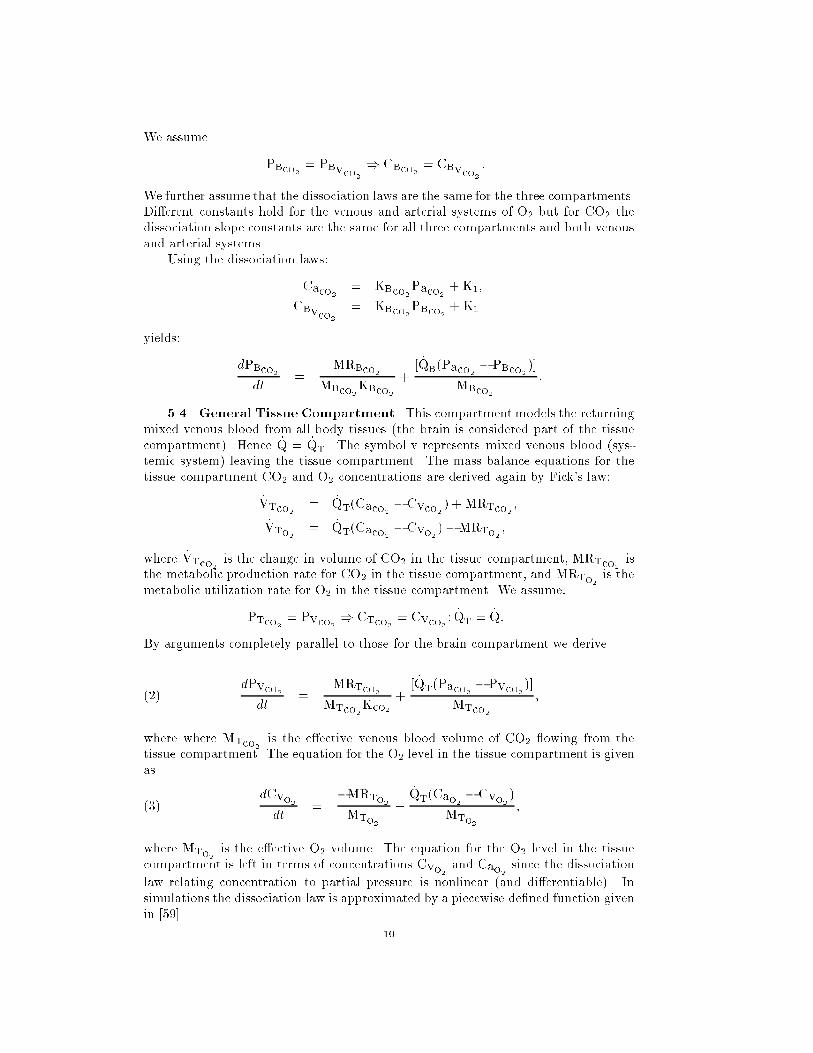
We assume
PBco2= PB
Vco2) CBco2
= CBVco2
:
We further assume that the dissociation laws are the same for the three compartments.
Di�erent constants hold for the venous and arterial systems of O2 but for CO2 the
dissociation slope constants are the same for all three compartments and both venous
and arterial systems.
Using the dissociation laws:
Caco2= KBco2
Paco2+ K1;
CBVco2
= KBco2PBco2
+ K1
yields:
dPBco2dt
=MRBco2
MBco2KBco2
+[ _Q
B(Paco2
� PBco2)]
MBco2
:
5.4. General Tissue Compartment. This compartment models the returning
mixed venous blood from all body tissues (the brain is considered part of the tissue
compartment). Hence _Q = _QT. The symbol v represents mixed venous blood (sys-
temic system) leaving the tissue compartment. The mass balance equations for the
tissue compartment CO2 and O2 concentrations are derived again by Fick's law:
_VTco2= _Q
T(Caco2
� CVco2) + MRTco2
;
_VTo2= _Q
T(Caco2
� CVo2) �MRTo2
;
where _VTco2is the change in volume of CO2 in the tissue compartment, MRTco2
is
the metabolic production rate for CO2 in the tissue compartment, and MRTo2is the
metabolic utilization rate for O2 in the tissue compartment. We assume:
PTco2= PVco2
) CTco2= CVco2
; _QT= _Q:
By arguments completely parallel to those for the brain compartment we derive
dPVco2dt
=MRTco2
MTco2Kco2
+[ _Q
T(Paco2
� PVco2)]
MTco2
;(2)
where where MTco2is the e�ective venous blood volume of CO2 owing from the
tissue compartment. The equation for the O2 level in the tissue compartment is given
as
dCVo2dt
=�MRTo2MTo2
+_QT(Cao2
� CVo2)
MTo2
;(3)
where MTo2is the e�ective O2 volume. The equation for the O2 level in the tissue
compartment is left in terms of concentrations CVo2and Cao2
since the dissociation
law relating concentration to partial pressure is nonlinear (and di�erentiable). In
simulations the dissociation law is approximated by a piecewise de�ned function given
in [59].
10

controller
central
compartment
brain tissue lung to braindelay
delaylung to carotid
delaytissue
ΣΣspace compartment
lungdead
heart
mixing in
tissuecompartment
peripheralcontroller
PamO2
PvCO2
PaCO2
PaO2
PamCO2
PvO2PvCO2
PamCO2
PbCO2
PvO2 SHUNT
PamCO2PamO2
PamCO2
PamO2
MODEL SCHEMATIC DIAGRAM WITH DELAYS
Fig. 4. Respiratory system delays
5.5. Introducing delay into the model. The following symbol set is used to
indicate the variables :
�B = lung to brain delay
= lung to tissue transport delay
�V = venous side transport delay from tissue to lung
�a = lung to carotid artery delay
Figure 4 shows a schematic diagram of how the delays are incorporated into the model.
It is also noted that these delays vary with blood ow.
With the delays added to the model we have the following system of equations:
dPaco2(t)
dt=
863 _QKco2 [PVco2(t� �V) � Paco2
(t)]
MLco2
+EF _VA[PIco2
� Paco2(t)]
MLco2
;
dPao2(t)
dt=
863 _Q[CVo2(t� �V)�Cao2
(t)]
MLo211

+EF _VA[PIo2
� Pao2(t)]
MLo2
;
dPBco2(t)
dt=
MRBco2MBco2
KBco2
+[ _Q
B(Paco2
(t� �B) � PBco2(t))]
MBco2
;
dPVco2(t)
dt=
MRTco2MTco2
Kco2+[ _Q
T(Paco2
(t � �T) � PVco2(t))]
MTco2
;
dCVo2(t)
dt=
_QT[Cao2
(t� �T)� CVo2(t)]�MRTo2
MTo2:
5.6. The Control Equation. The following control equation will be used in
the model:
_VI = GP exp (�:05Pao2(t� �a))(Paco2
(t � �a)� IP)
+GC(PBco2(t)�
MRBco2
Kco2_QB
� IC):
This equation is derived based on the following observations. There are two funda-
mental mechanisms controlling the ventilation rate _VI: the central controller and the
peripheral controller. In fact, the above model for the control variable is derived based
on the following observations:
� The central controller responds exclusively to Pco2 via production of H+ ions.
(hypoxia-independent) [126].
� The peripheral controller consists of the carotid receptors found in the angle
of the bifurcation of the common carotid arteries, as well as chemoreceptors
in the aortic arch. They respond to both O2 and CO2 via Pco2 and Po2(hypoxia dependent) [126].
� For �xed Po2 ,_VI varies linearly with Pco2 .
� The e�ect of Po2 on_VI for �xed Pco2 is exponential [126].
� Berger and West [4, 126] indicate that the peripheral Po2 interacts multi-
plicatively with the peripheral Pco2 e�ect.
� The e�ect of the peripheral controller represents approximately 25% of the
overall control stimulus response to Pco2 [126].
� The peripheral and central control e�ects are additive [19].
Thus:
_VI = _Vperiph + _Vcent;
where _Vcent is the ventilation due to the central control signal and _Vperiph is the
ventilation due to the peripheral control signal. Physiologically, we do not assign any
meaning to a negative _VI, _Vperiph or _Vcent. Let _VP be the function de�ning ventilation
due to the peripheral control signal and _VC be the function de�ning ventilation due
to the central control signal. Then, we set _VP and _VC equal to zero should these
functions become negative. Using the following notation
[[x]] =nx for x � 0
0 for x < 0.
the control equation actually takes the form
_VI = [[ _VP]] + [[ _VC]]
12

However, to simplify our discussion, we will omit this notation while always main-
taining that the peripheral and central ventilation rates will be greater than or equal
to zero. For the peripheral control we will use:
_VP = GP exp (�:05Pao2(t))(Paco2
(t)� IP));
with GP denotes the peripheral gain factor, IP denotes the apneic threshold for
peripheral CO2 response, and Paco2denotes the arterial partial pressure CO2 at the
entrance. An equation for _VC is established in [98, 78] for the steady state response
of _VC to a step increase of P�aco2and is given by:
_VC = GC(P�aco2� IC));
where IC is the apneic threshold, GC is the controller gain, and P�aco2is the arterial
partial pressure CO2 at the entrance to the brain compartment.
However the central controller has been shown to react to PBco2. The relation
between PBco2and P�aco2
comes from solving at steady state the following di�erential
equation:
dPBco2(t)
dt=
MRBco2MBco2
KBco2
+[ _Q
B(P�aco2
(t)� PBco2(t))]
MBco2
:
Suppressing time dependencies for clarity we have:
dPBco2dt
=MRBco2
MBco2Kco2
+[ _Q
B(P�aco2
� PBco2)]
MBco2
;
which implies
P�aco2=
MBco2_QB
dPBco2dt
�MRBco2
Kco2_QB
+PBco2:
And under the steady state assumption:
dPBco2dt
= 0:
We derive:
P�aco2= �
MRBco2
Kco2_QB
+ PBco2:
By substituting this expression for P�aco2into the above equation for _VC yields:
_VC = GC(PBco2�
MRBco2
Kco2_QB
� IC):
Introducing the delay to the peripheral control, time dependencies and summing the
two drive components we arrive at:
_VI = GP exp (�:05Pao2(t� �a))(Paco2
(t � �a)� IP)
+GC(PBco2(t)�
MRBco2
Kco2_QB
� IC):
13

Oxygen saturation So2 is a measure of oxygen content (hence Pao2) in the blood.
So2 re ects the percent of hemoglobin molecules fully bound with O2. The equation
for So2 is cited in [60]:
So2 = 100(1� 2:4 exp (�:05Pao2))
To allow for a residual peripheral response at hyperoxia a small term is added to
the control equation by rewriting it in the following way:
_VP = GP(102:4� So2 )(Paco2(t � �a)� IP)
Note that in this form the peripheral response depends on oxygen saturation. and
the factor GP will be smaller by a factor of 100. This form of the peripheral control
is used in the simulations for adults, the form without residual errct is used for
infants. With the parameter values given in the appendix the peripheral response
represents 25% of the total controller response and the CO2 sensitivity translates to
2.2 liter/min/mmHg.
Controller function _VI represents general ventilatory drive in liters/minute. Tidal
volume or breath by breath simulation can be obtained by considering the details of
a single breath. During inspiration the �rst segment of air is left-over exhaled air
remaining in the dead space of the lungs (the branching tubes which do not exchange
gases). This volume is approximately 150 ml for an adult. Neither this air nor expired
air provides the same volumes of CO2 and O2 compared to fresh air. Hence _VI will be
replaced in the state equations by _Ve� as follows. On the �rst segment of inspiration
(until the stale air in the dead space has passed into the lungs) _Ve� should be a reduced
level of _VI. During the remaining segment of inspiration _Ve� should equal _VI. Finally
during expiration _Ve� will again be a reduced level of _VI. In practice, we alter the value
of EF in the state equations for Paco2and Pao2
to reduce _VI. Furthermore, MLco2and MLo2
are varied during inspiration and expiration depending on _VI (see Khoo et
al. [61] for details). The actual chemical drive in the model will be proportionally
larger to force the ow of fresh air through the lung compartment during the fresh air
phase of inspiration (a factor of about 2.5). A small alveolar-arterial oxygen gradient
(A-a) O2 is assumed to account for ventilation/perfusion mismatch and a residual
R-L shunt in adults [80]. Breath by breath calculations can be found as:
Vtidal=tI_VI ,
where tI = time of inspiration (around 1.5 sec)_VI = inspiration drive in liters per minute
6. Blood Flow and Variable Delay. Blood ow to various regions of the body
depends on a large number of factors including cardiac output, blood pressure, cross-
section of arteries and partial pressures of CO2 and O2 in the blood. Blood ow in
various regions of the body depends on both central mechanisms of control and on
local mechanisms in the region (see, e.g.,[101, 40] for details). Blood ow regulation is
a very complicated phenomenon and the subject of ongoing research (see, e.g., [53] for
an extensive cardiovascular model). Transport delays, in turn, depend on the blood
ow rates to various areas. On �rst leaving the heart, arterial blood ow depends on
cardiac output. As blood ow branches to special areas such as the brain, this ow
rate becomes dependent also on local mechanisms of control. Cardiac output itself
14

depends on the interaction of a number of factors including Paco2and Pao2
[101].
Holding other factors constant, a relation between _Q, Paco2and Pao2
is given by
Richardson et al. [101] and a model re ecting these relations is given by Finchman
and Tehrani [28]. We have incorporated these factors into the model. Cerebral blood
ow is controlled locally in the brain by restricting or expanding the arterial vessels.
The degree of constriction depends on the levels of Paco2and Pao2
in the brain. This
phenomenon has been described by Lambertsen [65] and a model re ecting the data
given by Lambertsen has been developed by Khoo [55] and is a part of this model. To
calculate the transport delay from the lung to the chemosensors in the brain we need
�rst to calculate the delay involved in transporting from the lung to the branching of
the carotid artery leading to the brain. Secondly, the delay involved from the carotid
artery entrance to the peripheral sensors must be calculated. Thirdly, the delay from
the peripheral sensors to the central sensor in the brain itself must be calculated. The
former delay depends on _Q and the volume of the arterial branch from lung to carotid
while the latter delays depend on _QBand the volumes of the vascular segments from
the carotid artery to the peripheral sensor and from there to the central sensor in the
brain. Data for the various volume segments are found in Table 4. Using the history
of _Q and _QBand the relevant volumes, the transport delays are found by integrating
the blood ow rates backward in time until the volumes are �lled. Similar calculations
give the delay to the peripheral sensors in the carotid bodies.
7. Simulations of Human Respiratory Physiology. Simulations of various
conditions are carried out using appropriate parameter values chosen to re ect these
conditions. We present here simulations of the adult steady state and congestive
heart condition using the parameter values given in [60]. These parameters and initial
conditions are found in the various tables at the end of this paper. The delay times are
calculated by integrating backward the blood ow rates until the volumes are reached
for the arterial segments leading from the lung to the site of the sensory elements. The
values used for these volumes are found in [36]. Numerical solutions are obtained using
SNDDELM,a code developed by Lo and Jackiewicz [68] for the numerical solution
of systems of neutral delay di�erential equations with state-dependent delays using
Adams predictor-corrector methods. We are indebted to the authors for allowing us
to use this robust code to perform all simulations reported in this paper.
7.1. Normal Awake Adult Case. Figures 5-7 represent the steady state levels
for the system variables in a normal adult awake case. The simulated values for
partial pressures,tidal volume and blood ow are consistent with the data presented
in [85, 80, 59, 47].
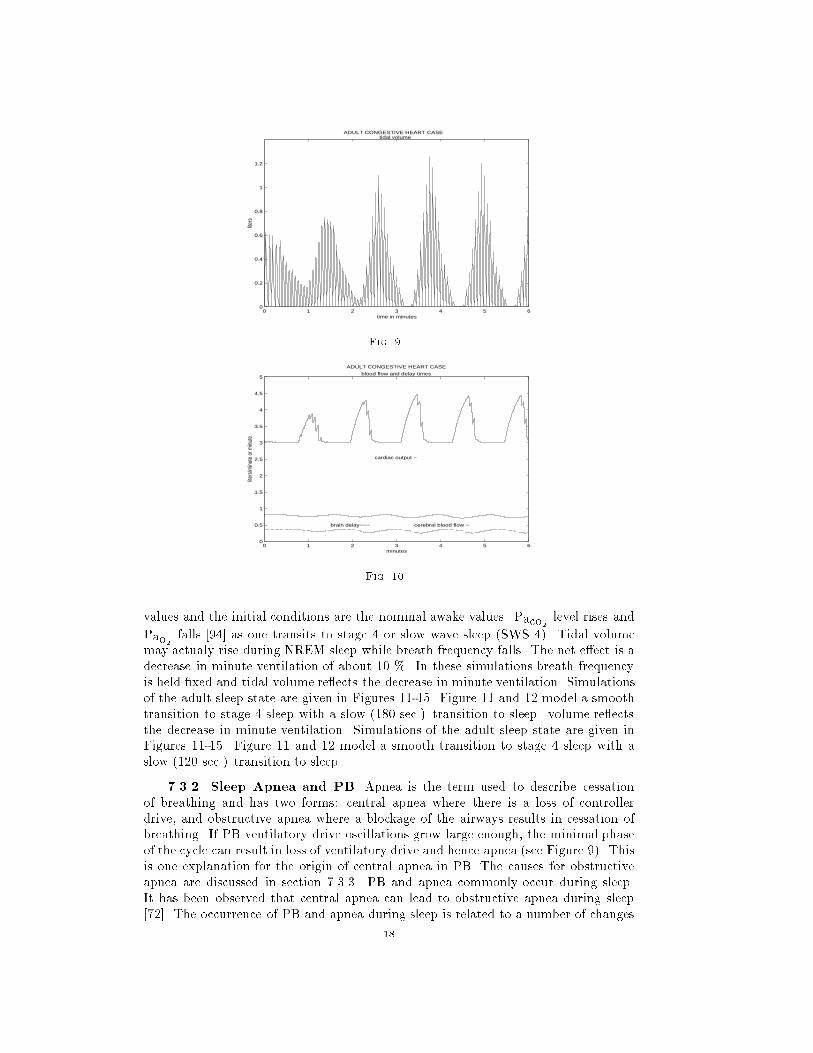
7.2. Congestive Heart Condition. Figures 8-10 represent simulations using
parameter values suggestive of the congestive heart condition. For this case, _Q is
reduced to one half the normal level and hence the transport delays are doubled. This
causes instability in the system resulting in central apnea (CA) and periodic breathing
as can be seen in Figure 9. Cheyne-Stokes respiration (CSR) is exhibited. Early
studies [41, 96] suggested that excessive delay timemight be the prime cause of (CSR).
Current research suggests that a number of factors contribute to the phenomenon. For
instance, it has been found that the application of continuous positive airway pressure
(CPAP) acts to counter the onset of CSR [84]. Also, hypocapnia is an important factor
in CSR in congestive heart failure and circulatory delay plays an important role in
determining CSR-CA cycle length [83]. Excessive circulatory delay time certainly
contributes to the \hunting phenomenon" �rst suggested by Douglas and Haldane to
15

2 2.5 3 3.5 4 4.5 5 5.5 60
20
40
60
80
100
120
mm
Hg
time in minutes
ADULT AWAKE CASE partial pressures
PaO2 ___
PaCO2 ___
PbCO2 − − − PvCO2 . . . .
PvO2 ._._._.
asleep
Fig. 5.
2 2.5 3 3.5 4 4.5 5 5.5 60
0.2
0.4
0.6
0.8
1
ADULT AWAKE CASEtidal volume
time in minutes
liters
Fig. 6.
account for PB and CSR [58]. Simulations with the above model show that for certain
values of controller gain, very long delay times may not produce oscillations but with
other controller gain values such as used in the simulations in Figures 8-10 oscillations
are produced.
7.3. Modeling Sleep.
7.3.1. Basic Sleep Condition. The sleep condition involves a number of dif-
ferent states and stages with di�erent physiological pro�les. As one passes from stage
1 sleep (S1) to stage 4 sleep (S4) the CO2 response curve shifts rightward, response
to overall ventilatory drive diminishes and muscle resistance to the upper airways
and other muscle groups related to breathing increases. These e�ects are referred to
as loss of the "wakefulness stimulus" [99, 59]. Once stage 4 is reached the sleeper
shifts between non rapid eye movement sleep (NREM) and rapid eye movement sleep
(REM). These two states have signi�cant physiological di�erences which a�ect the
stability of the respiratory control system [15]. In 1991, Khoo [55] adapted the basic
model to re ect the loss of wakefulness stimuli and model NREM sleep. The model
equations re ecting these facts are:
_Vs = Gw[[ _VI � Sw ]]16
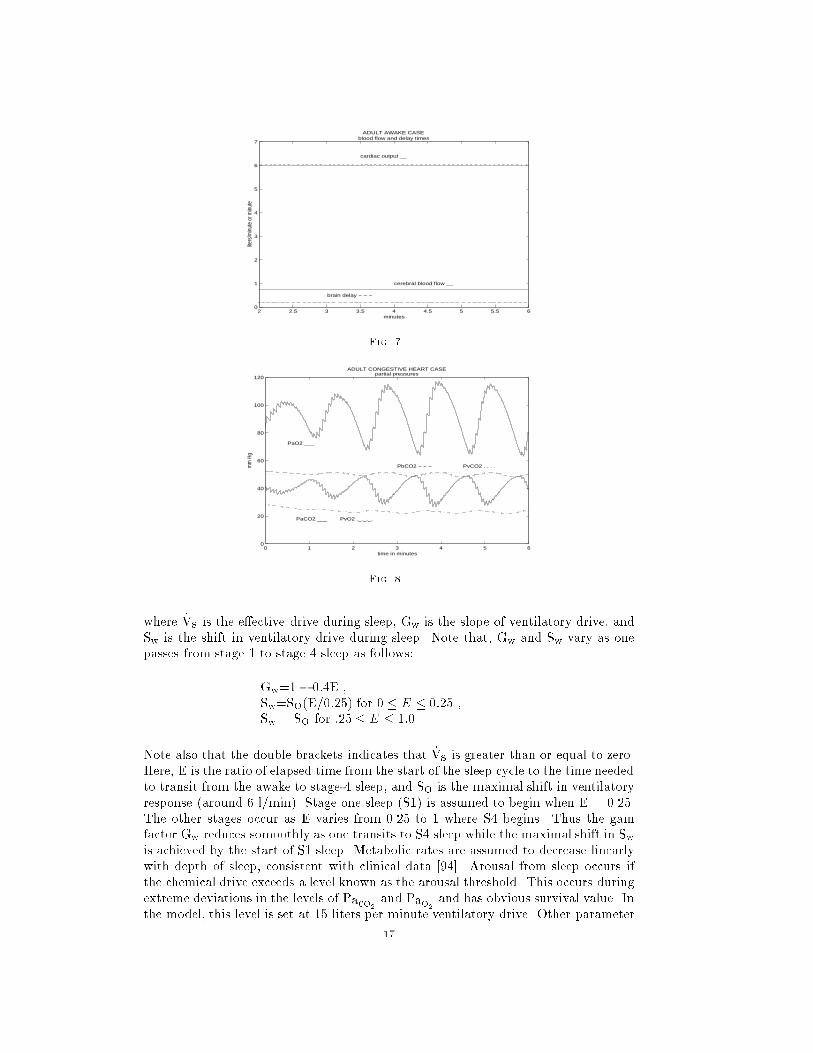
2 2.5 3 3.5 4 4.5 5 5.5 60
1
2
3
4
5
6
7
ADULT AWAKE CASE blood flow and delay times
brain delay − − −
cerebral blood flow __
cardiac output __
minutes
liters
/min
ute
or m
inut
e
Fig. 7.
0 1 2 3 4 5 60
20
40
60
80
100
120
mm
Hg
time in minutes
ADULT CONGESTIVE HEART CASE partial pressures
PaO2 ___
PaCO2 ___
PbCO2 − − − PvCO2 . . . .
PvO2 ._._._.
Fig. 8.
where _Vs is the e�ective drive during sleep, Gw is the slope of ventilatory drive, and
Sw is the shift in ventilatory drive during sleep. Note that, Gw and Sw vary as one
passes from stage 1 to stage 4 sleep as follows:
Gw=1� 0:4E ,
Sw=SO(E=0:25) for 0 � E � 0:25 ,
Sw = SO for :25 � E � 1:0 .
Note also that the double brackets indicates that _Vs is greater than or equal to zero.
Here, E is the ratio of elapsed time from the start of the sleep cycle to the time needed
to transit from the awake to stage-4 sleep, and SO is the maximal shift in ventilatory
response (around 6 l/min). Stage one sleep (S1) is assumed to begin when E = 0.25.
The other stages occur as E varies from 0.25 to 1 where S4 begins. Thus the gain
factor Gw reduces somoothly as one transits to S4 sleep while the maximal shift in Swis achieved by the start of S1 sleep. Metabolic rates are assumed to decrease linearly
with depth of sleep, consistent with clinical data [94]. Arousal from sleep occurs if
the chemical drive exceeds a level known as the arousal threshold. This occurs during
extreme deviations in the levels of Paco2and Pao2
and has obvious survival value. In
the model, this level is set at 15 liters per minute ventilatory drive. Other parameter
17
0 1 2 3 4 5 60
0.2
0.4
0.6
0.8
1
1.2
ADULT CONGESTIVE HEART CASEtidal volume
time in minutes
liter
s
Fig. 9.
0 1 2 3 4 5 60
0.5
1
1.5
2
2.5
3
3.5
4
4.5
5
ADULT CONGESTIVE HEART CASE
blood flow and delay times
brain delay−−− cerebral blood flow −
cardiac output −
minutes
liters
/min
ute
or m
inut
e
Fig. 10.
values and the initial conditions are the nominal awake values. Paco2level rises and
Pao2falls [94] as one transits to stage 4 or slow wave sleep (SWS 4). Tidal volume
may actualy rise during NREM sleep while breath frequency falls. The net e�ect is a
decrease in minute ventilation of about 10 %. In these simulations breath frequency
is held �xed and tidal volume re ects the decrease in minute ventilation. Simulations
of the adult sleep state are given in Figures 11-15. Figure 11 and 12 model a smooth
transition to stage 4 sleep with a slow (180 sec.) transition to sleep. volume re ects
the decrease in minute ventilation. Simulations of the adult sleep state are given in
Figures 11-15. Figure 11 and 12 model a smooth transition to stage 4 sleep with a
slow (120 sec.) transition to sleep.
7.3.2. Sleep Apnea and PB. Apnea is the term used to describe cessation
of breathing and has two forms: central apnea where there is a loss of controller
drive, and obstructive apnea where a blockage of the airways results in cessation of
breathing. If PB ventilatory drive oscillations grow large enough, the minimal phase
of the cycle can result in loss of ventilatory drive and hence apnea (see Figure 9). This
is one explanation for the origin of central apnea in PB. The causes for obstructive
apnea are discussed in section 7.3.3. PB and apnea commonly occur during sleep.
It has been observed that central apnea can lead to obstructive apnea during sleep
[72]. The occurrence of PB and apnea during sleep is related to a number of changes
18
which occur during sleep as described above in section 7.3.1. These e�ects include
the right shift in the CO2 apneic threshold, e�ects on the central control gain and
the reduction in the body's response to the ventilatory drive produced by the central
and peripheral control signals. These e�ects are caused by chemical and neurological
changes occuring in the body and brain as a result of the sleep state [99]. Apneas
can constitute as much as 20-50 % of total cycle time of PB during sleep [72]. The
phenomena just described have been modeled in several papers (see, for example,
[55, 72, 56]).
Infants commonly experience apnea during sleep. The length of apneic spells in
infants less than 6 months old is normally less than 10 seconds. Longer periods have
clinical signi�cance [46]. Periodic breathing and apnea have been linked to sudden
infant death in many studies and is an ongoing topic of research [111].
PB occurs during both REM sleep and NREM sleep but the PB associated with
NREM sleep is more regular with more or less constant breathing intervals and apneic
periods [102]. PB in REM sleep is more disorganized. In infants 1 month old, 4 %
of sleep time is in some form of PB [109]. Apneas are more common during REM
sleep and more often associated with bradychardia, but apnea and bradychardia may
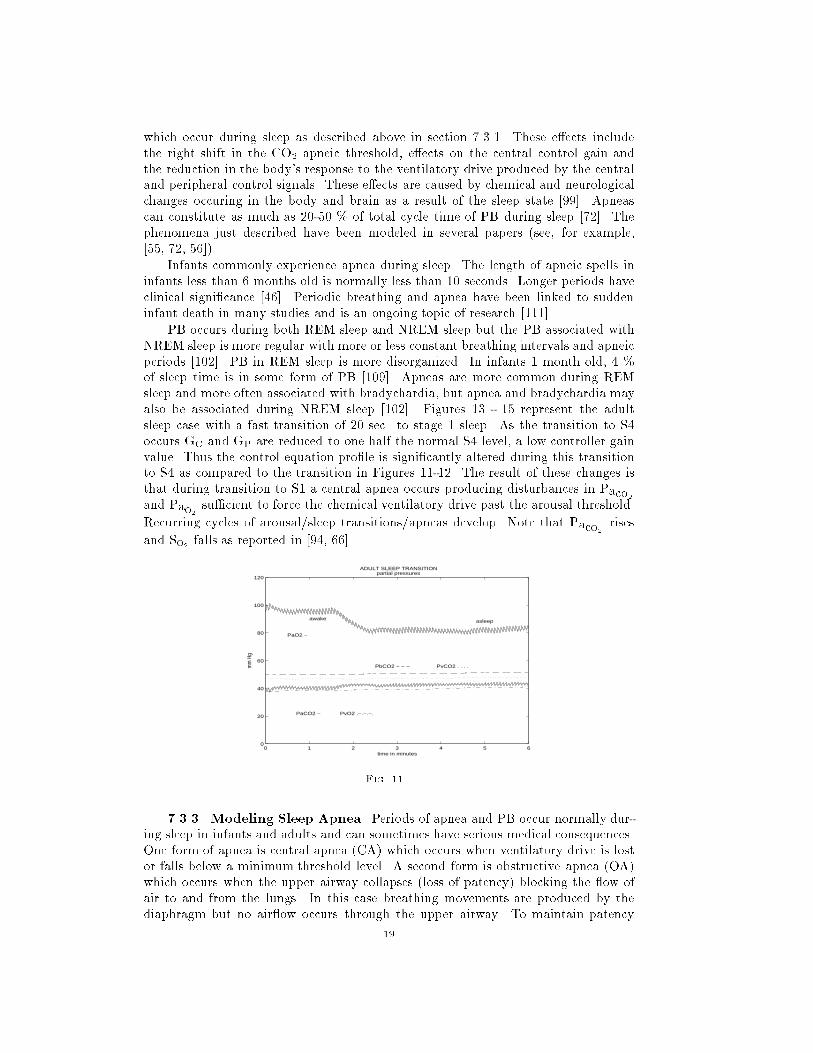
also be associated during NREM sleep [102]. Figures 13 - 15 represent the adult
sleep case with a fast transition of 20 sec. to stage 1 sleep. As the transition to S4
occurs GC and GP are reduced to one half the normal S4 level, a low controller gain
value. Thus the control equation pro�le is signi�cantly altered during this transition
to S4 as compared to the transition in Figures 11-12. The result of these changes is
that during transition to S1 a central apnea occurs producing disturbances in Paco2and Pao2
su�cient to force the chemical ventilatory drive past the arousal threshold.
Recurring cycles of arousal/sleep transitions/apneas develop. Note that Paco2rises
and So2 falls as reported in [94, 66].
0 1 2 3 4 5 60
20
40
60
80
100
120
mm
Hg
time in minutes
ADULT SLEEP TRANSITION partial pressures
PaO2 −
PaCO2 −
PbCO2 − − − PvCO2 . . . .
PvO2 .−.−.−.
awake asleep
Fig. 11.
7.3.3. Modeling Sleep Apnea. Periods of apnea and PB occur normally dur-
ing sleep in infants and adults and can sometimes have serious medical consequences.
One form of apnea is central apnea (CA) which occurs when ventilatory drive is lost
or falls below a minimum threshold level. A second form is obstructive apnea (OA)
which occurs when the upper airway collapses (loss of patency) blocking the ow of
air to and from the lungs. In this case breathing movements are produced by the
diaphragm but no air ow occurs through the upper airway. To maintain patency
19

0.5 1 1.5 2 2.5 3 3.5 4 4.5 5 5.5 60
0.2
0.4
0.6
0.8
1
1.2
1.4
1.6
ADULT SLEEP TRANSITION
tidal volume
awake
sleep
time in minutes
liters
Fig. 12.
0 1 2 3 4 5 60
20
40
60
80
100
120
mm
Hg
time in minutes
ADULT APNEA CASE partial pressures
PaO2 −
PaCO2 −
PbCO2 − − − PvCO2 . . . .
PvO2 .−.−.−.
awake
asleep
Fig. 13.
there are muscle groups which act to dilate the upper airway path and maintain a
free air ow from the nose through the nasopharynx, pharynx and larynx to the lower
airway or trachea. The ventilatory control system stimulates both the respiratory
muscles in the diaphragm and the muscle groups dilating the upper airway. This is
necessary since the diaphragm acts to expand the lungs resulting in a negative air
pressure or vaccuum which pulls air into the lungs. This negative pressure also acts
to pull the upper airway closed. The dilating muscles oppose this pressure.
During the awake stage, the general e�ects of the awake condition and the in-
teraction of neurological, chemo-ventilatory drive and conscious control remove any
possibility for OA to occur. However, during sleep a number of factors change. In the
�rst place, the only control of respiration is due to the chemoreceptor system. Sec-
ondly, as discussed above (section 7.3.1), the transition to sleep a�ects the response of
the respiratory control system to the signals produced by the chemoreceptors. This ef-
fect is referred to as removal of the "wakefulness stimulus". Several models have been
developed to describe the phenomenon of OA. Some research indicates that the e�ect
of withdrawal of the wakefulness stimulus on the diaphragm and upper airway mus-
cles are disproportionate (a�ecting the upper airway more) see, e.g., [117, 72, 125, 32].
In this case, the negative pressure due to the e�ect of the ventilatory drive on the
thoraxic muscles may overcome the dilational force of the airway muscles resulting
20

0.5 1 1.5 2 2.5 3 3.5 4 4.5 5 5.5 60
0.2
0.4
0.6
0.8
1
1.2
1.4
1.6
ADULT APNEA CASE
tidal volume
awake
sleep
time in minutes
liters
Fig. 14.
1 1.5 2 2.5 3 3.5 4 4.5 5 5.5 60
0.1
0.2
0.3
0.4
0.5
0.6
0.7
0.8
0.9
ADULT APNEA CASE
blood flow and delay times
brain delay − − −
cerebral blood flow −
carotid delay ....
minutes
liters
/min
ute
or m
inut
e
Fig. 15.
in upper airway collapse [117, 14]. It is also possible that the sleep state produces
di�erent response thresholds in the various muscle groups which results in dispropor-
tionate response to ventilatory drive [14]. Other research indicates that the reduction
in muscle tone and e�ectiveness is proportional for all muscle groups involved in res-
piration and therefore no such antagonism between the diaphragm and upper airway
muscles would account for OA [2, 21, 124]. In this case OA may be produced by
a nonexcessive reduction in upper airway muscle activity during sleep acting on a
geometrically small airway lumen [7].
Due to the e�ect of withdrawal of the wakefulness stimulus during sleep ven-
tilatory drive does not need to reach zero before air ow ceases. Su�ciently low
ventilatory drive will result in loss of respiratory muscular response and central apnea
(CA). The cessation of breathing may also cause the upper airway to collapse. Ven-
tilatory drive must rise to a high level to reopen the airway [15, 91]. Khoo modeled
this form of apnea (mixed apnea) by reducing to zero the e�ective ventilatory drive
whenever this drive reaches a level too low to maintain upper airway patency. It is
assumed that ventilation does not begin again until arousal occurs [59]. In this case
the original cessation in breathing due to low drive may be viewed as a central apnea
which causes collapse of the airway. Ventilatory drive (above the minimum level) will
not be able to reopen the airway until arousal occurs and this may be viewed as OA.
21

This model for the development of OA captures the salient features of low ventilatory
drive (central apnea) producing obstruction which is not terminated until arousal [7]
and the restoration of the wakefulness stimulus restores patency and uppper airway
muscle e�cacy. Central apnea may also be produced during the transition to sleep if
the decrease in nonmetabolic respiratory stimuli will not allow ventilatory muscle ac-
tivation until Paco2rises to the higher sleep set point which then produces ventilatory
drive high enough to activate ventilatory muscles [6].
In this model we consider only the withdrawal of the wakefulness stimulus suf-
�cient to produce transient reduction in ventilatory drive past a minimal threshold.
This will be interpreted as a central apnea. We will assume that this apneic episode
will terminate only with arousal. Arousal will be triggered by the chemical ventilatory
stimulus rising above an arousal threshold level. Arousal will reset the control mech-
anism to its awake parameter values. A new transition to sleep will then commence.
Apnea in infants is a more complicated phenomenon. Central apnea is common
while obstructive apnea is more rare and includes a condition of partial airway coll-
pase. Little is known about the mechanisms which terminate an apneic episode of
either kind. However, arousal is an important factor and is a protective response
to dangerous conditions during sleep [30]. De�nitions of arousal are not fully stan-
dardized and include EEG arousal,movement arousal and behavioral arousal. Not
all apneas end through arousal [31] however one important study of infants with in-
creased upper airway resistance exhibited an abnormal number of EEG arousals [39].
Miniarousals de�ned by Hoppenbrouwers as movement after apnea [49] have been
reported in preterm and fullterm infants [49]. Miniarousals which prevent prolonged
OA seem to occur in infants [31]. Litle is de�nitively known about the causes for and
termination of apnea in infants.
We will model the apneic mechanism as a black box. If ventilatory drive falls
below a minimumthreshold breathing will terminate. This will signify a central apnea.
Breathing will not begin again until the chemical stimulus rises to a su�cielntly high
level which will be termed the arousal threshold. This will trigger e�ective arousal
and a resetting of the awake ventilatory control parameters. In this study we consider
the e�ects of arousal and recycling the sleep transition process on respiratory stability.
7.4. Modeling Infant Respiration.
7.4.1. Basic Considerations. In modeling the respiratory processes of infants
we use allometric scaling for physical parameters. The nominal parameter values in
the tables are for a typical 70 kg adult and a 3.2 kg infant at birth. Weight scaling for a
3-4 month old infant can be found in [119]. Comparative data for physical parameters
can be found in [85, 1]. Initial partial pressure data can be found in [103, 81, 74]
and control system parameters are taken from [113, 86, 87, 100]. The dissociation
parameters for O2 vary during the early developmental stages for infants as fetal
hemoglobin is replaced by adult hemoglobin. This transition is completed during
the �rst 6 months after which the O2 dissociation curve and loading characteristics
approach that of adults [20]. The so-called paradoxical response to hypoxia disappears
after the �rst two weeks [34]. Signi�cant functional closure of the Foramen Ovale and
the Ductus Arteriosus are assumed [79, 75, 1] with a remaining 5 % shunt of blood
from the systemic venous return to systemic arterial blood ow assumed. There is
an overall drop in Pao2between the level PAo2
in the alveoli and the Pao2level
entering the tissue compartment. Part of this drop is due to the RL shunt and part
is due to ventilation/perfusion mismatch in the lungs denoted as DA-cap [85]. Since
22

the RL shunt for infants is larger than for adults it is not appropriate to assume that
PAo2is equal to Pao2
. From this point on Pao2will represent the partial pressure of
O2 leaving the lung capillary system.The equations relating the state variable Pao2and the partial presssure of O2 entering the tissue compartment and carotid sensors
will now be discussed. The blood coming from the lungs (rich in O2) and the blood
shunted around the lungs (low in O2) are remixed resulting in a lower concentration
of O2 than is found in the blood leaving the lungs. The equation re ecting this is as
follows.
Camo2= �CVo2
+ (1� �)Cao2,
where
Camo2= mixed concentration of O2 from shunted blood and lungs
Cao2= concentration of O2 from the pulmonary venous system
Cao2= concentration of O2 from the shunted venous return
� = percent of shunted blood.
Pamo2(for mixed O2 arterial pressure) is calculated using the dissociation laws and
will be used as input to the equation for the tissue compartment and the peripheral
control equation. Figure 4 illustrates these facts. The equation for PVo2is thus given
as:
dPVo2(t)
dt=
_QT[maPamo2
(t� �T)�mvPVo2(t) + Ba � Bv]�MRTo2
MTo2mv
:
The blood ow _Q to the lungs is reduced by the shunt factor (1� �) so that the
equation for lung Pao2becomes:
dPao2(t)
dt=
863(1� �) _Q[mvPVo2(t � �V)�maPao2
(t) + Bv � Ba]
MLo2
+EF _VA[PIo2
� Pao2(t)]
MLo2
;
Transport delay time for the shunted venous return to the arterial side of the tissue
compartment where the concentrations are mixed are estimated in the tables. Due to
insu�cient data relating Paco2and Pao2
to _Q we assume _Q to be constant.
There is also an alveolar-capillary gradient DA-cap for Po2 [100, 63] which is caused
mainly by ventilation/perfusion mismatch [85, 105]. The values used are taken from
[85, 100, 113]. There is little alveolar-arterial CO2 di�erence [85, 105] so that we still
assume the relationship PAco2= Paco2
.
The O2 dissociation curve changes during infancy and the values for a 3-4 month
old infant are taken from [100, 20]. Dissociation parameters for CO2 are assumed the
same as for adults [100, 34].
Normal and abnormal pro�les of infant breathing patterns can be compared with
those given by Rigato and Brady [103] and Hathorn [44, 45]. Excellent sources dis-
cussing infant physiology can be found in [105, 11, 110, 95, 20, 29, 81, 3, 73]. In Figures
16-18 note that the �rst segments of the graphs represent the simulated awake infant
23

steady state values. These values are also give in Table 12. We simulate a 6.0 kg infant
around 4 month of age. Paco2levels are somewhat lower for infants at 4 months than
at birth and Pao2is higher. The simulated values are consistent with data given in
[50, 81, 110]. The calculated tidal volume and minute ventilation is consistent for a
four month old infant (6 kg) as reported in in [29, 85]. A crosscheck of the simulated
values for Paco2and Pao2
can be given by calculating PAo2two ways. From the
equation given in [47] we have:
PAo2= PIo2
�Paco2RQ
where
RQ = respiratory quotient (given in the tables)
PIo2= partial pressure of atmospheric O2
PAo2= partial pressure of alveoli O2
Paco2= partial pressure of alveoli CO2
Also, PAo2is also given as:
PAo2= Pao2
+ DA-cap
where
Pao2= partial pressure of O2 leaving the capillaries
DA-cap = alveolar-capillary Po2 gradient (from the tables)
Using values for Pao2taken from the simulation produces a PAo2
level consistent with
those estimated from the RQ formula above which depends on Paco2. Note that for
a four month old, the lower Paco2level implies a higher PAo2
.
7.4.2. Modeling the Infant Sleep State. The organization of sleep state pat-
terns in the newborn is not completed before the age of 3 months. During the �rst few
weeks after birth, the classic sleep states of REM and NREM sleep cannot be easily
identi�ed but after approximately 3 months, sleep begins with NREM sleep [89]. From
that time on sleep patterns are more closely related to adult patterns [66, 89]. The
physiological changes accompanying REM sleep are more complicated than NREM
sleep and are not addressed in this model. For infants, as for adults, the transition
from the awake state to sleep state results in changes in the response to overall ven-
tilatory drive and muscle resistance to the upper airways and other muscle groups
related to breathing [46, 102, 66, 123]. Paco2rises 2-4 mm Hg as the infant transi-
tions to stage 4 sleep and O2 saturation falls [50, 9]. Data on infant state variables is
collected mostly during sleep [10]. Pao2values are somewhat higher and Paco2
levels
somewhat lower for the awake infant [81]. The values for Pao2are reduced and values
for Paco2are increased during transition to stage 4 sleep (SWS 4) as is the case for
adults (although not as much change)] [81]. We simulate a 4 month old infant ma-
tured enough so that NREM sleep normally precedes REM sleep during transitions
from awake to sleep states. We model only the NREM stage. Minute ventilation
depends on both tidal volume and breathing frequency. The relationships between
frequency, tidal volume and blood gas levels are complex and in these simulations
we hold the frequency constant so that tidal volume will re ect minute ventilation.
Arterial blood gas data can only be obtained with an indwelling arterial catheter,
which is not done except in exceptional cases. For general study, estimates can be
made using end-tidal gas composition, and transcutaneous measurements. In general,
transcutaneous O2 measurements aren't completely accurate, but can show trends [3]
24
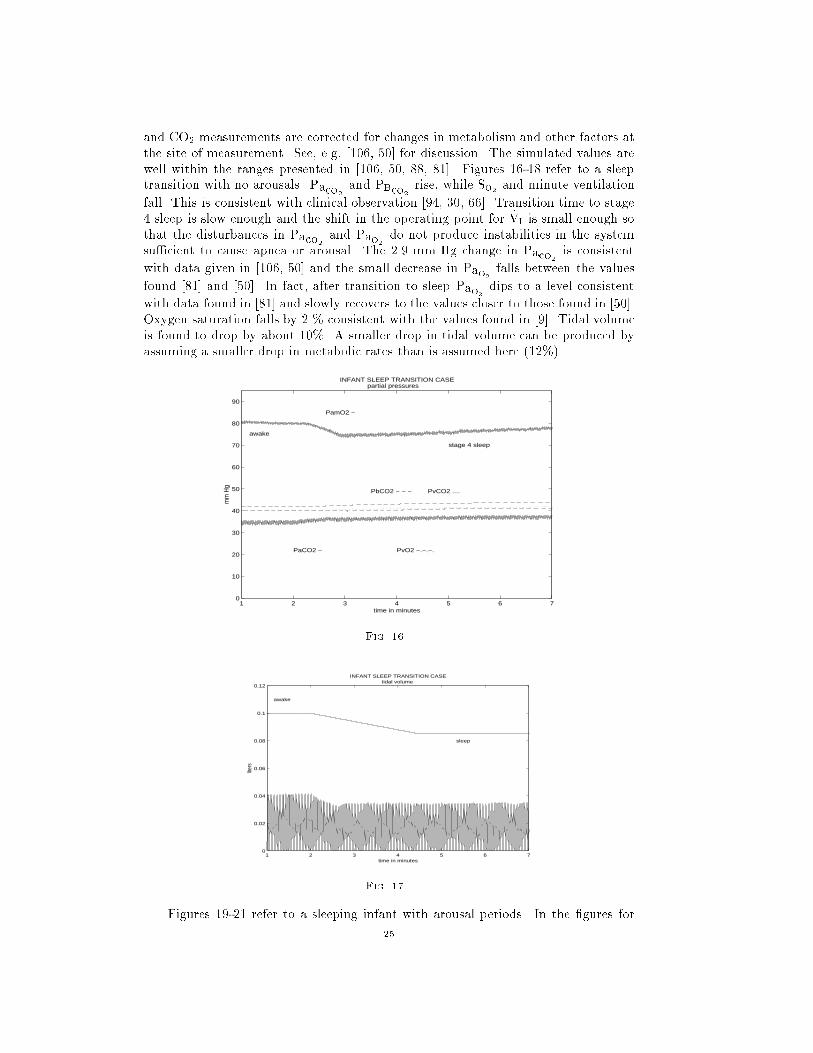
and CO2 measurements are corrected for changes in metabolism and other factors at
the site of measurement. See, e.g, [106, 50] for discussion. The simulated values are
well within the ranges presented in [106, 50, 88, 81]. Figures 16-18 refer to a sleep
transition with no arousals. Paco2and PBco2
rise, while So2 and minute ventilation
fall. This is consistent with clinical observation [94, 30, 66]. Transition time to stage
4 sleep is slow enough and the shift in the operating point for _VI is small enough so
that the disturbances in Paco2and Pao2
do not produce instabilities in the system
su�cient to cause apnea or arousal. The 2.9 mm Hg change in Paco2is consistent
with data given in [106, 50] and the small decrease in Pao2falls between the values
found [81] and [50]. In fact, after transition to sleep Pao2dips to a level consistent
with data found in [81] and slowly recovers to the values closer to those found in [50].
Oxygen saturation falls by 2 % consistent with the values found in [9]. Tidal volume
is found to drop by about 10%. A smaller drop in tidal volume can be produced by
assuming a smaller drop in metabolic rates than is assumed here (12%).
1 2 3 4 5 6 70
10
20
30
40
50
60
70
80
90
INFANT SLEEP TRANSITION CASE partial pressures
PamO2 −
PaCO2 −
PbCO2 − − − PvCO2 ....
PvO2 −.−.−.
mm
Hg
time in minutes
awake
stage 4 sleep
Fig. 16.
1 2 3 4 5 6 70
0.02
0.04
0.06
0.08
0.1
0.12
INFANT SLEEP TRANSITION CASEtidal volume
awake
sleep
time in minutes
liter
s
Fig. 17.
Figures 19-21 refer to a sleeping infant with arousal periods. In the �gures for
25

1 2 3 4 5 6 770
75
80
85
90
95
100
INFANT SLEEP TRANSITION CASE oxygen saturation
time in minutes
per c
ent
awake
stage 4 sleep
Fig. 18.
tidal volume a scaled graph of Gw is included to indicate the transitions from awake to
sleep. Arousals can occur for various reasons including an increase in chemical drive
past the arousal threshold level. For this case the S1 transition time is 20 seconds but
the e�ect of withdrawal of the awake stimulus is assumed to occur during the �rst
12 seconds. Thus an abrupt shift in the operating point occurs. Furthermore, the
maximal shift SO is higher than in the case of a smooth transition (about three �fths
of the awake ventilatory drive). The level of control gain is also reduced at S4 to two
thirds the normal level at S4. A lower arousal threshold is also assumed (see Table
16). The reduced arousal threshold and quick shift in the operating pro�le of the
control equation and the subsequent disturbances to Paco2and Pao2
are su�cient to
produce increases in ventilatory drive large enough to produce arousal. The degree
of disturbance produces a train of sleep/arousal cycles. The oscillations in the partial
pressures of Paco2and Pao2
re ect these transitions from awake to sleep. During
the initial transition ventilatory drive falls to the minimum threshold level needed
to sustain breathing and an apnea occurs. Figures 22-24 re ect apnea due
1 2 3 4 5 6 7 8 90
10
20
30
40
50
60
70
80
90
INFANT DISTURBED SLEEP CASE partial pressures
PamO2 −
PaCO2 −
PbCO2 − − − PvCO2 ....
PvO2 −.−.−.
mm
Hg
time in minutes
awake
sleep
Fig. 19.
to ventilatory drive dropping to a level su�ciently low such that respiratory muscle
response is absent and a central apneic episode begins. A fast transition time to the
sleep state and increased maximal shift SO (nearly equal to the awake ventilatory
drive [59]) and an increase in arousal threshold produces this case. See Table 16. The
26

1 2 3 4 5 6 7 8 90
0.02
0.04
0.06
0.08
0.1
0.12
INFANT DISTURBED SLEEP CASEINFANT DISTURBED SLEEP CASEtidal volume
sleep
awakeawakeawakeawakeawakeawake
time in minutes
per c
ent
Fig. 20.
1 2 3 4 5 6 7 8 980
82
84
86
88
90
92
94
96
98
100
INFANT DISTURBED SLEEP CASE
oxygen saturation
time in minutes
per c
ent
awake
sleep
Fig. 21.
resulting apnea causes ventilatory drive to rise until arousal occurs. The disturbance
to blood gas levels is su�cient to produce new cycles of apnea. The maximumlevels of
Paco2are consistent with levels producing arousals as reported in [30]. The minimum
So2 levels lie in the hypoxic region as de�ned by [116]. The apneic cycles
eventually disappear as the system slowly moves toward the steady state levels. In
this case disturbed sleep cycles resume.
As mentioned previously, infants commonly experience apnea during sleep. In full
term infants, periods of apnea less than 10 sec. are considered normal. Apneas longer
than this are unusual according to [24] and clinically important if the apneas approach
20 seconds. Such episodes are most common in premature infants [97, 46]. The mean
number of apneas for a three minute period is reported in one paper to range from 3
to 9 episodes [27]. These patterns vary with age, sleep state and the duration of the
sleep period. OA occurs mostly in the form of mixed apneas [76] where ventilatory
drive falls to zero or at least to a level so low that upper airway patency cannot be
maintained. Sudden infant death syndrome or SIDS, a term coined only in 1969, has
been anecdotally described since medieval times . It denotes the occurrence of death
in a new born (less than one year in age) probably during sleep while unattended and
with no discernible cause. A salient feature of SIDS (indeed one of its de�ning features
among childhood disease) is that there are virtually no cases before week one and then
27

1 1.5 2 2.5 3 3.5 4 4.5 5 5.5 60
10
20
30
40
50
60
70
80
90
INFANT APNEA CASE partial pressures
mm
Hg
time in minutes
PamO2 −
awake
PaCO2 −
PbCO2 − − − PvCO2 ....
PvO2 −.−.−.
sleep
Fig. 22.
1 1.5 2 2.5 3 3.5 4 4.5 5 5.5 60
0.02
0.04
0.06
0.08
0.1
0.12
0.14
INFANT APNEA CASEtidal volume
awake
sleep
time in minutes
liters
Fig. 23.
the rate of occurrence increases smoothly until week 12 and then slowly declines to
minimal rates after week 36. The incidence of SIDS in the U.S. is 2 to 3 deaths per
thousand live births for a total of between 7 to 10 thousand total deaths per year.
This rate is remarkably stable over time. Recent appeals to have infants sleep on their
back or side has reduced the incidence of SIDS. Though the total incidence is low it
represents one of the most common causes of death for infants whose age is between
one week and 1 year old [115]. It is not clear whether there is a single factor or a mix
of factors producing the syndrome. Ultimately, death results from cardiac arrest but
there is no consensus as to the precipitating cause of this cardiac arrest. It may be
that cardiac failure is the actual cause of death or it may be that respiratory failure
produces heart failure [93]. Periodic breathing and apnea have been linked to SIDS in
many studies [109, 120, 38, 54]. Certainly, during sleep, PB occurs in children more
often than in adults, and prolonged sleep apnea and PB are associated with infants.
Preterm infants are much more susceptible to apneic episodes than other infants [64],
[109]. While apneic episodes in infants are generally central (CA) and obstructive
apnea (OA) is relatively rare, signi�cantly more obstructive apneas (OA) have been
observed in connection with SIDS victims and near miss SIDS infants [46, 26, 115]. It
may be that OA is precipitated by a central apneic episode (such a situation is termed
mixed apnea) [38, 114]. The number of infants with OA and the number of obstructive
28

1 1.5 2 2.5 3 3.5 4 4.5 5 5.5 680
82
84
86
88
90
92
94
96
98
100
INFANT APNEA CASE oxygen saturation
time in minutes
per c
ent
awake
sleep
Fig. 24.
apneas per infant were higher in future SID victims, as was the frequency, mean and
maximal duration of central apneas of 3 to 10 sec. [108]. Apnea is often terminated
by some form of arousal and thus the arousal mechanisms plays an important role in
maintaining normal breathing during sleep. The mechanism for apnea as presented
here allows for the possible interpretation of apneic episodes as either CA or OA. The
anatomical structure of the upper airway and the dilatingmuscles that act to maintain
patency play a critical role in the occurence of OA and infants exhibiting heightened
resistance to air ow will be at greater risk for OA should there be any disruption of the
arousal mechanisms during sleep (including sleep fragmentation caused by repetitive
arousals) [39]. Large swings in Pao2levels has been associated with infant groups at
risk for SIDS [106].
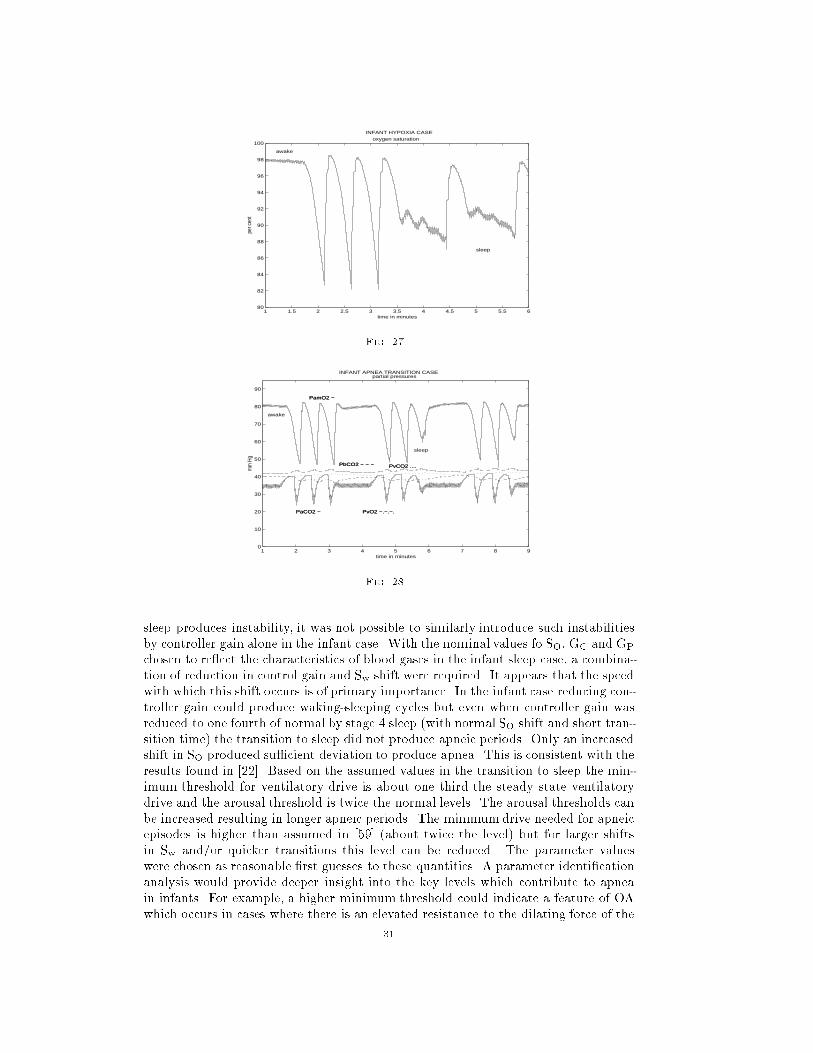
Using the de�nitions for hypoxia given in [116], Figures 25 - 27 exhibit moderate
to severe hypoxia at high arousal threshold and large shift in the ventilatory drive
operating point. Cycles of disturbed sleep resume as in the previous case. Apnea
length approaches levels considered medically signi�cant. The number of apneas per
minute is larger than was found in [106] but consistent with [27]. As arousal threshold
is increased the length of apnea increases and the O2 saturation is reduced. For arousal
threshold 10 % below nominal, apnea occurs but is of short duration and O2 saturation
reduction is moderate. When arousal threshold is increased by 25 % apneic periods
are in the range of 15 seconds and O2 saturation decreases to levels of signi�cant
hypoxia as de�ned in [116]. See Table 16 for comparisons. As seen below, the number
of apneas per minute can be reduced by assuming a longer aroused period. This also
acts to sustain the apneic cycles. Blood gas level deviations are also increased.
By inserting longer aroused periods these apnea cycles can be made to persist as
is shown in Figures 28-29.
Apnea density in the above case is similar to that reported in [48] for a four
month old infant although the duration is longer (around 8 seconds as compared to
�ve seconds)
8. Discussion. Much respiratory instability during sleep occurs during the tran-
sition to and during the phase of S1 sleep [59]. The above simulations have looked
at the e�ects of changes in sleep transition time, shift in Sw (the ventilatory drive
set point) which simulates withdrawal of the awake stimulus, increases in the arousal
threshold and levels for the minimumdrive for obstruction. The shift in Sw is assumed
completed by the the time S1 is reached and in some cases we have considered that
29

1 1.5 2 2.5 3 3.5 4 4.5 5 5.5 60
10
20
30
40
50
60
70
80
90
INFANT HYPOXIA CASE partial pressures
PamO2 −
PaCO2 −
PbCO2 − − − PvCO2 ....
PvO2 −.−.−.
mm
Hg
time in minutes
awake
sleep
Fig. 25.
1 1.5 2 2.5 3 3.5 4 4.5 5 5.5 60
0.02
0.04
0.06
0.08
0.1
0.12
0.14
INFANT HYPOXIA CASEtidal volume
awake
sleep
time in minutes
liters
Fig. 26.
this shift in Sw is completed early in this transition phase. See Table 16. A variety of
e�ects can be produced by various combinations of Sw transition time, SO magnitude,
arousal and minimum threshold levels and control gain levels. If the time for the Swshift is decreased then the magnitude of this shift can be reduced while producing
the same level of disturbance. In the simulations producing instability we use as the
transition time to S1 the value 20 seconds ([59]). We allow that the shift in Sw can be
completed before this transition is completed. A quick transition allows for smaller
shift magnitudes which in turn produce steady state levels closer to normal levels. As
the shift Sw is increased beyond the assumed normal value there are larger transient
shifts in blood gas levels but they are still within a reasonable range of values as
described in [9] for moderate shift maximums SO. Larger maximal Shifts SO allow
for a lower minimum drive point for obstruction and sustained cycles of apnea or a
slower transition. These larger shifts would imply more extreme deviations in steady
state values for the blood gases if permanent. However, large shifts which might be
transitory would not produce such large deviations in steady state values. This might
occur if strong transient e�ects on the ventilatory muscles occur during early sleep
stages and then dissipate as time passes. Controller gain reduced 25 % by stage 4
sleep produced steady state values consistent with observation [81]. Unlike the adult
case, where Khoo [59] found that excessive reduction in the controller gain during
30
1 1.5 2 2.5 3 3.5 4 4.5 5 5.5 680
82
84
86
88
90
92
94
96
98
100
INFANT HYPOXIA CASE oxygen saturation
time in minutes
per c
ent
awake
sleep
Fig. 27.
1 2 3 4 5 6 7 8 90
10
20
30
40
50
60
70
80
90
INFANT APNEA TRANSITION CASE partial pressures
PamO2 −
PaCO2 −
PbCO2 − − − PvCO2 ....
PvO2 −.−.−.
mm
Hg
time in minutes
awake
sleep
PamO2 −
PaCO2 −
PbCO2 − − − PvCO2 ....
PvO2 −.−.−.
Fig. 28.
sleep produces instability, it was not possible to similarly introduce such instabilities
by controller gain alone in the infant case. With the nominal values fo SO, GC and GP
chosen to re ect the characteristics of blood gases in the infant sleep case, a combina-
tion of reduction in control gain and Sw shift were required. It appears that the speed
with which this shift occurs is of primary importance. In the infant case reducing con-
troller gain could produce waking-sleeping cycles but even when controller gain was
reduced to one fourth of normal by stage 4 sleep (with normal SO shift and short tran-
sition time) the transition to sleep did not produce apneic periods. Only an increased
shift in SO produced su�cient deviation to produce apnea. This is consistent with the
results found in [22]. Based on the assumed values in the transition to sleep the min-
imum threshold for ventilatory drive is about one third the steady state ventilatory
drive and the arousal threshold is twice the normal levels. The arousal thresholds can
be increased resulting in longer apneic periods. The minimumdrive needed for apneic
episodes is higher than assumed in [59] (about twice the level) but for larger shifts
in Sw and/or quicker transitions this level can be reduced. The parameter values
were chosen as reasonable �rst guesses to these quantities. A parameter identi�cation
analysis would provide deeper insight into the key levels which contribute to apnea
in infants. For example, a higher minimum threshold could indicate a feature of OA
which occurs in cases where there is an elevated resistance to the dilating force of the
31

1 2 3 4 5 6 7 8 90
0.02
0.04
0.06
0.08
0.1
0.12
0.14
INFANT APNEA TRANSITION CASEtidal volume
awake
sleep
time in minutes
liter
s
Fig. 29.
ventilatory drive.
Respiratory instability is a potential risk factor for acute life threatening events
and SIDS [30, 39]. Such disturbances are caused by sleep/awake cycle disturbances,
upper airway obstruction, temperature, sleep position and ventilatory controller func-
tioning. Some infants at risk for SIDS may have de�ciencies in the arousal mechanism
[17, 42]. Some researchers report higher incidence of OA but fewer arousals [17, 52]
while other researchers have found no di�erence in the number of sleep/awake episodes
for infants at risk for SIDS but observe abnormal patterns of the sleep/awake cycle
[107]. Schectman et al. [107] report that while the mean arousal phenomena do not
di�er between control and at risk infants, there is greater di�culty in transiting to
the awake state for infants at risk for SIDS. Studying the relation between the arousal
threshold and other parameters might shed some light on the mechanisms implicated
in SIDS.
It has been hypothesized that oscillatory patterns in blood gas levels are indicative
of the stability of the respiratory control system with greater instability producing
greater swings in these state variables [122]. Waggener et al have observed that while
SIDS infants are not abnormal in the stability of the control system, one possible cause
of SIDS maybe that infants at risk have an abnormal susceptibility to prolonged apnea
by obstruction or may be abnormaly suceptible to normal apneas [121]. This study has
looked at the e�ects on respiratory stability of arousal thresholds, rightward shifts in
ventilatory drive due to the withdrawal of the awake stimulus, increase in the minimal
threshold for ventilation and loss of ventilatory drive during sleep. Higher arousal
thresholds increase the apneic period and the reduction in So2 . Apneic oscillations can
be damped out for certain combinations of the above factors and PB can be produced
due to the cycling between the awake and sleep stages (generally S1). Table 16
summarizes these simulation results. The results of the simulations indicate a general
stability to the infant breathing during transition to sleep except when the minimum
threshold for obstruction as described above is assumed higher than might be expected
or the transitional e�ects of sleep are assumed more severe. The interaction between
the various forces a�ecting upper airway patency, the cycling between NREM and
REM sleep and a complete description of the relation between central and obstructive
apnea as well as the mechanisms terminating apnea remain to be described and may
help provide a diagnostic scheme for recognizing infants at risk for SIDS.
32

APPENDIX
Table 1
Physiological constants nominal values
Quantity Symbol Unit Value Source
Metabolic rates MRBco2ml/min STPD 42 [55]
MRTco2" 220 [55]
MRTo2" 270 [55] [56]
Partial pressures Paco2mm Hg 40 [82]
Pao2" 100 [82]
PVco2" 46 [82]
PVo2" 40 [82]
PBco2" 49 [36]
PBo2" 37 [36]
Tidal volume Vtidal ml/breath 450 [80]
Dead space volume _VD ml 150 [80]
Alveolar ow rate _VA liters/min 4 [80]
Minute volume _VI " 5-7 [80]Alveolar to capillary matching constant A-a mm Hg 4 [80, 85, 88]Volume of compartment MBco2
liter .9 [55]
MTco2" 15 [55]
MTo2" 6 [55]
MLco2" 3.2 [55]
MLo2" 2.5 [55]
Blood Flow Rates _Q liters/min 6 [80]_QB " 0.8 [80]
Shunt Factor EF " 0.9 [80]
Table 2
Control constants nominal values
Quantity Symbol Unit Value Source
Central control gain GC mm Hg/min 1.8 (*2.5 for breath model) [59]
Peripheral control gain GP " 0.14 (*2.5 for breath model) [59]Central apneic threshold IC mm Hg 37.0 [59]
Peripheral apneic threshold IP mm Hg 37.0 [59]
33

Table 3
Transport delays nominal values
Quantity Symbol Unit Value Source
Lung to brain �B sec 12.0 (including mixing) [36, 60]Lung to tissue sec 19.0 (including mixing) [36, 60, 118]Lung to carotid artery �a sec 10.0 (including mixing) [36, 60]Tissue to lung �V sec 22.0 (including mixing) [36, 60, 118]Mixing and Distortion �1 sec 3 [60]
Table 4
Arterial segment volume nominal values
Quantity Unit Value Source
Lung to carotid artery liter 1.06 [36]Carotid to peripheral sensors " 0.008 [36]Peripheral sensors to brain " 0.008 [36]
Lung to tissue compartment " 1.735 [36]Tissue compartment to lung " 3.12 [36]
Table 5
Dissociation constants nominal values
Quantity Symbol Unit Value Source
CO2 constant Kco2 mm Hg�1 .0057 [59]O2 venous slope at PVo2
< 55 mv " .0021 [57]
O2 venous constant at PVo2< 55 Bv " .0662 [57]
O2 venous slope at 55 < PVo2< 70 mv " .00067 [57]
O2 venous constant at 55 < PVo2< 70 Bv " .1434 [57]
O2 venous slope at 70 < PVo2mv " .00025 [57]
O2 venous constant at 70 < PVo2Bv " .1728 [57]
O2 arterial slope at Pao2 < 55 ma " .0021 [57]
O2 arterial constant at Pao2 < 55 Ba " .0662 [57]
O2 arterial slope at 55 < Pao2< 70 ma " .00067 [57]
O2 arterial constant at 55 < Pao2 < 70 Ba " .1434 [57]
O2 arterial slope at 70 < Pao2 ma " .00025 [57]
O2 arterial constant at 70 < Pao2 Ba " .1728 [57]
34
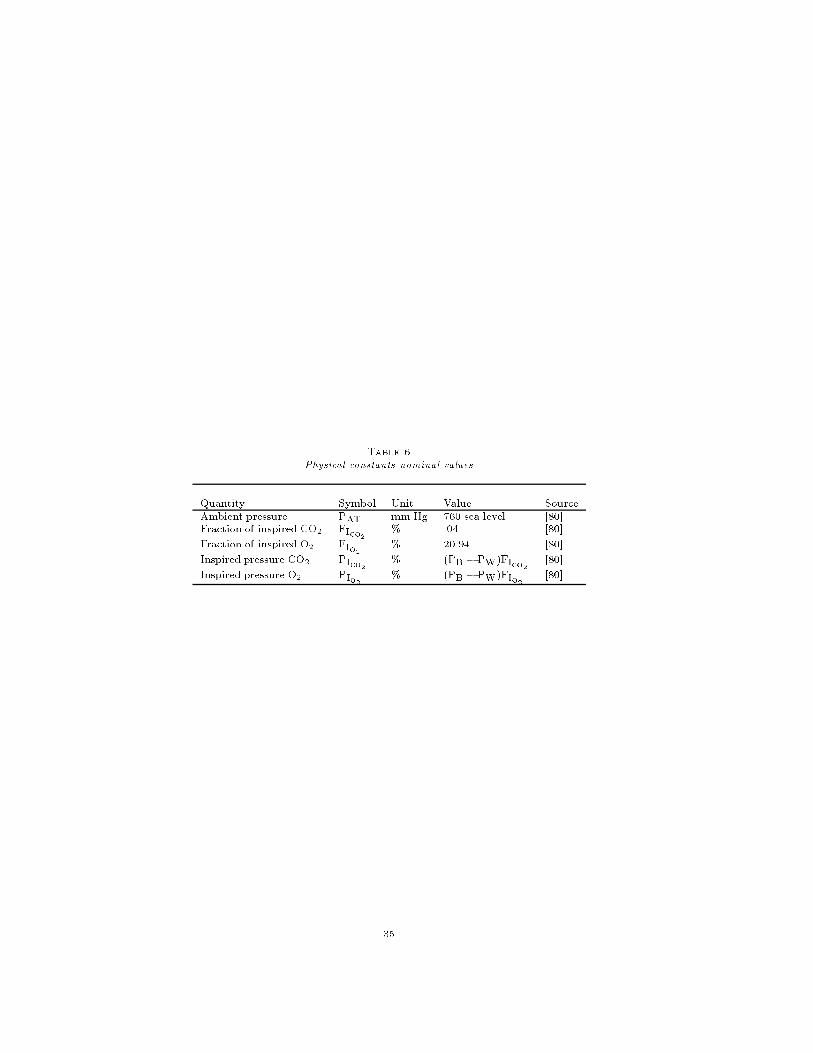
Table 6
Physical constants nominal values
Quantity Symbol Unit Value Source
Ambient pressure PAT mm Hg 760 sea level [80]Fraction of inspired CO2 FIco2
% .04 [80]
Fraction of inspired O2 FIo2% 20.94 [80]
Inspired pressure CO2 PIco2% (PB � PW)FIco2
[80]
Inspired pressure O2 PIo2% (PB � PW)FIo2
[80]
35

Table 7
Parameter and I.C. values for congestive heart case
Parameter Value Unit Source
Central control gain 1.88 * liter/min/mm Hg [60]
Peripheral control gain 0.135 * liter/min/mm Hg [60]
Central apneic threshold 39.0 mm Hg [59]
Peripheral apneic threshold 39.0 mm Hg [59]
Cardiac output 3.0 liter/min [60]
Lung to tissue delay 35.0 estimated sec [60]
Tissue to lung delay 41.0 estimated sec [60]
Lung to brain delay 21.0 sec [60]
Lung to carotid delay 17.0 sec [60]
PaCO2 42.0 mm Hg [60]
PaO2 85.0 mm Hg [60]
PVCO2 49.0 estimated mm Hg [60]
PVO2 25.0 estimated mm Hg [60]
PBCO2 50.0 estimated mm Hg [60]
* multiply by 2.5 for breath model
36

Table 8
Parameter values for adult simulations
Simulation Quantity Value Source
Figures 11 - 12 GP 0.14 * [59]GC 1.8 * [59]_Q 6.00 l/min [55]_QB 0.75 l/min estimate [28]Gw min 0.6 [59]SO 5.4 * l/mi180 [59]S4 sleep transition 180 sec. [59]min drive for obstruction 1.2 * l/min [59]arousal threshold 18.6 * l/min [59]obstruction removal threshold 18.6 * l/min [59]
expire and tidal multiplier for _VI 0.1
Figures 13 - 15 GP 0.11 * [59]GC 1.8 * [59]_Q 6.00 l/min [55]_QB 0.75 l/min estimate [28]Gw min 0.25 estimate [55]SO 6.6 * l/min [59]
S4 sleep transition 80 sec. [59]min drive for obstruction 1.6 * l/min [59]
arousal threshold 18.6 * l/min [59]obstruction removal threshold 18.6 * l/min [59]
expire and tidal multiplier for _VI 0.1
* multiply by 2.5 for breath model
37

Table 9
Nominal parameter values for awake new born infant at 3.2 kg
Parameter Value Unit Source
Central control gain 0.10 * liter/min/mm Hg [102, 87]
Central apneic threshold 29.0 mm Hg [87]
Peripheral control gain 2.0 * liter/min/mm Hg [87]
Peripheral apneic threshold 29.0 mm Hg [87]
CO2 e�ective lung volume 0.11 liters [87, 100]
O2 e�ective lung volume 0.092 liters [87, 100]
ventilatory dead space 0.009 liters [85]
CO2 e�ective tissue volume 1.05 liters [100]
O2 e�ective tissue volume 0.24 liters [100]
CO2 e�ective brain volume 0.10 liters [87, 59] estimate
CO2 tissue metabolic rate .018 liters/minute [100, 85, 87]
O2 tissue metabolic rate 0.02 liters/minute [100, 85, 87]
respiration quotient RQ 0.90 CO2/O2 ratio [100, 85]
CO2 brain metabolic rate 0.004 liters/minute [113] estimate
breath frequency 30 breaths /min [45, 29]
inspiratory time 0.8 sec [85]
expiratory time 1.2 sec [85]
alveolar/capillary O2 di�erence 20-30 mm Hg [113, 85]
Cardiac output 0.68 liter/min [113, 100]
Cerebral blood ow 0.14 liter/min [113]
R/L cardiac shunt factor 0.10 [113, 100, 88, 85]
* multiply by 2.5 for breath model
38

Table 10
Parameter value changes for awake 4 month old infant at 6 kg
Parameter Value Unit Source
Central control gain 0.10 * liter/min/mm Hg [102, 87]
Central apneic threshold 26.0 mm Hg [100]
Peripheral control gain 2.0 * liter/min/mm Hg [87]
Peripheral apneic threshold 26.0 mm Hg [100]
CO2 tissue metabolic rate .032 liters/minute [100, 85, 87]
respiration quotient RQ 0.85 CO2/O2 ratio [100, 85]
breath frequency 30 breaths /min [45, 29]
inspiratory time 0.8 sec [85]
expiratory time 1.2 sec [85]
alveolar/capillaryO2 di�erence 13 mm Hg [113, 100, 85]
Cardiac output 1.16 liter/min [100]
Cerebral blood ow 0.24 liter/min [100]
R/L cardiac shunt factor 0.055
* multiply by 2.5 for breath model
scale other parameters by weight
39

Table 11
Nominal delay parameter values for infant simulations
Parameter Value Unit Source
Lung to tissue delay 8.0 estimated sec [87] [100]
tissue to lung delay 9.0 estimated sec [87] [100]
Lung to brain delay 4.0 sec [87] [100]
Lung to carotid delay 3 sec [87] [100]
mixing delay 2 sec [87] [100]
PVo2delay to Pamo2
mixing 0.7*�V delay + 0.7*�T sec estimated
for tissue compartment
PVo2delay to Pamo2 mixing for carotid sensor 0.7*�V + .4*�a sec estimated
for carotid sensor
Table 12
Nominal Initial conditions for awake infant after 3-4 months
State variable Value Unit Source
PaCO2 34.0 mm Hg [106, 50, 85]
PaO2 96.0 mm Hg [85]
PamO2 79.0 mm Hg [85, 81, 50, 106]
PVCO2 40.0 mm Hg [85] estimate
PVO2 40.0 mm Hg [85] estimate
PBCO2 43.0 mm Hg [85] estimate
breath frequency 30 breaths /min [85, 29]
Vtidal .04 liters /breath [110, 29, 73, 85]
_VI 1.2 liters/min [110, 29, 85]
40

Table 13
Dissociation constants nominal values for 3-4 month infant
Quantity Symbol Unit Value Source
CO2 constant Kco2 mm Hg�1 .0050 [100] [20]
O2 venous slope at PVo2< 35 mv " .00307 [100],[20]
O2 venous constant at PVo2< 35 Bv " -.0122 [100],[20]
O2 venous slope at 35 < PVo2< 45 mv " .00199 [100],[20]
O2 venous constant at 35 < PVo2< 45 Bv " .0255 [100],[20]
O2 venous slope at 45 < PVo2< 55 mv " .00116 [100],[20]
O2 venous constant at 45 < PVo2< 55 Bv " .0625 [100],[20]
O2 venous slope at 55 < PVo2< 70 mv " .00057 [100],[20]
O2 venous constant at 55 < PVo2< 70 Bv " .0953 [100],[20]
O2 venous slope at 70 < PVo2mv " .000159 [100],[20]
O2 venous constant at 70 < PVo2Bv " .1242 [100],[20]
O2 arterial slope at Pao2< 35 mv " .00307 [100],[20]
O2 arterial constant at Pao2< 35 Bv " -.0122 [100],[20]
O2 arterial slope at 35 < Pao2< 45 ma " .00199 [100],[20]
O2 arterial constant at 35 < Pao2< 45 Ba " .0255 [100],[20]
O2 arterial slope at 45 < Pao2< 55 ma " .00116 [100],[20]
O2 arterial constant at 45 < Pao2< 55 Ba " .0625 [100],[20]
O2 arterial slope at 55 < Pao2< 70 ma " .00057 [100],[20]
O2 arterial constant at 55 < Pao2< 70 Ba " .0953 [100],[20]
O2 arterial slope at 70 < Pao2ma " .000159 [100],[20]
O2 arterial constant at 70 < Pao2Ba " .1242 [100],[20]
41

Table 14
O2 saturation constants
Quantity Symbol Unit Value Source
So2 slope at Pao2< 30 ms " 2.40 [20]
So2 constant at Pao2< 30 bs " 14.0 [20]
So2 slope at 30 < Pao2< 40 ms " 1.8 [20]
So2 constant at 30 < Pao2< 40 bs " 4.0 [20]
So2 slope at 40 < Pao2< 50 ms " .9 [20]
So2 constant at 40 < Pao2< 50 bs " 40.0 [20]
So2 slope at 50 < Pao2< 60 ms " .5 [20]
So2 constant at 50 < Pao2< 60 bs " 60.0 [20]
So2 slope at 60 < Pao2< 70 ms " .4 [20]
So2 constant at 60 < Pao2< 70 bs " 66.0 [20]
So2 slope at 70 < Pao2< 80 ms " .37 [20]
So2 constant at 70 < Pao2< 80 bs " 68.1 [20]
So2 slope at 80 < Pao2< 85 ms " 0.32 [20]
So2 constant at 80 < Pao2 < 85 bs " 72.1 [20]
So2 slope at 85 < Pao2 < 88 ms " 0.2 [20]
So2 constant at 85 < Pao2 < 88 bs " 82.2 [20]
So2 slope at 88 < Pao2 ms " 0.10 [20]
So2 constant at 88 < Pao2 bs " 91.8 [20]
Table 15
Nominal sleep constants for 4 month old infants
State variable Value Unit Source
SO 0.4 * l/min scaled from[59]
Gw min value 0.85 [59, 22]
_Q reduction 5 % [59]
MRTco2, MRTo2
reduction 12.00 % scaled from [59]
MRBco2reduction 4.0 % [59]
arousal threshold 2.4 * l/min scaled from [59]
removal of obstruction threshold 2.4 * l/min scaled from [59]
minimum drive for obstruction 0.3 * l/min scaled from [59]
PaO2 79.0 mm Hg [81, 50]
* multiply by 2.5 for breathmodel
VI=1.2 l/min (multiply by 2.5 for breathmodel)
42

Table 16
Stability results for infant sleep cases
type min S4 Gw arousal SO SO max So2_Vs * reduction threshold * shift * shift time ** drop
stable transition 0.3 15 % 2.4 0.40 30 sec 2 %disturbed sleep cycle 0.46 40 % 2.2 0.9 12 sec 8 %apnea/arousal cycle 0.46 60 % 2.6 1.12 16 sec. 15.0 %hypoxia/apnea cycle 0.46 60 % 2.9 1.12 16 sec. 18.0 %hypoxic/apnea cycle 0.46 60% 3.0 1.40 20 sec 18.5 %severe hypoxia cycle 0.46 60% 3.0 0.82 10 sec 18.5 %
* multiply by 2.5 ** transition to S1 is 20 sec. except case 1for breath model
43

REFERENCES
[1] Avery,G. Neonatology. J.B. Lippincott, Philadelphia,Pa., 1975.[2] Badr, M.S. E�ect of ventilatory drive on upper airway patency in humans during NREM
sleep. Resp.Physiol., 103:1{10, 1996.[3] Beckerman, R.C., Brouillette, R.T., and Hunt,C.E. Respiratory Control Disorders in Infants
and Children. Williams and Wilkins, Baltimore, Md., 1992.[4] Berger, A., Mitchell, R., and Severinghaus, J. Regulation of respiration. New England Journal
of Medicine, 297(4):194{201, 1977.[5] Berne, R. and Levy, M. Principles of Physiology 2nd edition. C.V. Mosby, St.Louis, 1995.[6] Bradley, T.D., McNicholas, W.T., Rutherford,R., Popkin,J., Zamel,N., and Phillip-
son,E.A. Clinical and physiologic heterogeneity of the central sleep apnea syndrome.Am.Rev.Resp.Dis., 134:217{221, 1986.
[7] Bradley, T.D. and Phillipson, E.A. Pathogenesis and pathophysiologyof the O.S.A. syndrome.Med.Clin.North.Amer., 69(6):1169{1185, 1985.
[8] Brady, J.P. and Mcann, E.M. Control of ventilation in subsequent siblings of victims of SIDS.Journal of Pediatrics, 106(2):212{217, 1985.
[9] Brouillette, R.T. Assessing cardiopulmonary function during sleep in infants and children. In
R.G. Beckerman, R.T. Brouillette, and C.E. Hunt, editors, Respiratory Control Disordersin Infants and Children, pages 125{141. Williams and Wilkins-Baltimore Md., 1992.
[10] Bryan, A.C, Bowes, G., and Maloney, J.E. Control of breathing in the fetus and newborn. InFishman A.P., editor, Handbook of Physiology ,The Respiratory System, Part II, pages
621{647. American Physiol. Soc. Bethesda Md., 1986.[11] Burgess, W.R. and Chernick, V. Respiratory Therapy in Newborn Infants and Children.
Thieme, New York, 1986.
[12] Carley, D.W. and Shannon,D.C. A minimalmathematicalmodel of humanperiodic breathing.J. Appl. Physiol., 65(3):1400{1409, 1988.
[13] Carley, D.W. and Shannon, D.C. Relative stability of respiration during progessive hypoxia.J.Appl.Physiol, 65(3):1389{1399, 1988.
[14] Carlo,W.A. and DiFiore,J.M. Respiratorymuscle responses to changes in chemoreceptor drivein infants. J.Appl.Physiol., 68(3):1041{1047, 1990.
[15] Cherniack, N.S. Respiratory dysrythmias during sleep. New Eng. J. Med., 305(6):325{330,
1981.[16] Cooke, K. and Grossman, Z. Discrete delay,distributed delay and stability switches.
J.Math.Analys.Appl., 86:592{627, 1982.[17] Coons, S. and Guilleminault, C. Motility and arousal in near miss SIDS. J. Pediatr.,
107(5):728{732, 1985.[18] Crystal, R.G. and West,J.B. et al. The Lung: Scienti�c foundations 2nd edition. Raven
Press, N.Y. N.Y., 1997.
[19] Cunningham, D.C, Robbins, P.A., and Wol�, C.B. Integration of respiratory responses. InFishman A.P., editor, Handbook of Physiology, The Respiratory System, Part II, pages
475{528. American Physiol. Soc. Bethesda Md., 1986.[20] Delivoria-Papadopoulos,M, and DiGiacomo, J.E. Oxygen transport and delivery. In R.A.
Polin and W.W. Fox, editors, Fetal and Neonatal Physiology Volume 1, pages 801{813.W.B. Saunders, Philadelphia, 1992.
[21] Dempsey, J.A., Harms,C., Morgan,B., Badr,M.S., and Skatrud,J.B. Sleep e�ects on breathingand breathing stability. In R.G. Crystal, J.B. West, P.J. Barnes, N.S. Cherniack, and E.R.Weibel, editors, The Lung : Scienti�c Foundations, pages 2063{2071. Lippincott-RavenN.Y., 1997.
[22] Dempsey,J.A. and Skatrud,J.B. A sleep-induced apneic threshold and its consequences.Am.Rev.Resp.Dis., 133(6):1163{1170, 1986.
[23] Douglas, C.G. and Haldane, J.S. Causes of PB or CSR. J. Physiol. Lond., 38:401{419, 1909.[24] Dyson, M., Beckerman,R.C., and Brouillette,R.T. Obstructive sleep apnea syndrome. In R.G.
Beckerman, R.T. Brouillette, and C.E. Hunt, editors, Respiratory Control Disorders in
Infants and Children, pages 212{230. Williams and Wilkins-Baltimore Md., 1992.
[25] Elhefnawy, A., Saidel, G.M., and Bruce, E.N. CO2 control of the respiratory system: plantdynamics and stability analysis. Annals of Biomed. Eng., 16:445{461, 1988.
[26] Engelberts,A.C. The role of ob-structive apnea in SIDS and ALTE. Int.J.Ped.Oto.Rhynolaryng., 32(Suppl.):S59{S62,1995.
[27] Fenner, A., Schalk, V., Hoenicke, H., Wendenburg, A., and Roehling, T. Periodic breathingin premature and neonatal babies: breathing patterns,respiatory gas tensions,response to
44

the changes in ambient air. Pediatr. Res., 7(4):174{183, 1973.[28] Fincham, W.F. and Tehrani, F.T. On the regulation of cardiac output and cerebral blood
ow. J. Biomed. Eng., 5:73{75, 1983.[29] Gaultier, C. Overview of infant respiratory physiology during sleep. Bull.Europ.Physiol.Resp.,
21(1):55{112, 1985.[30] Gaultier, C. Cardio-respiratoryadaptation during sleep in infants and children. Ped. Pulmon.,
19:105{117, 1995.[31] Gaultier,C. Obstructive sleep apnea syndrome in infants and children:established facts and
unsettled issues. Thorax, 50:1204{1210, 1995.[32] Gothe, B., van Lunteren, E., and Dick, T.E. In uence of the sleep state on respiratory
muscle function. In N.A. Saunders and C.E. Sullivan, editors, Sleep and Breathing, pages239{256. Marcel Dekker, N.Y., 1994.
[33] Gray, J.S. Multiple factory theory of the control of respiratory ventilation. Science, 102:739{744, 1946.
[34] Greenough, A. and Milner,A.D. Control of the respiratory system. In A. Greenough, N.R.Roberton, and A. Milner, editors, Neonatal Respiratory Disorders, pages 27{47. Arnold,London, 1996.
[35] Grodins, F.S. Models of respiration. In T.F. Hornbein, editor, Regulation of Breathing: Part
II, pages 1313{1351. Marcel Dekker N.Y., 1981.[36] Grodins, F.S., Buell, J., and Bart, A.J. Mathematical analysis and digital simulation of the
respiratory control system. J. Appl. Physiology, 22(2):260{276, 1967.[37] Grodins, F.S., Gray, J.S., Schroeder, K.R., Norins, A.I., and Jones, R.W. Respiratory re-
sponses to CO2 inhalation: A theoretical study of a nonlinear biological regulator. J.
Appl. Physiol., 7:283{308, 1954.[38] Guilleminault, C . Sleep-related respiratory functionand dysfunction in post-neonatal infantile
apnea. In J.L. Culbertson, H.F. Krous, and R.D. Bendell, editors, Sudden Infant Death
Syndrome,Medical Aspects and Psychological Management, pages 94{120. John Hopkins
Univ.Press. Baltimore, 1988.[39] Guilleminault, C., Stoohs,R., Skrobal,A., Labonowski,M., and Simmons,J. Upper airway
resistance in infants at risk for SIDS. J. Pediatr., 122(6):881{886, 1993.[40] Guyton, A.C. Physiology of the Human Body. Saunders, Philadelphia, 1984.
[41] Guyton, A.C., Crowell, J.W., and Moore, J.W. Basic oscillatingmechanism of Cheyne-Stokesbreathing. Amer.J.Physiol., 187:395{398, 1956.
[42] Haddad, G.G. and Mellins, R.B. Hypoxia and respiratory control in early life. Ann. Rev.
Physiol., 46:629{643, 1984.[43] Haldane, J.S. and Priestley, J.G. The regulation of lung ventilation. J. Physiol. Lond.,
32:225{266, 1905.[44] Hathorn, M.K.S. The rate and depth of breathing in new-born infants in di�erent sleep states.
J. Physiol.London, 243(1):101{113, 1974.[45] Hathorn, M.K.S. Analysis of periodic changes in ventilation in new-born infants. J. Physiol.,
285:85{99, 1978.
[46] Henderson-Smart, D.J. Regulation of breathing in the fetus and newborn. In N.A. Saundersand C.E Sullivan, editors, Sleep and Breathing, pages 605{647.Marcel Dekker N.Y., 1994.
[47] Hlastala, M.P. and Berger, A.J. Physiology of Respiration. Oxford University Press, N.Y.,1996.
[48] Hoppenbrouwers, T. and Hodgman, J. Sleep respiratory behavior in normal term and preterminfants. IEEE Ninth Annual Conf. EMBS, 2:1106{1107, 1987.
[49] Hoppenbrouwers, T., Hodgman, J., and Cabal,L. Obstructive apnea,associated patterns of
movement,heart rate and oxygenation in infants at low and increased risks for SIDS.Ped.Pulmon., 15(1):1{12, 1993.
[50] Hoppenbrouwers, T., Hodgman, J., Kazuka,A., Durand,M., and Cabal,L. Transcutaneousoxygen and carbon dioxide during the �rst half of life in premature and normal terminfants. Ped.Res., 31(1):73{79, 1992.
[51] Horgan, J.D. and Lange, R.L. Digital computer simulation of the human respiratory system.IEEE International Conference Record, pages 149{157, 1963.
[52] Kahn, A., Groswasser, E., Rebu�at, E., and Sottiaux, M. et al. Sleep and cardiorespiratorycharacteristics of infant victims of sudden infant death:a prospective case-control study.Sleep, 15(4):287{292, 1992.
[53] Kappel, F. and Peer, R.O. A mathematical model for fundamental regulation processes in
the cardiovascular system. J.Math. Biol., 31(6):611{631, 1993.[54] Kelly, D.H. and Shannon, D.C. Periodic breathing in infants with near miss SIDS. Pediatrics,
63(3):355{360, 1979.
45

[55] Khoo, M.C.K . A model for respiratory variability during non-REM sleep. In G.D. Swanson,F.S. Grodins, and R.L. Hughson, editors, Respiratory Control: modeling perspective,pages 327{336. Plenum Press. N.Y., 1990.
[56] Khoo, M.C.K. Modeling the e�ect of sleep state on respiratory stability. In M.C.K. Khoo,editor,Modeling and parameter estimation in respiratory control, pages 193{203. PlenumPress. N.Y., 1990.
[57] Khoo, M.C.K. Periodic breathing. In Grystal R. G. and West J.B. et al, editors, The Lung:scienti�c foundations, pages 1419{1431. Raven Press Ltd. New York, 1991.
[58] Khoo, M.C.K. Periodic breathing. In R.G. Crystal and J.B. et al West, editors, The Lung :
Scienti�c Foundations, pages 1851{1863. Lippincott-Raven N.Y., 1997.[59] Khoo, M.C.K., Gottschalk, A., and Pack, A.I. Sleep-induced periodic breathing and apnea:
A theoretical study. J. Applied Physiol., 70(5):2014{2024, 1991.[60] Khoo, M.C.K, Kronauer, R.E., Strohl, K.P., and Slutsky, A.S. Factors inducing periodic
breathing in humans: a general model. J. Appl. Physiol., 53(3):644{659, 1982.[61] Khoo, M.C.K. and Kronauer,R.E. Estimation of cardiopulmonary parameters for quasi-
optimal inputs. 1983 Proc. 2nd Am. Control Conf., pages 46{51, 1.[62] Khoo, M.C.K. and Yamashiro, S.M. Models of Control of Breathing. In Chang, H.A. and
Paiva, M., editors,Respiratory Physiology: an analytical approach, pages 799{829.MarcelDekker, 1989.
[63] Koch,G. Alveolar ventilation,di�using capacity and the A-a PaO2 di�erence in the newborn
infant. Respir.Physiol., 4:168{192, 1968.[64] Krous, H. F. The Pathology of Sudden Infant Death Syndrome: an overview. In J.L. Cul-
bertson, H.F. Krous, and R.D. Bendell, editors, Sudden Infant Death Syndrome,Medical
Aspects and Psychological Management, pages 18{47. John Hopkins Univ. Press. Balti-more, 1988.
[65] Lambertsen, C.J. Chemical control of respiration. In Mountcastle,V.B, editor,Medical Phys-
iology, pages 1447{1487. C.V.Mosbey, 1980.
[66] Lamm, C. Sleep-disordered breathing in children. Mt. Sinai. J. Med., 61(2):131{138, 1994.[67] Lloyd, B.B. and Cunningham, D.J.C. A quantitative approach to the regulation of human
respiration. In Cunningham D.J.C and Lloyd B.B., editors, The Regulation of Human
Respiration, pages 331{349. Blackwell Scienti�c Publications,Oxford, 1963.
[68] Lo,E.([email protected]) and Jackiewicz,Z.([email protected]). SNDELLMcode, 1992.
[69] Longobardo, G.S. and Cherniack, N.S. Abnormalities in respiratory rhythm. In A.P. Fish-
man, editor, Handbook of Physiology: The Respiratory System, pages 729{749. AmericanPhysiology Society, 1986.
[70] Longobardo, G.S., Cherniack, N.S., and Gothe, B. Factors a�ecting respiratory system sta-bility. Annal. Biomed. Eng, 17(4):377{396, 1989.
[71] Longobardo,G.S., Cherniak, N.S., and Fishman, A.P. Cheyne-Stokes breathing produced by amodel of the human respiratory system. Journal of Applied Physiology, 21(6):1839{1846,1966.
[72] Longobardo, G.S., Gothe, B., Goldman, M.D., and Cherniack, N.S. Sleep apnea consideredas a control system instability. Resp. Physiol., 50:311{333, 1982.
[73] Longo,L.D. and Nystrom,G.A. Fetal and newborn respiratory gas exchange. In R.G. Crystal,J.B. West, P.J. Barnes, N.S. Cherniack, and E.R. Weibel, editors, The Lung: Scienti�c
Foundations, pages 2141{2149. Lippincott-Raven N.Y., 1997.[74] Martin,R.J., Okken,A.R., and Rubin,D. Arterial oxygen tension during active and quiet sleep
in the normal neonate. J.Ped., 94(2):271{274, 1979.
[75] Mathew, R.J. Development of pulmonary circulation: Metabolic aspects. In R.A. Polinand W.W. Fox, editors, Fetal and Neonatal Physiology Volume 1, pages 678{682. W.B.
Saunders, Philadelphia, 1992.[76] McNamara, F. and Sullivan, C.E. Sleep disordered breathing and its e�ects on sleep in infants.
Sleep, 19(1):4{12, 1996.[77] Milhorn, H.T. Jr., Benton, R, Ross, R., and Guyton, A.C. A mathematical model of the
human respiratory control system. Biophys., 5:27{46, 1965.[78] Miller, J.P., Cunningham,D.J., Lloyd, B.B., and Young, J.M. The transiient respiratory e�ects
in man of sudden changes in alveolar CO2 in hypoxia and high O2. Respr. Physiol.,20(1):17{31, 1974.
[79] Milner,A. Adaptation at birth. In A. Greenough, N.R. Roberton, and A. Milner, editors,
Neonatal Respiratory Disorders, pages 48{56. Arnold, London, 1996.[80] Mines, A.H. Respiratory Physiology. Raven Press, N.Y. N.Y., 1986.
[81] Mok,J.Y., McLaughlin,F.J., Pintar,M., Hak,H., Amarogalvez,R., and Levison,H. Transcuta-
46

neous monitoring of oxygenation: What is normal? J.Pediatr., 108(3):365{371, 1986.[82] Murray, J.F. ed. The Normal Lung. W.B. Saunders, N.Y. N.Y., 1986.[83] Naughton, M., Benard, D., Tam,A., Rutherford,R., and Bradley,T.D. Role of hyperventilation
in the pathogenesis of central sleep apneas in patients with congestive heart failure. Am-Rev-Respir-Dis., 148(2):330{338, 1993.
[84] Naughton, M.T., Benard, D.C., Rutherford,R., and Bradley,T.D. E�ect of continuouspositive airway pressure on central sleep apnea and nocturnal PCO2 in heart failure.Am.J.Respir.Crit.Care Med., 150(6 pt.1):1598{1604, 1994.
[85] Nelson, N. Respiration and circulation after birth. In C.A. Smith and N.M. Nelson, editors,Physiology of the Newborn Infant, pages 200{250. Thomas,Spring�eld Ill., 1976.
[86] Nugent, S.T. and Finley, J.P. Spectral analysis for periodic and normal breathing in infants.IEEE Trans. Biomed. Eng., 30(1):672{675, 1983.
[87] Nugent, S.T., Tan,G.A., and Finley, J.P. A nonlinearmodel study of PB in infants. Proc.NinthAnnual Conf. IEEE EMBS, 2:1108{1110, 1987.
[88] Nunn, J.F. Applied Respiratory Physiology. Butterworths Press, Boston.Mass., 1987.[89] Pack, A.I. General physiology of sleep. In R.G. Crystal, J.B. West, P.J. Barnes, N.S. Cher-
niack, and E.R. Weibel, editors, The Lung : Scienti�c Foundations, pages 2055{2061.Lippincott-Raven N.Y., 1997.
[90] Pallot, D. J. Control of Respiration. Oxford University Press, N.Y., 1983.[91] Parisi, R.A., Neubauer, J.A., Frank,M.M., Edelman,N.H, and Santiago,T.V. Correla-
tion between genioglossal and diaphragmatic responses to hypercapnia during sleep.Amer.Rev.Resp.Dis., 135:378{382, 1987.
[92] Parmalee, A.H., Stern, E, and Harris, M.A. Maturation of respiration in premature and younginfants. Neuropadiatrie, 3(3):294{304, 1972.
[93] Peterson, D.R. . Epidemiology of Sudden Infant Death Syndrome. In J.L. Culbertson, H.F.
Krous, and R.D. Bendell, editors, Sudden Infant Death Syndrome,Medical Aspects and
Psychological Management, pages 3{17. John Hopkins Univ. Press. Baltimore, 1988.
[94] Phillipson, E.A. Control of beathing during sleep. Am. Rev. Resp. Disease, 118(5):909{939,1978.
[95] Polin,R.A. and Fox,W.W. Fetal and Neonatal Physiology Vols. 1 and 2. W.B. Saunders,Philadelphia, 1992.
[96] Pryor, W.W. Cheyne-Stokes breathing in patients with cardiac enlargment and prolongedcirculation time. Circulation, 4:233{238, 1951.
[97] Read, D. and Henderson-Smart, D. Regulation of breathing in the newborn during di�erent
behavioral states. Ann. Rev. Physiol., 46:675{685, 1984.[98] Rebuck, A.S., Slusky, A.S., and Mahutte, C.K. A mathematical expression to describe venti-
latory response to hypoxia and hypercapnia. Res. Physiol., 31:107{116, 1977.[99] Remmers, J.E. E�ects of sleep on control of breathing. In Widdicombe J.G., editor, Respi-
ratory Physiology III,vol 23, Int.Rev. of Physiol., pages 111{147. University Park PressBaltimore Md., 1981.
[100] Revow, M., England, S.J., O'Beirne, H., and Bryan, C. A model of the maturation of respi-
ratory control in the newborn infant. IEEE. Trans. Biomed. Eng., 36(4):414{423, 1989.[101] Richardson, D.W., Wasserman, A.J., and Patterson Jr., J.L. General and regional circulatory
response to change in blood pH and CO2 tension. J. Clin. Invest., 40:31{43, 1961.[102] Rigatto, H. Control of ventilation in the newborn. In Ann. Rev. of Physiol., vol. 46, pages
661{674. 1984.[103] Rigatto, H. and Brady, J.P. PB and apnea in preterm infants-hypoxia as a primary event.
Pediatrics, 50(2):219{227, 1972.
[104] Saunders, N.A. and Sullivan, C.E., eds. Sleep and Breathing. Marcel Dekker, N.Y. N.Y., 1994.[105] Scarparelli, E. Pulmonary Physiology :Fetus,Newborn,Child,Adolescent 2nd Edition. Lee and
Febiger, Philadelphia, 1975 and 1990.[106] Schafer, T., Schafer, D., and Schlafke,M. Breathing, transcutaneous blood gases, and CO2
responses in SIDS siblings and control infants during sleep. J.Appl.Physiol., 74(1):88{102,1993.
[107] Schechtman, V.L., Harper, R.M., Wilson, A.J., and Southall, D.P. Sleep state organizationin normal infants and victims of SIDS. Pediatrics, 89(5):865{870, 1992.
[108] Schluter B., Buschatz D., and Trowitzsch E. Apnea characteristics of children who later died:comparison of sudden infant death with other causes of death. Wien-Med-Wochenschr.,146(13-14):321{323, 1996.
[109] Shannon, D.C., Carley, D.W., and Kelly, D.H. Periodic breathing: quantitative analysis andclinical description. Pediat. Pulmon., 4:98{102, 1988.
[110] Siner,B. and Carlo, W.A. Appendix. In W.A. Carlo and R.L. Chatburn, editors, Neonatal
47
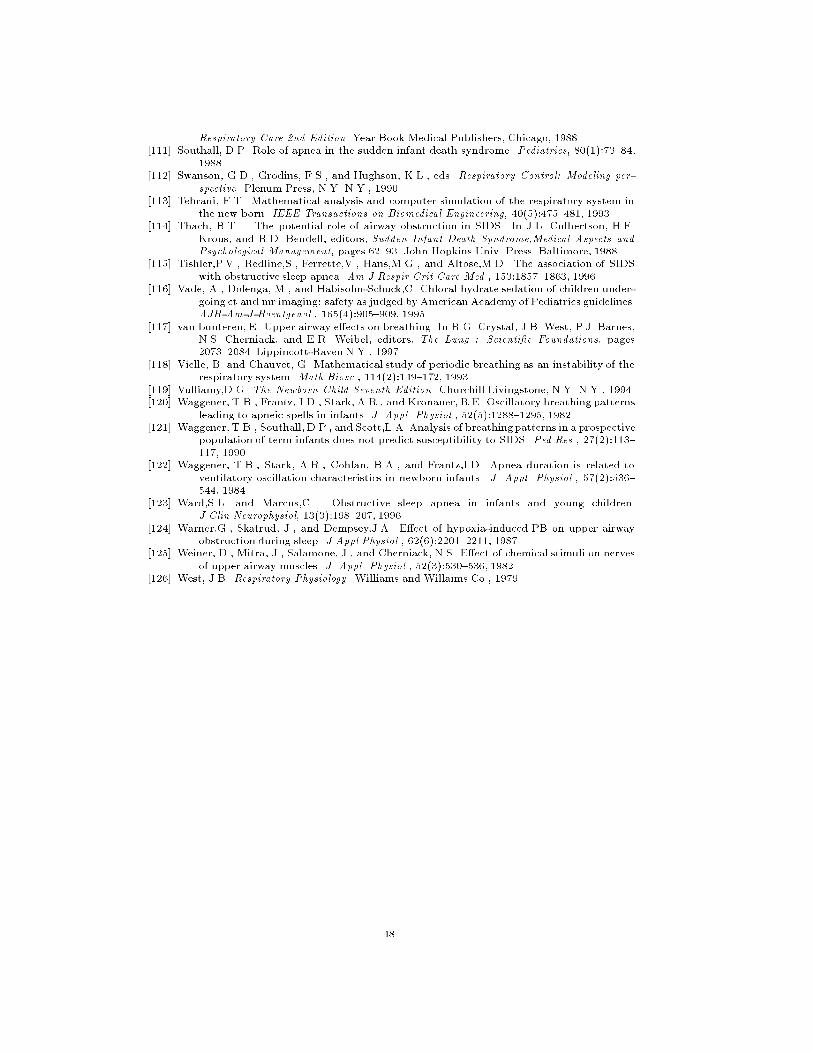
Respiratory Care 2nd Edition. Year Book Medical Publishers, Chicago, 1988.[111] Southall, D.P. Role of apnea in the sudden infant death syndrome. Pediatrics, 80(1):73{84,
1988.[112] Swanson, G.D., Grodins, F.S., and Hughson, K.L., eds. Respiratory Control: Modeling per-
spective. Plenum Press, N.Y. N.Y., 1990.[113] Tehrani, F.T. Mathematical analysis and computer simulation of the respiratory system in
the new born. IEEE Transactions on Biomedical Engineering, 40(5):475{481, 1993.[114] Thach, B.T. . The potential role of airway obstruction in SIDS. In J.L. Culbertson, H.F.
Krous, and R.D. Bendell, editors, Sudden Infant Death Syndrome,Medical Aspects and
Psychological Management, pages 62{93. John Hopkins Univ. Press. Baltimore, 1988.[115] Tishler,P.V., Redline,S., Ferrette,V., Hans,M.G., and Altose,M.D. The association of SIDS
with obstructive sleep apnea. Am.J.Respir.Crit.Care Med., 153:1857{1863, 1996.[116] Vade, A., Dolenga, M., and Habisohn-Schuck,C. Chloral hydrate sedation of children under-
going ct and mr imaging: safety as judged by American Academy of Pediatrics guidelines.AJR-Am-J-Roentgenol., 165(4):905{909, 1995.
[117] van Lunteren, E. Upper airway e�ects on breathing. In R.G. Crystal, J.B. West, P.J. Barnes,N.S. Cherniack, and E.R. Weibel, editors, The Lung : Scienti�c Foundations, pages2073{2084. Lippincott-Raven N.Y., 1997.
[118] Vielle, B. and Chauvet, G. Mathematical study of periodic breathing as an instability of therespiratory system. Math.Biosc., 114(2):149{172, 1993.
[119] Vulliamy,D.G. The Newborn Child Seventh Edition. Churchill Livingstone, N.Y. N.Y., 1994.[120] Waggener, T.B., Frantz, I.D., Stark, A.R., and Kronauer, R.E. Oscillatory breathing patterns
leading to apneic spells in infants. J. Appl. Physiol., 52(5):1288{1295, 1982.[121] Waggener, T.B., Southall, D.P., and Scott,L.A. Analysis of breathingpatterns in a prospective
population of term infants does not predict susceptibility to SIDS. Ped.Res., 27(2):113{
117, 1990.[122] Waggener, T.B., Stark, A.R., Cohlan, B.A., and Frantz,I.D. Apnea duration is related to
ventilatory oscillation characteristics in newborn infants. J. Appl. Physiol., 57(2):536{544, 1984.
[123] Ward,S.L. and Marcus,C. Obstructive sleep apnea in infants and young children.J.Clin.Neurophysiol, 13(3):198{207, 1996.
[124] Warner,G., Skatrud, J., and Dempsey,J.A. E�ect of hypoxia-induced PB on upper airwayobstruction during sleep. J.Appl.Physiol., 62(6):2201{2211, 1987.
[125] Weiner, D., Mitra, J., Salamone, J., and Cherniack, N.S. E�ect of chemical stimuli on nerves
of upper airway muscles. J. Appl. Physiol., 52(3):530{536, 1982.[126] West, J.B. Respiratory Physiology. Williams and Willaims Co., 1979.
48


