R Reactor Seepage Basins Soil Moisture and Resistivity ...
116
%, ? WSRC-TR-99-00330 R Reactor Seepage Basins Soil Moisture and Resistivity Field Investigation Using Cone Penetrometer Technology, Savannah River Site, Aiken, South Carolina by M. K. Harris WestinghouseSavannah River Company Savannah River Site Aiken, South Carolina 29808 J. V. Noonkester DOE ContractNo. DE-AC09-96SR1 8500 This paper was prepared in connectionwithwork done underthe above contractnumberwiththe U. S. Departmentof Energy. By acceptanceof this paper, the publisherancf/orrecipientacknowledgesthe U. S, Government’srightto retaina nonexclusive,royalty-freelicensein and to any copyrightcoveringthis paper, along withthe rightto reproduceand to authorizeothersto reproduceall or part of the copyrightedpaper.
Transcript of R Reactor Seepage Basins Soil Moisture and Resistivity ...

%, ?
WSRC-TR-99-00330
R Reactor Seepage Basins Soil Moisture and Resistivity FieldInvestigation Using Cone Penetrometer Technology, SavannahRiver Site, Aiken, South Carolina
by
M. K. Harris
WestinghouseSavannah River CompanySavannah River SiteAiken, South Carolina29808
J. V. Noonkester
DOE ContractNo. DE-AC09-96SR1 8500
This paper was prepared in connectionwithwork done underthe above contractnumberwiththe U. S.Departmentof Energy. By acceptanceof this paper, the publisherancf/orrecipientacknowledgesthe U. S,Government’srightto retaina nonexclusive,royalty-freelicensein and to any copyrightcoveringthis paper, alongwiththe rightto reproduceand to authorizeothersto reproduceall or part of the copyrightedpaper.
WSRC-TR-99-O0330Rev. O
R Reactor Seepage Basins Soil Moisture and ResistivityField Investigation using Cone Penetrometer Technology,Savannah River Site, Aiken, South Carolina (U)
Mary K. Harris, Jay V. Noonkester
September 1999
~QoNSIBl[/rkQ$
Prepared by: ● “X4
Westinghouse Savannah River CompanyAA~—~ pm ~—~ cc*- $
Savannah River Site ~ == “~: == ~
Aiken, SC 29808>ZD-AZ- .—
SAVANNAH RIVER SITE
Prepared for the U.S. Department of Energy UnderContract Number DE-AC09-96SR18500 ~
I

ii WSRC-TR-99-O0330, Rev. O,RRSB Soil Moisture and Resistivity Field Investigation with CPT I
DISCLMMER
This report was prepared as an account of work sponsored by an agency of the United StatesGovernment. Neither the United States Government nor any agency thereof, nor any of theiremployees, makes any warranty, express or implied, or assumes any legal liability or responsibilityfor the accuracy, completeness, or usefuhtess of any information, apparatus, product or processdisclosed, or represents that its use would not infringe privately owned rights. Reference herein toany specific commercial product.j process or service by trade name, trademark, manufacturer, orotherwise does not necessarily constitute or imply its endorsement, recommendation, or favoringby the United States Government or any agency thereof. The views and opinions of authorsexpressed herein do not necessarily state or reflect those of the United States Government or anyagency thereof.
This report has been reproduced directiy from the best avaiIable copy.
Available for sale to the public, in paper, from: U.S. Department of Commerce, National TechnicalInformation Service, 5285 Port RoyaJ Road, Springfield, VA 22161, phone: (800) 553-6847fax: (703) 605-6900email: orders@ ntis.fedworld.govonline ordering: http:lAvww.ntis.gov/ordering.htm
Available electronically at http://www.doe.gov/bridgeAvailable for a processing fee to U.S. Department of Energy and its contractors, in paper, from:U.S. Department of Energy, OffIce of ScientMc and Technical Information, P.O. Box 62, OakRidge, TN 37831-0062, phone: (865) 576-8401fax: (865) 576-5728email: reports@ adonis.osti.gov

DISCLAIMER
Portions of this document may be illegiblein electronic image
produced from the
document.
products. Images arebest available original

i
\
WSRC-TR-99-O0330Rev. O
I
BR Reactor Seepage Basins Soil Moisture and Resistivity
I Field Investigation using Cone Penetrometer Technology,Savannah River Site, Aiken, South Carolina (U)
9
Mary K. Harris, Jay V. Noonkester
September 1999
~qoNS181[/pkq..
Prepared by: ● “J+
Westinghouse Savannah River Company44 =—~*= - m—v‘c-D- *
Savannah River Site Jf --= ~: == ~&mma&m
Aiken, SC 29808. -—
SAVANNAH RIVER SITE
Prepared for the U.S. Department of Energy UnderContract Number DE-AC09-96SR18500

ii WSRC-TR-99-O0330, DRAFT, RRSB Soil Moisture and Resistivitv Field Investigation with (2PT
R Reactor Seepage Basins Soil Moisture and Resistivity Field Investigation using Cone
Penetrometer Technology, Savannah River Site, Aiken, South Carolina
Authentication and Approvals:
\z13\ ’17%“
M.K!. Harris, SRTC Date
/24/32
J. V.%oonkester, SRTC i Date
Date
/onnenberg, SRTC, M Date

WSRC-TR-99-O0330, Rev. O, RRSB Soil Moisture and Resistivity Field Investigation with CPT “””111
EXECUTIVE SUMMARY
Recent and historical water table levels at the R Reactor Seepage Basins (RRSBS) suggest
that a “perched” water table may exist directly beneath the RRSBS based on regulatory
documentation and groundwater modeling. Additional studies were conducted in the summer
of 1999 of the shallow groundwater system to determine if the water beneath the RRSBS is
actually perched or whether the shallow water table is in direct communication with the
underlying “transmissive zone”. Direct Push or Cone Penetrometer Technology (CPT) was
used to investigate the shallow water table beneath the basins. CPT soil moisture and
resistivity tests combined with CPT lithologic data (tip, sleeve, friction ratio, and pore
pressure) were performed at 10 locations. The CPT pushes were pushed to approximately
105’ to obtain a saturation profile from the surface to the top of the “transmissive zone” in
the Upper Three Runs Aquifer. Shelby tube samples were taken with the soil moisture
analysis to validate and confirm moisture percentage.
Upon completion of the field investigation the following sources of data were integrated to
determine the characteristics of the shallow water table:
. CPT data (moisture%, resistivity data, pore pressure, tip, sleeve, and friction ratio)
● Permeability data
● Water level and potentiometric data to determine head relations
. Contaminant Data
All the data indicate that perched water conditions occur on a seasonal basis during extremely
wet periods as were experienced in the spring of 1998. There is significantly less mounding
of the water table beneath the RRSBS with water levels being 10–15 feet lower during 1999.
This is due to the “draining” of the upper water table due to dry conditions in the summers of
both 1998 and 1999 along with the effects of the asphalt cover over the basins. CPT data
further indicates that the 1998 water levels were located on top of silty and clayey layers in
March 1998. In addition, the confining-like characteristics of the “A” and “AA” horizons
and the positive potentiometric surface of the underlying “Transrnissive” zone impede
vertical movement of groundwater from the surface to the “transmissive zone”. This
interpretation is corroborated by the extent of Sr-90 contamination in the upper water table
DU zone &d the absence of Sr-90 contamination in the lower DL (“transmissive” zone).
Therefore, contamination from the Principal Threat Source Material (PTSM) associated with
the RRSBS will not easily migrate into the underlying “transmissive zone”.

iv WSRC-TR-99-O0330, Rev. O, RRSB Soil Moisture and Resistivity Field Investigation with CPT
This page intentionally left blank

WSRC-TR-99-O0330, Rev. O, RRSB Soil Moisture and Resistivity Field Investigation with CPT v
Table of Contents
9 EXECUTIVE SUMMARY...
..........................................................................................................1111.0 Introduction ..........................................................................................................................*. 1
1.1 Hydrogeology and Extent of Contamination ..................................................................... 11.2 Field Characterization Methodology using the Cone Penetrometer Soil Moisture &Resistivity Probe ..........................................................................................................................
2.0 Field data acquisition and sampling results ......................................................................... :3.0 Interpretation ......................................................................................................................... 64.0 Summary ................................................................................................................................. 8
9
5.0 Recommendations .................................................................................................................. 9REFERENCES ............................................................................................................................ 24

Ivi WSRC-TR-99-O0330, Rev. O, RRSB Soil Moisture and Resistivity Field Investigation with CPT
List of Tables and Figures D
Table 1: Name and locations of the RR CPTS.................................................................................................. 3
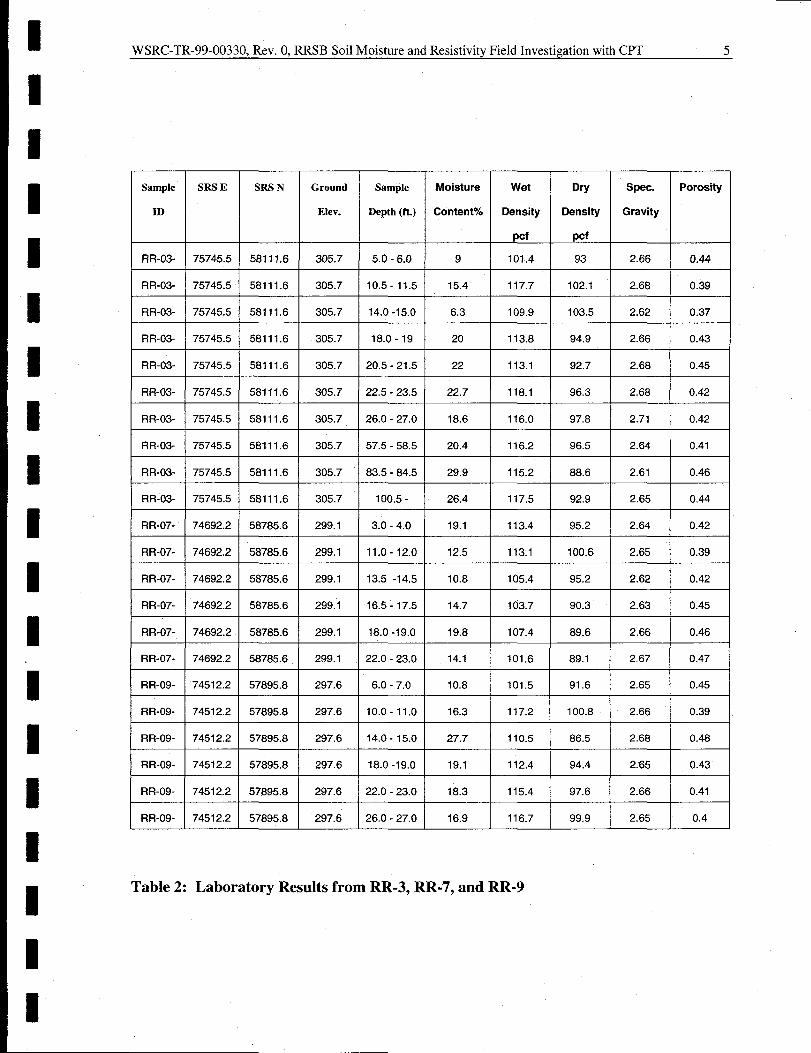
Table 2: Laboratory Results from RR-3, RR-7, and RR-9 ............................................................................. 5
Figure 1:
Figure 2:
Figure 3:
Figure 4:
Location of the R Reactor Seepage Basins within R Reactor Area. ............................................ 11
Conceptual Hydrogeologic Diagram for the R Reactor Seepage Basins ..................................... 12
Water Table Map – DU screen zone – March 1998, Contour Interval = 5 Ft . ......................... 13
Transmissive zone Potentiometric Surface – DL screen zone – March 1998, Contour Interval=5 Ft . ............................................................................................................................................................ 14
Figure 5: Soil Moisture Probe CPT Locations ............................................................................................... 15
Figure 6: Areal Extent of Contamination illustrating 2 CPT pushes inside fenced area ............................ 16
Figure 7: CPT RR-03 illustrating Friction Ratio, Pore Pressure, Resistivity, and Volume % moisturewith March 1998 and June 1999 water levels from the DU and DL screens of Well RPC-1 .............17
Figure 8: CPT RR-07 iHustrating Friction Ratio, Pore Pressure, Resistivity, and Volume % moisturewith March 1998 and June 1999 water levels from the DU and DL screens of Well RPC-1 .............18
Figure 9: CPT RR-09 illustrating Friction Ratio, Pore Pressure, Resistivity, and Volume YO moisturewith March 1998 and June 1999 water levels from the DU and DL screens of Well RPC-1 .............19
Figure 10: East-West Cross-Section with CPT RR-09, RR-19A, RR-3 illustrating volume % moistureand resistivity CPT curves with March 98 and June 99 DU and DL water elevations plotted.Traverse for cross-section is located on Figure 5....................................... .. .... ................................. ..... 20
Figure 11: Three-dimensional grid of volume percent moisture. Yellow and red area indicate saturatedzone. .......................................................................................................................... ................................. 21
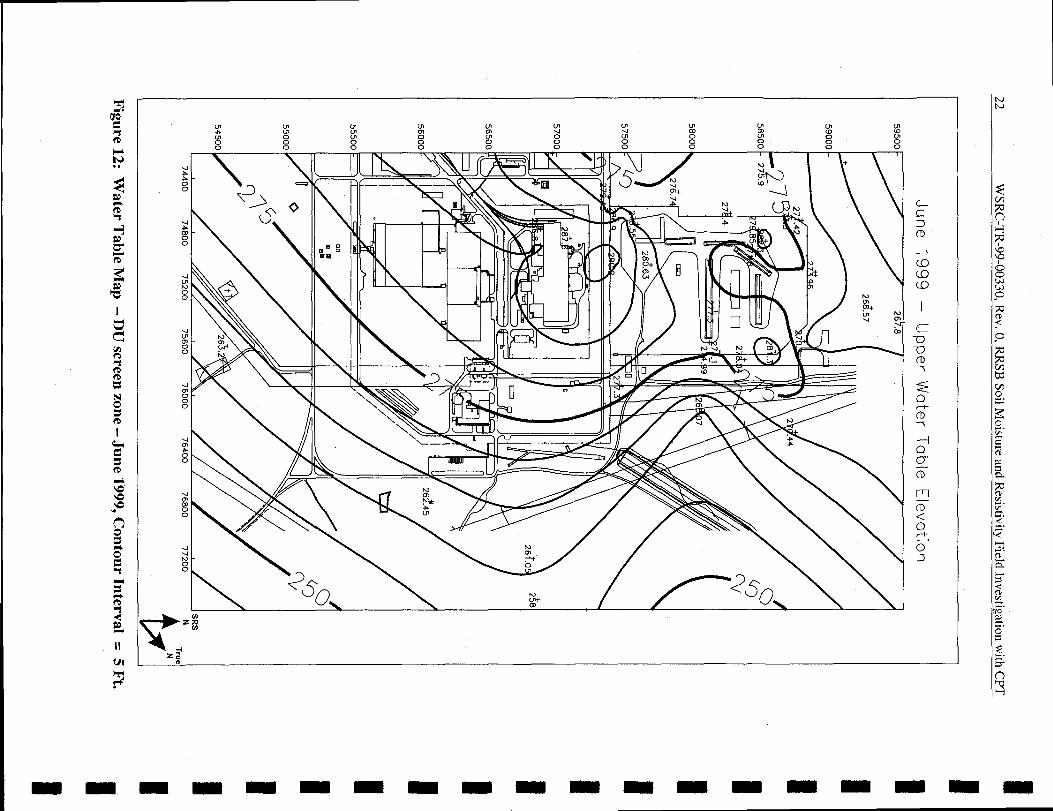
Figure 12: Water Table Map – DU screen zone – June 1999, Contour Interval = 5 Ft . .......................... 22
Figure 13: Transmissive zone Potentiometric Surface – DL screen zone – June 1999, Contour Interval =

WSRC-TR-99-O0330, Rev. O, RRSB Soil Moisture and Resistivity Field Investigation with CFT 1
1.0 Introduction
Recent and historical water table levels at the R Reactor Seepage Basins (RRSBS) (Figure 1)
suggest that a “perched” water table may exist directly beneath the basins. Recent regulatory
documentation (WSRC, 1998) and groundwater modeling (Jones and others, 1998) both
indicated that additional study of the shallow groundwater system is needed to determine if
the water beneath the RRSBS is actually perched or whether the shallow water table is in
direct communication with the underlying “transmissive zone”. The understanding of the
shallow water table in relation to the hydrology of the area is essential for the ongoing
feasibility study for the waste unit. Whether or not the water table is perched may impact the
remedial alternative selection for the Principal Threat Source Material (PTSM). If the water
table is “perched”, then it is part of the soil column above the “Transmissive zone” (which
would become the first viable aquifer zone). If this is the case soil leachability would be
considered from the contaminant source to the “transrnissive zone for the purpose of remedial
technology selection”. The focus of this report is the summer 1999 investigation of the
shallow groundwater system using cone penetrometer technology (CPT) characterization
methods to determine if the water table is perched beneath the RRSBS.
The characterization plan for this study was documented in a Workplan Addendum outlining
additional field characterization for the RRSB Workplan/RFI/RI for the RRSB (WSRC,
1999a).
1.1 Hydrogeology and Extent of Contamination
There are four hydrostratigraphic units that are important to contaminant migration. Figure 2
is a conceptual hydrogeological model for the RRSB area. The seepage basins are located in
undifferentiated surface soils of varying thickness. The “A” and “AA” horizons immediately
beneath the seepage basins, and correspond to the Upland Unit and Tobacco Road Formation.
The “A” and “AA” horizons both are similar to confining units with relatively low hydraulic
conductivities (average 1.Ox10-7 crnlsc and 1.Ox10-6 cmlsec, respectively). The
“Transmissive” zone underlies the “AA” horizon, and correlates to the Irwinton Sand of the
Dry Branch Formation. This zone has relatively high hydraulic conductivity averaging
1.Ox10-4crnlsec.
Groundwater is present in the “A” and “AA” horizons and the “Transmissive” zone. The
hydraulic characteristics of the “A” and “AA” horizons are not well understood because these
strata behave more like confining units than aquifers. The vertical mobility of the

2 WSRC-TR-99-O0330, Rev. O, RRSB Soil Moisture and Resistivity Field Investigation with CPT
groundwater within these low permeability units is also not well understood. Figure 2
illustrates how the groundwater in the “A” and “AA” (DU) horizons is at similar head to the
potentiometric surface of the “Transmissive” zone (DL) to the west of the waste units. This
is supported by the water table surface of the “A/AA” and potentiometric surface of the
“Transrnissive” zone (Figures 3 and 4). In the area underlying the RRSBS the groundwater
surface associated with the “Transmissive” zone (DL) drops toward the “Old” R Area
Discharge Canal, which indicates the aquifer discharges into the canal. However, in the same
area the water table surface associated with the “AlAA” horizon (DU) is relatively flat lying
when compared to the “Transmissive” zone (DL) which suggests minimal connection
between the two water bearing units.
The majority of the Contaminants of Concern (COCS) associated with PTSM have not
migrated significantly within the vadose zone, and tend to remain within the contaminated
soils in the backfilled basins. However, a portion of the Sr-90 associated with the PTSM, has
migrated to the groundwater within the “A” horizon. Am-241, Pu239/240 are also
contaminant migration constituent of concern (CMCOCS) are therefore predicted to migrate
from the PTSM to the groundwater at activities above their respective maximum contaminant
level (MCL). The potential for migration of contaminants in the groundwater within the “A”
horizon, to deeper stratigraphic units, is dependent upon the connection between the water
bearing units. Therefore it is very important to have a good understanding of the hydraulic
characteristics of these hydrostratigraphic units, and the degree of connectivity of the units, to
make good predictions of contaminant transport. In addition, this information is critical to a
proper selection of remedial alternatives.
1.2 Field Characterization Methodology using the Cone Penetrometer Soil Moisture&
Resistivity Probe
Soil Moisture Probes were evaluated at the Savannah River Site in 1996 and 1997 (Argonne
National Laboratory, 1997) through the Site Characterization and Analysis Penetrometer
System. The soil moisture probe is used in conjunction with direct push technology to obtain
real-time data to measure subsurface volumetric soil moisture. Shelby tube samples are taken
with the soil moisture analysis to validate and confirm moisture percentage. In addition,
resistivity log profiles were used in conjunction with the soil moisture percentage
measurements. Based on prior studies conducted at the SRS, the soil moisture percentages
increase as the probe approaches the saturated zone, while the resistivity decreases with the

WSRC-TR-99-O0330, Rev. O, RRSB Soil Moisture and Resistivity Field Investigation with CPT 3
increase in water in the pore space of the sediments (WSRC, 1999, Argonne National Labs,
1997).
CPT soil moisture and resistivity tests combined with CPT lithologic data (tip, sleeve,
friction ratio, and pore pressure) were performed at 10 locations (Figure 5 and Table 1). The
CPT pushes were pushed to approximately 105’ through the undifferentiated surface soils,
“A” Horizon and “AA” Horizon to obtain a saturation profile from the surface to the top of
the “transmissive zone” in the Upper Three Runs Aquifer. The CPT pushes were terminated
at the top of the “Transmissive zone”. Two of the CPT pushes (RR-19A and 19-B) were
inside the RRSB fence (Figure 5), and required RCO/HP coverage. The locations within the
RRSB fenced area were chosen based on the RRSB RFI/RI characterization work that
delineated the extent of contamination (Figure 6). The locations are in non-contaminated
areas within the fence (Figure 5 & 6).
The remaining 8 pushes were completed outside the fence and did not require RCO/HP
coverage (Figure 5). All of the locations are being done near existing lithologic pushes to
maximize hydrogeologic data in the area for interpretive purposes. Shelby tubes were
collected at 3 locations for soil moisture percentage and porosity. Shelby tube samples were
collected, sealed, and stored according to WRSC-3Q5.
I CPT ID I SRSE I SRSN I Elevation II RR-19A I 75349.1 I 57966.3 I 306.63 II RR-19B I 75534.1 I 57887 I 306.63 I
RR-3 75745.5 58111.6 305.7
RR-4 75727.98 58380.3 299.2
I RR-5 I 75609 I 58798.8 I 301.4 IJ
RR-6 75115.7 58891.3 297.8
RR-7 74692.2 58785.6 299.1
RR-8 74657.5 58283.4 299.9
RR-9 74512.2 57895.8 297.6
RR-10 74538.6 57354 291.6
Table 1: Name and locations of the RR CPTS

4 WSRC-TR-99-O0330, Rev. O, RRSB Soil Moisture and Resistivity Field Investigation with CPT
2.0 Field data acquisition and sampling results
Field data acquisition began on 6/14/99 and ended
are reported in Appendix A. Initially, electrical
I9
on 7/1/99. Details of the daily activities
connection problems required repeating Iseveral of the pushes to ensure quality data was collected. Other than the electrical m
malfunctions, the remaining field work went smoothly. Appendix B contains plots of the 10
pushes with sleeve and tip stress, friction ratio, pore pressure, resistivity, and volume percent I
moisture plotted.
Shelby Tube Samples were collected at RR-3, RR-7, and RR-9. Table 2 summarizes the
results. Figures 7 -9 illustrates the sample locations and percentages in relation to the CPT
data and June water levels at nearby RPC-3 DU and DL. Soil samples were taken in clear B
tubing in four foot sections. The samples were then examined to determine where to take the
sample based on the CPT results and lithologic type. Samples were analyzed by LAW I
Engineering and Environmental Services in Atlanta, GA for Grain Sieve Wash 200 (ASTM
D422) and volumetric soil moisture content, density and porosity (EM1 110-2-1906). IAppendix C provides the detailed results from LAW Engineering and Environmental
Services.
Samples were taken at RR-3 beginning at a depth of 5 feet. A total of 10 samples were taken
ending at 101.5 feet. Again, samples were taken based on the lithology and in relation to the 9
response on the CPT moisture percentage curve (Figure 7). Generally, the results match well
with the laboratory results and the predicted moisture from the CPT probe. In the upper 30I
feet of RR-3 there is variability of approximately 15% moisture percentage in interbedded
sandy, silty and clayey sediments. In the lower portion of RR-3 the moisture percentage is
relatively stable with variability of approximately 10Yo.
9
WSRC-TR-99-O0330, Rev. O, RRSB Soil Moisture and Resistivity Field Investigation with CPT 5
Sample SRSE SRS N Ground Sample Moisture Wet Dry Spec.
ID Elev. Depth (ft.) Content% Density Density Gravity
pcf pcf
RR-03- 75745.5 58111.6 305.7 5.0- 6.0 9 101.4 93 2.66
RR-03- 75745.5 58111.6 305.7 10.5 -11.5 15.4 117.7 102.1 2.68
RR-03- 75745.5 58111.6 305.7 14.0 -15.0 6.3 109.9 103.5 2.62
RR-03- 75745.5 58111.6 305.7 18.0-19 20 113.8 94.9 2.66
RR-03- 75745.5 58111.6 305.7 20.5 -21.5 22 113.1 92.7 2.68
RR-03- 75745.5 58111.6 305.7 22.5 -23.5 22.7 118.1 96.3 2.68
RR-03- 75745.5 58111.6 305.7 26.0 -27.0 18.6 116.0 97.8 2.71
RR-03- 75745.5 58111.6 305.7 57.5 -58.5 20.4 116.2 96.5 2.64
RR-03- 75745.5 58111.6 305.7 83.5 -84.5 29.9 115.2 88.6 2.61
RR-03- 75745.5 58111.6 305.7 100.5- 26.4 117.5 92.9 2.65
RR-07- 74692.2 58785.6 299.1 3.0- 4.0 19.1 113.4 95.2 2.64
RR-07- 74692.2 58785.6 299.1 11.0 -12.0 12.5 113,1 100.6 2.65
RR-07- 74692.2 58785.6 299.1 13.5 -14.5 10.8 105.4 95.2 2.62
RR-07- 74692.2 58785.6 299.1 16.5 -17.5 14.7 103.7 90.3 2.63
RR-07- 74692.2 58785.6 299.1 18.0 -19.0 19.8 107.4 89.6 2.66
RR-07- 74692.2 58785.6 299.1 22.0 -23.0 14.1 101.6 89.1 2,67
RR-09- 74512.2 57895.8 297.6 6.0- 7.0 10.8 101,5 91.6 2.65
RR-09- 74512.2 57895.8 297.6 10.0 -11.0 16.3 117.2 100.8 2.66
RR-09- 74512.2 57895.8 297.6 14.0 -15.0 27.7 110.5 86.5 2.68
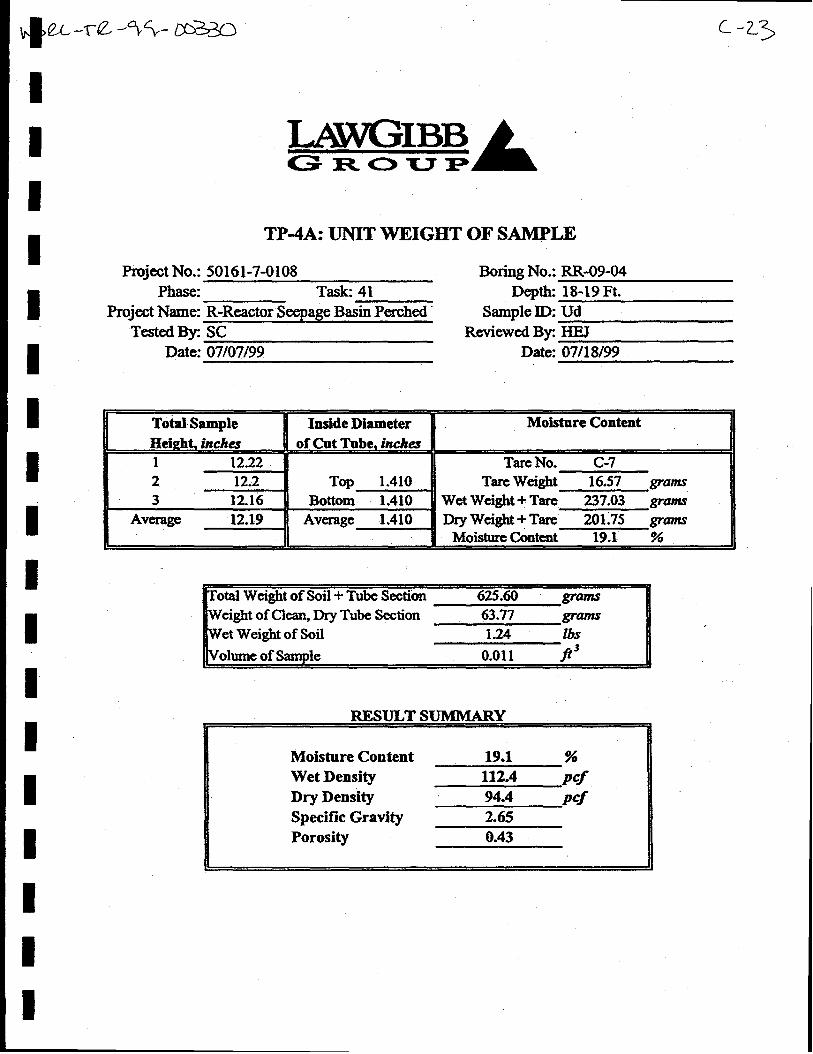
RR-09- 74512.2 57895.8 297.6 18.0 -19.0 19.1 112.4 94.4 2.65
RR-09- 74512.2 57895.8 297.6 22.0 -23.0 18.3 115.4 97.6 2.66
RR-09- 74512.2 57895.8 297.6 26.0 -27.0 16.9 116.7 99.9 2.65
Table 2: Laboratory Results from RR-3, RR-7, and RR-9
Porosity
0.44
0.39
0.37
0.43
0.45
0.42
0.42
0.41
0.46
0.44
0.42
0.39
0.42
0.45
0.46
0.47
0.45
0.39
0.48
0.43
0.41
0.4

6 WSRC-TR-99-O0330,Rev. O,RRSB Soil Moisture and Resistivity Field Investigation with CPT
Samples were taken at RR-7 beginning at 3 feet. A total of 6 samples were taken ending at
23 feet. The agreement is good for the correlation between the laboratory values and CPT
probe predictions for soil moisture. There is approximately 15% variability in the laborato~
values in the highly interbedded sandy, silty, and clayey sediments in the upper 30 feet of ,
RR-7. There is excellent correlation between the lithology defined by the friction ratio with
the pore pressure response, resistivity and moisture percentage curves (Figure 8).
Samples were taken at RR-9 beginning at 6.0 feet. A total of 6 samples were taken ending at
27 feet. Again, agreement is relatively good for the correlation between the laboratory values
and CPT probe predictions for soil moisture. The sediments are not as highly interbedded in
RR-09 as in RR-03 and RR-07. This is reflected in the higher moisture percentage values
around 15 feet. Correlation is good between the Iithology defined by the friction ratio with
the pore pressure response, resistivity and moisture percentage curves (Figure 9).
Figure 10 illustrates an east-west cross-section labeled A – A’ (traverse location on Figure 5)
through sample points RR-9, RR- 19A, and RR-3. The cross-section also illustrates the water
table DU elevations and the “Transmissive” zone potentiometric surface DL elevations in
March 1998 and June 1999. This relation will be discussed in the next section.
Figure 11 is a 3-dimensional grid of the soil moisture probe data over the RRSB data. The
grid illustrates that the lower percent moisture is near the surface in the surface soils and “A”
horizon and the higher percent moisture is correlative with the elevation of the
“Transmissive” zone potentiometric surface. The moisture percentage is relatively stable
below this surface.
3.0 Interpretation
The purpose of the study was to determine if “perched” water conditions exist in the shallow
water table system at the RRSBS, Upon completion of the soil moisture probe and resistivity
study other data was combined to better resolve and understand the characteristics of the
shallow hydrogeology.
The RPC wells that rim the RRSBS (Figure 5) were installed in March 1998. During
installation the region experienced unusually heavy rains from the “El Nine” effect of Pacific
Ocean heating. Upon completion of the well installation water table measurements indicated
an extremely high water table surface, sometimes within 0.5 feet of the ground surface
(Appendix D and Figure 3). The monthly water table measurements begun in August 1998
WSRC-TR-99-O0330, Rev. O, RRSB Soil Moisture and Resistivity Field Investigation with CPT 7
continue to be collected. The water levels have dropped significantly since March 1998.
Appendix D contains the hydrography for the RPC wells around the RRSBS. Figures 7 – 9
illustrate the water level differences experienced from March 1998 until June 1999 at RPC-
3DU/RR-03, RPC-7DU/RR-07, and RPC-9DU/RR-09. At all three locations the water table
has dropped significantly ranging from 10 – 15 feet with very small differences currently
observed between the upper DU “A/AA” horizon water table screen and the lower DL
“transmissive” zone screen of 2 – 5 feet.
Figures 3 and 4 and Figures 12 and 13 illustrate the March 98 and June 99 water table surface
for the DU screens and DL screens, respectively. Notice, that there is significantly less
mounding underneath the basins in June 99 for the upper water table surface in the DU
screens. This is interpreted to be from the “draining” of the upper water table due to dry
conditions that have been experienced in the summers of both 1998 and 1999 and the effects
of the asphalt cover over the basins. The soil moisture probe data supports this interpretation.
Figures 7 (RR-03) and 8 (RR-07) illustrate that in March 1998 the DU screen zone water
levels were located on top of silty and clayey layers and therefore were exhibiting perched
conditions during that timeframe. During 1999 the DU water levels have dropped and have
stabilized with very little head separation between the DU & DL water elevations. The DU
water levels appears to have little effect on vertical groundwater movement. This is
consistent with the vertical permeabilities and horizontal groundwater flow velocities cited in
the August 1998 RFI/RI/BRA (WSRC, 1998). The average vertical permeability for the “A”
horizon is l. OXIO-Gcrn/sec and the annual horizontal movement is approximately 9.2
cmlyear. This coupled with the positive head conditions of the underlying “transmissive
zone” support the that the PSTM will not easily migrate into the underlying transmissive
zone.
The soil moisture probe CPT data (volume moisture 910,resistivity data, pore pressure, tip,
sleeve, and friction ratio) coupled with the water level data indicate strongly that perched
water conditions occur on a seasonal basis during extremely wet periods as were experienced
in March 1998. However, due to the confining like characteristics of the “A’ and “AA”
horizons and the positive potentiometric surface of the underlying “Transmissive” zone the
vertical movement of groundwater from the surface to the “transmissive zone” is not likely.
This interpretation is corroborated by the extent of Sr-90 contamination in the upper water
table DU zone and the absence of Sr-90 contamination in the lower DL (“transmissive” zone)
as reported in the RFI/RI/BRA (WSRC, 1998).

8 WSRC-TR-99-O0330,Rev. O,RRSB Soil Moisture and Resistivity Field Investigation with (YT
4.0 Summary
Recent and historical water table levels at the RRSBS suggested that a “perched” water table
may exist directly beneath the RRSBS based on regulatory documentation (WSRC, 1998) and
groundwater modeling (Jones and others, 1998). Additional studies were conducted in the
summer of 1999 of the shallow groundwater system to determine if the water beneath the
RRSBS is actually perched or whether the shallow water table is in direct communication
with the underlying “transrnissive zone”.
Direct Push Technology was used to investigate the shallow water table beneath the basins.
CPT soil moisture and resistivity tests combined with CPT lithologic data (tip, sleeve,
friction ratio, and pore pressure) were performed at 10 locations. The CPT pushes were
pushed to approximately 105’ through the undifferentiated surface soils, “A” Horizon and
“AA” Horizon to obtain a saturation profile from the surface to the top of the “transmissive
zone” in the Upper Three Runs Aquifer. Shelby tube samples were taken with the soil
moisture analysis to validate and confirm moisture percentage.
Upon completion of the field investigation the following sources of data were integrated to
determine the characteristics of the shallow water table:
. CPT data (volume
ratio)
. Permeability data
moisture 9ii, resistivity data, pore pressure, tip, sleeve, and friction
● Water level and potentiometric data to determine head relations
. Contaminant Data
All the data indicate that perched water conditions occur on a seasonal basis during extremely
wet periods as were experienced in March 1998. There is significantly less mounding of the
water table beneath the RRSBS with water levels being 10 –15 feet lower during 1999. This
is interpreted to be from the “draining” of the upper water table due to dry conditions in the
summers of both 1998 and 1999 and the effects of the asphalt cover over the basins.
Perched water is also indicated by the lithologic data. Careful examination of the CPT data
and water level data illustrate the March 1998 DU screen water levels were located on top of
silty and clayey layers in March 1998.

WSRC-TR-99-O0330, Rev. O, RRSB Soil Moisture and Resistivity Field Investigation with CPT 9
Furthermore, the confining like characteristics of the “A” and “AA” horizons (based on
permeability data) and the positive potentiometric surface of the underlying “Transmissive”
zone impede vertical movement of groundwater from the surface to the “transrnissive zone”.
This interpretation is corroborated by the extent of Sr-90 contamination in the upper water
table DU zone and the absence of Sr-90 contamination in the lower DL (“transmissive” zone)
as reported in the RFI/RI/BRA (WSRC, 1998). Therefore, contamination from the PTSM
associated with the RRSBS will not easily migrate into the underlying “transmissive zone”.
5.0 Recommendations
Monitoring of the R Area wells water elevations on a monthly basis should be continued. In
addition, individual monitoring of selected wells should be initiated. Electronic
instrumentation that can measure the water levels on a timed interval should be considered.
This would allow for rain events to be monitored to verify the perching of water on the silty
and clayey layers near the ground surface.
The new piezometers that were installed to monitor water levels near the R-Area Canal
should be measured on a monthly basis. In addition, these wells should be considered for
individual monitoring as well as described above.
Multi-well pumping tests are planned at the RPC-1 and P-20 cluster during FYOO. The
information from these tests should be integrated into the soil moisture/resistivity field
characterization results to further understand the shallow hydrogeology and its relation to
contaminant migration of the PTSM to the subsurface beneath the RRSBS.
10 WSRC-TR-99-O0330, Rev. O, RRSB Soil Moisture and Resistivity Field Investigation with CPT
This page intentionally left blank.

WSRC-TR-99-O0330, Rev. O, RRSB Soil Moisture and Resistivity Field Investigation with CPT 11
\
‘h------w4R Reactor Seepage Ba~
.. D
SRSN
True
b
N
Fignre 1: Location of the R Reactor Seepage Basins within R Reactor Area.

12 WSRC-TR-99-O0330. Rev. O. RRSB Soil Moisture and Resistivitv Field Investigation with CFT
Evapdranspiratton
$4,jj
Q
Precipitulton
)( ., j \ --
_- -- -_
Figure 2: Conceptual Hydrogeologic Diagram for the R Reactor Seepage Basins

WSRC-TR-99-O0330, Rev. O, RRSB Soil Moisture and Resistivity Field Investigation with CPT 13
March 1998 – Upper Water Table Elevation
59500 2*9 { J [A’ 1
\ 1. t
\ /
— Z1 I
Ill lNiYK\\ \ I
w ~ ,,*
mOa:
~~ —
I ,+55000- 2~~2?4
-+’cj-
54500 -
74400 74800 75200 75600 76000 76400 768001“SRS
N77200 TN
b
)’4
F@me 3: Water Table Map – DU screen zone – March 1998, Contour Interval = 5 Ft.

14 WSRC-TR-99-O0330, Rev. O, RRSB Soil Moisture and Resistivity Field Investigation with CPT
March 1998 – Transmissive zone Potentiometric Surface
SRS..
Tru(
%
N
Figure 4: Transmissive zone Potentiometric Surface - DL screen zone – March 1998,Contour Interval = 5 Ft.

WSRC-TR-99-O0330, Rev. O, RRSB Soil Moisture and Resistivity Field Investigation with CPT 15
74400 74600 74800 75000 75200 75400 75600 75800 76OOO59200 , , , I , ,
1’ \\\ \ II
SRSN
TNe
59000
If
N
RPC–6*,
RR-07 RR-08*
58800 -.d 1
R 5 %$-5d i75B-34
58600t I LA’
58400 -
58200 -
58000 -
57800 -
57600 -
I RR.,O1L_--’” 19+7
57200 I I 1[
LBBackground @ “Clean” ■ SourceLayer V CPT
*Soil MoistureProbeCPT locations
Figure 5: Soil Moisture Probe CPT Locations

16 WSRC-TR-99-O0330, Rev. O, RRSB Soil Moisture and Resistivity Field Investigation with CPT
/’R’Reactor seepage B“&J~~.<. ... ... ... ... ........ .... ........ .... .. ....... ....... . ... .. .. .... . . ... .
,,
l~-l=n’-----;”l----------::
Proces:Sewer
Areal Extent ofContamination
200 Feet SRSN
x CPT Locations
Inside Fence
True
b’N
$anitary Sewer
Figure 6: Areal Extent of Contamination illustrating 2 CPT pushes inside fenced area.

WSRC-TR-99-O0330, Rev. O, RRSB Soil Moisture and Resistivity Field Investigation with CPT 17
%.ktik.f:dim-.
U------.--- lmllo
F@me 7: CPT RR-03 illustrating Friction Ratio, Pore Pressure, Resistivity, andVolume % moisture with March 1998 and June 1999 water levels from the DU and DLscreens of Well RPC-1

18 WSRC-TR-99-O0330, Rev. O. RRSB Soil Moisture and Resistivitv Field Investigation with CPT
?mject: 4569 R-Reactor Seepage Basin 1...,.;e.JCi..a-m59 1
rest m : RE-07:IIZ: SRS, Aiken SC Soil Moisture and Resistiviky Study;CcAmou : F.-Area
l%~?h?.=1. (cm) P.,, PC,.,.,,
O-----------io U–-–--––----25
~-i–--–––—--.——-—----
—
Pesi..ivity
Cdml-m.
O-------- i833O
vol. !4.13 ,”,,(+)
2-----------1OG
4==June 99
I)L
Figure 8: CPT RR-07 illustrating Friction Ratio, Pore Pressure, Resistivity, andVolume % moisture with March 1998 and June 1999 water levels from the DU and DLscreens of Well RPC-1

WSRC-TR-99-O0330, Rev. O, RRSB Soil Moisture and Resistivity Field Investigation with CPT 19
Project: 4569I!Qst w: SS-09;SXS: SSS, a.iken SCkxamom: u-kr.sa
Rm,o lCOKjiepth, D-----------lil
E-lG
-2G
-30 \
.413 \
-5s
-6G I
9
R-Reactor Seepage Basti
Soil Moisture and Resistivity Stwly
P.e3iscivit-,?“,, Pres, ure oh- .
0-----------15 O-------- llxme
B
!r,l. Ea,*t*e P%;
S-------–---l fflc!
——
—
F@me 9: CPT RR-09 illustrating Friction Ratio, Pore Pressure, Resistivity, andVolume % moisture with March 1998 and June 1999 water levels from the DU and DLscreens of Well RPC-1

------- ------9 -D --
C/l0-!

%
.
. .
Transmkivezane .PatentiametrlcSurface
Moisture
P4Z035.0
? 300
m2s.0
2 C?mg$wrwm’4,0
~igure 11: Three-dimensional grid of volume percent moisture. Yellow and red area indicate saturated zone.
I
c-uw(1)-1

R
WSRC-TR-99-O0330. Rev. O. RRSB Soil Moisture and Resistivitv Field Investigation with CPT 23
June 1999 – Transmissive zone Potentiometric Surface
Figure 13: Transmissive zone Potentiometric Surface – DL screen zone – June 1999,Contour Interval = 5 Ft.

24 WSRC-TR-99-O0330, Rev. O, RRSB Soil Moisture and Resistivity Field Investigation with CPT
REFERENCES
Argonne National Laboratory, Environmental Research Division, 1997, Evaluation Report:
Study of Three Soil Moisture Probes with Laboratoq Sample Results, Version 01, 8129/97,
Environmental Research Division, Argonne National Laboratory, Argonne, Illinois.
Jones, W.F., Haselow, J. S., Harris, M. K., and Denham, M.E., 1998, Groundwater Flow and
Contaminant Transport for the R-Reactor Seepage Basins (U), WSRC-OS-00011, Rev. O
HydroGeoLogic, Inc., Herndon, VA, 406p. A98
WSRC, 1998, RCRA Facili~ Investigation Remedial Investigation Report with Baseline Risk
Assessment for the R-Reactor Seepage Basins 108-4R Overjlow Basin Operable Unit (U),
WSRC-RP-003 14, Rev. O, August 1998, Westinghouse Savannah River Company, Aiken,
SC 29808.;~
WSRC, 1999, E- Area Vadose Zone Proposed Plan, WSRC-RP-99-4039, Revision O, 30
pages, April 1999, Westinghouse Savannah River Company, Aiken, SC 29808.
WSRC, 1999a, Additional Field Investigation R-Reactor Seepage Basins for Revised
Operable Unit Strategy (U), WSRC-RP-4082, Rev. O, June, 1999, Westinghouse Savannah
River Company, Aiken, SC 29808. ~ ~
Westinghouse Savannah River Company, Current Version, WSRC 3Q5, HydroGeologic
Data Collection Methods, Procedures, and Specifications.

WSRC-TR-99-00330, Rev. O, RRSB Soil Moisture and Resistivity Fleid Investigation
A-1
I
991BI9999
Appendix A – Daily Activities Report

A-2 WSRC-TR-99-O0330. Rev. O, RRSB Soil Moisture and Resistivity Field Investigation
This page intentionally left blank

A-3F -Tf2 +$+ CD3ix)o.lss(2.lj.97)
9. Daily Activities Report
;-
B .

.A-4.OSR 30-28. (2.11.97)
Daily Activities Report
I ITechnicalOversightSinature
p (-/5 -77 Ii J

A-5
Daily Activities Report7
Ius;.{:+ IOf& u~fi<qb+;otiOfilllngSubcontfactor
I i
I I
i
I II
II I #
BTechnical OversightSignature Ioale g_/g -99
u-
.

XR JO.2S~ (2-13.97)
Daily Activities Report1
Projed
8 so,”] /??cTAhn5ILbwe Zh Lu6?.sGA)&e) 8uiiT/ &
13contractor
h~ L&k .-Nt.unber edlrllcal Oversirsht IOverwht I-IMS

A---l
Daily Activities Report
Loca’kM‘ted- /2?”79 l“? ~ “’a
I I
i
I 1
I I
o1 I
Technical OversightSig
I“a’e <-N-77/
9

&O.OSR 30-28# (2- 13.97)
. Daily Activities Report
stat I StOD I t)eauidion ofArAiviialRemarka
I
!
Technical OversightSin Date
<-2-/-Ty
u-’

A-3OSR)0-28s {2-! 1+7)
start i Stoo 1 Deacriotbnof&h&dWma d(a 1
I I I
I I. .
I I
I I I I
I I
I I I
I
II I
Technical Oversght Signature
~6-27&?d

3SR10-286 (2-1 )-’77)
Daily Activities Report
, ,t
1“I
1
I I I
I I I
I 1Technical OversightSignature Ioate <.>3-77
J

I . Daily Activities Report1
1 1 1
Tectwkd Oversight Sinaturepte <.29 -m

b z . LYQl_-TQ_. 5<- a33dmli 30.2s8(1-11-97)
Daily Activities Report
I I I 7—i—i I
,t 1
,I . . I
1-1
[
II
I
I
I I
I 1 I
I ITechnical ovets.ightSignature Date
d-z5-77Y .

1.5U- .T (z-v--) -113.2W(2. I ).97)
9 Daily Activities Report
&\3
1 I
I 1 . I
9B
I iTechnical Oversigh!S~gnature Date

Daily Activities Report

A-Ex~.& (2. t3.Q7)
Daily ActivitiesReport
—
I 1
1 1 1 I
...

A-L.SRJ:-lSB (2,1 }-$’7)
Daily Activities Report
Start I Stoll I fkscrbtion of ~ I
\ I
I
II1 1
Techn’kal OversJqhtSqnatme1“”= ?-/- ?9 Iv w

9 WSRC-TR-99-00330, Rev.O, RRSB Soil Moisture and Resistivity Field Investigation B-1
u
I
I
I
B
D
s
Appendix B – Cone Penetrometer Data

w&CD
-----m- m--m--mm -----

WSRC-TR-99-O0330, Rev.O, RRSB Soil Moisture and Resistivitv Field Investigation B-3
-@l
-la
-20
-36
-40
-m
-a-TIT
-m
C&-——----m a-—------z5 &—————m3m
z
0--—-—w3 AW -
f3LW
mu
ma
Zlil
2M
Zw
Z473
Z3U
;~
23J
pa
-25
-20
-xl
-43
-38
-6U
74s
-%0
-ml
-u
w.- stress(W@ T@ SZ.essra%). R3.tia(mm13-——————4m
< -
-
m---—?mnn!i9-
~ .
—
WIL FIsis&d6E (%13-—-–-2IE el.eu -
c
[
290
I
2s5
Z7K
~@-
25U
3
I
245
-“zm
22fi-
210
ZKJ3
T
RR-04

~4 WSRC-TR-99-O0330, Rev.O, RRSB Soil Moisture and Resistivitv Field Investigation
ZOied : 4569-s* 2D: =-OSm : Sus, A,aen Sc-Om : R-Area
sleeve stress(tfs)
:ptb
-lo
-2!3
-30
-40
-50
-60
-70
-80
-90
-10
.n
Ctcx SeeD~—
Soil Moisture and Resistivitv Study~~- ——
Tip stress(tfsl Ratio (COR) Pore e.ess.reltfs>Resi3tivity(0hm-rOJV’J1M.i,tuml%)O---------4OD W----------lu 0---------1s
?
RR-OS
Pr03*et: 4569%St ID: =-06
See~S?az:s=. Ilikul2C Soil Moisture an d Resistivity Studv Ir=am.L0ciwr2w:”E-xr.a
sleeve Stress (tfs>
~ -50
-60
-70
-80
-99
[ -10
Tip stress (tfsl Rat1. (Ccw mm Pms%ure (tfs.} Re. istivity(okmm) VO1 Moisture [%)
0---------4 @cl 0-----------10 0---------25 D------mono 0------–100 ele”.
F
II[291
28[
~27[
26[
25[
24[
>
RR-06
——
I23[
22(

WSRC-TR-99-O0330, Rev.O, RRSB Soil Moisture and Resistivity Field Investigation B-5
3=-
RR-08
a-—-----m +-. I

&6 WSRC-TR-99-O0330, Rev.O . RRSB Soil Moisture and Resistivity Field Investigation9
zolect: 4569!e~t 2D, XE-09
R-Reac tor Saepaa e Basin=: SK, Aikea SC Soil MoLsture and Res i.stivitm studylC1.T206:n-area l~=%?=l
sleeve Stress{tfs} Tip $tless(tfs} Rat10 (CCR)pth 6-----------0
~
-10
-20
-30
-40
-50
-60
-70
-80
-90
-10
0---------480
r
0-----------:
?-
2Pore Pressure <t fs}Rmistivityieh*s)
D---------15 0------1ama
7
I
Vol UOi%mre!%>a----–--mu ekri.
29 Q
Zso
Z70
260
250
240
230
220
210
20u
m: Sxs, Aihn Sc)m.zmil : R-axea
sleeve Sxress!tf3)
lxh-
G
-26
3G
-40
-5C
m
-7e
Em
-90
-:0!
___________~ Tip SZress!Zfs}E---------4CK
——

WSRC-TR-99-O0330, Rev.O, RRSB Soil Moisture and Resistivity Field Investi~ation B-7
!xej.ct: 4569restm: =-19*
~Dsg e BasinI? R?:SRs, Afkem SC Soil ?. foistmre and Resist ivitv studyCx=f2cu:R-rirea ~==ii~——
w hD--
-10
-20
-30
-40
-50
-6CI
-70
-s0
-90
-10
..........- 0 0----–----400
. 13
-2% 1>
R.cio (CcmL?--––-------1O
kRR-19A
‘.05- : 4569 —
M ID: llE-19bme: SSs, - se
. .~
—: E-AX.
Ske.re stress(tfs} Tip stress!tfs} Rs,cio<COWpch 6-----------o a-----–---40D
- m
-2B
-30
-40
-5B
6n
-70
-ED
-90
-1oo
E--------–--1
7!~.2!E_-
Pore Pmsssrefti-l–--------z:
RR-19B
—VOI C+astwe {a
m—-----ma ek .
3m
290
J
2%U
2
Zm
.?53
2ZL?
240
220
220
7?0


D
WSRC-TR-99-00330. Rev. O. RRSB Soil Moisture and Resistivity Field Investigationc-1
mE9B
,9
Appendix C – Shelby Tube Sample Results
c-2 WSRC-TR-99-O0330, Rev. O, RRSB Soil Moisture and Resistivity FieldInvestigation
This page intentionally left blank
C-3
I
99
LAW ~LAWGIBB Group Member
3UIY 23,1999
Westinghouse Savannah River CompanyP.o. Box 616A&q South Carolina 29808
Attention Mr. Bruce TriplettBuilding 730-2B, Room 1086!%dxwntractNO.AB8011 IN
SubjeetTransmittaI of Test Resultx r-Reactor Seepage Basin Perch Water ~GeotechnicalTesting servicesWSRC Site Wide - Taak Release No.41Law Engineering ProjectFIo. 50161-7-0108 (phase 41)
Dear Mr. Triplett
Law Engineering and E&ronmental Servieeq Inc. haa completed the aasigned labomtmy teats fm Taak Release No.41 of our 3-year site-wide geoteebnical testing eontraet. We are transmitting to you the tabular and/or graphicalsummary for each of the speeimens tested. A copy of the Labomtoxy Aaaignment Sheet is enclosed with the samplestested - am the final results, thus, we have enclosed two eopiea of the following test msulta fw yourdiatriiutiom
Grainsizewaah200(AsTM D422)Unit Weight and Porosity(EMl 110-2-WOf$
If you have any questions pertaining to these test results or require additional information%please do not hesitate tocall Us.
Sineen?ly,LAW ENGINEERING and ENVIRONMENTALSERVICES. INC.
$*&’’ffJHan-y E.Principal Techni:an
LAW Engtneermg and Environmental Services. k396 Plasters Avenue ● Atlanta, GA 30324
404-873-4761 ● Fax. 404-881-0508

EsEl
,
-
(
—
—
—
—
—
r
—
—
—
—
b*.
in6
?h0
&K
1
————————.————b
?0
—
*ym~
i%
—
1-
—
—
—
—
—
—
—
1-
—
—
—
—
—
-N
-F—
?:w
—
—
—
—
—
—
—
—.—
—
—
—
—
w.-G-s
—
qm
2a
—
So6t
-Z-OilL-W3 wJmw* (m) =mS Fwwl
f9f M WE3V~d =WM ~
(m) J=wSIwwl
.491HIW.lsv(m) -s ml
Osaz-aWlsv(nn)==S F?*1
Oeos-aWlsv(W@ c)-us Z=J!Cl
Sslz-aWlsvvqss-duq pwgucoun
Mzz-aW.lsv(W*) ~H
Ot!t-a rusvqseM Mets 002w
Zzwbzt-aB.lsvsp~w W+s
Es-O Wlsv4WJ9 W!=$S
elm-a WISv$W?-1-w9122-(3 Wlsv
Wwm @Jw?M
%U ~ MVl5u166ulSqnL
b.
w
-$~mq
a!Ct
{
_
—
1I
—
—.—
. .
+
1-1-
f
—
—
—
i-Lw
bSW
—
—
(lom
[6qmqm w wusqs se)
J-WnN

Projeet No.: 50161-7-0108 Boring No.: RR-07-01
Phase: Task: 41 Depth: 3-4 Ft.
Project Name: R-Reactor Seepage Basin Perehed Sample ID: Ud
Tested By SC Reviewed By: HEJ
Date: 07/07/99 Date: 07/18/99
c-5
TP-4A: LHWT WEIGHT OF SAMPLE
Total Sample II Inside DiameterHeight inches t! of Cut Tuk inches
1 12.14 n
3 12.12 II Bottom 1.409Average 12.12 Average 1.409
Moisture Content
TareNo. c-22
Tare”Weight 15.68 grams
Wet Weight + Tare 214.71 grants
Dry Weight + Tare 182.79 gramsMoisture Content 19.1 %
otal Weight of Soil + Tube See60n 626.20 grams
eight of Clean, Dry Tube Section 63.78 grams
1.24 lbs
0.011 fi3 h
RESULT SUMMARY
IiMoisture Content 19.1 70
Wet Density 113.4 - pcf
Dry Density 95.2 pcf
Specific Gravity 2.64Porosity 0.42

c-b
100
90
80
,70
zzl-l60k
30
20
10
0
GRAIN -SIZE DISTRIBUTION TEST REPORT ~
200 Ioo 10.0GRAIN SIZE - mm
Test % +3” % GRAVEL % SAND % SILT I %CLAY) 1 0.0 0.0 54.2 45.8
LL PI
) 0-22 0.15 0.11 I\
1
MATERIAL DESCRIPTION
} Brown Silty Sand (SM)
Oroject No.: 50i61-7-0i08 Task 41
~roject: R-Reactor Seepage Basin Perched Water
) Location: FV+-07-01 Ud @ 3-4 Ft.
late: &Jly 18, 1999
GRAIN SIZE DISTRIBUTION TEST REPORT
LAW ENGINEERING. lNC .
Remarks:
ASTM D422
Figure No.

C.-1
TP-4A: UNIT WEIGHT OF SAMPLE
Project No.: 50161-7-0108 Boring No.: RR-07-02
Phase: Task: 41 Depth: 11-12 Ft.
Project Name: R-Reactor Seepage Basin Perehed’ Sample ID: UdTested By: SC Reviewed By: HE.J
Date: 07/07/99 Date 07/18/99
Total Sample Moisture ContentInside Diameter
HeighL inches of Cut Tube, inches
1 12 Tare No. v-53
2 11.95 Top 1.404 Tare Weight 16.48 grams
3 11.95 I Bottom 1.405 Wet Weight+ Tare 15251 grams
Average 11.97
ilAverage 1.405 Dry Weight + Tare 137.44 grams
Moisture Content 12.5 %
~otal Weight of Soii +T.be Section 613.48 grams
Eeight of Clean, Dry Tube Seetion 62.89 grams
et Weijzhtof Soil 1.21 lbsnVolume of Sample 0.011 83
RESULT SUMMARY
IMoisture Content 125 70
Wet Density 113.1 pcf
Dry Density 100.6 pcf
Specific Gravity 2.65Porosity 039
IL
GRAIN SIZE DISTRIBUTION TEST REPORT #6 . . ..N --5554
100
90
80
70a
2H 60IL
5 50wuaI.Ll 40a
30
20
10
0200 100 10.0 1.0 0.1 0.01 0.0
GRAIN SIZE - mm
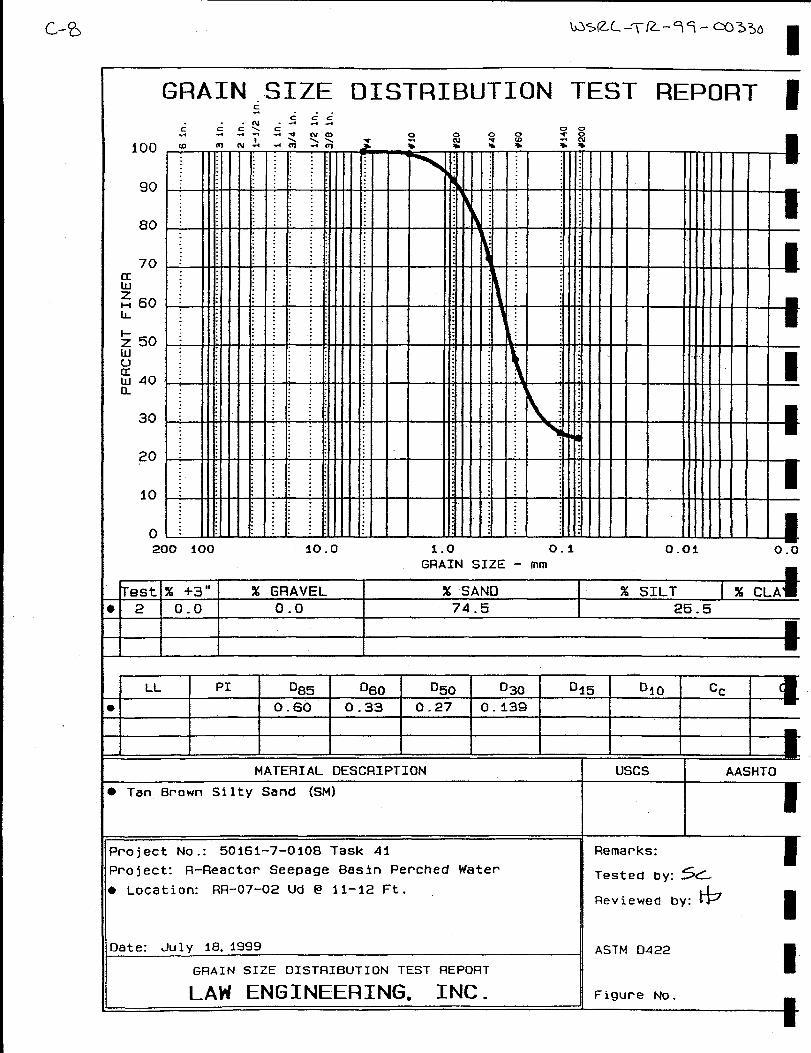
Test % +3” % GRAVEL % SAND % SILT I% CLAE 2 0.0 0.0 74.5 25.5
1
!
rLL PI ’85 D60 D50 D30 D~~ Dfo
D 0.60 0.33 0.27 0. i39
IIMATERIAL DESCRIPTION Uses AASHTO
o Tan Brown Silty Sand (SM)
IProject No.: 50i6i-7-0~08 Task 41 Remarks:
Project: R-Reactor’ Seepage Oasin Perched Water
b Location: RR-07-02 Ud @ il–12 Ft.
Date: JUIY 18+1999
GRAIN SIZE OISTRIBUTION TEST REPORT
LAW ENGINEERING, INC. Figure No.
Tested by: SC
Reviewed by: *u
ASTM 0422
i

TP-4A: UNIT WEIGHT OF SAMPLE
Project No.: 50161-7-0108 Boring No.: RR-07-03Phase: Task: 41 Depth: 13.5-14.5 Ft.
Project Name: R-Reactor Seepage Basin Perched Sample ID: UdTested By: SC Reviewed By: HEI
Date: 07/07/99 Date: 07/18/99
Total Sample Inside Diameter Moisture Content
HeighQ inches of Cut Tube, inches
1 12.4 Tare No. D-42 12.4 Top 1.407 TareWeight 14.44 grams
3 12.42 Bottom 1.407 Wet Weight + Tare 187.56 grams
Average 12.41 Average 1.407 Dry Weight + Tare 170.69 gramsMoistureContent 10.8 %
Total Weight of Soil+ Tube Section 598.90 grams
Weightof Clean, Dry Tube Section 65.04 grants
Wet Weight of SoiI 1.18 !/)s
Volnme of Samrde 0.011 ft3
Moisture Content 10.8 %Wet Density 105.4 pcf
Dry Density 9S.2 pcf
Specific Gravity 2.62
Porosity 0.42

100
90
80
70uw~ 60lJ-
1-Z 50wEw 40m
30
20
10
GRAIN SIZEc ,..
OISTRI13UTIOhJ TEST REPORT #
1.0 O.i 0.01 o.o~GRAIN SIZE – mm
Test % +3” % GRAVEL % SAND % SILT I % CLAI 3 0.0 0.0 SO.2 19.8
LL PI D85 060 D50 D30 045 Dlo cc c
1 0.95 0.53 0.44 0.270
I I I I I I I1 I 1 I I I I
MATERIAL DESCRIPTION
) Tan Brown Silty Sand (SM]
Jroject No.: 50161-7-0108 Task 41
Woject: R-Reactor Seepage Basin Perched Water
F Location: RI+07-03 Ud @ 13.5–14.5 Ft.
)ate: JUIY 28, 1999
GRAIN SIZE DISTRI13UT10N TEST R&PORT
LAW ENGINEERING, INC.
Uses AASHTO
Remarks:
Tested by: k
Reviewed by: bD
ASTM D422I
Figure No.

TP-4A: UNIT WEIGHT OF SAMPLE
C--II
Project No.: 50161-7-0108 Boring No.: RR-07-04Phase: Task 41 Depth 16.5-17.5 Ft.
Project Name: R-Reactor Seepage Basin Perched” Sample ID UdTested By: SC Reviewed By: HEJ
Date: 07/07/99 Date: 07/18/99
Total Sampie
I
Inside Diameter
I
Moisture Content
HeighL inches of Cut Tube. inches1 11.72 TareNo. C-312 11.73 Top 1.40} Tare Weight 16.24 grams3 11.74 Bottom 1.400 Wet Weight + Tare 175.70 grams
Avemge 11.73
I
Average 1.401 Dry Weight+ Tare 155.21 grwnsMoistureContent 14.7 %
Total Weight of Soil+ Tube Section 558.10 grams
Weight of Ckan, Dry Tube Section .66.36 grams
Wet Weight of Soil 1.08 lbs
Volume of Samde 0.010 ff’
----- - ..- - . . . . .KJi2iULl SUMMAKY
Moisture Content 14.7 %Wet Density 103.7 pcf
Dry Density 90.3 pcf
Specific Gravity 2.63
Porosity 0.45

GRAIN SIZE DISTRIBUTION TEST REPORT i
ioo
90
80
70awz1+ 60
1-Z 50wCJIIw 40a
30
20
10
0200 100 10.0 1.0 0.1 0.0:
GRAIN SIZE – mm 9
Test % +3” % GRAVEL % SAND % SILT I % CL,t 4 0.0 0.0 73.3 26.7
I I I I
LL PI 085 0(30 050 D3(j %5 Dio cc
) 0.70 0.42 0.34 0-124
I I
I I I 1 t 1 #
MATERIAL DESCRIPTION
E Tan Brown Silty Sand (SM)
Woject NO.: 50161-7-0108 Task 41-
Woject: R–Reactor Seepage Basin Perched
} Location: RR-07–04 Ud @ 15.5-17-5 Ft.
Jate: July 18, 19S!9
Water
GRAIN SIZE DISTRIL3UTION TEST REPORT
LAW ENGINEERING. INC.
Remarks:
Tested by: *
&[
Reviewed by:
ASTM 0422
Figure NO.

c-\3
TP-4A: UNIT WEIGHT OF SAMPLE
Projeet No.: 50161-7-0108Phase: Task: 41
Project Name: R-Reactor Seepage Basin Perched”Tested By SC
Date 07/07/99
Boring No.: RR-07-05Depth: 18-19 Ft.
Sample Ill UdReviewed Bv: HEJ
Dat.&07/18/99
Total Sample
Ik
Inside Diameter Moisture Content
Hei~hL inches of Cut Tu inches
1 12.07 Y TareNo. R-642 12.05 Top 1.395 Tare Weight 16.02 grams
3 12.1 Bottom 1.395 Wet Weight + Tare 214.28 gramsAverage 12.07
I
Average 1.395 Dry Weight + Tare 181.50 gramsMoisture Content 19.8 %
WI Weight of Soil + Tube Section 588.60 grams
‘eightof Clean, Dry Tube Section 68.52 grants
‘et Weight of Soil 1.15 lbs
Olumeof samDle 0.011 $3
Moisture Content 19.8 $ZOWet Density 107.4 pcf
Dry Density 89.6 pcf
Specific Gravity 2.66
Porosity 0.46

GRAIN SIZE DISTRIBUTION TEST REPORTc
c&c
ioo~m~
90
80
70awzH GO
k
1-Z 50wuaw 40a
30
20
10
0200 100
GRAIN SIZE - mm
Test % +3” % GRAVEL % SAND I % SILT I % CLAYt 5 !59.6
LL PI D85 060 050 I 030 I 045 Dio cc c
) 0.19 0.11 0.09
I
MATERIAL DESCRIPTION
} Tan Brown Silty Sand (SM)
+oject No.: 50i6i-7-0i08 Task 41
+oject: R-Reactor Seepage Basin Perched Water
E Location: RR–07-05 Ud @ 18-19 Ft.
)ate: JLJIY 18. lgg9
GRAIN SIZE DISTRIBUTION TEST REPORT
LAW ENGINEERING, INC.
Uses AASHTO
Remarks:
Tested by:=
Reviewed by: & I
ASTM D422
Figure No.

TP-4A: UNIT WEIGHT OF SAMPLE
Project No.: 50161-7-0108 Boring No.: RR-07-06Phase: Task: 41 Depth: 22-23 Ft.
Project Name: R-Reactor Seepage Basin Perched Sample ID: UdTested By: SC Reviewed By: HEJ
Date: 07/07/99 Date: 07/18/99
Total Sample
I
Inside Diameter Moisture Content
Hei~hL inches of Cut Tu~ inches1 12.15 Tare No. V-132 12.03 Top 1.400 Tare Weight 15.49 grams
3 12.04 Bottom 1.400 Wet Weight + Tare 211.05 gr~
Average 12.07 Average ‘1.400 Dry Weight + Tare 186.95 grams
it Moisture Content 14.1 %
‘1’otal Weightof Soil +Tube Section 564.50 grams
Weight of Clean, D~ Tube Section 68.60 grams ~Weight “ofSoil 1.09 lbs
tiVolumeof Samole 0.011 33 II
Rli?WJI,T SIJMMARY ‘
Moisture Content 14.1 910
Wet Density 101.6 pcf
Dry Density 89.1 pcf
Specific Gravity 2.67Porositv 0.47
“

90
80
70
EzI+ 60IL
t-Z 50
Haw 40Q
20
10
GRAIN SIZE DISTRIBUTICIN TEST REPORT ~s
0.GRAIN SIZE - mm
Test % +3” % GRAVEL % SAND % SILT I % CLAY
) 6 0-0 0-4 77.4 22.2
LL PI 085 D@ D50 D 3(-J D45 Dfo
) 0-43 0.23 0.19 0.110
II II I 1 I I I 1
MATERIAL DESCRIPTION
k Tan Brown Silty Sand (SM)
%oject No.: 50161-7-0108 Task 41
aroject: R-i7eactoP Seepage Basin Perched Water
} Location: RR-07-05 Ud @ 22–23 Ft.
Date: July 18, 1999
GRAIN SIZE OISTHIEUTION TEST REPORT
LAW ENGINEERING. INC -
n I
Uses
I
AASHTO
Remarks:
ASTM 0422
Figure No.

TP-4A: UNIT WEIGHT OF SAMPLE
Project No.: 50161-7-0108Phase: Task: 41
Project Name: R-Reactor Seepage Basin Perched’Tested Bv: SC
Dat& 07/07/99
Boring No.: RR-09-01Depth: 6-7 Ft.
Sample ID UdReviewed By: FE.1
Date 07/18/99
Total Sample
[
Inside Diameter
Heizh& inches of Cut Tube, indes
1 11.912 11.91 Top 1.4013 11.94 Bottom 1.402
Avemge ‘4 ‘Ve”ge‘m”
Moisture Content
Tam NO. C-23Tare Weight 16.70 grams
Wet Weight + Tare 171.05 grumsDry Weight + Tare 156.05 grams
Moisture Content 10.8 %
Total Weight of Soil+ Tube Seetion 553.20 grams
Weight of Clean. Dw Tube !%etion 63.22 Prams
Wet Weight of Soil
Volume of Samde
1.08 lbs
0.011 #’
RESULT SUMMARY
Moisture Content 10.8 YoWet Density 101.5* pcf
Dry Density 91.6 pcf
Specific Gravity 2.65Porosity 0.45

C-t%
ioo
90
70
LL
5 50wclu1# 40
30
20
10
0
GRAIN SIZE DISTRIBUTION TEST REPORT ~i . ..a
00rlon Vo
200 100 10.0 f.o 0.1 O.oi 0.04GRAIN SIZE - mm
) 7 0.0 0.0 75.8 24.2
LL PI
} 0.37 0.21 0.18 o.i15, ,
I I 1 I I 1 I I 1 I mI 1 I [ 1 1 1
MATERIAL DESCRIPTION
} Tan Brown Silty Sand (SMJ
Woject No.: 5OI61-7-O1OB Task 41
+aject: R-Reactor Seepage Basin Perched Water
b Location: RR-09-01 Ud @ 6-7 Ft.
late: July 18, 1999
GRAIN SIZE OISTRIEUTION TEST REPORT
LAW ENGINEERING. INC.
Uses I AASHTO
Remarks:
Reviewed by: @
ASTM D422
Figure No. ■

i’SQL--T(L- Yi -
TP-4A:
Proiect No.: 50161-7-0108.
UNIT WEIGHT OF SAMPLE
Boring No.: RR-09-02Phase Task: 41 Depth: 10-11 Ft.
Proiect Name: R-Reactor SeeDa~e Basin Perched” Samde ID: UdTested By: SC Reviewed By: HE.T
Date: 07/07/99 Date: 07/18/99
Total Sample II Inside Diameter II Moisture Content
l-kizh~ inches Iof Cut Tube, inches
1 12.15 Tare No. P-13A
l~otal W.ight .f Soil+TubeSection 648.90 grams
IKeight of Clean, Dry Tube Seetion 64.13 grams
et Weizht of Soil 1.29 /&sII
Volume of Sample 0.011 $3
RESULT SUMMARY
Moisture Content 16.3 9?0
Wet Density 117.2 pcf
Dry Density 100.8 pcf
Specific Gravity 2.66
Porosity (L39

GRAIN SIZE DISTRIBUTION TEST REPORT 8c“..=4 &c.N .54-+
100
90
80
70
EzII 60h-
% 50wuuw 40m
30
20
io
o200 100 10.0 1.0 0-s. 0.01 c
GRAIN SIZE - mm
Test % +3” % GRAVEL % SAND % SILT I) 8 0.0 0.1 65.2 34.7
LL PI DesI 0f30 D50 D so D35 Dio cc
I 0.36 0.19 0.15a
I
MATERIAL DESCRIPTION Uses AASHTO
} Tan f3i_own Silty Sand (SM)
~roject No.: 50161–7-0108 Task 41 IIRemarks:
~roject: R-Reactor Seepage Basin Perched Water
I
Tested by: _) Location: RR-09–02 Ud @ 10-11 Ft.
Reviewed hy: +n
Date: July 18, 1999 ASTM 0422
GRAIN SIZE DISTRIEUTION TEST REPORT
LAW ENGINEERING, INC. Figure No.

c.”z\
TP-4A: UNIT WEIGHT OF SAMPLE
Project No.: 50161-7-0108Phase: Task 41
Boring No.: RR-09-03lkpth: 14-15 Ft.
Project N~e R-Reactor Seepage Basin Perched’ Sample Ill U@Tested By SC Reviewed By: HEJ
Date 07/07/99 Date 07/18/99
Total Sample
1
Inside Diameter Moisture Content
Heigh%inches of Cut Tube, inches1 12.12 Tare No. c-372 12.14 Top 1.403 TareWeight 15.99 grams
3 12.16 Bottom 1.400 Wet Weight + Tare 187.69 gramsAverage 12.14 Average 1.402 Dry Weight + Tare 150.47 grams
Moisture Content 27.7 %..
Total Weight of Soil+ Tube Sedion ‘607.20 grams
Weight of Clean, Dry Tube Section 64.07 grants
Wet Weight of Soil 1.20 Lbs
Volume of Samde 0.011 ff’
8 RESULT SUMMARY
Moisture Content 27.7Wet Density 110.5 pcf
Dry Density 86s pcf
Specific Gravity 2.68
Porosity 0.48

1c -22 W%QC-TQ. yy. ~~33
1
GRAIN .SIZE DISTRIBUTION TEST REPORTc
.“ . . .
.nl .555
100
90
80
70
k
30
20
o200 100 10.0 1.0 0. 1 0.01 0. OQ’
GRAIN SIZE – mm
est % +3” % GRAVEL . % SAND % SILT 1. % CLAY
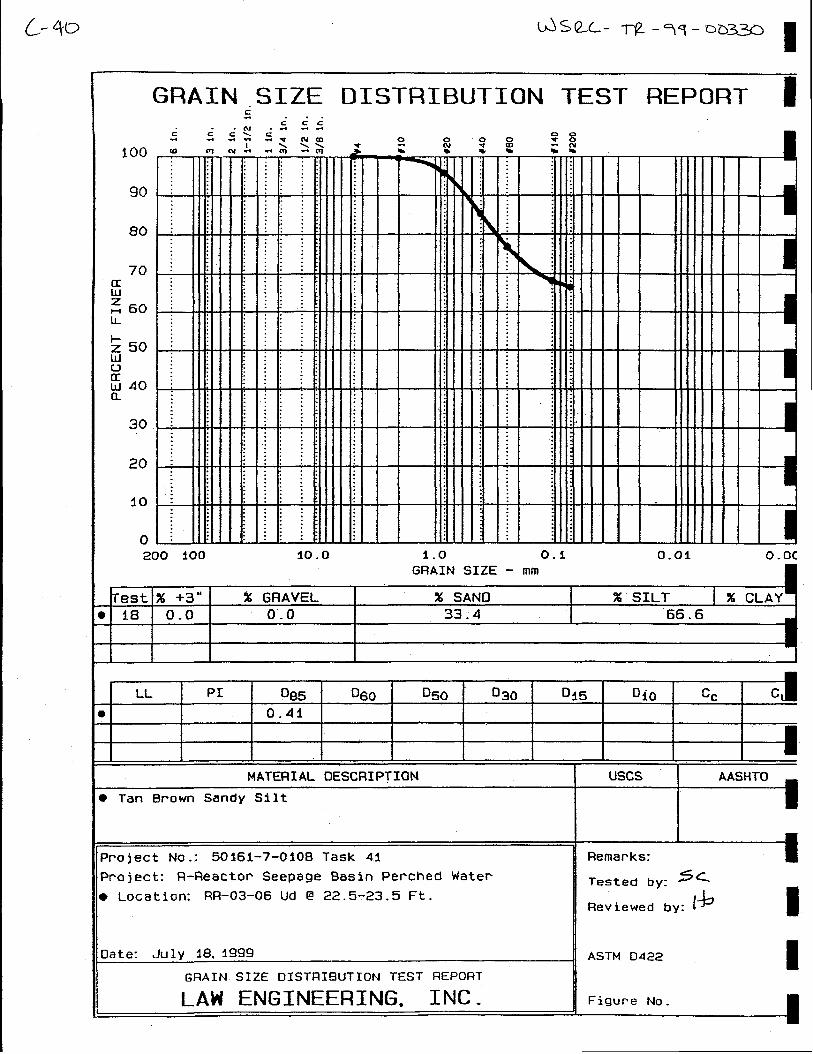
9 0.0 0.0 34.1 65.9
I
I
LL PI Df35 D60 050 030 D15 D~o cc c“
0.21 I
I I I I1 II I I I I I I
MATERIAL DESCRIPTION
} Tan Brown Sandy Silt
Woject No.: 50161-7-0108 Task 41
~roject: R–Reactor’ Seepage Basin Pef’ched Water
} Location: RU-09-03 Ud @ 14-15 Ft-
late: July 18. 1999
GRAIN SIZE DISTF?IBUTION TEST REPORT
LAW ENGINEERING. INC.
I I I
Uses AAStiTO
Remarks:
Tested by:~&
Reviewed by: & I
ASTM 0422
Figure No.
c -Z3
TP-4A: UNIT
ProiectNo.: 50161-7-0108
WEIGHT
“ Phase: Task 41
Proket Nanx R-Reactor Seeua~e Basin Perehed.
OF SAMPLE
Boring No.: RR-09-04DeDtk 18-19 Ft.
Sanmle XIXUd
Tested By SC Reviewed By IIEJ
Date 07/07/99 Date 07/18/99
To~ Sample
[
Inside Diameter Moisture Content
Heizh~ inches of Cut Tube, inches
1 12.22 TareNo. C-72 12.2 Top 1.410 Tare Weight 16.57 gram
3 12.16 Bottom 1.410 Wet Weight t Tare 237.03 gramsAverage 12.19
!
Average 1.410 Dry Weight+ Tare 201:75 gramMoisture Content 19.1 %i
otal Weight of Soil + Tube Seetion 625.60 grams
Eeight of Cleq Dry Tube Seetion 63.77 gmr?tset Weiszhtof Soil 1.24 lbs
❑
of Sample 0.011 $3
RESULT SUMMARY
IMoisture Content 19.1 %Wet Density 112.4 PtiDry Density 94.4 pcf
Specific Gravity 2.65
Porosity 0.43

(-”D+
GRAIN SIZE DISTRIBUTION TEST REPORT 1
100
90
80
70mg
H 60L
5 50w
EW 40m
30
20
10
0200 :00 10.0 1-0 o-f, 0.01 0.00
GRAIN SIZE - mm
Test % +3” % GRAVEL % SAND % SILT
~ io 0.0 0.0 57.9 42.3
.
1
LL PI DfJ5 Df3~ D50 030 D45 Dio cc I c“
) 0.25 0.:5 0.12
I1 I I 1 I [ I
MATERIAL DESCRIPTION
} Tan Brown Silty Sand
Jroject No.: 50161-7-0108 Task 41
~roject: R-Reactor Seepage Basin Perched Water
) Location: RR-09-04 Ud @ 18-19 Ft.
)ate: July 18. 1999
GRAIN SIZE DISTRIBUTION TEST REPORT
LAW ENGINEERING. INC.
I
Remarks:
Tested by:s~
Reviewed by: &
ASTM 0422B
Figure No.

C.”zs
‘IBL& UNIT WEIGHT OF SAMPLE
Project No.: 50161-7-0108 Boring No.: RR-09-05Phase Task 41 Deptlx 22-23 Ft.
Project Name R-Reactor Seepage Basin Perched Sample IJX UdTested By SC Reviewed By HEJ
Date 07/07/99 Date 07/18/99
Total Sample1
Inside Djameter Moisture Content
HeizhL incfies of Cut ‘1’bb~inches1 12 Tare No. R-432 11.98 Top 1.400 Tare Weight 16.65 grams3, 11.98 Bottom 1.400 Wet Weight -t Tare 182.32 grams
Average 11.99 Average 1.400 Dry Weight + Tare 156.74 gramsMoisture Content 183 %
Total Weight of Soil+ Tube Section 622.00 gramsWeight of Cl- Dry Tube Section 62.81 grams
Wet Weight of Soil 1.23 tbs
Volume of Samde 0.011 $3
Moisture Content 18.3 %Wet Density 115.4 pcf
Dry Density 97.6 pcf
Specific Gravity 2.66
Porosity 0.41

100
90
80
5 !50wuaWI 40n
30
GRAIN SIZE DISTF?IBUTION TEST REPORT ~c ;&c”
I-1, , , I s 1+: , a , I
I+l+l+I-420
10
0200 100 10.0 1.0 O.i 0.01 0.00
GRAIN SIZE - mm
+est % +3” X GRAVEL “ % SAND % SILT I % CLAY
~ ii 0.0 0-0 67.0 33.0
LL PI D85 060 05~ 030 D45 Dio
) 0.40 0.22 0.i6
I1 I I 1 1 1 1
MATERIAL DESCRIPTION
} Tat-1 Brown Silty Sand
Project No.: 50161–7-0108 Task 41
Project: R-Reactor’ Seepage Basin Perched Water
● Location: RR–09–05 Ud @ 22-23 Ft.
Date: July 48, 1999
GRAIN SIZE 01STRIf3UTION TEST REPORT
LAW ENGINEE~ING. INC -
, * I
m
IRemarks:
Tested by:
Reviewed by: \& I
ASTM D422
Figure No.

TP-4A: UNIT WEIGHT OF SAMPLE
Project No.: 50161-7-0108 Boring No.: RR-09-06Phase Taslc 41 De@ 26-27 Ft.
Project Name R-Reactor Seepage BasirI Perched Sample IIk UdTested By SC Reviewed By HE.T
Date 07/07/99 Date: 07/18/99
Total Sample
I
Inside Diameter Moisture Content
Hei~b& inches of cut mim inches
1 11.96 Tare No. R-352 11.95 Top 1.400 Tare Weight 16.57 grams3 11.95 Bottom 1.401 Wet Weight + Tare 178.80 grams
Average 11.95
I
Average 1.401 Dry weight + Tare 155.38 gramsMoisture Content 16.9 Yo
Total Weight of Soil+ Tube Sedion 627.50 gramsWeight of Clq Dry Tube Seotion 63.30 F-Wet Weight of Soil 1.24 Ibs
Volume of Sarnde 0.011 33
RESULT SUMMARY
[Moisture Content 16.9 %
Wet Density 116.7 pcf
Dry Density 99.9 pcf
Specific Gravity 2.65Porosity 0.40

100
80
: :
: :: :: :: ; I
u : : ::’ T
: 40 + . -; - — — — ;. . - _ . . . -; - - --: - - - — — . -- __ . _: ; ::: ; :: I: . ::: : ::: : :: :
Qn : : : :: :av
20
10
0200 100 10.0 1.0 0.1 0.01
GRAIN SIZE - mm B
~estl% +3” I % GRAVEL ] . PAS,” I a/ .--’. Y i e. -,
)1 12 0.0 0-oI A 3ANU I xl a.Ll_l I Z bl_J
?
I -.— — - — I — — 77.7 22.3I I
I I I
LL PI 085 060 050 D30 Di5 010 cc
) 0.63 0-38 0.32 0.189
I I1 1 1 1 , *
MATERIAL DESCRIPTION
D Tan Brown Silty Sand
%wject No.: 50161-7–0108 Task 41
~roject: R-Reactor Seepage Basin Perched Water
P Location: RFI-09-06 Ud @ 26–27 Ft.
hte: July 18, 1999
GRAIN SIZE DISTRIBUTION TEST REPORT
LAW ENGINEERING. INC -
1 * 1
WCS AASH
Remarks:
Tested by: s~
Reviewed by: 1+I
ASTM 0422
Figure No.

9I
TP-4A: UNIT WEIGHT OF SAMPLE
Projeot No.: 50161-7-0108 Boring No.: RR-03-01”Phase Task 41 Deptlx 5-6 Ft.
Project Name R-Reactor Seepage Basi.11Perched Sample Ilk UdTested B~ SC Reviewed By HEJ
Date: 07/07/99 Datti 07/18/99
Total Sample
I
Inside Diameter Moisture Content
Height inches of Cut Tubq hmhes h1 12.16 Tsre No. R-382 12.2 Top 1.398 Tare Weight 16.31 grams3 12.2 Bottom 1.399 Wet Weight + Tare 180.12 grams
Average 12.19 Average 1.399 Dry Weight +Tsre 166.53 &lm.sMoisture Content 9.0 %
Total Weight of Soil+ Tube Seetion 568.10 gramsWei~t of Clean. Drv Tube Se&on 69.86 mmWet Weight of Soil
Volume of Sanmle
1.10 lb
0.011 $3
RESULT SUMMARY
tlMoisture Content 9.0 %Wet Density 101.4 pcf
Dry Density 93.0 pcf
Specific Gravity 2.66Porosity 0.44

GRAIN .SIZE DISTRIBUTION TEST REPORT
200 100 10.0 1.0 0.1 0.01 0.GRAIN SIZE - mm
est % +3”” % GRAVEL % SAND % SILT I % CLAY
LL PI D85 060 D50 D30 D~l=J Dfo cc c
D 0.47 0.26 o.2f 0.140
i
b 1 , I ,
MATERIAL DESCRIPTION
● Tan Brown Silty Sand
Project No.: 50161-7-0108 Task 41
Project: R–Reactor Seepage Basin Perched
● Location: RR–03–01 Ud @ 5-6 Ft.
Date: JUIV 18. 1999
GRAIN SIZE DISTFIIf3UTION TEST REPORT
LAW ENGINEERING. INC -
Tested by: 5L
Reviewed by: 1+
ASTM 0422’
Figure No.

TP-4A:
ProjectNo.: 50161-7-0108
UNIT WEIGHT
Phas(x Task 41project Name R-Reactor Seepage Basin Pemhed
OF SAMPLE
Boring NO.: RR-03-02Deptk 10.5-11.5 Ft.
Sample ID: UdTested By SC Reviewed By HBJ
Date 07/07/99 Date: 07/18/99
1
Total Sample Inside Diameter
I
Moisture Content
Hei~h~ inches of Cut Tube+ ihches
1 12.07 Tare NO. R-42
2 11.94 Top 1.403 Tare Weight 16.61 grams
3 11.95 i Bottom 1.401 Wet Weight + Tare .191.35 gramsAverage 11.99 Average 1.402 Dry Weight’+ Tare 168.07 grams
Moisture Content 15.4 ‘A
kotal Weight of Soil + Tube &ction 634.70 gramsWeight of Cleq Dry Tube Section 62.76 gramsWet Weight of Soil 1.26 Ibs I
of Sample 0;011 p’!
Moisture Content 15.4 %Wet Density 117.’7 pcf
Dry Density 102.1 pcf
Specific Gravity 2.68
Porosity 039

GRAIN SIZE DISTRIBUTION TEST REPORT #
ioo
90
70
U.J 4V
a
30
20
10
0200 10CI 10.0 1.0 0.1 0.01 0
GRAIN SIZE - mm
Test % +3” % GRAVEL % SAND % SILT I % CLAI i4 0.0 0.0 64.5 38.5
m
LL PI I D85 D60 D50 D30 015 Cqo cc
)
I
I I I I I 1 I
MATERIAL DESCRIPTION
F Tan Brown Silty Sand
a~oject No.: 50161-7-0108 Task 41
Woject: R-Reactor Seepage Basin Perched Water
b Location: fWi-03-02 Ud @ 10.5-11.5 Ft.
Date: July 18, 1999
GRAIN SIZE DISTRIBUTION TEST REPORT
LAM ENGINEERING. INC.
I 1 1,
Uses AASHT
i?emafks: ■
Tested by: ~C
Reviewed by: 1+
ASTM 0422
Figure No. D

C6330
TP-4A:
(--33 .
LLW31BB=ROUF AL
Project No.: 50161-7-0108
UNIT WEIGHT OF SAMPLE
Phase: Task 41Project Name: R-Reactor Seepage Basin Perched
Boring No.: RR-03-03DCptk 14-15 Ft.
Sample Ill UdTested By SC Reviewed By: HE3
Date: 07/07/99 Date 07/18/99
Total Sample Inside Diameter Moisture Content
Height inches A of cut Tub& inches
1 12 Tare No. C-272 12.01 Top 1.405 Tare Weight 16.08 grams
3 12.01 Bottom 1.40s Wet Weight + Tam 180.76 grumsAverage 12.01 Average 1.405 Dry Weight + Tare 171.05 grums
Moisture Content 6.3 %
~talWeight of Soil + Tube Section 600.50 grams
‘eightof Ckan, Dry Tube Section 63.31 grams
‘etWeight of Soil 1.18 lbs
Dlume of Samrde 0.011 ff3
RESULT SUMMARY
Moisture ContentWet DensityDry Density
Specific GravityPorosity
6.3 70
109.9 pcf
10305 pcf
2.62037

C“39
GRAIN SIZE DISTRIBUTION TEST REPORT:
100
90
80
70aw~ 60
1-Z 50w(Jccu 40Q
30
20
o200 icm 10.0 1.0 0.1 0.01 0.
GRAIN SIZE - mmI
Test % +3” % GRAVEL % SANO % SILT I %CLAY~ 15 0.0 2.0 Bf.6 16.4
I
{ i I I
LL PI I Df35 Dfjo D50 030 D15 Dfo I cc c“
b 0.77 0.37 0.30 ~o. lal
I II iI I I I I I I
MATERIAL DESCRIPTION
} Tan Brown Silty Sand
Project No.: 50161-7-0108 Task 41
Project: F!-Reactor’ Seepage Basin Perched Water
F Location: RR–03-03 Ud @ 14-15 Ft.
Date: July 18, 19g9
GRAIN SIZE DISTRIBUTION TEST REPORT
LAW ENGINEERING. INC.
I I I
Uses AASHTO
Remarks:
Tested by: ~~
&I
Reviewed by:
ASTM 0422 I
Figure No. I

L-35w’U----l-Q-- q’i - co%w~
TP-4A: UNIT WEIGHT
Project No.: 50161-7-0108Phase: Task 41
~K@C!t ~tMllCX R-Reactor SeepageBasin Perched Water
OF SAMPLE
Boring No.: RR-03-04Depth: 18-19 Ft.
Sample ID: Ud—
Tested By: SC Reviewed By: HEJDate: 07/07/99 Date: 07/18/99
Total Sample II Inside D]ameterHeiEhQinches of Cut Tube, inches
1 11.982 12 Top 1.3953 12 Bottom 1.3%
Average 11.991
Average 1.396
Moisture Content1
Tare No. R-40
Tare Weight 16.33 grams
Wet Weight + Tare 208.16 grams
Dry Weight + Tare 176.24 grams
Moisture Content 20.0 %
Total Weight of Soil+ Tube Section 617.20 gramsWeight of Clean, Dry Tube Section 69.10 gratqs
Wet Weight of Soil 1.21 lbs
Volume of Samvle 0.011 $3
RESULT SUMMARY
Moisture Content 20.0 %Wet Density 113.8 pcf
Dry Density 94.9 pcf
Specific Gravity 2.66
Porosity 0.43

GRAIN SIZE DISTRIBUTION TEST REPORT& 1. ..
ioo
90
80
70
IL1-Z 50111
%w 40m
30
20
10
200 foo 10.0 1.0 0.1 0.01 0.00GRAIN SIZE - mm
est % +3” % GRAVEL % SANO % SILT I % CLAY~ 16 0.0 0.0 46.4 53.6
i-L PI 085 Ofjo %0 D3C) 015 .Dio cc I q1 0.?50 0-15
I I I I I I IMATERIAL DESCRIPTION
} Tan ~pown Silty Sand
~roject No.: 50161-7-0106 Task 41
%wject: R-Reactor Seepage Basin Perched Water
1 Location: RR–03–04 Ud @ 18-19 Ft.
GRAIN SIZE DISTRIBUTION TEST REPORT
LAW ENGINEERING. INC.
USGS I AASHTO
Remarks:
Tested by: 5L
Reviewed by: @
ASTM D422
Figure No.
9

L#!WGIBB=ROUP Ah
TP-4A: UNIT WEIGHT OF SAMPLE
Project No.: 50161-7-0108 Boring.No.: RR-03-05Phase: Task: 41 Depth: 20.5-21.5 Ft.
Project Name: R-ReactorSeepageBasin PerchedWater Sample ID: UdTested By: SC Reviewed By: HEI
Date: 07/07/99 Date: 07/18/99
Total Sample Inside Diameter
I
Moisture Content
Height+inches of Cut Tube, inches
1 12.12 Tare NO. c-392 12.06 Top 1.399 Tare Weight 16.30 grams
3 12.2 Bottom 1.399 Wet Weight + Tam 216.87 gmmsAverage 12.13
1
Average 1.399 Dry Weight + Tare 180.70 grams “Moisture ContentA 22.0 %
otal Weight of Soil + l%be Section 623.30 grams
Weight of Clean, Dry Tube Section 69.94 grams
Weight of SoiI 1.22 lbs
olume of Samde 0.011 33
Moisture Content 22.0 70
Wet Density 113.i pcf
Dry Density 92.7 pcf
Specific Gravity 2.68
Porosity 0.45

100
90
80
70
EzH 60L
30
20
02
GRAIN SIZE DISTRIBUTION TEST REPORT 9ic ;2
: 1 1 1 t Ill I I i I I I I
, , 1 I:::: 1111I 1111111I
1 ~. L t , & r t
I ~: :: :: :i : ;: . II
I“: ; ::
1 :::: :;.: ::: ::: :.: ::. . . .!00 -1oo 10.0 %.0 0.1 0.01 0.00
GRAIN SIZE - mm
) 17 0.0 0-0 41.6 58.4
I
r
LL PI 085 D60 DSJ-J I 030 o~~ Ol(j cc c
) 0.56 O.li
II r
MATERIAL DESCRIPTION
b Tan Brown Sandy Silt
%wject No.: 50161-7-0108 Task 41
aroject: R-Reactor Seepage Basin Perched Water
b Location: RR-03-05 Ud @ 20.5–21.5 ft.
Date: July 18, 1999
GRAIN SIZE DISTflI13UTION TEST REPORT
LAW ENGINEERING. INC.
s
Uses AASHTO
Remat’ks:
Tested by: SC
Reviewed by: MI
ASTM 0422I
Figure No.

TP-4A: UNIT WEIGHT OF SAMPLE
Project I’40.: 50161-7-0108Phase: Task: 41
project Name: R-ReactorSeepageBasin PerchedWater
Tested By: SCDate 07107/99
Boring No.: RR-03-06Depth: 22.5-23.5 Ft.
Sample ID: UdReviewed By? HEJ
Date: 07/18/99
Total Sample
[
Inside Diameter Moisture Content
Hei~ht inches of Cut Tuk inches
1 11.7 Tare No. A-n2 11.72 Top 1.396 Tare Weight 14.67 grams
3 11.77 B“&tom 1.395 Wet .Weight + Tare 212.71 gramsAverage 11.73 Average 1.3% Dry Weight + Tare 176.08 grams
Moisture Content 22.7 %
Total Weight of Soil+ Tube Section 624.50 grams
Weight of Clean, Dry Tube Section 68.09 grams
Wet Weight of Soil 1.23 lbs
Vohne of Samrde 0.010 x’
Moisture Content 22.7 %Wet Density 118.1 pcf
Dry Density 96.3 pcf
Specific Gravity 2.68
Porosity 0.42
GRAIN SIZE DISTRIBUTION TEST REPORT ~; c“cc“100
90
80
70
&fi 60LL
i-Z 50wCJa: 40
30.
20
10
0200 ioo 10.0 1.0 0.1 0.01 O.oc
GRAIN SIZE - mm
Test % +3” % GRAVEL % SAND % SILT I % CLAY
) $8 0-0 0.0 33-4 66.6
!_L PI of35 060 D50 D90 D45 D~O cc c
) 0.41
MATERIAL OESCRIPTIUN
P Tan Brown Sandy Silt
Project NcI.: 50161-7-O1OB Task 41
Project: R-Reactor Seepage Basin Perched Water
E Location: RR-03-06 Ud @ 22.5-23.5 Ft.
Date: July 18. 1999
GRAIN SIZE DISTRI!3UTION TEST REPORT
LAW ENGINEERING. lNC.
IRemarks:
Tested t3y: s<Reviewed by: I%J
ASTM 0422
Figure No-
4
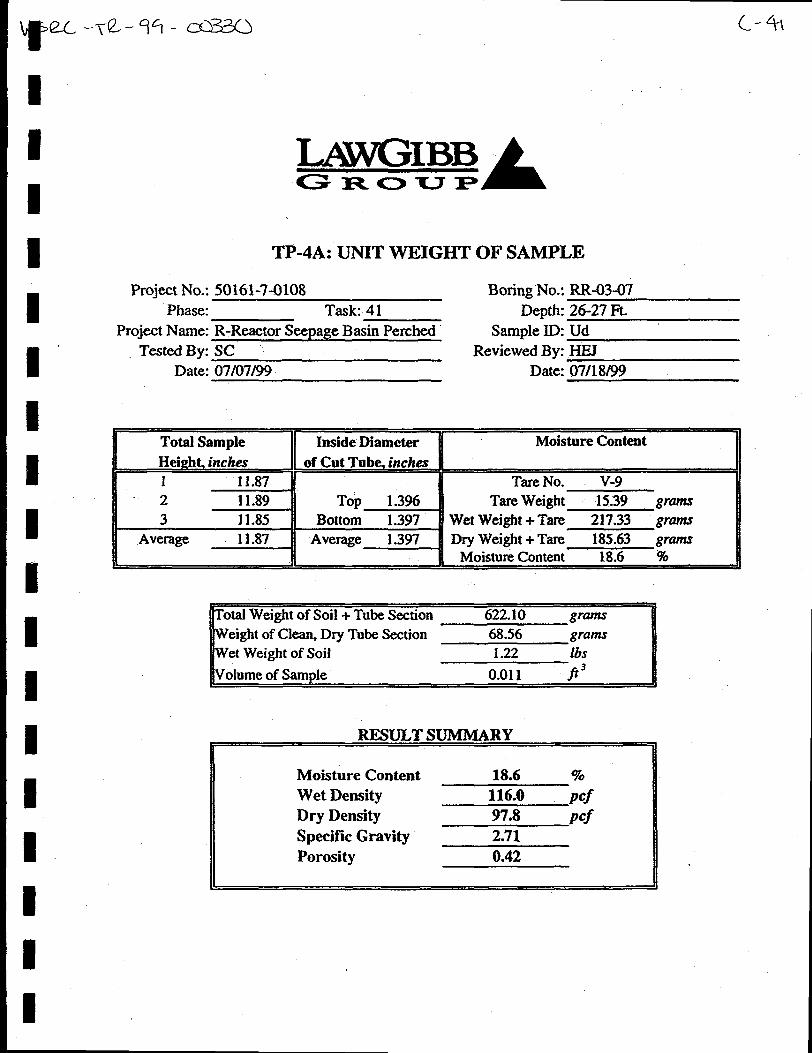
MWVGIBB=ROU3? A
TP-4A: UNIT WEIGHT OF SAMPLE
Project No.: 50161-7-0108 Boring ”No.:RR-03-07Phase: Task 41 DeDth: 26-27 Ft.
Proiect Name: R-Reactor Seemage Basin Perehed Sarnrde’ID: Ud“TestedBy SC Review;d By: HEJ
Date: 07/07/99 Date: 07/18/99
Total Sample Moisture ContentInside Diameter
HeiEhQinches of Cut Tube. inches II1 i 1.87 Tare No. V-92 11.89 Top 1.396 Tare Weight 13.39 grams
3 11.85 Bottom 1.397 Wet Weight + Tam 217.33 grams
Average 11.871
Average 1.397 Dry Weight + Tare 185.63 grams
Moisture Content 18.6 %
otal Weight of Soil + Tube Section 622.10 grams
eight of Clean, Dry Tube Seetion 68.56 grams
1.22 lbs
0.011 33
Moisture Content 18.6 %
Wet Density 116.0 pcf
Dry Density 97.8 pcf
Specific Gravity 2.71
Porositv 0.42.

&4z-
GRAIN SIZE DISTRIBUTION TEST REPORT: 1
100
90
80
1-Z 50111uaI&l40
30
20
10
0200 100 10.0 1.0 0.1 0.01 0.00
GRAIN SIZE - mm
Test % +3” % GRAVEL % SAND % SILT I % CLAY
E 19 0.0 7.2 44.8 48.0
I
LL PI 085 D60 050 030 Di5 o~o cc c“
r 1.i5 0.23 0.10
IIm ,
MATERIAL OESCFIIPTION
● Tan 13rr)wn Silty Sand with Gravel
Project No.: 50161-7-0108 Task 41
Project: R-Reactor Seepage Basin Perched Water
b Location: RR-03-07 Ud @ 26-27 Ft.
Elate: July 18, fg99
GFIAIN SIZE OISTR18UTION TEST REPORT
LAW ENGINEERING. INC -
I
Remarks:
Tested bY:.SL
Reviewed by: &
ASTM 0422I
Figure No.

BXL--it -%-CD330
,.,
TP-4A: UNIT WEIGHT OF SAMPLE
Project No.: 50161-7-0108Phase: Task 41
Project Name: R-Reactor Seepage Basin PerchedTested By: SC
Date: 07/07/99
Boring No.: RR-03-08Depth: 57.5-58.5 Ft.
Sample ID: UdReviewed By: HEJ
Date: 07/18/99
~1.f=::%::.” I Moisture Content i
I 11.97 Tare No. R-482 12.07 Top 1.399 Tare Weight 16.91 grams
3 12.07 Bottom 1.399 Wet Weight + Tare 182.26 grams
Average 12.04 Avetige 1.399 Dry Weight + Tare 154.25 gramsMoistur&Content 20.4 %
[-4(3
Total Weight of Soil+ Tube Section 634.05 grams
Weight of Clean, Dry Tube Section 69.60 grams
Wet Weight of Soil 1.24 fbs
Volume of Samde 0.011 fi’
RESULT SUMMARY
Moisture ContentWet DensityDry Density
Specific GravityPorosity
20.4 Yo
116.2 pcf965 pcf
2.640.41

L.4q
GRAIN SIZE DISTRIBUTION TEST REPORT I
i 00
90
00
70
L
30
20
10
0200 100 10.0 1.0 O.f
GRAIN SIZE - mm0.01
estl%+3” I % GRAVEL I % SAND I % SILT I % CLA) 20 0.0 0.0 I 75.8 I 24.2
II
LL PI 085 ~fjo D50 D30 D15 oio” cc) 0.44 0.31 0.27 0:174
MATERIAL DESCRIPTION
) Red Brown Silty Sand
+oject No.: 5016i-7-0i08 Task 41
2rOject: R-Reactor Seepage Basin Perched Water’
} Location: RFI-03-08 Ud @ 57.5-58.5 Ft.
Date: July 18, 1999
GRAIN SIZE DISTRIBUTION TEST REPORT
LAW ENGINEERING. INC.
Uses
Remarks:
Tested by: s~
Reviewed by: LbI
ASTM 0422I
Figure No.

L“’45
TP-4A: UNIT WEIGHT OF SAMPLE
Projeet No.: 50161-7-0108 Boring No.: RR-03-O!)Phase: Task 41 Depth: 83.5-84.5 Ft.
Project Name: R-Reactor Seepage Basin Perched Sample Ill UdTested By: SC Reviewed By: HEJ
Date 07/07/99 Dattx 07/18/99
Total Sample II Inside Diameter II Moisture Content
Height inches [ of Cut Tube, inches
1 12.2 Tare No. R-42 12.2 Top I .394 Tam Weight 16.41 grams
3 12.22 Bottom 1.393 Wet Weight + Tare 244.57 grams
Average 12.21II
Average 1.394 Dry Weight + Tam 192.01 grants
Moisture Content 29.9 %
~otd Weight of Soil +T.be Section 633.60 grams UWeight of Clean, Dry Tube Section 70.83 grams
Wet Weight of Soil 1.24 lbs
Volume of Samole 0.011 ii3
RESULT SUMMARY
1Moisture Content 29.9 %Wet Density 1152 pcf
Dry Density 88.6 pcf
Specific Gravity 2.61
Porosity 0.46

GR} lN SIZE C)lSTRIBUTION T ZST REPORT
200 100 10.0 1.0 0.1 0.01 “0-00GRATN SXZE - mm
rTest 2 +3” $Z GRAVEL % SAND Z SILT I % CIAY
) 1 0.0 0.0 78.5 21.5
LLI
PI 085 I D60 I D50 030 D15 q o cc Cu
D 0.25 0.17 0.15 0.114
[ I
1 I 1 1 I 1
MATERIAL DESCRIPTION
B Pu rp I e Brown S i I ty Sand {SM)
Pfoject No. : 50161–7-0108 Task 41
Project: R–f?eoctor Seepage Basin Perched Woter
D Location: RR-03-09 Ud @ 83.5–84.5 Ft.
Date: Julv 18.1999
GRAIN SIZE DISTRIBUTION TEST REPORT
LAW ENGINEERING , lNC .
t 1 1
Uses I AA3-lTo
Remark:
Tested By:~c
Reviewed by: &
Figure No.

I
LASh7GIBB=ROUP Ah
TP-4A: UNIT WEIGHT OF SAMPLE
Project No.: 50161-7-0108. Boring No.: RR-O3-1OPhase: Task: 41 Depth: 100.5-101.5 Ft.
Proiect Name: R-Reactor SeeDa~e Basin Perched’ Samr)le ID: Ud. .
Tested By SC Reviewed By: HEJDate: 07/07/99 Date: 07/18/99
~ ‘0:=:27=?. Moisture Content
= ~
1 12.04 Tare No. V-802 12.04 Top 1398 TareWeight 16.91 grams
3 12.05 Bottom 1.395 Wet Weight + Tam 243.47 grams
Average 12.04 Average 1.397 Dry Weight + Tare 196.12 gramsMoisture Content 26.4 %
Total Weight of Soil+ Tube Section 637.30 grams
Weight of Clean, Dry Tube Seetion 68.47 grams
Wet Weight of Soil 1.25 lbs
Volume of Samnle 0.011 fr3
RESULT SUMMARY
Moisture Content 26.4 %
Wet Density 117.5 pcf
Dry Density 92.9 pcf
Specific Gravity 2.65Porosity 0.44

c-qq
GRAIN SIZE D1STR1BUTION TESTc“ REPORT
200 100 10.0 1.0 0.1GRAIN SIZE - mm
0.01 0.
Test % +3” % GRAVEL % SAND % SILT I z CLAY} 2 0-0 0.2 82.4 17.4
I
LL PI 5/35 ’60 D50 D30 015 D1o cc c“
B 0.44 0.26 0.22 0.143I
I I I I I I IMATERIAL DESCRIPTION
I I I I I I I I I I
Uses I AASHTOD Purple Brown Silty Sand (SM)
Project No .: 50161-7-0108 Task 41
Project: R-Reactor Seepoge 8osin Perched Water
o Location: RR-O3-1O Ud @ 100.5-101.5 Ft.
Date: July 18,1999
GRAIN SIZE DISTRIBUTION TEST REPORT
!AW ENGINEERING, INC.
IRerna rks:
Tested By: SC
Reviewed by: +
Figure No.

WSRC-TR-99-O0330, Rev. O, RRSB Soil Moisture and Resistivity Field Investigation D-1
Appendix D – Water Level Data and Hydrography

~2 WSRC-TR-99-O0330, Rev.O,RRSB SoilMoistureandResistivityFieldInvestigation
This page intentionally left blank
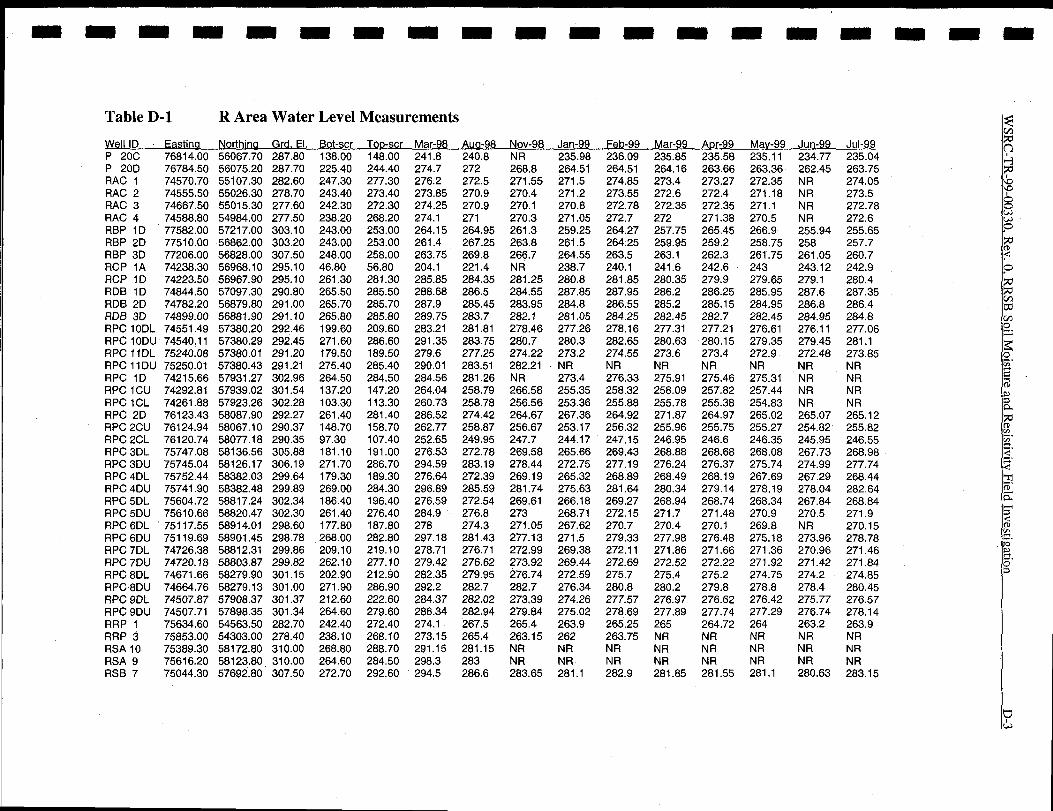
-- 9---9 ------- 9 ----
Table D-1 R Area Water Level Measurements
Well ID Eastina Northina Grd. El.P 20C 76814.0056067.70287.80P 20D 76784.5056075.20287.70RAC 1 74570.70 55107.30 282.60RAC 2 74555.50 55026.30 278.70RAC 3 74667.50 55015.30 277.60RAC 4 74588.80 54984.00 277.50RBP ID 77582.00 57217.00 303.10RBP 2D 77510.00 56862,00 303.20RBP 3D 77206.00 56828.00 307.50RCP 1A 74238.30 56968.10 295.10RCP 1D 74223.50 56967.90 295.10RDB 1D 74844.50 57097.30 290.80RDB 2D 74782.20 56879.80 291.00RDB 3D 74899.00 56881.90 291.10RPC 10DL 74551.49 57380,20 292.46RPC 10DU 74540.11 57380.29 292.45RPC 11DL 75240.08 57380.01 291.20RPC 1lDU 75250.01 57380.43 291.21RPC lD 74215.66 57931.27 302.96RPC 1CU 74292.81 57939.02 301.54RPC 1CL 74261.88 57923.26 302.28RPC 2D 76123.43 58087.90 292.27RPC 2CU 76124.94 58067.10 290.37RPC 2CL 76120.74 58077.18 290.35RPC 3DL 75747.08 58136.56 305.88RPC 3DU 75745.04 58126.17 306.19RPC 4DL 75752.44 58382.03 299.64RPC 4DU 75741.90 58382.48 299.89RPC 5DL 75604.72 58817.24 302.34RPC 5DU 75610.66 58820.47 302.30RPC 6DL 75117,55 58914.01 298.60RPC 6DU 75119.69 58901.45 298.78RPC 7DL 74726.38 58812,31 299.86RPC 7DU 74720.18 58803.87 299.82RPC 8DL 74671.66 58279.90 301.15RPC 8DU 74664.76 58279.13 301.00RPC 9DL 74507.87 57908.37 301.37RPC 9DU 74507,71 57898.35 301.34RRP 1 75634.60 54563.50 282.70RRP 3 75853.00 54303.00 278.40RSA 10 75389.30 58172.80 310.00RSA 9 75616.20 58123.80, 310.00RSB 7 75044.30 57692.80 307.50
Bot-scr138.00225.40247.30243.40242.30238.20243.00243,00248.0046.80261.30265.50265.70265.80199,60271.60179.50275.40264.50137.20103.30261.40148.7097.30181.10271.70179.30269.00186.40261.40177.80268.00209.10262.10202.90271.90212.60264.60242.40238.10268.80264.60272.70
Tot)-scr148.00244.40277.30273,40272.30268.20253.00253.00258.0056.80281.30285.50285.70285.80209.60286.60189.50285,40284.50147.20113.30281.40158.70107.40191.00286.70189.30284.30196.40276.40187.80282.80219.10277.10212.90286.90222.60279.60272.40268.10288.70284.50292.60
Mar-98241.8274.7276.2273.85274.25274.1264.15261.4263.75204.1285.85288.68287.9289.75283.21291.35279.6290.01284.56264.04260.73286.52262.77252.65276.53294.59276.64296.89276.59284.9278297.18278.71279.42282.35292.2284.37286.34274.1273.15291.15298.3294.5
Aua-98240.8272272.5270.9270.9271264.95267.25269.8221.4284.35286.5285.45283.7281.81283.75277.25283.51281.26258.79258.78274.42258.87249.95272.78283.19272.39285.59272.54276.8274,3281.43276.71276.62279.95282.7282.02282.94267,5265.4281.15283286.6
Nov-98NR268.8271,55270.4270.1270.3261.3263.8266,7NR281.25284.55283.95282.1278.46280.7274.22282.21NR266.58256.56264.67256.67247.7269.58278.44269.19281.74269.61273271.05277.13272.99273.92276.74282.7273,39279.84265.4263.15NRNR283,65
Jan-99235.98264.51271.5271.2270.8271.05259.25261.5264.55238.7280.8287.85284.8281.05277.26280.3273.2NR273.4255.35253.36267.36253.17244.17265.66272.75265.32275.63266.18268.71267.62271.5269.38269.44272.59276.34274.26275.02263.9262NRNR281.1
Feb-99236.09264.51274.85273.55272.78272.7264.27264.25263.5240,1281.85287.95286.55284.25278.16282.65274.55NR276.33258.32255.88264.92256.32247,15269.43277.19266.89281.64269.27272.15270.7279.33272.11272.69275.7280.8277.57278.69265.25263.75NRNR282,9
Mar-99235.85264.16273.4272.6272.35272257.75259.95263.1241.6280.35286.2285.2282.45277.31280.63273.6NR275.91258.09255.78271.87255.96246.95268.88276.24268.49280.34268.94271.7270.4277.98271.86272.52275.4280.2276.97277.89265NRNRNR281.85
J!K?.@Q235.58263.66273.27272.4272.35271.38265.45259.2262.3242.6279.9286.25285.15282.7277.21280.15273.4NR275.46257.82255.38264.97255.75246.6268.68276.37268.19279.14268.74271.48270,1276.48271.66272.22275.2279.8276.62277.74264.72NRNRNR281.55
Mav-99235.11263,36272.35271.18271.1270.5266.9258,75261,75243279.65285.95284.95282.45276.61279.35272.9NR275.31257.44254.83265.02255.27246.35268.08275.74267.69278.19268.34270.9269.8275.18271.36271.92274.75278.8276.42277.29264NRNRNR261.1
_Jw.MKL234.77262.45NRNRNRNR255.94258261.05243.12279.1287.6286.8284.95276.11279.45272.46NRNRNRNR265.07254.82245.95267.73274.99267.29278.04267.84270.5NR273.96270.96271.42274.2278.4275.77276.74263.2NRNRNR280.63
JuI-99235.04263.75274.05273.5272.78272.6255.65257.7260.7242.9280.4287.35286.4284.8277.06281.1273.85NRNRNRNR265.12255.82246.55268.98277.74268.44282.64268.84271.9270.15278.78271.46271.84274.85280.45276.57278.14263.9NRNRNR283.15

Table D-1 R Area Water Level Measurements (cont.) Table D-1 R Area Water Level Measurements
Well IDRSC 10RSC 2RSC 3RSC 4RSC 6RSC 7USC 8RSI) 1RSD 3RSD 4RSD 5RSD 6RSD 7RSD 8RSD 9RSE 1ARSE 2RSE 24RSE 25RSE 3ARSE 7RSE 8RSE 9RSF 1RSF 2RSF 3RSP 4DRSP 5DRSP 6DRSP 7D*NR= NO
Easting Northing Grd. El.75470.00 59542.70 293.8074378.60 58543.00 300.2074699.70 58724.70 299.9075097.80 58900.30 298.9075686.10 58607.10 302.1075686.20 58200.10 305.8075684.00 57818.10 307.6075035,10 57440.80 299.0074702.30 57451.60 299.2075154.60 57441.40 299.9075207.00 57439.90 299.9075256.60 57441.30 300.4075178.40 57394.30 291.6075229.60 57394.00 291.6075185.90 57245.60 291.0074712.70 57734.50 302.6074743.50 57594.90 301.0074638.90 57370.40 291.9074544.50 55824.50 291.8074931.20 57445.80 299.5074783.70 58481.50 301.2074869.40 58538.80 300.5074971.10 58463.30 304.5074869.40 58505.30 301.2074628.60 57670.40 300.6075206.70 57621.40 305.1075940.00 57480.00 298.2876279.00 58756.00 294.4475363.00 59311.00 297.9774295.00 59123.00 302.59
reading
Bot-scr255.50261.90258.60268.60267,70263.40271.30267.90269.30270.60269.60270.10267.30267.30251.70274.80269.70237.60237.50268.20266.50271.20266.70228.80224.80229.80265.20263.40255.90258.50
Top-scr Mar-98 Aug-98 Nov-98 Jan-99275.50 279.45 272.1 269.5 269.05281.90 284.05 281.3 282.4 276.8278.60 283.85 279.8 277,1 275288.60 293.4 280 276.8 273.9287.70 299.4 291.85 281.1 279.2283.40 295 282.8 278.28 274.85299.30 305.25 291.2 288.1 284.1287.70 293.25 287.9 283.9 292289.10 293.2 288.05 282 287.3290.60 294.6 290.1 285.3 290.9289.60 294.65 287.25 284.01 287.4290.10 294.75 285.5 283.25 285.8287.30 290.9 285.9 282.6 286287.30 291.05 285.8 282.92 286.1271.70 287.65 264.35 282.15 284.4294.80 294.35 288.05 NR 281.1289.50 291.85 286.35 280.35 281.6257.60 286.35 283.95 281.05 279.6257.50 281 277.7 275.6 275288.00 292.75 287.85 NR 287.7286.30 298 294.6 295.35 276.4291.00 294.05 288.9 284.85 283.15286.70 282.25 279.65 NR NR238.80 286.35 286.4 NR NR235.30 285.6 282.75 279.9 277.8239.80 287.47 282.3 279.75 278.3285.20 289.18 281.53 278.63 275.98283.50 286.09 270.04 270.04 270.24276.00 278.57 273.12 262.62 269.57278.40 279.54 275.69 273.29 272.29
Feb-99269.95277.4276.05278.5290.75276,6287.45288.15288.55289.9287.5286.65285.78285.75285.02286.4285.9280.9276.6286,3277.42285.75NRNR278.9279.37278.98270.29269.97272.59
Mar-99269.4277.1275.6277.45280.2275.9287.4288.4287.25291.05288.9287.65286.8286.8283.18284282.6279.92275.55289.2297.6285.05NRNR278.2278.8279.05270.34269.77272.39
Apr-99269276.8275.2276.2279.35275.6287.3285.15285.65286.6284.9284,7283.6284.05282,9282.88280.8279,7275.45283.8284.23283.75NRNRNR278.7279.06270.34269.52272,39
May-99 Jun-99268.45 267.8276.35 275.9274.9 273.3274.75 273.75277.3 281.3275.05 274.1286.3 NRNR 290.2284.42 286.9NR NRNR NRNR NRNR NRNR NR282.65 NR281.62 279.1279.05 278.55278.95 278.8275 NR283.2 288.5285.35 279.85283.15 282.3NR NRNR NRNR NR278.3 NR278.38 277.3270.34 270.44268.97 268.57271.99 264.39
JuI-99269.88276.85275.6278.15291.25277.4287.7292.25288.75290.1287.9286.95286.15286.2284.08287.45286.1280NR285.75277.18284.28NRNR278.1279.3279.73270.39269.62271.69

WSRC-TR-99-O0330, Rev. O,RRSB Soil Moisture and Resistivity Field Investigation D-5
290
285
280
275
g~ 270
s
2s5
264
255
25D
290
2sa
270
260
gIll
s ~M
240
2s4
220
-
I-xWPC ID
+Pclcl
-tRPc Icl
%
+- .I ~
—
.
—
~
—
—
RPC1WellHydrography
I
Mar- Apr. May. Jun- JuI-98 AW Sep CM- NOV. Dec. Jan.9898989S 9S989898!?S99
date
4-
F& Mar-
RPC2 WellHydrography
Apr. May Jun. JuI-88
9!398989399
ttltMar- Apr. May Jun. JuI.98 lug Sep. C+ Nov. kc- Jam F&b- Mar- Apr- May Jun. Ju!-S998 98 98 98 es 96988898 !299999 WWIS9
date
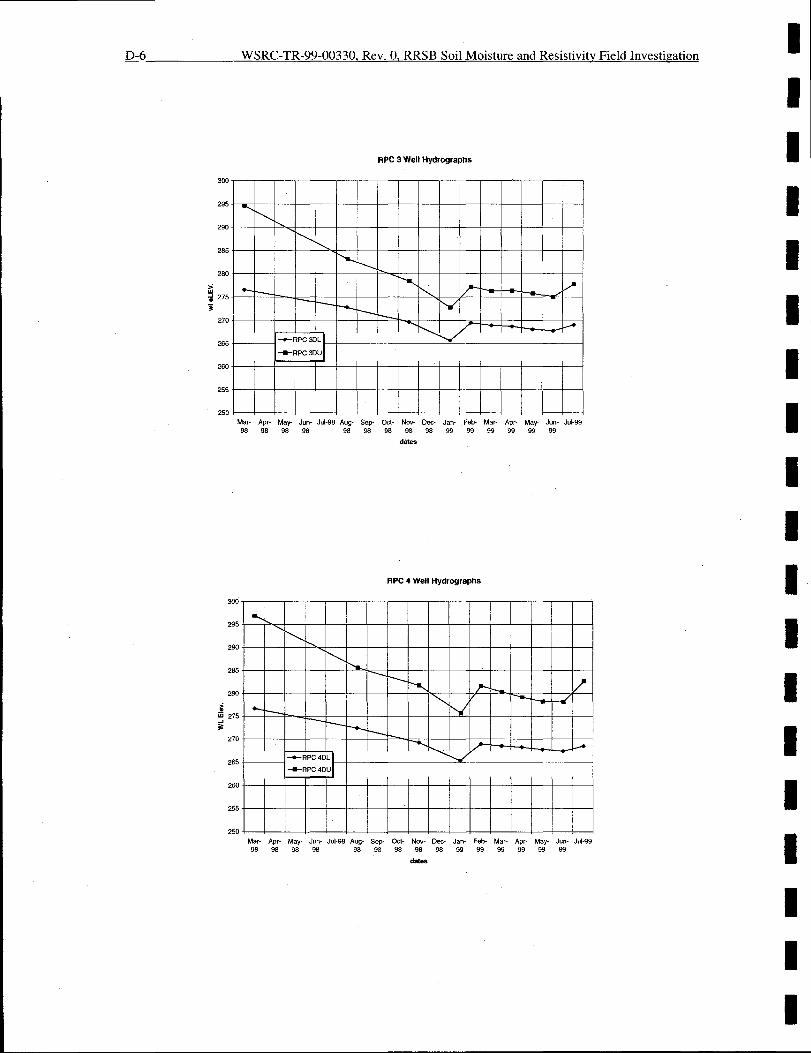
Q6 WSRC-TR-99-O0330, Rev. O, RRSB Soil Moisture and Resistivity Field Investigation
285
2WI
2s5
280
z< 275
z
270
265
280
255
250
RPC3 WellHydrography
—
—
+RPc SDU
I
Aar. Apr. May. Jun. JuI-98 Aug. Sap- Oct. Nov. Dec. Jan- F* Mar- Apr. M?+ Jun. Juk9998 98 8S 98 98989898989899 99888999
dates
RPC4 WellHydrography
WI
2e5
290
2s5
2s0
~~ 275
$
270
265
260
255
250
1 I 1 ( 1 , I I [ t I
P “‘p““‘r-l-+’.
Mar- Apr- May- Jun. JuI-98 Aug. S+- O@ Nov. Oec- Jm. F&. Mar- Apr- May- Jun. JuI-9998 98 98 98 989S 8898989999 9999 S989
ties

------m -9 ----- -----
WLElev.
I
WL Elev.
I

Q8 WSRC-TR-99-O0330, Rev. O, RRSB Soil Moisture and Resistivitv Field Investigation
RPC7 Well Hydrcgraphs
282
280
278
276
> 274*wAS 27*
270
, 426a
284-
264.
Mar- Apr. May Jun. JIMX3 Aug- %p C@- Nw- Dee Jan. Feb- Mar- Apr. May Jun. JuI-s498 98 9S 98 98989898988999 S9999999
RPC 8 Well Hydrography
295
290
285
280>.
$
s275
270
265
260
Mm. Apr. May Jun. J“I.98 Aug. S8P. OCt- NOV. D8e- Jan- Fet- Mar- Ap+ May Jurt JuI-9998 98 98 98 98989898989999 99S9W ’99

-t-
-1
RPC 9 Well Hydrcgraphs
—
—
P
—
—
—
-a
v—
295
290
2S5
280
~w
$275
270
2e5
28C
Mar- .@ May. Jun. JuI-9S Aug. Sep. Ccl- Nw. Da- Jam F6b- Mar- Apr. May Jun- Ju!-89
% 9s 98 9s 989898989S 9999 99999999
dares
RPC 10 Well Hydrogrsphs
IFEJErfi
-PC 1oDL
~PC 10DU
-PC sDL
-s-RPC 9DUI
9 WSRC-TR-99-00330, Rev O,~SBSoll Moisture and Reslstlvlty Field Investlgatlon D-9
9
I
1
I
I
B
I
8
1
1
B
I
1
I
B
I
I
9
Mar- Apr. May- Jun. JuI-S Aug- SeF- D& Nov. Dec. Jan- Fet- Mar- Apr- May Jun. JuW9989s9s98 989898989S 9992 99 S99989
dares
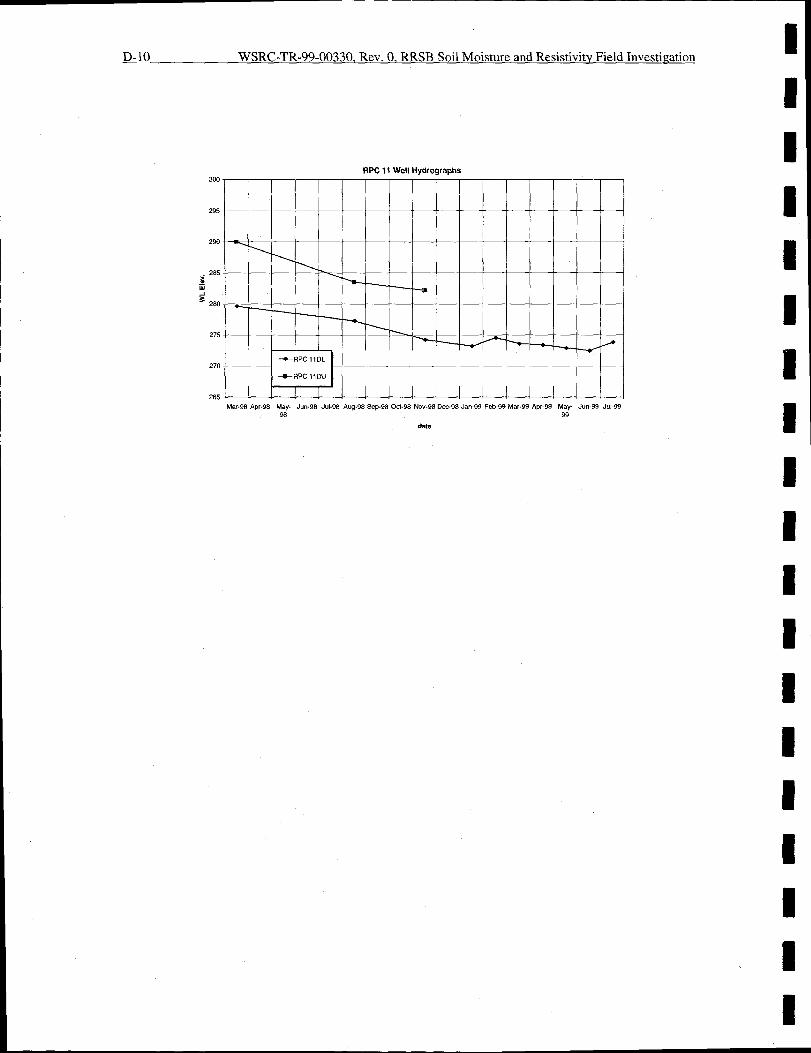
&lo WSRC-TR-99-O0330, Rev. O,RRSB Soil Moisture and Resistivity Field Investigation
300
295
29+2
285&UI
$ Zm
275
E
270
265 E
6RPC llDL
-D- RPCIIDLI
1Mar-98 APr-98 May J..-98 J.I-98 Aw-98 SW-98 CM-98 Nov-98 D--98 Jan-99 Fet-98 Mar-m Apr-99 May Jun-59 JuI-99
98 w
tie