R. K. Bakshi Chairman – Bank of Baroda (Kenya) Ltd.bankofbarodakenya.com/images/bob/2011 -Bank of...
28
1 Bank of Baroda (Kenya) Limited | Annual Report & Financial Statements for the Year Ended 31 December 2011 “To build on the momentum of the last two years, we shall continue to focus more on long term sustainable business, providing personalized services to our clients, marketing the products and strengthening alternate delivery channels for customer convenience.” R. K. Bakshi Chairman – Bank of Baroda (Kenya) Ltd.
Transcript of R. K. Bakshi Chairman – Bank of Baroda (Kenya) Ltd.bankofbarodakenya.com/images/bob/2011 -Bank of...

1
Bank of Baroda (Kenya) Limited | Annual Report & Financial Statements for the Year Ended 31 December 2011
“To build on the momentum of the last two years, we shall continue to focus more on long term sustainable business, providing personalized
services to our clients, marketing the products and strengthening alternate delivery channels for customer convenience.”
R. K. BakshiChairman – Bank of Baroda (Kenya) Ltd.

3
Bank of Baroda (Kenya) Limited | Annual Report & Financial Statements for the Year Ended 31 December 2011
Table of Contents
Chairman’s Report 4
Company Information 8
Corporate Governance 11
Report of the Directors 14
Statement of Directors’ Responsibilities 15
Independent Auditors Report 16
Financial Statements
Income Statement 17
Statement of Comprehensive Income 18
Statement of Financial Position 19
Statement of Changes in Equity 20
Statement of Cash Flows 21
Notes to the Financial Statements 22
The following pages do not form an integral part of these financial statements
Annexure I 49
Annexure II 50
Annexure III 51
Highlights of 2011 52

4 5
Bank of Baroda (Kenya) Limited | Annual Report & Financial Statements for the Year Ended 31 December 2011Bank of Baroda (Kenya) Limited | Annual Report & Financial Statements for the Year Ended 31 December 2011
Table of Contents
Dear Stakeholders,
I have the pleasure to present the Bank’s Annual Audited Report and Financial Statements for the year ended 31st December 2011. The Bank continued to maintain its growth and profitability momentum on account of improved internal management and continuous support from stakeholders, despite turmoil in the global economy.
KENYAN ECONOMY
The year 2011 witnessed economic slowdown worldwide followed by Euro Zone sovereign debt crisis and high fuel costs. Kenya was also not an exception. Early signs of recovery in the Economy at the end of 2009 from the global meltdown in 2008 caught its momentum in 2010. During 2010, the real GDP expanded by 5.6% after suppressed growth of 1.5% and 2.6 % in 2008 and 2009 respectively. The developments in 2010 were attributed to favorable weather conditions, increased credit to private sector, low inflationary pressure and relatively stable domestic environment.
Due to turbulent macroeconomic environment, the country’s real GDP grew by 4.1% in the second quarter of year 2011 down from 4.6% in the same period in the year 2010. It is further expected that GDP of Kenya may shrink due to macro-economic factors coupled with aggressive tightening of monetary policy. The World Bank and IMF both have revised Kenya’s Economic Growth forecasts downward to 4.8% and 5.4% from their earlier projections of 5.3% and 5.7% respectively.
The main factors cited for the decline in GDP include the following:-• Increased food (maize) and energy prices. • Tight liquidity in financial system. • A wide negative gap in Balance of Payment (BoP) Position, Balance of Trade deteriorated to negative in 2011. • High Interest Rate scenario - upward shift in Yield Curve & increased Base Lending Rate of Banks ranging between 22-25%. • High inflation & high inflationary expectations.• High cost of government borrowing.• Increasing expenditure on security measures (war against Somali militants). • Volatile exchange rates and depreciation of home currency against major foreign currencies.• Drought and famine in most parts of the country.• Debt crisis in Euro Zone countries.• Political uncertainties.
BANKING SECTOR
The financial sector in Kenya consists of Commercial Banks, Microfinance Institutions, Mortgage Finance Companies, and Forex Bureaus. As on 31st December 2011, the banking sector comprised of 43 Commercial Banks, 1 Mortgage Finance company, 6 deposit taking Microfinance Institutions, 3 representative offices of foreign banks, 118 Foreign Exchange Bureaus and 2 Credit Reference Bureaus.
The banking sector registered an enhanced performance as of 31st December 2011, assets size of banks stood at Kshs 2,046 bn, loans and advances at Kshs 1,206 bn, and deposit base at Kshs 1,542 bn while profit before tax (PBT) at Kshs 89.6 bn. The number of customer deposit accounts stood at 13.65 mn with a branch network of 1,114. The stock of Gross Non Performing Advances (NPAs) reduced to 4.4% of Gross advances in December 2011 against 6.2% in December 2010. The reduction in stressed assets was attributed mainly to enhanced appraisal standards, timely re-structuring of debts, recoveries in bad loans and write off in respect of perceived non-recoverable loans.
Chairman’s Report
DEVELOPMENTS IN SUPERVISORY FRAMEWORK
In September 2011 the Central Bank of Kenya issued a guidance note to Commercial Banks to safeguard and combat financing of terrorism wherein it required Commercial Banks to file Suspicious Transaction Reports (STRs) with the Financial Reporting Centre.
In order to strengthen the home currency the Central Bank of Kenya took various measures and issued a series of guidelines to the Foreign Exchange market in 2nd half of the year 2011; -
• The foreign exchange risk exposure in any single currency, reduced to 10% (from 20%) of institution’s core capital.
• The overall foreign exchange risk exposure, reduced to 10% (from 20%) of institution’s core capital.• Restricted to facilitate the movement of local currency between the NOSTRO accounts of offshore
banks in their books or with other banks without proof of underlying customer transaction.• Foreign currency swaps involving Kenya Shillings was limited to a minimum tenor of seven (-7-) days.• ‘Reverse Carry’ transactions which have been recently introduced into the market was limited to a
minimum tenor of one year, i.e. the foreign currency swaps and forward transactions involving Kenya Shillings for non- resident financial institutions was limited to a minimum tenor of one year.
• Central Bank Rate (CBR) was revised upwardly from 6.00% (in 2010) to 18.00% (in 2011).• Cash Reserve Ratio (CRR) was increased from 4.75% to 5.25%.
PERFORMANCE OF THE BANK
During the year, Bank crossed total business of Kshs 50 bn with deposits increasing by 18.22% to Kshs 30.26 bn and the loan book expanding by 42.72% to Kshs 19.74 bn as on 31.12.2011. With unusually high rates of interest on deposits being offered in the market, the Bank adopted a cautious approach for canvassing fresh deposits and instead offloaded some investments to take care of the expanding loan book. Though the increased cost of deposits had put strain on our profitability yet with the increased interest incomes the Bank attained net profit of Kshs 1.36 bn. The Bank’s Gross NPA stood at Kshs 649 Mn and with adequate provisions the Net NPA reduced to Kshs. 55 Mn as on 31.12.2011 compared to Kshs 117 as on 31.12.2010.
INITIATIVES
In line with the Bank’s expansion strategy, our branch at Kakamega was opened in November 2011 and the first of its kind “ALL WOMEN EMPLOYEE” branch became functional in March 2012 in Nyali. In furtherance to the Bank’s strategies, we are exploring the possibility of opening more branches in different parts of the country.
To further enhance monitoring of credit portfolio, new software- ASCROM has been implemented from March 2012. To build on the momentum of the last two years, we shall continue to focus more on long term sustainable business, providing personalized services to our clients, marketing the products and strengthening alternate delivery channels for customer convenience. The opening of our Kakamega Branch will also facilitate the introduction of Agency Banking to supplement Business development.
ACKNOWLEDGEMENTS
I take this opportunity to extend my appreciation to our esteemed customers and business partners for their continued support and the confidence demonstrated. I also wish to thank our dedicated staff members for their efforts which have enabled the Bank to achieve a good performance. The general enthusiasm and high spirit of our staff is a source of great strength to the organisation. I also express gratitude to Board of Directors for their active involvement in guiding the Bank towards its progress.
My special thanks to you, our shareholders, for your continued encouragement and cooperation. We are committed to look forward and deliver. I also take this opportunity to thank the Government of Kenya and the Central Bank of Kenya for their healthy information system, policies which have been an indispensable input in the Bank’s decision making process and their support in our endeavour to expand business.
(R. K Bakshi) Chairman - Bank of Baroda (Kenya) Ltd

6 7
Bank of Baroda (Kenya) Limited | Annual Report & Financial Statements for the Year Ended 31 December 2011Bank of Baroda (Kenya) Limited | Annual Report & Financial Statements for the Year Ended 31 December 2011
Table of ContentsBoard of Directors
Name: Mr. R. K. BakshiAge: 59yrsNationality: IndianPosition: Chairman and Non-Executive DirectorDate of Appointment: 7 December 2009Other Directorships: Bank of Baroda (Tanzania) Ltd -Non Executive Indo-Zambia Bank Ltd -Non ExecutiveQualifications: M. Sc, CAIIB, Diploma in Bank ManagementPercentage of Shareholding in the bank: None
Name: Mr. Arun ShrivastavaAge: 55yrsNationality: IndianPosition: Managing DirectorDate of Appointment: 16 July 2009Other Directorships: Bank of Baroda (Tanzania) Ltd -Non Executive Bank of Baroda (Uganda) Ltd -Non Executive Qualifications: M.Sc, CAIIB,AIBMPercentage of Shareholding in the bank: One share
Name: Mr. Sunil K. SrivastavaAge: 50yrsNationality: IndianPosition: Executive DirectorDate of Appointment: 8 January 2010Other Directorships: NoneQualifications: B. Sc, CAIIBPercentage of Shareholding in the bank: None
Name: Mr. Kupple Dev LambaAge: 58yrsNationality: IndianPosition: Non-Executive DirectorDate of Appointment: 31 December 2010Other Directorships: NoneQualifications: M.A. CAIIB Percentage of Shareholding in the bank: None
Name: Mr. Vikram C. Kanji Age: 45yrsNationality: KenyanPosition: Non-Executive DirectorDate of Appointment: 22 January 2010Other Directorships: Leadway Investments Ltd -Executive Suvila Ltd -Executive Mombasa Cement Ltd -(Non -Executive)Qualifications: Solicitor (enrolled with Law Society of UK), Advocate of High court of Kenya, Certified Public Secretary of Kenya) Percentage of Shareholding in the bank: None
Name: Mr. J. K. MuiruriAge: 66yrsNationality: KenyanPosition: Non-Executive DirectorDate of Appointment: 14 September 2007Other Directorships: Sunset Boulevard Limited, Kenya Holdings Limited, Lion of Kenya Ins. Company Limited, Farmchem Limited, Knight Frank Kenya Limited African Banking Corporation (ABC) BankQualifications: ACCA, CPA (K)Percentage of Shareholding in the bank: None

8 9
Bank of Baroda (Kenya) Limited | Annual Report & Financial Statements for the Year Ended 31 December 2011Bank of Baroda (Kenya) Limited | Annual Report & Financial Statements for the Year Ended 31 December 2011
Company Information
PRINCIPAL SHAREHOLDERSBank of Baroda - India - 86.70%
PRINCIPAL OFFICERSMr. Arun Shrivastava - Managing DirectorMr. Sunil K. Srivastava - Director -ExecutiveMr. Kumar Ajay Singh - Head - OperationsMr. Rajesh Kumar - Head - Risk Management / ComplianceMs. Elizabeth Nyambutu - Head - CreditMr. Winston Sore - Head - Internal AuditMr. Sanjay Kumar Ray - Head - Treasury (Front Office)Mr. David Kinuthia - Head - Treasury (Back Office)Mr. Patrick Sila - Head - FinanceMr. Manoj K. Sachar - Branch Head - Digo Rd, Mombasa BranchMr. Arya Das - Branch Head - Thika BranchMr. Madan L. Dahiya - Branch Head - Kisumu BranchMr. Diwakar P. Singh - Branch Head - Sarit Centre BranchMr. Raman Kumar - Branch Head - Eldoret BranchMr. Anil K. Taneja - Branch Head - Nakuru BranchMr. Paul Kairu - Branch Head - Kakamega BranchMr. Aditya Narayan Singh - Branch Head - Nairobi main officeMs. Neela Raj - Branch Head - Nyali Branch REGISTERED OFFICEBaroda HouseP.O. Box 30033, 00100NAIROBI - KENYATelephone: (020) 2248402, 2248412, 2226416Fax: (020) 316070/310439E-mail: [email protected]; [email protected]
AUDITORS COMPANY SECRETARY PKF Kenya Africa RegistrarsCertified Public Accountants Kenya - Re TowersKalamu House, Grevillea Grove, Westlands UpperhillP.O. Box 14077, 00800 P.O. Box 1243, 00100Telephone: +254(20)4446616/9, 4270000 NAIROBI - KENYANAIROBI - KENYA
LEGAL ADVISORS PRINCIPAL VALUERSHamilton, Harrison & Mathews Njihia Njoroge & Co A. B. Patel & Patel Advocates Crystal Valuers LimitedMwaura & Wachira Advocates Datoo Kithiku LimitedPatel & Patel Advocates Coral Properties Limited
PRINCIPAL CORRESPONDENTS Bank of Baroda - Mumbai, India Bank of Baroda - New York, U.S.A. Bank of Baroda - London, U.K. Bank of Baroda - Brussels, Belgium Bank of Baroda - Durban, South Africa Bank of India - Tokyo, Japan Bank of Montreal - Toronto, Canada Union Bank of Switzerland - Zurich, Switzerland
HEAD OFFICE Baroda House, 29 Koinange Street P.O. Box 30033, 00100 NAIROBI Telephone: +254(20) 2248402 / 2248412 / 2226416 Fax: (020) 316070/310439 E-mail: [email protected]; [email protected]
BRANCH NETWORK KOINANGE STREET, NAIROBI BRANCH ELDORET BRANCH Baroda House, 29 Koinange Street Charotar Patel Plaza, Moi Street P.O. Box 30033, 00100 P.O. Box 1517, 30100 NAIROBI ELDORET Telephone: (020) 2248402/12 Telephone: (053) 2063341 Fax: (020) 310439 Fax: (053) 2063540 E-mail: [email protected] E-mail: [email protected] DIGO ROAD, MOMBASA BRANCH INDUSTRIAL AREA BRANCH Kenya House, Digo Road Enterprise Road P.O. Box 90260, 80100 P.O. Box 18269, 00500 MOMBASA NAIROBI Telephone: (041) 224507/8, 2226211 Telephone: (020) 555971/2/3 Fax: (041) 228607 Fax: (020) 555943 E-mail: [email protected] E-mail: [email protected] KISUMU BRANCH SARIT CENTRE, WESTLANDS BRANCH Central Square Lower Ground Floor, Sarit Centre P.O. Box 966, 40100 P.O. Box 886, 00606 KISUMU NAIROBI Telephone: (057) 2021768/74, 2020303 Telephone: (020) 3752590/91 Fax: (057) 2024375 Fax: (020) 3752592 E-mail: [email protected] E-mail: [email protected] THIKA BRANCH NAKURU BRANCH Kenyatta Avenue Vickers House, Kenyatta Avenue P.O. Box 794, 01000 P.O. Box 12408, 20100 THIKA NAKURU Telephone: (067) 22379, 30048 Telephone: (051) 2211718 Fax: (067) 30048 Fax: (051) 2211719 E-mail: [email protected] E-mail: [email protected] NYALI BRANCH KAKAMEGA BRANCH Texas Towers, Nyali Road Kenyatta Avenue P.O. Box 95450-80106, P.O. Box 2873Nyali, Mombasa. KAKAMEGA Tel: (041) 447 1103 Telephone: (056) 31766Fax: (041) 447104 Fax: (056) 2111777E-mail:[email protected] E-mail: [email protected]

10 11
Bank of Baroda (Kenya) Limited | Annual Report & Financial Statements for the Year Ended 31 December 2011Bank of Baroda (Kenya) Limited | Annual Report & Financial Statements for the Year Ended 31 December 2011
Board Committees
Board AuditCommittee
CreditCommittee
Asset and LiabilityCommittee
Risk ManagementCommittee
ExecutiveCommittee
Composition
Three Non-Executive Directors
Two Executive and TwoNon-Executive Directors.
Two Executive Directors,Head CreditHead OperationsHead Treasury (Front Office) Head Treasury (Back Office) Head Risk / ComplianceHead Finance
One Executive Director Head CreditHead OperationsHead ITHead Treasury (Front Office)Head Risk Management & Compliance Head Finance
One Executive Director Head CreditHead OperationsHead ITHead Treasury (Front Office)Head HRMHead Finance
Main function
Strengthening the control environment, financial reporting and auditing function.
Appraisal and approval of credit applications andreviewing credit portfolio.
Monitoring and Management of the statement of financial positionincluding liquidity risk,interest rate risk, foreign currency risk and compliance with all statutory requirements.
Ensuring quality, integrity and reliability of the Bank’ s Risk Management function.
To act as link between the Board and Management in implementing operational plans, annual budgets and periodic review of operations, strategic plans and identification of opportunities.
Frequency of meetings per Annum (minimum)
Quarterly Quarterly Monthly Quarterly Three times a year
Chairman
Mr. J. K. Muiruri Mr. Arun Shrivastava Mr. Arun Shrivastava Mr. Sunil K. Srivastava Mr. Sunil K. Srivastava
Members
Mr. Vikram C. KanjiMr. K. D. Lamba
Mr. J. K. MuiruriMr. Vikram C. KanjiMr. Sunil Srivastava
Mr. Sunil SrivastavaMr. Kumar Ajay SinghMs. Elizabeth NyambutuMr. Sanjay Kumar RayMr. Rajesh Kumar Mr. Patrick Sila Mr. David Kinuthia
Mr. Kumar Ajay SinghMs. Elizabeth NyambutuMr. Sanjay Kumar RayMr. Rajesh Kumar Mr. Patrick Sila Mr. Patrick Kombe
Mr. Kumar Ajay SinghMs. Elizabeth NyambutuMr. Sanjay Kumar RayMr. Patrick Sila Mr. Patrick Kombe
The Bank places strong importance on maintaining a sound control environment and applying the highest standards to continue its business integrity and professionalism in all areas of activities. It shall continue its endeavour to enhance shareholders’ value by protecting their interests and defend their rights by ensuring performance at all levels and maximising returns with minimal use of resources in its pursuit of excellence in corporate life.
RESPECTIVE RESPONSIBILITIES The shareholders’ role is to appoint the Board of Directors and the external auditors. This role is extended to holding the Board accountable and responsible for efficient and effective governance. The Board of Directors is responsible for the governance of the Bank, and to conduct the business and operations of the Bank with integrity and in accordance with generally accepted corporate practices, in a manner based on transparency, accountability and responsibility.
BOARD OF DIRECTORS The composition of the Board is set out on page 6-7. The Board is chaired by a Non-Executive Chairman and comprises of Managing Director (Executive Director), one other Executive Director and three other non-Executive Directors. All non-Executive Directors are independent of management. The Board has varied and extensive skills in the areas of banking, business management, accountancy and information communication and technology. The Directors’ responsibilities are set out in the Statement of Directors Responsibilities on page 15. The Directors are responsible for the development of internal financial controls which provide safeguard against material mis-statements and fraud and also for the fair presentation of the financial statements. The Board meets on a quarterly basis and has a formal schedule of matters reserved for discussion. During the year under review, six Board meetings were held on the following dates: - 08 February, 2011 - 28 February, 2011 - 08 March, 2011 - 28 June, 2011 - 16 August, 2011 - 20 December, 2011 The attendance of individual Directors is as follows:
Name of director Period Meetings held during their tenure Meetings Attended
Mr. Rajiv Kumar Bakshi 01 January 2011 to 31 December 2011 6 6
Mr. Arun Shrivastava 01 January 2011 to 31 December 2011 6 6
Mr. Sunil Srivastava 01 January 2011 to 31 December 2011 6 4
Mr. J. K. Muiruri 01 January 2011 to 31 December 2011 6 6
Mr. Vikram Kanji 01 January 2011 to 31 December 2011 6 5
Mr. Kupple Dev Lamba 01 January 2011 to 31 December 2011 6 5
The Board has appointed various sub-committees to which it has delegated certain responsibilities with the chairman of the sub-committees reporting to the Board. The composition of the sub-committees is set out on page 10.
Corporate Governance

12 13
Bank of Baroda (Kenya) Limited | Annual Report & Financial Statements for the Year Ended 31 December 2011Bank of Baroda (Kenya) Limited | Annual Report & Financial Statements for the Year Ended 31 December 2011
BOARD EVALUATION
In compliance with the Prudential Guidelines issued by the Central Bank of Kenya and also part of good corporate governance, each member of the Board including the Chairman conducted a peer evaluation exercise for the year 2011. This involved a self review of the Board’s capacity, functionality and effectiveness of performance against its set objectives. This enabled the Board to assess its areas of strengths and weakness and then know how to balance its skills, expertise and knowledge.
The Board Performance evaluation covered the following: (a) The Board Self Evaluation The Board’s performance during the year was evaluated by each member where members were allowed to give their opinion on how the Board had performed. Members were satisfied that the Board had performed to their expectations. (b) The Director Peer Evaluation A Directors’ Peer evaluation exercise was conducted for each member. Each director was required to give the ratings on the performance of each member of the Board. (c) The Board Chairman’s Evaluation The Board Members assessed the Chairman’s performance and noted that the Board managed to achieve its Business targets for year 2011 under his Chairmanship. The Chairman was effective during the year.
BOARD COMMITTEES Board Audit Committee The committee comprises three non-Executive Directors. The committee meets on a quarterly basis and its functions include: • Monitoring and strengthening the effectiveness of management information and internal control systems.• Review of financial information and improving the quality of financial reporting. • Strengthening the effectiveness of internal and external audit functions, and deliberating on significant issues arising
from internal and external audits, and inspections carried out by the Bank Supervision Department of Central Bank of Kenya.
• Increasing the stakeholders’ confidence in the credibility and stability of the institution. • Monitoring instances of non-compliance with the International Financial Reporting Standards, applicable legislation and
Central Bank of Kenya Prudential Regulations and other pronouncements. Credit Committee The committee is chaired by the Managing Director (Executive Director) and comprises of one other Executive Director, two Non-Executive Directors and head of credit as convener. It meets at least once in a quarter. The functions of the committee include Credit monitoring, appraisal and approval of credit applications based on limits set by the Board. The committee also monitors and reviews non-performing advances and ensures that adequate loan loss provisions are held against delinquent accounts in accordance with the guidelines issued by the Central Bank of Kenya and International Financial Reporting Standards.
MANAGEMENT COMMITTEES Asset and Liability Committee The committee, chaired by the Managing Director, comprising one Director (Executive) and various departmental heads, meets on a monthly basis to discuss operational issues and to monitor and manage the statement of financial position to ensure that adequate resources are available to meet anticipated fund demands and to monitor compliance with all statutory requirements. The committee is also responsible for developing a framework for monitoring the banking risks including operational, liquidity, maturity, interest rate and exchange rate risks.
Risk Management CommitteeThe committee, chaired by the Director Executive and comprising various departmental heads, meets on a quarterly basis to ensure quality, integrity and reliability of Risk Management function and programme by way of assisting the Board of Directors in the discharge of duties relating to the corporate accountability, reviewing the integrity of the risk control systems, monitoring external developments relating to the practice of corporate accountability and providing independent and objective oversight. Executive CommitteeThe committee, chaired by the Director-Executive and comprising various departmental heads, meets at least three times a year to implement operational plans, annual budgeting, periodic reviews of operations, strategic plans, ALCO strategies, identification and management of key risks and opportunities. Directors’ Remuneration The remuneration to all Directors is based on the responsibilities allocated to the Directors, and is subject to regular review to ensure that it adequately compensates them for the time spent on the affairs of the Bank. The remuneration paid to the Directors and key management staff is disclosed in note 32 to the financial statements. Relationship with ShareholdersThe Bank is a private limited liability company with the details of the main shareholder set out on page 8. Shareholders have full access through the Managing Director to all information they require in respect of the Bank and its affairs. In accordance with the guidelines issued by the Central Bank of Kenya, the Bank publishes quarterly accounts in the Kenyan newspapers. Corporate Social Responsibility To boost our image, we foster to play an active role in the “give back to the society” through augmenting the principle of Corporate Social Responsibility. The Bank assisted financially various organisations such as the Kenya Red Cross and Industrial Area Prison.
(Arun Shrivastava)Managing Director
02/03/ 2012

14 15
Bank of Baroda (Kenya) Limited | Annual Report & Financial Statements for the Year Ended 31 December 2011Bank of Baroda (Kenya) Limited | Annual Report & Financial Statements for the Year Ended 31 December 2011
The Directors submit their report and the audited financial statements for the year ended 31 December 2011, in accordance with Section 22 of the banking Act and Section 157 of the Companies Act, which disclose the state of affairs of the Bank.
PRINCIPAL ACTIVITIES The Bank is licensed under the banking Act and provides banking, financial and related services.
DIVIDENDThe Directors propose a final dividend of Shs. 3.40 per share (2010: Shs. 3.40 per share) amounting to Shs. 168.25 million (2010: Shs. 168.25 million).
DIRECTORSThe Directors who held office during the year and to the date of this report are shown on page 6-7. In accordance with the Bank’s Articles of Association, no Director is due for retirement by rotation.
INDEPENDENT AUDITORS The company’s auditors, PKF Kenya, have indicated their willingness to continue in office in accordance with Section 159(2) of the Companies Act (Cap. 486), subject to approval of the Central Bank of Kenya in accordance with Section 24(1) of the Banking Act (Cap. 488).
BY ORDER OF THE BOARD _______________________ COMPANY SECRETARY NAIROBI 02/03/ 2012
Report of the Directors
RESULTS2011
Shs ‘0002010
Shs ‘000
Profit before tax 1,676,383 1,827,573
Tax (312,502) (434,171)
Profit for the year 1,363,881 1,393,402
Statement of Directors’ Responsibilities
The Companies Act (Cap. 486) requires the Directors to prepare financial statements which give a true and fair view of the state of affairs of the Bank as at the end of the financial year and of the results for that year. It also requires the Directors to ensure that the Bank maintains proper accounting records which disclose with reasonable accuracy the financial position of the Bank. The Directors are also responsible for safeguarding the assets of the Bank. The Directors accept the responsibility for the financial statements which have been prepared using appropriate accounting policies supported by reasonable and prudent judgements and estimates, consistent with previous years, and in conformity with International Financial Reporting Standards and the requirements of the Companies Act (Cap. 486). The Directors are of the opinion that the financial statements give a true and fair view of the state of the financial affairs of the Bank as at 31 December 2011 and of its operating results for the year then ended. The Directors further confirm the accuracy and completeness of the accounting records maintained by the Bank which have been relied upon in the preparation of the financial statements, as well as on the adequacy of the systems of internal financial controls. Nothing has come to the attention of the Directors to indicate that the Bank will not remain a going concern for at least the next twelve months from the date of this statement. Approved by the Board of Directors on 02/03/2012 and signed on its behalf by: ________________________ ___________________MANAGING DIRECTOR DIRECTOR

16 17
Bank of Baroda (Kenya) Limited | Annual Report & Financial Statements for the Year Ended 31 December 2011Bank of Baroda (Kenya) Limited | Annual Report & Financial Statements for the Year Ended 31 December 2011
Independent Auditors Report to the members of Bank of Baroda (Kenya) Limited
REPORT ON THE FINANCIAL STATEMENTSWe have audited the accompanying financial statements of Bank of Baroda (Kenya) Limited set out on pages 17 to 48, which comprise the statement of financial position as at 31 December 2011 and the income statement, statement of comprehensive income, statement of changes in equity and statement of cash flows for the year then ended, and a summary of significant accounting policies and other explanatory information.
DIRECTORS’ RESPONSIBILITY FOR THE FINANCIAL STATEMENTSThe Directors are responsible for the preparation and fair presentation of these financial statements in accordance with International Financial Reporting Standards and the requirements of the Companies Act (Cap. 486), and for such internal control as management determines is necessary to enable the preparation of the financial statements that are free from material misstatement, whether due to fraud or error.
AUDITOR’S RESPONSIBILITYOur responsibility is to express an opinion on these financial statements based on our audit. We conducted our audit in accordance with International Standards on Auditing. Those standards require that we comply with ethical requirements and plan and perform the audit to obtain reasonable assurance about whether the financial statements are free from material misstatement. An audit involves performing procedures to obtain audit evidence about the amounts and disclosures in the financial statements. The procedures selected depend on the auditor’s judgement, including the assessment of the risk of material misstatement of the financial statements, whether due to fraud or error. In making those risk assessments, the auditor considers internal control relevant to the entity’s preparation and fair presentation of the financial statements in order to design audit procedures that are appropriate in the circumstances, but not for the purpose of expressing an opinion on the effectiveness of the entity’s internal control. An audit also includes evaluating the appropriateness of accounting policies used and the reasonableness of accounting estimates made by management, as well as evaluating the overall presentation of the financial statements. We believe that the audit evidence we have obtained is sufficient and appropriate to provide a basis for our audit opinion.
OPINION In our opinion, the accompanying financial statements give a true and fair view of the financial position of Bank of Baroda (Kenya) Limited as at 31 December 2011 and of its financial performance and its cash flows for the year then ended in accordance with International Financial Reporting Standards and the requirements of the Companies Act (Cap. 486).
REPORT ON OTHER LEGAL REQUIREMENTS As required by the Companies Act (Cap. 486) we report to you, based on our audit, that:(i) we have obtained all the information and explanations which to the best of our knowledge and belief were necessary for the purposes of our audit;(ii) in our opinion proper books of account have been kept by the Bank, so far as appears from our examination of those books; and (iii) the Bank’s statement of financial position, income statement and statement of comprehensive income are in agreement with the books of account.
Certified Public Accountants PIN NO. P051130467RNAIROBI27/03/201291/12
Income Statement
The significant accounting policies on pages 22 to 29 and the notes on pages 30 to 48 form an integral part of these financial statements. Report of the independent auditors - Pages 16.
Notes2011
Shs ‘0002010
Shs ‘000
Interest income 1 3,925,869 2,946,246
Interest expense 2 (1,639,739) (1,269,151)
NET INTEREST INCOME 2,286,130 1,677,095
Fees and commission income 164,693 127,726
Foreign exchange trading income 46,528 30,504
Other income 3 (41,860) 601,542
OPERATING INCOME 2,455,491 2,436,867
Increase in impairment losses on loans and advances
4 (199,349) (55,717)
Other operating expenses 5 (579,759) (553,577)
PROFIT BEFORE TAX 1,676,383 1,827,573
Tax 6 (312,502) (434,171)
PROFIT BEFORE TAX 1,363,881 1,393,402
EARNINGS PER SHARE
Basic and diluted (Shs. per share) 7 27.56 28.16
DIVIDEND
Proposed final dividend for the year 8 168,252 168,252
DIVIDEND PER SHARE (Shs. per share) 8 3.40 3.40
18 19
Bank of Baroda (Kenya) Limited | Annual Report & Financial Statements for the Year Ended 31 December 2011Bank of Baroda (Kenya) Limited | Annual Report & Financial Statements for the Year Ended 31 December 2011
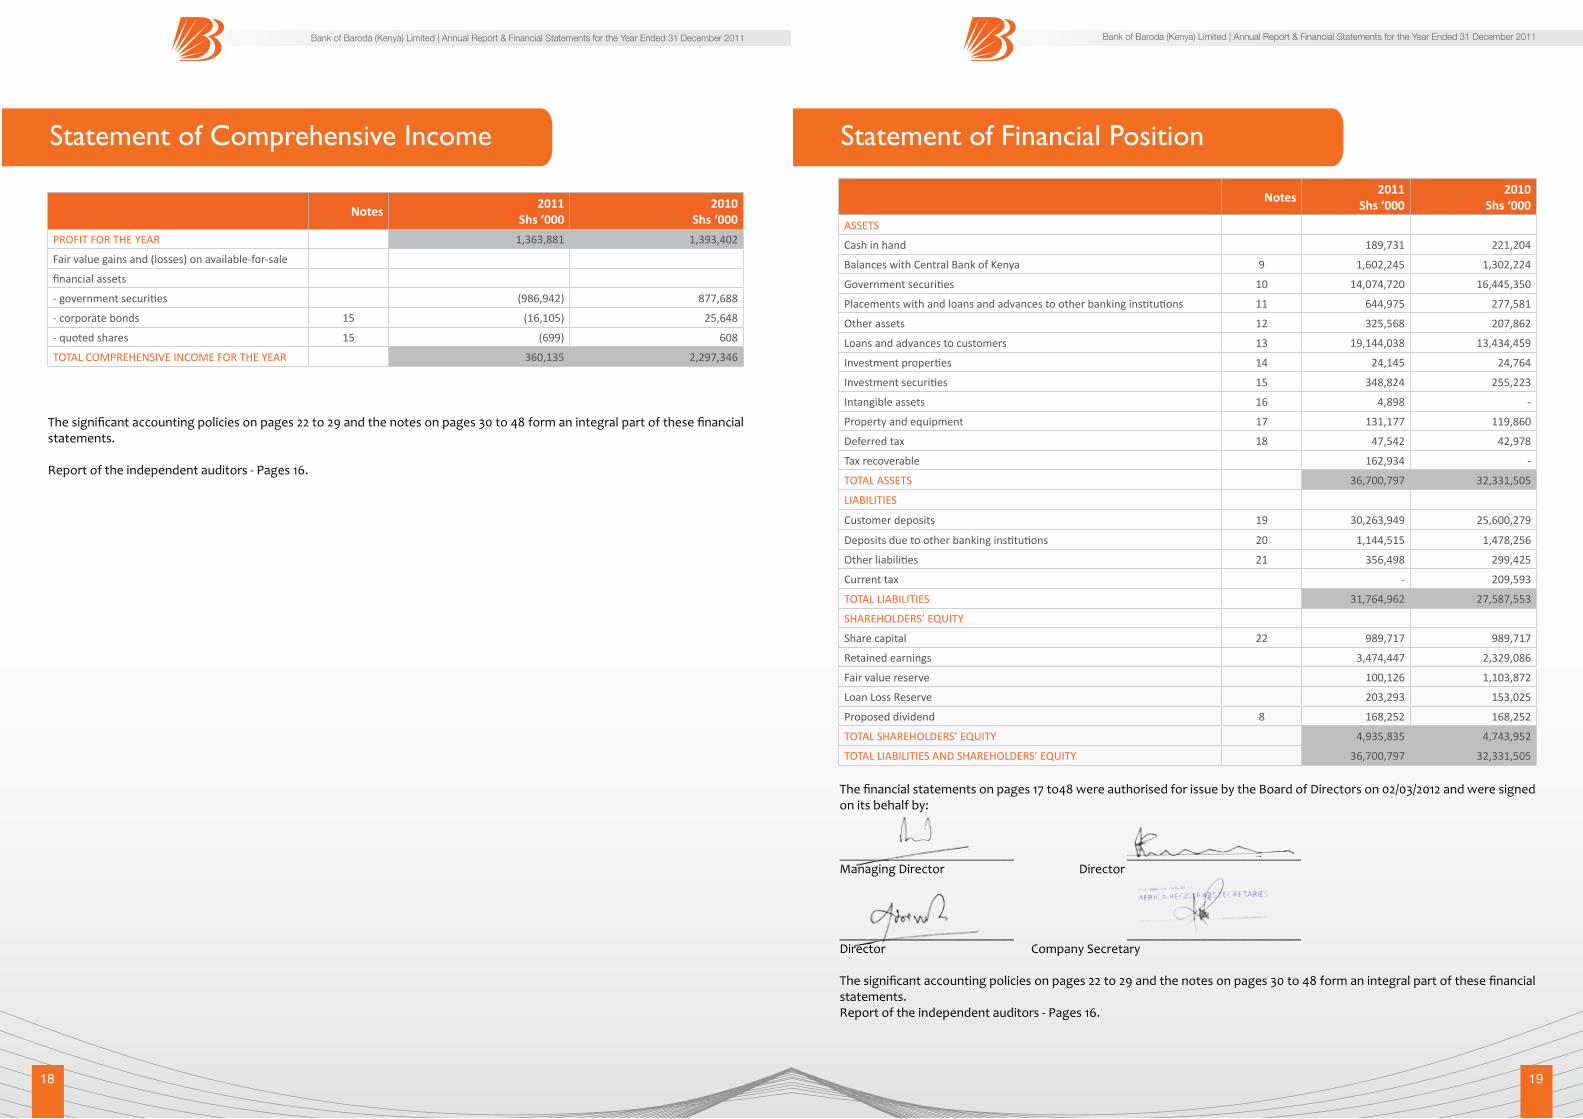
Statement of Comprehensive Income
Notes2011
Shs ‘0002010
Shs ‘000
PROFIT FOR THE YEAR 1,363,881 1,393,402
Fair value gains and (losses) on available-for-sale
financial assets
- government securities (986,942) 877,688
- corporate bonds 15 (16,105) 25,648
- quoted shares 15 (699) 608
TOTAL COMPREHENSIVE INCOME FOR THE YEAR 360,135 2,297,346
The significant accounting policies on pages 22 to 29 and the notes on pages 30 to 48 form an integral part of these financial statements. Report of the independent auditors - Pages 16.
Statement of Financial Position
Notes2011
Shs ‘0002010
Shs ‘000
ASSETS
Cash in hand 189,731 221,204
Balances with Central Bank of Kenya 9 1,602,245 1,302,224
Government securities 10 14,074,720 16,445,350
Placements with and loans and advances to other banking institutions 11 644,975 277,581
Other assets 12 325,568 207,862
Loans and advances to customers 13 19,144,038 13,434,459
Investment properties 14 24,145 24,764
Investment securities 15 348,824 255,223
Intangible assets 16 4,898 -
Property and equipment 17 131,177 119,860
Deferred tax 18 47,542 42,978
Tax recoverable 162,934 -
TOTAL ASSETS 36,700,797 32,331,505
LIABILITIES
Customer deposits 19 30,263,949 25,600,279
Deposits due to other banking institutions 20 1,144,515 1,478,256
Other liabilities 21 356,498 299,425
Current tax - 209,593
TOTAL LIABILITIES 31,764,962 27,587,553
SHAREHOLDERS’ EQUITY
Share capital 22 989,717 989,717
Retained earnings 3,474,447 2,329,086
Fair value reserve 100,126 1,103,872
Loan Loss Reserve 203,293 153,025
Proposed dividend 8 168,252 168,252
TOTAL SHAREHOLDERS’ EQUITY 4,935,835 4,743,952
TOTAL LIABILITIES AND SHAREHOLDERS’ EQUITY 36,700,797 32,331,505
The financial statements on pages 17 to48 were authorised for issue by the Board of Directors on 02/03/2012 and were signed on its behalf by:
__________________________ __________________________Managing Director Director
__________________________ __________________________Director Company Secretary The significant accounting policies on pages 22 to 29 and the notes on pages 30 to 48 form an integral part of these financial statements. Report of the independent auditors - Pages 16.

20 21
Bank of Baroda (Kenya) Limited | Annual Report & Financial Statements for the Year Ended 31 December 2011Bank of Baroda (Kenya) Limited | Annual Report & Financial Statements for the Year Ended 31 December 2011
Statement of Changes in Equity
Available-for-sale fair value reserves
NotesShare
capitalShs’000
RetainedearningsShs’000
Loan lossreserveShs’000
Governmentsecurities
Shs’000
Corporatebonds
Shs’000
Quoted shares
Shs’000
ProposeddividendShs’000
TotalShs’000
YEAR ENDED 31 DECEMBER 2011
At start of year 989,717 2,329,086 153,025 1,083,875 19,351 646 168,252 4,743,952
Transfer to loan loss reserve
- (50,268) 50,268 - - - - -
Total comprehensive income/(loss) for the year
- 1,363,881 - (986,942) (16,105) (699) - 360,135
Dividends:
- Final for 2010 (paid) 8 - - - - - - (168,252) (168,252)
- Final for 2011 (proposed)
8 - (168,252) - - - - 168,252 -
AT END OF YEAR 989,717 3,474,447 203,293 96,933 3,246 (53) 168,252 4,935,835
Available-for-sale fair value reserves
NotesShare
capitalShs’000
RetainedearningsShs’000
Loan lossreserveShs’000
Governmentsecurities
Shs’000
Corporatebonds
Shs’000
Quoted shares
Shs’000
ProposeddividendShs’000
TotalShs’000
YEAR ENDED 31 DECEMBER 2010
At start of year 989,717 1,112,401 95,000 255,747 (6,297) 38 118,766 2,565,372
Transfer to loan loss reserve
- (58,025) 58,025 - - - - -
Realised fair value loss of prior years now transferred from retained earnings
- 49,560 - (49,560) - - - -
Total comprehensive income for the year
- 1,393,402 - 877,688 25,648 608 - 2,297,346
Dividends:
- Final for 2009 (paid) 8 - - - - - - (118,766) (118,766)
- Final for 2010 (proposed)
8 - (168,252) - - - - 168,252 -
AT END OF YEAR 989,717 2,329,086 153,025 1,083,875 19,351 646 168,252 4,743,952
The significant accounting policies on pages 22 to 29 and the notes on pages 30 to 48 form an integral part of these financial statements. Report of the independent auditors - Pages 16.
The significant accounting policies on pages 22 to 29 and the notes on pages 30 to 48 form an integral part of these financial statements. Report of the independent auditors - Pages 16.
Statement of Cash Flows
Notes2011
Shs ‘0002010
Shs’000
CASH FLOWS FROM OPERATING ACTIVITIES
Interest receipts 4,015,414 2,830,901
Interest payments (1,556,991) (1,075,966)
Fees and commission receipts 261,248 218,439
Payments to employees and suppliers (735,402) (578,707)
Tax paid (689,593) (191,505)
CASH FLOWS FROM OPERATING ACTIVITIES BEFORE CHANGES IN OPERATING ASSETS AND LIABILITIES
1,294,676 1,203,162
Changes in operating assets and liabilities:
- cash reserve ratio (426,861) (315,314)
- loans and advances (5,683,348) (4,381,824)
- other assets (117,227) 6,745
- customer deposits 4,580,922 6,772,856
- other liabilities 42,323 (1,119)
NET CASH (USED IN)/FROM OPERATING ACTIVITIES (309,515) 3,284,506
Cash flows from investing activities
Purchase of intangible assets 16 (6,123) -
Purchase of property and equipment 17 (40,643) (30,020)
Purchase of investment securities 15 (227,435) (25,053)
Purchase of government securities (6,897,225) (10,141,375)
Dividends received 805 94
Proceeds from disposal of government securities 7,900,788 5,542,487
Proceeds from maturity of government securities 175,000 -
Proceeds from disposal of investment securities 113,993 26,378
Proceeds from disposal of property and equipment 1,429 889
NET CASH FROM/(USED IN) INVESTING ACTIVITIES 1,020,589 (4,626,600)
Cash flows from financing activities
Dividend paid (168,252) (118,766)
NET CASH (USED IN) FINANCING ACTIVITIES (168,252) (118,766)
Net increase/(decrease) in cash and cash equivalents 542,822 (1,460,860)
CASH AND CASH EQUIVALENTS AT START OF THE YEAR 23 (807,065) 653,795
CASH AND CASH EQUIVALENTS AT END OF THE YEAR 23 (264,243) (807,065)
The significant accounting policies on pages 22 to 29 and the notes on pages 30 to 48 form an integral part of these financial statements. Report of the independent auditors - Pages 16.

22 23
Bank of Baroda (Kenya) Limited | Annual Report & Financial Statements for the Year Ended 31 December 2011Bank of Baroda (Kenya) Limited | Annual Report & Financial Statements for the Year Ended 31 December 2011
Notes
SIGNIFICANT ACCOUNTING POLICIES
1. GENERAL INFORMATION
Bank of Baroda (Kenya) Limited is incorporated in Kenya under the Companies Act as a private limited liability company and is domiciled in Kenya.
2. SUMMARY OF SIGNIFICANT ACCOUNTING POLICIES The principal accounting policies adopted in the preparation of these financial statements are set out below. These policies have beepn consistently applied to all the years presented, unless otherwise stated.
(A) BASIS OF PREPARATION The financial statements are prepared under the historical cost convention, except as indicated otherwise, and are in accordance with International Financial Reporting Standards.
The preparation of financial statements in conformity with IFRS requires the use of certain critical accounting estimates and assumptions. It also requires management to exercise its judgement in the process of applying the Bank’s accounting policies. Changes in assumptions may have a significant impact on the financial statements in the period the assumptions change. Although these estimates and judgements are based on the Directors’ best knowledge of current events and actions, actual results may differ from those estimates. Accounting policy ‘b’ on ‘critical accounting estimates and judgements’ highlights the areas that involve a higher level of judgement, or where the estimates or assumptions used are significant to the financial statements. There are no IFRSs or IFRIC interpretations that are effective for the first time for the financial year beginning on or after 1 January 2011 that would be expected to have a material impact on the bank. New standards, amendments and interpretations issued but not effective for the financial year beginning 1 January 2011 and not adopted in advance of the effective date. • International Financial Reporting Standard (IFRS 13) on ‘Fair Value Measurement’ - The standard aims to improve
consistency and reduce complexity by providing a more precise definition and a single source of measurement and disclosure requirements. Adoption is mandatory from 1 January 2013 although early adoption is permissible.
The Bank has not assessed the potential impact of IFRS 13 on its financial statements. • International Financial Reporting Standard (IFRS 9) on ‘Financial Instruments: Classification and Measurement’ - The
standard was issued in November 2009 and will replace the areas in International Accounting Standard 39 (IAS 39) that relate to classification and measurement of financial assets. Adoption is mandatory from 1 January 2015 although early adoption is permissible.
The Bank is yet to assess the full impact that IFRS 9 shall have on its consolidated financial statements.
(B) CRITICAL ACCOUNTING ESTIMATES AND JUDGEMENTS
The Bank’s financial statements and its financial results are influenced by its accounting policies and the assumptions, estimates and judgements made by management. These assumptions, estimates and judgements are continually evaluated and are based on historical experience and other factors, including expectations of future events that are believed to be reasonable under the prevailing circumstances. Key sources of estimation uncertainty
Management has made the following estimate that has a significant risk of resulting in a material adjustment to the carrying amounts of assets and liabilities within the next financial year: • Impairment of loans and advances: Critical estimates have been made by the management in arriving at the discounted values of securities in order to arrive at the impairment charges for non-performing loans and advances. The values of securities are discounted using both the International Financial Reporting Standards and the Prudential Guidelines issued by the Central Bank of Kenya. The Prudential Guidelines provide a specific basis of discounting securities whilst discounting according to International Accounting Standard 39 (IAS 39) on Financial Instruments: Recognition and Measurement’ is based on historical experience and other relevant factors, discounted to net present values. • SignificantjudgementsmadebymanagementinapplyingtheBank’saccountingpolicies
Management has made the following judgements that are considered to have the most significant effect on the amounts recognised in the financial statements: • Impairment losses on loans and advances: The Bank reviews its loan portfolio to assess the likelihood of impairment at least on a quarterly basis. In determining whether a loan or advance is impaired, the management makes judgement as to whether there is any evidence indicating that there is a measurable decrease in the estimated future cash flows expected from that loan or advance. Management use judgement based on historical experience for such assets with credit risk characteristics and as to whether there are any conditions that would indicate potential impairment. The methodology and assumptions used for estimating both the amount and timing of future cash flows are reviewed regularly to reduce any differences between loss estimates and actual loss experience. • NonfinancialassetsThe Bank reviews its non financial assets to assess the likelihood of impairment on an annual basis. In determining whether such assets are impaired, management make judgements as to whether there are any conditions that indicate potential impairment of such assets. • Impairmentoffinancialassetsclassifiedas‘availableforsale’The Bank determines that available-for-sale financial assets are impaired when there has been a significant or prolonged decline in their fair values below its original cost. This determination of what is significant or prolonged requires significant judgement. In making this judgement, the Bank evaluates among other factors, the volatility in share price and market prices for government securities. In addition, objective evidence of impairment may be deterioration in the financial health of the investee, industry and sector performance, changes in technology, and operational and financing cash flows.
(C) TRANSLATION OF FOREIGN CURRENCIES Transactions in foreign currencies during the year are converted into Kenya Shillings (functional currency), at rates ruling at the transaction dates. Assets and liabilities at the date of this report which are expressed in foreign currencies are translated into Kenya Shillings at rates ruling at that date. The resulting differences from conversion and translation are dealt with in the profit or loss in the year in which they arise.

24 25
Bank of Baroda (Kenya) Limited | Annual Report & Financial Statements for the Year Ended 31 December 2011Bank of Baroda (Kenya) Limited | Annual Report & Financial Statements for the Year Ended 31 December 2011
(D) REVENUE RECOGNITION Revenue is recognised only when it is probable that the economic benefits associated with the transaction will flow to the Bank.
The Bank recognises revenue when the amount of revenue can be reliably measured, it is probable that future economic benefits will flow to the Bank and when the specific criteria have been met for each of the Bank’s activities as described below. The amount of revenue is not considered to be reliably measured until all contingencies relating to the transaction have been resolved. The Bank bases its estimates on historical results, taking into consideration the type of customer, type of transaction and specifics of each arrangement. • Interest income is recognised on an accruals basis in the profit or loss for the year using the effective yield on the asset.
Interest income includes income from loans and advances, income from placements with loans and advances to other banking institutions and income from government securities. When financial assets become impaired, interest income is thereafter recognised at rates used to discount future cash flows for the purposes of measuring the recoverable amount.
• Fees and commissions income are recognised at the time of effecting the transaction. • Foreign exchange trading income is recognised at the time of effecting the transaction. It includes income from spot and
forward deals and translated foreign currency assets and liabilities.• Dividend income is recognised when declared. • Rental income is accounted for in the period in which it is earned.
(E) PROPERTY AND EQUIPMENT All property and equipment is initially recorded at cost and thereafter stated at historical cost less depreciation. Historical cost comprises expenditure initially incurred to bring the asset to its location and condition ready for its intended use. Subsequent costs are included in the asset’s carrying amount or recognised as a separate asset, as appropriate, only when it is probable that future economic benefits associated with the item will flow to the Bank and the cost can be reliably measured. The carrying amount of the replaced part is derecognised. All other repairs and maintenance are charged to the profit or loss during the financial year in which they are incurred. Buildings and leasehold improvements are depreciated on a straight line basis over the remaining period of the lease. Depreciation on all other assets is calculated on a reducing balance basis to write down the cost of each asset to its residual value over its estimated useful life using the following annual rates:
Rate%
Computers and electronic equipment 30.00
Motor vehicles 25.00
Furniture and fittings 12.50
The assets residual values and useful lives are reviewed, and adjusted if appropriate, at the end of each reporting period.
An asset’s carrying amount is written down immediately to its recoverable amount if the asset’s carrying amount is greater than its estimated recoverable amount.
Gains or losses on disposal of property and equipment are determined by comparing the proceeds with the carrying amount and are taken into account in determining operating profit.
(F) INVESTMENT PROPERTIES Investment properties are long-term investments in land and buildings that are not occupied substantially for own use. Investment properties are initially recognised at cost and subsequently stated at historical cost less accumulated depreciation.
Subsequent expenditure on investment properties where such expenditure increases the future economic value in excess of the original assessed standard of performance is added to the carrying amount of the investment property. All other expenditure is recognised as an expense in the year which it is incurred.
Depreciation is calculated on the straight line basis to write down the cost of the property to its residual value over its estimated useful life of 50 years.
The properties residual values and useful lives are reviewed, and adjusted if appropriate, at the end of each reporting period. The properties carrying amounts are written down immediately to their recoverable amount if the carrying amount is greater than their estimated recoverable amount. Gains or losses on disposal of investment property are determined by comparing the proceeds with the carrying amount and are taken into account in determining operating profit.
(G) FINANCIAL INSTRUMENTS - Financial assets Financial assets are initially recognised at fair value plus transaction costs for all financial assets not carried at fair value through profit or loss. The Bank’s financial assets fall into the following categories: • Held-to-maturity: financial assets with fixed or determinable payments and fixed maturity where the management have
the positive intent and ability to hold to maturity. Subsequent to initial recognition, such assets are carried at amortised cost using the effective interest rate method. Changes in the carrying amount are recognised in the profit or loss.
• Available-for-sale: financial assets that are held for an indefinite period of time, which may be sold in response to needs
for liquidity or changes in interest rate. Such assets are classified as non-current assets except where the management intends to dispose the assets within 12 months of the date of this report. Subsequent to initial recognition, they are carried at fair value with gains and losses recognised in other comprehensive income, until the financial asset is derecognised or impaired. At this time, the cumulative gain or loss previously recognised in equity is recognised is transferred to retained earnings. However, interest calculated using the effective interest method and gains and losses on disposal of assets classified as available-for-sale’ are recognised in the profit or loss. Dividends on ‘available-for-sale’ equity instruments are recognised in the profit or loss when the entity’s right to receive payment is established.
• Loans and receivables: financial assets with fixed or determinable payments that are not quoted in an active market other than:
- those that the entity intends to sell immediately or in the short term, which are classified as ‘held for trading’, and those that the entity upon initial recognition designated it as ‘fair value through profit or loss’; - those that the entity upon initial recognition designates as ‘available-for-sale’; or - those for which the holder may not recover substantially all of its initial investment, other than because of credit deterioration. Such assets are classified as current assets where maturities are within 12 months of the date of this report. All assets with maturities greater than 12 months after the date of this report are classified as non-current assets. Subsequent to initial recognition, they are carried at amortised cost using the effective interest method. Changes in the carrying amount are recognised in the profit or loss. Purchases and sales of financial assets are recognised on the trade date i.e. the date on which the Bank commits to purchase or sell the asset. Financial assets are derecognised when the rights to receive cash flows from the assets have expired or have been transferred and the Bank has transferred substantially all risks and rewards of ownership. Gains and losses on disposal of investments whose changes in fair value were initially recognised in the profit or loss are determined by reference to their carrying amount and are taken into account in determining operating profit. On disposal

26 27
Bank of Baroda (Kenya) Limited | Annual Report & Financial Statements for the Year Ended 31 December 2011Bank of Baroda (Kenya) Limited | Annual Report & Financial Statements for the Year Ended 31 December 2011
of investments whose changes in fair value were initially recognised in equity, the gains/losses are recognised in the reserve, where the fair values were initially recognised. Any resultant surplus/deficit after the transfer of the gains/losses are transferred to retained earnings.
The Bank does not have any financial assets classified as either held for trading or fair value through profit or loss. Managementclassifiesfinancialassetsasfollows: Cash in hand, balances with Central Bank of Kenya, placements with and loans and advances from other banking institutions, other assets, tax recoverable and loans and advances to customers are classified as loans and receivables and are carried at amortised cost. The portfolio of government securities has been split by bond into the held-to-maturity and available-for-sale classes of financial assets. The fair values of government securities classified as available for sale are based on the market prices as at the date of the statement of financial position. Government securities classified as held-to-maturity are carried at amortised cost. Investment securities are classified as “Available-For-Sale” (AFS) financial instruments. The fair values of quoted investments and corporate bonds are based on current bid prices at the date of this report. Where fair values cannot be reliably measured (unquoted investments), the Bank carries these investments at cost less provision for impairment.
Where financial assets are carried at fair value in the statement of financial position, management classify the fair values of financial assets based on the qualitative characteristics of the fair valuation as at the financial year end. The three hierarchy levels used by management are: - Level 1: where fair values are based on non-adjusted quoted prices in active markets for identical inancial assets. - Level 2: where fair values are based on adjusted quoted prices and observable prices of similar financial assets. - Level 3: where fair values are not based on observable market data. - Financial liabilities The Bank’s financial liabilities which include customer deposits, deposits due to other banking institutions, current tax and other liabilities fall into the following category: - Financial liabilities measured at amortised cost: These are initially measured at fair value and subsequently measured at amortised cost, using the effective interest rate method.
Any difference between the proceeds (net of transaction costs) and the redemption value is recognised as interest expense in the profit or loss under finance costs. All financial liabilities are classified as current liabilities unless the Bank has an unconditional right to defer settlement of the liability for at least 12 months after the date of this report. Financial liabilities are derecognised when, and only when, the Bank’s obligations are discharged, cancelled or expired. Offsetting financial instruments Financial assets and liabilities are offset and the net amount reported in the statement of financial position when there is a legally enforceable right to offset the recognised amounts and there is an intention to settle on a net basis, or realise the asset and settle the liability simultaneously.
(H) IMPAIRMENT OF FINANCIAL ASSETS - Assets carried at amortised cost The Bank assesses at the date of the report whether there is objective evidence that a financial asset is impaired. A financial asset is impaired and impairment losses are incurred only if there is evidence of impairment as a result of one or more events that occurred after the initial recognition of the asset and that a certain event has an impact on the estimated future cash flows of the financial asset. The criteria that the Bank uses to determine that there is objective evidence of an impairment loss include: • Default in contractual payments of principal or interest; • Cash flow difficulties experienced by the borrower or issuer (for example, declining financial ratios) • Breach of loan covenants or conditions; • Initiation of Bankruptcy proceedings; • Deterioration of the borrower’s or issuer’s competitive position; • Deterioration in the value of collateral; and • The disappearance of an active market for that financial asset because of financial difficulties
- Impairment of loans and advances Loans and advances are recognised when cash is advanced to borrowers. Loans and advances are initially recognised at fair value and are subsequently carried at amortised cost less provision for impairment losses. A specific credit risk provision for loan impairment is established to provide for management’s estimate of credit losses as soon as the recovery of an exposure is identified as doubtful. In arriving at such provisions, present value of future expected cash flows, including amounts recoverable from securities, discounted at effective interest rates of loans are taken into account. A general credit risk provision for loan impairment is also provided for in accordance with the requirements of the Prudential Guidelines issued by the Central Bank of Kenya. This ranges from between 1% to 3% of the gross advances classified as Normal and Watch (per the categorisation required by the Central Bank of Kenya). Where provisions computed in accordance with the Prudential Guidelines exceed those under International Accounting Standard 39 (IAS 39) on Financial Instruments: Recognition and Measurement, the excess is credited to reserves under the loan loss reserve. The Prudential Guidelines and IAS 39 are used by the Bank to determine when a loan becomes impaired. The Bank first assesses whether objective evidence of impairment exists individually for financial assets that are individually significant, and individually or collectively for financial assets that are not individually significant. If the Bank determines that no objective evidence of impairment exists for an individually assessed financial asset, whether significant or not, it includes the asset in a group of financial assets with similar credit risk characteristics and collectively assesses them for impairment. Assets that are individually assessed for impairment and for which an impairment loss is/or continues to be recognised are not included in a collective assessment of impairment. The amount of the loss is measured as the difference between the asset’s carrying amount and the present value of estimated future cash flows (excluding future credit losses that have not been incurred) discounted at the effective interest rate and the discounted value of the collateral. The carrying amount of the asset is reduced and the amount of the loss is recognised in the profit or loss. The calculation of the present value of the estimated future cash flows of a collateralised financial asset reflects the cash flows that may result from foreclosure less costs for obtaining and selling the collateral, whether or not foreclosure is probable. For the purposes of a collective evaluation of impairment, financial assets are Banked on the basis of similar credit risk characteristics (i.e. on the basis of the Bank’s grading process that considers asset type, industry, geographical location, collateral type, past-due status and other relevant factors). Those characteristics are relevant to the estimation of future cash flows of such assets by being indicative of the debtors’ ability to pay all amounts due according to the contractual terms of the assets being evaluated.

28 29
Bank of Baroda (Kenya) Limited | Annual Report & Financial Statements for the Year Ended 31 December 2011Bank of Baroda (Kenya) Limited | Annual Report & Financial Statements for the Year Ended 31 December 2011
Historical loss experience is adjusted on the basis of current observable data to reflect the effects of current conditions that did not affect the period on which the historical loss experience is based and to remove the effects of conditions in the historical period that do not currently exist. Estimates of changes in future cash flows for groups of assets should reflect and be directionally consistent with changes in related observable data from period to period (for example, changes in unemployment rates, property prices, payment status, or other factors indicative of changes in the probability of losses in the Bank and their magnitude). The methodology and assumptions used for estimating future cash flows are reviewed regularly by the Bank to reduce any differences between loss estimates and actual loss experience. When a loan is uncollectible, it is written off against the related provision for loan impairment. Such loans are written off after all the necessary procedures have been completed and the amount of the loss has been determined. If in a subsequent period, the amount of the impairment loss decreases and the decrease can be related objectively to an event occurring after the impairment was recognised (such as an improvement in the debtor’s credit rating), the previously recognised impairment loss is reversed in the profit or loss. - Renegotiated loans
Loans that are either subject to collective impairment assessment or individually significant and whose terms have been renegotiated are considered to be past due. They will continue to be treated as past due unless all past due interest is paid in cash at the time of renegotiation and a sustained record of performance has been maintained. -Assetsclassifiedasavailableforsale
The Bank assesses at each reporting date whether there is objective evidence that a financial asset or a group of financial assets is impaired. In the case of equity investments classified as ‘available for sale’, a significant or prolonged decline in the fair value of the security below its cost is objective evidence of impairment resulting in the recognition of an impairment loss. If any such evidence exists, the cumulative loss (the difference between the acquisition cost and the current fair value, less any impairment losses previously recognised in profit or loss) is eliminated from equity and recognised in the profit or loss.
(I) IMPAIRMENT OF NON-FINANCIAL ASSETS
An impairment loss is recognised for the amount by which the asset’s carrying amount exceeds its recoverable amount. The recoverable amount is the higher of an asset’s fair value less costs to sell and value in use. For the purposes of assessing impairment, assets are grouped at the lowest levels for which there are separately identifiable cash flows (cash-generating units). Non-financial assets that suffered an impairment are reviewed for possible reversal of the impairment at the end of each reporting period.
(J) RETIREMENT BENEFIT OBLIGATIONS The Bank operates a defined contribution pension scheme for its employees, the assets of which are held in a separate trustee administered guaranteed scheme managed by an insurance company. The pension plan is funded by contributions from the employees and the Bank. The Bank’s contributions are charged to the profit or loss in the year to which they relate. The Bank has no further payment obligations once the contributions have been paid. The Bank and its employees contribute to the National Social Security Fund (NSSF), a statutory defined contribution scheme registered under the NSSF Act. The Bank’s contributions to the defined contribution scheme are charged to the profit or loss in the year to which they relate.
(K) EMPLOYEE ENTITLEMENTS Employee entitlements to gratuity and long service awards are recognised when they accrue to employees. A provision is made for the estimated liability for such entitlements as a result of services rendered by employees up to the date of the reporting period.
The estimated monetary liability for employees’ accrued annual leave entitlement as at the date of this report is recognised as an expense accrual.
(L) INTANGIBLE ASSET - COMPUTER SOFTWARE
Computer software programmes are capitalised on the basis of the costs incurred to acquire and bring to use the specific software. These costs are amortised on a straight line basis over their useful lives which are estimated to be 5 years. Costs associated with developing or maintaining computer software programmes are recognised as an expense as incurred. Costs that are directly associated with the acquisition of identifiable and unique software products controlled by the company, and that will probably generate economic benefits exceeding costs beyond one year, are recognised as intangible assets.
(M) LEASES Operating leases as a lessee: Leases of assets where a significant proportion of the risks and rewards of ownership are retained by the lessor are classified as operating leases. Payments made under operating leases are charged to the profit or loss on a straight line basis over the lease period. (N) TAXATION The tax expense for the period comprises current and deferred tax. Tax is recognised in the profit or loss for the year. Current tax Current tax is provided on the basis of the results for the year, adjusted in accordance with tax legislation. Deferred tax Deferred tax is provided using the liability method for all temporary differences arising between the tax bases of assets and liabilities and their carrying values for financial reporting purposes. Currently enacted tax rates at the date of the statement of financial position are used to determined deferred tax. Deferred tax assets are recognised only to the extent that it is probable that future taxable profits will be available against which temporary differences can be utilised.
(O) DIVIDENDS Proposed dividends are disclosed as a separate component of equity until declared.
Dividends are recognised as a liabilities in the period in which they are approved by the Bank’s shareholders. (P) CASH AND CASH EQUIVALENTS For the purposes of the cash flow statement, cash and cash equivalents comprise cash, balances due to and from other banking institutions, balances with Central Bank of Kenya (excluding cash reserve ratio) and government securities maturing within 91 days from the date of the statement of financial position. (Q) CONTINGENT LIABILITIES Letters of credit, acceptances, guarantees and performance bonds are accounted for as off balance sheet transactions and disclosed as contingent liabilities. Estimates of the outcome and of the financial effect of contingent liabilities is made by the management based on the information available up to the date the financial statements are approved for issue by the Directors. Any expected loss is charged to the income statement. (R) SHARE CAPITAL Ordinary shares are classified as equity. (S) COMPARATIVES Where necessary, comparative figures have been adjusted to conform with changes in presentation in the current year.

30 31
Bank of Baroda (Kenya) Limited | Annual Report & Financial Statements for the Year Ended 31 December 2011Bank of Baroda (Kenya) Limited | Annual Report & Financial Statements for the Year Ended 31 December 2011
2011Shs ‘000
2010Shs ‘000
1. INTEREST INCOME
Loans and advances to customers 2,421,609 1,641,979
Government securities 1,422,947 1,268,816
Corporate bonds 34,765 24,038
Deposits and balances due from banking institutions 32,007 8,700
Other income 14,541 2,713
3,925,869 2,946,246
2. INTEREST EXPENSETime deposits 1,517,531 1,184,112
Customer deposits 75,354 60,229
Deposits and balances due to banking institutions 46,854 24,810
1,639,739 1,269,151
3. OTHER INCOME(Loss)/profit on disposal of government securities (104,141) 538,604
(Loss)/profit on disposal of property and equipment (785) 629
Profit on disposal of quoted shares - 2,006
Rental income 49,831 43
Dividend income 805 94
Miscellaneous income 196 1,794
Recoveries of advances previously provided for 12,234 58,372
(41,860) 601,542
4. IMPAIRMENT LOSSES ON LOANS AND ADVANCESLoans and advances to customers:
- Additional Provisions 199,349 55,714
- Other write offs - 3
Increase in provision for impairment charged to profit or loss 199,349 55,717
5(a). OTHER OPERATING EXPENSESStaff costs (Note 5 (b)) 284,284 271,339
Directors’ emoluments:
- fees 615 368
- other 10,219 7,174
Depreciation of investment properties (Note 14) 619 619
Amortisation of intangible assets (Note 16) 1,225 -
Depreciation on property and equipment (Note 17) 27,112 23,988
Auditors’ remuneration:
- current year 3,016 2,191
- under provision for prior year 130 -
Contribution to Deposit Protection Fund 33,967 26,434
Operating lease rentals 57,154 52,978
Other operating expenses
- administration 122,986 134,141
- establishment 38,432 34,345
579,759 553,577
Notes to the Financial Statements2011
Shs ‘0002010
Shs ‘000
5.(b) STAFF COSTS
The following items are included under staff costs:
Staff leave and gratuity accrual 14,750 19,805
Pension costs:
- defined contribution scheme 13,471 13,133
- National Social Security Fund (NSSF) 352 345
6. TAXCurrent tax 317,066 433,593
Deferred tax (credit)/charge (Note 17) (4,564) 578
312,502 434,171
The tax on the Bank’s profit before tax differs from the theoretical amount that would arise using the basic tax rate as follows:
Profit before tax 1,676,383 1,827,573
Tax calculated at a rate of 30% (2010: 30%) 502,915 548,272
- expenses not deductible for tax purposes 4,834 4,210
- income not subject to tax (195,247) (118,311)
Tax charge 312,502 434,171
7. EARNINGS PER SHAREBasic earnings per share is calculated on the profit attributable to the shareholders and on the weighted average number of shares outstanding during the year adjusted for the effect of the bonus share issued if any.
There were no potentially dilutive shares outstanding as at 31 December 2011 and 2010.
8. DIVIDEND Proposed dividends are accounted for as a separate component of equity until they have been ratified at an annual general meeting. At the forthcoming annual general meeting a final dividend in respect of the year ended 31 December 2011 of Shs. 3.40 per share (2010: Shs. 3.40) amounting to Shs. 168.25 million (2010: Shs. 168.25 million) is to be proposed. Where applicable, payment of dividends is subject to deduction of withholding tax at a rate 5% for residents and 10% for non-residents.
The cash reserve ratio balance is non interest bearing and is based on the value of customer deposits as adjusted in accordance with Central Bank of Kenya requirements. As at 31 December 2011 the cash reserve ratio requirement was 5.25% (2010: 4.5%) of all customer deposits.
2011Shs ‘000
2010Shs ‘000
Net profit for the year attributable to shareholders(Shs. ‘000)
1,363,881 1,393,402
Adjusted weighted average number of ordinary shares in issue (‘ 000)
49,486 49,486
Earnings per share - basic and diluted (Shs.) 27.56 28.16
2011Shs ‘000
2010Shs ‘000
9. BALANCES WITH CENTRAL BANK OF KENYA
Balances with Central Bank of Kenya
- cash reserve ratio 1,556,679 1,129,818
- other (Note 23) 45,566 172,406
1,602,245 1,302,224

32 33
Bank of Baroda (Kenya) Limited | Annual Report & Financial Statements for the Year Ended 31 December 2011Bank of Baroda (Kenya) Limited | Annual Report & Financial Statements for the Year Ended 31 December 2011
2011Shs ‘000
2010Shs ‘000
10. GOVERNMENT SECURITIES
Treasury Bills - 49,177
Treasury bonds - ‘available-for-sale (AFS)’ 5,307,081 9,625,236
Treasury bonds - ‘Held to Maturity (HTM)’ 8,767,639 6,770,937
14,074,720 16,445,350
Comprising
Maturing after 91 days but within one year from the reporting date - 177,812
Maturing within one to three years from reporting date 626,455 2,840,494
Maturing after three years from reporting date 13,448,265 13,427,044
14,074,720 16,445,350
2011Shs ‘000
2010Shs ‘000
11.PLACEMENT WITH AND LOANS AND ADVANCES TO OTHER BANKING INSTITUTIONS
Balances with banking institutions in Kenya 582,602 257,879
Balances with banking institutions abroad 1,466 19,702
Balances with parent Bank 60,907 -
644,975 277,581
12. OTHER ASSETS
Items in transit 179,474 157,866
Other receivables and prepayments 146,094 49,996
325,568 207,862
13. LOANS AND ADVANCES TO CUSTOMERS
a) Loans and advances to customers
Loans and overdrafts 19,615,853 13,683,655
Bills discounted and foreign bills purchases 122,389 146,386
Gross loans and advances to customers (Note 13 (c)) 19,738,242 13,830,041
Suspended interest (64,606) (53,606)
Provision for impaired loans and advances (Note 13 (b)) (529,598) (341,976)
Loans and advances to customers net of provision for impairment (Note 13 (d)) 19,144,038 13,434,459
b) Provision for impaired loans and advances - Specific provision
At start of year 341,976 376,206
New provisions
- Additional provisions 199,349 55,714
- Write Offs 507 (31,572)
- Recoveries / Excess Provisions reversed (12,234) (58,372)
Net decrease/(increase) in provision for impairment 187,622 (34,230)
At end of year 529,598 341,976
The fair values of the government securities classified as ‘Available-for-sale’ financial assets are categorised under Level 1 based on the information set out in accounting policy (g).
Loans and advances have been written down to their recoverable amount. Non performing loans and advances on which provisions for impairment have been recognised amount to Shs. 648.852 million (2010: Shs. 512.940 million). These are included in the statement of financial position net of provisions at Shs. 54.648 million (2010: Shs.117.358 million). In the opinion of the Directors, sufficient securities are held to cover the exposure on such loans and advances. Interest income amounting to Shs. 64.606 million (2010: Shs. 53.606 million) on impaired loans and advances has not been recognised as the management feels no economic benefit of such interest will flow to the Bank. From past experience, the management is of the opinion that 1% provision for normal accounts and 3% provision for watch accounts is adequate to cover any accounts which might become delinquent in the future.
13. LOANS AND ADVANCES TO CUSTOMERS c) Concentration Economic sector risk concentrations within the loans and advances portfolio are as follows:
2011 Shs ‘000
2011 %
2010 Shs ‘000
2010 %
Agriculture 655,611 3.32% 448,486 3.24%
Manufacturing 6,018,031 30.49% 3,708,725 26.82%
Building & Construction 1,354,484 6.86% 725,234 5.24%
Mining & Quarrying 153,040 0.78% 111,841 0.81%
Energy & Water 98,723 0.50% 99,124 0.72%
Trade 5,015,060 25.41% 3,619,713 26.17%
Tourism, Restaurant & Hotels 1,407,446 7.13% 972,775 7.03%
Transport & Communication 1,072,936 5.44% 993,644 7.18%
Real Estate 3,338,007 16.91% 2,472,173 17.88%
Financial Services 65,379 0.33% 21,281 0.15%
Social, Community & Personal Households 559,525 2.92% 657,045 4.85%
19,738,242 100% 13,830,041 100%
2011Shs ‘000
2010Shs ‘000
(d) Loans and advances neither past due nor impaired, past due but not impaired and individually impaired
Neither past due nor impaired 18,471,160 12,340,862
Past due but not impaired 618,230 976,239
Individually impaired 648,852 512,940
Gross loans and advances to customers 19,738,242 13,830,041
Less: Provision for impaired loans and advances and suspended interest (594,204) (395,582)
Net loans and advances to customers (Note 13(a)) 19,144,038 13,434,459
2011Shs ‘000
2010Shs ‘000
Watch 618,230 976,239
Loans and advances that are aged past 90 days are considered past due. Loans and advances that are aged past 180 days are considered impaired. The credit quality of the portfolio of loans and advances that were past due but not impaired can be assessed by reference to the internal rating system adopted by the Bank. The loans and advances past due but not impaired can be analysed as follows:

34 35
Bank of Baroda (Kenya) Limited | Annual Report & Financial Statements for the Year Ended 31 December 2011Bank of Baroda (Kenya) Limited | Annual Report & Financial Statements for the Year Ended 31 December 2011
2011Shs ‘000
2010Shs ‘000
14. INVESTMENT PROPERTIES
COSTAt start and end of year
30,950 30,950
DEPRECIATION
At start of year 6,186 5,567
Charge for the year 619 619
At end of year 6,805 6,186
Net book value 24,145 24,764
2011Shs ‘000
2010Shs ‘000
15. QUOTED EQUITY INVESTMENTS:
At start of year 2,931 1,642
Additions - 25,053
Disposals - (24,372)
Fair value (loss)/gain (699) 608
At end of the year 2,232 2,931
UNQUOTED EQUITY INVESTMENTS:
At start and end of year 19,391 19,391
CORPORATE BONDS
At start of year 232,901 207,143
Additions 227,435 -
Disposals (113,993) -
Interest income for the year 34,765 24,038
Interest income received (37,802) (23,928)
Fair value (loss)/gain (16,105) 25,648
At end of the year 327,201 232,901
348,824 255,223
The fair values of the quoted equity investments and corporate bonds are categorised under Level 1 based on the information set out in accounting policy (h). The fair values of the unquoted equity investments are categorised under Level 3 based on the information set out in accounting policy (h).
The loans and advances past due but not impaired are aged between 30 to 90 days. The fair value of the collateral for loans and advances past due but not impaired is considered adequate.
Loans and advances individually impaired The fair value of the collateral for loans and advances individually impaired is Shs. 240.790 Million.
Loans and advances renegotiated Restructuring activities include extended payment arrangements, approved external management plans, modification and deferral of payments. Following restructuring, a previously overdue customer account is reset to a substandard status and managed together with other similar accounts. Restructuring policies and practices are based on indicators or criteria which, in the judgment of the credit committee indicate that payment will most likely continue. These policies are kept under continuous review.
Repossessed collateral As at 31 December 2011 the Bank did not repossess any collateral held as security.
2011Shs ‘000
2010Shs ‘000
16. INTANGIBLE ASSETS - SOFTWARE
COST
At start of year - -
Additions 6,123 -
At end of year 6,123 -
AMORTISATION
At start of year - -
Charge for the year 1,225 -
At end of year 1,225 -
Net book value 4,898 -
Year ended 31 December 2011Buildings
Shs’000
LeaseholdImprovements
Shs’000
Computersand electronic
equipmentShs’000
MotorvehiclesShs’000
Furniture and
fittingsShs’000
TotalShs’000
17. PROPERTY AND EQUIPMENT
COST
At start of year 11,123 61,083 61,058 20,580 114,238 268,082
Additions - 5,777 10,666 1,200 23,000 40,643
Disposals - - (926) (690) (3,584) (5,200)
At end of year 11,123 66,860 70,798 21,090 133,654 303,525
DEPRECIATION
At start of year 2,230 32,958 50,323 11,290 51,421 148,222
Charge for the year 222 7,553 6,388 2,481 10,468 27,112
Disposals - - (685) (472) (1,829) (2,986)
At end of year 2,452 40,511 56,026 13,299 60,060 172,348
NET BOOK VALUE 8,671 26,349 14,772 7,791 73,594 131,177
In the opinion of the Directors, there is no impairment in the value of property and equipment.All additions to property and equipment during the year were made on a cash basis.

36 37
Bank of Baroda (Kenya) Limited | Annual Report & Financial Statements for the Year Ended 31 December 2011Bank of Baroda (Kenya) Limited | Annual Report & Financial Statements for the Year Ended 31 December 2011
Year ended 31 December 2010Buildings
Shs’000
LeaseholdImprovements
Shs’000
Computersand electronic
equipmentShs’000
MotorvehiclesShs’000
Furniture and
fittingsShs’000
TotalShs’000
COST
At start of year 11,123 60,970 60,945 18,863 92,081 243,982
Additions - 113 1,719 5,200 22,988 30,020
Write off - - (829) - (706) (1,535)
Disposals - - (777) (3,483) (125) (4,385)
At end of year 11,123 61,083 61,058 20,580 114,238 268,082
DEPRECIATION
At start of year 2,000 26,126 47,075 11,373 42,961 129,535
Charge for the year 230 6,832 4,682 3,250 8,994 23,988
Write off - - (749) - (427) (1,176)
On Disposals - - (685) (3,333) (107) (4,125)
At end of year 2,230 32,958 50,323 11,290 51,421 148,222
NET BOOK VALUE 8,893 28,125 10,735 9,290 62,817 119,860
Year ended 31 December 20112011
Shs’0002010
Shs’000
As start of year (42,978) (43,556)
Profit or loss (credit)/charge (Note 6) (4,564) 578
At end of year (47,542) (42,978)
18. DEFERRED TAX Deferred tax is calculated on all temporary timing differences under the liability method using a principal tax rate of 30% (2010: 30%). The movement on the deferred tax account is as follows:
Deferred tax assets and deferred tax charge/(credit) in the profit or loss are attributable to the following:
At startof year
Shs ‘000
Charge/(credit) to
profit or lossShs ‘000
At endof year
Shs ‘000
Property and equipment (1,133) (139) (1,272)
Provision for staff accruals (39,975) (4,425) (44,400)
General provision (1,870) - (1,870)
(42,978) (4,564) (47,542)
2011Shs’000
2010Shs’000
20. CUSTOMER DEPOSITS
Parent Bank 457,870 654,820
Foreign Banks 686,645 810,959
Other Banks - 12,477
1,144,515 1,478,256
2011Shs’000
2010Shs’000
21. OTHER LIABILITIESStaff leave and gratuity accrual 148,000 133,250
Bills payable 38,200 16,010
Other accounts payable 170,298 150,165
356,498 299,425
No. of ordinary shares Issued and paid up capital
2011‘000
2010‘000
2011Shs’000
2010Shs’000
22. SHARE CAPITAL
At start and end of year 49,486 49,486 989,717 989,717
Other liabilities are expected to be settled within no more than 12 months after the date of the statement of financial position.
The authorised share capital of the company is Shs. 2 billion (2010: Shs. 2 billion) representing 100 million (2010: 100 million) ordinary shares of Shs. 20 each.
Concentration:The economic sector concentrations within the customer deposits portfolio were as follows:
2011Shs’000
2011%
2010Shs’000
2010%
Non profit institutions and individuals 23,357,734 77.18% 19,486,758 76.12%
Private companies 6,250,453 20.65% 6,061,859 23.68%
Insurance companies 655,762 2.17% 51,662 0.20%
30,263,949 100% 25,600,279 100%
2011Shs’000
2010Shs’000
19. CUSTOMER DEPOSITS
Current and demand accounts 7,410,958 6,877,859
Term deposits 22,852,991 18,722,420
30,263,949 25,600,279
ANALYSIS OF CUSTOMER DEPOSITS BY MATURITY:
Payable within 90 days 20,385,923 12,582,468
Payable after 90 days and within one year 7,242,829 7,691,992
Payable after one year 2,635,197 5,325,819
30,263,949 25,600,279
Included in customer accounts were deposits of Shs. 1,026.160 Million (2010: Shs. 474.643 Million) held as collateral for loans and advances. The fair value of those deposits approximates the carrying amount.

38 39
Bank of Baroda (Kenya) Limited | Annual Report & Financial Statements for the Year Ended 31 December 2011Bank of Baroda (Kenya) Limited | Annual Report & Financial Statements for the Year Ended 31 December 2011
2011Shs’000
2010Shs’000
Changesduring the year
Shs’000
23. CASH AND CASH EQUIVALENTS
For the purposes of the statement of cash flows, cash and cash equivalents comprise the following:
Cash in hand 189,731 221,204 (31,473)
Balances with Central Bank of Kenya (Note 9) 45,566 172,406 (126,840)
Placements with and loans and advances from other banking institutions (Note 11)
644,975 277,581 367,394
Deposits due to other banking institutions (Note 20) (1,144,515) (1,478,256) 333,741
(264,243) (807,065) 542,822
24. OFF BALANCE SHEET FINANCIAL INSTRUMENTS, CONTINGENT LIABILITIES AND COMMITMENTS In common with banking business, the Bank conducts business involving acceptances, guarantees, performance bonds and letters of guarantees. The majority of these facilities are offset by corresponding obligations from third parties.
CONTINGENT LIABILITIES2011
Shs’0002010
Shs’000
Forward contracts 460,229 381,137
Letters of credit 1,978,891 1,022,291
Letters of guarantees 3,464,304 2,026,696
Bills sent for collection 827,612 645,341
6,731,036 4,075,465
An acceptance is an undertaking by a Bank to pay a bill of exchange on a specified due date. The Bank expects most acceptances to be presented and reimbursement by the customer is normally immediate. Letters of credit commit the Bank to make payments to third parties on productionof credit compliant documents which are subsequently reimbursed by customers. Guarantees are generally written by a Bank to support the performance of a customer to third parties. The Bank will only be required to meet these obligations in the event of the customers default. Based on the estimate of the financial effect of the contingencies and the corresponding obligations from third parties, no loss is anticipated.
COMMITMENTS2011
Shs2010
Shs
Undrawn formal stand-by facilities and credit lines 1,671,705 2,348,298
Commitments to lend are agreements to lend to customers in future subject to certain conditions. Such commitments are normally made for a fixed period. The Bank may withdraw from its contractual obligation for the undrawn portion of agreed facilities by giving reasonable notice to the customer.
CAPITAL COMMITMENTSThere were no capital expenditure contracted as at the reporting date.
OPERATING LEASE COMMITMENTS2011
Shs2010
Shs
The future minimum lease payments under non-cancellable operating leases are as follows:
- not later than 1 year 61,839 58,753
- later than 1 year and not later than 5 years 123,074 164,134
- later than 5 years 1,085 4,284
185,998 227,171
The Directors are of the view that future net revenues, funding and cash flows will be sufficient to cover these commitments.
25. FINANCIAL RISK MANAGEMENT The Bank’s activities exposes it to a variety of financial risks and those activities involve analysis, evaluation, acceptance and management of some degree of risk or combination of risks. Taking risk is core to the financial business, and the operational risks are an inevitable consequence of being in business. The Bank’s aim is therefore to achieve an appropriate balance between risk and return and minimise potential adverse effects on the Bank’s financial performance. The Bank’s Risk Management Policies are designed to identify and analyse these risks, to set risk limits and controls, and to monitor the risks and adherence to limits by means of reliable and up-to-date management information systems. The Bank regularly reviews its risk management policies and systems to reflect changes in markets, products and emerging best practice.
Risk Management function is carried out by the Bank’s Risk Management Department under policies approved by the Board of Directors. The Bank’s Risk Management Department identifies, measures, monitors and controls financial risks in close coordination with various other departmental heads. The Bank has Board approved policies covering specific areas, such as credit risk, market risk, liquidity risk and operational risk The most important types of risk are credit risk, liquidity risk, market risk and operational risk. Market risk includes currency risk, interest rate risk and price risk.
(a) Credit risk The Bank takes on exposure to credit risk, which is the risk that a customer will cause a financial loss for the Bank by failing to fulfil a contractual obligation. Credit risk is the most important risk for the Bank’s business. Management therefore carefully manages its exposure to credit risk. Credit risk mainly arises from customer loans and advances, credit cards, investing activities and loan commitments (off balance sheet financial instruments). The credit risk management and control are centralised in credit and treasury departments of the Bank.
Measurement of credit risk
• Loans and advances In measuring credit risk of loans and advances to customers, the Bank reflects various components. These include: - the probability of default by the borrower/client on their contractual obligations; - current exposures on the borrower/client and the likely future development, from which the Bank derives the exposure at default; and - the likely recovery ratio on the defaulted obligations. These credit risk measurements, which reflect expected loss, are embedded in the Bank’s daily operational management. The operational measurements can be contrasted with impairment allowances required under IAS 39 and the banking Act which are based on losses that have been incurred at the date of the statement of financial position rather than expected losses. The Bank assesses the probability of default of individual borrower/client using internal rating internally methods tailored to the various categories of the borrower/client. These have been developed and combine statistical analysis with the credit department’s judgment and are validated, where appropriate, by comparison with externally available data. Management assesses the credit quality of the customer, taking into account their financial position, past experience and other factors. Individual limits are set based on internal or external information in accordance with limits set by the management. The utilisation of credit limits is regularly monitored. Corrective action is taken where necessary.
• Investments For investments, external ratings in addition to the requirements of the banking Act are used by the Bank for managing the credit risk exposures. The investments in those securities are viewed as a way to gain a better credit quality and maintain a readily available source to meet the funding requirement at the same time.
- Risk limit control and mitigation policies The Bank measures,monitors and controls concentrations of credit risk wherever they are identified. The Bank structures the levels of credit risk it undertakes by placing limits on the amount of risk accepted in relation to one borrower, or group’s of borrowers, and to industry segments. Such risks are monitored on a continous basis and subject to an annual or more frequent review, when considered necessary. Limits on the level of credit risk by product and industry/sector are approved as and when required by the Risk Management Committee. Exposure to credit risk is also managed through regular analysis of the ability of borrowers and potential borrowers to meet interest and capital repayment obligations and by changing these lending limits where appropriate. Some other specific control and mitigation measures are outlined below:

40 41
Bank of Baroda (Kenya) Limited | Annual Report & Financial Statements for the Year Ended 31 December 2011Bank of Baroda (Kenya) Limited | Annual Report & Financial Statements for the Year Ended 31 December 2011
• Collateral The Bank employs a range of policies and practices to mitigate credit risk. The most common one is to obtain collateral for loans and advances to customers. The types of collateral obtained include: • Mortgages over properties; • Charges over business assets such as land and buildings, inventory and receivables;• Charges over financial instruments such as investments.• Deposits placed under lien • Credit-related commitments The primary purpose of these instruments is to ensure that funds are available to a customer as required. Guarantees and letters of credit carry the same credit risk as loans. Letters of credit (which are written undertakings by the Bank on behalf of a customer authorising a third party to draw drafts on the Bank up to a stipulated amount under specific terms and conditions) are collateralised by the underlying shipments of goods to which they relate and therefore carry less risk than a direct advance or loan. Commitments to extend credit represent unused portions of authorisations to extend credit in the form of loans, guarantees or letters of credit. With respect to credit risk on commitments to extend credit, the Bank is potentially exposed to loss in an amount equal to the total unused commitments. However, the likely amount of loss is less than the total unused commitments, as most commitments to extend credit are contingent upon customers maintaining specific credit standards. The Bank monitors the term to maturity of credit commitments because longer-term commitments generally have a greater degree of credit risk than shorter-term commitments.
• Impairment and provisioning policies
The Bank’s internal and external systems focus more on credit-quality mapping from the inception of the lending of the loan or advance. In contrast, impairment provisions are recognised for financial reporting purposes only for losses that have been incurred at the date of the statement of financial position based on objective evidence of impairment. The impairment provision shown in the statement of finacial position at the year-end is derived after taking various factors into consideration as described in accounting policy (k). The Bank’s management uses basis under IAS 39 and the Prudential Guidelines to determine the amount of impairment.
• Exposure to credit risk
The management is confident in its ability to continue to control and sustain minimal exposure of credit risk to the Bank resulting from both its loan and advances portfolio and other financial assets based on the following: • The maximum exposure to credit risk arises from loans and advances to customers which form 52.39% (2010: 41.74%) of total financial
assets; 38.52% (2010: 51.09%) represents investments in government securities. • 96.71% (2010: 96.29%) of the loans and advances portfolio is categorised in the top two grades (Normal and Watch). • 3.13% (2010: 7.06%) of the loans and advances portfolio are considered to be past due but not impaired (note 11).• Most of its loans and advances to customers are performing as per the covenants and the non-performing ones have been provided for. The
loans and advances are also secured. • Cash in hand, balances with Central Bank of Kenya and placements with other banking institutions are held with sound financial institutions.
Government securities are considered stable investments as the risk is considered negligible.• Management considers the historical information available to assess the credit risk on investment securities.
Exposure to this risk has been quantified in each financial asset note in the financial statements along with any concentration of risk.
(b) Market risk Market risk is the risk that changes in the market prices, which includes currency exchange rates, interest rates and bid prices, will affect the fair value or future cash flows of financial instruments. Market risk arises from open positions in interest rates and foreign currencies, both of which are exposed to general and specific market movements and changes in the level of volatility. The objectives of market risk management is to manage and control market risk exposures within acceptable limits, while optimising on the return on risk. Overall management of market risk rests with the Assets and Liability Committee (ALCO). The treasury department is responsible for the development of detailed risk management policies, subject to review and approval by ALCO, and for the day to day implementation of these policies. Market risks arise mainly from trading and non-trading activities.
Trading portfolios include those positions arising from market-making transactions where the Bank acts as a principal with clients or with the market. Non-trading portfolios primarily arise from the interest rate management of the entity’s retail and commercial banking assets and liabilities. Non-trading portfolios also consist of foreign exchange and equity risks arising from the Bank’s available-for-sale investments. The major measurement techniques used to measure and control market risk are outlined below:
• ALCO review ALCO meets on a monthly basis to review the following: • A summary of the Bank’s aggregate exposure on market risk• A summary of the Bank’s maturity/repricing gaps • A report indicating that the Bank is in compliance with the Board’s set exposure limits• A comparison of past forecast or risk estimates with actual results to identify any shortcomings
• Review by the treasury department The Risk Management Department monitors foreign exchange risk in close co-ordination with the Finance Department. Regular reports are prepared by the Finance Department of the Bank. Some of these reports include: • Net overnight positions by currency • Maturity distribution by currency of the assets and liabilities for both on and off balance sheet items • Outstanding contracts (if any) by settlement date and currency• Total values of contracts, spots and futures • Aggregate dealing limits • Exceptional reports for example limits or line excesses
(c) Operational risk Operational risk is the risk of direct or indirect loss arising from a wide variety of causes associated with the Bank’s processes, personnel, technology and infrastructure and from external factors other than credit, market and liquidity risks such as those arising out of legal and regulatory requirements and generally accepted standards of corporate behaviour. Operational risk arises from the Bank’s operations and is faced by all other business entities. The Bank endeavours to manage the operational risk by creating a balance between avoidance of cost or financial losses and damage to the Bank’s reputation within overall cost effectiveness and to avoid control procedures that restrict creativity and initiative. The key responsibility for development policies and programs to implement the Bank’s operational risk management is with the senior Management of the Bank. The above is achieved by development of overall standards for the Bank to manage the risk in the following areas: • Segregation of duties including independent authorisation of transactions• Monitoring and reconciliation of transactions • Compliance to regulatory and legal requirement • Documentation of control and procedure • Assessment of the operational risk on a periodic basis to address the deficiencies observed, if any• Reporting of operational losses and initiation of remedial action • Development of contingency plans • Giving training to staff to improve their professional competency • Ethical standards • Obtaining insurance wherever feasible, as a risk mitigation measure.
(d) Risk measurement and control Interest rate, currency, credit, liquidity and other risks are actively monitored by Management to ensure compliance with the Bank’s risk limits. The Bank’s risk limits are assessed regularly to ensure their appropriateness, given its objectives and strategies and current market conditions. A variety of techniques are used by the Bank in measuring the risks inherent in its trading and non-trading positions.

42 43
Bank of Baroda (Kenya) Limited | Annual Report & Financial Statements for the Year Ended 31 December 2011Bank of Baroda (Kenya) Limited | Annual Report & Financial Statements for the Year Ended 31 December 2011
AT 31 DECEMBER 2011US $
Shs ‘000GB £
Shs ‘000Euros
Shs ‘000Others
Shs ‘000Total
Shs ‘000
Assets
Cash and Bank balances 4,465 710 204 - 5,379
Balances with CBK 6,251 2,883 1,964 - 11,098
Deposits due from other banking institutions
80,382 11,891 10,585 2,049 104,907
Loans and advances to customers
2,333,448 24,703 131,239 - 2,489,390
Total assets 2,424,546 40,187 143,992 2,049 2,610,774
Liabilities
Customer deposits (1,474,055) (161,687) (118,062) - (1,753,804)
Deposits due to other banking institutions
(1,088,872) - (23,113) (32,529) (1,144,514)
Other liabilities (6,684) (1,791) (1,241) (8,091) (17,807)
Total liabilities (2,569,611) (163,478) (142,416) (40,620) (2,916,125)
Net balance sheet position (145,065) (123,291) 1,576 (38,571) (305,351)
Off balance sheet net notional position
124,173 121,940 - 45,579 291,692
26. CURRENCY RISK The Bank operates wholly within Kenya and its assets and liabilities are reported in the local currency. It conducts trade with Correspondent Banks and takes deposits and lends in other currencies also. The Bank’s currency position and exposure are managed within the exposure guideline of 20% of the core capital as stipulated by the Central Bank of Kenya. This position is monitored on a daily basis by the Management.The significant currency positions are detailed below:
AT 31 DECEMBER 2010US $
Shs ‘000GB £
Shs ‘000Euros
Shs ‘000Others
Shs ‘000Total
Shs ‘000
Total assets 2,213,375 16,775 139,819 9,070 2,379,039
Total liabilities 2,074,279 240,676 25,716 17,829 2,358,500
Net balance sheet position 139,096 (223,901) 114,103 (8,759) 20,539
Foreign exchange risk sensitivity The table below summarises the effect on post-tax profit had the Kenya Shilling weakened by 10% against each currency, with all other variables held constant. If the Kenya shilling strengthened against each currency, the effect would have been the opposite.
Year 2011US $
Shs ‘000GB £
Shs ‘000Euros
Shs ‘000Others
Shs ‘000Total
Shs ‘000
Effect on profit - increase/(decrease) (10,155) (8,630) 110 (2,700) (21,375)
Year 2010US $
Shs ‘000GB £
Shs ‘000Euros
Shs ‘000Others
Shs ‘000Total
Shs ‘000
Effect on profit - increase/(decrease) 9,737 (15,673) 7,987 (613) 1,438
27. INTEREST RATE RISK The Bank is exposed to various risks associated with the effects of fluctuation in the prevailing levels of market interest rates on its financial position and cash flows. The management closely monitors the interest rate trends to minimise the potential adverse impact of interest rate changes. The table below summarises the exposure to interest rate risk at the reporting date. Included in the table are the assets and liabilities at carrying amounts, categorised by the earlier of contractual repricing or maturity dates. The Bank does not have any derivative financial instruments. The Bank does not bear any interest rate risk on off balance sheet items.
AT 31 DECEMBER 2011Upto
3 monthsShs’000
3 - 6monthsShs’000
6 - 12monthsShs’000
1 - 3years
Shs’000
Over3 years
Shs’000
Non interestbearingShs’000
TotalShs’000
ASSETS
Cash in hand - - - - - 189,731 189,731
Balances with Central Bank of Kenya
851 - 44,715 - - 1,556,679 1,602,245
Government securities - - - 626,455 12,071,745 1,376,520 14,074,720
Placements with and loans and advances to other banking institutions
582,602 - - - - 62,373 644,975
Other assets - - - - - 325,568 325,568
Loans and advances to customers
8,507,735 241,121 470,601 2,682,428 6,510,134 732,019 19,144,038
Investment properties - - - - - 24,145 24,145
Other investments - - - - 309,700 39,124 348,824
Intangible assets - - - - - 4,898 4,898
Property and equipment - - - - - 131,177 131,177
Deferred tax - - - - - 47,542 47,542
Tax recoverable - - - - - 162,934 162,934
Total assets 9,091,188 241,121 515,316 3,308,883 18,891,579 4,652,710 36,700,797
LIABILITIES AND SHAREHOLDERS’ EQUITY
Customer deposits 17,484,977 3,421,343 3,821,486 2,521,862 113,335 2,900,946 30,263,949
Deposits due to other banking institutions
1,111,985 - - - - 32,529 1,144,515
Other liabilities - - - - - 356,498 356,498
Shareholders’ equity - - - - - 4,935,835 4,935,835
Total liabilities and shareholders’ equity
18,596,962 3,421,343 3,821,486 2,521,862 113,335 8,225,808 36,700,797
On balance sheet interest sensitivity gap
(9,505,774) (3,180,222) (3,306,170) 787,021 18,778,244 (3,573,098) -
AT 31 DECEMBER 2010Upto
3 monthsShs’000
3 - 6monthsShs’000
6 - 12monthsShs’000
1 - 3years
Shs’000
Over3 years
Shs’000
Non interestbearingShs’000
TotalShs’000
Total assets 7,122,424 140,602 695,167 4,693,993 14,921,995 4,757,324 32,331,505
Total liabilities and shareholders’ equity
11,388,367 3,316,912 4,470,361 4,765,993 559,826 7,830,046 32,331,505
On balance sheet interest sensitivity gap
(4,265,943) (3,176,310) (3,775,194) (72,000) 14,362,169 (3,072,722) -

44 45
Bank of Baroda (Kenya) Limited | Annual Report & Financial Statements for the Year Ended 31 December 2011Bank of Baroda (Kenya) Limited | Annual Report & Financial Statements for the Year Ended 31 December 2011
The table below summarises the effective interest rates calculated on a weighted average basis, by major currencies for monetary financial assets and liabilities:
2011 2010
Shs.%
US $%
GB£%
Euro%
Shs.%
US $%
GB£%
Euro%
Government securities 8.95 - - - 10.80 - - -
Placements with other banking institutions
2.30 - - - 1.35 1.50 - -
Loans and advances to customers
17.00 6.61 7.96 7.03 14.75 4.33 4.76 -
Customer deposits 5.72 0.94 1.27 1.19 6.21 1.46 3.00 2.00
Borrowings from other banking institutions
11.34 - - - 1.35 1.80 0.65 0.81
2011Shs
2010Shs
Effect on interest income - increase/(decrease) 263,876 183,052
Effect on interest expense - (increase)/decrease (229,548) (149,671)
Net effect on profit after tax - increase/(decrease) 34,328 33,381
Impact on equity
2011 2010
Effect of increase 281,826 493,053
28. PRICE RISK SENSITIVITY The Bank is exposed to price risk on quoted shares, corporate bonds and government securities because of investments that are classified on the statement of financial position as ‘Available-for-sale’. The table below summarises the impact on increase in the market price on the Bank’s equity net of tax. The analysis is based on the assumption that the market prices had increased by 5% with all other variables held constant and all the Banks equity instruments moved according to the historical correlation with the price:
29. LIQUIDITY RISK Liquidity risk is the risk that the Bank is unable to meet its payment obligations associated with its financial liabilities as they fall due and to replace funds when they are withdrawn. The matching and controlled mismatching of the maturities and interest rates of assets and liabilities is fundamental to the management of the Bank. It is unusual for Banks ever to be completely matched since business transacted is often of uncertain terms and of different types. An unmatched position potentially enhances profitability, but can also increase the risk of losses. The maturity of assets and liabilities and the ability to replace, at an acceptable cost, interest bearing liabilities as they mature are important factors in assessing the liquidity of the Bank and its exposure to changes in interest and exchange rates. The Bank does not maintain cash resources to meet all liabilities as they fall due as experience shows that a minimum level of reinvestment of maturing funds can be predicted with high level of certainty. The management has set limits on the minimum portion of maturing funds available to meet such withdrawals and on the level of interBank and other borrowing facilities that should be in place to cover withdrawals at unexpected levels of demand. The management reviews the maturity profile on a weekly basis and ensures that sufficient liquidity is maintained to meet maturing deposits which substantially are generally rolled over into new deposits. The Bank fully complies with the Central Bank of Kenya’s minimum cash reserve ratio (5.25 %) and liquidity ratio (10 %) requirements, with the average liquidity maintained at 49.2% (2010: 65.1%) during the year.
Interest rate risk sensitivity At 31 December 2011, if the weighted average interest rates had been 10 percent higher with all other variables held constant, post-tax profit for the year would have been as follows:
AT 31 DECEMBER 2011 ASSETS
Upto3 monthShs’000
3 - 6 monthsShs’000
6- 12monthsShs’000
1 - 3yearsShs’000
Over 3 yearsShs’000
TotalShs’000
Assets
Cash in hand 189,731 - - - - 189,731
Balances with Central Bank of Kenya
851 - 44,715 - 1,556,679 1,602,245
Government securities - - - 620,493 13,454,227 14,074,720
Placements with and loans and advances to other banking institutions
644,975 - - - - 644,975
Other assets 288,730 - 34,703 2 2,133 325,568
Loans and advances to customers 9,239,754 241,121 470,601 2,682,428 6,510,134 19,144,038
Investment properties - - - - 24,145 24,145
Other investments - - - - 348,824 348,824
Intangible assets - - - - 4,898 4,898
Property and equipment - - - - 131,177 131,177
Deferred tax - - - - 47,542 47,542
Tax recoverable - - 162,934 - - 162,934
Total assets 10,364,041 241,121 712,953 3,302,923 22,079,759 36,700,797
LIABILITIES AND SHAREHOLDERS' EQUITY
Customer deposits 20,385,923 3,421,343 3,821,486 2,521,862 113,335 30,263,949
Deposits due to other banking institutions
1,144,515 - - - - 1,144,515
Other liabilities 185,342 - 9,978 17,500 143,678 356,498
Shareholders' equity - 168,252 100,126 - 4,667,457 4,935,835
Total liabilities and shareholders' equity
21,715,780 3,589,595 3,931,590 2,539,362 4,924,470 36,700,797
Net liquidity gap (11,351,739) (3,348,474) (3,218,637) 763,561 17,155,289 -
AT 31 DECEMBER 2010
Total assets 7,579,768 203,321 698,802 4,962,889 18,886,725 32,331,505
Total liabilities and shareholders' equity
14,009,911 4,806,366 4,480,434 4,879,963 4,154,831 32,331,505
Net liquidity gap (6,430,143) (4,603,045) (3,781,632) 82,926 14,731,894 -
Experience indicates that customer deposits are maintained for longer periods than the contractual maturity dates. The deposit base is considered to be of a stable and long term nature.

46 47
Bank of Baroda (Kenya) Limited | Annual Report & Financial Statements for the Year Ended 31 December 2011Bank of Baroda (Kenya) Limited | Annual Report & Financial Statements for the Year Ended 31 December 2011
30. FAIR VALUES OF FINANCIAL ASSETS AND LIABILITIESIn the opinion of the Directors, the fair values of financial assets and financial liabilities are not materially different from their carrying values.
31. CAPITAL MANAGEMENTThe Bank’s objectives when managing capital, which is a broader concept than the ‘equity’ on the face of the statement of financial position, are:• To comply with the capital requirements set by the Central Bank of Kenya• To safeguard the Bank’s ability to continue as a going concern so that it can continue to providereturns for shareholders and benefits for
other stakeholders; and• To maintain a strong capital base to support the development of its business. The Bank monitors the adequacy of its capital using ratios
established by Central Bank of Kenya. These ratios measure capital adequacy by comparing the Bank’s core capital with total risk-weighted assets plus risk weighed off-balance sheet items, total deposit liabilities and total risk-weighted off balance sheet items.
The Bank monitors the adequacy of its capital using ratios established by Central Bank of Kenya. These ratios measure capital adequacy by comparing the Bank’s core capital with total risk-weighted assets plus risk weighed off-balance sheet items, total deposit liabilities and total risk-weighted off balance sheet items.
Assets are weighted according to broad categories of notional credit risk, being assigned a risk weighting according to the amount of capital deemed to be necessary to support them. Four categories of risk weights (0%, 20%, 50% and 100%) are applied. e.g. cash in hand (domestic and foreign), balances held with Central Bank of Kenya including securities issued by the Government of Kenya have a zero risk weighting, which means that no capital is required to support the holding of these assets. Property, plant and equipment carries a 100% risk weighting. Based on these guidelines it means that they must be supported by capital equal to 100% of the carrying amount. Other asset categories have intermediate weightings.
Off-balance sheet credit related commitments such as guarantees and acceptances, performance bonds, documentary credit etc., are taken into account by applying different categories of credit risk conversion factors, designed to convert these items into statement of financial position equivalents. The resulting credit equivalent amounts are then weighted for credit risk using the same percentages as for statement of financial position assets. Core capital (Tier 1) consists of paid-up share capital, retained profits less non-dealing investments. Supplementary capital (Tier 2) includes general provisions and non-dealing investments.
Balance sheet - nominal values Risk weighted amount
2011Shs'000
2010Shs'000
2011Shs'000
2010Shs'000
Cash in hand 189,731 221,204 - -
Balances with Central Bank of Kenya 1,602,245 1,302,224 - -
Government securities 14,074,720 16,445,350 - -
Placements with and loans and advances from other banking institutions
644,975 277,581 128,995 55,516
Other assets 325,568 207,862 325,568 207,862
Loans and advances to customers 19,144,038 13,434,459 17,672,572 12,578,299
Investment properties 24,145 24,764 24,145 24,764
Other investments 348,824 255,223 348,824 255,223
Intangible assets 4,898 - 4,898 -
Property and equipment 131,177 119,860 131,177 119,860
Deferred tax 47,542 42,978 47,542 42,978
Tax recoverable 162,934 - 162,934 -
Total assets 36,700,797 32,331,505 18,846,655 13,284,502
Off balance sheet positions 6,731,036 4,075,465 2,965,797 1,423,377
Total risk weighed assets 43,431,833 36,406,970 21,812,452 14,707,879
Capital adequacy requirement calculationCapital
2011Shs'000
2010Shs'000
Tier 1 capital 4,464,164 3,318,804
Tier 2 capital 203,293 153,025
Total Capital 4,667,457 3,471,829
Total deposit liabilities (net of margin money) 30,263,949 25,600,279
Risk weighted amounts for loans and advances to customers are stated net of impairment losses. These balances have also been offset against fixed deposits and short term deposits placed by customers as securities. There is no borrower with either funded or non-funded facilities, exceeding twenty five percent of core capital.
Actual ratios Minimum requirement
2011%
2010%
2011%
2010%
Core capital to total risk weighted assets 20.5% 22.6% 8 8
Total capital to total risk weighted assets 21.4% 23.6% 12 12
Core capital to deposit liabilities 14.8% 13.0% 8 8
32. RELATED PARTY TRANSACTIONS
Included in loans and advances and customer deposits are amounts advanced to/received from certain Directors and companies in which Directors are involved either as shareholders or Directors (related companies). In addition, contingent liabilities (Note 24) include guarantees and letters of credit which have been issued to related companies.
The following transactions were carried out with related parties:
2011Shs’000
2010Shs’000
a) Interest received from loans and advances to:
Related companies 1,998 2,766
Senior management employees 37 197
other employees 7,134 5,201
9,169 8,164
b) Interest paid on deposits from:
Directors 822 1
Senior management employees 9,808 1,433
Other employees 34 41
276 258
10,941 1,733
c) Management fees paid
Related companies 41,560 37,143
DirectorsRelated
companiesSenior management
employeesOther employees
2011Shs’000
2010Shs’000
2011Shs’000
2010 Shs’000
2011Shs’000
2010Shs’000
2011Shs’000
2010Shs’000
d)Outstanding loans and advances
At start of year - - 17,505 6,231 3,960 2,626 79,754 72,771
Advances during the year
- - 6,152 28,396 1,160 1,879 39,394 25,286
Interest charged - - 1,998 2,766 37 197 7,097 5,004
Repayments during the year
- - (18,774) (19,888) (4,150) (742) (28,054) (23,307)
At end of year - - 6,881 17,505 1,007 3,960 98,190 79,754
Contingent liabilities - - - - - - - -
The loans and advances to related parties are performing .No provisions have been recognised in respect of the loans and advances to Directors, related parties or staff as they are performing well.

48 49
Bank of Baroda (Kenya) Limited | Annual Report & Financial Statements for the Year Ended 31 December 2011Bank of Baroda (Kenya) Limited | Annual Report & Financial Statements for the Year Ended 31 December 2011
DirectorsRelated
companiesSenior management
employeesOther employees
2011Shs’000
2010Shs’000
2011Shs’000
2010Shs’000
2011Shs’000
2010Shs’000
2011Shs’000
2010Shs’000
e) Deposits
At start of year 10,610 770 41,431 9,507 6,215 2,224 27,471 34,028
Advances during the year
59,562 55,337 3,189,349 33,463 18,941 54,715 256 241
Interest charged 822 1 9,808 1,433 34 41 276 258
Repayments during the year
(61,306) (45,498) (2,871,734) (2,972) (22,736) (50,765) (2,783) (7,056)
At end of year 9,687 10,610 368,854 41,431 2,454 6,215 25,220 27,471
2011Shs’000
2010Shs’000
f)Undrawn formal stand by facilities, credit lines and other commitments to lend:
Related companies 10,119 11,536
g) Directors emoluments
-fees 615 368
-others 10,219 7,174
10,834 7,542
h) Key management personnel compensation
Key management includes the directors and other members of key management.
Short-term employee benefits 28,296 17,595
Post-employment benefits 1,699 1,280
29,995 18,875
All transactions with related parties were at arms length and at terms and conditions similar to those offered to other major customers.
33. PRESENTATION CURRENCY The financial statements are presented in to the nearest thousand Kenya Shillings (Shs’000).
2011Shs’000
2010Shs’000
OPERATING EXPENSES1. STAFF COSTS
Leave benefits 2,900 4,243
Pension fund contributions 13,823 13,478
Salaries and wages 227,890 215,251
Fringe benefit tax 43 15
Staff and other expenses 22,042 21,006
Staff housing 5,698 5,344
Staff medical 10,862 10,702
Staff training 1,026 1,300
Total staff costs 284,284 271,339
2. ADMINISTRATIVE EXPENSES
Advertising 12,643 17,282
Broker commissions 4,267 6,578
Computer expenses 3,711 4,176
Donations and fines 2,362 486
Subscriptions and periodicals 3,040 7,749
Entertainment 2,221 2,100
Legal and professional fees 44,863 47,336
Miscellaneous 19,413 16,877
Postages, telephones, telex and fax 4,497 5,075
Printing and stationery 5,064 6,805
Secretarial fees 146 160
Insurance 10,302 10,033
Travelling and motor vehicle 10,457 9,484
Total administrative expenses 122,986 134,141
3. OPERATING EXPENSES
Electricity and water 9,999 7,503
Insurance 291 873
Licences 2,385 1,972
Office cleaning 1,748 957
Repairs and maintenance 24,009 22,681
Write off of property and equipment - 359
Total operating expenses 38,432 34,345
ANNEXURE I - SCHEDULE OF OTHER OPERATING EXPENSES

50 51
Bank of Baroda (Kenya) Limited | Annual Report & Financial Statements for the Year Ended 31 December 2011Bank of Baroda (Kenya) Limited | Annual Report & Financial Statements for the Year Ended 31 December 2011
2011Shs’000
2010Shs’000
NON-PERFORMING LOANS AND ADVANCES1. NON-PERFORMING LOANS AND ADVANCES
a) Gross Non-performing loans and advances 648,851 512,940
b) Less Interest in Suspense 64,606 53,606
c) Total Non-Performing Loans and Advances (a-b) 584,245 459,334
d) Less Loan Loss Provision 529,597 341,976
e) Net Non-Performing Loans and Advances(c-d) 54,648 117,358
f) Discounted Value of Securities 54,648 117,358
g) Net NPLs Exposure (e-f) - -
2. INSIDER LOANS AND ADVANCES
h) Directors, Shareholders and Associates 6,881 17,504
i) Employees 99,198 81,248
j) Total Insider Loans and Advances and other facilities 106,079 98,752
3. OFF-BALANCE SHEET ITEMS
a) Letters of credit,guarantees, acceptances 5,443,195 3,048,986
b) Other contingent liabilities 1,287,841 3,048,986
c) Total Contingent Liabilities 6,731,036 4,075,464
4. CAPITAL STRENGTH
a) Core capital 4,464,164 3,318,804
b) Minimum Statutory Capital 700,000 500,000
c) Excess (a-b) 3,764,164 2,818,804
d) Supplementary Capital 203,293 153,025
e) Total Capital (a+d) 4,667,457 3,471,829
f) Total risk weighted assets 21,812,452 14,707,879
g) Core Capital/Total deposits Liabilities 14.8% 13.0%
h) Minimum statutory Ratio 8.0% 8.0%
i) Excess 6.8% 5.0%
j) Core Capital / total risk weighted assets 20.5% 22.6%
k) Minimum Statutory Ratio 8.0% 8.0%
l) Excess (j-k) 12.5% 14.6%
m) Total Capital/total risk weighted assets 21.4% 23.6%
n) Minimum statutory Ratio 12.0% 12.0%
o) Excess (m-n) 9.4% 11.6%
5. LIQUIDITY
a) Liquidity Ratio 49.2% 65.1%
b) Minimum Statutory Ratio 20.0% 20.0%
c) Excess (a-b) 29.2% 45.1%
ANNEXURE II - OTHER DISCLOSURES ANNEXURE III - FINANCIAL HIGHLIGHTS
Shareholder’s Fund
Business Volume
Profit Growth
Total Assets
Business Per Employee
Book Value Per Share

52 53
Bank of Baroda (Kenya) Limited | Annual Report & Financial Statements for the Year Ended 31 December 2011Bank of Baroda (Kenya) Limited | Annual Report & Financial Statements for the Year Ended 31 December 2011
Highlights of 2011
Another feather in our cap ...
Now present in Kakamega ...
Our “All-Woman” Branch opens in Nyali ...CSR Project ...
1
2
3
4
5
6
1. Bank of Baroda (Kenya) Ltd. Chairman Mr. R. K. Bakshi and Managing Director Mr. Arun Shrivastava present a cheque to Rosemary Mutunkei of Kenya Red Cross Society towards the Kenyans for Kenya Initiative. | 2. Western Provincial Commisioner Mr. Samuel Kilele Mngoda officially opens the Kakamega Branch | 3. Cake-cutting ceremony | 4. Mr. J.K Muiruri, Director, welcomes Coast
Provincial Commisioner Mr. Ernest Munyi | 5. Chief Guest Mr. Ernest Munyi cuts the cake | 6. The Nyali Branch team | 7. Sylvia Mulinge of Safaricom presents an award for the most efficient Bank,
1st Runner-up to Mr. Shrivastava at the 2012 Banking Awards.
7

54
Bank of Baroda (Kenya) Limited | Annual Report & Financial Statements for the Year Ended 31 December 2011
Team
Bar
oda