R A JENKINS ET NATIONAL LAB TN I EEEEEEEEEEEEEE ...
74
RD-Ai42 718 CHEMICAL CHARACTERIZATION AND TOXICOLOGIC EVALUATION OF 1/i AIRBORNE MIXTURES..(U) OAK RIDGE NATIONAL LAB TN R A JENKINS ET AL. NOV 83 ORNL-TM-9196 UNCLASSIFIED F/G 21/4 NL mmmmmmmmmmmms I IIIIIIIIIIIIII IIIIIIIIIIIIol EEEEEEEEEEEEEE EEEEEEEEEEEEEE EEEEEEEEE
Transcript of R A JENKINS ET NATIONAL LAB TN I EEEEEEEEEEEEEE ...

RD-Ai42 718 CHEMICAL CHARACTERIZATION AND TOXICOLOGIC EVALUATION OF 1/iAIRBORNE MIXTURES..(U) OAK RIDGE NATIONAL LAB TNR A JENKINS ET AL. NOV 83 ORNL-TM-9196
UNCLASSIFIED F/G 21/4 NL
mmmmmmmmmmmms I
IIIIIIIIIIIIIIIIIIIIIIIIIIolEEEEEEEEEEEEEEEEEEEEEEEEEEEEEEEEEEEEE

I. A 0=1 a L0 IM 13.
IILA
.25 AM4 1.6
MICROCOPY RESOLUTION TEST CHARTNATIONL BUREAU OF StANDARDS-1963-A
AD
ORNLiATM-9196
OAK RIDGENATIONALLABORATORY Chemical Characterization and
Toxicologic Evaluation of-Airborne Mixtures
,O0 CHEMICAL AND PHYSICALI CHARACTERIZATION OF
DIESEL FUEL SMOKE
R. A. JenkinsHR.W. Holmberg
SolJ. S. Wike h~~J. H. Moneyhun rR. S. Brazell 10-
NOVEMBER 1983
Supported byU.S. ARMY MEDICAL RESEARCH AND DEVELOPMENT COMMAND
Fort Detrick, Frederick, MD 21701
Army Project Order Nos. 9600 and 0027
Health Effects Research Division
U.S. ARMY MEDICAL BIOENGINEERING RESEARCH ANDDEVELOPMENT LABORATORY
Fort Detrick, Frederick, MD 21701
Approved for public release;distribution unlimited
The findings in this report are not to be construed as anofficial Department of the Army position unless so
designated by other authorized documents.
M1M1 IMAIKTA OW SYUS, MC.N.UUMETA1M 84 07 05 071"swm

. . . . . . . . . . . . . . .. . ... -..T-~
UNCLASSIFIEDSECURITY CLASSIFICATION OF THIS PAGE (When Data Entered)
REPORT DOCUMENTATION PAGE RES BEFO'RE C() .PLETING FORM
1. REPORT NUMBER 2. GOVT ACCESSION NO. 3. RECIPIENT'S CATALOG NUMBER
a4. TITLE (and Subtitle) S. TYPE OF REPORT & PERIOD COVEREO
Chemical Characterization and Toxicologic Evalu-ation of Airborne Mixtures: Chemical and Phys- TASK FINAL REPORTical Characterization of Diesel Fuel Smoke G. PERFORMING ORG. REPORT NUMBER
7. AUTHOR(a) 8. CONTRACT OR GRANT NUMBER(&)
R. A. Jenkins, R. W. Holmberg, J. S. Wike, J. H. Army Project Order Nos.Moneyhun, R. S. Brazell 9600 and 0027
9. PERFORMING ORGANIZATION NAME AND ADDRESS 10. PROGRAM ELEMENT. PROJECT. TASK
Bio/Organic Analysis Section; Analytical Chemis- AREA 4 WORK UNIT NUMBERS
try Division; Oak Ridge National Laboratory; 62777Oak Ridge, Tennessee 37831 A3E162777A878
11. CONTROLLING OFFICE NAME AND ADDRESS 12. REPORT DATE
U.S. Army Medical Research and Development NOVEMBER 1983Command; Fort Detrick, Frederick, Maryland 21701 ,3. NUMBEkOF PAGES
6714. MONITORING AGENCY NAME 8 ADDRESS(il different from ControllinA Office) 15. SECURITY CLASS. (of this report)
U.S. Army Medical Bioengineering Research and UnclassifiedDevelopment LaboratoryFort Detrick, Frederick, Maryland 21701 ISE. D ASSIFICATION/DOWNGRADING
r7SCHEDULE
16. DISTRIBUTION STATEMENT (of this Report)
Approved for public release; distribution unlimited.
17. DISTRIBUTION STATEMENT (of the abstct enteredin Block 20, If different from Report)
18. SUPPLEMENTARY NOTES
.+ 4
I. KEY WORDS (Continue on revereD side it neceeaary md Identify by block number)
aerosol chemistry fractionationaliphatic chromatography fuelanalysis diesel fuel gas chromatographyaromatic elemental analysis GC/MScascade impactor fluorene HPLC (Continued on reverse)
0. A8SRAcr (C~otiue am reveree OEu If neceseary mad Identify by block number)
-*Diesel fuel no. 2 (DF2) used in the vehicle engine exhaust smoke system
(VEESS) has been chemically and physically characterized.. A battery of frac-tionation procedures was used, including elemental analysis, inductivelycoupled plasma, UV/visible and infrared spectrometrys, high performance liquidchromatography (HPLC), gas chromatography and GC/MS. The best overall charac-
terization was provided by HPLC, which yielded four major fractions (saturatedhydrocarbons, 70 percent; substituted benzenes, 16 percent; 2-ring aromatics,-
(Continued on reverse)
IDO I Fi 1473 oMI OF I NOV 6S IOS OBSOLETE UNCLASSIFIED
SECURITY CLASSIFICATION' OF THIS PAGE (WhM Dorae Entered)
L % % %
' - .° -, , * . . . . . .C * * . .9 .~. I

UNCLASSIFIED
SECURITY CLASSIFICATION OF THIS PAGEO(ten Data Entered)
.. 19. hydrocarbons particles tracer
infrared spectrometry petroleum UV spectrometryliquid chromatography phenanthrene vapormilitary smoke VEESSobscurant spectrometry
20.1,12 percent; and 3-ring aromatics, 2 percent) and one minor fraction (polar
aromatics, 0.2 percent). These fractions were further analyzed by GC/MS.* No single component accounted for more than about one percent of the DF2.
The major effect of aerosolization of the DF2, in a generator designed tosimulate the military deployment of VEESS smoke, was partitioning of con-stituents between the vapor and the liquid particulate phase on the basisof their relative volatility. No significant levels of constituents notfound in the unaerosolized DF2 were observed in the liquid phase of thesmoke generated from it.
%
UNCLASSIFIED
SECURITY CLASSIFICATION OF THIS PAGE(Wben Dte Entered)
* ,, r .

AD__ _ORNLT-9196
Chemical Characterization and Toxicologic Evaluation ofAirborne Mixtures
CHEMICAL AND PHYSICAL CHARACTERIZATION OF DIESEL FUEL OK3c
PREPARED BY U-'
R. A. Jenkins
J. S. WikeJ. H. Moneyhun MTIS GRA&ZR. S. Brazell DTUC TAB
Umannoun0gJrustificatio
Bio/Organic Analysis SectionAnalytical Chemistry Division ]ByOak Ridge National Laboratory Distribution,
Oak Ridge, TN 37830 Aalblt oe
Date Published - June 1984 n
Supported by
U.S. ARMY MEDICAL RESEARCH AND DEVELOPMENT COMMANDFort Detrick, Frederick, MD 21701
Army Project Order Nos. 9600 and 0027
Project officer: James C. Eaton
Health Effects Research DivisionU.S. ARMY MEDICAL BIOENGINEERING RESEARCH AND DEVELOPMENT LABORATORY
Fort Detrick, Frederick, MD 21701
OAK RIDGE NATIONAL LABORATORYOak Ridge, Tennessee 37830
operated byMARTIN MARIETTA ENERGY SYSTEMS, INC.
for theU. S. DEPARTMENT OF ENERGY
Under Contract No. DE-AC05-840R2 1400

EXECUTIVE SUMMARY
The purposes of the work described in this report were threefold:(1) to describe the chemistry of a diesel fuel smoke undergoing inhala-tion toxicology studies, (2) to define the diesel fuel used in thestudy to acertain what chemical changes occur as a result of aerosoli-zation, and (3) to provide a data base with which to compare otherfuels for the purpose of future risk assessment studies. The fuel usedwas a reference diesel fuel No. 2 designed for use in compliance test-ing of motor vehicles. The physical characteristics of the fuel,including density, kinematic viscosity, flash point, particualte con-tamination, simulated distillation ranges, and accellerated stabilitywere determined according to standard procedures. A comparison of thedata obtained from tests performed in our laboratory with those ofspecifications provided by the EPA or Department of Defense indicatedthat the fuel used in the study was within normal specification range.
The chemical characterization of the diesel fuel and fuel smoke wasdesigned to be sufficiently broad to be applicable to a variety ofdiesel fuels which may be employed in future tests and also be gene-rally applicable to the analysis of condensed smokes. Therefore, abattery of testing procedures, including elemental analyses, Fouriertransform infrared spectrometry, UV/visible spectrometry, high perfor-mance liquid chromatography (HPLC), and high resolution gas chromatog-raphy (CC) and GC/MS were employed. The hydrogen:carbon molar ratiofor the fuel was 1.80:1. This was close to that predicted from the70:30 aliphatics:aromatics ratio determined by HPLC. Sulfur (at 0.39percent) was the most prevalent non-hydrocarbon element. Little evi-dence was obtained of trace metal contamination in the fuel. Barium,calcium, cadmium, copper, and lead were at levels between 0.1 and 0.01ppm. UV/visible spectral analysis indicated a strong absorption bandin the ultraviolet region. This absorption increased upon exposure ofthe fuel to light. Therefore, fuel was kept in the dark during storageperiods. The infrared spectrum was characterized by strong absorptionsfor C-H stretching and bending. Very few other strong absorptions werenoted.
Class fractionation of the diesel fuel by HPLC yielded one minorand four major fractions. These fractions were then subjected to GCand GC/MS for qualitative and quantitative analysis. The first frac-tion (approximately 70 percent of the fuel, by weight) consisted pre-dominantly of straight and branched chains saturated hydrocarbons,present at maximum concentrations of 10-12 mg per g fuel. The secondfraction (approximately 16 percent of the fuel) consisted of alkyl sub-stituted benzene compounds. These were present at maximum concentra-tions of I - 2.5 mg per g fuel. The third fraction (approximately 12percent of the fuel) was composed predominantly of two-ring aromatics,including naphthalene, alkylated naphthalenes, alkylated biphenyls, andsmall amounts of thiophenes. The most prevalent constituents were pre-sent at concentrations of 5-10 mg per g fuel. The fourth fraction(approximately 2 percent of the fuel) consisted of predominantlythree-ring hydrocarbons, including fluorene, alkylated fluorenes,

phenanthrene, and alkylated phenanthrenes. These were present atconcentrations of 2-4 mg per g of fuel. A minor (0.2%), more polarfraction, contained alkyl substituted indoles, carbozoles, and alkylsubstituted carbazoles. The most prevalent constituents in this frac-tion were present at concentrations of 40-90 micrograms per gram fuel.Benzo(a)pyrene was present in the fuel at a concentration of approxi-mately 70 ng per mL.
The single greatest effect of the high temperature aerosolizationprocedure was to partition the components of the diesel fuel betweenvapor and liquid phases. This occurs because the obscurant cloud is anevaporation-condensation aerosol which, when generated, undergoes alarge dilution simultaneously with condensation. Many of the morevolatile constituents in the fuel have significant vapor pressures atambient temperatures and thus partition themselves between the vaporand particle phases. Further experiments indicted that, as the smokebecomes more dilute, a greater fraction of the fuel remains uncon-densed. At the concentrations used in the study, the fraction of fuelremaining in the vapor phase ranged between 7 and 20 percent. Compari-son of specific constituent concentrations in the various fractions ofthe particle phase of the smoke with those reported for the fuel itselfindicated a lowered concentration of both one-ring aromatics and morevolatile straight chain saturated hydrocarbons in the smoke particles.These compounds were identified in the vapor phase of the smoke. Con-centrations of other constituents in the fuel and smoke were generallywithin the range of experimental uncertainty of each other. No signif-icant levels of constituents not present in the original fuel wereobserved in the liquid phase of the smoke. Only traces of carbonmonoxide (CO) and oxides of nitrogen (NOx) were present in the vaporphase.
Scoping studies were conducted by adding oxygen to the smoke gene-rator carrier gas to better simulate the chemical environment existinginside the exhaust manifold of an armored vehicle. Results obtainedsuggested that field generated smoke would contain more NOx and CO,and that about 25 percent of the aliphatic constituents of the particlephase would be depleted due to combustion. The smoke changed color andodor.
.-. , . ..... . . . . .~ . . *.. ..*. .. .... . .... ....... . . . . . .

FOREWORD
In conducting the research described in this report, the investi-
' gators adhered to the "Guide for Laboratory Animal facilities andCare," as promilgated by the Committee on the Guide for Laboratory
Animal Facilities and Care of the Institute of Laboratory Animal
Resources, National Academy of Sciences-National Research Council.
is
4.-
4
-3
4, *. . .. -

TABLE OF CONTENTS
Page
EXECUTIVE SUMMARY . . . . . . . . . . . . . . . . . . . . . . . I
FOREWORD . . . . . . . . ...... . 3
LIST OF TABLES ... . . . . . . . . . . . . . . . ..... . 7
LIST OF FIGURES . . . . . . . . . . o . . . . . . . . . . . . . 9
INTRODUCTION . . . . . . . . . . o . . . . . . . . . . . . . . . II
PHYSICAL CHARACTERISTICS OF THE DIESEL FUEL . . . . . . . . . . 11
Methods .... ... ... ... .. . ... 12
Results o. ... . . .. . . . . ...... 12
CHEMICAL CHARACTERIZATION OF THE DIESEL FUEL . . . . o . . . . . 12
Methods .. . . . . . . . ....... * .. * * * * 13
Results and Discussion .. ............. . .. 15
PHYSICAL CHARACTERIZATION OF THE DIESEL FUEL SMOKE: PARTICLE
SIZE DISTRIBUTION . ....... .. ......... .. . 33
Introduction . .. . .. . . . . . . . . . .. .. . . 33
Methods . . . . . . . . . . .. . . . . . . . . . .. . . . 33
Data Reduction .. * . . . . . . . * . . . . . . .. . . . 34
Results and Discussion ... ....... ......... 38
CHEMICAL CHARACTERIZATION OF THE DIESEL FUEL SMOKE . . . . . . . 38
Introduction ................. . 38
Methods .* ....................... 42
Results and Discussion .................. 43
Distribution of the Smoke Between Vapor and Particulate
States e.o..**.....oo..*..*. .......... 9 44
Chemical Composition of the Diesel Fuel Smoke .. ... 50
PREVIOUS PAGE
. . . . . . ' . , .5 ." . ." ," " . ' .. .

Table of Contents (Cont'd)
Page
EFFECTS OF OXYGEN INCLUSION IN SMOKE GENERATOR CARRIER GAS . . . 56
Introduction . . . . . ... . . . . . . . . . . . . . 56
Methods ... . . . . . .. .... ... 56
Results .. . . . . . . . . . . . . 57 .
Discussion ............ . . . . . . . . . .. . 57 -
LITERATURE CITED . . . . . 61
APPENDIX: BASIC Computer Program for Iterative Calculation of
Cut-off Diameters for Cascade Impactor Stages .... 63
PERSONNEL 65
PUBLICATIONS . . . . . . . . . . . . . . . . . . . . . 66
DISTRIBUTION LIST . . . . . 67N.
* .
'a
-6- 1q
4.-

LIST OF TABLES
No. PageI Physical Characteristics of Diesel Fuel #2 Used in
ORNL Study . . . . . . . . . . . . . . . . . . . . . . 13
2 Bulk Elemental Analysis of Diesel Fuel . . . . . . . . . 15
3 Estimated Trace Element Concentrations in Diesel Fuel . 17
4 Concentrations of Selected Constituents: Aliphatic
Fraction of Diesl Fuel . ................ 25
5 Concentrations of Selected Constituents: One-Ring Frac-
tion of Diesel Fuel .................. 26
6 Concentrations of Selected Constituents: Two-Ring Frac-tion of Diesel Fuel .................. 26
7 Concentrations of Selected Constituents: Three-RingFraction of Diesel Fuel ................ 30
8 Concentrations of Selected Constituents in the Semi-
Polar Fraction of Diesel Fuel .. . . . . . . . . * 30
9 Effects of Storage Conditions on Diesel Fuel "Aging":Absorbance of Neat Fuel at 460 na . . . . . . . .. 32
10 Conditions for Rapid Chromatographic Analysis of Diesel
Fuel Smoke Particles From Cascade Impaction Stages . . . 34
11 Stage Constants for Circular Jet Impactors . . . . .. .. 35
12 Particle Size Data From Typical Cascade Impactor Run . . 37
13 Particle Size Summary of DF2 Aerosols in ExposureChambers *.....9 . . ....... o ........ 39
14 Analysis of Nitrogen Carrier Gas Used for AnimalExposures .. . . . . . . . .. . . . . e * . . . 44
15 Smoke Vapor Phase Concentration as Estimated FromMaterial Balance Calculations . . o . .. . ... . .. 46
16 DCBP Enrichment and Calculated Vapor Phase Concentra-tion as a Function of Smoke Particle Concentration:Cylindrical Chamber o.............9 . . . 47
-7-
7 " TM ' e ' " """-" "" *"*-' " *- . . . . . " - ", , '- - ' . , .. . ." . " "- -' - "/ ' , ,, ',... ..- ""''''''?; '',., ''''''.;: -. o .'- '/ ,' ,.. ,
... . . . •UT ~ - ~ ' r - -
%
List of Tables (Cont'd)
No. Page
17 DCBP Enrichment and Calculated Vapor Phase Concentra-tion as a Function of Smoke Particle Concentration:X-10 Chamber ... ....... . . . . . . . . . . . . . 48
18 Vapor Phase Concentration as a Function of Smoke Part-icle Concentration as Determined by Carbon MolecularSieve (Spherocarb® ) Trapping Method . . . . . . . . . . 50
19 Concentrations of Selected Constituents: AliphaticFraction of the Liquid Phase of Diesel Fuel Smoke . . . 53
20 Concentrations of Selected Constituents: One-RingAromatic Fraction of the Liquid Phase of Diesel FuelSmoke .. .. .. .. .. .*. .. .. .. .. .. ... 53
21 Concentrations of Selected Constituents: Two-RingAromatic Fraction of the Liquid Phase of Diesel FuelSmoke .. .. .. .. .. .. .. .. .. .. .. . .. 54
22 Concentrations of Selected Constituents: Three-RingAromatic Fraction of the Liquid Phase of Diesel FuelSmoke ........................ 54
23 Exposure Chamber Atmosphere: Concentrations of SpecificConstituents .. . . . . .. .. .. .... 55
' -S, '.,-.-..% ,-,% .-. .- ,% ,- .,,. -. ,-, - -, . ,: - . - -... . . . ., , .: .. ' ¢'. . . ... : . .; . .'.. .'
* .*LIST OF FIGURES
No. Pg
1 Ultra-Violet and Visible Spectra of Neat and Diluted, Diesel Fuel ...................... 16
2 Diffuse Reflectance Fourier Transform Infrared Absorp-tion Spectra of Phillips #2 Diesel Fuel ......... . 18
3 High Performance Liquid Chromatogram (HPLC) WithRefractive Index Detection of Phillips #2 Diesel Fuel . 19
4 Comparison of HPLC Chromatograms of Diesel Fuel Used*, in Inhalation exposures and That of Fuel Collected at
Smoke Week III . . . . ..... ......... .. 21
5 High Resolution Gas Chromatographic (GC) Profile of
Diesel Fuel . . . . . . . . . . . . . . . *.. .. .. .. 22
6 HPLC Fractionation of Diesel Fuel Followed by HighResolution GC Visualization of Individual Fractions . . 23
7 High Resolution GC Profile of the Aliphatic Fraction ofDiesel Fuel ....... . . . . .......... . 24
8 High Resolution GC Profile of the One-Ring Fraction ofDiesel Fuel ...... . . . ............. . 27
9 High Resolution GC Profile of the Two-Ring Fraction ofDiesel Fuel . . . . . . . . . . . . . . . . . . . . . . 28
10 High Resolution GC Profile of the Three-Ring Fractionof Diesel Fuel . . . . . . . . . . . . . . . . . . 29
11 High Resolution GC Profile of the Semi-Polar Fraction
of Diesel Fuel . . . . . . . . . . . . . . . . . 31
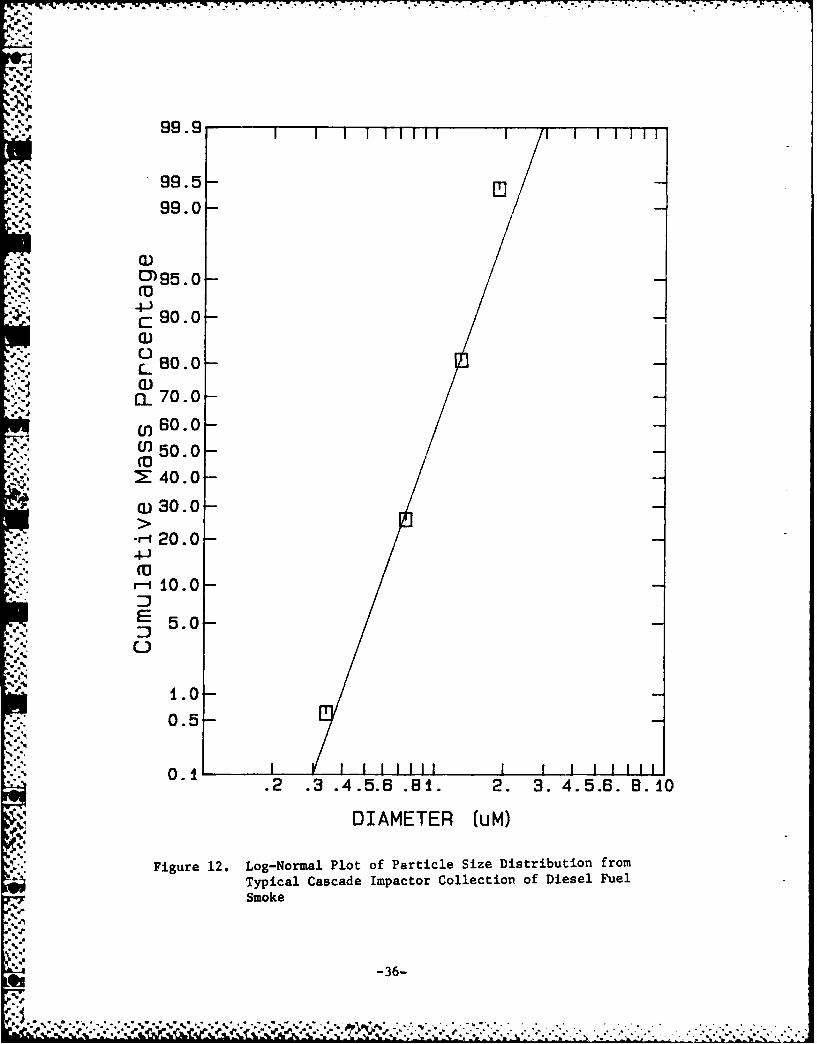
12 Log-Normal Plot of Particle Size Distribution From., Typical Cascade Impactor Collection of Diesel Fuel
"Smoke . .. . . . . . . . .. . . . . . . . . .. . .. 36
13 Particle Sizes of Diesel Fuel Smoke in Inhalation Expo-sure Chambers . . . . . . . . . . . . . .. . . . . . . 41
14 Vapor Phase Concentration of Diesel Fuel Smoke as aFunction of Particle Concentration .. . . . . . .. 49
-9-
. 'N- ' t. ,, _ ,. ' . -.. . .' ,.-, . .,'.. ,. . .-. .

List of Figures (Cont'd)
No.
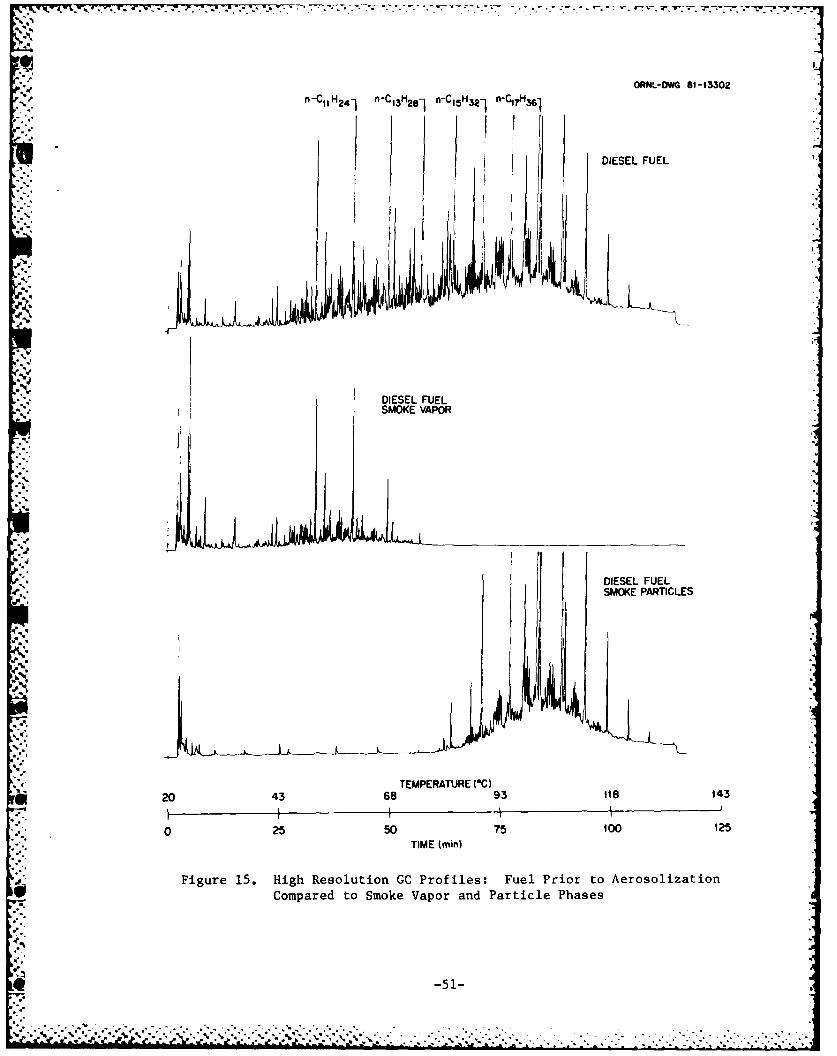
,- 15 High Resolution GC Profiles: Fuel Prior to Aerosoli-
zation Compared to Smoke Vapor and Particle Phases . . 51
16 Comparison of High Resolution GC Profiles: Unaero-
solized Diesel Fuel vs. Liquid Particle Phase FollowingAerosolization . . . . . . . . . . . . . ........ 52
17 Comparison of HPLC Chromatograms: Smoke ParticlesGenerated With Pure Nitrogen Carrier Gas vs. That Gene-rated With 50:50 Air:Nitrogen Mixture . . . . . . . . . 58
or
.i0-4'.
"4'. .",_,4" "'". ." ; ." :;"i ";? .'.'' ". '-i ."? - -- ",% -:'--, -v>''- - .. "-',.''." 'Z-D .',-: _,-. .
. . . . . . . . .. .. . .
INTRODUCTION
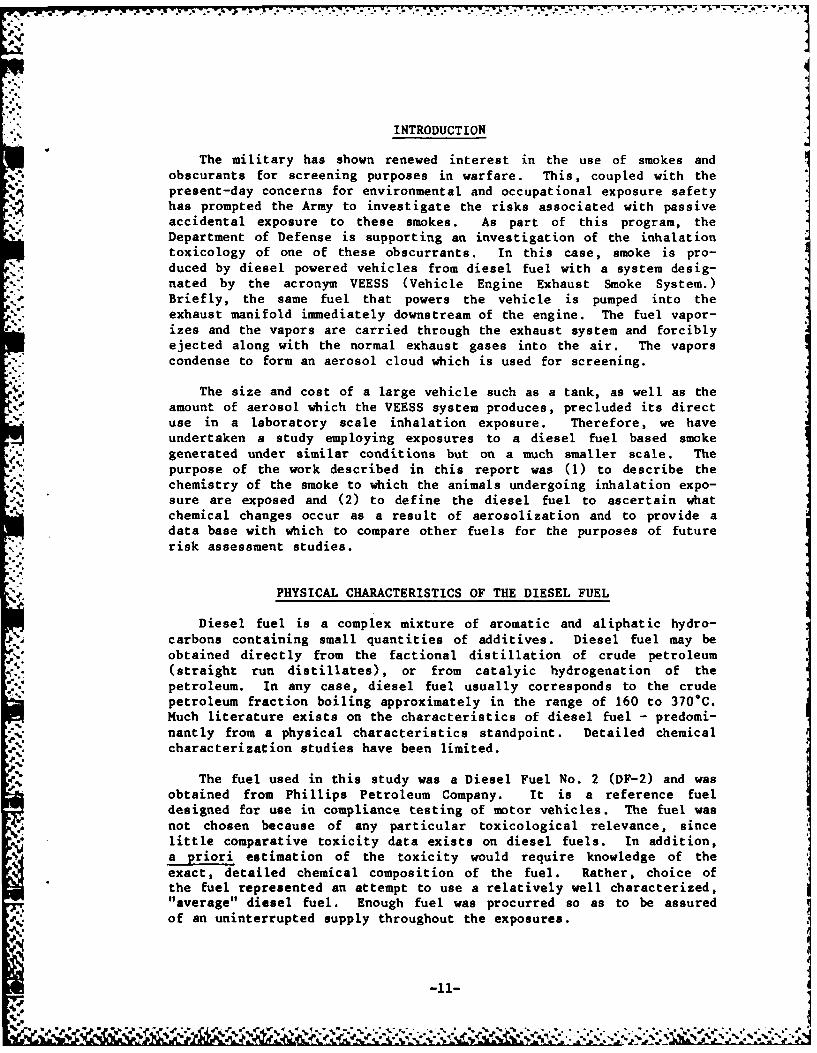
The military has shown renewed interest in the use of smokes andobscurants for screening purposes in warfare. This, coupled with thepresent-day concerns for environmental and occupational exposure safetyhas prompted the Army to investigate the risks associated with passiveaccidental exposure to these smokes. As part of this program, theDepartment of Defense is supporting an investigation of the inhalationtoxicology of one of these obscurrants. In this case, smoke is pro-duced by diesel powered vehicles from diesel fuel with a system desig-nated by the acronym VEESS (Vehicle Engine Exhaust Smoke System.)Briefly, the same fuel that powers the vehicle is pumped into theexhaust manifold immediately downstream of the engine. The fuel vapor-izes and the vapors are carried through the exhaust system and forciblyejected along with the normal exhaust gases into the air. The vaporscondense to form an aerosol cloud which is used for screening.
The size and cost of a large vehicle such as a tank, as well as theamount of aerosol which the VEESS system produces, precluded its directuse in a laboratory scale inhalation exposure. Therefore, we haveundertaken a study employing exposures to a diesel fuel based smokegenerated under similar conditions but on a much smaller scale. Thepurpose of the work described in this report was (1) to describe thechemistry of the smoke to which the animals undergoing inhalation expo-sure are exposed and (2) to define the diesel fuel to ascertain whatchemical changes occur as a result of aerosolization and to provide adata base with which to compare other fuels for the purposes of futurerisk assessment studies.
PHYSICAL CHARACTERISTICS OF THE DIESEL FUEL
Diesel fuel is a complex mixture of aromatic and aliphatic hydro-carbons containing small quantities of additives. Diesel fuel may beobtained directly from the factional distillation of crude petroleum
. (straight run distillates), or from catalyic hydrogenation of thepetroleum. In any case, diesel fuel usually corresponds to the crudepetroleum fraction boiling approximately in the range of 160 to 3700C.Much literature exists on the characteristics of diesel fuel - predomi-nantly from a physical characteristics standpoint. Detailed chemicalcharacterization studies have been limited.
The fuel used in this study was a Diesel Fuel No. 2 (DF-2) and wasobtained from Phillips Petroleum Company. It is a reference fueldesigned for use in compliance testing of motor vehicles. The fuel wasnot chosen because of any particular toxicological relevance, sincelittle comparative toxicity data exists on diesel fuels. In addition,a priori estimation of the toxicity would require knowledge of theexact, detailed chemical composition of the fuel. Rather, choice ofthe fuel represented an attempt to use a relatively well characterized,"average" diesel fuel. Enough fuel was procurred so as to be assuredof an uninterrupted supply throughout the exposures.
-11-
We,

The fuel was received in September, 1980 in 55-gallon drums andstored refrigerated at 4"C until use. When an individual barrel wasopened for use, it was warmed to approximately 20"C, tumbled for twohours, and aliquotted into 5-gallon fuel safety cans. The safety canshad been previously washed with hexane, ethanol, detergent and water,and ethanol, sequentially, to remove traces of residual oil or fuel.The filled cans were also stored refrigerated until immediately priorto use. For the inhalation exposures, no fuel was allowed to remain atroom temperature for more than one month.
METHODS
Density determinations were performed at 25*C by weighing a speci-fied volume of fuel. Kinematic viscosities were determined at both 40"Cand 25"C according to ASTM! procedure D445-53T. Flash point determina-tion was performed according to ASTM Procedure D93-58T. Particulatecontamination of the diesel fuel was determined by filtering a one-halfliter quantity of the fuel through a one-micrometer pore size glassfiber filter (Gelman Sciences, Inc.). The weight increase of the fil-ter pad was taken to be the amount of particles present in the filteredvolume. Simulated distillations were performed according to ASTMD2887-73. Accellerated stability testing was performed according toASTM D2274-74. Refactive indices were determined on a refractometer.
RESULTS
In Table I are listed various physical tests and parameters for thediesel fuel used in this study, along with the manufacturer's specifi-cations for that particular parameter and EPA or Department of Defensespecification ranges for selected parameters. A comparison with testsperformed in our laboratory indicates that the fuel used was within thenormal specification range. Accellerated stability testing, performedafter the fuel had been refrigerated approximately 12 months, indicatedthat the level of total insolubles was still well within the limitsspecified for diesel fuel. There were some differences between thedistillation points measured at ORNL and those determined for themanufacturer's specification. These may be due to the fact that theORNL procedure is not a true distillation but rather a gaschromatographic simulated distillation. However, the boiling pointswere well within specification limits.
CHEMICAL CHARACTERIZATION OF THE DIESEL FUEL
A "complete", exhaustive chemical characterization of the materialused to generate the VEESS smoke would involve considerable effort andresources and was beyond the scope of the project. The purpose of thework performed for this study was to develop a data base (1) with whichto compare other diesel fuels, and (2) to provide for the determination
-12-
% %.

%. W.IJ n V'r
%% - 4
0M00
-A 44Ln en
0.0
E-4co0
c4- -10 * 4 k4.0 ( 00 C 14 L0) co C4 C l en
bO I Ln I I4440 1 0 en co0
1.000N C 0
"q4 I. 1 4 .0 c
0000
04P0ca 04 0 00
j- 4q ZE- 0 QAI C; 0MU3 Qv 00 P% 0
1 * -4 eq M t
Na0 0
4.0
. 0 00
~~c0 I : 0 .-0-0 9! a * 0.41-
CJ2 0
.0 * 440 I0-0, 0.0 0 b&b .94 a4 l% :0.wai
00 00C49 0
a94 .10aON &'A "0 > .
Ii 0 C4 4~ V
0 w
A44'JO
-16
916

of the effects of aerosolization on the fuel. The chemical characteri-zation was to be sufficiently broad to be applicable to a variety ofdiesel fuels and also be generally applicable to the analysis of con-densed smokes. Ideally, the procedures had to be directed toward char-acterization of a large fraction of the total mass of fuel (as opposedto the determination of small quantities of additives) and had to beperformed on a routine basis. Thus, rather than one particularanalytical procedure being employed (such as high resolution gaschromatography), a battery of testing procedures was used to define thechemical composition of the diesel fuel.
METHODS
Carbon and hydrogen analyses were performed according to ASTM Pro-cedure D3178-3. Elemental nitrogen determinations were performed byASTM Procedure D-3179-73. Elemental bulk sulfur determinations wereperformed by ASTM Procedure D3177-75. Minor modifications of themethods were made in order to handle liquid petroleum samples. Tracemetal determinations were conducted on dodecane solutions of the dieselfuel by inductively coupled plasma analysis. UV/visibile spectra wereobtained on a Cary 14 recording spectrophotometer or a Varian Model DMS90 recording spectrophotometer. Diffuse reflectance Fourier Transforminfrared spectra were obtained by spotting small portions of fuel ontopotassium bromide powder. The mixture was then pressed into pelletsand spectra taken on a Digilab Model FTS-20C FTIR Spectrometer.1
High performance liquid chromatographic (HPLC) separations or frac-tionations of diesel fuel or dilute diesel fuel were performed on asemi-preparative scale 5-micrometer particle diameter silica column(two Altex Ultrasphere - Si columns in series). Usual injection sizewas 50 microliters. Aliphatic and aromatic constituents in the fuelwere isocratically eluted with hexane at 1.1 mL per minute using aLaboratory Data Control HPLC Pump. The more polar constituents wereeluted by changing the mobile phase to methylene chloride or a 50:50methylene chloride:hexane mixture. Detection of fuel constituents wasperformed with either refractive index detection or UV detection at 254nm. Benzo(a)pyrene analyses were performed by sequential HPLCanalyses, as described elsewhere.
2
Most gas chromatographic determinations of diesel fuel constituentswere performed on a Hewlett Packard 5840A gas chromatograph. Two-microliter splitless injections were made onto either a 30-M, SE-52-coated, fused silica capillary column or 50- OV-ll-coated fusedsilica capillary column. Hydrogen was the carrier gas. The usualtemperature program was: 2 minute hold at 50C and then program at 2"per minute to 250"C. Quantitative determinations were performed bycomparing peak areas with those of external standards. Mass spectraldata were obtained with a Hewlett Packard 5895A GC/MS system equippedwith a dual EI/Cl source. El source potential was 70 eV. Proceduresfor ammonia chemical ionization GC/MS have been described in detailelsewhere.
3
-14-

RESULTS AND DISCUSSION
Analysis of the bulk elemental composition of the fuel provides abasis for the estimation of the relative levels of more polar consti-tuents in the predominantly hydrocarbon matrix. For example, if nitro-gen, oxygen, or sulfur levels are relatively high, substantial levelsof more polar constituents are more likely to be present in the dieselfuel. Data for the CHNOS analyses are listed in Table 2. The level ofsulfur (.39 percent) determined at ORNL was in good agreement with thatprovided by the manufacturer (.34 percent). The hydrogen:carbon molarratio for the diesel fuel was 1.80. This is very close to what wouldbe predicted based on the manufacturers specification of 71 percentaliphatic hydrocarbons and 29 percent aromatic hydrocarbons.
TABLE 2. BULK ELEMENTAL ANALYSIS OF DIESEL FUEL
Element Mean Weight Per Cent
Carbon 86.8Hydrogen 13.05Nitrogen 0.01Oxygen (by difference) < 0.1Sulfur 0.388
Determination of the trace element content of the fuel was diffi-cult due to the predominantly hydrocarbon nature of the matrix.
Attempts to determine approximately 20 elements including aluminum,silver, calcium, chromium, copper, magnesium, nickel, and lead wereperformed using inductively coupled plasma (ICP). Results of thedeterminations indicated that the levels for all of these elements werebelow the limit of accurate determination of the ICP (apprpximately 1microgram per gram of fuel). Order-of-magnitude estimates of tracemetal content based on the ratio of the emission intensities of thefuel samples and fuel samples spiked to 1 ppm of the element inquestion yielded the data found on Table 3. These data suggested thatbarium, calcium, cadmium, copper and lead were at levels above .01 ppm.All other elements tested were less than 0.01 ppm.
A UV/visible spectral scan of the diesel fuel and dilute dieselfuel are portrayed in Figure 1. The fuel itself is a slightly paleyellow color. The absorption spectrum of the fuel had few distinguish-ing features other than a strong absorption band in the UV region.This suggested that the yellow color observed was not from a particularspecies absorbing blue light in the visible region but rather a resultof UV absorbtion tailing into the visible region. The diesel fueltended to darken upon standing in room light. This was manifested asan increase in absorption of the near UV region (see below).
-15-
"

ORNL-DWG 82-1663* 2.0
1.5
Uz40 1.0
0
0.5 -DIESEL FUEL,
VERY DILUTE
01 -
N700 600 500 400 300 200WAVELENGTH (nm)
Figure 1. Ultra-Violet and Visible Spectra of Neat and DilutedDiesel Fuel
-16-
W7~- -. . 1
'9
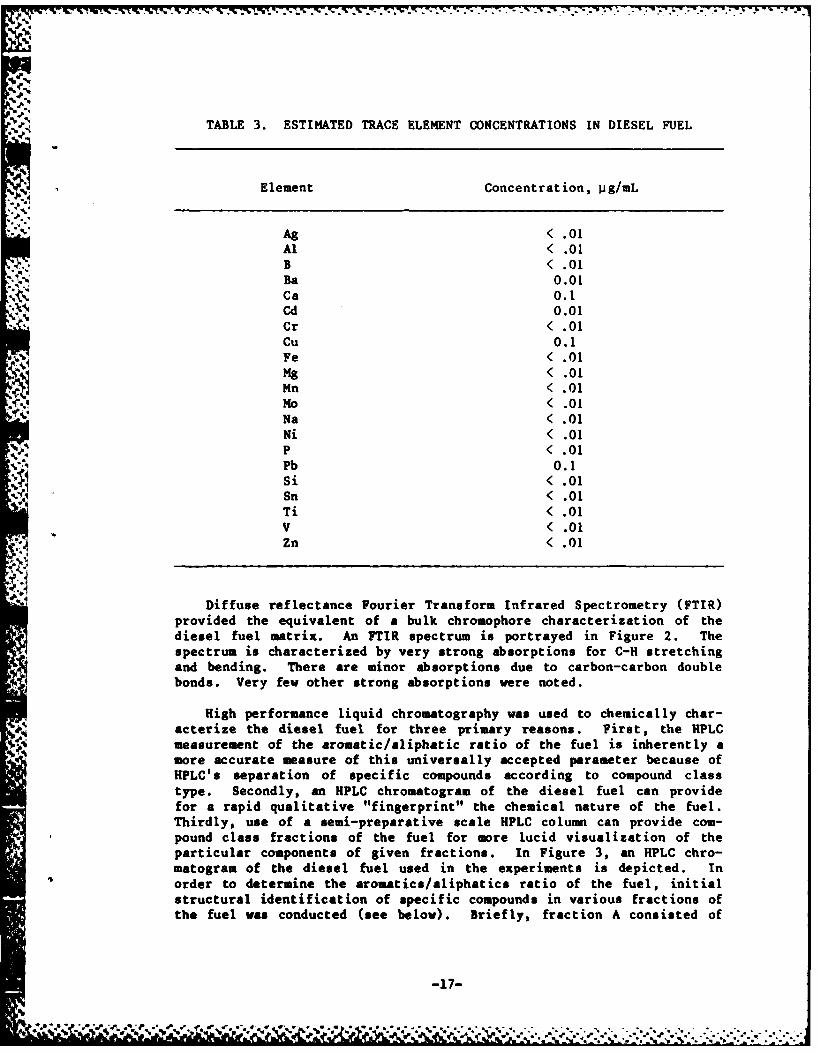
TABLE 3. ESTIMATED TRACE ELEMENT CONCENTRATIONS IN DIESEL FUEL
Element Concentration, jig/mL
Ag < .01Al < .01B < .01Ba 0.01Ca 0.1Cd 0.01Cr < .01Cu 0.1Fe < .01Mg < .01Nn < .01Mn < .01Na < .01Ni < .01P < .01Pb 0.1Si < .01
- Sn < .01Ti < .01V < .01Zn < .01
Diffuse reflectance Fourier Transform Infrared Spectrometry (FTIR)provided the equivalent of a bulk chromophore characterization of thediesel fuel matrix. An FTIR spectrum is portrayed in Figure 2. Thespectrum is characterized by very strong absorptions for C-H stretchingand bending. There are minor absorptions due to carbon-carbon doublebonds. Very few other strong absorptions were noted.
High performance liquid chromatography was used to chemically char-acterize the diesel fuel for three primary reasons. First, the HPLCmeasurement of the aromatic/aliphatic ratio of the fuel is inherently amore accurate measure of this universally accepted parameter because ofHPLC's separation of specific compounds according to compound classtype. Secondly, an HPLC chromatogram of the diesel fuel can providefor a rapid qualitative "fingerprint" the chemical nature of the fuel.Thirdly, use of a semi-preparative scale HPLC column can provide com-pound class fractions of the fuel for more lucid visualization of theparticular components of given fractions. In Figure 3, an HPLC chro-matogram of the diesel fuel used in the experiments is depicted. Inorder to determine the aromatics/aliphatics ratio of the fuel, initialstructural identification of specific compounds in various fractions ofthe fuel was conducted (see below). Briefly, fraction A consisted of
-17-
A - .* **. *N -.

00Z
0
coc
0
*14
400
.4-
44
-Jj~ AS~ ww iu
c
'-A

w-
I
R t II
a' U
IL
* Id
-1-
TIME -
- Figure 3. High Performance Liquid Chromatogram (HPLC) 'ith
Refractive Index Detection of Phillips #2 Diesel
Fuel"
, -19-
... iq F r F ... k _ .. ,r, .. :.... . . . .
' = - ==

[%.
straight and branched chain hydrocarbons. Fractions B, C, and D con-tained predominantly one, two, and three ring aromatics, respectively.Because of differences in specific refractive indices among variousfuel constituents, standardization with compounds similar to thosefound in the fuel had to be performed. This was accomplished by choos-ing standard compounds which had specific refractive indices close tothose of the constituents in each of the four major compound classeswithin the fuel. The compounds chosen for the standardization includeddodecane, toluene, napthalene, and 3,6-dimethylphenanthrene. Theproportion of aromatic compounds in the fuel determined by this proce-dure yielded values very close to those obtained by independev: tests(29.3 percent aromatics by HPLC at ORNL versus 30.5 percent by analysissupplied with the fuel). The aromatic fractions B, C, and D made upapproximately 16, 12, and 2 percent (by weight) of the fuel, respec-tively.
As stated previously, HPLC can provide for a rapid qualitative com-parison of the differences among various fuels being tested. For exam-ple, Figure 4 compares the HPLC chromatograms of two fuels examinedduring these experiments. The diesel fuel labeled VEESS was that sam-pled during a field exercise at Smoke Week III. Comparison of the twochromatograms indicates that, even with this relatively crude approach,differences among the fuels can be clearly seen.
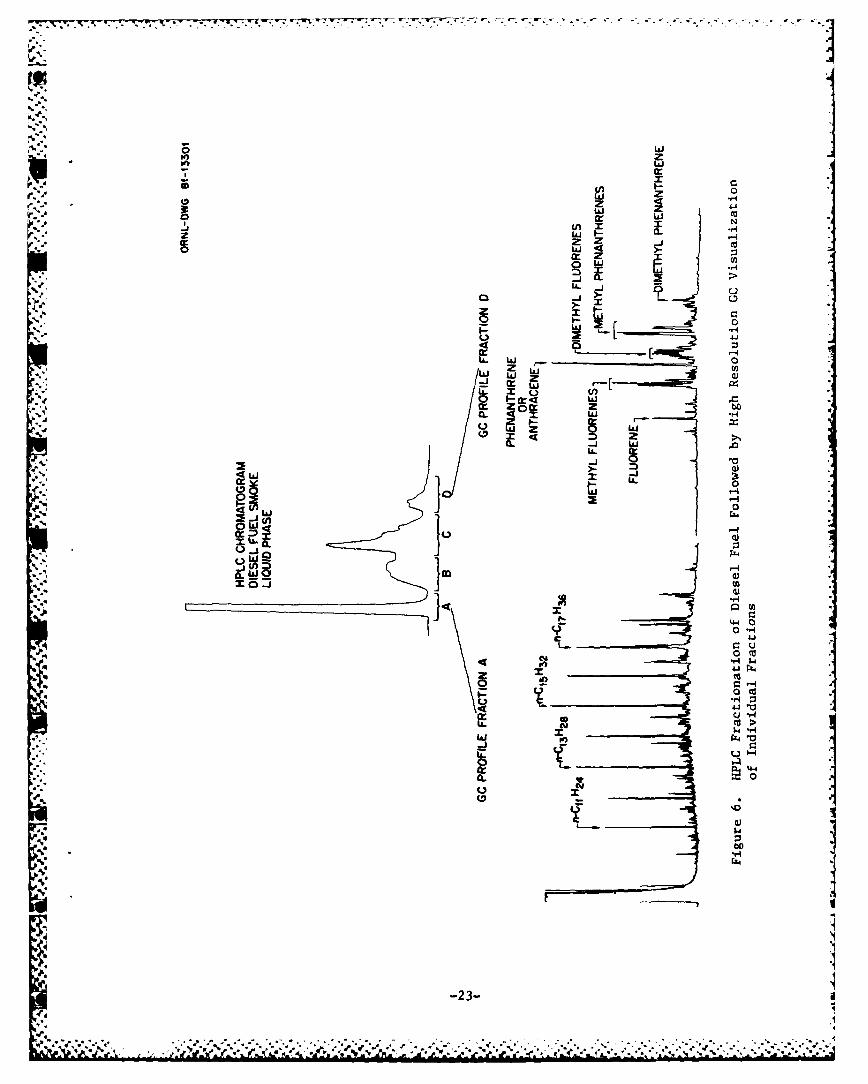
Because of the considerable complexity of the diesel fuel matrix,even high resolution gas chromatography on a fused silica capillarycolumn can be insufficient for determining important but minor constit-uents in the fuel. For example, Figure 5 is a high resolution gaschromatogram of the diesel fuel. The predominant peaks in the chromat-ogram are the straight chain saturated hydrocarbons. However, it isclear that other constituents are present in smaller but significantamounts. In order to more lucidly visualize other, non-saturatedhydrocarbons, the fuel was subjected to a tiered analytical scheme. Inthis case, the diesel fuel is first separated into class fractions bysemi-preparative scale HPLC. The specific HPLC fractions werecollected and reduced in volume to approximately 500 microliters in amanner so as to prevent loss of the more volatile constituents. Analiquot of the fuel fraction concentrate was then subjected to highresolution gas chromatographic separation. This is portrayed in Figure6.
pFigure 7 is a high resolution gas chromatogram of fraction A ofthe fuel. The most predominant peaks in the fraction - the straightchain saturated hydrocarbons - were identified using high resolutionGC/MS and comparison of retention times of authentic standard com-pounds. The remaining constituents were tentatively identified asbranched chain hydrocarbons. However, because of the similarity of themolecular fragmentation patterns, it was not possible to unambiguouslyidentify other specific constituents within the fraction. Table 4lists concentrations of the straight chain hydrocarbons in the fuelfraction A. Concentrations ranged upward to approximately 10 to 12milligrams of n-C17 H3 6 per gram of fuel. Comparison of peak
-20-
' + -f **. = ,. .. *5. * .* ' -. " , "-. '

S.0 cn . .p
C~Cl)
IIi
(4 (0 I Pa.3
00ob 0
0 0n-Id
S CH
0r) .
44a.0 4
44
0
4X30NI3AIIO 1.33
-21-

.- '
-. U
0k '-
- C)
- '. 1,. '-o
00 I A,
InI
.'- 0
-4
04 vz
-- 2-
%. ... . .- - - . . --. - .. ...- . , .. -.. -, 0 ,. - . . ,4, - . -NJ. .. - . • ".
"w" " '"" ''" "*"" " "'". "".4*4, ' 4J ' " " ' ' '- " "• .' , . . : " ",- " -, .- , - -' " ". , ","I
" ". , 'nP" ' "b
- LL)
h ir 0a
cn N
0 w r. 0
iE
P0
4wr
J 0JLii wZ(fl 10Liq -I
r( QiicZ L~m z bIL. Xj
S, 1LL03
-j4
9--0-
.1.~
U ILi
Uwa
'0
0 c'4 -
'4'4.
cu >
-23-
eA.-4Z

6*j
4*4
Iz
I 0y -
Ia.
0Y
0N 0 W
0
1-4010
U-11
U N 0
4
.S.
-24-4
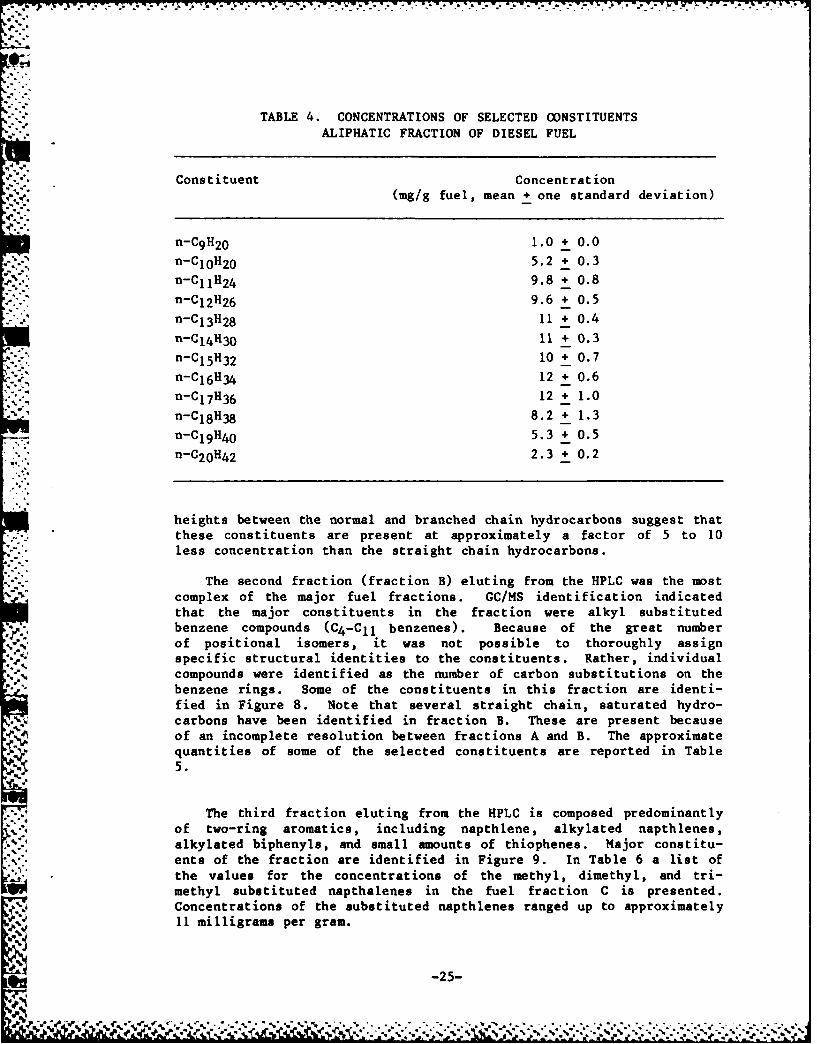
TABLE 4. CONCENTRATIONS OF SELECTED CONSTITUENTS*, ALIPHATIC FRACTION OF DIESEL FUEL
Constituent Concentrat ion
(mg/g fuel, mean + one standard deviation)
n-C 9 H2 0 1.0 + 0.0.n-l0H20 5.2 + 0.3
n-C1 .H 2 4 9.8 + 0.8n-C 1 2H26 9.6 + 0.5
n-C 1 3H28 11 + 0.4
n-C 1 41H3 0 11 + 0.3n-C 1 5 H3 2 10 + 0.7
n-Cl6H34 12 + 0.6n-C17H36 12 + 1.0
n-C18H38 8.2 + 1.3
. n-Cl9 H40 5.3 + 0.5
* ." n-C 20 H4 2 2.3 + 0.2
heights between the normal and branched chain hydrocarbons suggest thatthese constituents are present at approximately a factor of 5 to 10less concentration than the straight chain hydrocarbons.
The second fraction (fraction B) eluting from the HPLC was the mostcomplex of the major fuel fractions. GC/MS identification indicatedthat the major constituents in the fraction were alkyl substitutedbenzene compounds (C4-Cll benzenes). Because of the great numberof positional isomers, it was not possible to thoroughly assignspecific structural identities to the constituents. Rather, individualcompounds were identified as the number of carbon substitutions on thebenzene rings. Some of the constituents in this fraction are identi-fied in Figure 8. Note that several straight chain, saturated hydro-carbons have been identified in fraction B. These are present becauseof an incomplete resolution between fractions A and B. The approximatequantities of some of the selected constituents are reported in Table5.
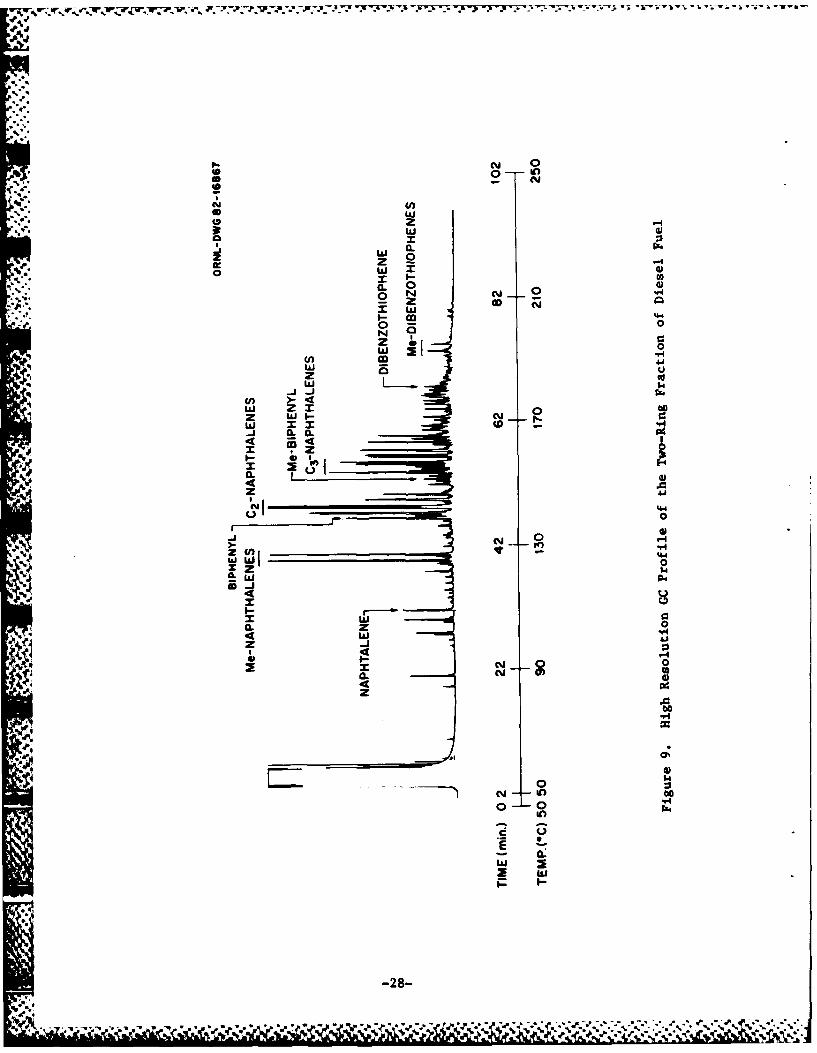
The third fraction eluting from the HPLC is composed predominantlyof two-ring aromatics, including napthlene, alkylated napthlenes,alkylated biphenyls, and small amounts of thiophenes. Major constitu-
ents of the fraction are identified in Figure 9. In Table 6 a list of
.3 the values for the concentrations of the methyl, dimethyl, and tri-methyl substituted napthalenes in the fuel fraction C is presented.Concentrations of the substituted napthlenes ranged up to approximately11 milligrams per gram.
-25-

I...
TABLE 5. CONCENTRATIONS OF SELECTED CONSTITUENTSONE-RING FRACTION OF DIESEL FUEL JI
Concentrat ionConstituent Retention Time, Mina (mg/g fuel,
mean + one standard dev)
IC4 -Benzene 19.1 2.5 + 0.3C5-Benzene 30.1 1.8 + 0.2C6 -Benzene 37.6 1.2 + 0.2C 7-Benzene 41.5 1.0 + 0.2C8-Benzene 50.2 1.2 + 0.4C8-Benzene 52.4 0.5 + 0.3
aSee Figure 8
TABLE 6. CONCENTRATIONS OF SELECTED CONSTITUENTS
TWO-RING FRACTION OF DIESEL FUEL
..5
ConcentrationConstituent Retention Time, Mina (mg/g fuel,
mean + one standard dev)
Naphthalene 31.3 1.3 + 0.5Methyl Naphthalene 39.2 9.1 + 1.2Methyl Naphthalene 40.3 5.7 + 0.8C2 Naphthalene 46.1 4.7 + 0.8C2 Naphthalene 46.9 4.8 + 0.9C2 Naphthalene 47.8 11.0 + 1.8C2 Naphthalene 49.0 5.8 + 1.5C3 Naphthalene 56.3 2.9 + 0.5C3 Naphthalene 57.1 3.1 + 0.3
aSee Figure 9
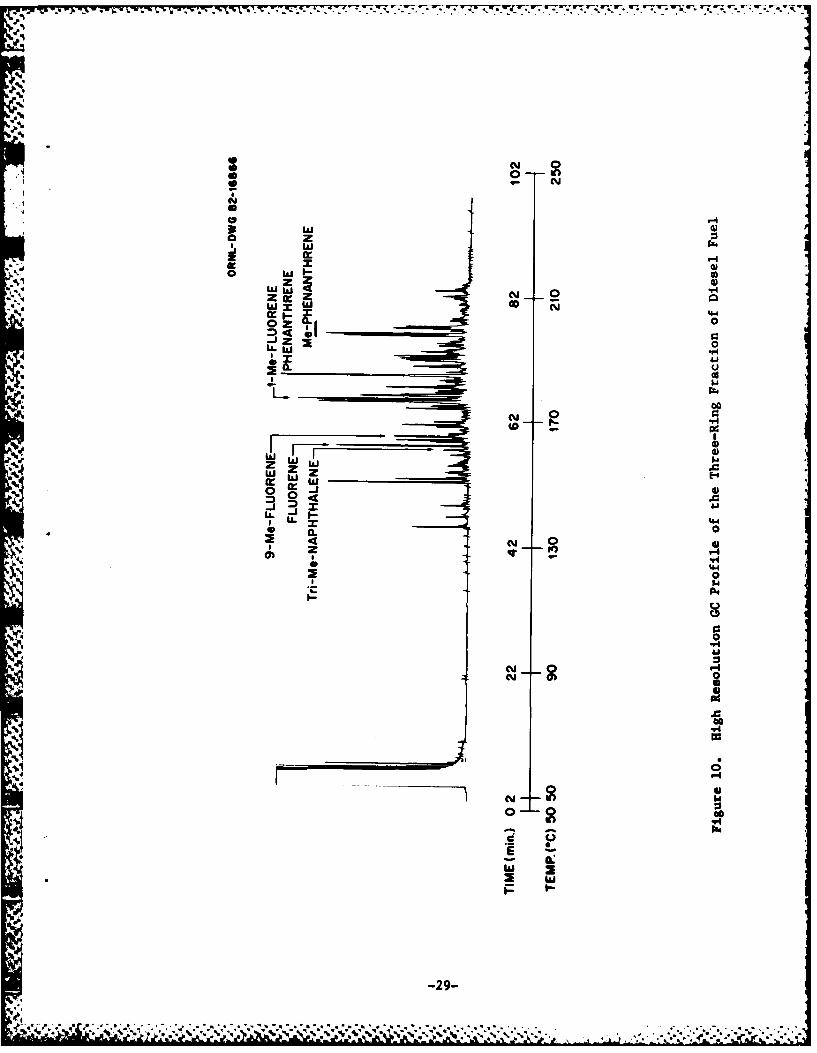
Figure 10 is a high resolution gas chromatogram of the D fractionof the diesel fuel. Major constituents in this fraction include fluor-
ene, alkylated fluorenes, phenanthrene, and alkylated phenanthrenes.Traces of multi-substituted alkyl naphthalenes were also present due tothe incomplete resolution of fractions C and D of the fuel. In Table 7the concentration of some selected compounds in fraction D are listed.In this case, phenanthrene was present in the highest concentration:approximately 4.9 micrograms per milligram fuel.
-26-
NIJ°

0 (YI.S -o
0
N 0D -4
00 04OD 0
0
44
20 CY -4
z 0
z 4m0
N 0 xz0
z doUJJ
w z 0LL4J
w -,o
oo .91~0
w0z-
wU
ci 0
E -0
- abe
-27-
N 0
Ia.
w 0
a z
4. OD
1*.z 0.0@
hi I-4
z
w 0 x4 00
IL al
4 ~
. V4@
xZ $
CL 0
w "4
WILI 0
V.4
0 001.4 42
CL:'
-28-
v1-
F3-k I.
wwzz
de 00 0
oz 0
z 0
oCY)
I~
00
N0
0.
LA. .0I-
4 C. 0
I 6c 4
'4 '40
04
0
9' V4
0.V14
-.1I
0S.,
6-
-29-
.011L . ..
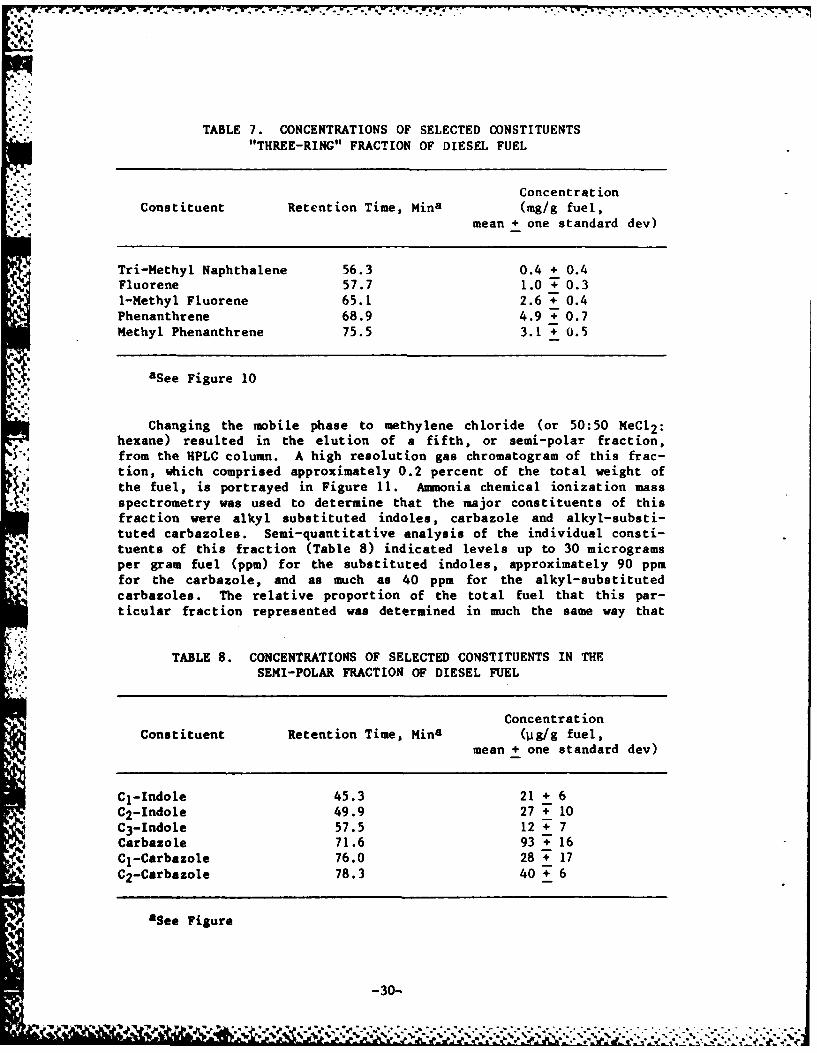
TABLE 7. CONCENTRATIONS OF SELECTED CONSTITUENTS"THREE-RING" FRACTION OF DIESEL FUEL
"" " ConcentrationConstituent Retention Time, Mina (mg/g fuel,
mean + one standard dev)
Tri-Methyl Naphthalene 56.3 0.4 + 0.4Fluorene 57.7 1.0 + 0.31-Methyl Fluorene 65.1 2.6 + 0.4Phenanthrene 68.9 4.9 + 0.7Methyl Phenanthrene 75.5 3.1 + 0.5
aSee Figure 10
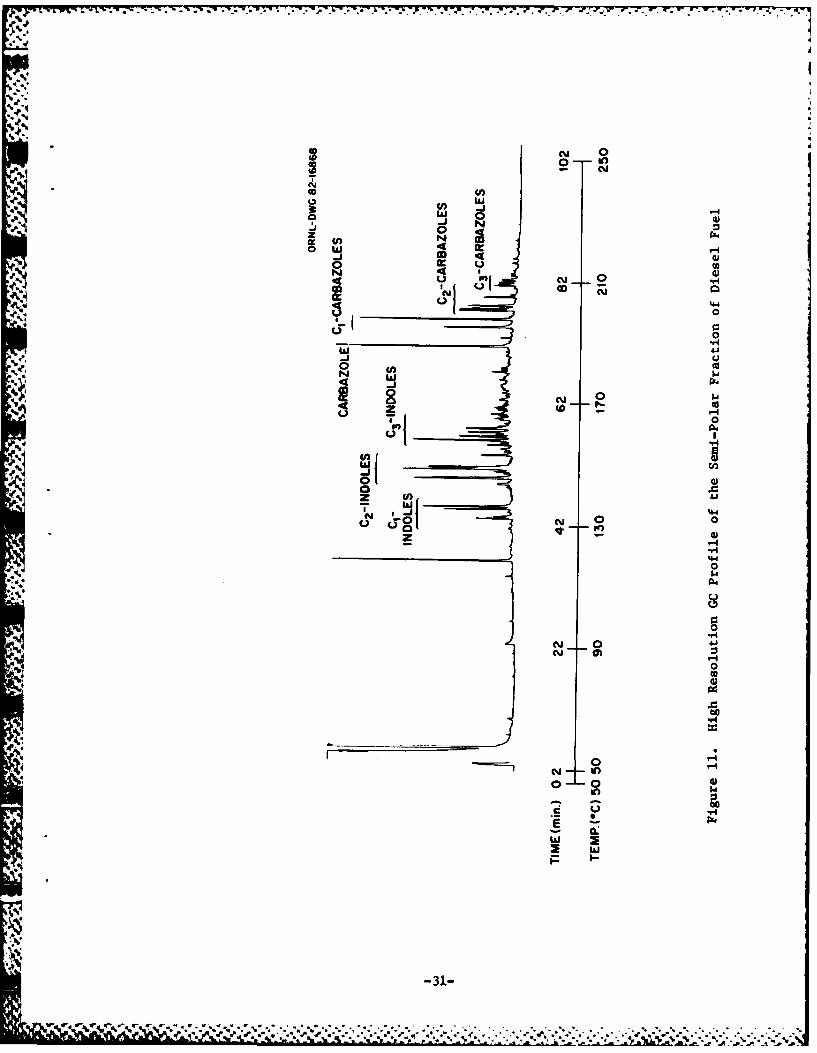
Changing the mobile phase to methylene chloride (or 50:50 MeC1 2 :hexane) resulted in the elution of a fifth, or semi-polar fraction,
, 4 from the HPLC column. A high resolution gas chromatogram of this frac-tion, which comprised approximately 0.2 percent of the total weight ofthe fuel, is portrayed in Figure 11. Ammaonia chemical ionization massspectrometry was used to determine that the major constituents of thisfraction were alkyl substituted indoles, carbazole and alkyl-substi-tuted carbazoles. Semi-quantitative analysis of the individual consti-tuents of this fraction (Table 8) indicated levels up to 30 microgramsper gram fuel (ppm) for the substituted indoles, approximately 90 ppmfor the carbazole, and as much as 40 ppm for the alkyl-substitutedcarbazoles. The relative proportion of the total fuel that this par-ticular fraction represented was determined in much the same way that
TABLE 8. CONCENTRATIONS OF SELECTED CONSTITUENTS IN THESEMI-POLAR FRACTION OF DIESEL FUEL
ConcentrationConstituent Retention Time, Mina (pg/g fuel,
mean + one standard dev)
Cl-Indole 45.3 21 + 6C2-Indole 49.9 27 + 10C3-Indole 57.5 12 + 7Carbazole 71.6 93 + 16Cl-Carbazole 76.0 28 _ 17C2-Carbazole 78.3 40 + 6
aSee Figure
-30-
NO
0-
Ii -4
z0ow co 49
0 q 00
4 ct
N 4
0 0
* 0
00
u 404
0
U)4
00
44
i~ 0"4
0
'44
0- 0"4
P4
ILA
the aromatics/aliphatics ratio was determined for the bulk of the fuel.
That is, the area ratio of the particular fraction to that of the knownweight of compounds which were major constituents of that fraction wasdetermined.
BaP analyses of the diesel fuels used in these studies yieldedvalues of 41, 102, and 72 nanograms per ml fuel. The average level of72 nanograms per mL is similar to, but somewhat larger than, the aver-age of 26 nanograms per milliliter which is reported in the FranklinInstitute's literature review of diesel fuel toxicity.4 The 72nanogram per mL average is considerably lower than the 1-5 microgramsper mL typically found in petroleum crude oils. 2
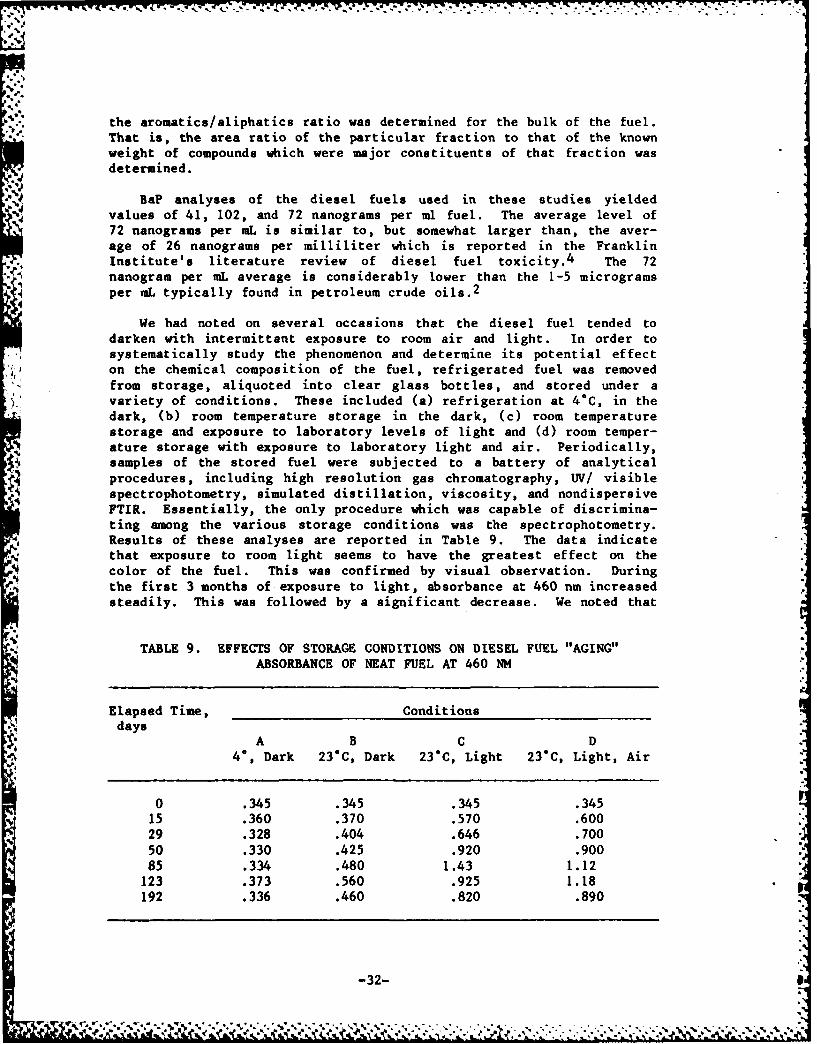
We had noted on several occasions that the diesel fuel tended todarken with intermittant exposure to room air and light. In order tosystematically study the phenomenon and determine its potential effecton the chemical composition of the fuel, refrigerated fuel was removedfrom storage, aliquoted into clear glass bottles, and stored under avariety of conditions. These included (a) refrigeration at 4C, in thedark, (b) room temperature storage in the dark, (c) room temperaturestorage and exposure to laboratory levels of light and (d) room temper-ature storage with exposure to laboratory light and air. Periodically,samples of the stored fuel were subjected to a battery of analyticalprocedures, including high resolution gas chromatography, IV/ visiblespectrophotometry, simulated distillation, viscosity, and nondispersiveFTIR. Essentially, the only procedure which was capable of discrimina-ting among the various storage conditions was the spectrophotometry.Results of these analyses are reported in Table 9. The data indicatethat exposure to room light seems to have the greatest effect on thecolor of the fuel. This was confirmed by visual observation. During
4 the first 3 months of exposure to light, absorbance at 460 nm increasedsteadily. This was followed by a significant decrease. We noted that
TABLE 9. EFFECTS OF STORAGE CONDITIONS ON DIESEL FUEL "AGING'ABSORBANCE OF NEAT FUEL AT 460 NM
Elapsed Time, Conditionsdays
A B C D4", Dark 23"C, Dark 230C, Light 23"C, Light, Air
0 .345 .345 .345 .34515 .360 .370 .570 .60029 .328 .404 .646 .70050 .330 .425 .920 .90085 .334 .480 1.43 1.12
123 .373 .560 .925 1.18192 .336 .460 .820 .890
-32- ,
Ie a- )

7.W' W... 7 .- - -- 6. W
during the course of the tests a dark amber, waxy sediment formed inthe bottles exposed to light. We speculate that the rise and
subsequent decrease in absorbance was partially due to formation of theamber substance in suspension in the fuel, followed by its eventualprecipitation. The source of the color change is unknown, but we have
noted that solutions of indole standards tend to turn yellow with
continued exposure to light.
PHYSICAL CHARACTERIZATION OF THE DIESEL FUEL SMOKE:PARTICLE SIZE DISTRIBUTION
".."
INTRODUCTION
It is well accepted that the pattern of aerosol deposition in the
.. respiratory system of animals is a function of the sizes of theparticles inhaled and that the size and point of deposition mayinfluence toxicological results. Particle size distributions are not
5' only dependent on the method of generation, but also on the time
elapsed from formation to sampling, with the rate of growth beingconcentration-dependent. The diesel fuel aerosol has been studied atsufficiently high concentrations so that it was to be expected that
particle sizes would change appreciably as a function of chamberconcentration. In this section, the results that were obtained in the
toxicology chambers both with and without animals present are
reported.
o "METHODS
-* The results presented here were all obtained by cascade impactiontechniques. A simple seven stage impactor of Mercer/Lovelace design5
was used. Each stage has a single cylindrical jet. The aerosol
impinges on glass microscope cover slips where it is collected foranalysis. Particles escaping the final stage were collected on a small
.. glass-fiber 'absolute' filter. The impactor was designed for flow
rates of one liter per minute. Uniform flows were maintained usingflow-controlled sampling pumps set at 1.00 L/m. These pumps werefrequently calibrated using soap-bubble meters.
.
In the course of this investigation two techniques were used tomeasure the amount of diesel fuel that was collected on each stage.Most used was a chromatographic technique. Inmediately after sampling,
each glass stage plate and the filter were transferred to small glassbottles. A known amount (usually 2 mL) of carbon disulfide was addedto dissolve the fuel particulates. A small aliquot (10 1L) was injec-
ted into a short chromatographic column operating at constant tempera-ture. A flame ionization detector was used to detect the fuel vaporscoming through the column. Chromatographic conditions are listed in
Table 10.
The conditions were such that all of the components of the fuel
passed through the system in about three minutes. The amount of fuel
-33-

TABLE 10. CONDITIONS FOR RAPID CHROMATOGRAPHIC ANALYSIS OF
DIESEL FUEL SMOKE PARTICLES FROM CASCAUE IMPACTION STAGES
Column: 1/4" o.d. x 18" stainless steel packed with 5Y SP 2100on 100-120 mesh Supelcoport
Injector Temperature: 250CDetector and Temperature: Flame ionization at 350C
Carrier Gas: HeliumFlow Rate: 40 mL per minute
particles in each solution (and hence on each stage) was determined by
time integration of the signal. An LSI-11 MINC (Digital Equipment Co.)
computer equipped with an analog-to-digital converter was used to col-lect and process the data. Occasionally, samples of pure diesel fuel
at known concentrations were run to assess the sensitivity of the sys-
tern, but it should be noted that only relative quantities were used in
the impactor calculations of size and distribution. Carbon disulfide(CS2 ) was used as a solvent because of its very weak flame ionization
response. CS2 response was separately measured for each run and
these blank values were subtracted from sample responses.
The above technique was developed because of our inability todirectly weigh the with sufficient precision the amount of fuel on each
stage. Near the end of the investiation, it was found that, if theplates were properly cleaned and carefully handled, direct weighing
could be accomplished to a precision of about 0.1 mg. With this
precision, direct weighing was finally used rather than the morecumbersome chromatographic technique.
' DATA REDUCTION
Cascade impactor stage constants have not been determined experi-mentally, but were calculated based on measured orifice diameters usingthe formalism developed by Marple 6 and Marple and Liu.7 Each stage
can be characterized by a dimensionless Stokes number (S) given byS pCVD2 (1)
9VW
where p is the particle density (g/mL)V is the air velocity through the orifice (cm/sec)D is the (Stokes) particle diameterp is the viscosity of airW is the orifice diameter
and C is the Cunningham correction factor defined as
0.16 0.055 [DPC 1 + - + - exp '.5 (2)
P DP
-34-
5fix

As shown by Marple, the collection efficiency curve for each stageneed not be determined experimentally, but depends on the Stokes numberof the stage. The 50 percent efficiency point for the stages comes atS - 0.49 for the cylindrical jet impactors used here. 8 Noting thatthe volumetric flow rate Q is related to the air velocity and orificediameter by
(3)
Eq. 1, rearranged, becomes
3 1\/2u9"TW
D, D50 (4 )
50 V 50 ) 4Q/
where D50 is the diameter corresponding to the 50 percent collec-tion efficiency point. With this assignment, all terms on the rightare defined and one can calculate the 50 percent cutoff point for each
stage (D50 ) and C by graphical or iterative solutions of equations2 and 4. For this work a BASIC program to solve them iteratively hasbeen written (Appendix). Data for our impactor specific to diesel fuelaerosol of density - 0.87 g/mL and a flow rate of 1 liter per minuteare contained in Table 11.
-'s TABLE 11. STAGE CONSTANTS FOR CIRCULAR JET IMPACTORS
Flow Rate 1 1000 mL/min. Particle Density - 0.87 g/mL
JET DIAMETERS PRESSURE STOKES AERODYNAMICIn. Cm. Atm. Diam. Cunn. Cor. Diam. Cunn. Cor.
0.930 0.2362 1.000 5.205 1.0307 4.850 1.03300.0700 0.1778 1.000 3.372 1.0475 3.140 1.05100.0560 0.1422 1.000 2.390 1.0669 2.224 1.07190.0480 0.1219 1.000 1.881 1.0851 1.749 1.09150.0380 0.0965 1.000 1.303 1.1228 1.210 1.13230.0270 0.0686 1.000 0.750 1.2137 0.695 1.23100.0170 0.0432 1.000 0.338 1.4899 0.311 1.5373
Particle size data reported here are summarized in terms of themass median diameter and the geometric standard deviation for each run.An analysis of a typical run is shown in Table 12 and Figure 12 and arediscussed to indicate the limitations of the method. The details ofthe stage analyses are shown in Table 12. In Figure 12, the cumulativepercent of material less than a given diameter (column 6 of Table 12)is plotted using normal probability coordinates vs. the logarithm ofthe diameter (column 2). In this construct, a particle size distribu-tion that is logarithmic-normal would plot as a straight line. The
-35-
P% Ji.
warn 99.9 -
. 99.0-
CD
-.1 95.0-
:' .. :M: 4 - 0.0 -
i . ";.ri 20 0 -
:.., 170.0-
- ~E 5Ji6.01-
(U-u 90.0-
0.5-
.4
;"7-a. 00
'4. .2 .3.456w8 30.0 .. 6 8
-36-
. . ,.2. , .. . 6 .. 2.. ... .10

TABLE 12. PARTICLE SIZE DATA FROM TYPICAL CASCADE IMPACTOR RUN
Areab Percentd Wt. Percent of
Stage of GC Areac on each particles less
Stage Diama Response -Blank Stage than D
Pm units units % %
1 5.21 221 0 0 1002 3.37 201 0 0 100
3 2.39 213 0 0 1004 1.88 310 70 .6 99.45 1.30 2507 2277 18.6 80.8
6 0.75 6690 6760 55.1 25.77 0.34 3312 3082 25.1 .6
F -- 304 74 .6
aStage constants in pm from Table 11.bTotal area under GC response curve. Units are arbitrary.
cArea after subtracting CS2 blank response of 230. Propor-
tional to amount of DF2 oil each stage. Approximate proportional-ity relation is: mg DF2 = Area * 5 x 10⁻⁴ .
dNote that total area of first three stages is less than measuredblank response and is assigned as zero. This is a consequence of
variability of experimental responses.
mass median diameter is the intercept of the 50 percent line (regard-
less of distribution type). The geometric standard deviation is calcu-
lated from the slope of the line. As can be seen from the table and
figure, only three stages had appreciable amounts of material on them;the influence of the blank severely limited the precision to whichamounts on other stages could be determined. Furthermore, these three
data points translate to only two well determined points on the plot.
Thus, cascade impaction techniques as used here give few reliable data
as to the detailed shape of the distribution; we assume lognormality
for simplicity of discussion. Valid data are obtained for the massmedian diameters. The conclusions we draw from the example shown here
are quite general for all of the data obtained. Fundamentally, it is a
consequence of the low polydispersity (small geometric standarddeviation) of aerosols of this type (see reference 9 for a discussionof similar highly concentrated condensation aerosol). The lower the
polydispersity, the higher the resolution required to determine details
of the distribution. This technique for estimating the mass mediandiameters is graphical, as indicated in Figure 12. A "best fit"straight line is drawn through the data points, subjectively weighting
those points derived from stages containing larger amounts of material
-37-
J ~~~~.. . . . .. . . . . ...-. - •, ,.... ••. .o. .. . . .. . ,. . . . . . . . .

..4
most heavily. We thus interpolate the best data to the 50 percent masspoint. The slope from which we derived the geometric standard devia-tion is perhaps more uncertain, but inasmuch as throughout the investi-gation we have seen no major deviations from a value of 1.4, theresults are quite adequate for the intended purposes.
RESULTS AND DISCUSSION
* .The aerosol generation facilities and the chambers used for thetoxicology studies have been previously described1 0 , as have some
of the inhalation toxicology experiments.1 1 Particle size datataken from these chambers during the course of the toxicology study aretabulated in Table 13. Usually, impactor samples were taken fromchamber ports just above the top shelf of animal cages (top) and justbelow the bottom shelf (bottom). It can be noted from Table 13 thatthe particle diameters at the bottom port are usually slightly greater
(ca. 0.2 pm) than at the top. This is a consequence of particle growthand is particularly evident at the higher concentrations. The aerosolis flowing through the chambers approximately laminarly.10 Thechamber volume subtended by the sampling ports was approximately one
cubic meter. At the volumetric flow rate used (420 L/min), two andone-half minutes are required for the aerosol to flow from top tobottom. This time is sufficiently long that some coagulation growth is
to be expected.
The chamber particle size data are summarized in Figure 13, where
the averages of the top and bottom measurements are plotted against theaerosol concentration. An arbitrary straight line has been drawnthrough the points to emphasize the trend toward increased size withconcentration. Particle growth theory would certainly predict a non-linear curve, but, in view of the data scatter, no attempt has beenmade to refine the curve. Points are plotted distinguishing size meas-urements in chambers with and without the presence of animals. It canbe seen that no large or significant difference in size distribution
was seen in chambers with or without animals present.
CHEMICAL CHARACTERIZATION OF THE DIESEL FUEL SMOKE
INTRODUCTION
The generation of the diesel fuel smoke for this study has beendescribed elsewhere.1 0 Briefly, the diesel fuel is injected onto aVycor glass heater held at 600°C. The vaporized fuel is then sweptinto a stream of air with nitrogen carrier gas. Upon contacting thecooler dilution air, the diesel fuel condenses and forms the smokecloud, which is in turn swept into an animal exposure chamber. Thesingle greatest effect of the high temperature aerosolization procedureis to partition the components of the diesel fuel between the vapor andliquid phases. Because the smoke is relatively concentrated andpresent as a two phase (liquid and vapor) system, the sampling and
i-38-rl, y ' n ., ., .i, ., .... .. ... ... , .: ,,:,t ,L.. P.,... a Y A A U'" 19" 1j.- %t" ', " - -,*. .. . . -. " i-.. -, " .. - '- . ' ."

*.410 0
4180 .cc 41 %0 .2 - 4r -* 4t - It en 'T C c5 '4 IT m '4 M4 M 4C
0 c0)-41
0n 0J~ e1% cn MC-I0 !%o LA.co--14 0 C14 r- . O Z r.00 r- co 0000% 0%00%0 C 0 0 cr f- c~o 0a%
0z Vw- 4.8 - Te D r TU) 0 - 0C1TC
0.-
.4U'
00
00 0 0 0 0 0 0 0 0 0.4 4. 81 4 411 4 4.8 4. 41 4.1 418 48
0 0.b 41 C64 0.1 ~ 0. " 04 41 ".4 A 046..80 0.404 0 0 0 0 00 0 0 00 O's 0 0 00 0 00 0
41 4 1 .0 4041 a 41 .0 41 .0 4 1 .04.8.0 41 ,03..0
rz"4 1. 0b W w*. 4.8 0 4 1 ~ .44.8 41
1-4 4. 0 Cd co
r.4 00 000 -4Cu -41 -4t c f0 N '
0)
-4
-44-
0 - 4 - 4 - 4 - 4 - 4
4.1 '4 Le) 0% 0(0 -44 0 -
0 0 C
-39- '

V 01
0 >.
'I1
Ud 0
$- 4 0% - q cn -4 -4 0 4- C44 r.. 4 -4 -4
0~. -00 0 0r- ~0 0*~ 0
04 09 0 0 0 0 0 0 0 0 0 0
E-4
41
0 4D' co 00 00 OD
*0 0 0 0 00 00 0
0.8 0 0 0 0 0 0 0
040
'-F NN*N CV

.ORNL DWG 83-1B139
44-
.,
4''
:2 S
4, --- "
0
Ea
4-) *1 M
'0a) [D No Animals
in 0~ With Animals
0 a.
Aerosol Concentration (mg/L)
Figure 13. Particle Sizes of Diesel Fuel Smoke in InhalationExposure Chambers

•p analytical procedures must be designed such that the distribution of Athe chemical constituents between the two phases is not altered signif-icantly.
METHODS
Samples of the diesel fuel smoke particle phase were collected onstandard 45-mm Cambridge glass fiber filter pads 12 by drawing aknown volume of the smoke through the pad with constant flow samplingpumps. The weight gain of the filter pad was then related to thevolume of sample as the weight of smoke particulates per unit volume.Sampling flows of 2 L per minute or less were employed to minimize
Npossible evaporation of collected particles or reentrainment of thoseparticles into the sampling stream.
Because of the limited capacity of the adsorptive resins, samplingof the diesel fuel smoke for vapor phase constituents had to be per-formed somewhat differently than that for the particle phase sampling.In the former case, approximately 30 cc of the filtered smoke vapor wasdrawn with either a hand syringe or an infusion pump very slowly (I ccper minute) through a glass tube containing 1.8 mL of Tenax GC® . Foranalysis, the TenaxO was desorbed at 250*C with helium purging for 10min onto a nickel capillary precolumn cooled in liquid nitrogen. Theprecolumn was then attached to the primary GC column (60 m OV-101-coated glass capillary) and chromatographed by removing the liquidnitrogen and temperature-programming from 50*C to 180C at 2* perminute.
Depending on the particular analytical scheme, particle phase sam-ples were extracted from the Cambridge filter pads with either"distilled-in-glass" grade hexane or methylene chloride. The extractswere then reduced in volume to approximately 500 microliters andhandled in much the same way as Lhe fuel samples described above forHPLC and GC analysis.
Decachlorobiphenyl (DCBP) was determined gas chromatographicallywith electron capture detection on a I m x 6 mm o.d. 10 percent OV-1 on80-100 mesh Chromosorb G-HP column. Column temperature was 220,injector temperature was 2500, the detector was held at 3008.
One method of determining quantities of whole smoke or vapor phasein a given volume of smoke involved drawing a known amount of smoke in-to an evacuated 300-cc bulb. If vapor phase analysis was to be per-formed, the smoke was filtered immediately upstream of the bulb. Forwhole smoke analysis, the smoke was drawn, unfiltered, directly intothe bulb. Next, 5 mL of carbon disulfide (CS2) solvent was added tothe bulb in order to dissolve the smoke constituents. After chillingof the bulb in a freezer (to aid in dissolution of smoke vapors intothe CS2), the bulb was warmed to room temperature. The carbondisulfide solution was removed and an aliquot injected into the GC.
The same quantitation procedures used to determine the particulates
-42-
a- . J-

collected on the cascade impactor stages (see above) were used todetermine the amount of smoke present in the bulb.
Another method for determining the quantity of vapor phase in agiven smoke volume employed carbon molecular sieves. Personal airsampling pumps calibrated to operate at low flow rates were used topull one-liter volume samples over a 7- to 12-minute time interval.Cambridge holderz and filters, used to trap the particulate phase, wereplaced directly in the chamber to assure temperature equilibration andprevent condensation of species of the vapor phase prior to the vaportraps. One-fourth-inch o.d. x three-inch-long cartridges containing175 mg Spherocarb*, a carbon molecular sieve, were used to collect thevapor phase. This material has been previously shown to retain lowmolecular weight constituents. Some samples were drawn with cartridges
in series to assure that that breakthrough did not occur. Followingcollection, the vapor phase constituents were thermally desorbed fromthe cartridges at 350"C in the injection port of a gas chromatographand retrapped in a precolumn immersed in liquid N2. The precolumnserved to introduce the sample as a narrow plug onto the analyticalcolumn which minimized peak broadening and facilitated quantitation.Since an estimate of the total vapor phase concentration was desired,
4the sample was chromatographed on a low resolution column packed withuncoated glass beads. Peak areas were integrated and compared to thoseareas obtained from direct injection of a liquid "standard" ontoSpherocarb® cartridges. The standard was a distilled fraction ofdiesel fuel taken up to 235°C at atmospheric pressure. This fractionwas chosen because previous high resolution chromatograms of the vaporphase showed that tridecane was the highest boiling major hydrocarbon
present in the vapor phase.
Carbonyls in whole smoke were determined by the method of Manningand Maskarinec. 13 Carbon monoxide (CO) determinations were madewith an electrochemical CO analyzer (Ecolyzer, Erergetics Sciences,Tnc.). In order to perform carbon monoxide analyses on filtered smoke,it was necessary to remove organic vapor phase constituents, whichinterfered with the analysis, from the smoke. This was accomplished byadding a small glass tube, containing approximately 2 cc of Tenax and2 cc of activated charcoal, upstream of the Ecolyzer. Oxides ofnitrogen (NOx) analyses were performed by means of a Beckman Model951 NOx Chemiluminescent Analyzer using the same organic vapor trapas that used for the CO analyses. Determination of constituents in thenitrogen carrier gas was performed by mass spectrometry. Hydrogencyanide in the whole smoke was determined by collecting the smoke on aCambridge filter backed by a silica gel trap. The filter and trap werecombined and analyzed according to the method of Collins et al. 14
RESULTS AND DISCUSSION
Analysis of the nitrogen carrier gas used to generate the smokeaerosol was performed in order to insure that a significant amount of
-43-

the fuel would not be combusted by traces of oxygen present in thecarrier gas during the aerosolization process. Results of the carriergas analyses are found in Table 14. The data indicate only very minortraces of other gaseous constituents present in the carrier gas.Judging from the level of oxygen, very little combustion of the dieselfuel constituents would be expected.
TABLE 14. ANALYSIS OF NITROGEN CARRIER GAS USED FOR ANIMAL EXPOSURES
Compound Weight Fraction*(%)
H2 0.0001CH4 0.0007H20 0.0011N2 + CO 99.94802 0.0012Ar 0.0483
C02 0.0003
*Average of Duplicate Samples
Distribution of the Smoke Between Vapor and Particulate States
The obscurant cloud generated is an evaporation/condensation aero-sol which undergoes a large dilution simultaneously with condensation.Many of the more volatile constituents in the fuel have significantvapor pressures at ambient temperatures and thus partition themselvesbetween the vapor and particle phases. Besides complicating thesampling of the aerosol (since the method of sampling the cloud canultimately affect the relative composition of the sample obtained), thepresence of a two-phase system can complicate the interpretation of theresults, because the experimental animals are exposed to both theliquid and vapor phase of the aerosol. The primary method ofadministration of the more volatile constituents is via the vaporphase, while the less volatile constituents are administered to theanimals in the particle phase. The distinction may have toxicologicalsignificance, since organic vapors could be distributed through thelung and absorbed in a manner different from that of particles. Thus,it was desirable to obtain some independent measure of theconcentration of each of the two phases of the system. Estimation ofthe concentration of particles in the aerosol was relativelystraightforward. That is, a specific volume of smoke was filtered (atlow flows) and the weight increase of the filter pad taken to be theweight of particles per unit volume.IDetermination of the quantity of the vapor phase was considerablymore difficult: For a sample sufficiently large to be accurately
-44-

weighed, it was difficult to assure that 100 percent recovery of allvapor phase constituents had occurred. In addition, we found thatinstrumental measurement of the quantity of vapor phase posedsubstantial problems of standardization and sample dilution. Thus, weattempted to use chemical measures of the amount of fuel present as avapor in the obscurant smoke. Over the course of the study, fourapproaches were tried. Two of the methods, more indirect in nature,measured the amount of fuel which does not re-condense followingaerosolization. The other two methods measured directly the amount ofmaterial present in the vapor phase. None of the methods was withoutsome experimental difficulties. However, the results, taken together,provide a good estimate of the amount of material in the vapor phase asa function of the aerosol particle concentration. The procedures andtheir results are described below.
Material Balance. In this procedure, the amount of fuel beingpumped into the smoke generator was very carefully metered. Using anexact determination of the airflow into the chamber, a total mass offuel per unit volume was calculated. When compared with a value for
Ad the smoke particle concentration per unit volume - determined byconventional means - the difference was taken to be the amount of fuelconstituents present in the vapor phase. Results of these materialbalance calculations are presented in Table 15. These data indicatethat, over a particle concentration range of 1.8 to 6.3 mg per liter,the fraction of the fuel which remains uncondensed varies from approxi-mately 28 to 16 percent. Of course, these calculations assume completecollection of the sampled particulates. If chamber wall deposition, orevaporation of collected particles from the filter occur, the calcula-ted vapor concentrations will be higher than those actually present.
Tracer Method. This approach was thought to provide a goodestimate of the relative fraction of vapor phase constituents in theaerosol. The change in the apparent concentration of a "non-volatile"tracer - one which has an extremely low vapor pressure at ambienttemperatures - in the liquid phase of the aerosol can be used to deter-mine this fraction through the following expression.
~F V-_I V
where F - the fraction of the fuel remaining in the vapor phaseV - the ratio of the concentration of the tracer in the aerosol
particle phase to that of the tracer in the original fuel f(Tpart)/(Tfuel).
The concentration of vapors, Cv, is given by
i:: 5 Cv . (V-1)Cp
where C p is the volume concentration of the particles.
In this case, decachlorobiphenyl (DCBP) was chosen as the nonvola-tile tracer. DCBP ws used as a dosimetric tracer in another experimentto determine deposition of the diesel fuel aerosol in rats in theinhalation toxicology study. In our experiments, no evidence of
-45-

*...*~W a%, W . ~ . - U
V b A
4u, I ill Iz 'I1jo 0 4
0 r-00
~~0)
14 00 0.0dw
cc J 4 4 4.1
:1 k0 :4 1 ..
V 0 00 C c
>.. 410cc
ca4 0
%
)4 1
44
4.4)
4-4 0000 4
104I-4 414
J tU4 PC "4
v-4~~~5 4.02t** . * 0
a Ua -
0 :
o 0,4.544 0)5'0 41 0
4.1 w " 9 4)
4d4 0- V*'
cd0 4.5
ca C-4 0000 4n 00o rINC"0 OV (0)$ 04.1)
4-4 v.) 'Tv.4W C
0o 411?9 014 0 0) 4-0) cc 4J J 4 0
> H 4-4U, ~OF'-'J~e.s .. ~0
- ~ 0S4.9.9. -4600

- . .. .. . -. - •.
measurable quantities of the DCBP in the vapor phase was foundfollowing aerosolization. Thus, it was assumed that all of the traceradded to the fuel was present in the particle phase of the smoke. Theresults of one set of experiments conducted in a small cylindricalchamber are presented in Table 16. Additional results for a largerchamber are in Table 17. The data from both experiments suggest that,
as the smoke particle concentration increases, the fraction of fuelwhich remains uncondensed generally decreases. However, the overall
amount of material in the vapor phase increases.
TABLE 16. DCBP* ENRICHMENT AND CALCULATED VAPOR PHASE CONCENTRATIONAS A FUNCTION OF SMOKE PARTICLE CONCENTRATION
CYLINDRICAL CHAMBER
d. . Smoke Particle Fraction of Fuelb [DCBPlParticlesa Vapor Phase
'V. Concentration, Remaining in Vapor [DCBP] Concentration,
Cp, mg.L-1 Phase, Percent Fuel Cv c , (mgL ' )
0.43 20 1.25 + 0.03 .111.0 18 1.23 + 0.04 .233.0 17 1.21 + 0.06 .635.0 14 1.17+ 0.05 .85
8.0 7 1.08 + 0.03 .64
*DecachlorobiphenylaRatio of DCBP concentration in particle phase of aerosol to that
added to fuel prior to aerosolization.bSince DCBP transfers quantitatively to particle phase of theaerosol, the fraction of the fuel remaining in the vapor phase, F,
is given by
F= V-1 where V particlesV [DCBP fuel
cCv = (V-i) Cp where Cp - Smoke particle concentration
Bulb Sampling. Attempts were made to determine the vapor phaseconcentration by making a difference measurement. That is, particleconcentrations, determined by the conventional filter pad method, werecompared with whole smoke (vapor + particles) concentrations, determin-ed by the bulb sampling method described a above. At nominal smokeparticle concentrations of 4.2 mg.L-I, whole smoke concentrationswere determined to be approximately 5.2 mg'L-1. This indicated
that, at this particular smoke particle level, vapor phase constituentswere about 1 mg.L - 1 , or about 20 percent of the mass of smoke.These values were in good agreement with those obtained by the DCBP
tracer method.
-47-
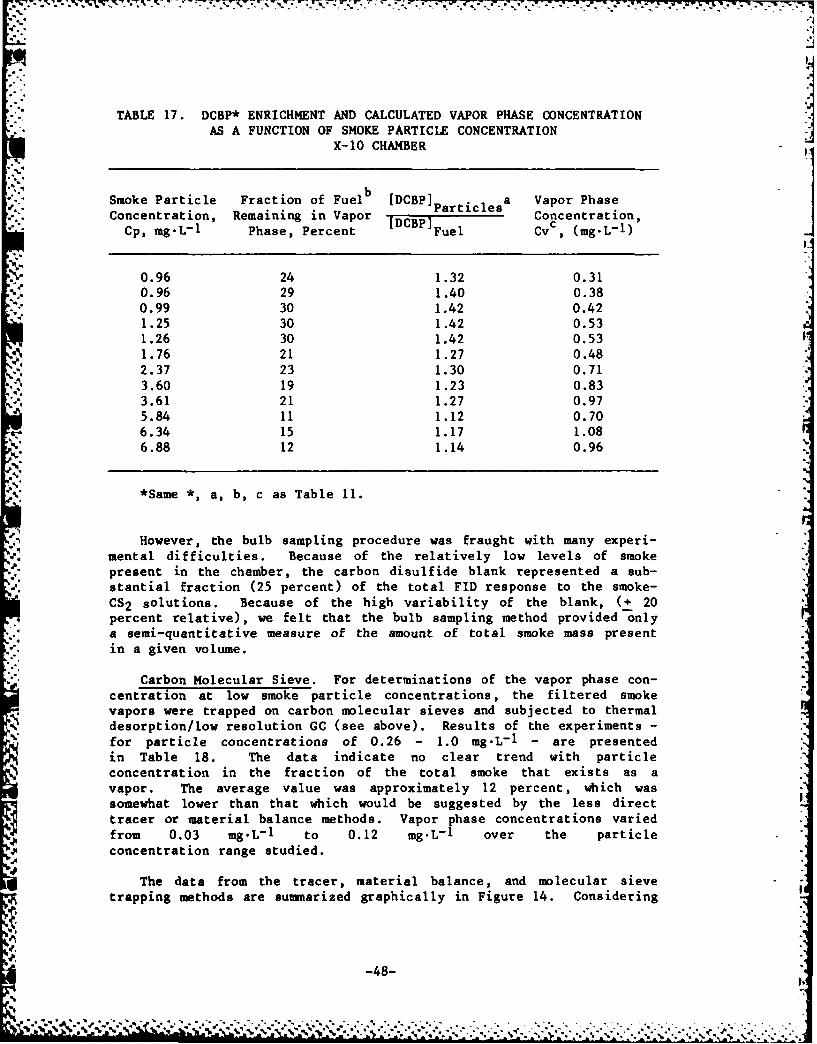
TABLE 17. DCBP* ENRICHMENT AND CALCULATED VAPOR PHASE CONCENTRATION
AS A FUNCTION OF SMOKE PARTICLE CONCENTRATIONX-10 CHAMBER
Smoke Particle Fraction of Fuelb [DCBP] Ptilea Vapor PhaseConcentration, Remaining in Vapor [DCBP] Concentration,Cp, mg.L-I Phase, Percent Fuel Cvc, (mg.L-1 )
0.96 24 1.32 0.310.96 29 1.40 0.380.99 30 1.42 0.421.25 30 1.42 0.531.26 30 1.42 0.531.76 21 1.27 0.48
• 2.37 23 1.30 0.71
3.60 19 1.23 0.83" 3.61 21 1.27 0.97
5.84 11 1.12 0.70
6.34 15 1.17 1.08
6.88 12 1.14 0.96
*Same *, a, b, c as Table 11.
However, the bulb sampling procedure was fraught with many experi-
mental difficulties. Because of the relatively low levels of smoke
present in the chamber, the carbon disulfide blank represented a sub-stantial fraction (25 percent) of the total FID response to the smoke-
CS2 solutions. Because of the high variability of the blank, (+ 20
percent relative), we felt that the bulb sampling method provided onlya semi-quantitative measure of the amount of total smoke mass present
in a given volume.
Carbon Molecular Sieve. For determinations of the vapor phase con-
centration at low smoke particle concentrations, the filtered smoke
vapors were trapped on carbon molecular sieves and subjected to thermaldesorption/low resolution GC (see above). Results of the experiments -
for particle concentrations of 0.26 - 1.0 mg.L-I - are presentedin Table 18. The data indicate no clear trend with particleconcentration in the fraction of the total smoke that exists as a
vapor. The average value was approximately 12 percent, which wassomewhat lower than that which would be suggested by the less direct
tracer or material balance methods. Vapor phase concentrations variedfrom 0.03 mg.L- I to 0.12 mg.L-1 over the particle
concentration range studied.
The data from the tracer, material balance, and molecular sievetrapping methods are sumnarized graphically in Figure 14. Considering
-48-

LOco,
LU 0
.-0 o4
4 LD0
C) .4.DIN ..- 0
CCD
IN CD -r-
4 Co
z5C) 0
C) 0
* 02
LJC)~
a )
0
CC,0
0C"o
* C C Cu
4 *40
-49-)

TABLE 18. VAPOR PHASE CONCENTRATION AS A FUNCTION OF SMOKE PARTICLECONCENTRATION AS DETERMINED BY CARBON MOLECULAR SIEVE (SPHEROCARBO)
TRAPPING METHOD
Smoke Particle Vapor Phase
Concentration Concentration Percentmg.L- I (mg.L-1 ) Vapor Phase
.262 .034 13.0
.338 .046 13.6
.376 .048 12.8
.376 .055 14.6
.377 .041 10.9
.395 .045 11.4
.414 .050 12.1
.891 .122 13.7
.772 .102 10.5
.972 .102 10.5
.972 .104 10.7
.995 .102 10.3
.995 .102 10.3
the differences in the methods, the data are relatively consistent.They show an increasing vapor concentration with increasing particleconcentration. The rate of increase tends to diminish at higherparticle concentrations, which might be intuitively expected.
Chemical Composition of the Diesel Fuel Smoke
The single most important effect of the aerosolization process on
the fuel matrix is the partitioning of the fuel between a vapor andliquid phase. This is dramatically illustrated in Figure 15, which
compares high resolution gas chromatograms of the unaerosolized fuel,the aerosol droplets collected on Cambridge filter pads, and vaporspassing through the pad and adsorbed on Tenax-GCO . (Note that the lack
of recovery of constituents boiling in the range of C1 2 to C14. was an artifact of the thermal desorption process and temperature
program, and not an actual loss of the mid-boiling range constituents).In Figure 16, a more detailed comparison of the liquid phase of the
smoke and the fuel - prior to aerosolization - is made. The loss oflower-boiling constituents in the liquid phase is a result of theirhigher vapor pressures at room temperature. When the fuel is heatedand the vapors cooled, the more volatile constituents in the fuel donot condense as efficiently as the less volatile constituents.
In Tables 19-22 are listed the concentrations of selected constitu-
ents the aliphatic, the one-, two-, and three-ring fractions of the* liquid phase of the smoke. Comparison of the data reported for the
-50- .
W ORML-DWG 81-13302
n-C, H24 n-CM3-18 n-CM5,2 n-C,-rH3
.4'..DISE FU4]E3L]152
DIEESEL FUEL
SMKEVAO
DIESELL FUEL
SMOKE PARTICLES
.0
%C I
20 43 68 TEPRTR *)93 118 143
0 25 50 75 100 125TIME (min)
A Figure 15. High Resolution GO Profiles: Fuel Prior to Aerosolization
Compared to Smoke Vapor and Particle Phases
4.'v

ORNL/DWG 81-9189
C16
C14
C 10
FUEL.
TEMPERATURE, *Cso 75 100 125 150 175 200
2114.5 2'7 39.15 51264 .5 7 17T Ii MIN
Figure 16. Comparison of High Resolution GC Profiles: UnaerosolizedDiesel Fuel vs. Liquid Particle Phase Following Aerosoli-zation
-52-
%2-~ * ~.4 24 ~ . *- ~
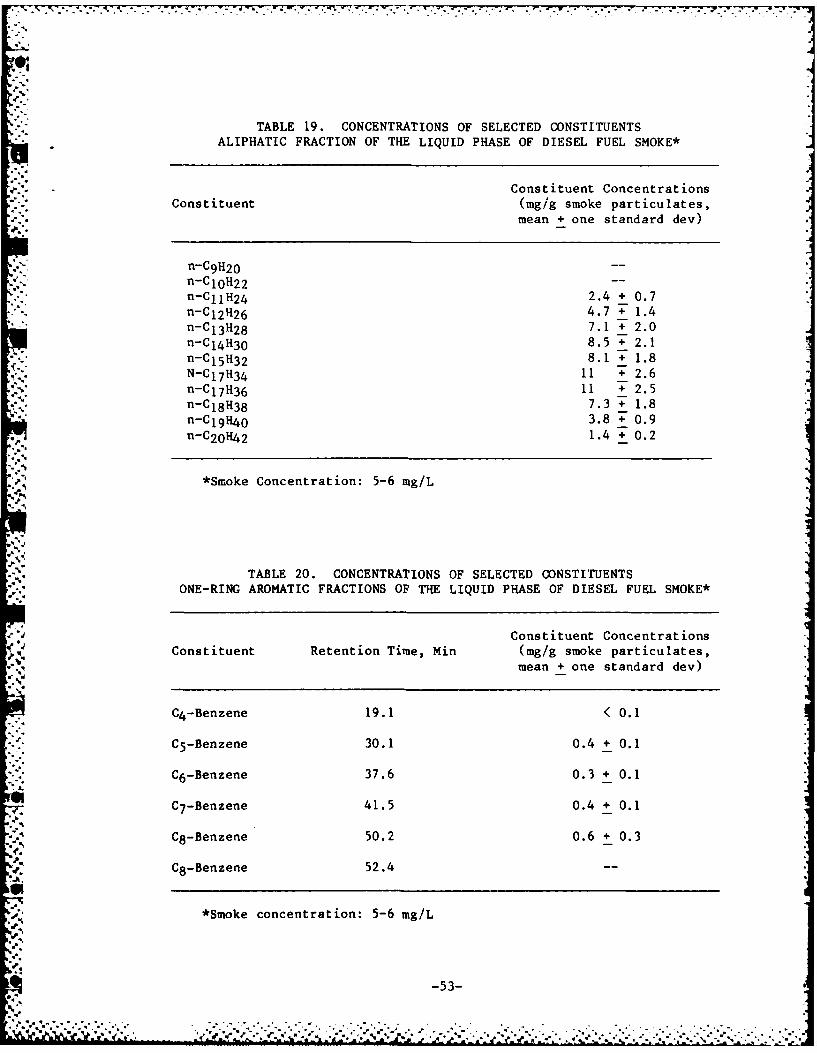
TABLE 19. CONCENTRATIONS OF SELECTED CONSTITUENTSALIPHATIC FRACTION OF THE LIQUID PHASE OF DIESEL FUEL SMOKE*
Constituent ConcentrationsConstituent (mgig smoke particulates,
mean + one standard dev)
n-C9 H2 0n-CloH22 -n-CI1H24 2.4 + 0.7
4.7 + 1.4n-C13H28 7.1 + 2.0
n-CI4H30 8.5 + 2.1n-CI5H32 8.1 7 1.8
N-C17H34 11 + 2.6n-C17H36 11 + 2.5n-C1 8H38 7.3 + 1.8n-Cl1H40 3.8 + 0.9n-C20H42 1.4 + 0.2
*Smoke Concentration: 5-6 mg/L
TABLE 20. CONCENTRATIONS OF SELECTED CONSTITUENTSONE-RING AROMATIC FRACTIONS OF THE LIQUID PHASE OF DIESEL FUEL SMOKE*
Constituent ConcentrationsConstituent Retention Time, Min (mg/g smoke particulates,
mean + one standard dev)
C4 -Benzene 19.1 < 0.1
C5 -Benzene 30.1 0.4 + 0.1
C6 -Benzene 37.6 0.3 + 0.1
C 7-Benzene 41.5 0.4 + 0.1
C8 -Benzene 50.2 0.6 + 0.3
C8 -Benzene 52.4
*Smoke concentration: 5-6 mg/L
-53-
u n *n * P - t "" " " "* . " " "

.1
TABLE 21. CONCENTRATIONS OF SELECTED CONSTITUENTSTWO-RING AROMATIC FRACTION OF THE LIQUID PHASE OF DIESEL FUEL SMOKE*
Constituent ConcentrationsConstituent Retention Time, Min (mg/g smoke particulates,
mean + one standard dev)
Naphthalene 31.3 0.6 + 0.1Methyl Naphthalene 39.2 7.4 + 1.9Methyl Naphthalene 40.3 4.8 + 0.9
,-. C 2 Naphthalene 46.1 2.6 + 0.1
. C2 Naphthalene 46.9 4.1 + 0.3
C2 Naphthalene 47.8 7.5 + 3.4
C2 Naphthalene 49.0 4.9 + 0.7
C3 Naphthalene 56.3 3.3 + 0.5
C3 Naphthalene 57.1 2.6 + 1.7
*Smoke concentration: 5-6 mg/L
TABLE 22. CONCENTRATIONS OF SELECTED CONSTITUENTS"THREE-RING" AROMATIC FRACTION OF THE LIQUID PHASE
OF DIESEL FUEL SMOKE*
Constituent ConcentrationsConstituent Retention Time, (mg/g smoke particulates,
Mn mean + one standard dev)
Tri-Methyl Naphthalene 56.3 1.4 + 0.3Fluorene 57.7 1.0 + 0.3i-Methyl Fluorene 65.1 2.0 + 0.9Pnenanthrene 68.9 4.3 + 0.9
Methyl Phenanthrene 75.5 2.9 + 0.5
*Smoke concentration 5-6 mg/L%'..
-54-
-..
,,. *.....--- -.... ,. -..... .... ..,-.-..... .......-. . .- -: .,, ......... , .v .-. , .- ... ,, .-..- ,- ., . ..
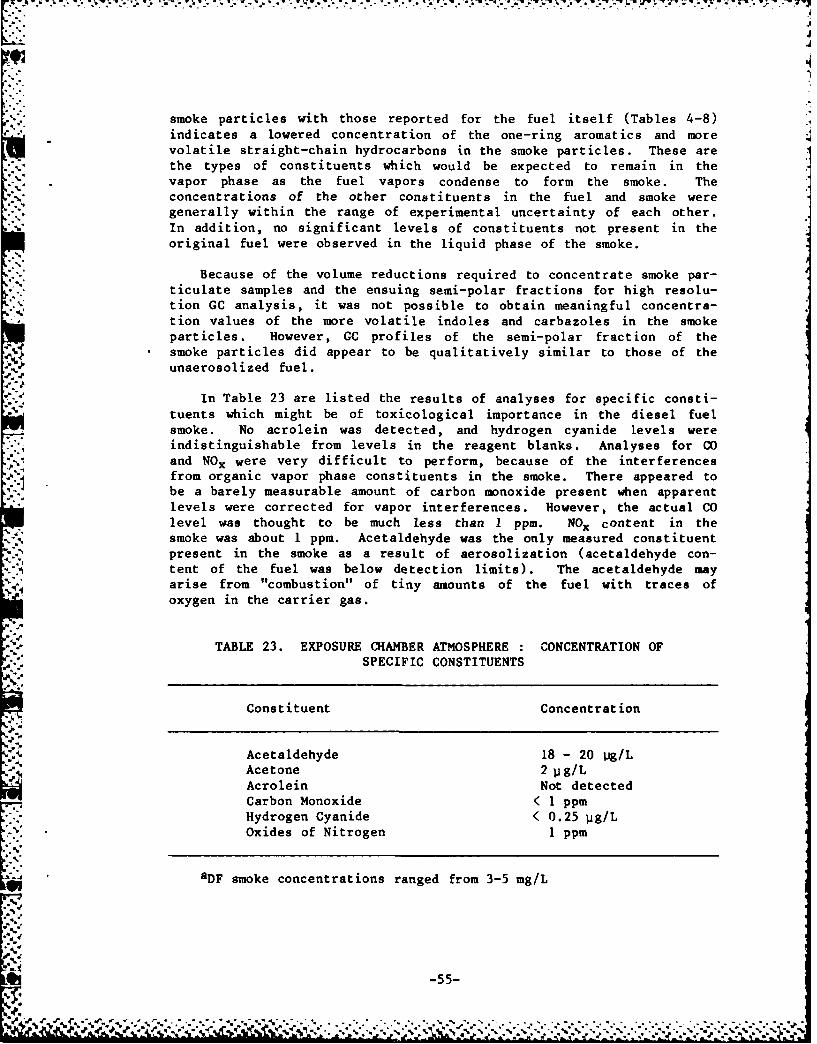
smoke particles with those reported for the fuel itself (Tables 4-8)indicates a lowered concentration of the one-ring aromatics and morevolatile straight-chain hydrocarbons in the smoke particles. These are
the types of constituents which would be expected to remain in thevapor phase as the fuel vapors condense to form the smoke. The
concentrations of the other constituents in the fuel and smoke weregenerally within the range of experimental uncertainty of each other.
In addition, no significant levels of constituents not present in the
original fuel were observed in the liquid phase of the smoke.
Because of the volume reductions required to concentrate smoke par-
ticulate samples and the ensuing semi-polar fractions for high resolu-
tion GC analysis, it was not possible to obtain meaningful concentra-tion values of the more volatile indoles and carbazoles in the smoke
particles. However, GC profiles of the semi-polar fraction of thesmoke particles did appear to be qualitatively similar to those of theunaerosolized fuel.
In Table 23 are listed the results of analyses for specific consti-
tuents which might be of toxicological importance in the diesel fuelsmoke. No acrolein was detected, and hydrogen cyanide levels wereindistinguishable from levels in the reagent blanks. Analyses for CO
and NOx were very difficult to perform, because of the interferencesfrom organic vapor phase constituents in the smoke. There appeared to
be a barely measurable amount of carbon monoxide present when apparentlevels were corrected for vapor interferences. However, the actual CO
level was thought to be much less than 1 ppm. NOx content in thesmoke was about 1 ppm. Acetaldehyde was the only measured constituent
present in the smoke as a result of aerosolization (acetaldehyde con-tent of the fuel was below detection limits). The acetaldehyde may
arise from "combustion" of tiny amounts of the fuel with traces ofoxygen in the carrier gas.
TABLE 23. EXPOSURE CHAMBER ATMOSPHERE : CONCENTRATION OF
SPECIFIC CONSTITUENTS
Constituent Concentration
Acetaldehyde 18 - 20 lig/LAcetone 2 p g/LAcrolein Not detected
Carbon Monoxide < 1 ppmHydrogen Cyanide < 0.25 .ig/L
Oxides of Nitrogen 1 ppm
aDF smoke concentrations ranged from 3-5 mg/L
-55-
4 %

..i. EFFECTS OF OXYGEN INCLUSION IN SMOKE GENERATOR CARRIER GAS
INTRODUCTION
Under field conditions, the VEESS Smoke is generated in the exhaustmanifold of a diesel engine. In contrast to the laboratory generatedsmoke, in which pure nitrogen is employed as a carrier gas, the fieldgenerator employs spent exhaust gases as the "carrier" gas. Amongother substances, the exhaust gas contains a good deal of excessmolecular oxygen (02), affording the opportunity for partialcombustion of the injected diesel fuel and pyrosynthesis of newcompounds. Thus, there exists some question as to the existence of
V: toxicologically significant chemical differences between the smokegenerated under field conditions and that being generated for bioassay.The discussion below attempts to address this issue. However, aconcerted, detailed study of the effects of an oxygen-containingcarrier gas on the chemical composition of the diesel fuel smoke wasbeyond the scope of this project. Rather, the results described beloware a sumary of observations made in the course of experiments eitherdesigned to investigate other phenomena, or to scope the problem in alimited fashion. Thus, the "conclusions" should be consideredtentative and in need of additional verification and/or elucidation.
METHODS
For the limited scoping experiments, the diesel fuel smoke wasgenerated with an oxygen-containing carrier gas. The gas consisted ofnitrogen-breathing air mixtures to a maximum breathing-air level of50 percent. The resulting 10.5 percent (by volume) oxygen concentra-tion was designed to approximate that present in the exhaust gases of adiesel engine.
To determine the levels of CO and NOx present in the oxygen-generated smoke, a chemiluminescent NOx analyzer and an electrochem-ical carbon monoxide analyzer (Ecolyzer*) were employed. However, bothof these systems respond to organic vapors. In addition, the Ecolyzerwas shown to respond to NOx with three times the sensitivity that itdoes to carbon monoxide. Some of the organic vapors could be elimina-ted by employing small vapor traps consisting of cartridges filled withTenaxO GC backed by activated charcoal. However, the traps had limitedcapacities and, at the sampling flow rates which had to be employed inthe experiments, they tended to bleed organic vapors after a very shortuse. In addition, the inner surfaces of the CO and NOx analyzerseasily became contaminated with organic vapors. Compensation for theseresponses to the vapors was accomplished by alternate sampling of freshair, smoke generated with nitrogen, and smoke generated with nitrogenand air -- all with known amounts of 00 and/or NOx added. TheEcolyzerO response to NOx was corrected by independently measuringNOx levels and subtracting them (corrected for sensitivity
%differences) from the Ecolyzer* readings. Other chromatographic,q methods employed were identical to those described above.
- -

RESULTS
The most obvious effect of oxygenation is the distinct yellow colorof the collected particulate matter. There was also an acrid odor whichwas not present with nitrogen-generated smoke. However, it was notpossible to ascribe the observed color differences to any definitechemical change (see below).
From a compositional standpoint, the most discernable change wasthe increase in carbon monoxide concentration in the oxygenated smoke.Upon addition of air to the carrier gas, CO levels increased from less
than 1 ppm to about 100 ppm (at smoke particle concentrations of 3-4mg/L and breathing air fraction of 50%). NOx levels increased fromapproximately 1 ppm to approximately 4 ppm.
In Figure 17 are compared an HPLC chromatogram of diesel fuel smoke(on an amino-silane column) generated with nitrogen carrier gas andthat of a smoke generated with a 50-50 nitrogen/air mixture. Somedifferences in the chromatograms are readily apparent. First, therehas been a substantial decrease in the amount of aliphatics (peak 1)when the 50/50 nitrogen/air mix is used. Secondly, there is a smallincrease in the peak height of peak 2 (peak 2 is thought to be predomi-nantly comprised of one-ring aromatic compounds, but may include othervolatile constituents of the diesel fuel smoke). Thirdly, there is a
is a small additional peak which elutes prior to peak 2 which is muchless prominant in a chromatogram of the smoke generated under a 100percent nitrogen. These results suggest that the aliphaticconstituents may be more susceptible to partial combustion than are thearomatic compounds.
In another set of experiments (described in detail in the SmokeWeek III Reportl 5), extracts of field generated (i.e., using battletank exhaust) smoke particulates were subjected to high resolution gaschromatographic profiling. Comparison of the profiles with thoseobtained from the animal inhalation exposures (i.e., smoke generatedwith pure nitrogen carrier gas) indicated no major compositionaldifferences which could not be ascribed to compositional differencesbetween the two diesel fuels employed in the separate experiments.HPLC fractionation of the field generated particulates, followed byfurther high resolution gas chromatographic analysis, revealed nosubstantial compositional differences in the individual fractions.
DISCUSSION
Taken together, the results suggest that the field-generated smokeis likely to contain more CO and NOx. However, these quantities areprobably small in relation to the quantities of those compounds presentin normal diesel exhaust. In addition, as much as 25-30 percent of thealiphatic constituents Ln the particle phase may be depleted due tocombustion. That new compounds are synthesized when oxygen is added tothe carrier gas is indicated by the change in color and odor of thesmoke.
-57-
• . . .. . .. -. .. ..-
*~* **'**%* ** * ~ % % %***4***4V4~

ORNL-DWG 83-14737
..REFRACTIVE SINDEX DETECTOR SMOKE GENERATED
4 WITH PURE NITROGEN ASCARRIED GAS
2A
I 1UV DETECTOR\fjz i0
w/
w (b)
SMOKE GENERATED WITHNITROGEN /BREATH ING AIR
I MIXTURE AS CARRIER GAS
2A
\3
V1j
/-58

However, the HPLC and high resolution GC data suggest that the com-
pounds are likely to be present in only very small quantities. Thetoxicological significance of these compounds is, of course, a matter
of speculation.
-N
-59-
4
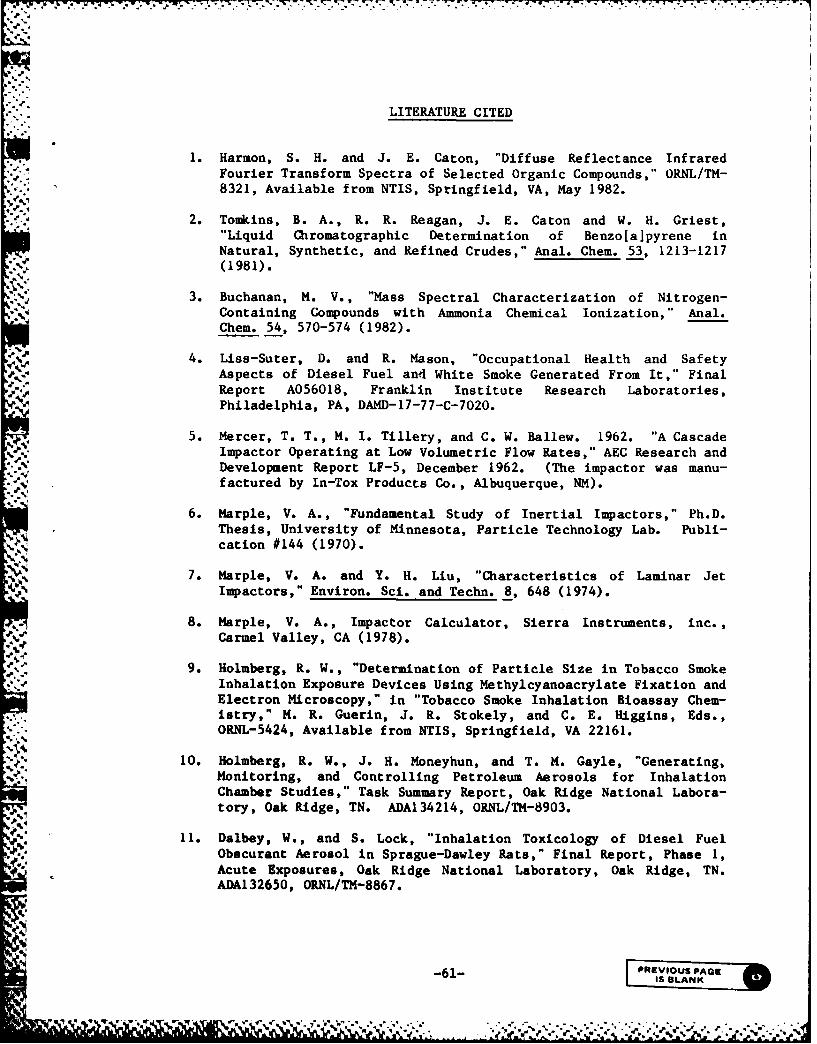
LITERATURE CITED
I. Harmon, S. H. and J. E. Caton, "Diffuse Reflectance Infrared
Fourier Transform Spectra of Selected Organic Compounds," ORNL/TM-8321, Available from NTIS, Springfield, VA, May 1982.
2. Tomkins, B. A., R. R. Reagan, J. E. Caton and W. H. Griest,"Liquid Chromatographic Determination of Benzo[a]pyrene inNatural, Synthetic, and Refined Crudes," Anal. Chem. 53, 1213-1217
'V (1981).
3. Buchanan, M. V., "Mass Spectral Characterization of Nitrogen-Containing Compounds with Ammonia Chemical Ionization," Anal.Chem. 54, 570-574 (1982).
4. Liss-Suter, D. and R. Mason, "Occupational Health and Safety' -4 Aspects of Diesel Fuel and White Smoke Generated From It," Final
Report A056018, Franklin Institute Research Laboratories,'V Philadelphia, PA, DAMD-17-77-C-7020.
5. Mercer, T. T., M. I. Tillery, and C. W. Ballew. 1962. "A Cascade"A Impactor Operating at Low Volumetric Flow Rates," AEC Research and
Development Report LF-5, December 1962. (The impactor was manu-factured by In-Tox Products Co., Albuquerque, NM).
6. Marple, V. A., "Fundamental Study of Inertial Impactors," Ph.D.Thesis, University of Minnesota, Particle Technology Lab. Publi-
cation #144 (1970).
7. arple, V. A. and Y. H. Liu, "Characteristics of Laminar JetImpactors," Environ. Sci. and Techn. 8, 648 (1974).
8. Marple, V. A., Impactor Calculator, Sierra Instruments, inc.,
Carmel Valley, CA (1978).
9. Holmberg, R. W., "Determination of Particle Size in Tobacco SmokeInhalation Exposure Devices Using Methylcyanoacrylate Fixation andElectron Microscopy," in "Tobacco Smoke Inhalation Bioassay Chem-
istry," M. R. Guerin, J. R. Stokely, and C. E. Higgins, Eds.,ORNL-5424, Available from NTIS, Springfield, VA 22161.
10. Holmberg, R. W., J. H. Moneyhun, and T. M. Gayle, "Generating,Monitoring, and Controlling Petroleum Aerosols for InhalationChamber Studies," Task Summary Report, Oak Ridge National Labora-tory, Oak Ridge, TN. ADA134214, ORNL/TM-8903.
11. Dalbey, W., and S. Lock, "Inhalation Toxicology of Diesel FuelObscurant Aerosol in Sprague-Dawley Rats," Final Report, Phase 1,
Acute Exposures, Oak Ridge National Laboratory, Oak Ridge, TN.ADA132650, ORNL/TM-8867.
-61- PREVIOUS PAGEIS BLANK
. 9~ r'- . .' .:._ ., , , ,-, , .; ,' .I-' - '. -,,-. ,,,,-.-..;--..,,...!.'...',:..-.%....,.
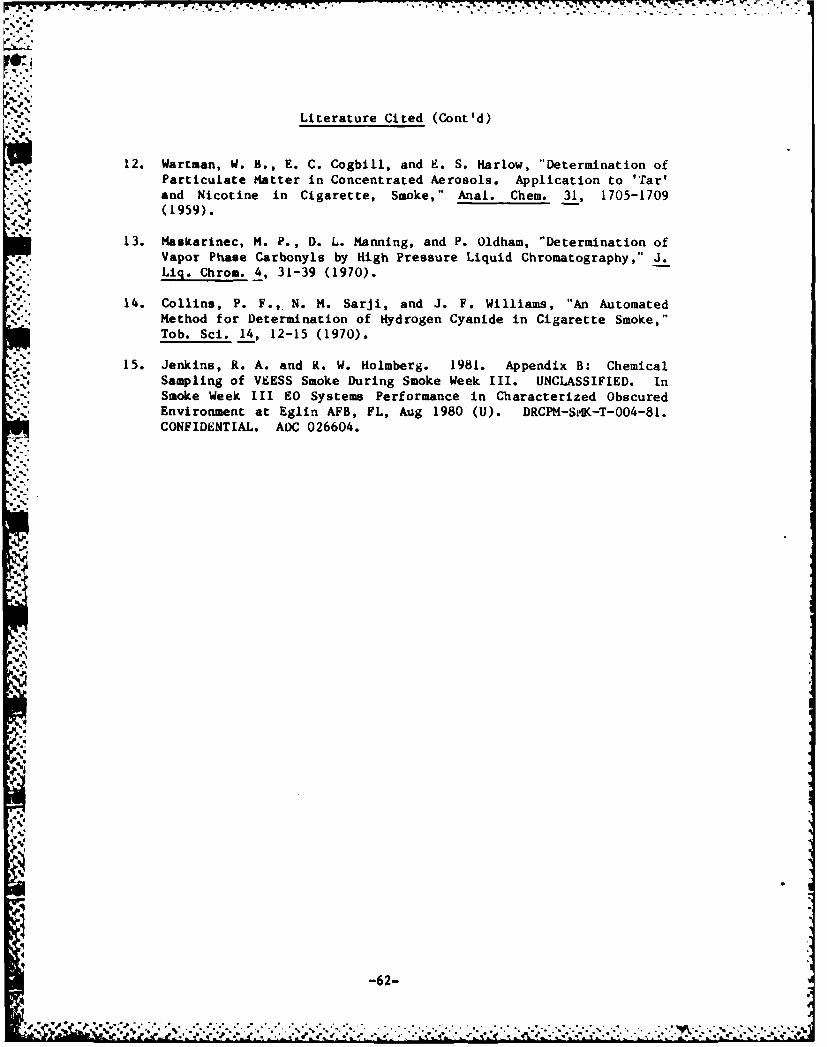
Literature Cited (Cont'd)
12. Wart-an, W. B., E. C. Cogbill, and E. S. Harlow, "Determination ofParticulate Matter in Concentrated Aerosols. Application to 'Tar'
and Nicotine in Cigarette, Smoke," Anal. Chem. 31, 1705-1709(1959).
13. Maskarinec, M. P., D. L. Manning, and P. Oldham, "Determination ofVapor Phase Carbonyls by High Pressure Liquid Chromatography," J.Lig. Chrom. 4, 31-39 (1970).
14. Collins, P. F., N. M. Sarjl, and J. F. Williams, "An AutomatedMethod for Determination of Hydrogen Cyanide in Cigarette Smoke,"Tob. Sci. 14, 12-15 (1970).
" 15. Jenkins, R. A. and R. W. Holmberg. 1981. Appendix B: ChemicalSampling of VEESS Smoke During Smoke Week III. UNCLASSIFIED. InSmoke Week III EO Systems Performance in Characterized ObscuredEnvironment at Eglin AFB, FL, Aug 1980 (U). DRCPM-SWlK-T-004-81.CONFIDENTIAL. ADC 026604.
1.
-62-
. . . .
.4..'. .=.. .. - ... ....... . - .... -, ;. .. ..-. - . . .-. .-.. .. ; . ....---.. .. .... . .. .. .. -,; .. ...: ..:,
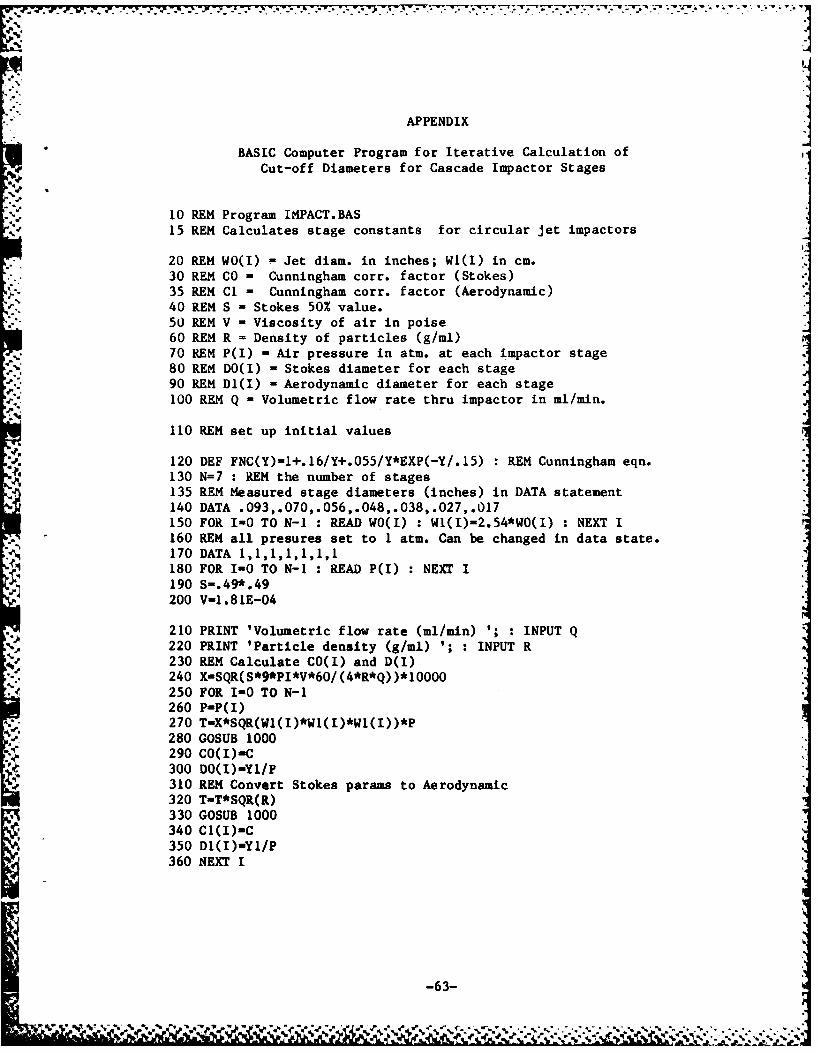
APPENDIX
BASIC Computer Program for Iterative Calculation of
Cut-off Diameters for Cascade Impactor Stages
10 REM Program IMPACT.BAS15 REM Calculates stage constants for circular jet impactors
20 REM WO(I) - Jet diam. in inches; WI(I) in cm.30 REM CO - Cunningham corr. factor (Stokes)
35 REM Cl - Cunningham corr. factor (Aerodynamic)40 REM S - Stokes 50% value.50 REM V - Viscosity of air in poise60 REM R - Density of particles (g/ml)70 REM P(I) - Air pressure in atm. at each impactor stage80 REM DO(I) = Stokes diameter for each stage
90 REM DI(I) - Aerodynamic diameter for each stage100 REM Q - Volumetric flow rate thru impactor in ml/min.
110 REM set up initial values
120 DEF FNC(Y)=1+.16/Y+.055/Y*EXP(-Y/.15) : REM Cunningham eqn.
130 N=7 : REM the number of stages135 REM Measured stage diameters (inches) in DATA statement140 DATA .093,.070,.056,.048,.038,.027,.017150 FOR 1-0 TO N-I : READ WO(I) : Wl(I)-2.54*WO(I) : NEXT I160 REM all presures set to 1 atm. Can be changed in data state.170 DATA 1,1,1,1,1,1,1180 FOR 1-0 TO N-i : READ P(I) : NEXT I
190 S-.49*.49
200 V-1.81E-04
210 PRINT 'Volumetric flow rate (ml/min) '; INPUT Q220 PRINT 'Particle density (g/ml) '; INPUT R
230 REM Calculate CO(I) and D(I)
240 X-SQR(S*9*PI*V*60/(4*R*Q) )*10000250 FOR 1-0 TO N-i260 P-P(I)270 T-X*SQR(WI(I)*Wl(I)*Wl(I))*P280 GOSUB 1000290 CO(I)-C300 DO(I)-Yl/P310 REM Convert Stokes params to Aerodynamic320 T=T*SQR(R)330 GOSUB 1000
340 Cl(I)-C350 DI(I)-YI/P
360 NEXT I
-63-

370 OPEN 'LP:' FOR OUTPUT AS FILE #1380 PRINT #1,' IMPACT.BAS'390 PRINT #1,TAB(15);'STAGE CONSTANTS FOR CICULAR JET IMPACTORS'400 PRINT #1,410 PRINT #1,'FLOW~ RATE -'Q ml/min.';TAB(40);'PARTICLE DENSITY=';420 PRINT #1,R430 PRINT #1,440 PRINT #1,' JET DIAMETERS';TAB(21);'PRESSURE';TAB(31);I STOKES';450 PRINT #1,TAB(51);' AERODYNAMIC'
*460 PRINT #1,' inches';TAB(11);' cm.';TAB(21);' atm.';TAB(31);470 PRINT #1,'Diam.';TAB(41);'Cunn. Cor';TAB(51);' Diam.';480 PRINT #1,TAB(61);'Cunn. Cor.'490 PRINT #1,1 '-----------------------------------------------------------------------------------
*500 A$-'#.#### #.#### #.### ##.### ##.#### ##.### ##.####'510 FOR I=0 TO N-i1520 PRINT #1,USING A$,W0(I),Wl(I),P(I),DO(I),CO(I),D1(I),Cl(I)530 NEXT I540 CLOSE #1550 STOP
1000 REM Subr. to caic Cunnighai factor iteratively1010 Y-1 :REM initial gues of D*P
*1020 C-FNC(Y) REM est. of C based on Y1030 Y1"'T/SQR(C) :REM new approx. of D*P-1040 IF ABS(Y-Y1)<1.OE-06 THEN RETURN1050 Y-Yl1060 GO TO 1020
%5
*-64

PERSONNEL
The following personnel received support under Army Project Orders9600, 0027, 1807, and 2802 in performance of work described in this
* report:
R. A. JenkinsR. W. HolmbergM. R. GuerinJ. S. WikeJ. H. MoneyhunP. BerlinskiB. E. GillR. S. BrazellD. L. Manning
S-65.

PUBLICATIONS
The following publications resulted in whole or in part from thework described in this report.
Jenkins, R. A. and J. S. Wike, "Chemical Characterization of DieselFuel Obscurants," Second Symposium on Physical and Chemical Characteri-
zation of Army Smokes/Obscurant Aerosols, Ft. Detrick, MD, November 13-14, 1980.
Dalbey, W. E., R. W. Holmberg, J. H. Moneyhun, R. A. Jenkins, S. Lock,
and M. R. Guerin. Toxicological Evaluation of Diesel Fuel No. 2.Proc., 11th Conference on Environmental Toxicology, Dayton, OH,
. November 18-20, 1980.
Dalbey, W. E., S. Lock, R. W. Holmberg, J. H. Moneyhun, and M. R.- " Guerin. Acute Toxicity of an Aerosol of Diesel Fuel. Society of Toxi-
cology Annual Conference, San Diego, CA, March 1-5, 1981.
Jenkins, R. A., R. W. Holmberg, J. H. Moneyhun, and J. S. Wike. Chem-ical and Physical Characterization of a Diesel Fuel Obscurant for Inha-
lation Toxicology Studies. Proc., Smoke/Obscurants Symposium V, Harry
Diamond Laboratories, Adelphi, MD, April 28-30, 1981.
Dalbey, W. E., S. Lock, R. W. Holmberg, J. H. Moneyhun, and M. R.
Guerin. Acute Exposure of Rats to an Inhaled Aerosol of Diesel Fuel.Proc., Smoke/Obscurants Symposium V, Mary Diamond Laboratories,Adelphi, MD, April 28-30, 1981.
Jenkins, R. A. and R. W. Holmberg. 1981. Appendix B: Chemical Samp-ling of VEESS Smoke During Smoke Week III. UNCLASSIFIED. In Smoke
*. Week III EO Systems Performance in Characterized Obscured Environment
at Eglin AFB, FL, Aug 1980 (U). DRCPM-SMK-T-004-81. CONFIDENTIAL.
ADC 026604.
V. Jenkins, R. A., T. M. Gayle, J. S. Wike, and D. L. Manning. Sampling
and Chemical Characterization of Concentrated Smokes. Toxic Materialsin the Atmosphere, ASTM STP 786, American Society for Testing and Mate-rials, 1982, pp. 153-166.
Jenkins, R. A., D. L. Manning, M. P. Maskarinec, J. H. Moneyhun, W.
Dalbey, and S. Lock. Diesel Fuel Smoke Particulate Dosimetry inSprague Dawley Rats. Task Summary Report to U.S. Army Medical Bioengi-neering Research and Development Laboratory, Ft. Detrick, Frederick,MD, 1983.
-66-
-66- ,4;-
DISTRIBUTION LIST
No. of Copies
4 CommanderUS Army Medical Research and Development Command
ATTN: SGRD-RMSFort DetrickFrederick, MD 21701
12 Defense Technical Information Center (DTIC)ATTN: DTIC-DDA
Cameron StationAlexandria, VA 22314
1' DeanvSchool of Medicine
Uniformed Services University. of the Health Sciences
4301 Jones Bridge Road- .~ Bethesda, MD 20014
1 "CommandantAcademy of Health Sciences, US ArmyATTN: AHS-CDMFort Sam Houston, TX 78234
.. ,Librarian
* '. US Army Medical Bioengineering Research andDevelopment Laboratory
ATTN: SGRD-UBZ-IFort Detrick
Frederick, MD 21701
35 Commander
US Army Medical Bioengineering Research andDevelopment Laboratory
ATTN: SGRD-UBG-MFort Detrick
Frederick, MD 21701
1'.R. S. BrazellBuilding 4500-S; E-160Oak Ridge National LaboratoryP. 0. Box XOak Ridge, TN 37831
- 7
' s - _ -' ,- . .. - .- ',- . o.. - . . .- .,.. .* . , .......... . .. - .... . .,- -. --

'i
DISTRIBUTION LIST (Cont'd)
No. of Copies
10 M. R. Guerin
Building 4500-S; E-160Oak Ridge National LaboratoryP. 0. Box XOak Ridge, TN 37831
% R. W. HolmbergBuilding 4500-S; E-160Oak Ridge National LaboratoryP. O. Box XOak Ridge, TN 37831
5 R. A. JenkinsN: Building 4500-S; E-160
Oak Ridge National LaboratoryP. 0. Box XOak Ridge, TN 37831
1 J. H. MoneyhunBuilding 4500-S; E-160Oak Ridge National LaboratoryP. 0. Box XOak Ridge, TN 37831
. 1 J. S. Wike
- -Building 3037; 107-EOak Ridge National LaboratoryP. 0. Box XOak Ridge, TN 37831
1 Central Research LibraryBuilding 4500-N
Oak Ridge National LaboratoryP. 0. Box XOak Ridge, TN 37831
1 Department of EnergyOak Ridge OperationsAttn: Mr. J. A. Lenhard, Assistant Manager
for Energy Research and Development. P.O. Box E
Oak Ridge, TN 37831
'.
-68-
-.44,%
DISTRIBUTION LIST (Cont'd)
No. of Copies
o oDocument Reference SectionBuilding 9711-1Oak Ridge National LaboratoryP. 0. Box YOak Ridge, TN 37831
3 Laboratory Records
Building 4500-N; H-205Oak Ridge National LaboratoryP. 0. Box X
Oak Ridge, TN 37831
ORNL Patent OfficeBuilding 4500-N; M-130
Oak Ridge National LaboratoryP. 0. Box X
Oak Ridge, TN 37830
166 Technical Information CenterDepartment of Energy
Oak Ridge, TN 37830For DOE/TIC 4500 distributionunder UC-4 Category
-- 9
-.o
i -69
-"'V " i ", , . d .' ' " ", . ,"' ' -. - . ' ,,. ' -. ' .' " .. ' " -." . . . . . . . - - - . . . . . . ..

'4.4 S. 4- '~
,,'j '~g4 -* 4'$~' ' - C "4*
1~
N . .4
* p
'1'
~ .4 y . - .*,.. 4
4.44
p 'v I $, N' 4A 44 S i
4. :t I ..A#~.dbar+r' p7 '~ .4
~ :.~'~' 7 VW:~" 'dL4 ~\. 2 'fL.~-
2 C144W.£4 '- ( -$.j"'. ''~'44tT 4? '~'
4,. '~jt~'s-h - -ip 4. . - 4...41 .4... 4' 7\ii .... ~ 3,
44~
4444 . ,* ,~, .A4 t.~ -
* - t~''t
4 ;4 C..' .
-- .. '4At~ ~ 217zrX~2 * ... .. . 4 it4. .
* - , .~ AA~ -.~ p 4~*
* 4 v.v . 44 .
- .'1, -4,4.4 ,' *'1'' -.
I MtZt$.>t9~1. .1* t,1($S ;,~e~Viy4A41 .r~.t4t
.'v4A41'4c
* '*L Ct''- .jA'
~r a**~~~~44t 4*~44~O~4~ - 'itgr-~4I~ I K ~ '~
-J I H~ ~ K F J 9'
IV.,., .4,'4 4
~ 4Q' .- :t 4
4 'i ' '4
* . (4 4444 'j~ 4.. ~ NA~',44\ ...
~k ,4..,.4$ 4 .. '44'U .~ P ~ '~ -r-rt U,. 4Vi4jj 4 ' .
At ~"F.~t .C.,%'A*.';'4 > 4
1"1 -, .4 4/.4 ~- * A.44-t'4# .
4,44J 444.7 .J4.
.44.4 ~ ~* 4 44
4<~ \44.,-,n- C
t4r.4: 4-. .4 4 ~447
A "4
1
.4..
* ~'A I '4~:' '4,
, 44-. *.4 4 -