R-28M 28 (710 mm) MIDDLE BLOCK WITH SOIL INFILL · m 45 (m ) 45 100 45 () 15 m ( m ) DESIGN VOLUME...
15
REDI-ROCK SUCCESS PROFILE DESIGN INFORMATION
Transcript of R-28M 28 (710 mm) MIDDLE BLOCK WITH SOIL INFILL · m 45 (m ) 45 100 45 () 15 m ( m ) DESIGN VOLUME...

REDI-ROCK SUCCESS PROFILE
DESIGN INFORMATION
Redi-Rock Design Resource Manual V19 | 65redi-rock.com© 2019 Redi-Rock International, LLC64 | Redi-Rock Design Resource Manual V19 redi-rock.com
© 2019 Redi-Rock International, LLCredi-rock.com
© 2019 Redi-Rock International, LLC
Project: Spokane Residence Block Manufacturer: Wilbert Precast Engineer: John McKervey, P.E. of JM Engineering Contractor: Ben Jeffers Location: Spokane, Washington Completed: 2014
CONCRETEDesign Unit Weight = 143 pcf (2291 kg/m3)LIMESTONE AND COBBLESTONE FACE TEXTURE Average Volume (Vc) 11.28 cft (0.32 m3) (From CAD Model) Concrete Block Weight (Wc) Wc = 11.28 cft x 143 pcf = 1,613 lbs (732 kg)KINGSTONE AND LEDGESTONE FACE TEXTURE Average Volume (Vc) 10.78 cft (0.31 m3) (From CAD Model) Concrete Block Weight (Wc) Wc = 10.78 cft x 143 pcf = 1,542 lbs (699 kg)Average Center of Gravity (COGc) 13.9 in (353 mm) (From CAD Model)
INFILL SOILDesign Unit Weight = 100 pcf (1602 kg/m3)Soil considered as infill includes the soil between adjacent blocks and at the ends ofthe bottom groove in the block.Volume (Vs) 1.05 cft (0.03 m3) (From CAD Model)Infill Soil Weight (Ws) Ws = 1.05 cft x 100 pcf = 105 lbs (47.7 kg)Center of Gravity (COGs) 13.6 in (345 mm) (Data from CAD Model)
DESIGN VOLUME28 in x 46.125 in x 18 in = 13.45 cft(0.711 m x 1.172 m x 0.457 m = 0.38m3)
INFILLED UNIT WEIGHTLIMESTONE AND COBBLESTONE FACE TEXTUREg INFILL = (1,613 lb + 105 lb) / 13.45 cft = 127.7 pcf((733 kg + 48 kg) / 0.381 m3 = 2045 kg/m3)KINGSTONE AND LEDGESTONE FACE TEXTUREg INFILL = (1,542 lb + 105 lb) / 13.45 cft = 122.4 pcf((701 kg + 48 kg) / 0.381 m3 =1960 kg/m3)
NOTE: The infilled unit weights shown here are referencevalues. Several factors can cause the unit weights of bothconcrete and infill soil to vary. The designer should usesound engineering judgement when assigning an infilledunit weight value for analysis.
46 18" (1172 mm)Wc
Ws
COGs
COGc
SWCOG
± 28
" (71
1 m
m)
22 5
8" (5
76 m
m)
R-28M 28" (710 mm) MIDDLE BLOCK WITH SOIL INFILL
RETAINING BLOCKS
Infill Weight Calculations
INFILLED UNIT WEIGHT CALCULATIONS
Redi-Rock 28" (710 mm)Middle Block (Typical)
Infill areas for stone(Typical)

DESIGN INFORMATION
66 | Redi-Rock Design Resource Manual V19 Redi-Rock Design Resource Manual V19 | 67redi-rock.com© 2019 Redi-Rock International, LLC
redi-rock.com© 2019 Redi-Rock International, LLC
Infill areas for stone(Typical)
Redi-Rock 28" (710 mm)PC Middle Block (Typical)
Wc
Ws
COGs
COGc
SWCOG
DESIGN VOLUME28 in x 46.125 in x 18 in = 23,247 in3 = 13.45 cft(0.711 m x 1.172 m x 0.457 m = 0.38m3)
INFILLED UNIT WEIGHTLIMESTONE AND COBBLESTONE FACE TEXTUREg INFILL = (1,519 lb + 173 lb) / 13.45 cft = 125.8 pcf((690 kg + 79 kg) / 0.381 m3 = 2015 kg/m3)KINGSTONE AND LEDGESTONE FACE TEXTUREg INFILL = (1,447 lb + 173 lb) / 13.45 cft = 120.4 pcf((658 kg + 79 kg) / 0.381 m3 = 1629 kg/m3)
NOTE: The infilled unit weights shown here are referencevalues. Several factors can cause the unit weights of bothconcrete and infill soil to vary. The designer should usesound engineering judgement when assigning an infilledunit weight value for analysis.
46 18" (1172 mm)
± 28
" (71
1 m
m)
22 5
8" (5
75 m
m)
R-28PCM 28" (710 mm) POSITIVE CONNECTION (PC) MIDDLE BLOCK WITH SOIL INFILL
RETAINING BLOCKS
Infill Weight Calculations
CONCRETEDesign Unit Weight = 143 pcf (2291 kg/m3)LIMESTONE AND COBBLESTONE FACE TEXTURE Average Volume (Vc) 10.62 cft (0.30 m3) (From CAD Model) Concrete Block Weight (Wc) Wc = 10.62 cft x 143 pcf = 1,519 lbs (690 kg)KINGSTONE AND LEDGESTONE FACE TEXTURE Average Volume (Vc) 10.12 cft (0.29 m3) (From CAD Model) Concrete Block Weight (Wc) Wc = 10.12 cft x 143 pcf = 1,447 lbs (658 kg)Average Center of Gravity (COGc) 14.0 in (356 mm) (From CAD Model)
INFILL SOILDesign Unit Weight = 100 pcf (1602 kg/m3)Soil considered as infill includes the soil between adjacent blocks, in the geogridslot, and at the ends of the bottom groove in the block.Volume (Vs) 1.73 cft (0.05 m3) (From CAD Model)Infill Soil Weight (Ws) Ws = 1.73 cft x 100 pcf = 173 lbs (79 kg)Center of Gravity (COGs) 9.9 in (251 mm) (Data from CAD Model)
INFILLED UNIT WEIGHT CALCULATIONSCONCRETEDesign Unit Weight = 143 pcf (2291 kg/m3)LIMESTONE AND COBBLESTONE FACE TEXTURE Average Volume (Vc) 16.14 cft (0.457 m3) (From CAD Model) Concrete Block Weight (Wc) Wc = 16.14 cft x 143 pcf = 2,308 lbs (1048 kg)KINGSTONE AND LEDGESTONE FACE TEXTURE Average Volume (Vc) 15.65 cft (0.443 m3) (From CAD Model) Concrete Block Weight (Wc) Wc = 15.65 cft x 143 pcf = 2,238 lbs (1015 kg)Average Center of Gravity (COGc) 20.5 in (521 mm) (From CAD Model)
INFILL SOILDesign Unit Weight = 100 pcf (1602 kg/m3)Soil considered as infill includes the soil between adjacent blocks and at the ends ofthe bottom groove in the block.Volume (Vs) 2.18 cft (0.062 m3) (From CAD Model)Infill Soil Weight (Ws) Ws = 2.18 cft x 100 pcf = 218 lbs (99.1 kg)Center of Gravity (COGs) 13.5 in (342 mm) (Data from CAD Model)
INFILLED UNIT WEIGHT CALCULATIONSDESIGN VOLUME40.5 in x 46.125 in x 18 in = 19.46 cft(1.03 m x 1.172 m x 0.457 m = 0.55 m3)
INFILLED UNIT WEIGHTLIMESTONE AND COBBLESTONE FACE TEXTUREg INFILL = (2,308 lb + 218 lb) / 19.46 cft = 129.8 pcf((1049 kg + 99 kg) / 0.551 m3 = 2079 kg/m3)KINGSTONE AND LEDGESTONE FACE TEXTUREg INFILL = (2,238 lb + 218 lb) / 19.46 cft = 126.2 pcf((1017 kg + 99 kg) / 0.551 m3 =2021 kg/m3)
NOTE: The infilled unit weights shown here are referencevalues. Several factors can cause the unit weights of bothconcrete and infill soil to vary. The designer should usesound engineering judgement when assigning an infilledunit weight value for analysis.
SWCOG
Wc
Ws
COGs
COGc46 18" (1172 mm)
± 40
1 2" (1
029
mm
)35
1 8" (8
92 m
m)
R-41M 41" (1030 mm) MIDDLE BLOCK WITH SOIL INFILL
RETAINING BLOCKS
Infill Weight Calculations
Redi-Rock 41" (1030 mm)Middle Block (Typical)
Infill areas for stone(Typical)

DESIGN INFORMATION
68 | Redi-Rock Design Resource Manual V19 Redi-Rock Design Resource Manual V19 | 69redi-rock.com© 2019 Redi-Rock International, LLC
redi-rock.com© 2019 Redi-Rock International, LLC
CONCRETEDesign Unit Weight = 143 pcf (2291 kg/m3)LIMESTONE AND COBBLESTONE FACE TEXTURE Average Volume (Vc) 15.19 cft (0.43 m3) (From CAD Model) Concrete Block Weight (Wc) Wc = 15.19 cft x 143 pcf = 2,172 lbs (987 kg)KINGSTONE AND LEDGESTONE FACE TEXTURE Average Volume (Vc) 14.69 cft (0.42 m3) (From CAD Model) Concrete Block Weight (Wc) Wc = 14.69 cft x 143 pcf = 2,101 lbs (955 kg)Average Center of Gravity (COGc) 20.4 in (518 mm) (From CAD Model)
INFILL SOILDesign Unit Weight = 100 pcf (1602 kg/m3)Soil considered as infill includes the soil between adjacent blocks,in the geogrid slot, and at the ends of the bottom groove in the block.Volume (Vs) 2.92 cft (0.08 m3) (From CAD Model)Infill Soil Weight (Ws) Ws = 2.92 cft x 100 pcf = 292 lbs (133 kg)Center of Gravity (COGs) 15.6 in (396 mm) (Data from CAD Model)
SWCOG
Wc
Ws
COGs
COGc
DESIGN VOLUME40.5 in x 46.125 in x 18 in = 33,625 in3 = 19.46 cft(1.03 m x 1.172 m x 0.457 m = 0.55 m3)
INFILLED UNIT WEIGHTLIMESTONE AND COBBLESTONE FACE TEXTUREg INFILL = (2,172 lb + 292 lb) / 19.46 cft = 126.6 pcf((987 kg x 133 kg) / 0.551 m3 = 2030 kg/m3)KINGSTONE AND LEDGESTONE FACE TEXTUREg INFILL = (2,101 lb + 292 lb) / 19.46 cft = 123.0 pcf((955 kg x 133 kg) / 0.551 m3 = 1970 kg/m3)
NOTE: The infilled unit weights shown here are referencevalues. Several factors can cause the unit weights of bothconcrete and infill soil to vary. The designer should usesound engineering judgement when assigning an infilledunit weight value for analysis.
46 18" (1172 mm)
± 40
1 2" (1
029
mm
)35
1 8" (8
92 m
m)
R-41PCM 41" (1030 mm) POSITIVE CONNECTION (PC) MIDDLE BLOCK WITH SOIL INFILL
RETAINING BLOCKS
Infill Weight Calculations
INFILLED UNIT WEIGHT CALCULATIONS
Infill areas for stone(Typical)
Redi-Rock 41" (1030 mm)PC Middle Block (Typical)
CONCRETEDesign Unit Weight = 143 pcf (2291 kg/m3)LIMESTONE AND COBBLESTONE FACE TEXTURE Average Volume (Vc) 23.00 cft (0.651m3) (From CAD Model) Concrete Block Weight (Wc) Wc = 23.0 cft x 143 pcf = 3,287 lbs (1491 kg)KINGSTONE AND LEDGESTONE FACE TEXTURE Average Volume (Vc) 22.49 cft (0.637 m3) (From CAD Model) Concrete Block Weight (Wc) Wc = 22.49 cft x 143 pcf = 3,216 lbs (1458 kg)Average Center of Gravity (COGc) 31.1 in (790 mm) (From CAD Model)
INFILL SOILDesign Unit Weight = 100 pcf (1602 kg/m3)Soil considered as infill includes the soil between adjacent blocks and at the ends ofthe bottom groove in the block.Volume (Vs) 4.70 cft (0.133 m3) (From CAD Model)Infill Soil Weight (Ws) Ws = 4.70 cft x 100 pcf = 470 lbs (214 kg)Center of Gravity (COGs) 20.2 in (513mm) (Data from CAD Model)
DESIGN VOLUME60 in x 46.125 in x 18 in = 28.83 cft(1.524 m x 1.172 m x 0.457 m = 0.816 m3)
INFILLED UNIT WEIGHTLIMESTONE AND COBBLESTONE FACE TEXTUREg INFILL = (3,288 lb + 470 lb) / 28.83 cft = 130.4 pcf((1495 kg + 214 kg) / 0.816 m3 = 2089 kg/m3)KINGSTONE AND LEDGESTONE FACE TEXTUREg INFILL = (3,216 lb + 470 lb) / 28.83 cft = 127.9 pcf((1462 kg + 214 kg) / 0.816 m3 = 2050 kg/m3)
NOTE: The infilled unit weights shown here are referencevalues. Several factors can cause the unit weights of bothconcrete and infill soil to vary. The designer should usesound engineering judgement when assigning an infilledunit weight value for analysis.
SWCOG
Wc
Ws
COGc46 18" (1172 mm)
± 60
" (15
24 m
m)
54 5
8" (1
389
mm
)
COGs
R-60M 60" (1520 mm) MIDDLE BLOCK WITH SOIL INFILL
RETAINING BLOCKS
Infill Weight Calculations
INFILLED UNIT WEIGHT CALCULATIONS
Redi-Rock 60" (1520 mm)Middle Block (Typical)
Infill areas for stone(Typical)
DESIGN INFORMATION
70 | Redi-Rock Design Resource Manual V19 Redi-Rock Design Resource Manual V19 | 71redi-rock.com© 2019 Redi-Rock International, LLC
redi-rock.com© 2019 Redi-Rock International, LLC
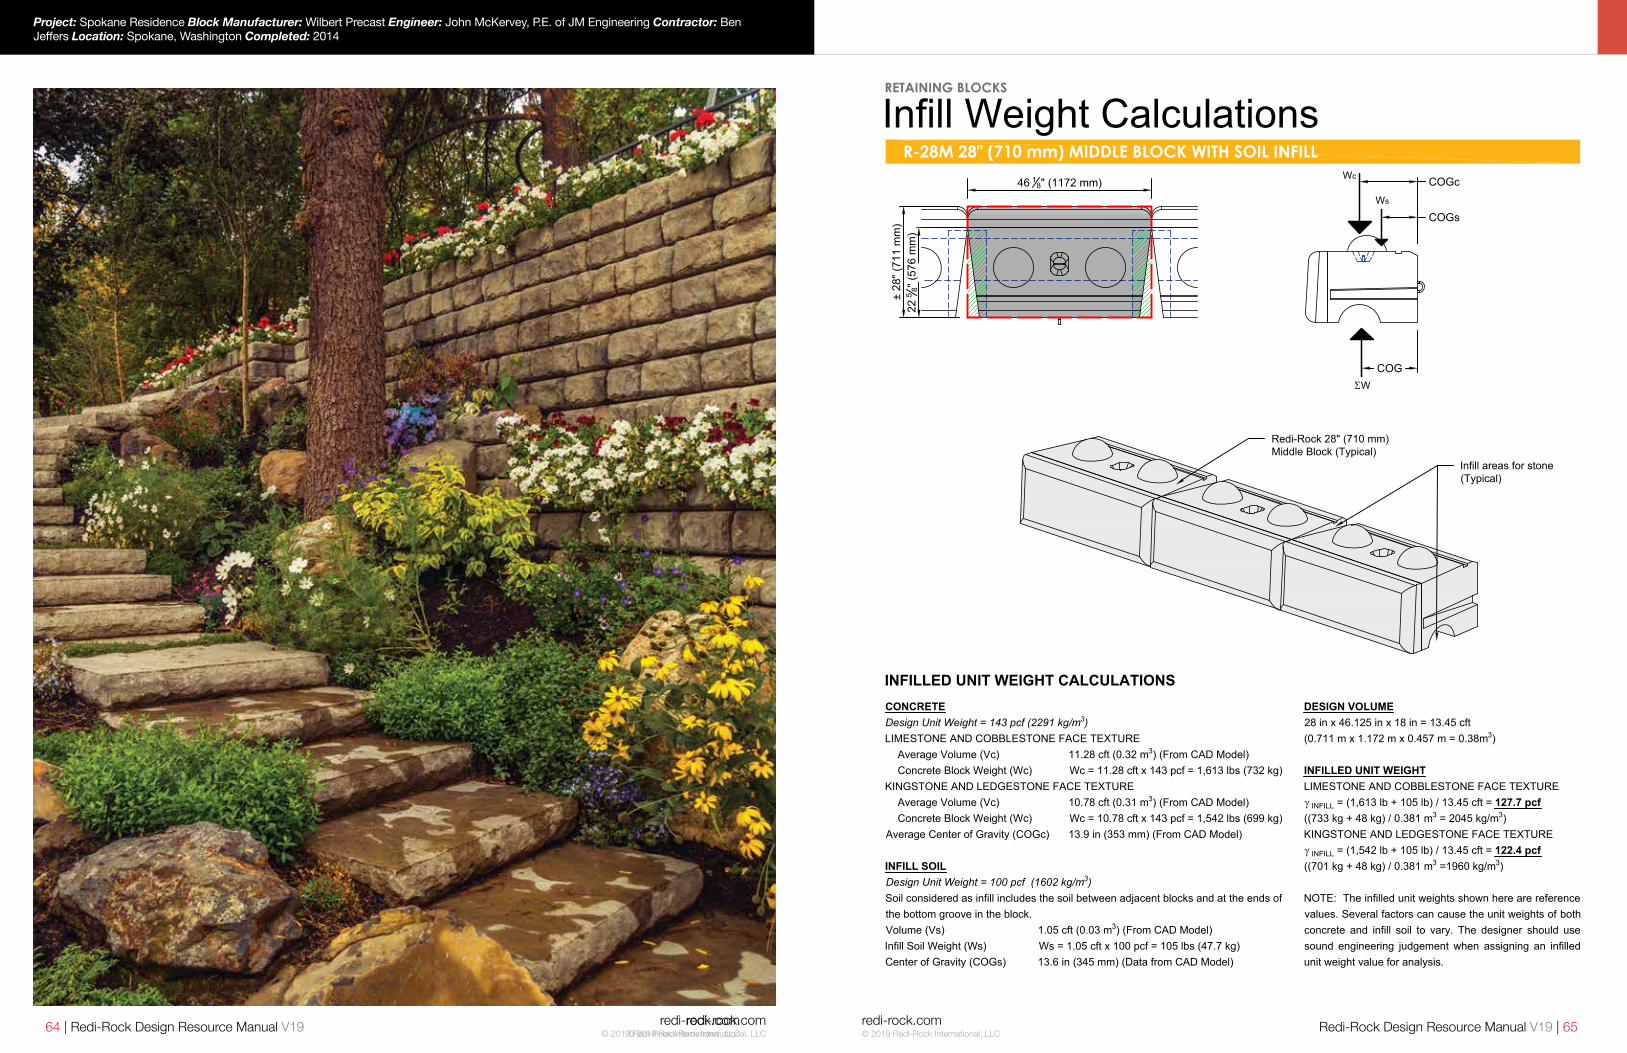
CONCRETEDesign Unit Weight = 143 pcf (2291 kg/m3)LIMESTONE AND COBBLESTONE FACE TEXTURE Average Volume (Vc) 23.90 cft (0.677 m3) (From CAD Model) Concrete Block Weight (Wc) Wc = 23.90 cft x 143 pcf = 3,418 lbsKINGSTONE AND LEDGESTONE FACE TEXTURE Average Volume (Vc) 23.40 cft (From CAD Model) Concrete Block Weight (Wc) Wc = 23.40 cft x 143 pcf = 3,346 lbsAverage Center of Gravity (COGc) 31.6 in from Back of Block (From CAD Model)
INFILL SOILDesign Unit Weight = 100 pcf (1602 kg/m3)Soil considered as infill includes the soil between adjacent blocks and at the ends ofthe bottom groove in the block.Volume (Vs) 4.58 cft (From CAD Model)Infill Soil Weight (Ws) Ws = 4.58 cft x 100 pcf = 458 lbsCenter of Gravity (COGs) 19.5 in from Back of Block (Data from CAD Model)
DESIGN VOLUME60 in x 46.125 in x 18 in = 49,815 in3 = 28.83 cft(1.524 m x 1.172 m x 0.457 m = 0.816 m3)
INFILLED UNIT WEIGHTLIMESTONE AND COBBLESTONE FACE TEXTUREg INFILL = (3,418 lb + 458 lb) / 28.83 cft = 134.4 pcf((1554 kg + 208 kg) / 0.816 m3 = 2153 kg/m3)KINGSTONE AND LEDGESTONE FACE TEXTUREg INFILL = (3,346 lb + 458 lb) / 28.83 cft = 131.9 pcf((1521 kg + 208 kg) / 0.816 m3 =2113 kg/m3)
NOTE: The infilled unit weights shown here are referencevalues. Several factors can cause the unit weights of bothconcrete and infill soil to vary. The designer should usesound engineering judgement when assigning an infilledunit weight value for analysis.
SWCOG
Wc
Ws
COGc
46 18" (1172 mm)
± 60
" (15
24 m
m)
54 5
8" (1
389
mm
)
COGs
R-60B 60" (1520 MM) BOTTOM BLOCK WITH SOIL INFILL
RETAINING BLOCKS
Infill Weight Calculations
INFILLED UNIT WEIGHT CALCULATIONS
Infill areas for stone(Typical)
Redi-Rock 60" (1520 mm)Bottom Block (Typical)
Redi-Rock 52" (1,320 mm)XL Block (Typical)
Infill areas for stone(Typical)
Wc
Ws
COGs
COGc
SWCOG
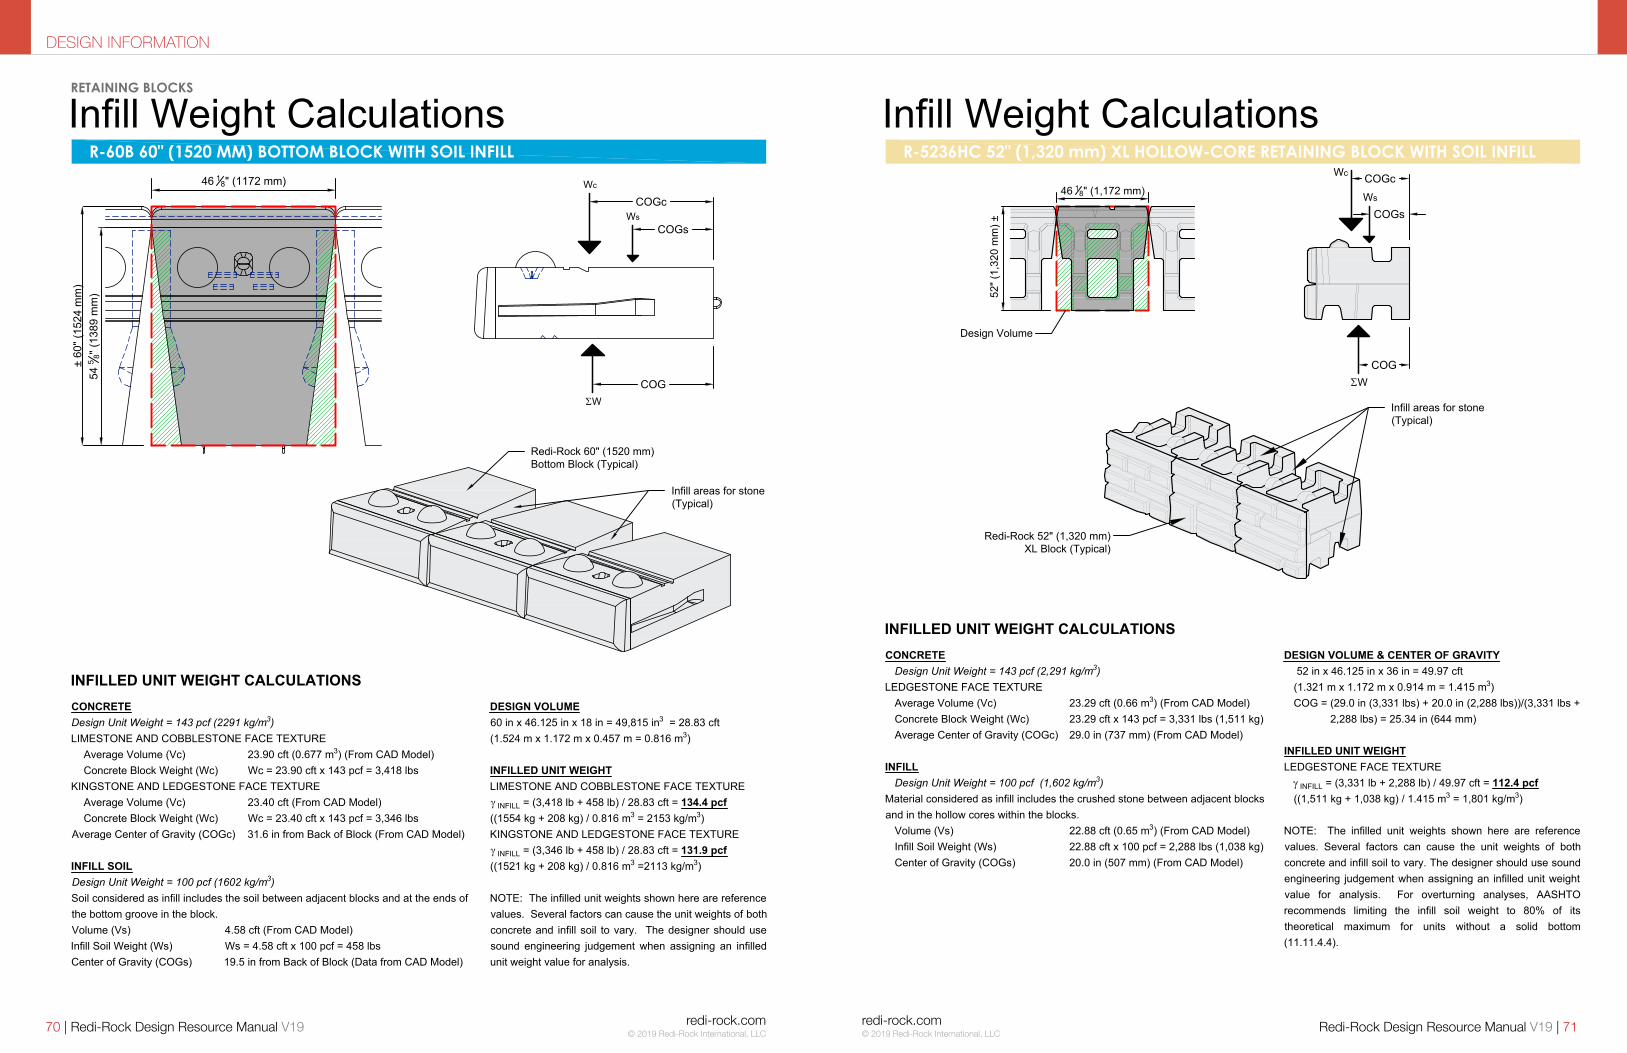
CONCRETE Design Unit Weight = 143 pcf (2,291 kg/m3)LEDGESTONE FACE TEXTURE Average Volume (Vc) 23.29 cft (0.66 m3) (From CAD Model) Concrete Block Weight (Wc) 23.29 cft x 143 pcf = 3,331 lbs (1,511 kg) Average Center of Gravity (COGc) 29.0 in (737 mm) (From CAD Model)
INFILL Design Unit Weight = 100 pcf (1,602 kg/m3)Material considered as infill includes the crushed stone between adjacent blocksand in the hollow cores within the blocks. Volume (Vs) 22.88 cft (0.65 m3) (From CAD Model) Infill Soil Weight (Ws) 22.88 cft x 100 pcf = 2,288 lbs (1,038 kg) Center of Gravity (COGs) 20.0 in (507 mm) (From CAD Model)
DESIGN VOLUME & CENTER OF GRAVITY 52 in x 46.125 in x 36 in = 49.97 cft (1.321 m x 1.172 m x 0.914 m = 1.415 m3) COG = (29.0 in (3,331 lbs) + 20.0 in (2,288 lbs))/(3,331 lbs +
2,288 lbs) = 25.34 in (644 mm)
INFILLED UNIT WEIGHTLEDGESTONE FACE TEXTURE g INFILL = (3,331 lb + 2,288 lb) / 49.97 cft = 112.4 pcf ((1,511 kg + 1,038 kg) / 1.415 m3 = 1,801 kg/m3)
NOTE: The infilled unit weights shown here are referencevalues. Several factors can cause the unit weights of bothconcrete and infill soil to vary. The designer should use soundengineering judgement when assigning an infilled unit weightvalue for analysis. For overturning analyses, AASHTOrecommends limiting the infill soil weight to 80% of itstheoretical maximum for units without a solid bottom(11.11.4.4).
R-5236HC 52" (1,320 mm) XL HOLLOW-CORE RETAINING BLOCK WITH SOIL INFILL
HOLLOW CORE RETAINING BLOCKS
Infill Weight Calculations
INFILLED UNIT WEIGHT CALCULATIONS
46 18" (1,172 mm)
52" (
1,32
0 m
m) ±
Design Volume

DESIGN INFORMATION
72 | Redi-Rock Design Resource Manual V19 Redi-Rock Design Resource Manual V19 | 73redi-rock.com© 2019 Redi-Rock International, LLC
redi-rock.com© 2019 Redi-Rock International, LLC
Redi-Rock 72" (1,830 mm)XL Block (Typical)
Infill areas for stone(Typical)
Wc
Ws
COGs
COGc
SWCOG
CONCRETEDesign Unit Weight = 143 pcf (2,291 kg/m3)LEDGESTONE FACE TEXTURE Average Volume (Vc) 29.10 cft (0.82 m3) (From CAD Model) Concrete Block Weight (Wc) 29.10 cft x 143 pcf = 4,162 lbs (1,888 kg) Average Center of Gravity (COGc) 39.9 in (1,013 mm) (From CAD Model)
INFILL Design Unit Weight = 100 pcf (1,602 kg/m3)Material considered as infill includes the crushed stone between adjacent blocksand in the hollow cores within the blocks. Volume (Vs) 36.29 cft (1.03 m3) (From CAD Model) Infill Soil Weight (Ws) 36.29 cft x 100 pcf = 3,629 lbs (1,646 kg) Center of Gravity (COGs) 30.0 in (762 mm) (From CAD Model)
DESIGN VOLUME & CENTER OF GRAVITY 72 in x 46.125 in x 36 in = 69.19 cft (1.829 m x 1.172 m x 0.914 m = 1.959 m3) COG = (39.9 in (4,162 lbs) + 30.0 in (3,629 lbs))/(4,162 lbs +
3,629 lbs) = 35.26 in (896 mm)
INFILLED UNIT WEIGHTLEDGESTONE FACE TEXTURE g INFILL = (4,162 lb + 3,629 lb) / 69.19 cft = 112.6 pcf ((1,888 kg + 1,646 kg) / 1.959 m3 = 1,804 kg/m3)
NOTE: The infilled unit weights shown here are referencevalues. Several factors can cause the unit weights of bothconcrete and infill soil to vary. The designer should use soundengineering judgement when assigning an infilled unit weightvalue for analysis. For overturning analyses, AASHTOrecommends limiting the infill soil weight to 80% of itstheoretical maximum for units without a solid bottom(11.11.4.4).
R-7236HC 72" (1,830 mm) XL HOLLOW-CORE RETAINING BLOCK WITH SOIL INFILL
HOLLOW CORE RETAINING BLOCKS
Infill Weight Calculations
INFILLED UNIT WEIGHT CALCULATIONS
46 18" (1,172 mm)72
" (1,
830
mm
) ±
Design Volume
Wc
Ws
COGs
COGc
SWCOG
CONCRETE Design Unit Weight = 143 pcf (2,291 kg/m3)LEDGESTONE FACE TEXTURE Average Volume (Vc) 33.83 cft (0.96 m3) (From CAD Model) Concrete Block Weight (Wc) 33.83 cft x 143 pcf = 4,837 lbs (2,194 kg) Average Center of Gravity (COGc) 55.3 in (1,405 mm) (From CAD Model)
INFILL Design Unit Weight = 100 pcf (1,602 kg/m3)Material considered as infill includes the crushed stone between adjacent blocksand in the hollow cores within the blocks. Volume (Vs) 54.63 cft (1.55 m3) (From CAD Model) Infill Soil Weight (Ws) 54.63 cft x 100 pcf = 5,463 lbs (2,478 kg) Center of Gravity (COGs) 40.7 in (1,034 mm) (From CAD Model)
DESIGN VOLUME 96 in x 46.125 in x 36 in = 92.25 cft (2.438 m x 1.172 m x 0.914 m = 2.612 m3) COG = (55.3 in (4,837 lbs) + 40.7 in (5,463 lbs)) / (4,837 lbs
+ 5,463 lbs) = 47.57 in (1,208 mm)
INFILLED UNIT WEIGHTLEDGESTONE FACE TEXTURE g INFILL = (4,837 lb + 5,463 lb) / 92.25 cft = 111.7 pcf ((2,194 kg + 2,478 kg) / 2.612 m3 = 2,161 kg/m3)
NOTE: The infilled unit weights shown here are referencevalues. Several factors can cause the unit weights of bothconcrete and infill soil to vary. The designer should use soundengineering judgement when assigning an infilled unit weightvalue for analysis. For overturning analyses, AASHTOrecommends limiting the infill soil weight to 80% of itstheoretical maximum for units without a solid bottom(11.11.4.4).
R-9636HC 96" (2,440 mm) XL HOLLOW-CORE RETAINING BLOCK WITH SOIL INFILL
HOLLOW CORE RETAINING BLOCKS
Infill Weight Calculations
INFILLED UNIT WEIGHT CALCULATIONS
46 18" (1,172 mm)
96" (
2,44
0 m
m) ±
Redi-Rock 96" (2,440 mm)XL Block (Typical)
Infill areas for stone(Typical)Design Volume

Redi-Rock Design Resource Manual V19 | 75redi-rock.com© 2019 Redi-Rock International, LLC
redi-rock.com© 2019 Redi-Rock International, LLC74 | Redi-Rock Design Resource Manual V19
The block-to-block setback available with Redi-Rock is controlled by the size and location of the shear knobs (domes) cast into theblocks. While the 10" (254 mm) diameter knob and the 1 5/8" (41 mm) setback position is the most common configuration, Redi-Rockhas three different knob sizes and three different locations available.
Five degree (5°) setback(Standard)
Block Setback Options
10" (254 mm)diameter knob
13 3 8" (340 mm)
15" (381 mm)Move blocks forward duringinstalltion to engage shearknobs (Typical)
Setback = 1 5 8" (41 mm)(5° batter angle on wall)
One degree (1°) setback(Specialty)
7 1/2" (190 mm)diameter knob
Setback = 3 8" (10 mm)(1° batter angle on wall)
Move blocks forward duringinstalltion to engage shearknobs (Typical)
Available with:· 28" (710 mm) blocks, 41" (1030 mm) blocks, and 60" (1520 mm) blocks· 28" (710 mm) PC blocks (shown here) and 41" (1030 mm) PC blocks
Text
ured
Fac
e
2" (51 mm)
13 3 4" (350 mm)
Zero (0°) setback(Specialty)
6 3 4" (171 mm)diameter knob
Setback = 0" (0 mm)(0° batter angle on wall)
Move blocks forward duringinstalltion to engage shearknobs (Typical)
13 3 8" (340 mm)
4" (102 mm)
4 12" (114 mm)
2" (51 mm)
Text
ured
Fac
eTe
xtur
ed F
ace
Available with:· 28" (710 mm) blocks, 41" (1030 mm) blocks, and 60" (1520 mm) blocks· 28" (710 mm) PC blocks (shown here) and 41" (1030 mm) PC blocks
Available with:· 28" (710 mm) blocks, 41" (1030 mm) blocks, and 60" (1520 mm) blocks· 28" (710 mm) PC blocks (shown here) and 41" (1030 mm) PC blocks
4 12" (114 mm)
13 3 8" (340 mm)
4 12" (114 mm)
13 3 8" (340 mm)
18" (457 mm) HIGH RETAINING BLOCKS
Project: Santa Fe River Rehab #168 Customer Name: City of Santa Fe Design/Specifying Engineer: Weston Solutions, MacCornack Engineering Manufacturer: Materials Inc. Installer: R.L. Leeder Location: Santa Fe, New Mexico Completed: 2011

DESIGN INFORMATION
76 | Redi-Rock Design Resource Manual V19 Redi-Rock Design Resource Manual V19 | 77redi-rock.com© 2019 Redi-Rock International, LLC
redi-rock.com© 2019 Redi-Rock International, LLC
Redi-Rock has two options for large batter retaining walls. Both options are created by relocating the knob so that it is further back inthe Redi-Rock blocks compared to our smaller batter walls (5° and less). There are two knob locations further back in the block whichcreate the 9" (230 mm) setback block and the planter block. Blocks made with knobs in either of these locations almost exclusivelyuse 10" (254 mm) diameter knobs.
Block Setback Options
9" (230 mm) Setback Blocks22 3 4" (578 mm) Move blocks forward during
installtion to engage shearknobs (Typical)
Setback = 9 3 8" (238 mm)(27.5° batter angle on wall)
Available with:· 41" (1030 mm) blocks (shown here) and 60" (1520 mm) blocks· Not available in PC blocks
4" (102 mm)
Text
ured
Fac
e
Planter Blocks
10" (254 mm)diameter knob
30" (762 mm)Move blocks forward duringinstalltion to engage shearknobs (Typical)
Setback = 16 5 8" (422 mm)
4" (102 mm)
Text
ured
Fac
e
Available with:· 41" (1030 mm) blocks (shown here) and 60" (1520 mm) blocks· Not available in PC blocks
4 12" (114 mm)
13 3 8" (340 mm)
4 12" (114 mm)
13 3 8" (340 mm)
10" (254 mm)diameter knob
18" (457 mm) HIGH RETAINING BLOCKS
Block Setback
16 58" (422 mm)
13 38" (340 mm)
4" (102 mm)
7" (178 mm)
Setback = 314" (83 mm)
(5° Batter Angle on Wall)Move blocks forward duringinstallation to engage shearknobs (typical)
10" (254 mm)shear knob
The block-to-block setback available with 36" (914 mm) high Redi-Rock XL hollow-core retaining blocks is controlled by the locationof the shear knobs cast into the blocks. The 3 1/4" (83 mm) setback between courses creates a 5° batter angle on the back of thewall which is consistent with the batter angle created by 18" (457 mm) high Redi-Rock blocks with 10" (254 mm) shear knobs.
The relative knob and groove configuration, and resulting setback,are consistent between the 52" (1320 mm), 72" (1830 mm), and 96"(2440 mm) XL hollow-core retaining blocks.
36" (914 mm)
Face
Text
ured
36" (914 mm) HIGH RETAINING BLOCKS
36" (914 mm) High XL Hollow-Core Retaining Blocks

DESIGN INFORMATION
78 | Redi-Rock Design Resource Manual V19 Redi-Rock Design Resource Manual V19 | 79redi-rock.com© 2019 Redi-Rock International, LLC
redi-rock.com© 2019 Redi-Rock International, LLC
6.75” (171 mm) KNOB INTERFACE SHEAR DATA(a)
Test No.Normal Load Service State Shear(b) Peak Shear
Observed Failure(c)
lb/ft (kN/m) lb/ft (kN/m) lb/ft (kN/m)1 522 (7.618) 838 (12.230) 1,724 (25.160) Test Stopped
2 19,209 (280.334) 11,324 (165.261) 11,324 (165.261) Test Stopped
3 16,303 (237.924) 11,252 (164.211) 11,252 (164.211) Test Stopped
4 13,612 (198.652) 11,036 (161.058) 11,036 (161.058) Test Stopped
5 11,075 (161.627) 10,462 (152.681) 10,462 (152.681) Test Stopped
6 11,074 (161.613) 11,060 (161.409) 11,252 (164.211) Knob Shear
7 8,299 (121.115) 10,408 (151.893) 11,204 (163.510) Test Stopped
8 5,854 (85.433) 8,337 (121.669) 9,935 (144.990) Knob Shear
9 3,077 (44.905) 5,722 (83.506) 6,153 (89.796) Knob Shear
10 10,981 (160.256) 10,821 (157.921) 11,252 (164.211) Knob Shear
Peak Shear(d): Sp = 1,178 + N tan 54° ≤ 10,970 lb/ft (Sp = 17.19 + N tan 54° ≤ 160.1 kN/m)Service State Shear (d): Sss = 616 + N tan 52° ≤ 10,970 lb/ft (Sss = 8.99 + N tan 52° ≤ 160.1 kN/m)
Test Methods: ASTM D6916 & NCMA SRWU-2 Test Facility: Bathurst, Clarabut Geotechnical Testing, Inc.Block Type: 28” (710 mm) Positive Connection (PC) Block Test Dates: 10/21/2011 - 6.75” (171 mm) Shear Knob Test
Interface Shear Report 6.75” (171 mm)
(a) The 28-day compressive strength of all concrete blocks tested in the 10-inch (254- millimeter) knob interface shear test series was 4,474 psi.
(b) Service State Shear is measured at a hori-zontal displacement equal to 2% of the block height. For Redi-Rock blocks, displacement = 0.36 inches (9.144 millimeters).
(c) In most cases, the test was stopped before block rupture or knob shear occurred to prevent damage to the test apparatus.
(d) Design shear capacity inferred from the test data reported herein should be lowered when test failure results from block rupture or knob shear if the compressive strength of the blocks used in design is less than the blocks used in this test. The data reported represents the actual laboratory test results. The equations for peak and service state shear conditions have been modified to reflect the interface shear performance of concrete with a minimum 28-day compres-sive strength equal to 4,000 psi. No further adjustments have been made. Appropriate factors of safety for design should be added.
The information contained in this report has been compiled by Redi-Rock International, LLC as a recommendation of peak interface shear capacity. It is accurate to the best of our knowledge as of the date of its issue. However, f inal determination of the suitability of any design information and the appropriateness of this data for a given design purpose is the sole responsibility of the user. No warranty of perfor-mance is expressed or implied by the publishing of the foregoing laboratory test results. Issue date: January 26, 2015.
12,000(175.1)
10,000(145.9)
8,000(116.8)
6,000(87.6)
4,000(58.4)
2,000(29.2)
0
Shea
r Cap
acity
, lb/
ft (k
N/m
)
Normal Load, lb/ft (kN/m)
0
4,000(58.4)
8,000(116.8)
12,000(175.1)
16,000(233.5)
20,000(291.9)
Peak Shear, SP
Service State Shear, SSS
6.75” (171 mm) KNOB INTERFACE SHEAR CAPACITY
10" (254 mm) KNOB INTERFACE SHEAR DATA(a)
Test No.Normal Load Service State Shear(b) Peak Shear
Observed Failure(c)
lb/ft (kN/m) lb/ft (kN/m) lb/ft (kN/m)1 19,619 (286.318) 11,300 (164.911) 11,300 (164.911) Test Stopped
2 16,007 (233.605) 11,300 (164.911) 11,300 (164.911) Test Stopped
3 13,546 (197.689) 11,371 (165.947) 11,371 (165.947) Test Stopped
4 11,042 (161.146) 11,371 (165.947) 11,371 (165.947) Test Stopped
5 8,400 (122.589) 11,204 (163.510) 11,204 (163.510) Test Stopped
6 10,999 (160.518) 11,252 (164.211) 11,252 (164.211) Test Stopped
7 10,922 (159.395) 11,252 (164.211) 11,252 (164.211) Test Stopped
8 5,786 (84.440) 10,414 (151.981) 11,156 (162.810) Test Stopped
9 3,137 (45.781) 7,469 (109.002) 10,174 (148.478) Test Stopped
10 522 (7.618) 3,926 (57.296) 6,033 (88.045) Test Stopped
Peak Shear: Sp = 6,061 + N tan 44° ≤ 11,276 lb/ft (Sp = 88.45 + N tan 44° ≤ 164.56 kN/m)Service State Shear: Sss = 3,390 + N tan 51° ≤ 11,276 lb/ft (Sss = 49.47 + N tan 51° ≤ 164.56 kN/m)
Test Methods: ASTM D6916 & NCMA SRWU-2 Test Facility: Bathurst, Clarabut Geotechnical Testing, Inc.Block Type: 28” (710 mm) Positive Connection (PC) Block 10/14/2011 - 10” (254 mm) Shear Knob Test
Interface Shear Report 10” (254 mm)
(a) The 28-day compressive strength of all concrete blocks tested in the 10-inch (254- millimeter) knob interface shear test series was 4,474 psi.
(b) Service State Shear is measured at a hori-zontal displacement equal to 2% of the block height. For Redi-Rock blocks, displacement = 0.36 inches (9.144 millimeters).
(c) In most cases, the test was stopped before block rupture or knob shear occurred to prevent damage to the test apparatus.
(d) Design shear capacity inferred from the test data reported herein should be lowered when test failure results from block rupture or knob shear if the compressive strength of the blocks used in design is less than the blocks used in this test. The data reported represents the actual laboratory test results. The equations for peak and service state shear conditions have been modified to reflect the interface shear performance of concrete with a minimum 28-day compres-sive strength equal to 4,000 psi. No further adjustments have been made. Appropriate factors of safety for design should be added.
The information contained in this report has been compiled by Redi-Rock International, LLC as a recommendation of peak interface shear capacity. It is accurate to the best of our knowledge as of the date of its issue. However, f inal determination of the suitability of any design information and the appropriateness of this data for a given design purpose is the sole responsibility of the user. No warranty of perfor-mance is expressed or implied by the publishing of the foregoing laboratory test results. Issue date: January 26, 2015.
12,000(175.1)
10,000(145.9)
8,000(116.8)
6,000(87.6)
4,000(58.4)
2,000(29.2)
0
Shea
r Cap
acity
, lb/
ft (k
N/m
)
Normal Load, lb/ft (kN/m)
0
4,000(58.4)
8,000(116.8)
12,000(175.1)
16,000(233.5)
20,000(291.9)
Peak Shear, SP
Service State Shear, SSS
10” (254 mm) KNOB INTERFACE SHEAR CAPACITY
redi-rock.com© 2019 Redi-Rock International, LLC Redi-Rock Design Resource Manual V19 | 81
DESIGN INFORMATION
80 | Redi-Rock Design Resource Manual V19 redi-rock.com© 2019 Redi-Rock International, LLC
Test No.
Normal Load Peak ShearObserved Failure(c)
lb/ft (kN/m) lb/ft (kN/m)1 872 (12.719) 3,812 (55.630) Test stopped - uplift
2 5,026 (73.350) 11,503 (167.877) Knob/face shear
3 872 (12.719) 3,383 (49.376) Test stopped - uplift
4 16,562 (241.704) 16,962 (247.537) Test stopped - capacity
5 2,062 (30.098) 6,970 (101.714) Test stopped - uplift
6 3,539 (51.642) 9,857 (143.848) Test stopped - uplift
7 7,773 (113.442) 11,210 (163.598) Knob/face shear
8 7,765 (113.318) 10,601 (154.710) Test stopped - back cracked
9 7,656 (111.733) 12,405 (181.044) Test stopped - back cracked
10 6,541 (95.458) 12,112 (176.765) Test stopped - uplift
11 12,496 (182.360) 13,962 (203.757) Test stopped - back cracked
Test No.
Normal Load Peak ShearObserved Failure(c)
lb/ft (kN/m) lb/ft (kN/m)1 7,759 (113.240) 15,635 (228.179) Test stopped - back cracked
2 7,840 (114.409) 15,843 (231.213) Test stopped - back cracked
3 7,761 (113.270) 13,859 (202.255) Knob/face shear
4 16,617 (242.509) 17,070 (249.119) Test stopped - back cracked
5 12,588 (183.705) 17,305 (252.543) Knob/face shear
6 842 (12.294) 6,643 (96.951) Knob/face shear
7 858 (12.522) 6,708 (97.900) Knob/face shear
8 2,324 (33.910) 9,102 (132.827) Test stopped - back cracked
9 3,609 (52.666) 11,747 (171.436) Test stopped - back cracked
10 5,060 (73.848) 10,943 (159.697) Test stopped - back cracked
11 6,612 (96.489) 12,978 (189.395) Test stopped - back cracked
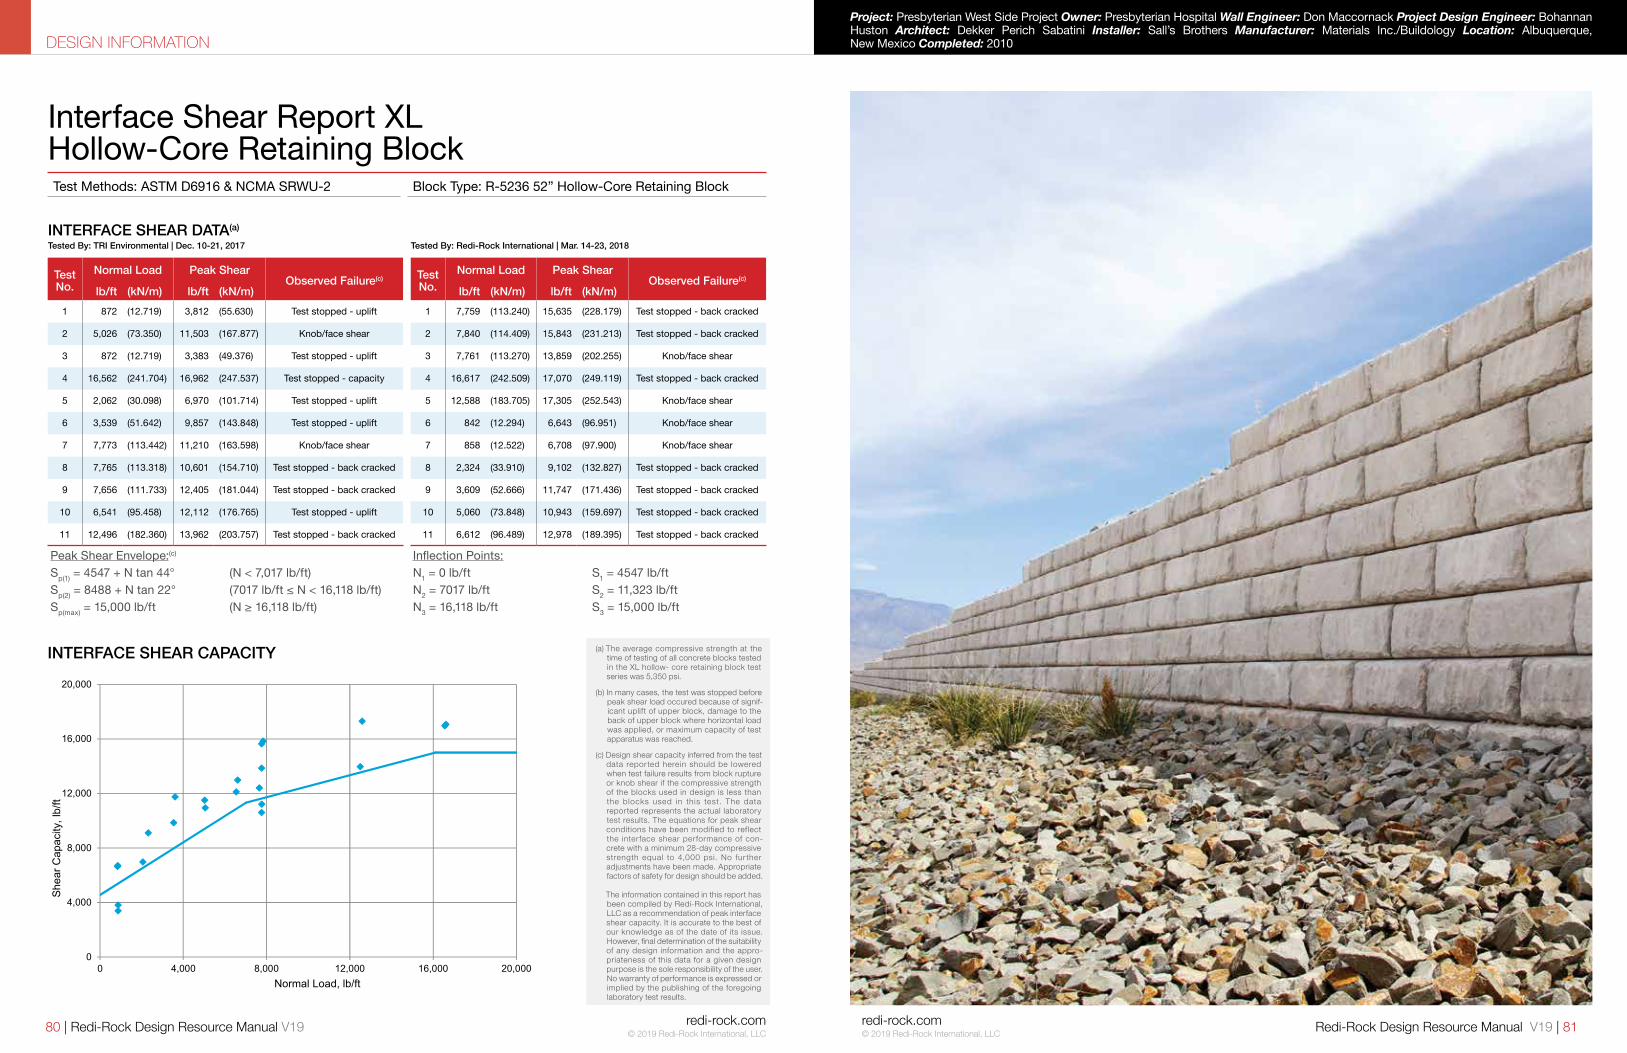
Test Methods: ASTM D6916 & NCMA SRWU-2 Block Type: R-5236 52” Hollow-Core Retaining Block
Interface Shear Report XL Hollow‐Core Retaining Block
(a) The average compressive strength at the time of testing of all concrete blocks tested in the XL hollow- core retaining block test series was 5,350 psi.
(b) In many cases, the test was stopped before peak shear load occured because of signif-icant uplift of upper block, damage to the back of upper block where horizontal load was applied, or maximum capacity of test apparatus was reached.
(c) Design shear capacity inferred from the test data reported herein should be lowered when test failure results from block rupture or knob shear if the compressive strength of the blocks used in design is less than the blocks used in this test. The data reported represents the actual laboratory test results. The equations for peak shear conditions have been modified to reflect the interface shear performance of con-crete with a minimum 28-day compressive strength equal to 4,000 psi. No fur ther adjustments have been made. Appropriate factors of safety for design should be added. The information contained in this report has been compiled by Redi-Rock International, LLC as a recommendation of peak interface shear capacity. It is accurate to the best of our knowledge as of the date of its issue. However, final determination of the suitability of any design information and the appro-priateness of this data for a given design purpose is the sole responsibility of the user. No warranty of performance is expressed or implied by the publishing of the foregoing laboratory test results.
INTERFACE SHEAR CAPACITY
Tested By: Redi-Rock International | Mar. 14-23, 2018INTERFACE SHEAR DATA(a)
Tested By: TRI Environmental | Dec. 10-21, 2017
Peak Shear Envelope:(c) Inflection Points:Sp(1) = 4547 + N tan 44° (N < 7,017 lb/ft) N1 = 0 lb/ft S1 = 4547 lb/ftSp(2) = 8488 + N tan 22° (7017 lb/ft ≤ N < 16,118 lb/ft) N2 = 7017 lb/ft S2 = 11,323 lb/ftSp(max) = 15,000 lb/ft (N ≥ 16,118 lb/ft) N3 = 16,118 lb/ft S3 = 15,000 lb/ft
Interface Shear Report XL Hollow‐Core Retaining BlockTest Methods: ASTM D6916 & NCMA SRWU-2Block Type: R-5236 52" Hollow-Core Retaining Block
INTERFACE SHEAR DATA(a)
Tested By: TRI Environmental | Dec. 10-21, 2017 Tested By: Redi-Rock International | Mar. 14-23, 2018
Test TestNo. No.1 872 (12.719) 3,812 (55.630) Test stopped - uplift 1 7,759 (113.240) 15,635 (228.179) Test stopped - back cracked
2 5,026 (73.350) 11,503 (167.877) Knob/face shear 2 7,840 (114.409) 15,843 (231.213) Test stopped - back cracked
3 872 (12.719) 3,383 (49.376) Test stopped - uplift 3 7,761 (113.270) 13,859 (202.255) Knob/face shear
4 16,562 (241.704) 16,962 (247.537) Test stopped - capacity 4 16,617 (242.509) 17,070 (249.119) Test stopped - back cracked
5 2,062 (30.098) 6,970 (101.714) Test stopped - uplift 5 12,588 (183.705) 17,305 (252.543) Knob/face shear
6 3,539 (51.642) 9,857 (143.848) Test stopped - uplift 6 842 (12.294) 6,643 (96.951) Knob/face shear
7 7,773 (113.442) 11,210 (163.598) Knob/face shear 7 858 (12.522) 6,708 (97.900) Knob/face shear
8 7,765 (113.318) 10,601 (154.710) Test stopped - back cracked 8 2,324 (33.910) 9,102 (132.827) Test stopped - back cracked
9 7,656 (111.733) 12,405 (181.044) Test stopped - back cracked 9 3,609 (52.666) 11,747 (171.436) Test stopped - back cracked
10 6,541 (95.458) 12,112 (176.765) Test stopped - uplift 10 5,060 (73.848) 10,943 (159.697) Test stopped - back cracked
11 12,496 (182.360) 13,962 (203.757) Test stopped - back cracked 11 6,612 (96.489) 12,978 (189.395) Test stopped - back cracked
Peak Shear Envelope:(c) Inflection Points: Sp(1) = 4547 + N tan 44° (N < 7,017 lb/ft) N1 = 0 lb/ft S1 = 4547 lb/ft Sp(2) = 8488 + N tan 22° (7017 lb/ft ≤ N < 16,118 lb/ft) N2 = 7017 lb/ft S2 = 11,323 lb/ft Sp(max) = 15,000 lb/ft (N ≥ 16,118 lb/ft) N3 = 16,118 lb/ft S3 = 15,000 lb/ft
INTERFACE SHEAR CAPACITY
Normal Loadlb/ft (kN/m)
Peak Shearlb/ft (kN/m)
Normal Loadlb/ft (kN/m)
Observed ObservedFailure(b) Failure(b)
Peak Shearlb/ft (kN/m)
The information contained in this report has beencompiled by Redi-Rock International, LLC as arecommendation of peak interface shear capacity. It isaccurate to the best of our knowledge as of the date ofits issue. However, final determination of the suitabilityof any design information and the appropriateness ofthis data for a given design purpose is the soleresponsibility of the user. No warranty of performanceis expressed or implied by the publishing of theforegoing laboratory test results.
(a) The average compressive strength at the time oftesting of all concrete blocks tested in the XL hollow-core retaining block test series was 5,350 psi.
(b) In many cases, the test was stopped before peakshear load occured because of significant uplift of upperblock, damage to the back of upper block wherehorizontal load was applied, or maximum capacity oftest apparatus was reached.
(c) Design shear capacity inferred from the test datareported herein should be lowered when test failureresults from block rupture or knob shear if thecompressive strength of the blocks used in design isless than the blocks used in this test. The data reportedrepresents the actual laboratory test results. Theequations for peak shear conditions have been modifiedto reflect the interface shear performance of concretewith a minimum 28-day compressive strength equal to4,000 psi. No further adjustments have been made.Appropriate factors of safety for design should beadded.
0
4,000
8,000
12,000
16,000
20,000
0 4,000 8,000 12,000 16,000 20,000
Shea
r Cap
acity
, lb/
ft
Normal Load, lb/ft
Project: Presbyterian West Side Project Owner: Presbyterian Hospital Wall Engineer: Don Maccornack Project Design Engineer: Bohannan Huston Architect: Dekker Perich Sabatini Installer: Sall’s Brothers Manufacturer: Materials Inc./Buildology Location: Albuquerque, New Mexico Completed: 2010
DESIGN INFORMATION
82 | Redi-Rock Design Resource Manual V19 Redi-Rock Design Resource Manual V19 | 83redi-rock.com© 2019 Redi-Rock International, LLC
redi-rock.com© 2019 Redi-Rock International, LLC
Peak
Con
nect
ion
Cap
acity
, lb/
ft (k
N/m
)
Normal Load, lb/ft (kN/m)
0
2,000(29.2)
4,000(58.4)
6,000(87.6)
6,000(87.6)
5,000(73.0)
4,000(58.4)
3,000(43.8)
2,000(29.2)
1,000(14.6)
0
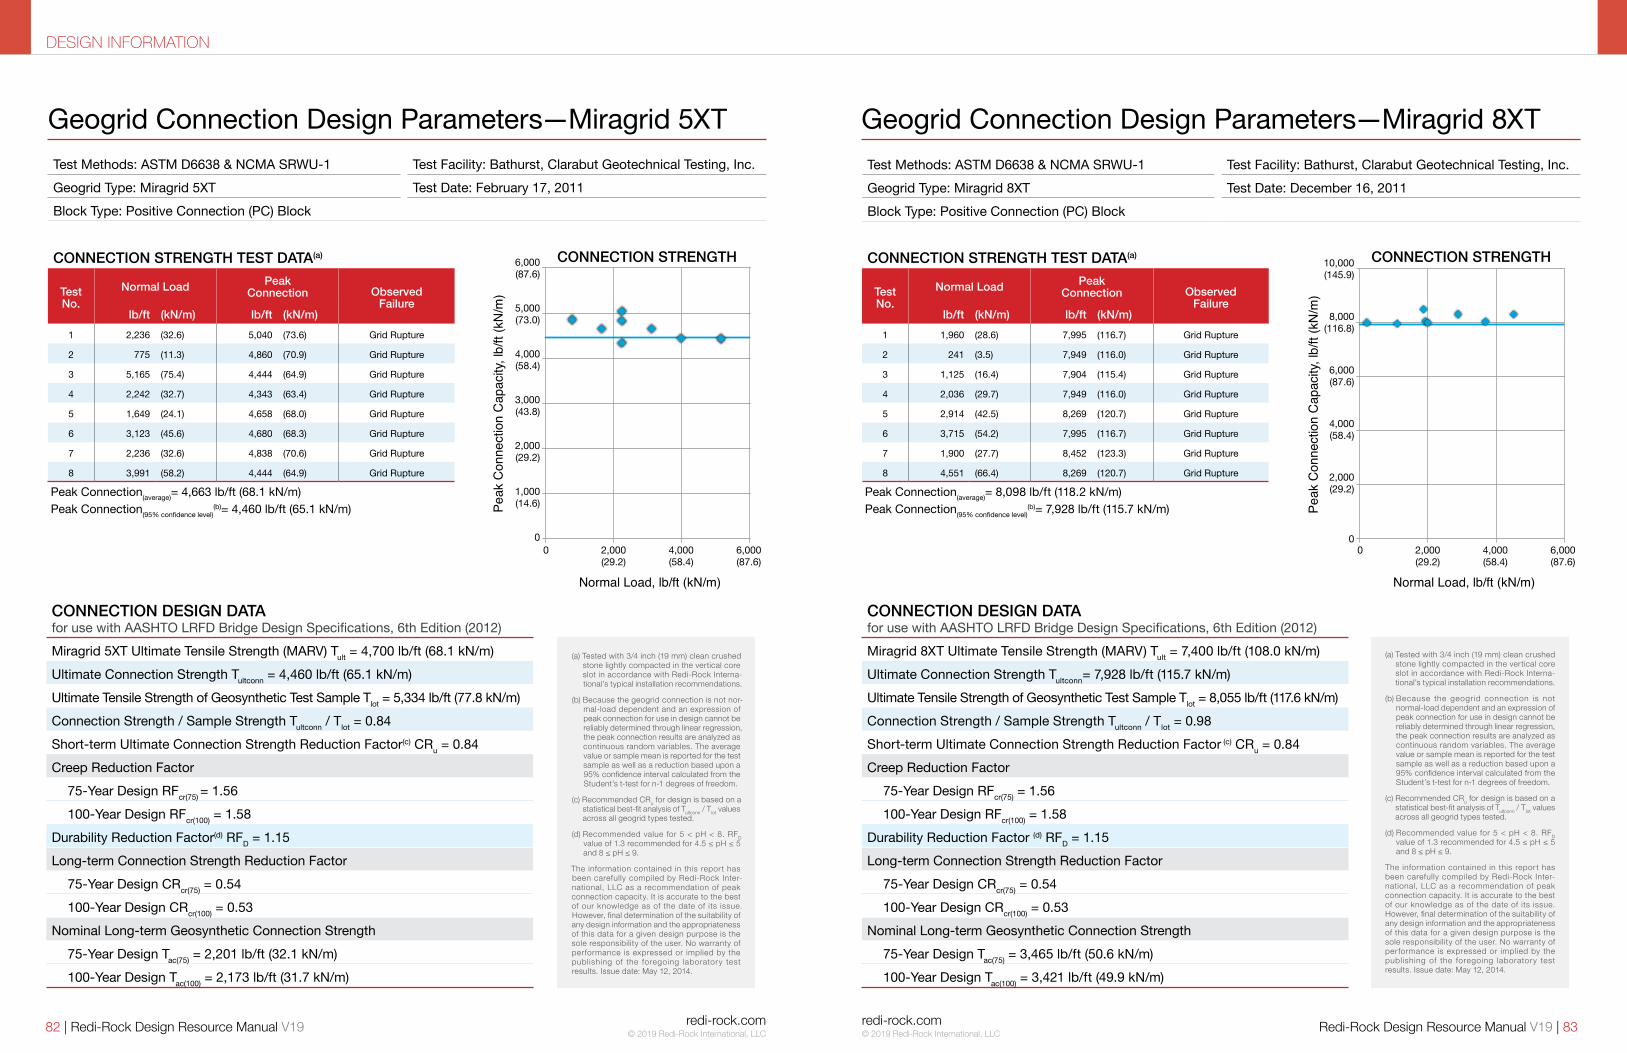
Test Methods: ASTM D6638 & NCMA SRWU-1 Test Facility: Bathurst, Clarabut Geotechnical Testing, Inc.Geogrid Type: Miragrid 5XT Test Date: February 17, 2011Block Type: Positive Connection (PC) Block
Geogrid Connection Design Parameters—Miragrid 5XT
(a) Tested with 3/4 inch (19 mm) clean crushed stone lightly compacted in the vertical core slot in accordance with Redi-Rock Interna-tional’s typical installation recommendations.
(b) Because the geogrid connection is not nor-mal-load dependent and an expression of peak connection for use in design cannot be reliably determined through linear regression, the peak connection results are analyzed as continuous random variables. The average value or sample mean is reported for the test sample as well as a reduction based upon a 95% confidence interval calculated from the Student’s t-test for n-1 degrees of freedom.
(c) Recommended CRu for design is based on a statistical best-fit analysis of Tultconn / Tlot values across all geogrid types tested.
(d) Recommended value for 5 < pH < 8. RFD value of 1.3 recommended for 4.5 ≤ pH ≤ 5 and 8 ≤ pH ≤ 9.
The information contained in this report has been carefully compiled by Redi-Rock Inter-national, LLC as a recommendation of peak connection capacity. It is accurate to the best of our knowledge as of the date of its issue. However, final determination of the suitability of any design information and the appropriateness of this data for a given design purpose is the sole responsibility of the user. No warranty of performance is expressed or implied by the publishing of the foregoing laboratory test results. Issue date: May 12, 2014.
CONNECTION STRENGTH TEST DATA(a)
Test No.
Normal Load Peak Connection Observed
Failurelb/ft (kN/m) lb/ft (kN/m)
1 2,236 (32.6) 5,040 (73.6) Grid Rupture
2 775 (11.3) 4,860 (70.9) Grid Rupture
3 5,165 (75.4) 4,444 (64.9) Grid Rupture
4 2,242 (32.7) 4,343 (63.4) Grid Rupture
5 1,649 (24.1) 4,658 (68.0) Grid Rupture
6 3,123 (45.6) 4,680 (68.3) Grid Rupture
7 2,236 (32.6) 4,838 (70.6) Grid Rupture
8 3,991 (58.2) 4,444 (64.9) Grid Rupture
Peak Connection(average)= 4,663 lb/ft (68.1 kN/m)Peak Connection(95% confidence level)
(b)= 4,460 lb/ft (65.1 kN/m)
CONNECTION DESIGN DATA for use with AASHTO LRFD Bridge Design Specifications, 6th Edition (2012)Miragrid 5XT Ultimate Tensile Strength (MARV) Tult = 4,700 lb/ft (68.1 kN/m)Ultimate Connection Strength Tultconn = 4,460 lb/ft (65.1 kN/m)Ultimate Tensile Strength of Geosynthetic Test Sample Tlot = 5,334 lb/ft (77.8 kN/m)Connection Strength / Sample Strength Tultconn / Tlot = 0.84Short-term Ultimate Connection Strength Reduction Factor(c) CRu = 0.84Creep Reduction Factor
75-Year Design RFcr(75) = 1.56100-Year Design RFcr(100) = 1.58
Durability Reduction Factor(d) RFD = 1.15Long-term Connection Strength Reduction Factor
75-Year Design CRcr(75) = 0.54100-Year Design CRcr(100) = 0.53
Nominal Long-term Geosynthetic Connection Strength75-Year Design Tac(75) = 2,201 lb/ft (32.1 kN/m)100-Year Design Tac(100) = 2,173 lb/ft (31.7 kN/m)
CONNECTION STRENGTH 10,000(145.9)
8,000(116.8)
6,000(87.6)
4,000(58.4)
2,000(29.2)
0
Peak
Con
nect
ion
Cap
acity
, lb/
ft (k
N/m
)
Normal Load, lb/ft (kN/m)
0
2,000(29.2)
4,000(58.4)
6,000(87.6)
Test Methods: ASTM D6638 & NCMA SRWU-1 Test Facility: Bathurst, Clarabut Geotechnical Testing, Inc.Geogrid Type: Miragrid 8XT Test Date: December 16, 2011Block Type: Positive Connection (PC) Block
Geogrid Connection Design Parameters—Miragrid 8XT
CONNECTION STRENGTH TEST DATA(a)
Test No.
Normal Load Peak Connection Observed
Failurelb/ft (kN/m) lb/ft (kN/m)
1 1,960 (28.6) 7,995 (116.7) Grid Rupture
2 241 (3.5) 7,949 (116.0) Grid Rupture
3 1,125 (16.4) 7,904 (115.4) Grid Rupture
4 2,036 (29.7) 7,949 (116.0) Grid Rupture
5 2,914 (42.5) 8,269 (120.7) Grid Rupture
6 3,715 (54.2) 7,995 (116.7) Grid Rupture
7 1,900 (27.7) 8,452 (123.3) Grid Rupture
8 4,551 (66.4) 8,269 (120.7) Grid Rupture
Peak Connection(average)= 8,098 lb/ft (118.2 kN/m)Peak Connection(95% confidence level)
(b)= 7,928 lb/ft (115.7 kN/m)
CONNECTION STRENGTH
CONNECTION DESIGN DATA for use with AASHTO LRFD Bridge Design Specifications, 6th Edition (2012)Miragrid 8XT Ultimate Tensile Strength (MARV) Tult = 7,400 lb/ft (108.0 kN/m)Ultimate Connection Strength Tultconn= 7,928 lb/ft (115.7 kN/m)Ultimate Tensile Strength of Geosynthetic Test Sample Tlot = 8,055 lb/ft (117.6 kN/m)Connection Strength / Sample Strength Tultconn / Tlot = 0.98Short-term Ultimate Connection Strength Reduction Factor (c) CRu = 0.84Creep Reduction Factor
75-Year Design RFcr(75) = 1.56100-Year Design RFcr(100) = 1.58
Durability Reduction Factor (d) RFD = 1.15Long-term Connection Strength Reduction Factor
75-Year Design CRcr(75) = 0.54100-Year Design CRcr(100) = 0.53
Nominal Long-term Geosynthetic Connection Strength75-Year Design Tac(75) = 3,465 lb/ft (50.6 kN/m)100-Year Design Tac(100) = 3,421 lb/ft (49.9 kN/m)
(a) Tested with 3/4 inch (19 mm) clean crushed stone lightly compacted in the vertical core slot in accordance with Redi-Rock Interna-tional’s typical installation recommendations.
(b) Because the geogrid connection is not normal-load dependent and an expression of peak connection for use in design cannot be reliably determined through linear regression, the peak connection results are analyzed as continuous random variables. The average value or sample mean is reported for the test sample as well as a reduction based upon a 95% confidence interval calculated from the Student’s t-test for n-1 degrees of freedom.
(c) Recommended CRu for design is based on a statistical best-fit analysis of Tultconn / Tlot values across all geogrid types tested.
(d) Recommended value for 5 < pH < 8. RFD value of 1.3 recommended for 4.5 ≤ pH ≤ 5 and 8 ≤ pH ≤ 9.
The information contained in this report has been carefully compiled by Redi-Rock Inter-national, LLC as a recommendation of peak connection capacity. It is accurate to the best of our knowledge as of the date of its issue. However, final determination of the suitability of any design information and the appropriateness of this data for a given design purpose is the sole responsibility of the user. No warranty of performance is expressed or implied by the publishing of the foregoing laboratory test results. Issue date: May 12, 2014.

DESIGN INFORMATION
84 | Redi-Rock Design Resource Manual V19 Redi-Rock Design Resource Manual V19 | 85redi-rock.com© 2019 Redi-Rock International, LLC
redi-rock.com© 2019 Redi-Rock International, LLC
10,000(145.9)
8,000(116.8)
6,000(87.6)
4,000(58.4)
2,000(29.2)
0
Peak
Con
nect
ion
Cap
acity
, lb/
ft (k
N/m
)
Normal Load, lb/ft (kN/m)
0
2,000(29.2)
4,000(58.4)
6,000(87.6)
Test Methods: ASTM D6638 & NCMA SRWU-1 Test Facility: Bathurst, Clarabut Geotechnical Testing, Inc.Geogrid Type: Miragrid 10XT Test Date: November 28, 2011Block Type: Positive Connection (PC) Block
(a) Tested with 3/4 inch (19 mm) clean crushed stone lightly compacted in the vertical core slot in accordance with Redi-Rock Interna-tional’s typical installation recommendations.
(b) Because the geogrid connection is not nor-mal-load dependent and an expression of peak connection for use in design cannot be reliably determined through linear regression, the peak connection results are analyzed as continuous random variables. The average value or sample mean is reported for the test sample as well as a reduction based upon a 95% confidence interval calculated from the Student’s t-test for n-1 degrees of freedom.
(c) Recommended CRu for design is based on a statistical best-fit analysis of Tultconn / Tlot values across all geogrid types tested.
(d) Recommended value for 5 < pH < 8. RFD value of 1.3 recommended for 4.5 ≤ pH ≤ 5 and 8 ≤ pH ≤ 9.
The information contained in this report has been carefully compiled by Redi-Rock Inter-national, LLC as a recommendation of peak connection capacity. It is accurate to the best of our knowledge as of the date of its issue. However, final determination of the suitability of any design information and the appropriateness of this data for a given design purpose is the sole responsibility of the user. No warranty of performance is expressed or implied by the publishing of the foregoing laboratory test results. Issue date: May 12, 2014.
CONNECTION STRENGTH TEST DATA(a)
Test No.
Normal Load Peak Connection Observed
Failurelb/ft (kN/m) lb/ft (kN/m)
1 1,990 (29.0) 9,046 (132.0) Grid Rupture
2 228 (3.3) 8,452 (123.3) Grid Rupture
3 1,147 (16.7) 8,589 (125.3) Grid Rupture
4 2,067 (30.2) 9,365 (136.7) Grid Rupture
5 2,918 (42.6) 8,863 (129.3) Grid Rupture
6 3,830 (55.9) 9,594 (140.0) Grid Rupture
7 2,067 (30.2) 9,000 (131.3) Grid Rupture
8 4707 (68.7) 9,046 (132.0) Grid Rupture
Peak Connection(average)= 8,994 lb/ft (131.3 kN/m)Peak Connection(95% confidence level)
(b)= 8,681 lb/ft (126.7 kN/m)
CONNECTION DESIGN DATA for use with AASHTO LRFD Bridge Design Specifications, 6th Edition (2012)Miragrid 10XT Ultimate Tensile Strength (MARV) Tult = 9,500 lb/ft (138.6 kN/m)Ultimate Connection Strength Tultconn= 8,681 lb/ft (126.7 kN/m)Ultimate Tensile Strength of Geosynthetic Test Sample Tlot = 10,635 lb/ft (155.2 kN/m)Connection Strength / Sample Strength Tultconn / Tlot = 0.82Short-term Ultimate Connection Strength Reduction Factor (c) CRu = 0.82Creep Reduction Factor
75-Year Design RFcr(75) = 1.56100-Year Design RFcr(100) = 1.58
Durability Reduction Factor (d) RFD = 1.15Long-term Connection Strength Reduction Factor
75-Year Design CRcr(75) = 0.53100-Year Design CRcr(100) = 0.52
Nominal Long-term Geosynthetic Connection Strength75-Year Design Tac(75) = 4,342 lb/ft (63.4 kN/m)100-Year Design Tac(100) = 4,287 lb/ft (62.6 kN/m)
CONNECTION STRENGTH
Geogrid Connection Design Parameters—Miragrid 10XT
Peak
Con
nect
ion
Cap
acity
, lb/
ft (k
N/m
)
Normal Load, lb/ft (kN/m)
0
2,000(29.2)
4,000(58.4)
6,000(87.6)
15,000(218.9)
12,000(175.1)
9,000(131.3)
6,000(87.6)
3,000(43.8)
0
Test Methods: ASTM D6638 & NCMA SRWU-1 Test Facility: Bathurst, Clarabut Geotechnical Testing, Inc.Geogrid Type: Miragrid 20XT Test Date: December 16, 2011Block Type: Positive Connection (PC) Block
CONNECTION STRENGTH
CONNECTION DESIGN DATA for use with AASHTO LRFD Bridge Design Specifications, 6th Edition (2012)Miragrid 20XT Ultimate Tensile Strength (MARV) Tult = 13,705 lb/ft (200.0 kN/m)Ultimate Connection Strength Tultconn= 13,447 lb/ft (196.2 kN/m)Ultimate Tensile Strength of Geosynthetic Test Sample Tlot = 16,397 lb/ft (239.3 kN/m)Connection Strength / Sample Strength Tultconn / Tlot = 0.82Short-term Ultimate Connection Strength Reduction Factor (c) CRu = 0.80Creep Reduction Factor
75-Year Design RFcr(75) = 1.56100-Year Design RFcr(100) = 1.58
Durability Reduction Factor (d) RFD = 1.15Long-term Connection Strength Reduction Factor
75-Year Design CRcr(75) = 0.51100-Year Design CRcr(100) = 0.51
Nominal Long-term Geosynthetic Connection Strength75-Year Design Tac(75) = 6,111 lb/ft (89.2 kN/m)100-Year Design Tac(100) = 6,034 lb/ft (88.1 kN/m)
(a) Tested with 3/4 inch (19 mm) clean crushed stone lightly compacted in the vertical core slot in accordance with Redi-Rock Interna-tional’s typical installation recommendations.
(b) Because the geogrid connection is not nor-mal-load dependent and an expression of peak connection for use in design cannot be reliably determined through linear regression, the peak connection results are analyzed as continuous random variables. The average value or sample mean is reported for the test sample as well as a reduction based upon a 95% confidence interval calculated from the Student’s t-test for n-1 degrees of freedom.
(c) Recommended CRu for design is based on a statistical best-fit analysis of Tultconn / Tlot values across all geogrid types tested.
(d) Recommended value for 5 < pH < 8. RFD value of 1.3 recommended for 4.5 ≤ pH ≤ 5 and 8 ≤ pH ≤ 9.
The information contained in this report has been carefully compiled by Redi-Rock Inter-national, LLC as a recommendation of peak connection capacity. It is accurate to the best of our knowledge as of the date of its issue. However, final determination of the suitability of any design information and the appropriateness of this data for a given design purpose is the sole responsibility of the user. No warranty of performance is expressed or implied by the publishing of the foregoing laboratory test results. Issue date: May 12, 2014.
Geogrid Connection Design Parameters—Miragrid 20XT
CONNECTION STRENGTH TEST DATA(a)
Test No.
Normal Load Peak Connection Observed
Failurelb/ft (kN/m) lb/ft (kN/m)
1 2,608 (38.1) 13,797 (201.4) Grid Rupture
2 802 (11.7) 13,980 (204.0) Grid Rupture
3 1,654 (24.1) 13,934 (203.4) Grid Rupture
4 2,521 (36.8) 14,299 (208.7) Grid Rupture
5 3,527 (51.5) 12,837 (187.3) Grid Rupture
6 4,302 (62.8) 13,797 (201.4) Grid Rupture
7 2,573 (37.6) 14,345 (209.3) Grid Rupture
8 5,196 (75.8) 13,706 (200.0) Grid Rupture
Peak Connection(average)= 13,837 lb/ft (201.9 kN/m)Peak Connection(95% confidence level)
(b)= 13,447 lb/ft (196.2 kN/m)

DESIGN INFORMATION
86 | Redi-Rock Design Resource Manual V19 Redi-Rock Design Resource Manual V19 | 87redi-rock.com© 2019 Redi-Rock International, LLC
redi-rock.com© 2019 Redi-Rock International, LLC
Peak
Con
nect
ion
Cap
acity
, lb/
ft (k
N/m
)
Normal Load, lb/ft (kN/m)
0
2,000(29.2)
4,000(58.4)
6,000(87.6)
24,000(350.2)
20,000(291.9)
16,000(233.5)
12,000(175.1)
8,000(116.8)
4,000(58.4)
0
Test Methods: ASTM D6638 & NCMA SRWU-1 Test Facility: Bathurst, Clarabut Geotechnical Testing, Inc.Geogrid Type: Miragrid 24XT Test Date: February 29, 2012Block Type: Positive Connection (PC) Block
(a) Tested with 3/4 inch (19 mm) clean crushed stone lightly compacted in the vertical core slot in accordance with Redi-Rock Interna-tional’s typical installation recommendations.
(b) Because the geogrid connection is not nor-mal-load dependent and an expression of peak connection for use in design cannot be reliably determined through linear regression, the peak connection results are analyzed as continuous random variables. The average value or sample mean is reported for the test sample as well as a reduction based upon a 95% confidence interval calculated from the Student’s t-test for n-1 degrees of freedom.
(c) Recommended CRu for design is based on a statistical best-fit analysis of Tultconn / Tlot values across all geogrid types tested.
(d) Recommended value for 5 < pH < 8. RFD value of 1.3 recommended for 4.5 ≤ pH ≤ 5 and 8 ≤ pH ≤ 9.
The information contained in this report has been carefully compiled by Redi-Rock Inter-national, LLC as a recommendation of peak connection capacity. It is accurate to the best of our knowledge as of the date of its issue. However, final determination of the suitability of any design information and the appropriateness of this data for a given design purpose is the sole responsibility of the user. No warranty of performance is expressed or implied by the publishing of the foregoing laboratory test results. Issue date: May 12, 2014.
CONNECTION STRENGTH TEST DATA(a)
Test No.
Normal Load Peak Connection Observed
Failurelb/ft (kN/m) lb/ft (kN/m)
1 4,046 (59.0) 20,375 (297.4) Grid Rupture
2 4,362 (63.7) 22,020 (321.4) Grid Rupture
3 665 (9.7) 22,568 (329.4) Grid Rupture
4 2,538 (37.0) 20,832 (304.0) Grid Rupture
5 1,713 (25.0) 21,746 (317.4) Grid Rupture
6 5,248 (76.6) 21,837 (318.7) Block & Grid
7 2,539 (37.1) 19,914 (290.6) Grid Rupture
8 4,063 (59.3) 21,015 (306.7) Block Rupture
Peak Connection(average)= 21,288 lb/ft (310.7 kN/m)Peak Connection(95% confidence level)
(b)= 20,535 lb/ft (299.7 kN/m)
CONNECTION DESIGN DATA for use with AASHTO LRFD Bridge Design Specifications, 6th Edition (2012)Miragrid 24XT Ultimate Tensile Strength (MARV) Tult = 27,415 lb/ft (400.1 kN/m)Ultimate Connection Strength Tultconn= 20,535 lb/ft (299.7 kN/m)Ultimate Tensile Strength of Geosynthetic Test Sample Tlot = 29,130 lb/ft (425.1 kN/m)Connection Strength / Sample Strength Tultconn / Tlot = 0.70Short-term Ultimate Connection Strength Reduction Factor(c) CRu = 0.70Creep Reduction Factor
75-Year Design RFcr(75) = 1.56100-Year Design RFcr(100) = 1.58
Durability Reduction Factor (d) RFD = 1.15Long-term Connection Strength Reduction Factor
75-Year Design CRcr(75) = 0.45100-Year Design CRcr(100) = 0.45
Nominal Long-term Geosynthetic Connection Strength75-Year Design Tac(75) = 10,773 lb/ft (157.2 kN/m)100-Year Design Tac(100) = 10,636 lb/ft (155.2 kN/m)
CONNECTION STRENGTH
Geogrid Connection Design Parameters—Miragrid 24XT
Geogrid estimating for a project is a simple process:
• Determine the cut length of strips for your different wall sections.
• Roll length / cut length = number of whole strips you can get from each roll of geogrid.
• Total number of required strips / number of strips per roll = total number of rolls you need to order.
Geogrid Packaging, Ordering, and Delivery
Geogrid for Redi-Rock Positive Con-nection (PC) System retaining walls is provided in 12 inch (305 millimeter) wide strips in 200 feet (61 meters) long rolls. Geogrids approved for use are Mirafi XT manufactured by Ten-Cate Geosynthetics of Pendergrass,
Georgia, USA. The geogrid strips are factory cut to width and are certified for width and strength by TenCate Mirafi. Other geogrid products or strips that are field cut to width from larger rolls are not allowed.
Geogrid strips are available exclu-sively through the Redi-Rock network of independently-owned and -operated, licensed manufac-turers. Contact information for the Redi-Rock manufacturer in your area is available at redi-rock.com.
Typically, the geogrid strips are ordered by the pallet. If your proj-ect doesn’t require a full pallet of geogrid strips, smaller tube quan-tities may be available from your Redi-Rock manufacturer.
Additionally, custom roll lengths between 150 feet (45 meters) and 250 feet (76 meters) are available in quantities greater than 48 pallets of the same geogrid type. Plan ahead because a minimum 10 week lead time is required for custom lengths.
GEOGRID ESTIMATING
Geogrid Rolls Per Pallet Pallet Weight5XT 60 743 lb (337 kg)8XT 48 764 lb (346 kg)10XT 48 958 lb (434 kg)20 XT 27 503 lb (228 kg)24XT 27 1,478 lb (670 kg)
Type Rolls per linear foot Rolls per linear meter5XT ±0.26 ±0.8510XT ±0.30 ±1.00
The preliminary charts list an approximate length of geogrid for estimating purposes. The example below is for a 21 foot (6.4 meter) tall wall section in 30° soil with no surcharge loads or slopes:
In this example, the geogrid required to build a 100 foot (30.5 meter) long section of wall (26 blocks long) is:
100 x 0.26 = 26 rolls of 5XT100 x 0.30 = 30 rolls of 10XT(This information is included with each cross section in the Preliminary Reinforcement Schedule in the MSE Wall section of the DRM.)
The geogrid is packaged with 3 rolls on each cardboard tube. Total number of rolls that can be placed on a pallet varies with product type.

Redi-Rock Design Resource Manual V19 | 89redi-rock.com© 2019 Redi-Rock International, LLC
DESIGN INFORMATION
88 | Redi-Rock Design Resource Manual V19 redi-rock.com© 2019 Redi-Rock International, LLC
Minimum Turning Radius
18-INCH (457 mm) HIGH BLOCKS 36-INCH (914 mm) HIGH XL BLOCKS
Height of Wall Radius From Face of Block Radius From Face of Block1’-6” (0.46 m) 14’-6” (4.42 m)
3’-0” (0.91 m) 14’-8” (4.47 m)
4’-6” (1.37 m) 14’-10” (4.52 m)
6’-0” (1.83 m) 15’-0” (4.57 m) 15’-0” (4.57 m)
7’-6” (2.29 m) 15’-2” (4.62 m) 15’-2” (4.62 m)
9’-0” (2.74 m) 15’-4” (4.67 m) 15’-4” (4.67 m)
10’-6” (3.20 m) 15’-6” (4.72 m) 15’-6” (4.72 m)
12’-0” (3.66 m) 15’-8” (4.78 m) 15’-8” (4.78 m)
13’-6” (4.11 m) 15’-10” (4.83 m) 15’-10” (4.83 m)
15’-0” (4.57 m) 16’-0” (4.88 m) 16’-0” (4.88 m)
16’-6” (5.03 m) 16’-2” (*.** m)
18’-0” (5.49 m) 6’-4” (4.98 m)
19’-6” (5.94 m) 16’-6” (5.03 m)
21’-0” (6.4 m) 16’-8” (95.08 m)
MINIMUM RADIUS FOR BOTTOM ROW OF BLOCKS
Exposed UntexturedBlock Surface
Convex curves can easily beincorporated into a Redi-Rock wall.Redi-Rock blocks are tapered 71
2° oneach side. The smallest radius that canbe made with Redi-Rock blocks (withoutcutting the blocks) occurs when theblocks are placed together with theirsides touching. This minimum radius for
full size blocks is 14 feet - 6 inches (4.42m) from the face of the blocks.Block to block setback will cause theradius for each succeeding row to besmaller than the row below. To ensurethe minimum radius for the top row ofblocks in a wall, start with the minimumradius and then add 2” (51 mm) per
course for each standard setbackblock 18-inch highblock, 10” (254 mm) per course foreach 9” (230 mm) setbackblock, and 17” (432 mm) per course foreach planter block in the wall below thetop row of blocks. For 36-inch high XLblocks, add 4 inches per row.
Minimum Turning RadiusDESIGN INFORMATION
Concave curves may be installed at varying radii. The blocks should be placed tight together to make a smooth curve. Althoughthere is no fixed minimum radius, smaller radii lengths of less than 14'6” (4.42 m) will result in exposing more of the untextured topface of the blocks in the underlying layer.
Minimum Radius (Bottom Row)
Top Blocks Tight Together
HEIGHTOF WALL
RADIUS FROMFACE OF BLOCK
1'-6" (0.46 m) 14'-6" (4.42 m)
3'-0" (0.91 m) 14'-8" (4.47 m)
4'-6" (1.37 m) 14'-10" (4.52 m)
6'-0" (1.83 m) 15'-0" (4.57 m)
7'-6" (2.29 m) 15'-2" (4.62 m)
9'-0" (2.74 m) 15'-4" (4.67 m)
10'-6" (3.20 m) 15'-6" (4.72 m)
12'-0" (3.66 m) 15'-8" (4.78 m)
13'-6" (4.11 m) 15'-10" (4.83 m)
15'-0" (4.57 m) 16'-0" (4.88 m)
MINIMUM RADIUS FOR BOTTOM ROW OF BLOCKS
Reco
mm
ende
d M
in.
Radiu
s = 1
4'-6"
(4.4
2 m
) (Bo
ttom
Row
)
14'-6" (4.42 m)
(Top Row)
RADIUS FROMFACE OF BLOCK
18-INCH (457 mm) HIGH BLOCKS 36-INCH (914 mm) HIGH XL BLOCKS
16'-6" (5.03 m)
18'-0" (5.49 m)
19'-6" (5.94 m)
21'-0" (6.4 m)
15'-0" (4.57 m)
15'-2" (4.62 m)
15'-4" (4.67 m)
15'-6" (4.72 m)
15'-8" (4.78 m)
15'-10" (4.83 m)
16'-0" (4.88 m)
16'-2" (*.** m)
16'-4" (4.98 m)
16'-6" (5.03 m)
16'-8" (5.08 m)
Convex curves can easily be incorporated into a Redi-Rock wall. Redi-Rock blocks are tapered 7½° on each side. The smallest radius that can be made with Redi-Rock blocks (without cutting the blocks) occurs when the blocks are placed together with their sides touching. This minimum radius for full size
blocks is 14 feet - 6 inches (4.42 m) from the face of the blocks.
Block to block setback will cause the radius for each succeeding row to be smaller than the row below. To ensure the minimum radius for the top row of blocks in a wall, start with the minimum radius and then
add 2” (51 mm) per course for each standard setback block 18-inch high block, 10” (254 mm) per course for each 9” (230 mm) setback block, and 17” (432 mm) per course for each planter block in the wall below the top row of blocks. For 36-inch high XL blocks, add 4” (101.6 mm) per row.
Project: Pigeon Forge Park Customer: City of Pigeon Forge, Tennessee Block Manufacturer: Blalock Ready Mix Location: Pigeon Forge, Tennessee Completed: 2013

DESIGN INFORMATION
90 | Redi-Rock Design Resource Manual V19 Redi-Rock Design Resource Manual V19 | 91redi-rock.com© 2019 Redi-Rock International, LLC
redi-rock.com© 2019 Redi-Rock International, LLC
Redi-Rock publishes a great resource created especially for engineers who are considering, designing, or reviewing a mechanically stabilized earth wall utilizing the Redi-Rock PC System. Inside the PC
System Design Guide you will find an overview of the system, sample projects, components, MSEW inputs, and an example problem. This 30 page document is available for immediate download at redi-rock.com.
Positive Connection (PC) Design Guide
• System overview
• Case Studies
• Description of system components
• Recommended connection design parameters
• Recommended MSEW input parameters
• Example problem
IN THE PC DESIGN GUIDE, YOU’LL FIND:
As a retaining wall engineer, you don’t want to be kept up at night wondering about a wall failure. The Redi-Rock system comes with two robust design software packages to provide the peace of mind you need.
Developed by FINE Software, the geotechnical experts that developed the full suite of GEO5 programs, both versions of Redi-Rock Wall provide an amazing amount of control over every aspect of your design, allowing you to optimize your wall from top to bottom.
• Design and analyze gravity walls• Bearing capacity and slope stability modules• ASD or LRFD calculation capacity• 3D visualization
• Design and analyze gravity walls and MSE walls using Positive Connection (PC) blocks
• Includes full GEO5 Settlement, Slope Stability, and Spread Footing modules
• ASD or LRFD calculation capacity• 3D visualization
Redi-Rock Wall Freeware & ProfessionalTHE software tools to optimize your Redi-Rock designs
REDI-ROCK WALL FREEWARE REDI-ROCK WALL PROFESSIONAL
Thousands of engineers download the freeware every year. Get your copy today at redi-rock.com/freeware.
Upgrade to Redi-Rock Wall Professional to take your designs to new heights. Lease, buy, or demo the software at redi-rock.com/pro.