QUT Digital Repository: · The working principle of stereolithography is based on spatially...
26
QUT Digital Repository: http://eprints.qut.edu.au/ This is the accepted version of this journal article: Melchels, Ferry P.W. and Bertoldi, Katia and Gabbrielli, Ruggero and Velders, Aldrik and Feijen, Jan and Grijpma, Dirk W. (2010) Mathematically defined tissue engineering scaffold architectures prepared by stereolithography. Biomaterials, 31(27). pp. 6909‐6916. © Copyright 2010 Elsevier Ltd All rights reserved.
-
Upload
trinhquynh -
Category
Documents
-
view
217 -
download
0
Transcript of QUT Digital Repository: · The working principle of stereolithography is based on spatially...

QUT Digital Repository: http://eprints.qut.edu.au/
This is the accepted version of this journal article:
Melchels, Ferry P.W. and Bertoldi, Katia and Gabbrielli, Ruggero and Velders, Aldrik and Feijen, Jan and Grijpma, Dirk W. (2010) Mathematically defined tissue engineering scaffold architectures prepared by stereolithography. Biomaterials, 31(27). pp. 6909‐6916.
© Copyright 2010 Elsevier Ltd All rights reserved.

Mathematically defined tissue
engineering scaffold architectures
prepared by stereolithography
Ferry Melchels1, Katia Bertoldi2, Ruggero Gabbrielli3, Aldrik Velders4, Jan Feijen1 and Dirk Grijpma1,5,*
keywords: rapid prototyping; stereolithography; microstructure; tissue engineering scaffold; three
dimensional printing
1 MIRA Institute for Biomedical Technology and Technical Medicine, Department of Polymer Chemistry and Biomaterials, University of Twente, P.O. Box 217, 7500 AE, Enschede, The Netherlands 2 Department of Multi Scale Mechanics, University of Twente, P.O. Box 217, 7500 AE, Enschede, The Netherlands 3 School of Engineering, Swansea University, SA2 8PP, Swansea, United Kingdom 4 MESA+ Institute for Nanotechnology, University of Twente, P.O. Box 217, 7500 AE, Enschede, The Netherlands 5 Department of Biomedical Engineering, University Medical Centre Groningen and University of Groningen, PO Box 196, 9700 AD, Groningen, The Netherlands * e‐mail: [email protected]; tel. +31 53 489 2966; fax. +31 53 489 2155
Abstract
The technology employed for the preparation of tissue engineering scaffolds restricts the materials
choice and the extent to which the architecture can be designed. Here we show the versatility of
stereolithography with respect to materials and freedom of design. Porous scaffolds are designed
with computer software and built with either a poly(D,L‐lactide)‐based resin or a poly(D,L‐lactide‐co‐
ε‐caprolactone)‐based resin. Characterisation of the scaffolds by micro computed tomography
shows excellent reproduction of the designs. The mechanical properties are evaluated in
compression, and show good agreement with finite element predictions. The mechanical properties
of scaffolds can be controlled by the combination of material and scaffold pore architecture. The
presented technology and materials enable an accurate preparation of tissue engineering scaffolds
with a large freedom of design, and properties ranging from rigid and strong to highly flexible and
elastic.
Introduction
The preparation of porous structures on the micron‐level with full freedom of design is still a
challenge. One application is in tissue engineering, where porous biodegradable structures serve as
temporary supports for the regeneration of tissue [1]. Such scaffolds should comply with the
surrounding native tissue, which imposes requirements on properties such as stiffness, strength,
biocompatibility and biodegradability [2]. Besides the properties of the material, also the pore
architecture of a scaffold is of great influence on its functionality. The architecture influences
mechanical properties, cell adhesion and proliferation, transport phenomena and degradation
behaviour.
Conventional scaffold fabrication techniques such as salt‐leaching, gas‐foaming and phase‐
separation followed by freeze‐drying, allow the tuning of only a few parameters like porosity and
pore size [3]. Advances in rapid prototyping techniques have significantly improved the control over
the whole design of three‐dimensional (3d) solid and porous structures [4, 5]. Among these
techniques are selective laser sintering [5, 6], fused deposition modelling (or 3d fibber plotting) [7],
3d printing [8] and stereolithography [9]. The latter is particularly versatile with respect to the
freedom of design and scale: sub‐micron structures [10] to decimetre‐sized objects [11] can be built.
The working principle of stereolithography is based on spatially controlled solidification of a liquid
photo‐polymerisable resin. Using a computer‐controlled laser beam or digital light projection, and a
computer‐driven support platform, a 3d object can be constructed in a layer‐by‐layer fashion.
Structural parameters such as porosity and pore size, and even gradients thereof, can be freely
varied. While by using fibber plotting methods little variation in patterning of structures is possible,

and laser sintering is limited by the need to process small and monodisperse particles of semi‐
crystalline polymers, stereolithography requires a photo‐sensitive polymer formulation. The
availability of suitable resins is very limited, which in general leads to non‐degradable addition‐type
polymer networks.
When fabricating medical implants such as tissue engineering scaffolds, biodegradability is essential.
A degradable photo‐polymerisable system can be obtained by chain‐crosslinking hydrolysable
oligomers with reactive end‐groups [12, 13]. For example, poly(D,L‐lactide) (PDLLA) functionalised
with methacrylate groups can be crosslinked to form rigid polymer networks [14]. With values of the
elasticity modulus of approximately 3 GPa, poly(D,L‐lactide) polymers are one of the few
biodegradable polymers with mechanical properties that approach those of bone (the E‐modulus of
bone is 3 to 30 GPa [3]). They have been applied in resorbable bone fixation devices clinically and for
use in bone tissue engineering. The ring opening polymerisation of cyclic esters (lactones) and cyclic
carbonates is very versatile, and allows the preparation of oligomers and macromers of a wide
variety of resorbable materials. Introducing �‐caprolactone (CL) by co‐polymerisation reduces the
glass transition temperature and flexible rubber‐like networks are obtained [15]. Copolymers of
lactide and caprolactone have successfully been applied in tissue engineering as well [16]. In this
paper we will show how to design biodegradable porous structures with refined architectures and
prepare these by stereolithography at high resolution. Also, we will show in which ways the
mechanical properties of these scaffolds can be tailored.
Materials and Methods
Design of porous architectures The cube architecture was designed using Rhinoceros 4.0 CAD software (McNeel). Starting from a
solid cube measuring 830x830x830 μm3, a porous construct was obtained by removal of rectangular
beams with cross‐sections of 530x530 μm2 in the three directions. This results in a cubic unit cell
with 150 μm thick struts and a porosity of 70%. K3DSurf v0.6.2 software
(http://k3dsurf.sourceforge.net) was used to generate CAD‐files that describe the surfaces of gyroid
(G) and diamond (D) architectures. The following trigonometric functions with boundary conditions
x,y=[‐6π,6π] and z=[‐12π,12π] were used:
G: cos(x)∙sin(y) + cos(y)∙sin(z) + cos(z)∙sin(x) ‐ 0.60 = 0
D: sin(x)∙sin(y)∙sin(z) + sin(x)∙cos(y)∙cos(z) + cos(x)∙sin(y)∙cos(z) + cos(x)∙cos(y)∙sin(z) – 0.42 = 0
To obtain porous structures with porosities of approximately 70 %, offset values of ‐0.60 for the
gyroid‐ and ‐0.42 for the diamond architecture are required. The gradient in pore size and porosity

of the gyroid structure presented was introduced by adding the term ‐0.032.z to the equation for z‐
values of [‐12π,0]. With this linear term, the porosity is designed to gradually decrease from 70 % at
the mid‐section to 30 % at the bottom end of the structure. Rhinoceros software was used to scale
the CAD‐files of all three architectures to the desired dimensions. The 5x5x10 mm3 designs were
scaled‐up by a factor 1.28, anticipating the shrinkage upon extraction of non‐reactive diluent from
the built structures. Envisiontec Perfactory RP2.0 software was used to slice the 3D CAD‐files. The
stack of bitmaps generated, is the input for the layer‐by‐layer building process.
Macromer synthesis Hydroxyl‐terminated oligomers were synthesised by ring‐opening polymerisation (130 °C, 40 h) of
D,L‐lactide (DLLA, Purac Biochem) using 1,6‐hexanediol (Sigma‐Aldrich) as initiator and stannous
octoate (Sigma‐Aldrich) as catalyst. P(DLLA‐co‐CL) oligomers were synthesised in a similar way, using
an equimolar mixture of D,L‐lactide and ε‐caprolactone (CL, Sigma‐Aldrich). The monomer‐to‐
initiator ratio was adjusted to yield oligomers with a molecular weight of 5 kg.mol‐1 (molecular
weights were confirmed by 1H‐NMR analysis). The termini of the oligomers were reacted with
methacrylic anhydride (Sigma‐Aldrich) in the presence of triethyl amine (Sigma‐Aldrich) (both in a 20
mol % excess) in dried dichloromethane for 5 d to yield methacrylate end‐functionalised lactide
macromers. After precipitation from isopropanol, washing with water and freeze‐drying, pure
macromers with a degree of functionalisation of 92‐99 % (determined by 1H‐NMR analysis) were
obtained.
Fabrication of porous structures The resins used for stereolithography consisted of 58 wt% PDLLA macromer, 40 wt% dry N‐
methylpyrrolidone (NMP, Fluka) as a non‐reactive diluent, 2 wt% ethyl‐2,4,6‐
trimethylbenzoylphenylphosphinate (Lucirin TPO‐L photo‐initiator from BASF), 0.2 wt% Orasol
Orange G dye (Ciba SC) and 0.1 wt% α‐tocopherol inhibitor (Fluka). A commercial stereolithography
apparatus (Envisiontec Perfactory Mini Multilens SLA) was employed to build designed structures.
The building process involves subsequent projections of 1280x1024 pixels, each 32x32 μm2 in size.
Layers with a thickness of 25 μm were cured by irradiating for 30 s with blue light (intensity 16
mW.cm‐2). Uncured excess resin was washed out and the diluent, non‐reacted macromer and photo‐
initiator were extracted from the structures with acetone. The extracted structures were then dried
at 90 °C for 2 d under a nitrogen flow.
A similar resin, containing camphorquinone instead of Lucirin TPO‐L and chloroform instead of NMP,
was used to prepare porous structures by a salt‐leaching process. This resin did not contain a dye.
The resin was mixed with NaCl particles sieved to sizes of 425‐710 μm, brought into tubular

polypropylene moulds (inner diameter 14 mm) and cured by irradiation through the tube wall with a
Kerr dental light (mono‐chromatic blue LED light, wavelength 470 nm, intensity 1000 mW.cm‐2) for
40 s. The specimens were frozen in liquid nitrogen, cut to the desired dimensions, and post‐cured by
heating to 90 °C for 12 hrs. The salt‐containing composites were extracted in acetone for 2 d, and
the salt fraction was leached out with water during a period of 7 d. Then, the porous structures were
dried at 90 °C for 2 d under a nitrogen flow.
Analyses of the porous structures Structural analysis was performed by micro‐computed tomography (μCT) using a GE eXplore Locus
SP scanner (General Electric) at 14.3 μm resolution. Scanning was done at an X‐ray tube voltage of
80 kV, a current of 80 μA and an exposure time of 3000 ms. No filter was applied. After
reconstruction using the Feldkamp algorithm, thresholded isosurface images were obtained (GE
MicroView software). The software was also used to generate pore size distribution maps of the
structures. In these 3D matrices, size values are assigned to pore voxels. These sizes correspond to
the diameter of the largest sphere that can be fitted in the pore space and contains that particular
pore voxel. The maps were used to calculate porosities, pore size distributions, pore surface areas
and pore accessibility curves (Mathworks Matlab 2008). In determining the porosity gradient curve
(Fig. 4), the porosity at a particular scaffold height was determined by taking the pore volume
fraction of every individual voxel plane. The accessibility of the pore networks was quantified by first
thresholding the pore size distribution maps to exclude pores smaller than a certain diameter, then
the remaining pore volume fraction connected to the exterior of the structure was determined. This
was repeated for a range of diameters. To compare the built structures with the software designs,
the latter were evaluated in the same manner as well. For this, the stacks of bitmaps used in the
layer‐by‐layer fabrication of the structures by SLA, were also imported into the μCT analysis
software.
To model and predict the mechanical behaviour of structures with different designed pore
architectures, numerical simulations were conducted. First the compressive response of solid PDLLA
and P(DLLA‐co‐CL) network specimens built by stereolithography was evaluated. Mechanical testing
in compression was done using a Zwick Z020 universal tensile tester in a range of compression rates.
The bulk properties of each material were described mathematically using a constitutive model. The
model was implemented into finite element software code (ABAQUS), which then allowed
simulating and predicting the deformation characteristics of the designed porous structures. See
Supporting Information for details on the development of the constitutive models and the finite
element analysis.

Nuclear magnetic resonance spectroscopy (1H‐NMR) was performed on networks swollen in
deuterated acetone using a Varian 600 MHz apparatus equipped with a high‐resolution probe
operating under magic angle spinning (HR‐MAS) conditions.
Results and Discussion
Design and fabrication of porous structures PDLLA and P(DLLA‐co‐CL) dimethacrylate macromers with a molecular weight of 5 kg.mol‐1 were
dissolved in a non‐reactive diluent together with other resin components and used in the
stereolithography rapid prototyping process. Fig. 1 gives an overview of the designed and built
architectures. Three sophisticated porous architectures were designed: a cube, a diamond, and a
gyroid architecture. The cube architecture is an anisotropic lattice‐like structure, similar to those
that many rapid prototyping methods are restricted to. With the stereolithography technique used
here, each layer is built using a distinct pattern of 1.3x10⁶ light pixels that can be switched on or off
independently. This allows for the fabrication of complex structures such as the diamond and gyroid
architectures. Their surfaces are defined by trigonometric implicit functions, where the spatial
variables are symmetrically ordered within the trigonometric terms. The functions are triply periodic
and are uniquely defined by their unit cell [17]. They closely approximate the minimal surfaces of
Schwarz and Schoen [18, 19], of which the mean curvature is zero at every point. Addition of an
offset value to these implicit functions allows designing porous structures with diamond or gyroid
architectures and specific porosities. The functions employed are presented in the experimental
section.

Figure 1. Visualisations of the different porous architectures. Columns: (1) CAD-designs of the repeating
unit cells (2) CAD-designs of assemblies of 6x6x12 unit cells (3) photos of the built structures (4)
visualisations obtained by μCT-scanning of the built structures. All structures measure approximately
5x5x10 mm.
For the different architectures, space‐filling computer models can be generated from assemblies of
the respective unit cells. Models consisting of 6x6x12 unit cells were then built by stereolithography
using a resin based on PDLLA or P(DLLA‐co‐CL) macromers and a non‐reactive diluent. Upon removal
of the diluent by extraction and drying, the structures shrink by 22 %. This shrinkage is homogenous
and reproducible, and could be compensated for by adjusting the dimensions of the design.
Furthermore, to enable precise control over the depth of curing in the layer‐by‐layer
stereolithography fabrication process, a dye is required to attenuate the light intensity. In our setup

photo‐polymerisation is induced by blue light, and in the resin an orange dye was used. This
determines the colour of the structures built.
For comparison, porous structures with similar average pore sizes and porosities were prepared by a
conventional porogen leaching method. Especially salt‐leaching is a widely used method to prepare
tissue engineering scaffolds. The PDLLA‐based resin containing dispersed salt particles with sizes
ranging from 425‐710 μm was photo‐polymerised, and porous structures were obtained upon
leaching with water. In this case the presence of dye is not required.
The porous structures were analysed by micro computed tomography (μCT), of which visualisations
are shown in the most right column of Fig. 1. The μCT images precisely match the designed models
of the different architectures. It is clear that the structure prepared by salt leaching is much less
regular.
Analyses of built structures To assess the accuracy of the stereolithography technique, a gyroid scaffold built from the PDLLA
material was compared to its computer aided design. The graphical data obtained by μCT scanning
was superimposed on the CAD data, enabling both visual and quantifiable comparisons. Fig. 2 shows
merged images of the gyroid design (in grey) and μCT data (in orange) both in three dimensions and
in two dimensions. It can be seen that over the whole porous structure the designed and built
architectures nearly coincide, indicating a very high accuracy of the technique. In the right of the
figure, a cross‐section of the μCT data of the built structure is depicted as a semi‐transparent overlay
over the CAD cross‐section, showing exactly where the two match. Except for slight shearing of the
built structure in the counter‐clockwise direction and some overcure, the computer aided design is
very well reproduced. When expressed in pixels, the agreement of the CAD and the μCT images of
the built structures is 95 %.
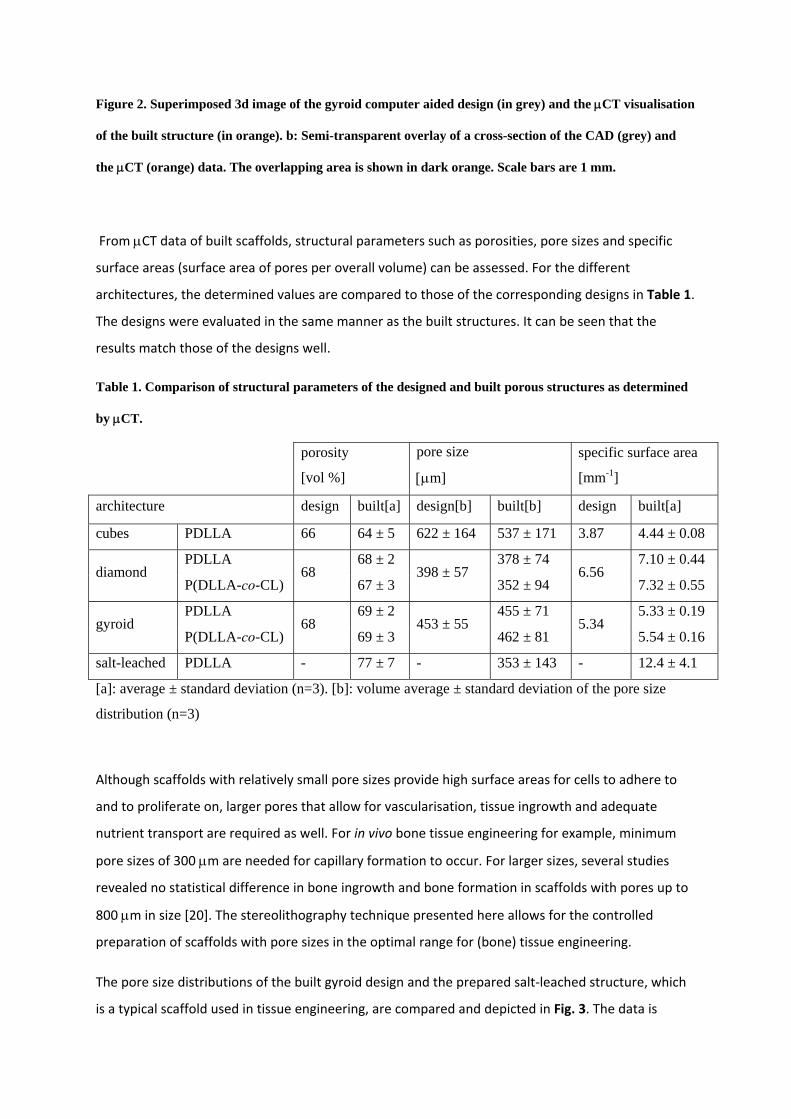
Figure 2. Superimposed 3d image of the gyroid computer aided design (in grey) and the μCT visualisation
of the built structure (in orange). b: Semi-transparent overlay of a cross-section of the CAD (grey) and
the μCT (orange) data. The overlapping area is shown in dark orange. Scale bars are 1 mm.
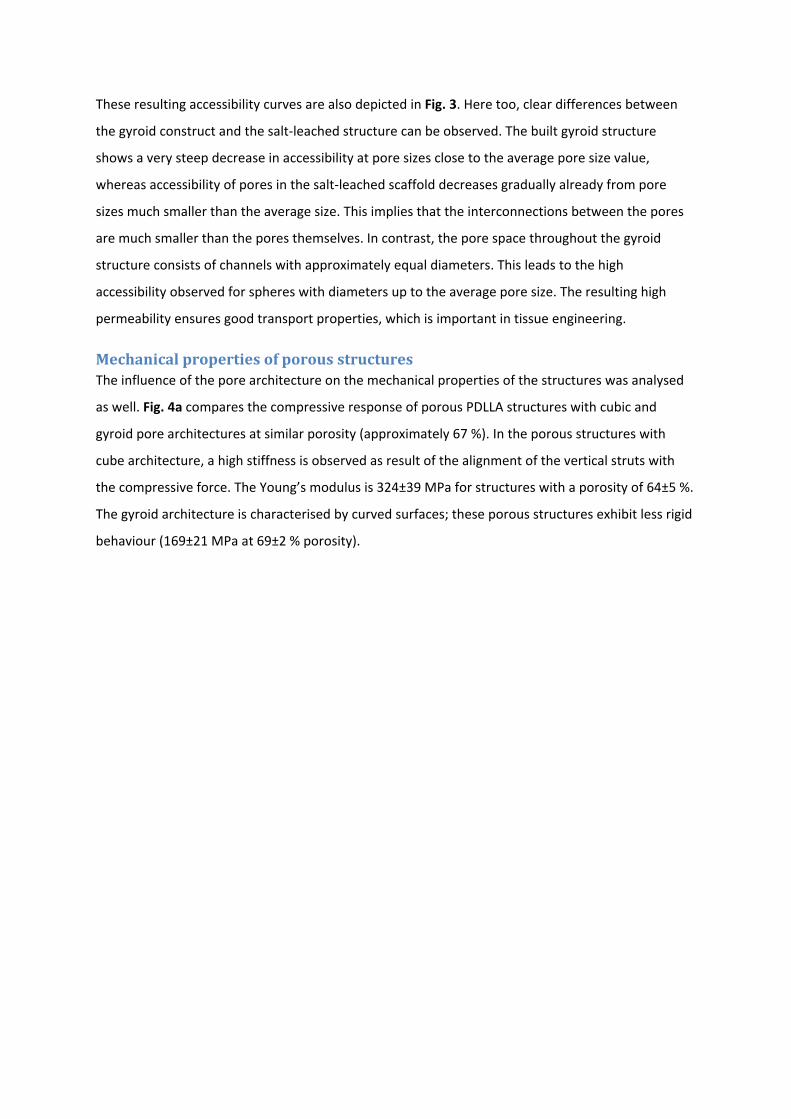
From μCT data of built scaffolds, structural parameters such as porosities, pore sizes and specific
surface areas (surface area of pores per overall volume) can be assessed. For the different
architectures, the determined values are compared to those of the corresponding designs in Table 1.
The designs were evaluated in the same manner as the built structures. It can be seen that the
results match those of the designs well.
Table 1. Comparison of structural parameters of the designed and built porous structures as determined
by μCT.
porosity
[vol %]
pore size
[μm]
specific surface area
[mm-1]
architecture design built[a] design[b] built[b] design built[a]
cubes PDLLA 66 64 ± 5 622 ± 164 537 ± 171 3.87 4.44 ± 0.08
diamond PDLLA
68 68 ± 2
398 ± 57 378 ± 74
6.56 7.10 ± 0.44
P(DLLA-co-CL) 67 ± 3 352 ± 94 7.32 ± 0.55
gyroid PDLLA
68 69 ± 2
453 ± 55 455 ± 71
5.34 5.33 ± 0.19
P(DLLA-co-CL) 69 ± 3 462 ± 81 5.54 ± 0.16
salt-leached PDLLA - 77 ± 7 - 353 ± 143 - 12.4 ± 4.1
[a]: average ± standard deviation (n=3). [b]: volume average ± standard deviation of the pore size
distribution (n=3)
Although scaffolds with relatively small pore sizes provide high surface areas for cells to adhere to
and to proliferate on, larger pores that allow for vascularisation, tissue ingrowth and adequate
nutrient transport are required as well. For in vivo bone tissue engineering for example, minimum
pore sizes of 300 μm are needed for capillary formation to occur. For larger sizes, several studies
revealed no statistical difference in bone ingrowth and bone formation in scaffolds with pores up to
800 μm in size [20]. The stereolithography technique presented here allows for the controlled
preparation of scaffolds with pore sizes in the optimal range for (bone) tissue engineering.
The pore size distributions of the built gyroid design and the prepared salt‐leached structure, which
is a typical scaffold used in tissue engineering, are compared and depicted in Fig. 3. The data is

visualised as an indexed colour‐map and quantitatively presented as a histogram. The relatively
narrow pore size distribution of the built gyroid structure results in a very even colouring in the
indexed colour maps. These pore size distribution maps can also be used to assess the
interconnectivity of the pores in a quantitative manner. Using an algorithm that mimics mercury
porosimetry, the permeation of spheres of different diameters through the pore network is
simulated. For a given sphere size, this simulation will allow to determine the volume of pores that is
accessible for that sphere. This therefore represents the fraction of the pore volume that is
connected to the exterior of the scaffold by channels with diameters larger than that sphere.
Figure 3. Pore size distributions and accessibility curves of built PDLLA gyroid structures and salt-
leached scaffolds from μCT analyses. a: Pore size distribution maps with pore sizes indicated by a colour
scale. b: The bars in the histogram correspond to volume fractions of pores with specific diameters. The
curves represent the pore volume that is accessible for permeating spheres of different diameters in a
simulation.
These resulting accessibility curves are also depicted in Fig. 3. Here too, clear differences between
the gyroid construct and the salt‐leached structure can be observed. The built gyroid structure
shows a very steep decrease in accessibility at pore sizes close to the average pore size value,
whereas accessibility of pores in the salt‐leached scaffold decreases gradually already from pore
sizes much smaller than the average size. This implies that the interconnections between the pores
are much smaller than the pores themselves. In contrast, the pore space throughout the gyroid
structure consists of channels with approximately equal diameters. This leads to the high
accessibility observed for spheres with diameters up to the average pore size. The resulting high
permeability ensures good transport properties, which is important in tissue engineering.
Mechanical properties of porous structures The influence of the pore architecture on the mechanical properties of the structures was analysed
as well. Fig. 4a compares the compressive response of porous PDLLA structures with cubic and
gyroid pore architectures at similar porosity (approximately 67 %). In the porous structures with
cube architecture, a high stiffness is observed as result of the alignment of the vertical struts with
the compressive force. The Young’s modulus is 324±39 MPa for structures with a porosity of 64±5 %.
The gyroid architecture is characterised by curved surfaces; these porous structures exhibit less rigid
behaviour (169±21 MPa at 69±2 % porosity).

Figure 4. Compression stress-strain diagrams of built structures and simulations. a: Stress-strain
diagrams of PDLLA structures with cube and gyroid architectures, at similar porosity. The experimental
data are depicted as average (solid line) ± standard deviation (shaded area) of 5 samples and compared to
the curve predicted by finite element analysis (dashed line). The inserted CAD unit cells show the von
Mises stress distribution at a simulated 4% macroscopic strain. b: Compression stress-strain diagrams of
gyroid structures built from rigid PDLLA and flexible P(DLLA-co-CL) at similar porosity. The insert

presents the experimental data of the flexible gyroid structures as average (solid line) ± standard
deviation (shaded area) of 5 samples and the curve predicted by finite element simulation (dashed line).
Finite element simulations of the compression experiments were conducted using the different CAD
unit cells. For this, the stress‐strain responses of bulk PDLLA and P(DLLA‐co‐CL) were first
determined using solid specimens that were also fabricated from the resins by stereolithography.
Two different constitutive models were then used to capture the experimentally observed behaviour
and were implemented into a finite element software code (see Supporting Information). Direct
comparison shows excellent agreement between the model predictions and the experimental
results. As numerical analyses allow us to predict the mechanical behaviour of porous structures a
priori, it is now possible to optimise scaffold designs with respect to their mechanical properties.
The figure also shows that for gyroid architectures, stress and strain are much more homogeneously
distributed throughout the structure than for cube architectures. A tissue engineering scaffold with
gyroid architecture will expose adhering cells to more equal mechanical stimuli throughout the
structure. As cells respond to deformation of the matrix to which they adhere [21], this could be
beneficial.
Compression data of gyroid structures of similar porosity built from rigid PDLLA and from flexible
P(DLLA‐co‐CL) are shown in Fig. 4b. The difference in the bulk elastic modulus of the different
polymer networks (respectively 2.5x10³ and 2 MPa) is reflected in the global stiffness of the
approximately 70% porous structures (respectively 165 and 0.12 MPa). The structures show
markedly distinct mechanical behaviour: while the PDLLA gyroid structures yield plastically at
approximately 5 % strain and 6 MPa stress, a same structure built from the copolymer can be
reversibly deformed up to 70 % strain and 0.43 MPa stress with little hysteresis. The mechanical
behaviour of the latter structures was unaffected for at least 1000 cycles (Fig. 5). Intermediate
mechanical properties can be obtained by adjusting the copolymer composition, allowing for the
preparation of designed structures that are suitable for the engineering of a wide range of tissues.

Figure 5. Overlay of stress-strain diagrams from cyclic compression (loading-unloading with a strain rate
of 30 %.min-1) of a 69 % porous P(DLLA-co-CL) gyroid structure. Cycle 1, 100 and 1000 are depicted.
Mathematically defined tissue engineering scaffolds Ordered porous structures such as the built gyroid and diamond architectures, are envisaged to be
very well suited for use as scaffolds in tissue engineering [22]. The good accessibility of pores and
resulting high permeability of the scaffold will facilitate the seeding of cells [23] and the transport of
nutrients and metabolites, either during in vitro culture or after implantation in the body.
Furthermore, scaffold morphology is a key factor determining tissue formation, as the pore network
initially provides the spatial template for cell adhesion and proliferation and the deposition of extra‐
cellular matrix [24].
In specific cases, scaffolds with defined but non‐uniform characteristics are desired. Bone tissue for
example, varies spatially in structure and composition. In load‐bearing bone, the properties of the
tissue progressively vary from those of cortical bone to those of trabecular bone. In the engineering
of other tissues, optimal conditions for cell culturing can differ from those of bone. To repair
osteochondral defects, tissue constructs comprising both bone and cartilage are to be engineered
[25]. For this, structures in which gradients of properties such as permeability and stiffness exist are
desired [26].

A gradient in size and volume fraction of the pores can be introduced by adding a linear term to the
mathematical equation used to describe the pore architecture [27]. To part of the design of a
scaffold with gyroid pore architecture, such a term was added. The scaffold was then built by
stereolithography using the PDLLA‐based resin. Fig. 6 shows a μCT‐visualisation of the resulting
scaffold. It is clear that the top half of the structure is much more open than the bottom part, where
a gradient in pore size and porosity can be seen. The right part of the figure is a quantification of the
average porosity as a function of the height of the scaffold, as determined by μCT. These results are
compared to the original design. The graph shows that the porosity gradually decreases from the
middle of the structure downwards. This gradient in porosity and pore size will result in a stiffness
and permeability gradient as well.
Figure 6. Built PDLLA scaffold with gyroid architecture showing a gradient in porosity and pore size. a:
μCT visualisation. b: Change in the average porosity with scaffold height (solid line) in comparison with
the designed porosity (dotted line).
The overall porosity of the built structure is somewhat lower than designed. This was also the case
for the isotropic gyroid structures presented in Fig. 2. It is likely that local warming up of the resin
due to the intensity of the light and the exothermic polymerisation reaction has resulted in overcure.
At lower porosities the absorbed energy per volume is relatively high, and deviation from the design

is more pronounced. Fig. 6 also shows that the effect of overcure is minimal at the boundaries of the
structure, where heat can be exchanged with the surrounding non‐illuminated resin.
In the photo‐initiated polymerisation in stereolithography, the conversion of reactive end groups is
incomplete. After swelling the polymer networks in deuterated acetone, conversions of 85 to 95 %
could be determined by high‐resolution NMR spectroscopy (see Fig. 7 for an example spectrum). The
unreacted double bonds remain available for subsequent covalent functionalisation. These can be
used, for example, to adjust the hydrophilicity of the networks or to immobilise cell‐adhesive
peptides at the surfaces of the porous structures [28].
Figure 7. 1H-NMR spectra (600 MHz) of a PDLLA macromer and network with acetone-d6 as solvent or
swelling agent. High-resolution spectra of networks were obtained under magic angle spinning conditions.
Here, peaks a1 and a2 correspond to the vinyl protons of unreacted methacrylate groups in the network.
Although we demonstrated here the suitability of the stereolithography technique for the
preparation of tissue engineering scaffolds, mathematically defined porous structures can be useful
in many other applications as well. Tight control over the pore size distribution can lead to materials
with photonic band gap properties [29], thermal, acoustic or electrical insulating characteristics, or
to mechanical materials that exhibit negative Poisson ratios [30].
Conclusions
We have shown that stereolithography fabrication methods can be used to accurately prepare tissue
engineering scaffolds with designs that can be modelled, allowing optimisation of the properties of
the structures. By varying the composition of the macromers and the pore architecture, scaffolds
with a large range of mechanical properties can be obtained.
Acknowledgements
We acknowledge the support of the European Union (STEPS project, FP6‐500465) and of NanoNed.
References
[1] Freed LE, Vunjak‐Novakovic G, Biron RJ, Eagles DB, Lesnoy DC, Barlow SK, et al. Biodegradable polymer scaffolds for tissue engineering. Bio‐Technol. 1994;12(7):689‐693. [2] Hutmacher DW. Scaffolds in tissue engineering bone and cartilage. Biomaterials. 2000;21(24):2529‐2543. [3] Yang SF, Leong KF, Du ZH, Chua CK. The design of scaffolds for use in tissue engineering. Part 1. Traditional factors. Tissue Eng. 2001;7(6):679‐689. [4] Hollister SJ. Porous scaffold design for tissue engineering. Nat Mater. 2005;4(7):518‐524. [5] Antonov EN, Bagratashvili VN, Whitaker MJ, Barry JJA, Shakesheff KM, Konovalov AN, et al. Three‐dimensional bioactive and biodegradable scaffolds fabricated by surface‐selective laser sintering. Adv Mater. 2005;17(3):327‐+. [6] Williams JM, Adewunmi A, Schek RM, Flanagan CL, Krebsbach PH, Feinberg SE, et al. Bone tissue engineering using polycaprolactone scaffolds fabricated via selective laser sintering. Biomaterials. 2005;26(23):4817‐4827. [7] Hutmacher DW, Schantz T, Zein I, Ng KW, Teoh SH, Tan KC. Mechanical properties and cell cultural response of polycaprolactone scaffolds designed and fabricated via fused deposition modeling. J Biomed Mater Res. 2001;55(2):203‐216. [8] Giordano RA, Wu BM, Borland SW, Cima LG, Sachs EM, Cima MJ. Mechanical properties of dense polylactic acid structures fabricated by three dimensional printing. J Biomat Sci‐Polym E. 1996;8(1):63‐75. [9] Cooke MN, Fisher JP, Dean D, Rimnac C, Mikos AG. Use of stereolithography to manufacture critical‐sized 3D biodegradable scaffolds for bone ingrowth. J Biomed Mater Res B Appl Biomater. 2003;64B(2):65‐69. [10] Maruo S, Ikuta K. Submicron stereolithography for the production of freely movable mechanisms by using single‐photon polymerization. Sens Actuators A Phys. 2002;100(1):70‐76. [11] Klein HM, Schneider W, Nawrath J, Gernot T, Voy ED, Krasny R. Stereolithography model construction based on 3‐dimensional reconstructions according to CAM. Rofo Fortschr Rontg. 1992;156(5):429‐432. [12] Sawhney AS, Pathak CP, Hubbell JA. Bioerodible hydrogels based on photopolymerized poly(ethylene glycol)‐co‐poly(alpha‐hydroxy acid) diacrylate macromers. Macromolecules. 1993;26(4):581‐587. [13] Ericsson J, Hult A. Novel degradable methacrylate‐based and para‐vinylphenoxy‐based oligomers .1. synthesis and characterization. Makromol Chem. 1991;192(7):1609‐1619. [14] Storey RF, Warren SC, Allison CJ, Wiggins JS, Puckett AD. Synthesis of bioabsorbable networks from methacrylate‐endcapped polyesters. Polymer. 1993;34(20):4365‐4372. [15] Helminen AO, Korhonen H, Seppala JV. Cross‐linked poly(epsilon‐caprolactone/D,L‐lactide) copolymers with elastic properties. Macromol Chem Phys. 2002;203(18):2630‐2639. [16] Matsubayashi K, Fedak PWM, Mickle DAG, Weisel RD, Ozawa T, Li RK. Improved left ventricular aneurysm repair with bioengineered vascular smooth muscle grafts. Circulation. 2003;108(10):219‐225. [17] Vonschnering HG, Nesper R. Nodal surfaces of Fourier‐series ‐ fundamental invariants of structured matter. Z Phys B Con Mat. 1991;83(3):407‐412. [18] Schwarz HA. Gesammelte mathematische Abhandlungen. Berlin: Springer‐Verlag; 1890. [19] Schoen AH. Infinite periodic minimal surfaces without self‐intersections. Nasa Technical Note 5541. Springfield: Clearinghouse for Federal Scientific and Technical Information; 1970.

[20] Karageorgiou V, Kaplan D. Porosity of 3D biomaterial scaffolds and osteogenesis. Biomaterials. 2005;26(27):5474‐5491. [21] Bao G, Suresh S. Cell and molecular mechanics of biological materials. Nat Mater. 2003;2(11):715‐725. [22] Rajagopalan S, Robb RA. Schwarz meets Schwann: Design and fabrication of biomorphic and durataxic tissue engineering scaffolds. Med Image Anal. 2006;10(5):693‐712. [23] Figallo E, Flaibani M, Zavan B, Abatangelo G, Elvassore N. Micropatterned biopolymer 3D scaffold for static and dynamic culture of human fibroblasts. Biotechnol Prog. 2007;23(1):210‐216. [24] Wang HJ, Pieper J, Peters F, van Blitterswijk CA, Lamme EN. Synthetic scaffold morphology controls human dermal connective tissue formation. J Biomed Mater Res. 2005;74A(4):523‐532. [25] Martin I, Miot S, Barbero A, Jakob M, Wendt D. Osteochondral tissue engineering. J Biomech. 2007;40(4):750‐765. [26] Kelly DJ, Prendergast PJ. Prediction of the optimal mechanical properties for a scaffold used in osteochondral defect repair. Tissue Eng. 2006;12(9):2509‐2519. [27] Gabbrielli R, Turner IG, Bowen CR. Development of modelling methods for materials to be used as bone substitutes. Key Eng Mat. 2008;361‐363 II:901‐906. [28] Drumheller PD, Hubbell JA. Polymer networks with grafted cell‐adhesion peptides for highly biospecific cell adhesive substrates. Anal Biochem. 1994;222(2):380‐388. [29] Man WN, Megens M, Steinhardt PJ, Chaikin PM. Experimental measurement of the photonic properties of icosahedral quasicrystals. Nature. 2005;436(7053):993‐996. [30] Lakes R. Foam structures with a negative Poissons ratio. Science. 1987;235(4792):1038‐1040.
Supporting Information: Constitutive models for polymer networks and numerical analysis
1. Constitutive model for crosslinked poly(D,L-lactide) (PDLLA)
1.1 Experimental results
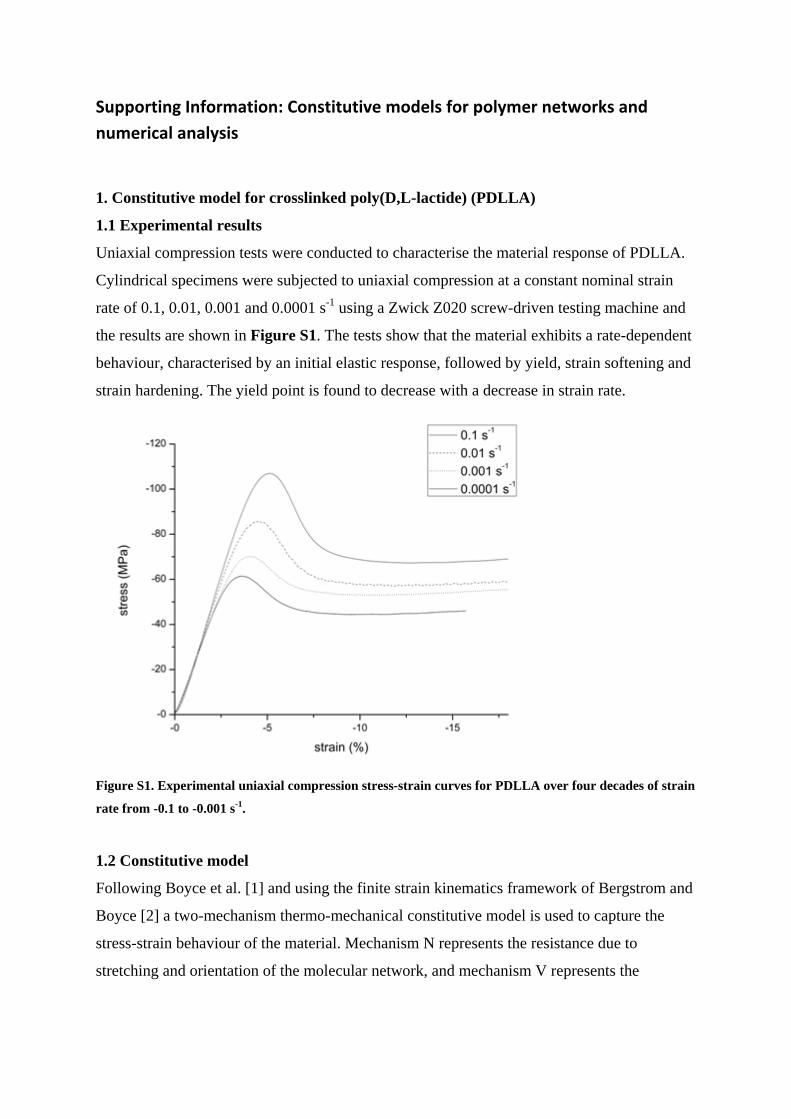
Uniaxial compression tests were conducted to characterise the material response of PDLLA.
Cylindrical specimens were subjected to uniaxial compression at a constant nominal strain
rate of 0.1, 0.01, 0.001 and 0.0001 s-1 using a Zwick Z020 screw-driven testing machine and
the results are shown in Figure S1. The tests show that the material exhibits a rate-dependent
behaviour, characterised by an initial elastic response, followed by yield, strain softening and
strain hardening. The yield point is found to decrease with a decrease in strain rate.
Figure S1. Experimental uniaxial compression stress-strain curves for PDLLA over four decades of strain
rate from -0.1 to -0.001 s-1.
1.2 Constitutive model
Following Boyce et al. [1] and using the finite strain kinematics framework of Bergstrom and
Boyce [2] a two-mechanism thermo-mechanical constitutive model is used to capture the
stress-strain behaviour of the material. Mechanism N represents the resistance due to
stretching and orientation of the molecular network, and mechanism V represents the
resistance to intermolecular interaction. Thus, the total stress acting on the material is given
by the sum of the stress contributions from the two mechanisms:
.N Vσ σ σ= +
1.2.1. Constitutive relations for Mechanism N
Mechanism N is modelled using an 8-chain network model as proposed by Arruda and Boyce
[3], so that the Cauchy stress is given by
1 λμλ
− ⎛ ⎞= ⎜ ⎟
⎝ ⎠chain
chain
N LJ NN B'σ
,
where B’ is the deviatory part of the left Cauchy-Green tensor B=FFT ( = ∂ ∂F x / X being the
total deformation gradient that maps a material point from the reference position X to its
current location x), J=det(F), 3λ =chain
trB
maps the macroscopic deformation to an average
chain stretch and L is the Langevin function defined as
1( ) cothβ β
β= −L
. The shear
modulus and the limiting chain extensibility are denoted by μ and N , respectively.
1.2.2 Constitutive relations for Mechanism V
The deformation gradient F is then decomposed into elastic and plastic contributions
= E PF F F and the Cauchy stress σV is calculated using E
VF as
( )1ln
det 3⎛ ⎞= −⎜ ⎟⎝ ⎠
E EV E
pL V IF
σ,
where =E E EV F R (ER being a rotation tensor) and
EL is the fourth order isotropic elasticity
tensor
4
1 (1 )(1 2 )E E Eν
ν ν ν= + ⊗
+ + −L I I I
,
G and λ being the Lame constants,
4Ithe fourth order identity tensor and I the second
order identity tensor.
The evolution of EF is then determined considering the composition of the spatial velocity
gradient

=& & E E E P E-1 -1L = F F F F + F L F ,
where PL can be further decomposed into
+&P P P P P-1L = F F = D W .
Without losing generality we can assume 0=PW , whereas the viscoplastic stretch rate PD is
constitutively prescribed to be
2
γτ
′&P
P VVD = σ
,
where ′Vσ denotes the deviatory part of Vσ and τ is the equivalent shear stress defined as
1
2τ ′ ′= •V Vσ σ
.
The viscoplastic shear strain rateγ&V is then constitutively prescribed as
0 0exp 1 exp 1τ τγ γ γ
θ α θ α⎛ ⎞ ⎛ ⎞⎛ ⎞ ⎛ ⎞−Δ −Δ
= − − +⎜ ⎟ ⎜ ⎟⎜ ⎟ ⎜ ⎟− −⎝ ⎠ ⎝ ⎠⎝ ⎠ ⎝ ⎠& & &V
G Gk s p k s p ,
where 0γ& is the pre-exponential factor, ΔG is the activation energy, s is the athermal shear
strength, θ is the absolute temperature, p is the pressure and α is the pressure coefficient.
Further, the evolution rule for s is defined as
0 1 γ⎛ ⎞
= −⎜ ⎟⎝ ⎠
&& Vs
ss hs ,
with the initial condition s = s0 when γ&V = 0.
1.3 Material parameters
The PDLLA model parameters determined by curve fitting are listed in Table S1.
Table S1. PDLLA model parameters.
Mechanism V Mechanism N
E
[MPa]
ν 0γ& [103s-1]
ΔG
[10-19J]
s0
[MPa]
ss
[MPa]
h0
[MPa]
α N μ
[MPa]
2100 0.33 1.58 1.05 90.73 30 350 0.075 2.4 22

1.4 Model predictions
Figure S2 reports the experimentally observed rate-dependent behaviour for PDLLA under
uniaxial compression along with the model simulations of these test conditions. The
constitutive model is found to accurately predict the strain rate dependence of the material
behaviour during uniaxial compression at low strain rates. The values of the model
parameters required used in the simulations are listed in Table S1.
Figure S2. Nominal stress–nominal strain behaviour in uniaxial compression at low strain rates:
experimental results (continuous lines) and model predictions (dashed lines).
2. Constitutive model for crosslinked poly(D,L-lactide-co-caprolactone) P(DLLA-co-
CL)
2.1 Experimental Results
Uniaxial compression and tension tests were conducted to characterise the material response
of P(DLLA-co-CL). Cylindrical specimens were subjected to uniaxial compression at a
constant nominal strain rate of 0.1, 0.01, 0.001 and 0.0001 s-1 using Zwick Z020 screw-driven
testing machine. The tests show that the material exhibits behaviour typical for elastomers:
large strain elastic behaviour with negligible rate dependence and negligible hysteresis during
a loading–unloading cycle. The material behaviour at a strain rate of 0.01 s-1 is reported in
Figure S3.

Figure S3. Experimental uniaxial stress-strain curves for P(DLLA-co-CL) at 0.01 s-1.
2.2 Constitutive model
The observed constitutive behaviour is modelled as hyperelastic. Let = ∂ ∂F x / X be the
deformation gradient, mapping a material point from the reference position X to its current
location x and J be its determinant, J=det(F). For an isotropic hyperelastic material the strain
energy density W can be expressed as a function of the invariants of the right Cauchy-Green
tensor C=FTF (or, alternatively, also the left Cauchy-Green tensor B=FFT), W = W(I1, I2, I3),
where
( )2 21 2 3
1tr , tr tr , det
2I I I⎡ ⎤= = − =⎣ ⎦C C C C
,
I1 being essentially a scalar equivalent stretch measure and I3 the square of the volume ratio.
Here the P(DLLA-co-CL) stress–strain behaviour is modelled using a Neo-Hookean model
modified to include compressibility (with a high bulk modulus):
21 3 1( , ) 3 log ( 1)
2 2
KW I I I J + Jμ μ= − −( ) -,
where μ and K are the shear and bulk modulus, respectively. The nominal stress S is found
as
( 1) TW J K JJμμ −∂ ⎡ ⎤= = − −⎢ ⎥∂ ⎣ ⎦
S F + FF .
-60 -40 -20 0 20 40 60 80 100 120 140-6
-5
-4
-3
-2
-1
0
1
2
nominal strain (%)
nom
inal
str
ess
(MP
a)
The material was modelled as nearly incompressible, characterised by K/ μ =1000. From the
compression data shown in Figure S3 the initial Young’s modulus was measured to be 1.35
MPa, so that μ = 1.08 MPa.
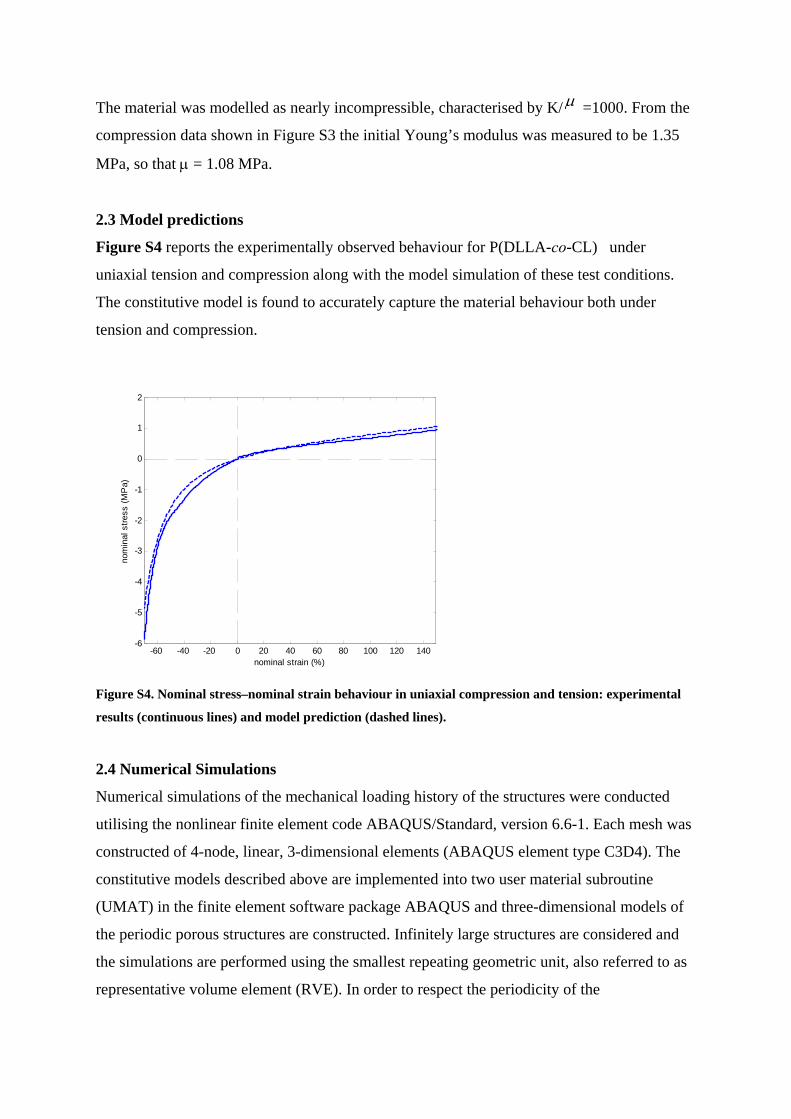
2.3 Model predictions
Figure S4 reports the experimentally observed behaviour for P(DLLA-co-CL) under
uniaxial tension and compression along with the model simulation of these test conditions.
The constitutive model is found to accurately capture the material behaviour both under
tension and compression.
Figure S4. Nominal stress–nominal strain behaviour in uniaxial compression and tension: experimental
results (continuous lines) and model prediction (dashed lines).
2.4 Numerical Simulations
Numerical simulations of the mechanical loading history of the structures were conducted
utilising the nonlinear finite element code ABAQUS/Standard, version 6.6-1. Each mesh was
constructed of 4-node, linear, 3-dimensional elements (ABAQUS element type C3D4). The
constitutive models described above are implemented into two user material subroutine
(UMAT) in the finite element software package ABAQUS and three-dimensional models of
the periodic porous structures are constructed. Infinitely large structures are considered and
the simulations are performed using the smallest repeating geometric unit, also referred to as
representative volume element (RVE). In order to respect the periodicity of the
-60 -40 -20 0 20 40 60 80 100 120 140-6
-5
-4
-3
-2
-1
0
1
2
nominal strain (%)
nom
inal
str
ess
(MP
a)

microstructure, a series of constraint equations are applied to the boundaries of the RVE
providing general periodic boundary conditions.
3. References
[1] Boyce MC, Parks DM, Argon AS. Large inelastic deformation of glassy‐polymers .1. Rate dependent constitutive model. Mech Mater. 1988;7(1):15‐33. [2] Bergstrom JS, Boyce MC. Constitutive modeling of the large strain time‐dependent behavior of elastomers. J Mech Phys Solids. 1998;46(5):931‐954. [3] Arruda EM, Boyce MC. A 3‐dimensional constitutive model for the large stretch behavior of rubber elastic‐materials. J Mech Phys Solids. 1993;41(2):389‐412.