QUT Digital Repository: · Leat, ... using the UFV scores as measured and Series 2 using the UFV...
30
QUT Digital Repository: http://eprints.qut.edu.au/ Leat, Susan J. and Lovie-Kitchin, Janette E. (2008) Visual function, visual attention and mobility performance in low vision. Optometry and Vision Science, 85(11). 1049 -1056. © Copyright 2008 Lippincott, Williams & Wilkins
Transcript of QUT Digital Repository: · Leat, ... using the UFV scores as measured and Series 2 using the UFV...

QUT Digital Repository: http://eprints.qut.edu.au/
Leat, Susan J. and Lovie-Kitchin, Janette E. (2008) Visual function, visual attention and mobility performance in low vision. Optometry and Vision Science, 85(11). 1049 -1056.
© Copyright 2008 Lippincott, Williams & Wilkins
Visual function, visual attention and mobility performance in low
vision.
Susan J. Leat, PhD, FAAO
School of Optometry, University of Waterloo, Waterloo, Ontario N2L 3G1, Canada
Jan E. Lovie-Kitchin, PhD, FAAO
Centre for Health Research, School of Optometry, Queensland University of
Technology, Victoria Park Road, Kelvin Grove, Queensland 4059, Australia
Corresponding author: Susan J. Leat,
School of Optometry, University of Waterloo, Waterloo, Ontario, Canada, N2L 3G1.
Phone: 519-888-4567 ext 32040
Fax 519-725-0784
E mail: [email protected]
1 figure, 3 tables
Date submitted: Aug 18th 2007

Abstract
Purpose: The aim of this study was to determine if useful field of view (UFV) measures
help to predict aspects of orientation and mobility in people with visual impairment. The
UFV is a composite measure of visual attention, ability to detect objects in the presence
of clutter and basic visual functions such as visual field loss and contrast sensitivity.
Methods: Thirty five participants aged 20-80 years with low vision due to a variety of
visual disorders took part. Mobility around a partly indoor and exterior real-life mobility
course was measured, together with UFV and clinical measures of contrast sensitivity
(CS), visual fields and visual acuity. Two series of models were considered; Series 1
using the UFV scores as measured and Series 2 using the UFV scores corrected for visual
field loss (only counting errors in areas of intact visual field).
Results: UFV was found to be an important predictor of some aspects of mobility
performance. Mobility errors were best predicted by uncorrected UFV (R2=0.38),
although CS was also a good predictor. Walking speed and preferred walking speed
(PWS) were best predicted by uncorrected UFV and age (R2=0.575 and 0.573
respectively). The visual detection distance and visual identification distances were best
predicted by clinical vision measures, such as contrast sensitivity, visual fields, and
central vision function. The percent PWS was not predicted by any of the measures we
used. None of these models was improved by the addition of the corrected UFV scores.
Conclusions: These results indicate that attention and the presence of distractors, as well
as visual function and age, are important factors in orientation and mobility performance,
in particular mobility errors, walking speed and PWS.
.

Introduction
Tests of the useful field of view or useful field of vision indicate the efficiency with
which information can be extracted from a cluttered scene, or in situations where
attention may be divided1 . Indeed, useful field of view tests were designed to measure
both sensory and cognitive/attentional factors1,2. A number of studies have shown a
strong age effect – older people make many more errors or require more time to
undertake UFV-type tests1,3-6. The commercially-available UFOV® test was developed by
Ball and colleagues. We used software that was developed by Wood and Troutbeck7 to
measure the useful field of view UFV). There are two main conditions/parameters that
may be measured in the UFV, the effect of clutter (presence of distractors) and the effects
of divided attention. People with low vision were found to have reduced UFV compared
to an age-matched group with normal vision (i.e. they made more errors on the UFV task)
but this difference disappeared once their visual field defects were taken into account6.
Alternatively, Ball et al3 showed that a person may have a normal visual field when
measured in the standard way, but have a significantly reduced useful field of vision. It
therefore seems that other factors, such as higher visual processing and cognition, are
affecting useful field of vision scores.
A number of studies have found that the useful field of view is more highly predictive of
driving ability than conventional visual field tests7-10. Ball et al9 suggested a model to
predict motor vehicle crash frequency. In this model, aspects of visual function, such as
visual field sensitivity and contrast sensitivity add to useful field of view scores, but it

was the useful field of view measures that appeared to have a direct relationship with
crash frequency. More recently, useful field of view has been found to be associated with
performance on other tasks which require attention to complex visual scenes e.g.
mobility11,12 and other everyday tasks13 in older adults. Edwards et al.14 found a
significant increase in timed instrumental activities of daily living and UFOV® for those
subjects who received training in speed of processing. Roth et al15 found an association
between participation in moderate, regular exercise and useful field of view scores in
older adults, after controlling for age, visual acuity and contrast sensitivity. Visual fields
were not measured in their study. However, the authors were careful to point out that
causal relationships cannot be drawn from these data i.e. it is possible that those with
better attentional fields may engage more readily in physical exercise or that exercise
improves attentional fields.
There is now a body of evidence showing that mobility performance in people with visual
impairment is correlated with aspects of visual function. Most studies agree that visual
fields16-20 , together with contrast sensitivity16, 17, 20-22 , is the best clinical vision predictor.
Some studies show that visual acuity16, 17 or low contrast visual acuity20 are also related.
Kuyk et al.21 looked at a wide range of visual factors and found that visual field extent
and a visual search task were the best predictors of mobility time and errors in both
scotopic and photopic conditions.
Mobility in a complex (cluttered) environment demands attention to multiple objects or
events within the visual field, and therefore our hypothesis is that mobility performance is

better predicted by measures of UFV than clinical measures of visual function, such as
contrast sensitivity or visual fields. If this is found to be the case, it would suggest a
model similar to Ball et al’s9 model for driving. Thus clinical measures of visual function
would be indirectly linked to mobility, but would directly influence UFV which would be
directly linked to mobility. We also investigated which aspect of UFV (divided attention
or presence of distractors) is most closely associated with mobility performance.
In order to study any association between UFV and orientation and mobility, a real-life
mobility course was constructed. This was not an inconsequential exercise, and, as our
experience may be useful to other researchers, it has been described in a separate paper
20. Although we did look at the prediction of various mobility variables by clinical vision
measures, it was not the main purpose of that paper. It was used as an illustration that the
final course was useful and gave results similar to other studies. The ultimate purpose of
the entire study was to consider whether divided attention or presence of clutter, as
measured by UFV, predict aspects of mobility as well as, or better than, age and clinical
measures of vision and this is being reported here, for the first time.
Methods
Subjects
Thirty five participants with low vision were recruited from the Queensland University of
Technology (QUT) Vision Rehabilitation Centre and the QUT School of Optometry Clinic

in two age groups; 13 aged 20-40 years and 22 aged 60-80 years. The research adhered to
the tenets of the Declaration of Helsinki, and was approved by the Office of Research
Ethics at the University of Waterloo and the University Human Research Ethics
Committee at QUT. Informed consent was obtained from all participants after an
explanation of the study. Inclusion criteria were: Visual acuity (VA) in the better eye poorer
than 6/12 and better than 6/120 or significant visual field loss, no diagnosis or history of systemic
disease or medications known to cause vision losses. A search was undertaken through the clinic
files of the Queensland University of Technology (QUT) Vision Rehabilitation Centre and
the main QUT Optometry Clinic for potential subjects who met these criteria. All
subjects who met the criteria (and who were also within reasonable traveling distance of
QUT) going back year by year, were mailed a letter with information about the study and
were contacted subsequently to ask if they were willing to participate. Thus the sample
includes subjects who had attended the low vision clinic, but also others who met the
criteria, but had only attended the Primary Care clinic. Subjects were screened for
cognitive ability using the Mini-Mental State Exam to exclude subjects with dementia,
delirium or affective disorder23. All participants scored 22 or better. Diagnoses and visual
acuities for the subjects with low vision are given in Table 1. The age ranged from 22 to
80 years.
Ninety-one percent of subjects were able to detect the central UFV target when it was
presented alone (Condition A) 100% of the time. One participant was able to detect it 7
out of 10 times, one 8 out of 10 times and one subject 9 out of 10 times.

All tests were undertaken with the participant’s own (habitual) distance refractive
correction (if worn). For all testing, subjects used natural viewing i.e. subjects with
central scotomas were allowed to use their eccentric preferred retinal locus (PRL), if one
existed. Presbyopic subjects were provided an appropriate near addition for tests at
distances of 1.2 metres and closer. Low vision subjects in the younger age group were
provided with a near addition sufficient to give subjective clarity as it has been shown
that pre-presbyopic subjects with low vision do not have a normal accommodative
response to near targets24.
Procedures
Procedures were as previously described 6 . Briefly, the following clinical measures of
visual function were assessed; monocular distance visual acuity, binocular contrast
sensitivity with the Pelli-Robson (PRCS) chart at 1 metre and the Melbourne Edge Test
(MET) 25 at 40 cms and binocular low contrast visual acuity with Bailey-Lovie charts
which have letters of 11% contrast. The background luminance on all VA and CS charts
was close to 100cd/m2. The presentation order of the PRCS, MET and low contrast VA
(LCVA) was randomised. One subject (subject 8) was not able to obtain a result on the
low contrast VA chart at the closest distance tested. She was assigned a value of 1.8 for
this test, which was one acuity level poorer than the poorest measurable and was also
based on the mean difference between the high contrast and the low contrast acuity which
was 0.2. Binocular central visual fields were measured with the Humphrey Field

Analyser, using the SITA Fast 30-2 threshold programme and the blind spot monitoring
turned off. Foveal thresholds were also measured.
The software used for the UFV was developed by Wood and Troutbeck7 . UFV was
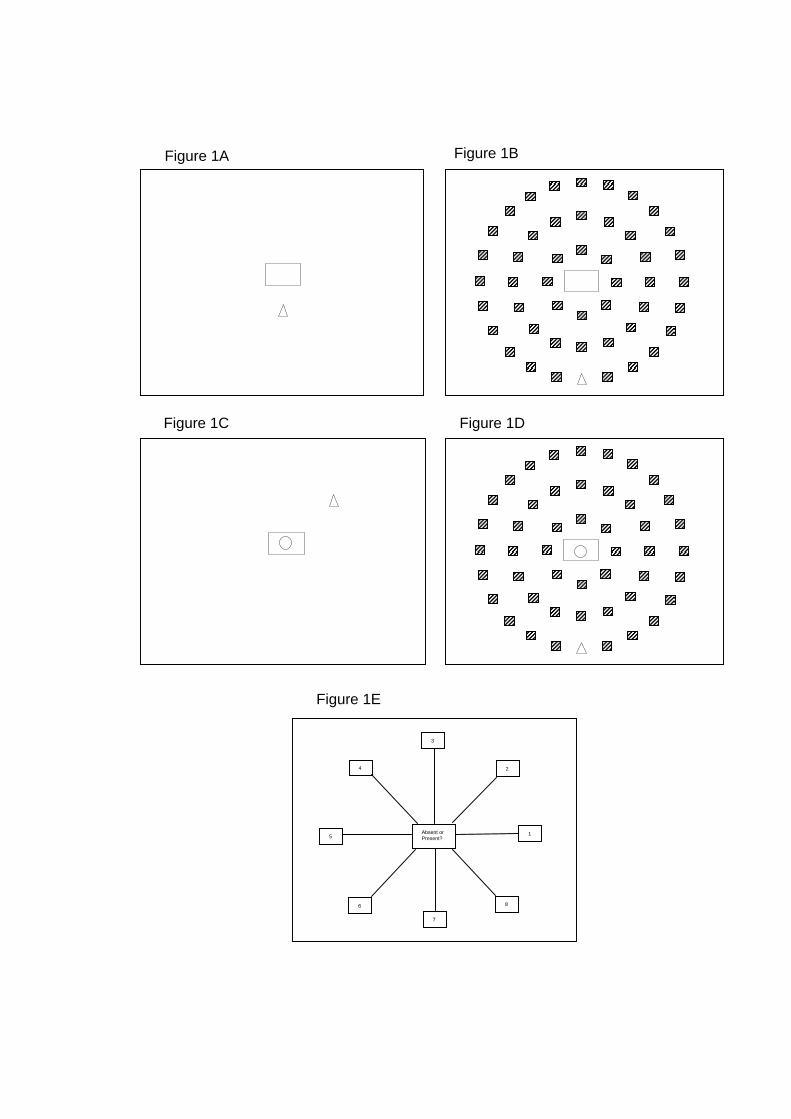
measured in the following conditions (Figure 1): Condition A, central task alone;
Condition 1 (UFV1), central task absent, no peripheral distractors; Condition 2 (UFV2),
central task absent, peripheral distractors; Condition 3 (UFV3), central task present, no
peripheral distractors; Condition 4 (UFV4), central task present, peripheral distractors.
The display duration was always 125 msecs, followed by masking noise. The central task
was to detect whether a circle was present or absent which was presented within the
central rectangle. The peripheral task was to detect the position of an open triangle in one
of 24 locations among 47 distractors, which were shaded squares. The distractors and
peripheral targets were presented in three rings at eccentricities of 10, 20 and 28 degrees.
The viewing distance was 27cms. The line width of targets subtended 12.7 minutes of arc
and the total angular subtense of the target was 3.38 degrees. A Snellen letter is
constructed with the line widths and the gaps between the lines being 1/5th of the total
angular subtense, which was not the case with these targets. Thus it is difficult to specify
an exact Snellen equivalent. Based on the line widths it would be equivalent to 6/76, but
based on the total angular subtense, it would be equivalent to 6/244. Based on the gap
between the lines it would be equivalent to 6/1066. After the masking noise was
presented, a response display came onto the screen (Figure 1E), which lasted until the
subject’s response was entered. The subject was allowed to respond verbally with the
number indicating the direction of the peripheral target, by touching the screen or by

verbalising the position as on a clock face. In conditions when there was a central target,
the subject first responded whether the central target was present or absent, and then
responded with the position of the peripheral target. The response to the peripheral target
was only recorded on those occasions when the subject was correct about the presence of
the central target. When the subject was incorrect, the trial was repeated (remixed
randomly into the remaining trials).
The order of UFV conditions was standardised, running them in the order of least to most
difficult. Thus the effects of practice would be equated between subjects, and any deficit
in performance in the harder conditions compared to the easier ones would not be due to
less practice.
For statistical analyses, an arcsine transformation was used on the UFV data as has been
used by others1,7,26.
Mobility performance was measured with the final version of the course described by
Leat and Lovie-Kitchin20. The preferred walking speed (PWS) was measured first
(Section 1), as the subject walked along an unobstructed path. For this section
participants were told that there would be no obstacles or steps and to walk at a
comfortable speed. Subsequent sections included both indoor and outdoor sections of a
real environment course with some natural and some deliberately placed obstacles. For
sections 2 and 3 of the course, the subject was told that there might be obstacles and
asked to negotiate them safely. Although there were no steps there were some changes in

contrast which could be confused with steps and cause hesitation. Errors such as
hesitations, object contacts (such as brushing into branches), stumbles, high stepping
(anticipating a step that is not present), corrections, experimenter interventions (when in
danger of impact) and behaviour modifications (such as trailing a hand along a wall) were
recorded. The time to complete the course was recorded and the walking speed was
calculated. Section 4 was a training session for Visual Detection Distance (VDD) as it
was found that this was necessary for valid results20 and section 5 was used in the data
analysis. The subject was asked to stop once they had detected an obstacle (they were not
required to identify it). Specifically they were requested to “…. walk along this pathway.
There might be steps or obstacles. As soon as you see something that might be an
obstacle, even if you are not sure what it is, I would like you to stop”. The stop-watch
was paused while they were not walking. Once they had stopped and correctly detected
that there was an obstacle ahead, this distance was recorded as the VDD (measured by the
point on a metre scale along the course where the subject had stopped). If they could
correctly identify it, this was also recorded as the Visual Identification Distance (VID). If
they could not correctly identify it, they were allowed to walk closer and stop again once
they could identify it, and this second distance was recorded as the VID. The obstacle
that they were asked to identify in section 5 was a step ladder. Again, behaviour
modifications as above were recorded as errors.
The following parameters of mobility were calculated; PWS from section 1, walking
speed and PPWS from sections 2 and 3, numbers of errors from all sections except
section 4 and the VDD and VID from section 5. Neither the walking speed nor PPWS for
section 4 were analysed as this was a training session. A log transformation was used for
total errors, otherwise the same incremental value is given to a difference between 1 and
2 and between 15 and 16 errors 16, 27 which resulted in a distribution that approximated to
normal (Kolmogorov-Smirnov test, p>0.05) and a log transformation was used for VDD
and VID. Walking speed, PWS and PPWS were not transformed, as they did approximate
to normal distributions (Kolmogorov-Smirnov test, p>0.05).
The data were analysed first by univariate analysis (correlation matrix). The independent
variables were grouped into types. Thus there were 3 measures of central vision (VA
[logMAR], LCVA and Humphrey foveal thresholds), two measures of contrast sensitivity
(PRCS and MET), two measures of visual fields (Humphrey mean deviation - MD and
pattern standard deviation - PSD), four measures of UFV, plus age. For each mobility
measure (dependant variable), the independent variable with the highest correlation in
each group of vision variables was selected and entered into a multiple regression
analysis. All of the measures in each group were well correlated. For example, all the
measures of central vision were highly correlated with each other (r>0.7 in all cases).
Forward step-wise multiple regression analysis was used with each mobility parameter as
a dependant variable. The models were checked with an 80/20 split of the data. For each
model, 80% of the data was randomly selected and the forward regression was repeated
with this subset. The new coefficients were used to calculate a value for the dependent
variable for the remaining 20% and a t-test performed between the calculated and the
actual values. The data were analysed using Systat (Systat Software Inc., San Jose).

Two series of multiple-regression models were explored. The first series included all the
vision variables, uncorrected UFV scores plus age and the second series also added the
UFV scores corrected for visual field loss (as another type of independent variable) into
the regression analysis. The reason for this correction is that the uncorrected UFV scores
are highly influenced by visual field loss in people with low vision 6 . Thus the
uncorrected useful field of view score is a valid measure of attention for people with
fairly normal visual fields, but is a measure of both field loss and attention in people with
significant visual impairment. Corrected UFV scores may be a better measure of attention
per se in people with low vision. To correct for visual field loss, UFV errors were only
counted if they occurred in areas of the visual field which were normal based on the
Humphrey total deviation plot (at the p ≥ 5% level) 6. The purpose of this was to
determine if aspects of attention and presence of distractors unaffected by actual visual
field loss would help to explain the data. This choice of criterion of normal visual fields
may be considered rather conservative and indeed, Owsley et al (1995), who also
considered the effects of visual field sensitivity on UFOV, chose a more lenient cut-off
between “good” and “poor” visual fields. Their cut-off of 15dB means that to be labeled
as having “poor” visual fields, an older person would have approximately 10dB (10x) of
sensitivity loss, which is a considerable loss. Our cut-off is based on age-related norms
and means that there would be a sensitivity loss at the p=0.05 level of about 3-4 dB,
which is 2 to 2.5x. We have chosen the more stringent criterion so as to be sure that the
errors in the corrected UFV are not due to visual field losses.

Results
The results of the univariate analysis are shown in Table 2 and the multiple-regression
models are given in Table 3. There were no differences between the first and second
series of models for any of the mobility measures, so only the first models are shown in
Table 3.
The mobility error score was predicted best by UFV condition 4 (UFV4) which explained
38% of the variance (Table 3). When we consider the 95% confidence limits of this
correlation coefficient with UFV4, we note that CS (both PRCS and MET) and UFV 2
and 3 are within these 95% limits and therefore may also be considered good predictors
of mobility errors. VDD and VID were best predicted by a combination of clinical vision
variables (PRCS or LCVA plus visual field loss, MD), explaining 75% and 69% of the
variance respectively. Again, considering the 95% limits of the highest correlation,
logMAR and MET were also good predictors of VDD as were foveal threshold, logMAR,
PRCS and MET were for VID. Walking speed was best predicted by age plus UFV3
(Table 3). Consideration of the 95% confidence limits of the best predictor (age), showed
that MET and UFV1, 2 and 4 were also good predictors of walking speed on the course.
PWS was best predicted by age plus UFV4. Based on the 95% confidence limits for the
correlation with age, MET and UFV 1-3 were also good predictors. The alternative
predictors which have been listed here were also all significantly correlated with the
dependant (mobility) variable. As shown by the univariate analysis, PPWS was not
significantly predicted by any of our vision measures or age.
These models were all stable, as determined by the 80/20 split. The coefficients
determined with 80% of the data (a different 80% in each case) were very similar to those
shown in Table 3. For the remaining 20% of the data, there was no significant difference
between the calculated and the actual values for all the models (p>0.05). The correlation
coefficients between the calculated and the actual values were also good, being greater
than 0.62 in all cases except for the PWS when it was 0.49.
To summarise, our mobility measures fall into two groups; those predicted by UFV
scores plus age and those predicted by clinical vision variables. The former group
included mobility errors, which was best predicted by UFV followed by contrast
sensitivity, and walking speed and PWS which were well predicted by age and UFV. In
all three cases, CS or LCVA were also good predictors. The latter group included VDD
and VID, which were best predicted by clinical vision measures, such as PRCS, LCVA
and visual fields loss, although, again, other measures of contrast sensitivity and central
vision (foveal threshold or VA) were good predictors of these mobility measures.
Discussion
The results of our study support those of previous studies11, 12 in showing that some
aspects of mobility are related to visual attention as measured by UFV type measures.
The question posed in this study was whether divided attention or presence of clutter, as

measured by UFV, predict aspects of mobility as well as, or better than, age and clinical
measures of vision. We were able to show that UFV is a good predictor of certain aspects
of mobility, in particular mobility errors and walking speed measures. However, our
findings do not definitively answer the question of whether UFOV is a better predictor
than other variables, such as age and clinical measures of vision and this is probably
because of the small sample size with a wide age range and heterogeneous causes of low
vision.
Mobility errors (bumping into objects, hesitating, stumbling and corrections) was best
predicted by UFV4 (Table 3), although other vision measures were almost as good. This
measure encapsulates both divided attention and peripheral distraction, but is also
influenced by visual field loss in people with low vision.6 This result is similar to the
findings of Ball et al.9 who found that the best predictor of motor vehicle accident rate
was UFOV®. Many studies have shown that visual field loss (sometimes with contrast
sensitivity loss as well) is correlated with mobility errors, generally explaining 50-70% of
the variance.16-18, 21, 28 The present results support this, but show that attention is also an
important factor and are in agreement with Broman et al.12 who found that both visual
fields and the useful field of view were associated with the number of bumps on a
mobility course in a population of community-based elders. UFV4 accounted for 38% of
the variance in mobility errors, so clearly other variables not measured in this study also
influence mobility safety.

Walking speed on the mobility course and on an unobstructed course (PWS) were best
predicted by age, perhaps not surprising given the bimodal age distribution of our
participants. This agrees with previous studies which have shown age-related changes in
walking speed (eg. Bohannon, 1997) but in our study other vision measures could predict
walking speed and PWS almost as well as age. The UFV3 score incorporates aspects of
both visual field loss and split attention and in this study improves the prediction of
walking speed on the mobility course, as does UFV4 for PWS (Table 3). Several studies
have shown that walking speed is related to visual field loss, plus, in one study, contrast
sensitivity.18, 30, 31 Kuyk et al.21 found that time to complete a course was predicted by
visual field extent together with scanning ability. Our results support to some extent the
vision findings of these studies, but most of these studies do not examine the effect of
age.
PPWS is the ratio of walking speed when obstacles are present compared to when
obstacles are absent in percent and is considered to be a way of controlling for variability
in walking speed between participants due to non-visual factors such as age, stride length
etc, so that PPWS estimates the degree to which walking speed is influenced by vision.32
This was not borne out by our results as PPWS was not related to any vision variable that
we measured, as we reported previously.20 This does not agree with the findings of
previous studies which have found PPWS to be significantly related to vision.27 ,33, 34 It is
difficult to explain this discrepancy in results. One possibility is that other variables,
such as age and attention, plus other factors that we did not measure (such as general
health), influenced walking speed and PWS, so that people did not change their walking
speed significantly between the obstacle-free route and the mobility course. However the
difference between walking speed and PWS, while small (0.25 metres/second), was
significant (p<0.001). Similarly, separate regression analyses for the younger and older
sub-groups (20-40 and 60-80 years) of our sample found that PPWS was still not
predicted by any vision measure in either group, suggesting that age was not a
confounding factor. Another possibility is that subjects were able to walk at a speed
more similar to their true PWS on the second trial, once they were familiar with the path.
However, there was no statistical difference between the speed of the first and second
PWS trial (t-test, p=0.9) and using the second trial PWS only for the calculation of PPWS
made no difference to the results of the regression analyses. Hassan et al.27 found that
PPWS was not significantly lower for the subjects with ARMD than an age-matched
control group. This finding and our results raise the question of what is being measured
with PPWS. We conclude that in the present population with mixed visual diagnoses and
a wide range of ages, some participants were not able to walk at a true PWS due either to
non-visual factors dominating their walking speed or because they were not able to
totally trust that there were no obstacles. This was indicated by the fact that some
participants made hesitations even when informed that the path was smooth with no
obstacles. It is possible that using a sighted guide method may have overcome this
problem, although Soong et al.35 found that this made no significant difference in a small,
predominantly ARMD, group.
The other measures of mobility we used in this study, VID and VDD, were best predicted
by measures of VA or contrast sensitivity and the regression models were slightly
improved with the inclusion of overall visual field sensitivity (MD). While UFV
measures were significantly correlated with VID and VDD (Table 2) the relationships
were not strong. As VID and VDD were mobility tasks involving detection and
resolution of a low contrast, medium to high spatial frequency object (a step-ladder) on
the mobility course, it is not surprising that measures of CS or VA coupled with visual
field status were the best predictors of these mobility measures. Goodrich and Ludt,29 in
the only previous study to have looked for prediction of VDD by vision variables, found
a weak association between contrast sensitivity, visual acuity and VDD (R2=0.08). Their
results are quite different from the present study in which clinical measures of vision
accounted for up to 75% of variance in VID and VDD (Table 3). This difference may be
accounted for by the fact that Goodrich and Ludt’s VDD measures were undertaken after
mobility training. Also, they noted that the VDD may be very different depending on the
type of obstacle – they used a waste basket, an overhanging foam cylinder and a curb.
In summary, mobility is obviously a complex function and there is no single measure that
currently encapsulates the totality of mobility performance. When walking, people
usually have some purpose or destination, so they have to maintain concentration
centrally (while scanning the environment) to detect and resolve the object of interest
(e.g., shop or street name). This may be the highly visually-related aspect of mobility,
measured by VID and VDD in this study. These were predicted well by vision measures
(VA or CS and MD). At the same time, people have to be aware of the surrounding
environment, avoid obstacles and moderate their speed for safety in order to detect and
avoid obstacles, amid the visual clutter. The safety aspect of mobility was best predicted
by UFV while we found age, together with UFV measures to be the best predictor of
walking speed. However, other vision measures and non-visual factors not measured in
this study obviously also influence mobility errors and speed.
Conclusion
Our findings show that UFV measures are good predictors of some aspects of mobility
performance but we are unable to confirm that they are better than age or other vision
variables. Various aspects of mobility are associated with different measures of vision,
attention or age and this indicates that these different measures of mobility are tapping
into diverse aspects of orientation and mobility performance and they should all be
included in future studies, along with other measures of health and functioning, until we
have a better understanding of their interactions.
Acknowledgements
We thank Allen Cheong for assistance in preparing the mobility course and in collecting
data. We thank the staff and faculty at the Queensland University of Technology, Kelvin
Grove Campus for their patience with obstacles and changes to the environment, and all
the subjects for their participation. We thank Associate Professor Joanne Wood for the
use of the UFV test in her laboratory. We thank the anonymous reviewers for their
helpful suggestions on the analyses. This study was supported by a QUT Visiting
Fellowship for S. Leat.
REFERENCES
1. Ball KK, Beard BL, Roenker DL, Miller RL, Griggs DS. Age and visual search:
Expanding the useful field of view. J Opt Soc Am A. 1988;5:2210-2219.
2. Sekuler R, Ball K. Visual localization: Age and practice. J Opt Soc Am A. 1986;3:864-
867.
3. Ball K, Owsley C, Beard B. Clinical visual perimetry underestimates peripheral field
problems in older adults. Clin Vis Sci. 1990;5:113-125.
4. Owsley C, Burton-Danner K, Jackson GR. Aging and spatial localization during
feature search. Gerontology. 2000;46:300-305.
5. Edwards JD, Ross LA, Wadley VG, et al. The useful field of view test: Normative data
for older adults. Arch Clin Neuropsychol. 2006;21:275-286.
6. Leat SJ, Lovie-Kitchin J. Visual impairment and the useful field of vision. Ophthalmic
Physiol Opt. 2006;26:392-403.
7. Wood JM, Troutbeck R. Elderly drivers and simulated visual impairment. Optom Vis
Sci. 1995;72:115-124.
8. Owsley C, Ball K, McGwin G,Jr, et al. Visual processing impairment and risk of motor
vehicle crash among older adults. JAMA. 1998;279:1083-1088.

9. Ball K, Owsley C, Sloane ME, Roenker DL, Bruni JR. Visual attention problems as a
predictor of vehicle crashes in older drivers. Invest Ophthalmol Vis Sci. 1993;34:3110-
3123.
10. Wood JM. Age and visual impairment decrease driving performance as measured on
a closed-road circuit. Hum Factors. 2002;44:482-494.
11. Owsley C, McGwin G,Jr. Association between visual attention and mobility in older
adults. J Am Geriatr Soc. 2004;52:1901-1906.
12. Broman AT, West SK, Munoz B, Bandeen-Roche K, Rubin GS, Turano KA. Divided
visual attention as a predictor of bumping while walking: The salisbury eye evaluation.
Invest Ophthalmol Vis Sci. 2004;45:2955-2960.
13. Owsley C, McGwin G,Jr, Sloane ME, Stalvey BT, Wells J. Timed instrumental
activities of daily living tasks: Relationship to visual function in older adults. Optom Vis
Sci. 2001;78:350-359.
14. Edwards JD, Wadley VG, Vance DE, Wood K, Roenker DL, Ball KK. The impact of
speed of processing training on cognitive and everyday performance. Aging Ment Health.
2005;9:262-271.
15. Roth DL, Goode KT, Clay OJ, Ball KK. Association of physical activity and visual
attention in older adults. J Aging Health. 2003;15:534-547.
16. Marron JA, Bailey IL. Visual factors and orientation-mobility performance. Am J
Optom Physiol Opt. 1982;59:413-426.

17. Long RG, Rieser JJ, Hill EW. Mobility in individuals with moderate visual
impairments. J Vis Impair Blind. 1990;84:111-118.
18. Lovie-Kitchin J, Mainstone J, Robinson J, Brown B. What areas of the visual field are
most important for mobility in low vision patients? Vis Res. 1990;5:249-263.
19. Rubin GS, Bandeen-Roche K, Huang GH, et al. The association of multiple visual
impairments with self-reported visual disability: SEE project. Invest Ophthalmol Vis Sci.
2001;42:64-72.
20. Leat SJ, Lovie-Kitchin JE. Measuring mobility performance: Experience gained in
designing a mobility course. Clin Exp Optom. 2006;89:215-228.
21. Kuyk T, Elliott JL, Fuhr PS. Visual correlates of mobility in real world settings in
older adults with low vision. Optom Vis Sci. 1998;75:538-547.
22. West SK, Rubin GS, Broman AT, Munoz B, Bandeen-Roche K, Turano K. How does
visual impairment affect performance on tasks of everyday life? the SEE project.
salisbury eye evaluation. Arch Ophthalmol. 2002;120:774-780.
23. Folstein MF, Folstein SE, McHugh PR. "Mini-mental state". A practical method for
grading the cognitive state of patients for the clinician. J Psychiatr Res. 1975;12:189-198.
24. Leat SJ, Mohr A. Accommodative response in pre-presbyopes with visual impairment
and its clinical implications. Invest Ophthalmol Vis Sci. 2007;48:3888-3896.
25. Woods RL, Wood JM. The role of contrast sensitivity charts and contrast letters
charts in clinical practice. Clin Exp Optom. 1995;78:43-57.

26. Sekuler AB, Bennett PJ, Mamelak M. Effects of aging on the useful field of view.
Exp Aging Res. 2000;26:103-120.
27. Hassan SE, Lovie-Kitchin JE, Woods RL. Vision and mobility performance of
subjects with age-related macular degeneration. Optom Vis Sci. 2002;79:697-707.
28. Haymes S, Guest D, Heyes A, Johnston A. Mobility of people with retinitis
pigmentosa as a function of vision and psychological variables. Optom Vis Sci.
1996;73:621-637.
29. Bohannon RW. Comfortable and maximum walking speed of adults aged 20-79
years: reference values and determinants. Age and Ageing 1997; 26:15-19.
30. Geruschat DR, Turano KA, Stahl JW. Traditional measures of mobility performance
and retinitis pigmentosa. Optom Vis Sci. 1998;75:525-537.
31. Turano KA, Rubin GS, Quigley HA. Mobility performance in glaucoma. Invest
Ophthalmol Vis Sci. 1999;40:2803-2809.
32. Clark-Carter DD, Heyes AD, Howarth CI. The efficiency and walking speed of
visually impaired people. Ergonomics. 1986;29:779-789.
33. Haymes S, Guest D, Heyes A, Johnston A. Comparison of functional mobility
performance with clinical vision measures in simulated retinitis pigmentosa. Optom Vis
Sci. 1994;71:442-453.
34. Black A, Lovie-Kitchin JE, Woods RL, Arnold N, Byrnes J, Murrish J. Mobility
performance in retinitis pigmentosa. Clin Exp Optom. 1997;80:1-12.

35. Soong GP, Lovie-Kitchin JE, Brown B. Preferred walking speed for assessment of
mobility performance: Sighted guide versus non-sighted guide techniques. Clin Exp
Optom. 2000;83:279-282.
36. Goodrich GL, Ludt R. Assesssing visual detection ability for mobility in individuals
with low vision. Vis Impair Res. 2003;5:57-71.

Legend
Figure 1. Diagram of UFV conditions. A. Condition 1: Central task absent, no peripheral
distractors. B. Condition 2: Central task absent, peripheral distractors. C: Condition 3.
Central task present, no peripheral distractors. D. Condition 4: Central task present,
peripheral distractors. E. Response display.
1 Absent or Present?
8
7
6
5
4
3
2
Figure 1A Figure 1B
Figure 1C Figure 1D
Figure 1E

Table 1. Diagnosis, Age and Visual Acuity of Subjects with Low Vision.
Subject Age Diagnosis Binocular VA
(logMAR) Younger group 1 40 Incomplete oculo-cutaneous albinism 0.48 2 22 Congenital cataract 0.88 3 26 Stargardts 0.96 4 28 Glaucoma 0.06 5 27 Stargardts 0.96 6 26 Oculo-cutaneous albinism 0.74 7 40 Stargardts 0.78 8 37 Retinopathy of prematurity 1.5 9 28 Optic nerve hypoplasia, nystagmus 1.18 10 37 Optic atrophy, post encephalitis 1.0 11 23 Stargardts 0.8 12 29 Oculo-cutaneous Albinism 1.0 13 25 Rod-cone dystrophy, keratoconus 1.1 Older group 14 78 Early AMD, epiretinal membrane 0.12 15 70 Atrophic AMD 0.1 16 75 Atrophic AMD 0.72 17 79 Atrophic AMD 0.66 18 80 Exudative AMD 1.14 19 78 Atrophic AMD 0.08 20 72 Exudative AMD 1.0 21 75 Exudative AMD, POAG 1.28 22 78 Exudative AMD 0.96 23 75 Exudative AMD 1.6 24 72 Atrophic AMD 0.44 25 79 Cataract 0.48 26 72 Myopic Degeneration 0.3 27 72 Diabetic retinopathy, aphakia 0.1 28 74 Cataract 0.16 29 73 Exudative AMD 1.34 30 75 POAG 0.18 31 71 POAG 0.08 32 62 POAG 0.04 33 78 POAG 0.1 34 75 POAG 0.32 35 79 Exudative AMD and central retinal artery
occlusion 0.94
The diagnosis listed is that for the better eye. POAG = Primary open angle glaucoma, AMD = age-related macular degeneration.

Table 2. Pearson correlation coefficients between each mobility measure and all independent vision variables, plus age. The uncorrected p-values are given in brackets. Those highlighted in grey were the variables with the highest correlation coefficient in each group and were entered into the multivariate analysis. Those marked with † were within the 95% confidence limits of the independent variable having the highest correlation with each mobility measure.
Mobility errors VDD VID WS PWS PPWS
MD 0.348 (0.041)
0.629 (<0.0005)
0.583 (<0.0005)
0.071 (0.685)
-0.021 (0.902)
0.255(0.139)
PSD 0.287 (0.095)
-0.258 (0.135)
-0.245 (0.155)
0.098 (0.576)
0.157 (0.369)
-0.183(0.291)
Fovthresh -0.305 (0.075)
0.646 (<0.0005)
0.681† (<0.0005)
0.064 (0.7115)
-0.054 (0.758)
0.263(0.127)
LCVA 0.343 (0.044)
-0.755† <0.0005
-0.783 (<0.0005)
-0.118 (0.501)
-0.027 (0.876)
-0.189(0.277)
LogMAR 0.338 (0.047)
-0.694† (<0.0005)
-0.743† (<0.0005)
-0.100 (0.567)
-0.037 (0.833)
-0.120(0.494)
PRCS -0.428† (0.01)
0.830 (<0.0005)
0.761† (<0.0005)
0.238 (0.168)
0.198 (0.255)
0.072(0.682)
MET -0.560† (<0.0005)
0.745† (<0.0005)
0.726† (<0.0005)
0.432† (0.01)
0.396† (0.019)
0.014(0.939)
UFV1 0.315 (0.065
-0.398 (0.018)
-0.353 (0.037)
-0.469† (0.004)
-0.418† (0.012)
-0.061(0.729)
UFV2 0.562† (<0.0005)
-0.489 (0.003)
-0.365 (0.031)
-0.499† (0.002)
-0.406† (0.015)
-0.184(0.289)
UFV3 0.452† 0.006
-0.585 (<0.0005)
-0.536 (0.001)
-0.540 (0.001)
-0.451† (0.007)
-0.161(0.354)
UFV4 0.618 (<0.0005)
-0.555 (0.001)
-0.459 (0.006)
-0.527† (0.001)
-0.468 (0.005)
-0.114(0.513)
AGE 0.185 (0.287)
0.239 (0.167)
0.339 (0.046)
-0.560 (<0.0005)
-0.629 (<0.0005)
0.279(0.105)
UFV1Corr -0.173 (0.321)
0.322 (0.059)
0.390 (0.02)
-0.244 (0.158)
-0.321 (0.06)
0.279(0.104)
UFV2Corr 0.061 (0.727)
0.273 (0.113)
0.328 (0.055)
-0.247 (0.153)
-0.253 (0.142)
0.067(0.702)
UFV3Corr 0.237 (0.171)
-0.011 (0.949)
-0.031 (0.859)
-0.352† (0.038)
-0.328 (0.055)
0.008(0.962)
UFV4Corr 0.095 (0.589)
0.278 (0.105)
0.294 (0.087)
-0.238 (0.169)
-0.332 (0.052)
0.274(0.112)
MD = mean deviation, PSD = pattern standard deviation and Fovthresh = the foveal threshold of the Humphrey Field Analyser, LCVA = low contrast visual acuity, logMAR = high contrast visual acuity, PRCS = Pelli-Robson contrast sensitivity, MET = Melbourne Edge Test, UFV1-4 = Useful field of view, UFV 1-4Corr = useful field of view corrected for visual field loss, VDD = visual detection distance, VID = visual identification distance.
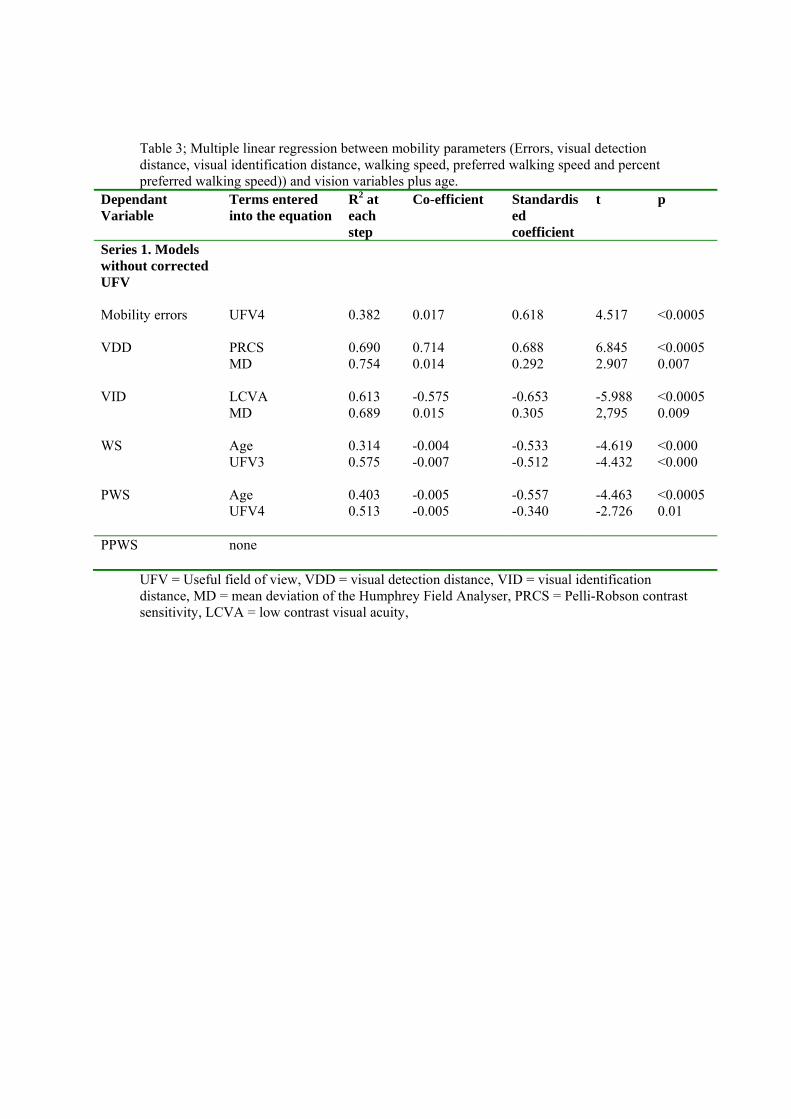
Table 3; Multiple linear regression between mobility parameters (Errors, visual detection distance, visual identification distance, walking speed, preferred walking speed and percent preferred walking speed)) and vision variables plus age.
Dependant Variable
Terms entered into the equation
R2 at each step
Co-efficient Standardised coefficient
t p
Series 1. Models without corrected UFV
Mobility errors UFV4
0.382 0.017 0.618 4.517 <0.0005
VDD PRCS 0.690 0.714 0.688 6.845 <0.0005 MD 0.754 0.014 0.292 2.907 0.007
VID LCVA 0.613 -0.575 -0.653 -5.988 <0.0005 MD
0.689 0.015 0.305 2,795 0.009
WS Age 0.314 -0.004 -0.533 -4.619 <0.000 UFV3 0.575 -0.007 -0.512 -4.432 <0.000 PWS Age 0.403 -0.005 -0.557 -4.463 <0.0005 UFV4
0.513 -0.005 -0.340 -2.726 0.01
PPWS
none
UFV = Useful field of view, VDD = visual detection distance, VID = visual identification distance, MD = mean deviation of the Humphrey Field Analyser, PRCS = Pelli-Robson contrast sensitivity, LCVA = low contrast visual acuity,