QUT Digital Repository: · 6 METHODS Design We used a prospective cohort design to determine the...
25
QUT Digital Repository: http://eprints.qut.edu.au/ This is the submitted version of this journal article. Published as: Webster, Joan and Nicholas, Catherine and Velacott, Catherine and Cridland, Noelle and Fawcett, Lisa (2010) Validation of the WHOQOL- BREF among women following childbirth. The Australian & New Zealand Journal of Obstetrics & Gynaecology, 50(2). pp. 132-137. © Copyright 2010 The Authors.
Transcript of QUT Digital Repository: · 6 METHODS Design We used a prospective cohort design to determine the...

QUT Digital Repository: http://eprints.qut.edu.au/
This is the submitted version of this journal article. Published as: Webster, Joan and Nicholas, Catherine and Velacott, Catherine and Cridland, Noelle and Fawcett, Lisa (2010) Validation of the WHOQOL-BREF among women following childbirth. The Australian & New Zealand Journal of Obstetrics & Gynaecology, 50(2). pp. 132-137.
© Copyright 2010 The Authors.
1
Title: Validation of the WHOQOL-BREF among women following childbirth
Authors:
Prof Joan WEBSTER1, 2, 3, 4, RN, BA, Nursing Director, Research
Catherine NICHOLAS1,5, RN, Research Midwife
Catherine VELACOTT1,6, RN, Mental Health, B Nurs, Research Nurse
Noelle CRIDLAND5, Nuring Director Women’s and Newborn Services, B Nurs
Lisa FAWCETT6, Nursing Director, Mental Health Services, B Nurs
1 Centre for Clinical Nursing, Royal Brisbane and Womens Hospital
2 School of Nursing and Midwifery, Queensland Institute of Technology
3 School of Nursing and Midwifery, Griffith University
4 School of Nursing and Midwifery, University of Queensland
5 Women’s and Newborn Services, Royal Brisbane and Womens Hospital
6 Mental Health Services, Royal Brisbane and Womens Hospital
Correspondence author:
Prof Joan Webster
Level 2, Centre for Clinical Nursing, Royal Brisbane and Women’s Hospital
Butterfield Street, Herston QLD 4029, Australia
Telephone: +61 7 3636 8590, Fax: +61 7 3636 5832
Email:[email protected]

2
(i) Title: Validation of the WHOQOL-BREF among women following
childbirth
(ii) Running head: Validation of the WHOQOL-BREF
(iii) Word cound: Abstract 226
Main text 1,946 (excluding acknowledgements, references )
2,512 (with acknowledgements and references)

3
PRÉCIS
The WHOQOL -BREF has been validated for clinical or research use following
childbirth.

4
ABSTRACT
Background: There is an increasing interest in measuring quality of life (QOL) in
clinical settings and in clinical trials. None of the commonly used QOL instrument
have been validated for use postnatally.
Aim: To assess the psychometric properties of the 26-item WHOQOL-BREF among
women following childbirth.
Methods: Using a prospective cohort design we recruited 320 women within the first
few days of childbirth. At six weeks postpartum, participants were asked to complete
the WHOQOL-BREF, the Edinburgh Postnatal Depression Index and the Australian
Unity Wellbeing Index. Validation of the WHOQOL-BREF included an analysis of
internal consistency, discriminate validity, convergent validity and an examination of
the domain structure.
Results: 221 (69.1%) women returned their six-week questionnaire. All domains of
the WHOQOL-BREF met reliability standards (alpha coefficient exceeding 0.70). The
questionnaire discriminated well between known groups (depressed and non-
depressed women. P = <0.000) and demonstrated satisfactory correlations with the
Australian Unity Wellbeing index (r = >0.45). The domain structure of the
WHOQOL-BREF was also valid in this population of new mothers, with moderate to
high correlation between individual items and the domain structure to which the items
were originally assigned.
Conclusion: The WHOQOL-BRF is well-accepted and valid instrument in this
population and may be used in postnatal clinical settings or for assessing intervention
effects in research studies.
Key words: Quality of life; Validation studies; Childbirth; Postpartum period;
Depression, postpartum

5
BACKGROUND
In recent years there has been an increasing interest in health related quality of life
(HRQoL) assessment in clinical research; particularly to gauge the success of
intervention programs. A number of different approaches have been used to measure
quality of life but many of these are condition-specific (1, 2). An alternative to using a
condition-specific instrument is to use a generic quality of life (QOL) assessment
instead (3, 4). However, when a generic QOL questionnaire is selected for use in a
particular population, the tool should first be validated in that group. To our
knowledge, none of the instruments commonly used to assess HRQoL, has been
validated for use among women who have recently given birth. Consequently,
normative ranges are unknown in this group, making comparisons between study
populations and cross-culturally very difficult. A validated instrument would also be
useful when investigating the quality of life among women who have experienced an
adverse pregnancy outcome.
HRQoL instruments may be costly and complex to use, making them unsuitable if the
intention is to use them in general health care settings or in large epidemiological
studies. At least one generic quality of life measure does not have these problems; the
short version of the World Health Organization Quality of Life assessment
(WHOQOL-BREF) (5). However, the instrument is generic, rather than disease
specific and, although it has been used to assess quality of life in a variety of cohorts
(6-8), the WHOQOL-BREF has not been independently validated for use by new
mothers, a group with health care and life issues which may be different from other
population groups. Thus, the purpose of this study was to investigate the validity and
reliability of the instrument for use following childbirth.

6
METHODS
Design
We used a prospective cohort design to determine the reliability and validity of the
WHOQOL-BREF assessment in women who had recently given birth.
Participants
Participants were consenting women who gave birth to a live infant or infants > 36
weeks gestation, who was not admitted to a neonatal intensive nursery. The study was
approved by the hospital’s Human Research Ethics Committee.
Instruments
WHOQOL-BREF
The WHOQOL-BREF was developed by the World Health Organization Quality of
Life Group, in 15 international field centres (5). It is a self-report questionnaire that
contains 26 items, and each item represents one facet. The facets are defined as those
aspects of life that are considered to have contributed to a person’s quality of life (5).
Among the 26 items, 24 of them make up the 4 domains of physical health (7 items),
psychological health (6 items), social relationships (3 items), and environment (8
items). The other 2 items measure overall quality of life and general health (5).
The Australian Unity Wellbeing Index
This cost-free instrument was developed by the Australian Centre on Quality of Life
and has been used annually to measure the well-being of Australians since 2001, so
societal norms are available (9). Several items contained in the ‘Personal Wellbeing
Index’ of the instrument are similar to those in the WHOQOL-BREF; so we will use it
to test the construct validity of the WHOQOL-BREF in a postnatal setting.

7
Edinburgh Postnatal Depression Scale (EPDS)
The EPDS is a simple, well-validated self-report questionnaire with 10 items designed
to screen for depression (10). Women are asked to underline one of four possible
responses to each question in terms of how they have felt in the previous week. A cut
off score of >12 is generally accepted as the demarcation between depressed and non-
depressed women. The EPDS will be used for known group comparisons.
Procedure
Women were consented during their early postnatal hospital stay. Baseline
demographic and obstetric data was collected at this time and the EPDS administered.
Participants were contacted, by mail, six weeks after discharge and asked to complete
a questionnaire, which included the WHOQOL-BREF, the Australian Unity
Wellbeing Index and the EPDS. If questionnaires were not returned within two weeks,
phone contact was attempted and, if requested, a second questionnaire sent. If the
EPDS score was > 12 in the immediate postpartum period or at the 6-week follow-up,
a nurse with counselling skills made immediate contact with the woman. At this time,
the EPDS score was discussed and options for management explored.
Analysis
The WHOQOL-BREF was first summarised to a 4-domain construct (physical health,
psychological health, social relationships & environment) and questions 3, 4 and 26
were reversed according to the guidelines for the WHOQOL-BREF (11). We
calculated each of the domain scores by taking the mean score of all items included in
each domain and multiplying by a factor of four. Missing values were replaced by the
appropriate mean score for the domain to which the item belonged, following the

8
WHOQOL-BREF guidelines (11). SPSS version 17.0 (SPSS Inc., Australasia,
Chatswood, NSW 2008) was used for all analyses.
Response patterns
We assessed the useability and acceptability of the WHOQOL-BREF by calculating
the proportion of unanswered questions. We also estimated the floor and ceiling
effects (proportion of participants scoring at the lowest and highest level) to gain a
clearer understanding of items which have more or less impact on quality of life
following childbirth.
Internal consistency
Internal consistency, for each domain was calculated using Cronbach’s alpha, with an
acceptable value set at > 0.70 (12).
Discriminant validity
For discriminate validity we used t tests to examine the ability of the WHOQOL-
BREF to detect differences between groups. The groups were those scoring >12 on
the EPDS (the postnatal depression (PND) group) at six weeks post partum and those
scoring < 12 on the same instrument (the non-PND Group).
Convergent validity
To test convergent validity, Pearson correlations were calculated between the four
domains of the WHOQOL-BREF and the Personal Wellbeing component of the
Australian Unity Wellbeing Index; in line with other studies, we accepted a moderate
correlation (between > r 0.45 to < r 0.70) (13, 14).
Correlation matrix of the WHOQOL –BREF
Correlation between the individual items of the WHOQOL-BREF and the four
domains was assessed using a 2-tailed Pearson correlation coefficient. A correlation
of >0.45 was anticipated.

9
RESULTS
Between 28 August 2008 and 12 December 2008, we recruited 320 women to the
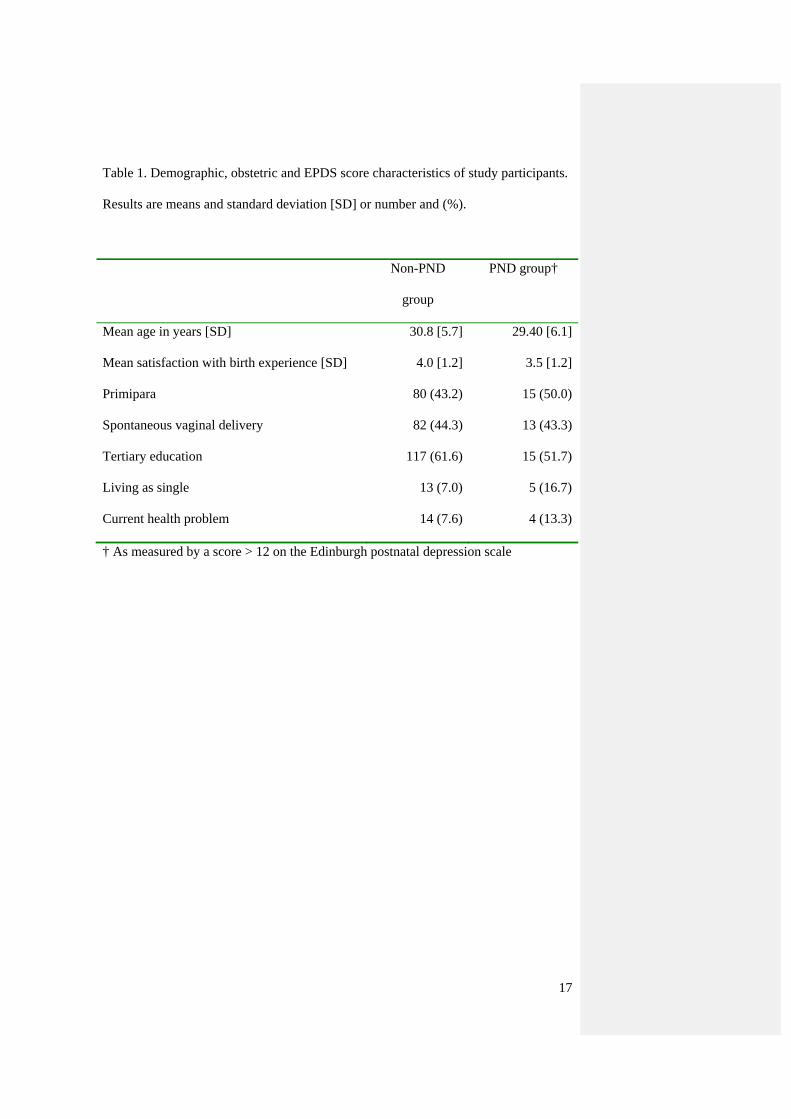
study. Of these, 221 (69.1%) returned their 6 week questionnaire. Characteristics of
the follow-up sample are shown in Table 1; these did not differ significantly from
characteristics of the total number of women who were originally recruited. Women
with EPDS scores >12 at six weeks post partum were less likely than others to have
tertiary education and more likely to be living as single and to report having a current
health problem. Mean item scores and response patterns for the WHOQOL-BREF are
shown in Table 2.
Internal consistency
The homogeneity between items on each of the sub-scales was satisfactory with the
alpha coefficient for each domain of the WHOQOL-BREF exceeding 0.70 (Table 3).
The only exception was in the psychological domain for the PND group where the
alpha coefficient was 0.62. This suggests internal consistency across domains of the
WHOQOL-BREF for childbearing women, whether or not they are currently
depressed.
Discriminant validity
Table 4 shows the ability of the WHOQOL-BREF to clearly discriminate between
known groups. As expected, women scoring < 12 on the EPDS at six weeks scored
higher than those scoring above 12 in all domains and these differences were
statistically significant. Discriminant validity was strongest in the psychological
domain and weakest in the environmental domain.

10
Convergent validity
As predicted, moderate correlations in the expected direction were found between the
domains of the WHOQOL-BREF and similar items on the Personal Wellbeing Index
(Table 5). Mean scores from this sample were similar to those drawn the 2008
national survey (15). Exceptions were in the items ‘personal relationships’ and
‘feeling safe’ (postnatal women rated higher than the national average) and in the item
‘community connection’ where women in this sample scored lower than the national
average.
Correlation matrix
We found the domain structure of the WHOQOL-BREF to be valid in this population
of new mothers (Table 6). There was moderate to high correlation between individual
items and the domain structure to which the items were originally assigned.
DISCUSSION
This study has examined the psychometric properties of the WHOQOL-BREF among
women who have recently given birth. The proportion of unanswered questions was
low, and the response rate was within the range of our previous investigations among
similar populations (16, 17). This demonstrates that the instrument was both
understandable and acceptable to the women surveyed.
Compared with other healthy populations, the mean scores for items on the
WHOQOL-BREF were one to two points higher in this cohort (5, 14, 18). On the one
hand this was surprising, postpartum physical and emotional heath problems are not
uncommon in the months following childbirth with sleep disturbances, pain and

11
physical exhaustion frequently reported (19-21). On the other hand, childbirth is
usually a positive experience for women and a time when women may minimise their
health problems. For example, a recent review of postpartum health reported that, in
general, women reported their health status as good during this period (22).
Internal consistency for the four domains and the total scale were satisfactory with
one exception. The Cronbach’s alpha for the psychological domain in the PND group
was marginally below the acceptable minimum standard of 0.70 however, it is not
unusual for subscales in some instruments to fall below this level (13). In terms of
discriminant validity the WHOQOL-BREF performed particularly well. On average,
in each of the domains, women in the non-PND group scored approximately three
points more than those with EPDS scores over 12. Although no previous studies have
evaluated discriminant validity in new mothers using this instrument, the ability of the
WHOQOL-BREF to discriminate between known groups has been well demonstrated
in other cohorts (5, 7, 18). It was also interesting to note the sensitivity of the
instrument in terms of the strength of difference between the PND group and the non-
PND group for each of the domains. The WHOQOL Group suggest that discriminant
validity is best demonstrated in the physical domain (5) however, in this cohort, not
unexpectedly, the psychological domain showed the greatest difference between
groups.
Convergent validity was confirmed using the Personal well-being sub-scale of the
Australian Unity Wellbeing Index. The highest correlations were found between the
social domain and personal relationships and the psychological domain and life as a
whole but, overall, correlations in all domains were satisfactory. The SF-36 is
12
generally used to assess convergent validity (7, 13, 14). However, we used the
Personal well-being sub-scale of the Australian Unity Wellbeing Index because it was
free and because we were able to compare our results with an Australian population
(15). Using this index provided further support for the notion that childbirth is a
positive time for women. They rated their life as a whole, their personal relationships
and their feelings of safety highly, although they felt less connected with the
community in the early postnatal period than does the wider population. The domain
structure of the WHOQOL-BREF was also well supported in this population with
mean correlations > 0.60 for all of the domains.
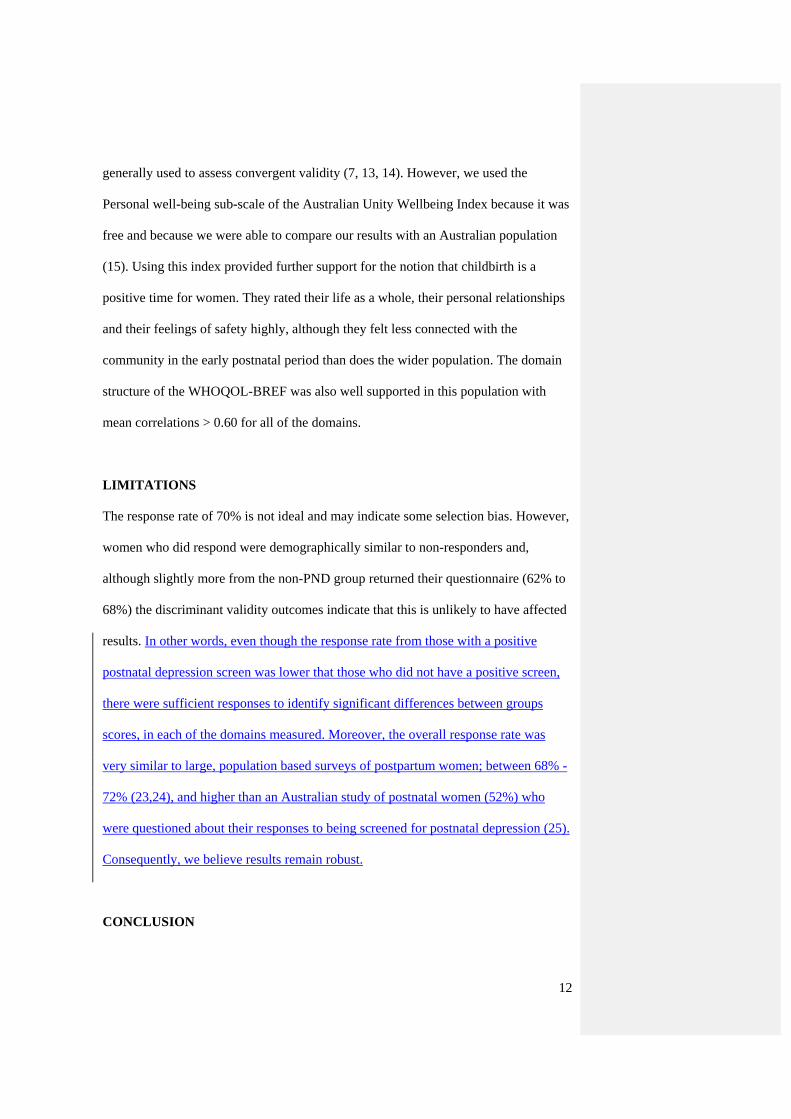
LIMITATIONS
The response rate of 70% is not ideal and may indicate some selection bias. However,
women who did respond were demographically similar to non-responders and,
although slightly more from the non-PND group returned their questionnaire (62% to
68%) the discriminant validity outcomes indicate that this is unlikely to have affected
results. In other words, even though the response rate from those with a positive
postnatal depression screen was lower that those who did not have a positive screen,
there were sufficient responses to identify significant differences between groups
scores, in each of the domains measured. Moreover, the overall response rate was
very similar to large, population based surveys of postpartum women; between 68% -
72% (23,24), and higher than an Australian study of postnatal women (52%) who
were questioned about their responses to being screened for postnatal depression (25).
Consequently, we believe results remain robust.
CONCLUSION

13
This study is the first to test the psychometric properties of the WHOQOL-BRF in a
population of postnatal women. Results indicate that the instrument is well-accepted
and valid for this group and may be used in clinical settings or for assessing
intervention effects in research studies.
ACKNOWLEDGEMENT
The sudy was funded by the Royal Brisbane and Women’s Hospital Research
Foundation
14
REFERENCES
1. Juniper EF, Buist AS, Cox FM, Ferrie PJ, King DR. Validation of a
standardized version of the Asthma Quality of Life Questionnaire. Chest.
1999;115:1265-70.
2. Lydick E, Zimmerman SI, Yawn B et al. Development and validation of a
discriminative quality of life questionnaire for osteoporosis (the OPTQoL). J
Bone Miner Res. 1997;12:456-63.
3. Hawthorne G, Richardson J, Osborne R. The Assessment of Quality of Life
(AQoL) instrument: a psychometric measure of health-related quality of life.
Qual Life Res. 1999;8:209-24.
4. Ware JE, Jr., Sherbourne CD. The MOS 36-item short-form health survey (SF-
36). I. Conceptual framework and item selection. Med Care. 1992;30:473-83.
5. Skevington SM, Lotfy M, O'Connell KA. The World Health Organization's
WHOQOL-BREF quality of life assessment: psychometric properties and
results of the international field trial. A report from the WHOQOL group.
Qual Life Res. 2004;13:299-310.
6. Sakthong P, Schommer JC, Gross CR, Sakulbumrungsil R, Prasithsirikul W.
Psychometric properties of WHOQOL-BREF-THAI in patients with
HIV/AIDS. J Med Assoc Thai. 2007;90:2449-60.
7. Castro Mda G, Oliveira Mda S, Miguel AC, Araujo RB. WHOQOL-BREF
psychometric properties in a sample of smokers. Rev Bras Psiquiatr.
2007;29:254-7.
8. Carpiniello B, Pinna M, Carta MG, Orru MG. Reliability, validity and
acceptability of the WHOQOL-Bref in a sample of Italian psychiatric
outpatients. Epidemiol Psichiatr Soc. 2006;15:228-32.
15
9. Cummins R, Eckersley R, Pallant J, et al. The Australian Unity Wellbeing
Index. Melbourne: Deakin University; 2001.
10. Cox JL, Holden JM, Sagovsky R. Detection of postnatal depression.
Development of the 10-item Edinburgh Postnatal Depression Scale. Br J
Psychiatr. 1987;150:782-6.
11. WHOQOL. Development of the World Health Organization WHOQOL-BREF
quality of life assessment. The WHOQOL Group. Psychol Med. 1998;28:551-
8.
12. Bland JM, Altman DG. Cronbach's alpha. BMJ. 1997;314:572.
13. Bonomi AE, Patrick DL, Bushnell DM, Martin M. Validation of the United
States' version of the World Health Organization Quality of Life (WHOQOL)
instrument. J Clin Epidemiol. 2000;53:1-12.
14. Nedjat S, Montazeri A, Holakouie K, Mohammad K, Majdzadeh R.
Psychometric properties of the Iranian interview-administered version of the
World Health Organization's Quality of Life Questionnaire (WHOQOL-
BREF): a population-based study. BMC Health Serv Res. 2008;8:61.
15. Cummins RA, Tomyn A, Woerner J, Gibson A. The wellbeing of Australians -
The effect of seven successive home-loan rate rises. Melbourne: Deakin
University; 2008.
16. Webster J, Pritchard MA, Creedy D, East C. A simplified predictive index for
the detection of women at risk for postnatal depression. Birth. 2003;30:101-8.
17. Webster J, Hall L, Somville T, Schneider P, Turnbull R, Smith P. Prospective
testing of the Brisbane Postnatal Depression Index. Birth. 2006;33:56-63.

16
18. Ohaeri JU, Awadalla AW. The reliability and validity of the short version of
the WHO Quality of Life Instrument in an Arab general population. Ann Saudi
Med. 2009;29:98-104.
19. Webb DA, Bloch JR, Coyne JC, Chung EK, Bennett IM, Culhane JF.
Postpartum physical symptoms in new mothers: their relationship to functional
limitations and emotional well-being. Birth. 2008;35:179-87.
20. McGovern P, Dowd B, Gjerdingen D, et al. Mothers' health and work-related
factors at 11 weeks postpartum. Ann Fam Med. 2007;5:519-27.
21. Thompson JF, Roberts CL, Currie M, Ellwood DA. Prevalence and
persistence of health problems after childbirth: associations with parity and
method of birth. Birth. 2002;29:83-94.
22. Cheng CY, Li Q. Integrative review of research on general health status and
prevalence of common physical health conditions of women after childbirth.
WHI. 2008;18:267-80.
23. Dørheim SK, Bondevic GT, Eberhard-Gran M, Bjorvatn B. Sleep and
depression in postpartum women: a population-based study. Sleep
2009;32:845-55
24. Goulet L, D’Amour D, Pineault R. type and timing of services following
postnatal discharge: do they make a difference? Women Health 2007;45:19-39
25. Gemmill AW, Leigh B, Ericksen J, Milgrom J. A survey of the clinical
acceptability of screening for postnatal depression in depressed and non-
depressed women. BMC Public Health 2006;17:211. doi: 10.1186/1471-2458-
6-211
Formatted: Bullets and Numbering
Formatted: Font: (Default) TimesNew Roman, 12 pt
17
Table 1. Demographic, obstetric and EPDS score characteristics of study participants.
Results are means and standard deviation [SD] or number and (%).
Non-PND
group
PND group†
Mean age in years [SD] 30.8 [5.7] 29.40 [6.1]
Mean satisfaction with birth experience [SD] 4.0 [1.2] 3.5 [1.2]
Primipara 80 (43.2) 15 (50.0)
Spontaneous vaginal delivery 82 (44.3) 13 (43.3)
Tertiary education 117 (61.6) 15 (51.7)
Living as single 13 (7.0) 5 (16.7)
Current health problem 14 (7.6) 4 (13.3)
† As measured by a score > 12 on the Edinburgh postnatal depression scale

18
Table 2. Response pattern and mean scores for WHOQOL-BREF items
Missing
%
Mean
score
Standard
deviation
Floor
(%)
Ceiling
(%)
Overall quality of life (1) 0.0 4.3 0.65 0.9 41.6
Overall health (2) 0.5 3.8 0.87 10.0 20.5
Pain (3) 0.0 4.5 0.74 59.7 0.5
Dependence of medical aids (4) 0.5 4.7 0.64 80.1 2.3
Positive feeling (5) 0.0 4.0 0.72 0.5 21.7
Personal belief (6) 0.0 4.0 0.81 1.4 27.1
Concentration (7) 0.0 3.5 0.74 0.9 4.5
Security (8) 1.0 4.3 0.74 0.5 45.0
Physical environment (9) 0.0 4.1 0.70 0.5 28.5
Energy (10) 0.0 3.7 0.81 0.5 10.4
Bodily image (11) 0.0 3.6 1.02 5.0 15.8
Financial Support (12) 0.5 3.8 0.92 2.3 20.8
Accessibility of information (13) 0.0 4.2 0.74 2.3 39.4
Leisure activity (14) 1.0 2.9 1.01 8.6 4.5
Mobility (15) 0.0 4.4 0.79 0.9 51.6
Sleep and rest (16) 0.0 3.1 0.97 5.0 4.5
Activities of daily living (17) 0.0 3.5 0.88 1.4 8.6
Work capacity (18) 1.0 3.5 0.87 2.7 7.2
Self-esteem (19) 0.5 3.7 0.81 0.9 10.4
Personal relationships (20) 0.0 4.1 0.92 1.8 35.3
Sexual activity (21) 0.0 3.3 1.08 7.2 12.7
Social support (22) 0.5 4.0 0.89 2.3 25.8
Home Environment (23) 0.0 3.9 0.95 1.4 27.1
Health care (24) 1.4 4.1 0.83 1.4 34.5

19
Transport (25) 0.5 4.2 0.94 1.8 46.4
Negative feeling (26) 1.0 3.8 0.77 0.9 12.7

20
Table 3. Internal consistency (coefficient alpha) of the WHOLQOL-BREF domains
Domain
Non-PND
group n = 190
PND group†
n = 29
Physical (7 items) 0.74 0.78
Psychological (6 items) 0.73 0.69
Social (3 items) 0.71 0.71
Environmental (8 items) 0.77 0.75
† As measured by a score > 12 on the Edinburgh postnatal depression scale

21
Table 4. Means and (standard deviations) of the domains of the WHOQOL-BREF for
non-depressed and depressed groups
Domain
Non-PND group PND group†
P - value
Physical 16.0 (1.85) 13.1 (2.57) < 0.000
Psychological 15.5 (1.96) 12.0 (2.20) < 0.000
Social 15.6 ( 2.82) 12.4 ( 3.69) < 0.000
Environmental 16.2 ( 2.00) 13.7 ( 2.28) < 0.000
† As measured by a score > 12 on the Edinburgh postnatal depression scale

22
Table 5: Pearson’s correlations between the WHOQOL-BREF and the ‘Personal well-
being’ sub-scale of the Australian Unity Wellbeing Index†.
Physical
health
Psychological
Health
Social
relationships
Environmental
health
Life as a whole 0.54 0.70 0.61 0.62
Standard of
living
0.50 0.58 0.39 0.63
Health 0.47 0.60 0.35 0.48
Achievement
in life
0.49 0.63 0.54 0.54
Personal
relationships
0.39 0.52 0.79 0.53
Feeling safe 0.41 0.47 0.52 0.63
Feeling part of
community
0.58 0.56 0.47 0.57
Future security 0.50 0.59 0.53 0.65
† Weak correlation (r < 0.45); moderate correlation (r 0.45 to r < 0.70); strong
correlation (r > 70

23
Table 6. Correlation matrix for the four domains of the WHOQOL-BREF†
Physical
health
Psychological
health
Social
relationships
Environmental
health
Physical health (item number)
Pain (3) 0.52 0.31 0.19 0.25
Dependence of medical aids (4) 0.50 0.30 0.19 0.17
Energy (10) 0.73 0.65 0.35 0.60
Mobility (15) 0.62 0.40 0.45 0.59
Sleep and rest (16) 0.73 0.49 0.41 0.46
Activities of daily living (17) 0.80 0.51 0.37 0.50
Work capacity (18) 0.79 0.55 0.45 0.49
Psychological health (item
number)
Positive feeling (5) 0.60 0.81 0.58 0.59
Personal belief (6) 0.40 0.70 0.47 0.48
Concentration (7) 0.45 0.59 0.23 0.35
Bodily image (11) 0.45 0.72 0.41 0.48
Self-esteem (19) 0.59 0.82 0.52 0.60
Negative feeling (26) 0.62 0.75 0.46 0.48
Social relationships (number of
items)
Personal relationships (20) 0.43 0.57 0.84 0.57
Sexual activity (21) 0.36 0.43 0.84 0.45
Social support (22) 0.45 0.51 0.76 0.48

24
Environmental Health (item
number)
Security (8) 0.39 0.53 0.44 0.65
Physical environment (9) 0.37 0.51 0.41 0.61
Financial Support (12) 0.39 0.40 0.39 0.67
Accessibility of information (13) 0.43 0.48 0.39 0.65
Leisure activity (14) 0.54 0.54 0.42 0.70
Home Environment (23) 0.45 0.37 0.34 0.64
Health care (24) 0.38 0.32 0.34 0.58
Transport (25) 0.44 0.40 0.42 0.68
† Correlation of r > 45 was considered satisfactory