Mentos Rockets 2/1/2011 By Dominick Mack With help from Siri Jonsson.
Upload
alisa-frazierCategory
view
13download
0description

1
Quote from Siri…Quote from Siri… “I hate the way they teach Math in the school. All the
teacher does is put lots of examples on the board for the students to memorize.
He does not explain the theory so that we could apply the theory to ANY numbers rather than memorizing 10 problems without understanding.
I much prefer learning why and how and working different problems hands on, like at my school at home, rather than memorizing specific problems that I’ll never see after school”
17-year old Exchange Student from Finland at Shullsburg High (home of the “Miners”), Shullsburg, WI

2
Business 173A: Business 173A: Intermediate Financial Management Intermediate Financial Management
Professor Introduction COB Policies Review/Professor Policies Review Schedule/Requirements Review/Key Dates Course Grading Roll call and Student Intros Finance Overview and Risk Return Tradeoff Review Reminder: You MUST change your WebCT password

3
Professor Contact InformationProfessor Contact Information Anu Vuorikoski WebCT E-mail: Response usually same day,
guaranteed within 24hrs. Web page: Go to Faculty home pages/V Office: Business Tower (BT) 961 Physical Office hours (e-mail works) :
As I live 148 miles away, only on campus M/W:12:00a-1:20p and 4:20-5:20p in OfficeInformal time before 12:00 as traffic allows

4
Professor BackgroundProfessor Background Teaching at SJSU since Spring 98
-Undergraduate: 170, 173A, 173B, 177-MBA: Intro and High Tech Financial Analysis
Have continued teaching because of letters/e-mail I get “long after” Teaching in corporate settings prior to that Formerly CFO of venture firm, start-up etc, and big company corporate finance
AND Logistics/supply chain re-engineering, AND project management assignments
Consulting (Bain, McKinsey, Touche Ross) and for start-ups MBA - Harvard, BA - Williams College CMA, CPIM, CIRM, PMP (all inactive) 20+ yrs global experience: Finance, Business Development, Logistics,
Consulting, etc. Always real world focus even when students want “easier”
5
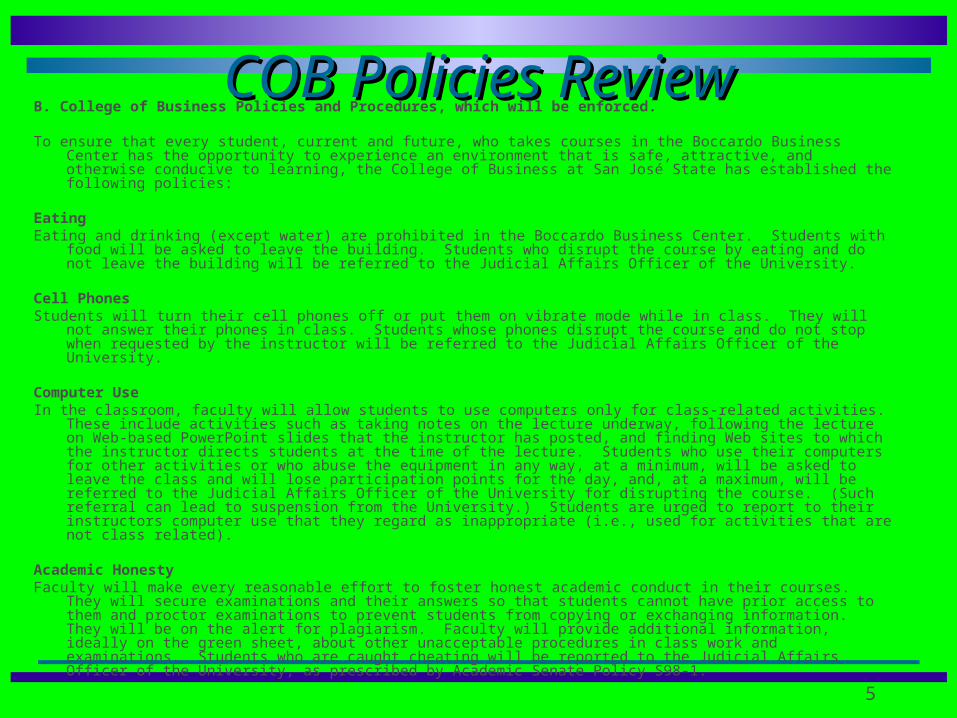
COB Policies ReviewCOB Policies ReviewB. College of Business Policies and Procedures, which will be enforced. To ensure that every student, current and future, who takes courses in the Boccardo Business Center has the opportunity
to experience an environment that is safe, attractive, and otherwise conducive to learning, the College of Business at San José State has established the following policies:
EatingEating and drinking (except water) are prohibited in the Boccardo Business Center. Students with food will be asked to
leave the building. Students who disrupt the course by eating and do not leave the building will be referred to the Judicial Affairs Officer of the University.
Cell PhonesStudents will turn their cell phones off or put them on vibrate mode while in class. They will not answer their phones in
class. Students whose phones disrupt the course and do not stop when requested by the instructor will be referred to the Judicial Affairs Officer of the University.
Computer UseIn the classroom, faculty will allow students to use computers only for class-related activities. These include activities
such as taking notes on the lecture underway, following the lecture on Web-based PowerPoint slides that the instructor has posted, and finding Web sites to which the instructor directs students at the time of the lecture. Students who use their computers for other activities or who abuse the equipment in any way, at a minimum, will be asked to leave the class and will lose participation points for the day, and, at a maximum, will be referred to the Judicial Affairs Officer of the University for disrupting the course. (Such referral can lead to suspension from the University.) Students are urged to report to their instructors computer use that they regard as inappropriate (i.e., used for activities that are not class related).
Academic Honesty Faculty will make every reasonable effort to foster honest academic conduct in their courses. They will secure
examinations and their answers so that students cannot have prior access to them and proctor examinations to prevent students from copying or exchanging information. They will be on the alert for plagiarism. Faculty will provide additional information, ideally on the green sheet, about other unacceptable procedures in class work and examinations. Students who are caught cheating will be reported to the Judicial Affairs Officer of the University, as prescribed by Academic Senate Policy S98-1.

6
My PoliciesMy PoliciesC. My Class Room Policies
1. Due to assistance in adhering to COB policies and to the demonstrated – by past classes – learning/attendance benefits it affords, classes will be run as back to back sessions with the “break” at the end. Thus the classes will run as follows:1:30 to 3:50/55 (with “break” from 3:55 to 4:15)5:30 to 7:50/55 (with “break” from 7:55 to 8:15)
2. Class will go full time. If something runs shorter than anticipated, an unscheduled class exercise that will further enhance learning will be added
3. Short courteous “bio” breaks are allowed during the class EXCEPT during exams.
4. Courtesy to your class mates and the professor requires on-time arrival and informing the professor of early departures or missing class ahead of time (due to in class group exercises)

7
Why I do things the way I do..Why I do things the way I do..
From industry – looking to teach something that will help you on the job and, hopefully, ensure it is not exported offshore….
Six 6-hour exams at end of HS (at 18) on EVERYTHING ever learned: Only tools pencil, eraser, slide rule. No M/C
CMA exam (Four 4-hour exams; no M/C), PLUS CPIM, CIRM and PMP exams

8
Primary Goals:Primary Goals:Challenge to GrowChallenge to Grow
Improve Analytical/Modeling SkillsPLUS
Deepen/Expand Discipline Specific Knowledge & SkillsPLUS
Prepare for lifelong learningEQUALS
Work and Career Preparation

9
Schedule/Key DatesSchedule/Key DatesExam Dates
1. Feb 21 (Ch 1-8)2. Mar 21 (Ch 9-14, 25)3. Final Date, Wed May 23 (do NOT book flights earlier, no exceptions will be made)
Jeopardy DateMay 2

10
GradingGrading
Homework 5 Total Max: One to Five assignments "quiz" (i.e. surprise dates). Credible effort countsMidterm 1 15 75-90 m in class Exam, followed by 60 minute Excel assignment at homeMidterm 2 20 75-90 m in class Exam, followed by 60 minute Excel assignment at homeJeopardy 10 5 For submitted stunners, 5 for playing (up to 5 bonus for winners)Final Exam 50 Comprehensive Exam on Exam Date
100
You cannot do well in exams without doing the homework. There are no MC or TF questions. Only short answer open questions and calculations. If we can get lab, it may be all in lab on computer using Excel
ONLY EC opportunity: Presenting correct homework solutions to the class. 1 Point for each presentation.First come first served so you have to decide you want to do it before everyone else does.
INCENTIVE: IF you take the two midterms and participate in Jeopardy and are carrying an "A" of anytype on percent basis, you are exempted from the Final Exam.
11
What grades are possibleWhat grades are possible
All grades from A+ to F Grades are based on points at the
end of the semester (break point system)

12
So, how do I get an A?So, how do I get an A? A typical A student in this class has the following profile:
* Thinks of themselves as a responsible adult and likes being treated as such * Works hard AND smart (usually had high grades in previous classes for the same reasons) uses time management tools* Submits work on time without excuses or whining* Tries to solve problems that, on the surface, may seem like “new” because they are in an unfamiliar format or ask for new information* Asks questions when does not understand* Fully participates in in class team exercises, etc.

13
Can I fail this class?Can I fail this class? Of course. A student who fails this class typically:
* Feels like school work interferes with other more important activities/feels entitled to a C or above regardless.* Has a poor record (lots of C-/D/F/U/W) when I check* Feels professors should focus on only what will be on exam, and spoon feed all answers and that cheat sheets should be allowed etc.* Use lots of excuses for not doing work/missing class* Does not contribute to the in class exercises choosing to talk about other matters during them

14
Why don’t you show us Why don’t you show us exactlyexactly how to do the how to do the analysis and forecast and give “right answer” analysis and forecast and give “right answer”
and test on the same numbers?and test on the same numbers? Answer: You are here to learn how to
approach a problem when you have not done exactly that problem before but have learned the tools previously.
Do you suppose your boss would pay you if he/she had to do the project first?
In real life, there are no “single right answers”

15
TOOO Much Work? Ch 1-3TOOO Much Work? Ch 1-3Review from 170, mostlyReview from 170, mostly

16
The basic goal of management: to create stock-holder value (measured by stock price!!!)
Agency relationships get in the way:1. Stockholders versus managers2. Stockholders versus creditors

17
What is an agency relationship?What is an agency relationship?
An agency relationship arises whenever one or more individuals, call (1) hires another individual or organization, to perform some service (2) delegates decision-making authority to that agent.

18
There are TWO potential There are TWO potential agency conflictsagency conflicts::
Conflicts between stockholders and managers.
Conflicts between stockholders and creditors.

19
Would going public in an IPO increase or Would going public in an IPO increase or decrease agency problems?decrease agency problems?
.

20
Why might you want to inflate your Why might you want to inflate your reported earnings or use off balance reported earnings or use off balance
sheet financing to make your financial sheet financing to make your financial position look stronger?position look stronger?
A manager might inflate a firm's reported earnings or make its debt appear to be lower if he or she wanted the firm to look good temporarily. For example just prior to exercising stock options or raising more debt.

21
If the firm is publicly traded, the stock price will probably drop once it is revealed that fraud has taken place. If private, banks may be unwilling to lend to it, and investors may be unwilling to invest more money.
What are the potential What are the potential consequences of inflating consequences of inflating earnings or hiding debt?earnings or hiding debt?

22
“Reasonable” annual salary to meet living expenses
Cash (or stock) bonus Options to buy stock or actual shares of
stock to reward long-term performance Tie bonus/options to EVA
What kind of compensation program might What kind of compensation program might you use to minimize agency problems?you use to minimize agency problems?

23
EVA????EVA????
Economic Value Added Profit over and beyond paying for the cost of capital $NOPAT - $Cost of Capital NOPAT=EBIT-Taxes $Cost of Capital = Capital (NWC+FA) * % WACC Capital: CA-CL+FA=LTD+Equity (CA+FA=CL+D+E) CofC: cost of debt after tax, cost of equity, impact of
risk How do you impact the components???

24
Why might someone interviewing for an entry level Why might someone interviewing for an entry level job have a better shot at getting a good job if he or job have a better shot at getting a good job if he or
she had a good grasp of financial management?she had a good grasp of financial management?
Managers want to hire people who can make decisions with the broader goal of corporate value maximization in mind because investors are forcing top managers to focus on value maximization.
25
What are investment returns?What are investment returns?
Investment returns measure the financial results of an investment.
Returns may be historical or prospective (anticipated).
Returns can be expressed in:
$$$$.
%.

26
What is the return on an investment that What is the return on an investment that costs $1,000 and is soldcosts $1,000 and is soldafter 1 year for $1,100?after 1 year for $1,100?
Dollar return ?
Percentage return ?

27
What is investment risk?What is investment risk?Risk Return TradeoffRisk Return Tradeoff
Investment returns are not known with certainty.
Risk refers to the probability of earning a return different from that expected. “Variability” of outcome.
The greater the chance of a return far below the expected return, the greater the risk. The corollary is that, typically, there is also probability of high return.

28
Probability distribution
Rate ofreturn (%) 50150-20
Stock X
Stock Y
Which stock is riskier? Why?

29
What about these?What about these?
Economy Prob. T-Bill A B C D
Recession 0.10 8.0% -22.0% 28.0% 10.0% -13.0%
Below avg. 0.20 8.0 -2.0 14.7 -10.0 1.0
Average 0.40 8.0 20.0 0.0 7.0 15.0
Above avg. 0.20 8.0 35.0 -10.0 45.0 29.0
Boom 0.10 8.0 50.0 -20.0 30.0 43.0
1.00

30
How to calculate the expected rate of How to calculate the expected rate of
return on each alternativereturn on each alternative..
. n
1=iiiPr = r
r = expected rate of return.
rA = 0.10(-22%) + 0.20(-2%) + 0.40(20%) + 0.20(35%) + 0.10(50%) = 17.4%.
^
^

31
What is the standard deviationWhat is the standard deviationof returns for each alternative?of returns for each alternative?
.
Variance
deviation Standard
1
2
2
n
iii Prr

32
Standard deviation measures the stand-alone risk of an investment.
The larger the standard deviation, the higher the probability that returns will be far below the expected return.
Coefficient of variation is an alternative measure of stand-alone risk.

33
Coefficient of Variation:Coefficient of Variation:CV = Expected return/standard CV = Expected return/standard
deviation.deviation.

34
Portfolio Risk and ReturnPortfolio Risk and Return
Assume a two-stock portfolio with $50,000 in each
Calculate rp and p.^

35
Portfolio Return, rPortfolio Return, rpp
rp is a weighted average:^
^
^ ^rp = wirin
i = 1

36
Two-Stock PortfoliosTwo-Stock Portfolios Two stocks can be combined to form a
riskless portfolio if = -1.0. Risk is not reduced at all if the two stocks
have = +1.0. In general, stocks have 0.65, so risk
is lowered but not eliminated. Investors typically hold many stocks. What happens when = 0?

37
What would happen to the risk of an What would happen to the risk of an average 1-stock portfolio as more average 1-stock portfolio as more
randomly selected stocks were added?randomly selected stocks were added?
p would decrease because the added
stocks would not be perfectly correlated, but rp would remain relatively constant.

38
Large
0 15
Prob.
2
1
1 35% ; Large 20%.Return

39
# Stocks in Portfolio
10 20 30 40 2,000+
Company Specific (Diversifiable) Risk
Market Risk
20
0
Stand-Alone Risk, p
p (%)
35

40
Risk: Stand-alone, Market, DiversifiableRisk: Stand-alone, Market, Diversifiable
Market risk is that part of a security’s stand-alone risk that cannot be eliminated by diversification.
Firm-specific, or diversifiable, risk is that part of a security’s stand-alone risk that can be eliminated by diversification.

41
Conclusions
As more stocks are added, each new stock has a smaller risk-reducing impact on the portfolio.
p falls very slowly after about 40 stocks are included. The lower limit for p is about 20% = M .
By forming well-diversified portfolios, investors can eliminate about half the riskiness of owning a single stock.

42
No. Rational investors will minimize risk by holding portfolios.
They bear only market risk, so prices and returns reflect this lower risk.
The one-stock investor bears higher (stand-alone) risk, so the return is less than that required by the risk.
Can an investor holding one stock earn a return appropriate to its risk?

43
Market risk, which is relevant for stocks held in well-diversified portfolios, is defined as the contribution of a security to the overall riskiness of the portfolio.
It is measured by a stock’s beta coefficient. In addition to measuring a stock’s contribution of
risk to a portfolio, beta also measures the stock’s volatility relative to the market.
How is market risk measured for individual securities?

44
What is the CAPM from 170?
The CAPM is an equilibrium model that specifies the relationship between risk and required rate of return for assets held in well-diversified portfolios.
It is based on the premise that only one factor affects risk.
What is that factor?

45
Investors all think in terms ofa single holding period.
All investors have identical expectations.
Investors can borrow or lend unlimited amounts at the risk-free rate.
What are the assumptions of the CAPM?
(More...)

46
All assets are perfectly divisible.
There are no taxes and no transactions costs.
All investors are price takers, that is, investors’ buying and selling won’t influence stock prices.
Quantities of all assets are given and fixed.

47
Run a regression line of past returns on Stock i versus returns on the market.
The regression line is called the characteristic line.
The slope coefficient of the characteristic line is defined as the beta coefficient.
How are betas calculated?

48
Regression to Estimate BetaRegression to Estimate Beta
Run a regression with returns on the stock in question plotted on the Y axis and returns on the market portfolio plotted on the X axis.
The slope of the regression line, which measures relative volatility, is defined as the stock’s beta coefficient, or b.

49
Calculating Beta in PracticeCalculating Beta in Practice Many analysts use the S&P 500 to
find the market return. Analysts typically use four or five
years’ of monthly returns to establish the regression line.
Some analysts use 52 weeks of weekly returns.

50
If b = 1.0, stock has average risk. If b > 1.0, stock is riskier than average. If b < 1.0, stock is less risky than average. Most stocks have betas in the range of
0.5 to 1.5. Can a stock have a negative beta?
How is beta interpreted?How is beta interpreted?

51
Finding Beta Estimates on the Finding Beta Estimates on the WebWeb
Go to www.bloomberg.com. Enter the ticker symbol for a
“Stock Quote”, such as IBM or Dell.
When the quote comes up, look in the section on Fundamentals.

52
Expected Return versus Market RiskExpected Return versus Market Risk
Which of the alternatives is best?
Expected
Security return Risk, b
1 17.4% 1.29
Market 15.0 1.00
2 13.8 0.68
T-bills 8.0 0.00
3 1.7 -0.86

53
Use the SML to calculate eachUse the SML to calculate eachalternative’s required return.alternative’s required return.
The Security Market Line (SML) is part of the Capital Asset Pricing Model (CAPM).
SML: ri = rRF + (RPM)bi . Assume rRF = 8%; rM = rM = 15%. RPM = (rM - rRF) = 15% - 8% = 7%.
^

54
Required Rates of ReturnRequired Rates of Return
r1 = 8.0% + (7%)(1.29)= 8.0% + 9.0% = 17.0%.
rM = 8.0% + (7%)(1.00) = 15.0%.
r2. = 8.0% + (7%)(0.68) = 12.8%.
rT-bill = 8.0% + (7%)(0.00) = 8.0%.
r3 = 8.0% + (7%)(-0.86) = 2.0%.

55
Expected versus Required Expected versus Required ReturnsReturns
^ r r
1 17.4% 17.0% Undervalued
Market 15.0 15.0 Fairly valued
2 13.8 12.8 Undervalued
T-bills 8.0 8.0 Fairly valued
3 1.7 2.0 Overvalued

56
SML1
Original situation
Required Rate of Return r (%)
SML2
0 0.5 1.0 1.5 2.0
1815
11 8
New SML I = 3%
Impact of Inflation Change on SML

57
rM = 18%
rM = 15%
SML1
Original situation
Required Rate of Return (%)
SML2
After increasein risk aversion
Risk, bi
18
15
8
1.0
RPM = 3%
Impact of Risk Aversion Change
58
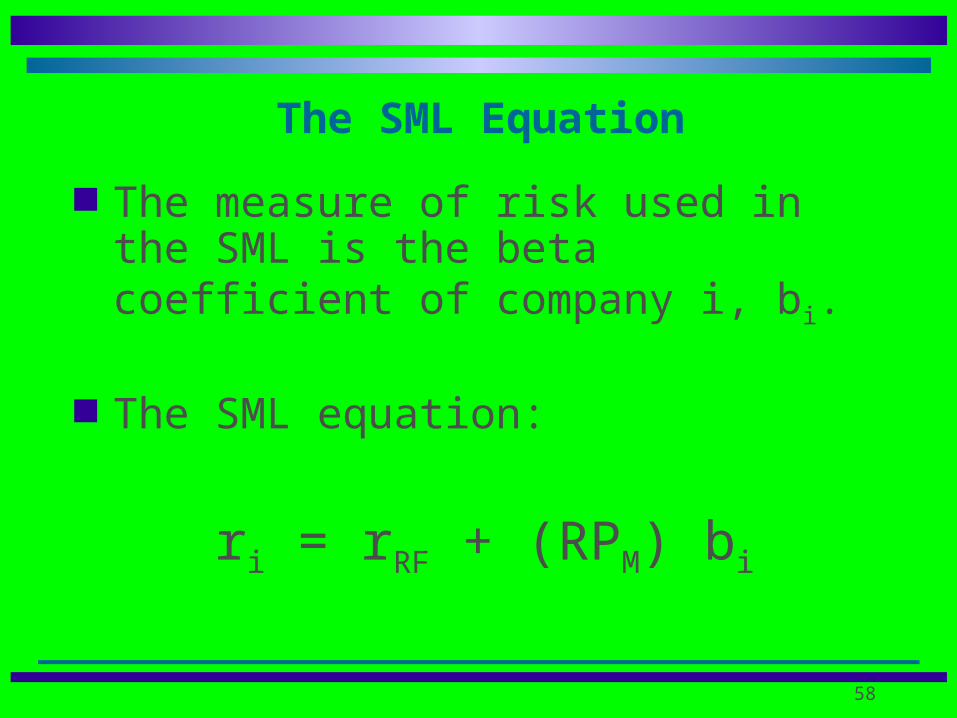
The measure of risk used in the SML is the beta coefficient of company i, bi.
The SML equation:
ri = rRF + (RPM) bi
The SML Equation
59
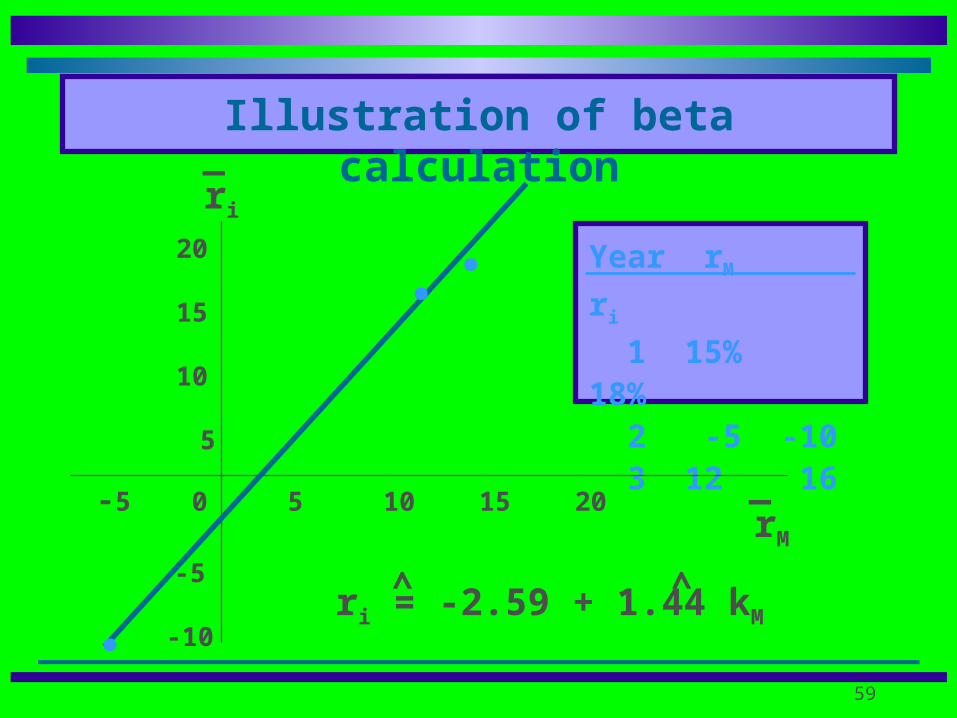
Illustration of beta calculation
Year rM ri
1 15% 18% 2 -5 -10 3 12 16
ri
_
rM
_-5 0 5 10 15 20
20
15
10
5
-5
-10
.
.
.
ri = -2.59 + 1.44 kM^ ^

60
(More...)
Method of CalculationMethod of Calculation
Analysts use a computer with statistical or spreadsheet software to perform the regression.– At least 3 year’s of monthly returns or 1
year’s of weekly returns are used.– Many analysts use 5 years of monthly
returns.

61
Interpreting Regression ResultsInterpreting Regression Results
The R2 measures the percent of a stock’s variance that is explained by the market. The typical R2 is:– 0.3 for an individual stock– over 0.9 for a well diversified portfolio

62
Interpreting Regression Results Interpreting Regression Results (Continued)(Continued)
The 95% confidence interval shows the range in which we are 95% sure that the true value of beta lies. The typical range is:– from about 0.5 to 1.5 for an individual stock– from about .92 to 1.08 for a well diversified
portfolio
63
Betas of individual securities are not good estimators of future risk.
Betas of portfolios of 10 or more randomly selected stocks are reasonably stable.
Past portfolio betas are good estimates of future portfolio volatility.

64
CAPM/SML concepts are based on expectations, yet betas are calculated using historical data. A company’s historical data may not reflect investors’ expectations about future riskiness.
Other models are being developed that will one day replace the CAPM, but it still provides a good framework for thinking about risk and return.