Sales Management Sales Quotas Topic 11. 3 Powerful Tools Quotas Compensation Company Policy.
Upload
phungthuanCategory
view
219download
0
© 2016 International Monetary Fund
QUOTAS—DATA UPDATE AND SIMULATIONS
IMF staff regularly produces papers proposing new IMF policies, exploring options for
reform, or reviewing existing IMF policies and operations. The following documents have
been separately released:
The Staff Report Quotas—Data Update and Simulations, prepared by IMF staff and
completed on August 9, 2016.
Staff Supplement on Quotas—Data Update and Simulations—Statistical Appendix,
completed on August 10, 2016.
The IMF’s transparency policy allows for the deletion of market-sensitive information and
premature disclosure of the authorities’ policy intentions in published staff reports and
other documents.
Electronic copies of IMF Policy Papers
are available to the public from
http://www.imf.org/external/pp/ppindex.aspx
International Monetary Fund
Washington, D.C.
September 2016
These documents were prepared by IMF staff and were presented to the Executive
Board in an informal session on September 9, 2016. Such informal sessions are used to
brief Executive Directors on policy issues, and to receive feedback from them. No
decisions are taken at these informal sessions. The views expressed in this paper are
those of the IMF staff and do not necessarily present the views of the IMF’s Executive
Board.

QUOTAS—DATA UPDATE AND SIMULATIONS
EXECUTIVE SUMMARY
The quota database has been updated by one year through 2014. Overall, the results of
the update continue the broad trends observed in previous updates, but the shifts
between the main country groups are generally smaller. Using the current quota
formula, the calculated quota share of Emerging Market and Developing Countries
(EMDCs) as a group increases by 0.6 percentage points relative to the 2015 update to
49.3 percent, which is about half the increase in the last update.
The paper takes stock of recent discussions on the quota formula, including the
outcome of the Quota Formula Review in 2013 and subsequent discussions in the
context of the annual quota data updates. It also updates the illustrative simulations of
possible reforms of the quota formula presented previously, using the latest data. These
simulations have sought to capture possible reforms that would be broadly in line with
the conclusions of the Quota Formula Review and Directors’ guidance is sought on the
relative merits of these reforms and the most productive areas for future work.
Initial simulations are also presented to show how possible changes in the quota
formula might feed through into shifts in actual quota shares in the context of the
15th Review. Given the very early stage of discussions, these simulations are purely
illustrative and no proposals are made. Rather the goal is to help inform the discussions
and seek feedback from Directors on the direction of future work.
The paper also proposes to update the current country groupings used in quota work,
and seeks guidance on how to define the poorest members for the purpose of
providing protection under the 15th Review.
August 9, 2016

QUOTAS—DATA UPDATE AND SIMULATIONS
2 INTERNATIONAL MONETARY FUND
Approved By Andrew Tweedie
Prepared by the Finance Department
(In collaboration with the Statistics Department)
The FIN team comprised H. Hatanpaa (lead), M. Albino-War,
R. Bhattacharya, E. Ozturk, R. Zhang, D. Mikhail, and S. Rodriguez-Apolinar.
T. Krueger (FIN) provided guidance.
CONTENTS
INTRODUCTION _________________________________________________________________________________ 5
UPDATED QUOTA DATABASE __________________________________________________________________ 6
A. Developments in Calculated Quota Shares_____________________________________________________ 6
B. Developments in Out-Of-Lineness ____________________________________________________________ 16
QUOTA FORMULA VARIABLES: TAKING STOCK ______________________________________________ 19
ILLUSTRATIVE CALCULATIONS FOR ALTERNATIVE QUOTA FORMULAS ____________________ 23
REALIGNING QUOTA SHARES _________________________________________________________________ 37
UPDATING COUNTRY GROUPINGS ___________________________________________________________ 48
CONCLUDING REMARKS _______________________________________________________________________ 49
BOXES
1. Data Sources and Methodology________________________________________________________________ 8
2. The Quota Formula ___________________________________________________________________________ 22
FIGURES
1. Evolution of CQS 2005–2014 ___________________________________________________________________ 7
2. Selected Macroeconomic Developments ______________________________________________________ 11
3. Contributions of Quota Variables to CQS _____________________________________________________ 13
4. Out-of-Lineness (OOL) ________________________________________________________________________ 18
TABLES
1a. Distribution of Quotas and Calculated Quotas ________________________________________________ 9
1b. Changes in Distribution of Calculated Quotas _______________________________________________ 10
2a. Distribution of Quotas and Updated Quota Variables ________________________________________ 14
2b. Updated GDP Blend Variable ________________________________________________________________ 15
3. Top 10 Positive and Negative Changes in Calculated Quota Shares ___________________________ 16
4. Under- and Overrepresented Countries by Major Country Groups ____________________________ 17

QUOTAS—DATA UPDATE AND SIMULATIONS
INTERNATIONAL MONETARY FUND 3
5. Illustrative Calculations: Summary _____________________________________________________________ 25
6. Illustrative Calculations—Current GDP and Openness Measures, and Dropping Variability ___ 27
7. Illustrative Calculations—Current Openness Measure, Dropping Variability, Weight Split
Evenly Between GDP and Openness, and Different Combinations of GDP Blend ____________ 28
8. Illustrative Calculations—Current Openness Measure, Dropping Variability, Weight Split
Between GDP (2/3) and Openness (1/3), and Different Combinations of GDP Blend _________ 29
9. Illustrative Calculations—Current Openness Measure, Dropping Variability, All Weight to
GDP, and Different Combinations of GDP Blend _____________________________________________ 30
10. Illustrative Calculations—Current Openness Measure, Dropping Variability, Weight of
Openness Reduced to 0.25, and Different Combinations of GDP Blend ______________________ 31
11. Illustrative Calculations—Current GDP Blend, Dropping Variability, Weight Split Evenly
Between GDP and Openness, and Different Openness Measures ____________________________ 32
12. Illustrative Calculations—Current GDP Blend, Dropping Variability, Weight Split Between
GDP (2/3) and Openness (1/3), and Different Openness Measures ___________________________ 33
13. Illustrative Calculations—Current GDP Blend, Dropping Variability, All Weight to GDP,
and Different Openness Measures ___________________________________________________________ 34
14. Illustrative Calculations—Current GDP and Openness Measures, Dropping Variability, and
Higher Compression (0.925) __________________________________________________________________ 35
15. Illustrative Calculations—Current GDP and Openness Measures, Dropping Variability and
Lower Compression (0.975) __________________________________________________________________ 36
16. Adjustment Coefficients and Convergence Indices ___________________________________________ 38
17. Weights of Variables for the Formulas Used for Illustrative Quota Allocations _______________ 39
18. Illustration of Allocation Mechanisms: Summary _____________________________________________ 41
19. Illustration of Allocation Mechanisms: Current Formula ______________________________________ 42
20. Illustration of Allocation Mechanisms: Formula 1.2 __________________________________________ 43
21. Illustration of Allocation Mechanisms: Formula 1.3 __________________________________________ 44
22. Illustration of Allocation Mechanisms: Formula 3.2.c _________________________________________ 45
23. Illustration of Allocation Mechanisms: Formula 3.3.c _________________________________________ 46
24. Illustration of Allocation Mechanisms: Formula 1.3, Includes 5 percent Ad Hoc Distribution
based on Voluntary Financial Contributions __________________________________________________ 47
25. Changes in CQS resulting from WEO Classification __________________________________________ 49
ANNEXES
I. Quota Formula Variables ______________________________________________________________________ 51
II. Country Groups _______________________________________________________________________________ 69
III. Defining the Poorest Members _______________________________________________________________ 74
IV. Voluntary Financial Contributions ____________________________________________________________ 77

QUOTAS—DATA UPDATE AND SIMULATIONS
4 INTERNATIONAL MONETARY FUND
Acronyms
AEs Advanced Economies
AQS Actual Quota Share
CQS Calculated Quota Share
EMDCs Emerging Market and Developing Countries
FCS Financial Contributions
FTP Financial Transactions Plan
ICP International Comparison Program
IDA International Development Association
LDCs Least Developed Countries
LICs Low Income Countries
LIDCs Low Income Developing Countries
OOL Out-of-lineness
PP Percentage Points
PPP Purchasing Power Parity
PRGT Poverty Reduction and Growth Trust
QFR Quota Formula Review
VFCS Voluntary Financial Contributions

QUOTAS—DATA UPDATE AND SIMULATIONS
INTERNATIONAL MONETARY FUND 5
INTRODUCTION
1. This paper provides background for an informal discussion of issues relating to the
quota formula and the distribution of any quota increases under the Fifteenth General Review
of Quotas (hereafter the 15th Review). In Resolution No. 71-2, the Board of Governors called on
the Executive Board to work expeditiously on the 15th Review in line with previous Executive Board
understandings, and with the aim of completing the 15th Review by the 2017 Annual Meetings. The
IMFC has also called on the Executive Board to work expeditiously toward completion of the
15th Review, including a new quota formula.1
2. Executive Directors have discussed the quota formula on a number of occasions since
the completion of the 14th Review. Extensive discussions took place in 2012-13 as part the Quota
Formula Review (QFR), and important progress was made in identifying key elements that could
form the basis for a final agreement on a new quota formula. At the conclusion of the QFR, the
Board agreed that achieving broad consensus on a new quota formula would best be done in the
context of the 15th Review, and that the discussions on this issue would be integrated and move in
parallel with the discussion on the 15th Review. Directors have subsequently revisited these issues in
the context of the annual updates of the quota database.2
3. The paper is organized as follows. The results of updating the quota database by one year
to 2014 are presented in the next section. The paper then recalls the outcome of the QFR and takes
stock of the discussions on the formula to date. The following section presents some purely
illustrative simulations of possible reforms of the formula, building on the outcome of the QFR and
using the new data. Some initial simulations of alternative quota allocations are also presented to
illustrate the potential implications for actual quota shares of reforms of the quota formula. It is
recognized that extensive further discussions of the distribution of any quota increase will be
needed in parallel with discussions on the appropriate future size of Fund quotas. The paper also
proposes aligning the analytical country groupings used for quota purposes with the WEO country
groups. Directors’ feedback is also sought on how to define the poorest members for the purpose of
protection under the 15th Review and on the alternative approaches to measuring voluntary financial
contributions to the Fund. The final section concludes and presents issues for discussion.
1 See the Board of Governors Resolution No. 71-2 on the Fifteenth General Review of Quotas (2/19/16) and the
Communiqué of the Thirty-Third Meeting of the IMFC, April 16, 2016, Washington, D.C.
2 See Outcome of the Quota Formula Review—Report of the Executive Board to the Board of Governors (1/31/13),
Quota Formula—Data Update (6/22/15), Quota Formula—Data Update and Further Considerations (7/2/14), and
Quota Formula—Data Update and Further Considerations (6/6/13).

QUOTAS—DATA UPDATE AND SIMULATIONS
6 INTERNATIONAL MONETARY FUND
UPDATED QUOTA DATABASE
A. Developments in Calculated Quota Shares
4. Staff has updated the quota database through 2014. The update advances by one year
the data presented last June, using the same sources as in past updates (see Box 1 and the Statistical
Appendix).3 The new data continue the broad trends observed previously, but the shifts between the
main country groups are generally smaller. Calculated quota shares (CQS) for the main country
groups and individual members are shown in Tables 1a and A1.4 These results and those presented
in the rest of this section are based on the current quota formula and country group classifications,
pending further discussions.5,6
5. The data update results in a further modest increase in the CQS of EMDCs as a group.
Their aggregate share increases by 0.6 percentage points (pp) to 49.3 percent (Tables 1a and 1b),
which is about half the increase in the last update (1.3 pp) and constitutes the smallest overall gain
for EMDCs since the current quota formula was agreed in 2008. Gains in EMDC shares continue to
be recorded in Asia, driven by China. EMDC shares in other regions remain broadly stable. Among
the advanced economies (AEs), the share of the major advanced economies declines by 0.7 pp—
with all countries (except for the UK) recording a decline. The share of other advanced economies as
a group increases by 0.1 pp, compared to a decline of 0.1 pp in the previous update.
6. The CQS shifts have been more sizable over a longer timeframe:
The aggregate shift to EMDCs has been 13.1 pp since the current quota formula was agreed in
2008, based on data through 2005 (Figure 1 and Table 1a). China has accounted for over
40 percent (5.6 pp) of this increase, with India (1.0 pp), Saudi Arabia (0.9 pp), Russia (0.7 pp), and
Brazil (0.6 pp) also recording sizable gains. The aggregate share of low income countries (LICs)
increased by more than one third.7 Among AEs, the major advanced economies’ share declined
by 11.5 pp, with the US and Japan accounting for about two thirds of this decline. Over the same
period, the share of other advanced economies as a group declined by 1.6 pp.
The CQS of EMDCs has increased by 7.5 pp since the 14th Review, which was based on data
through 2008. Over this 6-year period, the largest increase was recorded by China (4.1 pp). India
(0.6 pp), Saudi Arabia (0.4 pp), and Indonesia (0.4 pp) also recorded sizable gains. Driven by
3 Quota Formula—Data Update (6/22/15).
4 Individual country data and simulation results, as well as some additional technical material, are presented in the
Statistical Appendix (circulated separately).
5 The country classifications used in this paper have remained unchanged since the 11th Review and have become
increasingly outdated (see below and Annex II).
6 The current formula is CQS = (0.50*GDP + 0.30*Openness +0.15*Variability + 0.05*Reserves)^K. GDP is blended
using 60 percent market and 40 percent PPP exchange rates; K is a compression factor of 0.95; see Box 2.
7 LICs are defined as countries that are currently PRGT eligible plus Zimbabwe, which was removed from the PRGT list
by a Board decision in connection with its overdue obligations to the PRGT.

QUOTAS—DATA UPDATE AND SIMULATIONS
INTERNATIONAL MONETARY FUND 7
China, Asia accounted for about three-quarters of the total gains for EMDCs. The CQS of LICs
increased by 0.5 pp. Among AEs, the combined CQS of the major advanced economies declined
by 6.8 pp. All countries in this group lost CQS, with the US (-2.7 pp), Japan (-1.2 pp), and the UK
(-1.1 pp) experiencing the largest falls. The share of other advanced economies declined
by 0.7 pp.
CQS changes in relative terms, i.e., measured in percent, have varied widely (Table 1b). Among the
larger economies, China saw the largest relative increase in its CQS since the 14th Review
(51.9 percent), followed by Indonesia (43.6 percent) and Nigeria (39.8 percent). In addition, the
CQS for Switzerland, Saudi Arabia, India, and Thailand increased by more than a quarter. The
CQS declines for major advanced economies ranged from 23.5 percent for the UK to 9.5 percent
for Canada. Among other advanced economies the declines for Ireland and Spain were also
relatively large.
Figure 1. Evolution of CQS 2005–2014 1/
(In percent)
Source: Finance Department
1/ Figures adjacent to each line denote the change in percentage points between the current CQS based on data through 2014,
relative to the CQS based on data through 2005.
Africa, +0.9
Middle East, Malta, Turkey, +2.4
Western Hemisphere, +0.8
Transition Economies, +1.4
LICs, +0.6
Asia (RHS), +7.6
15
16
17
18
19
20
21
22
23
24
25
1
2
3
4
5
6
7
8
2005 2006-2007 2008 2009 2010 2011 2012 2013 2014
Major Advanced Economies, -11.5
Other Advanced Economies, -1.6
EMDCs, +13.1
0
10
20
30
40
50
2005 2006-2007 2008 2009 2010 2011 2012 2013 2014

QUOTAS—DATA UPDATE AND SIMULATIONS
8 INTERNATIONAL MONETARY FUND
Box 1. Data Sources and Methodology 1/
The data sources and methodology remain closely in line with past practice. The primary data source is
the Fund’s International Financial Statistics (IFS). Missing data were supplemented in the first instance by the
World Economic Outlook (WEO) database. Remaining missing data were computed based on staff reports and,
in very few instances, country desk data. As is customary, a cutoff date of January 31, 2016 for incorporating
new data in the quota database was employed for IFS; consistent with this cutoff, the Fall 2015 publication
was used for WEO data.
The PPP GDP data are calculated by dividing a country's nominal GDP in its own currency by its
corresponding PPP factor. The 2011 International Comparison Program (ICP) PPP factors were extended to
include 2012, 2013, and 2014 using WEO methodology.
Data for openness and variability reflect the ongoing implementation of BPM6, introduced in the 2013
quota data update. Country coverage has broadened with this update to include 120 BPM6-data reporting
members compared with 81 previously. Under the BPM6 methodology, the full value of goods for processing
is no longer counted under the reported (gross) exports and imports (these are goods processed under
contract for an explicit fee by a non-resident processing entity, where the goods being processed do not
change ownership); rather only the fees from processing are recorded under services. As discussed in Annex I
of Quota Formula—Data Update and Further Consideration (6/6/13), the overall impact of this change is
relatively modest.
__________________________
1/ See the Statistical Appendix for additional details.

QUOTAS—DATA UPDATE AND SIMULATIONS
INTERNATIONAL MONETARY FUND 9
Table 1a. Distribution of Quotas and Calculated Quotas
(In percent)
Source: Finance Department
1/ These results are based on the current quota formula: CQS = (0.50*GDP + 0.30*Openness + 0.15*Variability +
0.05*Reserves)^K. GDP blend using 60 percent market and 40 percent PPP exchange rates. K is a compression factor of 0.95. The
quota formula is typically used to inform discussions on the allocation of quota increases, but other considerations are also taken
into account.
2/ The “2008 Reform” reflects quotas after the “second round” ad hoc quota increases for 54 members agreed in 2008, following
the “first round” ad hoc increases for four members agreed in 2006. Includes South Sudan and Nauru which became members on
April 18, 2012 and April 12, 2016, respectively. For the two countries, Somalia and Sudan, that have not yet consented to and paid
for their quota increases, 11th Review proposed quotas are used.
3/ Includes South Sudan and Nauru which became members on April 18, 2012 and April 12, 2016, respectively; reflects their
quota increases proposed in their respective membership resolutions after the effectiveness of the 14th Review.
4/ Reflects the impact of adjustments to current receipts and payments for re-exports, international banking interest, and non-
monetary gold.
5/ Including Czech Republic, Estonia, Korea, Latvia, Lithuania, Malta, Singapore, Slovak Republic, and Slovenia.
6/ Including China, P.R., Hong Kong SAR and Macao SAR.
7/ Currently PRGT-eligible countries plus Zimbabwe.
2008 Reform 2/ 14th Review 3/
2008
Reform
(2005) 4/
14th
Review
(2008)
Previous
(2013)
Current
(2014)
Advanced economies 60.4 57.6 63.8 58.2 51.3 50.7Major advanced economies 45.3 43.4 47.6 42.9 36.8 36.1
United States 17.7 17.4 19.0 17.0 14.5 14.3Japan 6.6 6.5 8.0 6.5 5.6 5.3Germany 6.1 5.6 6.2 5.7 5.1 5.1France 4.5 4.2 4.0 3.8 3.4 3.3United Kingdom 4.5 4.2 4.4 4.7 3.4 3.6Italy 3.3 3.2 3.3 3.0 2.6 2.5Canada 2.7 2.3 2.6 2.3 2.1 2.1
Other advanced economies 15.1 14.3 16.2 15.3 14.5 14.6Spain 1.7 2.0 2.3 2.2 1.9 1.8Netherlands 2.2 1.8 1.9 1.9 1.8 2.1Australia 1.4 1.4 1.3 1.4 1.5 1.5Belgium 1.9 1.3 1.5 1.3 1.2 1.1Switzerland 1.5 1.2 1.2 1.2 1.6 1.6Sweden 1.0 0.9 1.0 0.9 1.0 0.9Austria 0.9 0.8 0.9 0.8 0.8 0.7Norway 0.8 0.8 0.8 0.8 0.8 0.8Ireland 0.5 0.7 1.2 1.1 0.7 0.7Denmark 0.8 0.7 0.9 0.7 0.6 0.6
Emerging Market and Developing Countries 5/ 39.6 42.4 36.2 41.8 48.7 49.3Africa 5.0 4.4 2.8 3.1 3.7 3.7
South Africa 0.8 0.6 0.6 0.6 0.6 0.5Nigeria 0.7 0.5 0.3 0.5 0.7 0.7
Asia 12.6 16.0 15.8 17.7 22.6 23.4China 6/ 4.0 6.4 6.4 7.9 11.3 12.0India 2.4 2.7 2.0 2.4 3.0 3.0Korea, Republic of 1.4 1.8 2.2 2.1 2.0 2.0Indonesia 0.9 1.0 0.9 0.9 1.3 1.3Singapore 0.6 0.8 1.0 1.2 1.3 1.3Malaysia 0.7 0.8 0.9 0.8 0.8 0.8Thailand 0.6 0.7 0.8 0.8 1.0 1.0
Middle East, Malta & Turkey 7.2 6.7 4.8 6.2 7.2 7.2Saudi Arabia 2.9 2.1 0.8 1.3 1.7 1.7Turkey 0.6 1.0 1.0 1.1 1.1 1.1Iran, Islamic Republic of 0.6 0.7 0.6 0.7 0.8 0.8
Western Hemisphere 7.7 7.9 6.6 7.0 7.5 7.4Brazil 1.8 2.3 1.7 2.2 2.3 2.3Mexico 1.5 1.9 2.0 1.8 1.7 1.7Venezuela, República Bolivariana de 1.1 0.8 0.4 0.5 0.5 0.5Argentina 0.9 0.7 0.6 0.6 0.7 0.6
Transition economies 7.1 7.2 6.2 7.7 7.7 7.6Russian Federation 2.5 2.7 2.1 2.9 2.8 2.7Poland 0.7 0.9 0.9 0.9 0.9 0.9
Total 100.0 100.0 100.0 100.0 100.0 100.0
Memorandum Item:EU 28 32.0 30.4 33.1 31.5 27.6 27.5LICs 7/ 3.3 3.3 1.6 1.7 2.1 2.2
Quota Shares Calculated Quota Shares 1/

QUOTAS—DATA UPDATE AND SIMULATIONS
10 INTERNATIONAL MONETARY FUND
Table 1b. Changes in Distribution of Calculated Quotas
(In percent)
Source: Finance Department
1/ These results are based on the current quota formula: CQS = (0.50*GDP + 0.30*Openness + 0.15*Variability +
0.05*Reserves)^K. GDP blend using 60 percent market and 40 percent PPP exchange rates. K is a compression factor of 0.95. The
quota formula is typically used to inform discussions on the allocation of quota increases, but other considerations are also taken
into account.
2/ Including Czech Republic, Estonia, Korea, Latvia, Lithuania, Malta, Singapore, Slovak Republic, and Slovenia.
3/ Including China, P.R., Hong Kong SAR and Macao SAR.
4/ Currently PRGT-eligible countries plus Zimbabwe.
7. The most recent gain in CQS for EMDCs reflects increases in their shares of all quota
formula variables, particularly GDP, consistent with continued divergence in global growth
rates. With the slowdown in the growth rate in EMDCs since the latest update, the growth
divergence has narrowed further but nonetheless remains sizable (Figure 2 upper panel). As a result,
14th
Review
(2008)
Previous
(2013)
Current
(2014)
Absolute Change
(2014 vs 2013)
(in pp)
Relative Change
(2014 vs 2013)
(in percent)
Absolute Change
(2014 vs 2008)
(in pp)
Relative Change
(2014 vs 2008)
(in percent)
Advanced economies 58.2 51.3 50.7 -0.6 -1.2 -7.5 -12.9Major advanced economies 42.9 36.8 36.1 -0.7 -1.9 -6.8 -15.9
United States 17.0 14.5 14.3 -0.2 -1.5 -2.7 -15.7Japan 6.5 5.6 5.3 -0.3 -5.8 -1.2 -18.3Germany 5.7 5.1 5.1 0.0 -0.4 -0.6 -10.9France 3.8 3.4 3.3 -0.1 -3.8 -0.5 -14.2United Kingdom 4.7 3.4 3.6 0.1 3.4 -1.1 -23.5Italy 3.0 2.6 2.5 -0.1 -3.7 -0.5 -16.6Canada 2.3 2.1 2.1 0.0 -2.2 -0.2 -9.5
Other advanced economies 15.3 14.5 14.6 0.1 0.6 -0.7 -4.7Spain 2.2 1.9 1.8 -0.1 -5.2 -0.4 -19.8Netherlands 1.9 1.8 2.1 0.3 17.7 0.3 13.6Australia 1.4 1.5 1.5 0.0 -3.0 0.1 7.4Belgium 1.3 1.2 1.1 0.0 -3.8 -0.2 -14.4Switzerland 1.2 1.6 1.6 0.1 4.2 0.4 33.1Sweden 0.9 1.0 0.9 0.0 -2.7 0.0 -1.2Austria 0.8 0.8 0.7 0.0 -2.4 -0.1 -12.3Norway 0.8 0.8 0.8 0.0 -2.5 0.0 -5.8Ireland 1.1 0.7 0.7 0.0 0.3 -0.3 -31.2Denmark 0.7 0.6 0.6 0.0 -3.8 -0.1 -20.1
Emerging Market and Developing Countries 2/ 41.8 48.7 49.3 0.6 1.3 7.5 18.0Africa 3.1 3.7 3.7 0.0 -0.6 0.5 16.6
South Africa 0.6 0.6 0.5 0.0 -2.9 0.0 -7.1Nigeria 0.5 0.7 0.7 0.0 2.2 0.2 39.8
Asia 17.7 22.6 23.4 0.9 3.8 5.7 32.2China 3/ 7.9 11.3 12.0 0.8 6.8 4.1 51.9India 2.4 3.0 3.0 0.0 -0.2 0.6 26.1Korea, Republic of 2.1 2.0 2.0 0.0 0.2 -0.1 -6.9Indonesia 0.9 1.3 1.3 0.0 2.8 0.4 43.6Singapore 1.2 1.3 1.3 0.0 -1.1 0.1 9.6Malaysia 0.8 0.8 0.8 0.0 -3.2 0.0 -1.1Thailand 0.8 1.0 1.0 0.0 0.4 0.2 25.1
Middle East, Malta & Turkey 6.2 7.2 7.2 0.0 -0.3 1.1 17.1Saudi Arabia 1.3 1.7 1.7 0.0 -0.9 0.4 26.4Turkey 1.1 1.1 1.1 0.0 -1.5 0.0 -2.5Iran, Islamic Republic of 0.7 0.8 0.8 0.0 -3.3 0.1 16.3
Western Hemisphere 7.0 7.5 7.4 0.0 -0.6 0.4 5.2Brazil 2.2 2.3 2.3 0.0 0.1 0.2 8.4Mexico 1.8 1.7 1.7 0.0 0.0 -0.1 -3.2Venezuela, República Bolivariana de 0.5 0.5 0.5 0.0 -0.6 0.0 -2.9Argentina 0.6 0.7 0.6 -0.1 -7.3 0.0 5.7
Transition economies 7.7 7.7 7.6 -0.1 -1.8 -0.1 -1.6Russian Federation 2.9 2.8 2.7 -0.1 -2.9 -0.2 -7.7Poland 0.9 0.9 0.9 0.0 -2.0 0.0 -3.0
Total 100.0 100.0 100.0
Memorandum Item:EU 28 31.5 27.6 27.5 -0.1 -0.3 -4.0 -12.7LICs 4/ 1.7 2.1 2.2 0.1 3.4 0.5 29.6
Changes w.r.t Previous CQS Changes w.r.t 14th Review CQSCalculated Quota Shares 1/

QUOTAS—DATA UPDATE AND SIMULATIONS
INTERNATIONAL MONETARY FUND 11
the aggregate share of EMDCs in the GDP blend increased by 0.9 pp (Tables 2a and 2b). With
external flows flattening, EMDCs recorded modest gains in their shares of global openness and
variability (Figure 2 lower panel, and Table 2a). The share of EMDCs in global reserves rose slightly to
76.7 percent from 76.1 percent. This increase reflects a 1.7 pp gain in China’s share, largely offset by
declining shares in several EMDCs across regions, and particularly in Russia (-0.7 pp).
Figure 2. Selected Macroeconomic Developments
Average GDP Growth Rates
Openness
Source: Finance Department
-1
0
1
2
3
4
5
6
7
8
2005-07 2006-08 2007-09 2008-10 2009-11 2010-12 2011-13 2012-14
In Percent
Advanced Economies EMDCs LICs
200
300
400
500
600
700
800
2,000
6,000
10,000
14,000
18,000
22,000
2005 2006 2007 2008 2009 2010 2011 2012 2013 2014
Advanced Economies EMDCs LICs (RHS)
Current Receipts and Current Payments (billions of SDRs)

QUOTAS—DATA UPDATE AND SIMULATIONS
12 INTERNATIONAL MONETARY FUND
8. Figure 3 shows the contributions of the five quota variables to CQS for major groups
during the last five data updates.8 For EMDCs as a group, the rising shares of market GDP, PPP
GDP and openness have been the main contributors to the increases in their CQS (Figure 3, bottom
panel). For the major advanced countries, the reverse applies as this group has steadily lost share
across all three variables. Market GDP continues to make the most important contribution to CQS
for this group, whereas for EMDCs, the contributions of market GDP, PPP GDP and openness are
broadly similar (reflecting their larger share of PPP GDP, which has a lower weight in the formula).
Openness and variability combined contribute roughly 60 percent of the CQS for other advanced
economies as a group (for a more comprehensive discussion on the relationship between openness
and variability, see Annex I).
8 The contribution of each quota variable is defined as each major group’s aggregate share multiplied by its
coefficient in the quota formula (e.g., 0.3 for market GDP and 0.2 for PPP GDP). The contributions will not equal the
corresponding CQS due to compression.

QUOTAS—DATA UPDATE AND SIMULATIONS
INTERNATIONAL MONETARY FUND 13
Figure 3. Contributions of Quota Variables to CQS
(In percent)
Source: Finance Department
0
2
4
6
8
10
12
14
16
18
Market GDP PPP GDP Openness Variability Reserves
Major Advanced Economies--CQS 36.1 Percent
2012 Data Update 2013 Data Update 2014 Data Update 2015 Data Update 2016 Data Update
0
1
2
3
4
5
6
7
Market GDP PPP GDP Openness Variability Reserves
Other Advanced Economies--CQS 14.6 Percent
2012 Data Update 2013 Data Update 2014 Data Update 2015 Data Update 2016 Data Update
0
2
4
6
8
10
12
14
Market GDP PPP GDP Openness Variability Reserves
EMDCs--CQS 49.3 Percent
2012 Data Update 2013 Data Update 2014 Data Update 2015 Data Update 2016 Data Update

QUOTAS—DATA UPDATE AND SIMULATIONS
14 INTERNATIONAL MONETARY FUND
Table 2a. Distribution of Quotas and Updated Quota Variables
(In percent)
Source: Finance Department
1/ Includes South Sudan and Nauru which became members on April 18, 2012 and April 12, 2016, respectively; reflects their
quota increases proposed in their respective membership resolutions after the effectiveness of the 14th Review.
2/ Based on IFS data through 2014.
3/ Based on IFS data through 2013.
4/ GDP blend using 60 percent market and 40 percent PPP exchange rates.
5/ Variability of current receipts minus net capital flows (due to change in sign convention in BPM6).
6/ Including Czech Republic, Estonia, Korea, Latvia, Lithuania, Malta, Singapore, Slovak Republic, and Slovenia.
7/ Including China, P.R., Hong Kong SAR, and Macao SAR.
8/ Currently PRGT-eligible countries plus Zimbabwe.
GDP Blend 4/ Openness Variability 5/ Reserves
Quota Shares 1/ Current 2/ Previous 3/ Current 2/ Previous 3/ Current 2/ Previous 3/ Current 2/ Previous 3/
Advanced economies 57.6 50.5 51.4 57.3 57.7 55.6 56.2 23.3 23.9
Major advanced economies 43.4 41.0 41.8 37.7 38.5 36.1 37.1 15.0 15.5United States 17.4 19.8 20.0 12.6 12.7 13.1 13.9 1.2 1.3Japan 6.5 5.9 6.5 4.2 4.2 5.1 5.5 10.7 11.0Germany 5.6 4.4 4.3 7.3 7.5 5.7 5.5 0.6 0.6France 4.2 3.2 3.3 4.1 4.2 3.0 3.4 0.5 0.5United Kingdom 4.2 3.1 3.1 4.4 4.4 4.7 4.0 0.8 0.8Italy 3.2 2.5 2.6 2.7 2.9 2.6 2.9 0.5 0.5Canada 2.3 2.0 2.1 2.5 2.5 1.8 1.9 0.6 0.6
Other advanced economies 14.3 9.4 9.6 19.6 19.2 19.5 19.2 8.4 8.4Spain 2.0 1.7 1.7 2.0 2.2 2.0 2.2 0.3 0.3Netherlands 1.8 1.0 1.0 3.8 2.9 3.1 2.6 0.2 0.2Australia 1.4 1.6 1.7 1.5 1.5 1.3 1.4 0.4 0.4Belgium 1.3 0.6 0.6 1.9 2.0 1.4 1.6 0.2 0.2Switzerland 1.2 0.7 0.7 2.2 2.2 2.4 1.9 4.3 4.3Sweden 0.9 0.6 0.6 1.1 1.2 1.4 1.4 0.5 0.5Austria 0.8 0.5 0.5 1.0 1.1 0.9 0.9 0.1 0.1Norway 0.8 0.5 0.5 0.8 0.8 1.2 1.3 0.6 0.5Ireland 0.7 0.3 0.3 1.2 1.3 1.3 1.2 0.0 0.0Denmark 0.7 0.4 0.4 0.8 0.8 0.6 0.7 0.7 0.8
Emerging Market and Developing Countries 6/ 42.4 49.5 48.6 42.7 42.3 44.4 43.8 76.7 76.1
Africa 4.4 3.3 3.2 2.8 2.8 3.7 4.0 3.5 3.8South Africa 0.6 0.6 0.6 0.5 0.5 0.3 0.3 0.4 0.4Nigeria 0.5 0.8 0.8 0.4 0.4 0.5 0.5 0.3 0.4
Asia 16.0 25.8 24.6 21.2 20.8 16.6 15.5 46.7 45.0China 7/ 6.4 14.4 13.4 9.8 9.4 8.2 6.9 33.9 32.3
India 2.7 4.2 4.2 2.1 2.1 1.4 1.5 2.5 2.4Korea, Republic of 1.8 1.7 1.7 2.6 2.6 0.9 1.0 3.1 3.0Indonesia 1.0 1.7 1.6 0.8 0.8 0.7 0.7 0.9 0.9Singapore 0.8 0.4 0.4 2.3 2.3 1.7 1.9 2.3 2.4Malaysia 0.8 0.5 0.5 1.0 1.0 0.8 0.9 1.1 1.2Thailand 0.7 0.7 0.7 1.1 1.1 1.2 1.3 1.4 1.5
Middle East, Malta & Turkey 6.7 6.1 6.1 6.0 5.9 8.8 8.8 12.0 11.9Saudi Arabia 2.1 1.2 1.2 1.2 1.2 2.5 2.6 6.4 6.2Turkey 1.0 1.2 1.2 0.9 0.9 1.1 1.1 1.0 1.0Iran, Islamic Republic of 0.7 1.0 1.0 0.4 0.4 0.5 0.5 1.1 1.0
Western Hemisphere 7.9 8.2 8.3 5.4 5.3 6.3 6.3 7.1 7.2Brazil 2.3 3.1 3.1 1.3 1.2 1.7 1.5 3.2 3.3Mexico 1.9 1.8 1.8 1.6 1.6 1.6 1.6 1.6 1.5Venezuela, República Bolivariana de 0.8 0.5 0.5 0.3 0.3 0.5 0.6 0.1 0.1Argentina 0.7 0.8 0.9 0.4 0.4 0.4 0.5 0.2 0.3
Transition economies 7.2 6.3 6.4 7.3 7.4 9.0 9.2 7.3 8.2Russian Federation 2.7 3.0 3.1 2.2 2.2 2.6 2.7 3.6 4.3Poland 0.9 0.8 0.8 1.0 1.0 0.9 1.0 0.8 0.9
Total 100.0 100.0 100.0 100.0 100.0 100.0 100.0 100.0 100.0
Memorandum Items:EU 28 30.4 21.3 21.5 36.6 36.7 33.7 33.5 7.0 7.3LICs 8/ 3.3 1.9 1.8 1.5 1.5 2.2 2.1 1.3 1.3
14th General Review

QUOTAS—DATA UPDATE AND SIMULATIONS
INTERNATIONAL MONETARY FUND 15
Table 2b. Updated GDP Blend Variable
(In percent)
Source: Finance Department
1/ Includes South Sudan and Nauru which became members on April 18, 2012 and April 12, 2016, respectively; reflects their
quota increases proposed in their respective membership resolutions after the effectiveness of the 14th Review.
2/ Based on the following formula: CQS = (0.50*GDP + 0.30*Openness +0.15*Variability + 0.05*Reserves)^K. GDP blended
using 60 percent market and 40 percent PPP exchange rates. K is a compression factor of 0.95.
3/ Based on IFS data through 2014.
4/ Based on IFS data through 2013.
5/ Current PPP-GDP data were retrieved from the WEO database for 186 countries. For the countries with no WEO data
(Nauru, Somalia and Syrian Arab Republic), PPP-GDP was gap filled.
6/ GDP blend using 60 percent market and 40 percent PPP exchange rates.
7/ Including Czech Republic, Estonia, Korea, Latvia, Lithuania, Malta, Singapore, Slovak Republic, and Slovenia.
8/ Including China, P.R., Hong Kong SAR, and Macao SAR.
9/ Currently PRGT-eligible countries plus Zimbabwe.
GDP PPP GDP 5/ GDP Blend 6/
Quota Shares 1/ Shares 2/ 3/ Current 3/ Previous 4/ Current 3/ Previous 4/ Current 3/ Previous 4/
Advanced economies 57.6 50.7 57.6 58.5 39.8 40.7 50.5 51.4Major advanced economies 43.4 36.1 46.5 47.2 32.8 33.5 41.0 41.8
United States 17.4 14.3 22.2 22.1 16.3 16.7 19.8 20.0Japan 6.5 5.3 6.9 7.6 4.5 4.7 5.9 6.5Germany 5.6 5.1 4.9 4.9 3.5 3.6 4.4 4.3France 4.2 3.3 3.7 3.7 2.5 2.6 3.2 3.3United Kingdom 4.2 3.6 3.6 3.6 2.4 2.3 3.1 3.1Italy 3.2 2.5 2.8 2.9 2.1 2.1 2.5 2.6Canada 2.3 2.1 2.4 2.5 1.5 1.5 2.0 2.1
Other advanced economies 14.3 14.6 11.1 11.2 7.0 7.2 9.4 9.6Spain 2.0 1.8 1.8 1.9 1.5 1.5 1.7 1.7Netherlands 1.8 2.1 1.1 1.1 0.8 0.8 1.0 1.0Australia 1.4 1.5 2.0 2.1 1.0 1.0 1.6 1.7Belgium 1.3 1.1 0.7 0.7 0.5 0.5 0.6 0.6Switzerland 1.2 1.6 0.9 0.9 0.4 0.4 0.7 0.7Sweden 0.9 0.9 0.7 0.8 0.4 0.4 0.6 0.6Austria 0.8 0.7 0.6 0.6 0.4 0.4 0.5 0.5Norway 0.8 0.8 0.7 0.7 0.3 0.3 0.5 0.5Ireland 0.7 0.7 0.3 0.3 0.2 0.2 0.3 0.3Denmark 0.7 0.6 0.4 0.4 0.2 0.2 0.4 0.4
Emerging Market and Developing Countries 7/ 42.4 49.3 42.4 41.5 60.2 59.3 49.5 48.6Africa 4.4 3.7 2.7 2.6 4.1 4.0 3.3 3.2
South Africa 0.6 0.5 0.5 0.5 0.7 0.7 0.6 0.6Nigeria 0.5 0.7 0.7 0.6 1.0 0.9 0.8 0.8
Asia 16.0 23.4 21.3 20.1 32.5 31.4 25.8 24.6China 8/ 6.4 12.0 13.0 11.9 16.5 15.7 14.4 13.4
India 2.7 3.0 2.6 2.6 6.6 6.6 4.2 4.2Korea, Republic of 1.8 2.0 1.7 1.7 1.7 1.7 1.7 1.7Indonesia 1.0 1.3 1.2 1.2 2.4 2.3 1.7 1.6Singapore 0.8 1.3 0.4 0.4 0.4 0.4 0.4 0.4Malaysia 0.8 0.8 0.4 0.4 0.7 0.7 0.5 0.5Thailand 0.7 1.0 0.5 0.5 1.0 0.9 0.7 0.7
Middle East, Malta & Turkey 6.7 7.2 5.2 5.2 7.4 7.5 6.1 6.1Saudi Arabia 2.1 1.7 1.0 1.0 1.5 1.5 1.2 1.2Turkey 1.0 1.1 1.1 1.1 1.4 1.4 1.2 1.2Iran, Islamic Republic of 0.7 0.8 0.8 0.8 1.3 1.3 1.0 1.0
Western Hemisphere 7.9 7.4 7.7 7.9 8.8 8.8 8.2 8.3Brazil 2.3 2.3 3.0 3.2 3.1 3.0 3.1 3.1Mexico 1.9 1.7 1.7 1.6 2.0 2.1 1.8 1.8Venezuela, República Bolivariana de 0.8 0.5 0.5 0.5 0.5 0.5 0.5 0.5Argentina 0.7 0.6 0.7 0.8 0.9 0.9 0.8 0.9
Transition economies 7.2 7.6 5.5 5.7 7.4 7.5 6.3 6.4Russian Federation 2.7 2.7 2.7 2.8 3.4 3.5 3.0 3.1Poland 0.9 0.9 0.7 0.7 0.9 0.9 0.8 0.8
Total 100.0 100.0 100.0 100.0 100.0 100.0 100.0 100.0
Memorandum Item:EU 28 30.4 27.5 23.7 23.8 17.7 17.9 21.3 21.5LICs 9/ 3.3 2.2 1.4 1.3 2.6 2.6 1.9 1.8
14th General Review Calculated Quota

QUOTAS—DATA UPDATE AND SIMULATIONS
16 INTERNATIONAL MONETARY FUND
9. As in previous updates, there were sizable absolute changes in CQS for some
individual members (Table 3). Among the largest gainers, China again recorded the largest
individual increase in CQS (0.77 pp) broadly in line with the last update. Three AEs are among the
top five gainers, namely the Netherlands, the UK, and Switzerland. For the Netherlands, the 0.32 pp
increase in CQS was driven by a higher share of openness associated mainly with changes in the
accounting treatment of balance of payments data.9 The gains for the UK and Switzerland were
mainly associated with a higher share in variability. Eight of the 10 largest declines in CQS were for
AEs. Japan had the largest individual decline (-0.33 pp), reflecting mainly a lower share in market
GDP. For the US, its share in market GDP was broadly unchanged, but its CQS (-0.21 pp) was
reduced by lower shares for the other variables.
Table 3. Top 10 Positive and Negative Changes in Calculated Quota Shares
(In percent)
Source: Finance Department
1/ Current and previous calculations are based on data through 2014 and 2013 respectively, using the existing formula.
2/ The difference between the current dataset through 2014 and the previous dataset through 2013, multiplied by the variable
weight in the quota formula. The change in CQS also reflects the effect of compression.
3/ GDP blended using 60 percent market and 40 percent PPP factors.
4/ Including China, P.R., Hong Kong SAR and Macao SAR.
B. Developments in Out-Of-Lineness
10. Out-of-lineness (OOL) based on the current formula has increased further. Comparing
CQS with 14th Review quota shares, at the aggregate level AEs are over-represented and EMDCs
9 In particular, this is the result of the transition of the Netherlands’ balance of payments to BPM6. With this
migration, data now include Special Financial Institutions (SFIs) as residents, which were previously explicitly excluded
from BPM5 (for more details, see Statistical Appendix).
Difference between
Current and Previous
Shares (In percent) 1/
Top 10: Positive Change Calculated Quota Share Market GDP PPP GDP GDP Blend 3/ Openness Variability Reserves
China 4/ 0.765 0.326 0.161 0.487 0.110 0.192 0.080
Netherlands 0.317 0.012 -0.007 0.006 0.253 0.071 -0.001
United Kingdom 0.117 0.014 0.012 0.027 -0.011 0.109 0.001
Switzerland 0.066 -0.007 0.002 -0.005 -0.009 0.081 0.000
United Arab Emirates 0.050 0.000 0.002 0.002 0.010 0.031 0.006
Indonesia 0.035 0.006 0.028 0.034 0.002 -0.003 0.002
Afghanistan 0.028 0.000 0.000 0.000 0.000 0.025 0.000
Oman 0.024 0.000 0.000 0.000 0.001 0.020 0.000
Luxembourg 0.022 0.000 0.000 0.000 0.023 -0.001 0.000
Vietnam 0.020 0.005 0.001 0.005 0.011 -0.001 0.003
Top 10: Negative Change
Japan -0.326 -0.231 -0.030 -0.261 -0.023 -0.060 -0.015
United States -0.212 0.023 -0.093 -0.070 -0.056 -0.118 -0.005
France -0.130 -0.008 -0.021 -0.029 -0.054 -0.056 -0.001
Spain -0.099 -0.014 -0.008 -0.023 -0.056 -0.024 -0.001
Italy -0.096 -0.016 -0.011 -0.027 -0.037 -0.037 -0.002
Russia -0.081 -0.030 -0.020 -0.049 0.007 -0.009 -0.035
Argentina -0.050 -0.029 -0.005 -0.034 -0.003 -0.008 -0.004
Australia -0.047 -0.026 -0.004 -0.029 -0.007 -0.012 0.001
Canada -0.046 -0.016 -0.005 -0.021 -0.012 -0.016 0.001
Belgium -0.045 0.001 -0.001 0.000 -0.018 -0.027 -0.001
Contribution of Variables to Change in CQS 2/

QUOTAS—DATA UPDATE AND SIMULATIONS
INTERNATIONAL MONETARY FUND 17
under-represented by 7.0 pp, compared with 6.3 pp in the previous update (Table 4). The number of
underrepresented members increased slightly to 73 compared with 72 in the previous update.
Table 4. Under- and Overrepresented Countries by Major Country Groups 1/
(In percent)
Source: Finance Department
1/ Under- and over-represented countries for the two datasets, respectively.
2/ Includes South Sudan and Nauru which became members on April 18, 2012 and April 12, 2016, respectively; reflects their
quota increases proposed in their respective membership resolutions after the effectiveness of the 14th Review.
3/ Difference between calculated quota shares and 14th General Review quota shares.
4/ Based on IFS data through 2014.
5/ Based on IFS data through 2013.
6/ The “2008 Reform” reflects quotas after the “second round” ad hoc quota increases for 54 members agreed in 2008, following
the “first round” ad hoc increases for four members agreed in 2006. Excludes South Sudan and Nauru which became members on
April 18, 2012 and April 12, 2016, respectively. For the two countries, Somalia and Sudan, that have not yet consented to and paid
for their quota increases, 11th Review proposed quotas are used.
7/ Difference between calculated quota shares based on IFS data through 2008 (14th Review) and 2008 Reform quota shares.
8/ Currently PRGT-eligible countries plus Zimbabwe.
11. These developments illustrate that calculated quota shares can over time depart
significantly from actual quota shares given the periodic nature of quota adjustments.
The 14th Review quota increases resulted in a major reduction of OOL. Aggregate OOL
for the membership as a whole would have been more than halved if the new quotas had
become effective immediately after the 14th Review was completed in 2010 (Figure 4).
However, subsequent economic developments have increased aggregate OOL again to
close to the level prevailing before the 14th Review. For example, the 73 countries that
are currently under-represented based on the current formula have an aggregate OOL of
about 11 pp, very close to the level prevailing in 2010. Within this group, one country—
China—now accounts for roughly half the aggregate OOL, compared with about one-third
prior to the 14th Review. Among over-represented countries, the US was modestly over-
represented in 2010 but now accounts for almost 30 percent of aggregate OOL, while Japan
14th General Review 2008 Reform Difference 7/Quota Share 2/ Current 4/ Previous 5/ Current Previous Quota Share 6/
(In percent) (In percent)
Advanced economies 57.6 -7.0 -6.3 26 26 60.5 -2.2
Underrepresented - 1.3 1.0 10 8 -- 1.8Overrepresented - -8.2 -7.3 16 18 -- -4.1
Emerging Market and Developing Countries 42.4 7.0 6.3 163 162 39.5 2.2
Underrepresented - 9.7 9.0 63 64 -- 8.9Overrepresented - -2.8 -2.7 100 98 -- -6.7
Total Underrepresented Countries 36.8 11.0 10.0 73 72 30.7 10.7Total Overrepresented Countries 63.2 -11.0 -10.0 116 116 69.3 -10.7
Memorandum Items:EU 28 30.4 -2.9 -2.8 28 28 32.0 -0.5
Underrepresented - 0.9 0.7 14 12 -- 2.2Overrepresented - -3.8 -3.5 14 16 -- -2.8
LICs 8/ 3.3 -1.1 -1.2 70 70 3.3 -1.6Underrepresented - 0.1 0.1 12 10 -- 0.0Overrepresented - -1.2 -1.3 58 60 -- -1.6
Difference 3/ Number of Countries

QUOTAS—DATA UPDATE AND SIMULATIONS
18 INTERNATIONAL MONETARY FUND
and France also represent sizable shares. These results are obviously sensitive to the quota
formula used to measure CQS and a different formula could generate a different OOL
distribution. However, they also highlight the importance of making periodic adjustments in
quota shares to reflect members’ changing relative positions in the global economy.
Figure 4. Out-of-Lineness (OOL)
(In percentage points, in percent of total OOL)
Source: Finance Department
1/ Difference between 2008 Reform AQS and CQS (2010) based on data through 2008.
2/ Difference between 14th Review AQS and CQS (2010) based on data through 2008.
3/ Difference between 14th Review AQS and CQS (2016) based on data through 2014.

QUOTAS—DATA UPDATE AND SIMULATIONS
INTERNATIONAL MONETARY FUND 19
QUOTA FORMULA VARIABLES: TAKING STOCK
12. The quota formula serves as a guide to quota adjustments. The Fund has broad
discretion to decide what considerations should determine quota adjustments. In practice, the quota
formula has been used as an important indicator in past adjustments, but other relevant factors
have also played a role. In the 2010 Reform, 60 percent of the overall increase was distributed
according to the formula, and the remaining 40 percent was based on alternative criteria, though
with the formula also playing a role for some of these criteria.
13. The current formula was agreed as part of the 2008 Reform (Box 2).10 The agreed
formula represented a major improvement in terms of simplicity and transparency over the previous
five formula system. In addition, the formula added two new elements—PPP GDP and
compression—with the agreement that they would be included for a period of 20 years, after which
the scope for retaining these elements would be reviewed.11 Considerable dissatisfaction with the
formula remained, however, and the 2010 Reform package included a request that the Executive
Board complete a comprehensive review of the quota formula by January 2013.
14. The 2013 QFR made important progress in identifying key elements that could form
the basis for a final agreement on a new quota formula. The Board agreed during the QFR that
the principles underpinning the 2008 reform remained valid. Thus, the formula should be simple and
transparent, consistent with the multiple roles of quotas,12 produce results that are broadly
acceptable to the membership, and be feasible to implement statistically based on timely, high
quality and widely available data. In its report to the Board of Governors on the outcome of the QFR,
the Executive Board concluded that its discussions had provided important building blocks for
agreement on a new quota formula that better reflects members’ relative positions in the global
economy, and that the outcome of the review will form a good basis for the Executive Board to
agree on a new quota formula as part of its work on the 15th Review.13
15. Other key outcomes of the review were:
Agreement that GDP should remain the most important variable, with the largest weight in the
formula and scope to further increase its weight.
Agreement that openness should continue to play an important role in the formula, and
concerns regarding this variable need to be thoroughly examined and addressed.
10 For more background on quota formula variables, see Annex I.
11 Reform of Quota and Voice in the International Monetary Fund—Report of the Executive Board to the Board of
Governors (4/4/08)
12 These include their key role in determining the Fund’s financial resources, their role in decisions on members’
access to Fund resources, their role in determining members’ shares in a general allocation of SDRs, and their close
link with members’ voting rights.
13 See Outcome of the Quota Formula Review—Report of the Executive Board to the Board of Governors (1/31/13).

QUOTAS—DATA UPDATE AND SIMULATIONS
20 INTERNATIONAL MONETARY FUND
Considerable support for dropping variability from the formula, with some conditioning their
support on other elements of the reform package, including how its weight is reallocated and
the adequacy of measures to protect the poorest members.
Considerable support for retaining reserves with its current weight.
Consideration will be given to whether or not (i) the weight of PPP GDP in the GDP blend
variable and (ii) the current level of compression should be adjusted.
Consideration will be given to whether and how to take account of very significant voluntary
financial contributions through ad hoc adjustments as part of the 15th Review.
Agreement that measures should be taken to protect the voice and representation of the
poorest members, with considerable support for addressing this issue as part of the
15th Review.
16. Staff prepared further analysis as background for Directors’ subsequent informal
exchanges in the context of the annual quota data updates.
2013 update: The staff paper presented additional work on the openness variable, and
identified possible options for addressing the concerns that had been raised in the past.14 These
options included data adjustments, adjusting its weight, and a cap on the overall boost that
individual countries can obtain from openness. The paper also presented the results of
additional staff work on variability that did not identify any significant correlation between this
variable and broader measures of balance of payments difficulties and underlying vulnerabilities
that were resolved without recourse to IMF assistance.15
2014 update: The staff paper presented additional work on PPP GDP (including an assessment
of data quality following the update of the 2011 International Comparison Program), and
updated staff’s earlier examination of the openness variable based on the latest data.16 It also
summarized staff’s extensive work program on variability dating back to the 2008 reform that
has failed to find evidence of any link between the current variability measure and actual or
potential demand for Fund resources, or to identify a superior alternative measure that would
better capture such demand.17
2015 update: The staff paper updated previous staff analysis on the characteristics of PPP GDP
and openness, noting that key conclusions from previous work remained broadly unchanged.
14 See Quota Formula—Data Update and Further Considerations (6/6/13).
15 Previous staff work had focused on the relationship between variability and actual demand for Fund resources (see
below and Annex I).
16 See Quota Formula—Data Update and Further Considerations (7/2/14).
17 See Annex II in Quota Formula—Data Update and Further Considerations—Annexes (7/2/14).

QUOTAS—DATA UPDATE AND SIMULATIONS
INTERNATIONAL MONETARY FUND 21
17. As part of this work, staff has also presented further illustrative simulations of possible
reforms of the quota formula. These simulations have been purely illustrative, and no proposals
have been made. The simulations have sought to illustrate the possible implications of reforms that
would build on and remain consistent with the broad conclusions of the QFR. In particular, they have
(i) retained GDP as the most important variable, and explored different options for the relative
weight of market and PPP GDP; (iii) retained openness with a sizable weight, and sought to explore
possible options that could address the concerns expressed about this variable; (iii) excluded
variability with different options for redistributing its weight; (iv) retained reserves with its current
5 percent weight; and (v) explored the impact of varying the compression factor.
18. Directors’ views expressed at the informal discussions in 2013-15 broadly echoed
those expressed previously in the context of the QFR. No significant convergence of views has
emerged, and sizable differences remain, including on the extent of needed further reforms. Some
have noted that the current formula is already delivering large shifts in CQS and questioned whether
further significant reforms are needed, whereas others see a need for substantial change. Some of
those who could support dropping variability have reiterated that this support is conditional on
other elements of the reform, including how its weight is redistributed. Most continued to support
retaining openness but with no consensus on how best to address the concerns regarding this
variable. Views continued to diverge on the weight of PPP GDP in the GDP blend variable, with most
EMDCs calling for an increase while most AEs support at most maintaining the current share. A few
have reiterated earlier calls during the QFR for a more radical simplification of the formula centered
solely or mainly on GDP, or for revisiting other issues (e.g., whether to maintain the compression
factor or whether to recognize financial contributions in the formula).
QUOTAS—DATA UPDATE AND SIMULATIONS
22 INTERNATIONAL MONETARY FUND
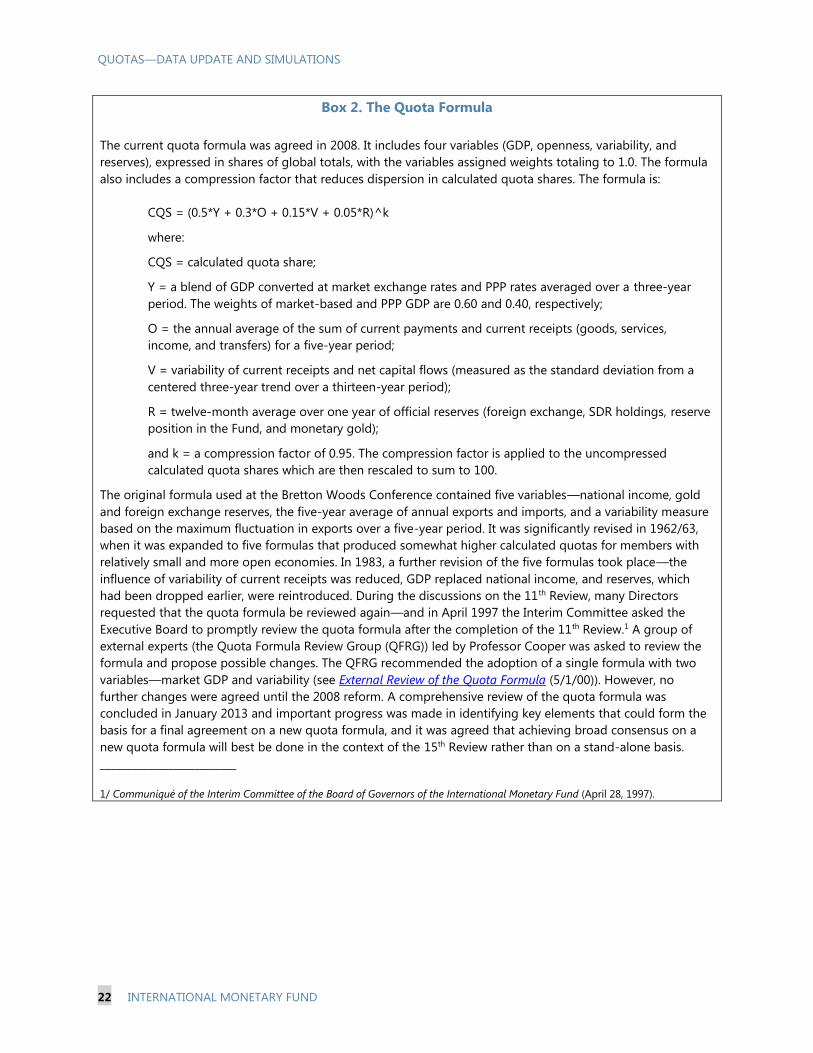
Box 2. The Quota Formula
The current quota formula was agreed in 2008. It includes four variables (GDP, openness, variability, and
reserves), expressed in shares of global totals, with the variables assigned weights totaling to 1.0. The formula
also includes a compression factor that reduces dispersion in calculated quota shares. The formula is:
CQS = (0.5*Y + 0.3*O + 0.15*V + 0.05*R)^k
where:
CQS = calculated quota share;
Y = a blend of GDP converted at market exchange rates and PPP rates averaged over a three-year
period. The weights of market-based and PPP GDP are 0.60 and 0.40, respectively;
O = the annual average of the sum of current payments and current receipts (goods, services,
income, and transfers) for a five-year period;
V = variability of current receipts and net capital flows (measured as the standard deviation from a
centered three-year trend over a thirteen-year period);
R = twelve-month average over one year of official reserves (foreign exchange, SDR holdings, reserve
position in the Fund, and monetary gold);
and k = a compression factor of 0.95. The compression factor is applied to the uncompressed
calculated quota shares which are then rescaled to sum to 100.
The original formula used at the Bretton Woods Conference contained five variables—national income, gold
and foreign exchange reserves, the five-year average of annual exports and imports, and a variability measure
based on the maximum fluctuation in exports over a five-year period. It was significantly revised in 1962/63,
when it was expanded to five formulas that produced somewhat higher calculated quotas for members with
relatively small and more open economies. In 1983, a further revision of the five formulas took place—the
influence of variability of current receipts was reduced, GDP replaced national income, and reserves, which
had been dropped earlier, were reintroduced. During the discussions on the 11th Review, many Directors
requested that the quota formula be reviewed again—and in April 1997 the Interim Committee asked the
Executive Board to promptly review the quota formula after the completion of the 11th Review.1 A group of
external experts (the Quota Formula Review Group (QFRG)) led by Professor Cooper was asked to review the
formula and propose possible changes. The QFRG recommended the adoption of a single formula with two
variables—market GDP and variability (see External Review of the Quota Formula (5/1/00)). However, no
further changes were agreed until the 2008 reform. A comprehensive review of the quota formula was
concluded in January 2013 and important progress was made in identifying key elements that could form the
basis for a final agreement on a new quota formula, and it was agreed that achieving broad consensus on a
new quota formula will best be done in the context of the 15th Review rather than on a stand-alone basis.
__________________________
1/ Communiqué of the Interim Committee of the Board of Governors of the International Monetary Fund (April 28, 1997).

QUOTAS—DATA UPDATE AND SIMULATIONS
INTERNATIONAL MONETARY FUND 23
ILLUSTRATIVE CALCULATIONS FOR ALTERNATIVE
QUOTA FORMULAS
19. This section updates the illustrative simulations of possible reforms of the quota
formula presented previously, using the latest data.18 As noted above, these simulations have
sought to capture possible reforms that would be broadly in line with the conclusions of the QFR.
More far reaching reforms could also be considered in future papers if Directors wish to revisit these
conclusions. As in the past, staff could also circulate additional simulations if requested by Executive
Directors. It should be stressed that the simulations presented in this paper are purely illustrative
and no proposals are made.
20. As in previous data update papers, all simulations of alternative formulas exclude
variability. As noted, this reform received considerable support in the QFR, though some Directors
have conditioned their support for dropping variability on other elements of the reform package. As
discussed in previous papers (and summarized in Annex II of Quota Formula—Data Update and
Further Considerations), staff has undertaken extensive work to explore the links between variability
and actual or potential demand for Fund resources and has found no evidence of such a link. More
recent staff work also highlighted the very close relationship between members’ shares in openness
and variability, suggesting that the two measures are to a large extent capturing the same concept
(Annex I). The simulations also maintain reserves with its current weight in line with the QFR.
21. Set 1 shows four different approaches to reallocate the weight of variability: (i) split
evenly between GDP and openness (thereby increasing the relative weight of openness), (ii) split
between GDP (2/3) and openness (1/3) leaving the relative weights of GDP and openness broadly
unchanged, (iii) all to GDP (thereby increasing the relative weight of GDP), and (iv) all to GDP and a
lower weight for openness (0.25), which would increase the weight of GDP to 0.7.
22. Set 2 shows a range of options for adjusting the weight of PPP GDP in the GDP blend.
These include increasing the weight of PPP GDP in the blend to 45 and 50 percent, respectively. A
simulation is also shown with the weight of PPP GDP reduced to 35 percent. As noted previously, a
combination of dropping variability and reducing the weight of PPP GDP would lead to a lower CQS
for a large number of EMDCs, including LICs.
23. Set 3 explores the implications of introducing a cap that limits the overall boost
individual countries can receive from openness. As noted in Annex I, staff has explored the
possible use of a cap to address one possible concern with the openness variable, namely that for
some countries it can generate CQS that appear very large in relation to other measures of their
relative economic positions. In line with the approach taken in previous update papers, two types of
18 See Quota Formula—Data Update and Further Considerations (7/2/14) and Quota Formula—Data Update
(6/22/15). An additional set has been included to illustrate the impact of both a higher and a lower degree of
compression.

QUOTAS—DATA UPDATE AND SIMULATIONS
24 INTERNATIONAL MONETARY FUND
caps are illustrated: one capping the absolute level of openness in relation to market GDP (absolute
cap) and the second capping the ratio of openness to GDP blend shares (share cap).
24. Set 4 illustrates the impact of changing the compression factor. In response to Directors’
comments at the last discussion, this set illustrates the impact of both a higher (0.925) and a lower
(0.975) degree of compression, based on simulations presented in Set 1.
25. Summary results for the 35 members with the largest quotas and for major country
groups are presented below. Table 5 provides an overview of the results for major country groups
and detailed results for all members are presented in the Statistical Appendix. The overall results are
broadly similar to those illustrated in the July 2014 and June 2015 papers, though starting from a
different base given the data update. The main results can be summarized as follows:
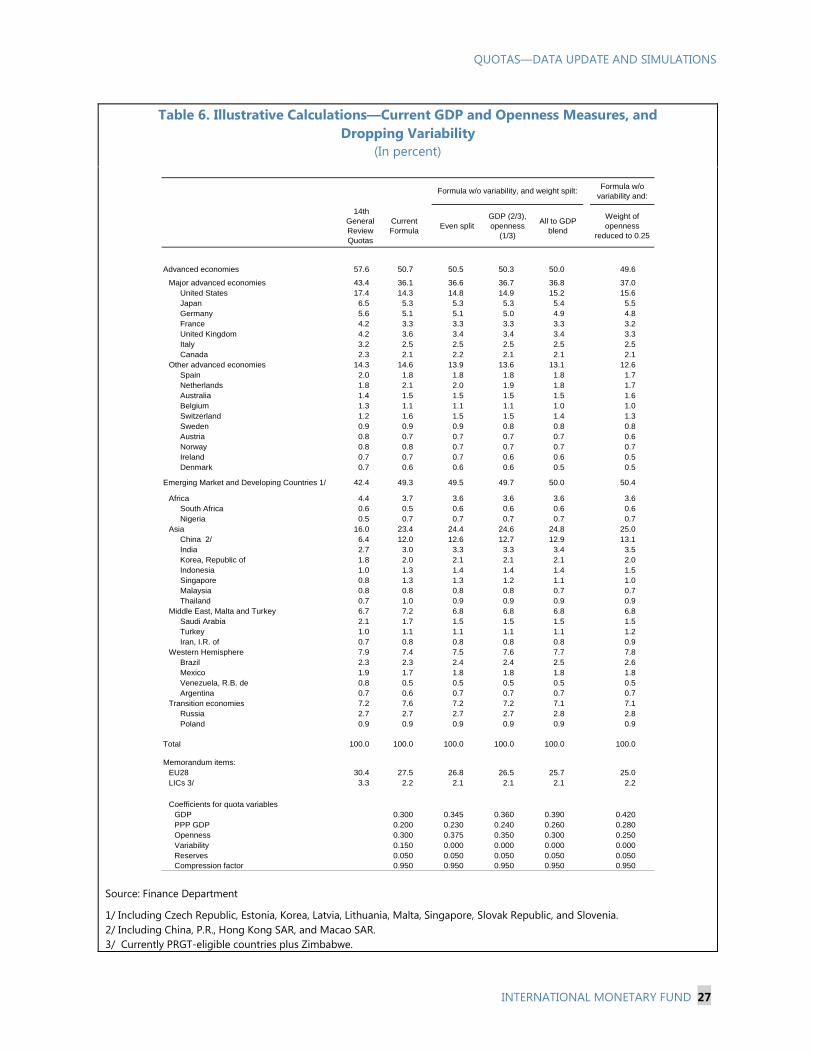
Set 1 – Simplification of the Current Formula – dropping variability, keeping current GDP and
openness measures (Table 6). Dropping variability and allocating part or all of the weight to GDP
reduces (compared to the current formula) the CQS of other advanced economies and increases
that of major advanced economies and EMDCs as a group. The shifts are larger when the weight
of openness is also reduced. The majority of large countries gain from dropping variability, while
around one quarter of small countries gain.
Set 2 – Same as Set 1, but with different combinations of GDP blend (Tables 7-10). Increasing the
weight of PPP GDP in the GDP blend leads to a higher CQS for EMDCs relative to the current
formula. More EMDCs and small countries gain with an increased weight for PPP GDP relative to
Set 1. Conversely, increasing the weight of market GDP in the GDP blend reduces the share of
both EMDCs and LICs.
Set 3 – Same as Set 1, but with different openness measures (Tables 11-13). Capping openness
tends to reduce the CQS of other advanced economies and increases the CQS for major
advanced economies and EMDCs as a group. Also, there are generally a larger number of
gainers among both EMDCs and small countries compared with Set 1, including when the
weight of openness is reduced, as capping openness redistributes the very large boost received
by some countries under the current measure across the rest of the membership.
Set 4 – Same as Set 1, but with a higher and a lower degree of compression (Tables 14-15). Higher
compression reduces the share of the largest economies and increases the share of all other
members. As a result, it leads to the largest number of gainers among EMDCs and LICs, as well
as among small countries. Reducing the amount of compression has the opposite impact, with
gains for the largest members and reduced shares for all other members.

Table 5. Illustrative Calculations: Summary
Source: Finance Department
1/ Countries with positive change in relation to current CQS.
2/ Countries are classified as "large" if their current GDP blend share exceeds 1.0 percent.
Major
Advanced
Other
Advanced EMDCs LICs
AEs
(26)
EMDCs
excl.
LICs
(93)
LICs
(70)
Large
countries
(18)
Small
countries
(171)
14th Review Quota Share 43.36 14.28 42.36 3.31
Current CQS 36.08 14.61 49.31 2.21
Set 1. Current GDP and openness measures, dropping variability
1. Weight of variability split evenly between GDP and openness 36.60 13.88 49.52 2.11 56 8 27 21 14 42
2. Weight of variability split between GDP (2/3) and openness (1/3) 36.68 13.63 49.69 2.12 51 7 25 19 14 37
3. All weight of variability to GDP 36.84 13.13 50.03 2.15 52 6 27 19 13 39
4. Weight of openness reduced to 0.25 37.00 12.63 50.37 2.17 53 5 28 20 12 41
Set 2. Same as Set 1, but with different GDP blends
1. Weight of variability split evenly between GDP and openness
a. 50/50 GDP blend 35.86 13.64 50.50 2.19 66 3 38 25 11 55
b. 55/45 GDP blend 36.23 13.76 50.01 2.15 61 5 33 23 12 49
c. 65/35 GDP blend 36.96 14.00 49.04 2.07 47 9 23 15 13 34
2. Weight of variability split between GDP (2/3) and openness (1/3)
a. 50/50 GDP blend 35.91 13.38 50.71 2.21 59 3 33 23 11 48
b. 55/45 GDP blend 36.29 13.51 50.20 2.16 54 5 28 21 12 42
c. 65/35 GDP blend 37.06 13.75 49.19 2.08 46 8 22 16 14 32
3. All weight of variability to GDP
a. 50/50 GDP blend 36.01 12.86 51.13 2.24 56 1 33 22 9 47
b. 55/45 GDP blend 36.42 13.00 50.58 2.19 55 5 29 21 12 43
c. 65/35 GDP blend 37.25 13.27 49.48 2.10 46 7 22 17 14 32
4. Weight of openness reduced to 0.25
a. 50/50 GDP blend 36.11 12.34 51.55 2.26 58 2 33 23 10 48
b. 55/45 GDP blend 36.56 12.49 50.96 2.22 55 3 30 22 11 44
c. 65/35 GDP blend 37.45 12.78 49.77 2.12 49 7 25 17 14 35
Calculated Quota Share (in percent)Number
of
Gainers
1/
of which: of which: 2/
QU
OTA
S—
DA
TA
UPD
ATE A
ND
SIM
ULA
TIO
NS
INTER
NA
TIO
NA
L MO
NETA
RY F
UN
D 2
5

Table 5. Illustrative Calculations: Summary (concluded)
Source: Finance Department
1/ Countries with positive change in relation to current CQS.
2/ Countries are classified as "large" if their current GDP blend share exceeds 1.0 percent.
Major
Advanced
Other
Advanced EMDCs LICs
AEs
(26)
EMDCs
excl.
LICs
(93)
LICs
(70)
Large
countries
(18)
Small
countries
(171)
14th Review Quota Share 43.36 14.28 42.36 3.31
Current CQS 36.08 14.61 49.31 2.21
Set 3. Same as Set 1, but with different openness measures
1. Weight of variability split evenly between GDP and openness
a. Nominal openness capped at 85th percentile 37.26 13.05 49.69 2.14 72 11 36 25 16 56
b. Nominal openness capped at 75th percentile 37.59 12.72 49.70 2.15 82 12 41 29 16 66
c. Openness share capped at 1.8 38.01 11.92 50.07 2.17 87 12 45 30 17 70
d. Openness share capped at 1.5 38.23 11.48 50.29 2.20 79 11 41 27 16 63
2. Weight of variability split between GDP (2/3) and openness (1/3)
a. Nominal openness capped at 85th percentile 37.30 12.85 49.85 2.15 71 10 36 25 16 55
b. Nominal openness capped at 75th percentile 37.61 12.54 49.85 2.16 73 10 37 26 16 57
c. Openness share capped at 1.8 38.00 11.80 50.20 2.18 83 11 44 28 17 66
d. Openness share capped at 1.5 38.20 11.39 50.40 2.20 78 10 41 27 15 63
3. All weight of variability to GDP
a. Nominal openness capped at 85th percentile 37.38 12.46 50.16 2.17 57 7 30 20 14 43
b. Nominal openness capped at 75th percentile 37.64 12.19 50.17 2.17 64 9 32 23 15 49
c. Openness share capped at 1.8 37.98 11.55 50.47 2.19 72 10 36 26 16 56
d. Openness share capped at 1.5 38.15 11.20 50.64 2.21 73 9 36 28 15 58
Set 4. Same as Set 1, but with different compressions
1. With a higher degree of compression (0.925)
1. Dropping variability, weight split evenly between GDP and openness 35.64 14.20 50.16 2.33 126 10 62 54 11 115
2. Dropping variability, weight split between GDP (2/3) and openness (1/3) 35.72 13.96 50.32 2.34 119 7 62 50 12 107
3. Dropping variability, all weight to GDP 35.88 13.46 50.66 2.37 111 7 56 48 13 98
4. Dropping variability, weight of openness reduced to 0.25 36.04 12.97 50.99 2.39 110 6 54 50 12 98
2. With a lower degree of compression (0.975)
1. Dropping variability, weight split evenly between GDP and openness 37.53 13.55 48.92 1.91 22 7 14 1 14 8
2. Dropping variability, weight split between GDP (2/3) and openness (1/3) 37.62 13.30 49.09 1.92 22 7 14 1 14 8
3. Dropping variability, all weight to GDP 37.78 12.79 49.43 1.94 26 5 17 4 13 13
4. Dropping variability, weight of openness reduced to 0.25 37.95 12.29 49.77 1.96 29 5 18 6 13 16
Calculated Quota Share (in percent)Number
of
Gainers
1/
of which: of which: 2/
Q
UO
TA
S—
DA
TA
UP
DA
TE A
ND
SIM
ULA
TIO
NS
26
IN
TER
NA
TIO
NA
L MO
NETA
RY F
UN
D
QUOTAS—DATA UPDATE AND SIMULATIONS
INTERNATIONAL MONETARY FUND 27
Table 6. Illustrative Calculations—Current GDP and Openness Measures, and
Dropping Variability
(In percent)
Source: Finance Department
1/ Including Czech Republic, Estonia, Korea, Latvia, Lithuania, Malta, Singapore, Slovak Republic, and Slovenia.
2/ Including China, P.R., Hong Kong SAR, and Macao SAR.
3/ Currently PRGT-eligible countries plus Zimbabwe.
Formula w/o
variability and:
14th
General
Review
Quotas
Current
FormulaEven split
GDP (2/3),
openness
(1/3)
All to GDP
blend
Weight of
openness
reduced to 0.25
Advanced economies 57.6 50.7 50.5 50.3 50.0 49.6
Major advanced economies 43.4 36.1 36.6 36.7 36.8 37.0
United States 17.4 14.3 14.8 14.9 15.2 15.6
Japan 6.5 5.3 5.3 5.3 5.4 5.5
Germany 5.6 5.1 5.1 5.0 4.9 4.8
France 4.2 3.3 3.3 3.3 3.3 3.2
United Kingdom 4.2 3.6 3.4 3.4 3.4 3.3
Italy 3.2 2.5 2.5 2.5 2.5 2.5
Canada 2.3 2.1 2.2 2.1 2.1 2.1
Other advanced economies 14.3 14.6 13.9 13.6 13.1 12.6
Spain 2.0 1.8 1.8 1.8 1.8 1.7
Netherlands 1.8 2.1 2.0 1.9 1.8 1.7
Australia 1.4 1.5 1.5 1.5 1.5 1.6
Belgium 1.3 1.1 1.1 1.1 1.0 1.0
Switzerland 1.2 1.6 1.5 1.5 1.4 1.3
Sweden 0.9 0.9 0.9 0.8 0.8 0.8
Austria 0.8 0.7 0.7 0.7 0.7 0.6
Norway 0.8 0.8 0.7 0.7 0.7 0.7
Ireland 0.7 0.7 0.7 0.6 0.6 0.5
Denmark 0.7 0.6 0.6 0.6 0.5 0.5
Emerging Market and Developing Countries 1/ 42.4 49.3 49.5 49.7 50.0 50.4
Africa 4.4 3.7 3.6 3.6 3.6 3.6
South Africa 0.6 0.5 0.6 0.6 0.6 0.6
Nigeria 0.5 0.7 0.7 0.7 0.7 0.7
Asia 16.0 23.4 24.4 24.6 24.8 25.0
China 2/ 6.4 12.0 12.6 12.7 12.9 13.1
India 2.7 3.0 3.3 3.3 3.4 3.5
Korea, Republic of 1.8 2.0 2.1 2.1 2.1 2.0
Indonesia 1.0 1.3 1.4 1.4 1.4 1.5
Singapore 0.8 1.3 1.3 1.2 1.1 1.0
Malaysia 0.8 0.8 0.8 0.8 0.7 0.7
Thailand 0.7 1.0 0.9 0.9 0.9 0.9
Middle East, Malta and Turkey 6.7 7.2 6.8 6.8 6.8 6.8
Saudi Arabia 2.1 1.7 1.5 1.5 1.5 1.5
Turkey 1.0 1.1 1.1 1.1 1.1 1.2
Iran, I.R. of 0.7 0.8 0.8 0.8 0.8 0.9
Western Hemisphere 7.9 7.4 7.5 7.6 7.7 7.8
Brazil 2.3 2.3 2.4 2.4 2.5 2.6
Mexico 1.9 1.7 1.8 1.8 1.8 1.8
Venezuela, R.B. de 0.8 0.5 0.5 0.5 0.5 0.5
Argentina 0.7 0.6 0.7 0.7 0.7 0.7
Transition economies 7.2 7.6 7.2 7.2 7.1 7.1
Russia 2.7 2.7 2.7 2.7 2.8 2.8
Poland 0.9 0.9 0.9 0.9 0.9 0.9
Total 100.0 100.0 100.0 100.0 100.0 100.0
Memorandum items:
EU28 30.4 27.5 26.8 26.5 25.7 25.0
LICs 3/ 3.3 2.2 2.1 2.1 2.1 2.2
Coefficients for quota variables
GDP 0.300 0.345 0.360 0.390 0.420
PPP GDP 0.200 0.230 0.240 0.260 0.280
Openness 0.300 0.375 0.350 0.300 0.250
Variability 0.150 0.000 0.000 0.000 0.000
Reserves 0.050 0.050 0.050 0.050 0.050
Compression factor 0.950 0.950 0.950 0.950 0.950
Formula w/o variability, and weight spilt:

QUOTAS—DATA UPDATE AND SIMULATIONS
28 INTERNATIONAL MONETARY FUND
Table 7. Illustrative Calculations—Current Openness Measure, Dropping Variability,
Weight Split Evenly Between GDP and Openness, and
Different Combinations of GDP Blend
(In percent)
Source: Finance Department
1/ Including Czech Republic, Estonia, Korea, Latvia, Lithuania, Malta, Singapore, Slovak Republic, and Slovenia.
2/ Including China, P.R., Hong Kong SAR, and Macao SAR.
3/ Currently PRGT-eligible countries plus Zimbabwe.
14th General
Review
Quotas
Current
Formula50/50 55/45 65/35
Advanced economies 57.6 50.7 49.5 50.0 51.0
Major advanced economies 43.4 36.1 35.9 36.2 37.0
United States 17.4 14.3 14.5 14.6 14.9
Japan 6.5 5.3 5.2 5.2 5.4
Germany 5.6 5.1 5.0 5.0 5.1
France 4.2 3.3 3.3 3.3 3.4
United Kingdom 4.2 3.6 3.4 3.4 3.5
Italy 3.2 2.5 2.5 2.5 2.5
Canada 2.3 2.1 2.1 2.1 2.2
Other advanced economies 14.3 14.6 13.6 13.8 14.0
Spain 2.0 1.8 1.8 1.8 1.8
Netherlands 1.8 2.1 2.0 2.0 2.0
Australia 1.4 1.5 1.5 1.5 1.6
Belgium 1.3 1.1 1.1 1.1 1.1
Switzerland 1.2 1.6 1.5 1.5 1.5
Sweden 0.9 0.9 0.8 0.9 0.9
Austria 0.8 0.7 0.7 0.7 0.7
Norway 0.8 0.8 0.7 0.7 0.7
Ireland 0.7 0.7 0.7 0.7 0.7
Denmark 0.7 0.6 0.6 0.6 0.6
Emerging Market and Developing Countries 1/ 42.4 49.3 50.5 50.0 49.0
Africa 4.4 3.7 3.6 3.6 3.5
South Africa 0.6 0.5 0.6 0.6 0.6
Nigeria 0.5 0.7 0.7 0.7 0.7
Asia 16.0 23.4 25.0 24.7 24.1
China 2/ 6.4 12.0 12.7 12.6 12.5
India 2.7 3.0 3.5 3.4 3.2
Korea, Republic of 1.8 2.0 2.1 2.1 2.2
Indonesia 1.0 1.3 1.5 1.4 1.3
Singapore 0.8 1.3 1.3 1.3 1.3
Malaysia 0.8 0.8 0.8 0.8 0.8
Thailand 0.7 1.0 1.0 1.0 0.9
Middle East, Malta and Turkey 6.7 7.2 6.9 6.9 6.7
Saudi Arabia 2.1 1.7 1.5 1.5 1.5
Turkey 1.0 1.1 1.1 1.1 1.1
Iran, I.R. of 0.7 0.8 0.8 0.8 0.8
Western Hemisphere 7.9 7.4 7.6 7.5 7.5
Brazil 2.3 2.3 2.4 2.4 2.4
Mexico 1.9 1.7 1.8 1.8 1.7
Venezuela, R.B. de 0.8 0.5 0.5 0.5 0.5
Argentina 0.7 0.6 0.7 0.7 0.7
Transition economies 7.2 7.6 7.3 7.3 7.2
Russia 2.7 2.7 2.8 2.7 2.7
Poland 0.9 0.9 0.9 0.9 0.9
Total 100.0 100.0 100.0 100.0 100.0
Memorandum items:
EU28 30.4 27.5 26.5 26.7 27.0
LICs 3/ 3.3 2.2 2.2 2.2 2.1
Coefficients for quota variables
GDP 0.300 0.288 0.316 0.374
PPP GDP 0.200 0.288 0.259 0.201
Openness 0.300 0.375 0.375 0.375
Variability 0.150 0.000 0.000 0.000
Reserves 0.050 0.050 0.050 0.050
Compression factor 0.950 0.950 0.950 0.950
Formula w/o variability, current openness
measure, weight split evenly between GDP and
openness, and GDP blends:

QUOTAS—DATA UPDATE AND SIMULATIONS
INTERNATIONAL MONETARY FUND 29
Table 8. Illustrative Calculations—Current Openness Measure, Dropping Variability,
Weight Split Between GDP (2/3) and Openness (1/3), and
Different Combinations of GDP Blend
(In percent)
Source: Finance Department
1/ Including Czech Republic, Estonia, Korea, Latvia, Lithuania, Malta, Singapore, Slovak Republic, and Slovenia.
2/ Including China, P.R., Hong Kong SAR, and Macao SAR.
3/ Currently PRGT-eligible countries plus Zimbabwe.
14th
General
Review
Quotas
Current
Formula50/50 55/45 65/35
Advanced economies 57.6 50.7 49.3 49.8 50.8
Major advanced economies 43.4 36.1 35.9 36.3 37.1
United States 17.4 14.3 14.6 14.8 15.1
Japan 6.5 5.3 5.2 5.3 5.4
Germany 5.6 5.1 4.9 5.0 5.1
France 4.2 3.3 3.3 3.3 3.4
United Kingdom 4.2 3.6 3.3 3.4 3.4
Italy 3.2 2.5 2.5 2.5 2.5
Canada 2.3 2.1 2.1 2.1 2.2
Other advanced economies 14.3 14.6 13.4 13.5 13.8
Spain 2.0 1.8 1.7 1.8 1.8
Netherlands 1.8 2.1 1.9 1.9 2.0
Australia 1.4 1.5 1.5 1.5 1.6
Belgium 1.3 1.1 1.1 1.1 1.1
Switzerland 1.2 1.6 1.4 1.4 1.5
Sweden 0.9 0.9 0.8 0.8 0.9
Austria 0.8 0.7 0.7 0.7 0.7
Norway 0.8 0.8 0.7 0.7 0.7
Ireland 0.7 0.7 0.6 0.6 0.6
Denmark 0.7 0.6 0.5 0.6 0.6
Emerging Market and Developing Countries 1/ 42.4 49.3 50.7 50.2 49.2
Africa 4.4 3.7 3.7 3.6 3.5
South Africa 0.6 0.5 0.6 0.6 0.6
Nigeria 0.5 0.7 0.7 0.7 0.7
Asia 16.0 23.4 25.2 24.9 24.2
China 2/ 6.4 12.0 12.8 12.8 12.6
India 2.7 3.0 3.6 3.4 3.2
Korea, Republic of 1.8 2.0 2.1 2.1 2.1
Indonesia 1.0 1.3 1.5 1.4 1.4
Singapore 0.8 1.3 1.2 1.2 1.2
Malaysia 0.8 0.8 0.8 0.8 0.8
Thailand 0.7 1.0 1.0 0.9 0.9
Middle East, Malta and Turkey 6.7 7.2 6.9 6.9 6.7
Saudi Arabia 2.1 1.7 1.5 1.5 1.5
Turkey 1.0 1.1 1.1 1.1 1.1
Iran, I.R. of 0.7 0.8 0.8 0.8 0.8
Western Hemisphere 7.9 7.4 7.6 7.6 7.5
Brazil 2.3 2.3 2.5 2.5 2.4
Mexico 1.9 1.7 1.8 1.8 1.8
Venezuela, R.B. de 0.8 0.5 0.5 0.5 0.5
Argentina 0.7 0.6 0.7 0.7 0.7
Transition economies 7.2 7.6 7.3 7.2 7.1
Russia 2.7 2.7 2.8 2.8 2.7
Poland 0.9 0.9 0.9 0.9 0.9
Total 100.0 100.0 100.0 100.0 100.0
Memorandum items:
EU28 30.4 27.5 26.1 26.3 26.6
LICs 3/ 3.3 2.2 2.2 2.2 2.1
Coefficients for quota variables
GDP 0.300 0.300 0.330 0.390
PPP GDP 0.200 0.300 0.270 0.210
Openness 0.300 0.350 0.350 0.350
Variability 0.150 0.000 0.000 0.000
Reserves 0.050 0.050 0.050 0.050
Compression factor 0.950 0.950 0.950 0.950
Formula w/o variability, current openness
measure, weight split between GDP (2/3)
and openness (1/3), and GDP blends:

QUOTAS—DATA UPDATE AND SIMULATIONS
30 INTERNATIONAL MONETARY FUND
Table 9. Illustrative Calculations—Current Openness Measure, Dropping Variability,
All Weight to GDP, and Different Combinations of GDP Blend
(In percent)
Source: Finance Department
1/ Including Czech Republic, Estonia, Korea, Latvia, Lithuania, Malta, Singapore, Slovak Republic, and Slovenia.
2/ Including China, P.R., Hong Kong SAR, and Macao SAR.
3/ Currently PRGT-eligible countries plus Zimbabwe.
14th General
Review
Quotas
Current
Formula50/50 55/45 65/35
Advanced economies 57.6 50.7 48.9 49.4 50.5
Major advanced economies 43.4 36.1 36.0 36.4 37.3
United States 17.4 14.3 14.9 15.1 15.4
Japan 6.5 5.3 5.3 5.4 5.5
Germany 5.6 5.1 4.8 4.8 4.9
France 4.2 3.3 3.2 3.2 3.3
United Kingdom 4.2 3.6 3.3 3.3 3.4
Italy 3.2 2.5 2.4 2.5 2.5
Canada 2.3 2.1 2.1 2.1 2.2
Other advanced economies 14.3 14.6 12.9 13.0 13.3
Spain 2.0 1.8 1.7 1.7 1.8
Netherlands 1.8 2.1 1.8 1.8 1.8
Australia 1.4 1.5 1.5 1.5 1.6
Belgium 1.3 1.1 1.0 1.0 1.0
Switzerland 1.2 1.6 1.4 1.4 1.4
Sweden 0.9 0.9 0.8 0.8 0.8
Austria 0.8 0.7 0.7 0.7 0.7
Norway 0.8 0.8 0.6 0.7 0.7
Ireland 0.7 0.7 0.6 0.6 0.6
Denmark 0.7 0.6 0.5 0.5 0.5
Emerging Market and Developing Countries 1/ 42.4 49.3 51.1 50.6 49.5
Africa 4.4 3.7 3.7 3.6 3.5
South Africa 0.6 0.5 0.6 0.6 0.6
Nigeria 0.5 0.7 0.7 0.7 0.7
Asia 16.0 23.4 25.4 25.1 24.4
China 2/ 6.4 12.0 13.1 13.0 12.8
India 2.7 3.0 3.7 3.6 3.3
Korea, Republic of 1.8 2.0 2.1 2.1 2.1
Indonesia 1.0 1.3 1.5 1.5 1.4
Singapore 0.8 1.3 1.1 1.1 1.1
Malaysia 0.8 0.8 0.8 0.8 0.7
Thailand 0.7 1.0 0.9 0.9 0.9
Middle East, Malta and Turkey 6.7 7.2 7.0 6.9 6.7
Saudi Arabia 2.1 1.7 1.5 1.5 1.5
Turkey 1.0 1.1 1.2 1.2 1.1
Iran, I.R. of 0.7 0.8 0.9 0.9 0.8
Western Hemisphere 7.9 7.4 7.8 7.7 7.7
Brazil 2.3 2.3 2.5 2.5 2.5
Mexico 1.9 1.7 1.8 1.8 1.8
Venezuela, R.B. de 0.8 0.5 0.5 0.5 0.5
Argentina 0.7 0.6 0.7 0.7 0.7
Transition economies 7.2 7.6 7.3 7.2 7.1
Russia 2.7 2.7 2.8 2.8 2.7
Poland 0.9 0.9 0.9 0.9 0.9
Total 100.0 100.0 100.0 100.0 100.0
Memorandum items:
EU28 30.4 27.5 25.3 25.5 25.9
LICs 3/ 3.3 2.2 2.2 2.2 2.1
Coefficients for quota variables
GDP 0.300 0.325 0.358 0.423
PPP GDP 0.200 0.325 0.293 0.228
Openness 0.300 0.300 0.300 0.300
Variability 0.150 0.000 0.000 0.000
Reserves 0.050 0.050 0.050 0.050
Compression factor 0.950 0.950 0.950 0.950
Formula w/o variability, current openness
measure, all weight to GDP, and GDP blends:

QUOTAS—DATA UPDATE AND SIMULATIONS
INTERNATIONAL MONETARY FUND 31
Table 10. Illustrative Calculations—Current Openness Measure, Dropping Variability,
Weight of Openness Reduced to 0.25, and Different Combinations of GDP Blend
(In percent)
Source: Finance Department
1/ Including Czech Republic, Estonia, Korea, Latvia, Lithuania, Malta, Singapore, Slovak Republic, and Slovenia.
2/ Including China, P.R., Hong Kong SAR, and Macao SAR.
3/ Currently PRGT-eligible countries plus Zimbabwe.
14th
General
Review
Quotas
Current
Formula50/50 55/45 65/35
Advanced economies 57.6 50.7 48.4 49.0 50.2
Major advanced economies 43.4 36.1 36.1 36.6 37.4
United States 17.4 14.3 15.2 15.4 15.8
Japan 6.5 5.3 5.4 5.4 5.6
Germany 5.6 5.1 4.7 4.7 4.8
France 4.2 3.3 3.2 3.2 3.3
United Kingdom 4.2 3.6 3.2 3.3 3.3
Italy 3.2 2.5 2.4 2.5 2.5
Canada 2.3 2.1 2.0 2.1 2.1
Other advanced economies 14.3 14.6 12.3 12.5 12.8
Spain 2.0 1.8 1.7 1.7 1.8
Netherlands 1.8 2.1 1.7 1.7 1.7
Australia 1.4 1.5 1.5 1.5 1.6
Belgium 1.3 1.1 0.9 0.9 1.0
Switzerland 1.2 1.6 1.3 1.3 1.3
Sweden 0.9 0.9 0.8 0.8 0.8
Austria 0.8 0.7 0.6 0.6 0.7
Norway 0.8 0.8 0.6 0.6 0.7
Ireland 0.7 0.7 0.5 0.5 0.5
Denmark 0.7 0.6 0.5 0.5 0.5
Emerging Market and Developing Countries 1/ 42.4 49.3 51.6 51.0 49.8
Africa 4.4 3.7 3.7 3.7 3.6
South Africa 0.6 0.5 0.6 0.6 0.6
Nigeria 0.5 0.7 0.7 0.7 0.7
Asia 16.0 23.4 25.7 25.3 24.6
China 2/ 6.4 12.0 13.3 13.2 13.0
India 2.7 3.0 3.8 3.7 3.4
Korea, Republic of 1.8 2.0 2.0 2.0 2.0
Indonesia 1.0 1.3 1.6 1.5 1.4
Singapore 0.8 1.3 1.0 1.0 1.0
Malaysia 0.8 0.8 0.7 0.7 0.7
Thailand 0.7 1.0 0.9 0.9 0.9
Middle East, Malta and Turkey 6.7 7.2 7.0 6.9 6.7
Saudi Arabia 2.1 1.7 1.5 1.5 1.5
Turkey 1.0 1.1 1.2 1.2 1.1
Iran, I.R. of 0.7 0.8 0.9 0.9 0.9
Western Hemisphere 7.9 7.4 7.9 7.9 7.8
Brazil 2.3 2.3 2.6 2.6 2.6
Mexico 1.9 1.7 1.8 1.8 1.8
Venezuela, R.B. de 0.8 0.5 0.5 0.5 0.5
Argentina 0.7 0.6 0.7 0.7 0.7
Transition economies 7.2 7.6 7.2 7.2 7.0
Russia 2.7 2.7 2.9 2.8 2.8
Poland 0.9 0.9 0.9 0.9 0.9
Total 100.0 100.0 100.0 100.0 100.0
Memorandum items:
EU28 30.4 27.5 24.6 24.8 25.2
LICs 3/ 3.3 2.2 2.3 2.2 2.1
Coefficients for quota variables
GDP 0.300 0.350 0.385 0.455
PPP GDP 0.200 0.350 0.315 0.245
Openness 0.300 0.250 0.250 0.250
Variability 0.150 0.000 0.000 0.000
Reserves 0.050 0.050 0.050 0.050
Compression factor 0.950 0.950 0.950 0.950
Formula w/o variability, weight of
openness reduced to 0.25, and GDP
blends:

QUOTAS—DATA UPDATE AND SIMULATIONS
32 INTERNATIONAL MONETARY FUND
Table 11. Illustrative Calculations—Current GDP Blend, Dropping Variability, Weight Split
Evenly Between GDP and Openness, and Different Openness Measures
(In percent)
Source: Finance Department
1/ Including Czech Republic, Estonia, Korea, Latvia, Lithuania, Malta, Singapore, Slovak Republic, and Slovenia.
2/ Including China, P.R., Hong Kong SAR, and Macao SAR.
3/ Currently PRGT-eligible countries plus Zimbabwe.
14th
General
Review
Quotas
Current
Formula
Nominal
openness capped
at the 85th
percentile
Nominal
openness capped
at the 75th
percentile
Openness
shares capped
at 1.8
Openness
shares capped
at 1.5
Advanced economies 57.6 50.7 50.3 50.3 49.9 49.7
Major advanced economies 43.4 36.1 37.3 37.6 38.0 38.2
United States 17.4 14.3 15.0 15.1 15.2 15.6
Japan 6.5 5.3 5.4 5.4 5.5 5.6
Germany 5.6 5.1 5.2 5.3 5.3 4.9
France 4.2 3.3 3.4 3.5 3.5 3.6
United Kingdom 4.2 3.6 3.5 3.6 3.6 3.6
Italy 3.2 2.5 2.6 2.6 2.6 2.7
Canada 2.3 2.1 2.2 2.2 2.3 2.3
Other advanced economies 14.3 14.6 13.1 12.7 11.9 11.5
Spain 2.0 1.8 1.8 1.8 1.9 1.9
Netherlands 1.8 2.1 1.7 1.5 1.3 1.2
Australia 1.4 1.5 1.6 1.6 1.6 1.6
Belgium 1.3 1.1 1.0 0.9 0.8 0.7
Switzerland 1.2 1.6 1.5 1.4 1.2 1.1
Sweden 0.9 0.9 0.9 0.9 0.8 0.8
Austria 0.8 0.7 0.7 0.7 0.7 0.6
Norway 0.8 0.8 0.7 0.7 0.7 0.7
Ireland 0.7 0.7 0.5 0.5 0.4 0.4
Denmark 0.7 0.6 0.6 0.6 0.5 0.5
Emerging Market and Developing Countries 1/ 42.4 49.3 49.7 49.7 50.1 50.3
Africa 4.4 3.7 3.6 3.6 3.7 3.7
South Africa 0.6 0.5 0.6 0.6 0.6 0.6
Nigeria 0.5 0.7 0.7 0.7 0.7 0.7
Asia 16.0 23.4 24.3 24.3 24.6 24.7
China 2/ 6.4 12.0 12.7 12.8 12.9 13.2
India 2.7 3.0 3.3 3.3 3.4 3.4
Korea, Republic of 1.8 2.0 2.2 2.2 2.3 2.1
Indonesia 1.0 1.3 1.4 1.4 1.4 1.4
Singapore 0.8 1.3 0.8 0.7 0.7 0.6
Malaysia 0.8 0.8 0.8 0.8 0.8 0.7
Thailand 0.7 1.0 1.0 1.0 1.0 0.9
Middle East, Malta and Turkey 6.7 7.2 6.9 6.8 6.8 6.8
Saudi Arabia 2.1 1.7 1.5 1.5 1.6 1.6
Turkey 1.0 1.1 1.1 1.1 1.2 1.2
Iran, I.R. of 0.7 0.8 0.8 0.8 0.8 0.8
Western Hemisphere 7.9 7.4 7.6 7.7 7.7 7.9
Brazil 2.3 2.3 2.4 2.4 2.5 2.5
Mexico 1.9 1.7 1.8 1.8 1.8 1.9
Venezuela, R.B. de 0.8 0.5 0.5 0.5 0.5 0.5
Argentina 0.7 0.6 0.7 0.7 0.7 0.7
Transition economies 7.2 7.6 7.3 7.2 7.2 7.2
Russia 2.7 2.7 2.8 2.8 2.8 2.9
Poland 0.9 0.9 0.9 0.9 1.0 1.0
Total 100.0 100.0 100.0 100.0 100.0 100.0
Memorandum items:
EU28 30.4 27.5 26.2 26.0 25.6 24.8
LICs 3/ 3.3 2.2 2.1 2.1 2.2 2.2
Coefficients for quota variables
GDP 0.300 0.345 0.345 0.345 0.345
PPP GDP 0.200 0.230 0.230 0.230 0.230
Openness 0.300 0.375 0.375 0.375 0.375
Variability 0.150 0.000 0.000 0.000 0.000
Reserves 0.050 0.050 0.050 0.050 0.050
Compression factor 0.950 0.950 0.950 0.950 0.950
Formula w/o variability, weight split evenly between GDP and
openness, and different openness measures:

QUOTAS—DATA UPDATE AND SIMULATIONS
INTERNATIONAL MONETARY FUND 33
Table 12. Illustrative Calculations—Current GDP Blend, Dropping Variability, Weight Split
Between GDP (2/3) and Openness (1/3), and Different Openness Measures
(In percent)
Source: Finance Department
1/ Including Czech Republic, Estonia, Korea, Latvia, Lithuania, Malta, Singapore, Slovak Republic, and Slovenia.
2/ Including China, P.R., Hong Kong SAR, and Macao SAR.
3/ Currently PRGT-eligible countries plus Zimbabwe.
14th
General
Review
Quotas
Current
Formula
Nominal
openness capped
at the 85th
percentile
Nominal
openness capped
at the 75th
percentile
Openness
shares capped
at 1.8
Openness
shares capped
at 1.5
Advanced economies 57.6 50.7 50.2 50.1 49.8 49.6
Major advanced economies 43.4 36.1 37.3 37.6 38.0 38.2
United States 17.4 14.3 15.1 15.2 15.4 15.7
Japan 6.5 5.3 5.4 5.5 5.5 5.6
Germany 5.6 5.1 5.1 5.2 5.2 4.8
France 4.2 3.3 3.4 3.4 3.5 3.6
United Kingdom 4.2 3.6 3.5 3.5 3.6 3.5
Italy 3.2 2.5 2.5 2.6 2.6 2.7
Canada 2.3 2.1 2.2 2.2 2.2 2.3
Other advanced economies 14.3 14.6 12.9 12.5 11.8 11.4
Spain 2.0 1.8 1.8 1.8 1.8 1.9
Netherlands 1.8 2.1 1.6 1.5 1.3 1.2
Australia 1.4 1.5 1.6 1.6 1.6 1.6
Belgium 1.3 1.1 1.0 0.9 0.8 0.7
Switzerland 1.2 1.6 1.5 1.4 1.2 1.1
Sweden 0.9 0.9 0.9 0.9 0.8 0.8
Austria 0.8 0.7 0.7 0.7 0.7 0.6
Norway 0.8 0.8 0.7 0.7 0.7 0.7
Ireland 0.7 0.7 0.5 0.4 0.4 0.3
Denmark 0.7 0.6 0.6 0.6 0.5 0.5
Emerging Market and Developing Countries 1/ 42.4 49.3 49.8 49.9 50.2 50.4
Africa 4.4 3.7 3.6 3.6 3.7 3.7
South Africa 0.6 0.5 0.6 0.6 0.6 0.6
Nigeria 0.5 0.7 0.7 0.7 0.7 0.7
Asia 16.0 23.4 24.4 24.5 24.7 24.8
China 2/ 6.4 12.0 12.8 12.9 13.0 13.3
India 2.7 3.0 3.4 3.4 3.4 3.5
Korea, Republic of 1.8 2.0 2.2 2.2 2.2 2.1
Indonesia 1.0 1.3 1.4 1.4 1.4 1.5
Singapore 0.8 1.3 0.8 0.7 0.7 0.6
Malaysia 0.8 0.8 0.8 0.7 0.8 0.7
Thailand 0.7 1.0 1.0 1.0 1.0 0.9
Middle East, Malta and Turkey 6.7 7.2 6.9 6.8 6.8 6.8
Saudi Arabia 2.1 1.7 1.5 1.5 1.6 1.6
Turkey 1.0 1.1 1.1 1.2 1.2 1.2
Iran, I.R. of 0.7 0.8 0.8 0.8 0.8 0.8
Western Hemisphere 7.9 7.4 7.7 7.7 7.8 7.9
Brazil 2.3 2.3 2.5 2.5 2.5 2.5
Mexico 1.9 1.7 1.8 1.8 1.8 1.9
Venezuela, R.B. de 0.8 0.5 0.5 0.5 0.5 0.5
Argentina 0.7 0.6 0.7 0.7 0.7 0.7
Transition economies 7.2 7.6 7.3 7.2 7.2 7.2
Russia 2.7 2.7 2.8 2.8 2.8 2.9
Poland 0.9 0.9 0.9 0.9 1.0 1.0
Total 100.0 100.0 100.0 100.0 100.0 100.0
Memorandum items:
EU28 30.4 27.5 25.9 25.7 25.3 24.5
LICs 3/ 3.3 2.2 2.1 2.2 2.2 2.2
Coefficients for quota variables
GDP 0.300 0.360 0.360 0.360 0.360
PPP GDP 0.200 0.240 0.240 0.240 0.240
Openness 0.300 0.350 0.350 0.350 0.350
Variability 0.150 0.000 0.000 0.000 0.000
Reserves 0.050 0.050 0.050 0.050 0.050
Compression factor 0.950 0.950 0.950 0.950 0.950
Formula w/o variability, weight split between GDP (2/3) and openness
(1/3), and different openness measures:
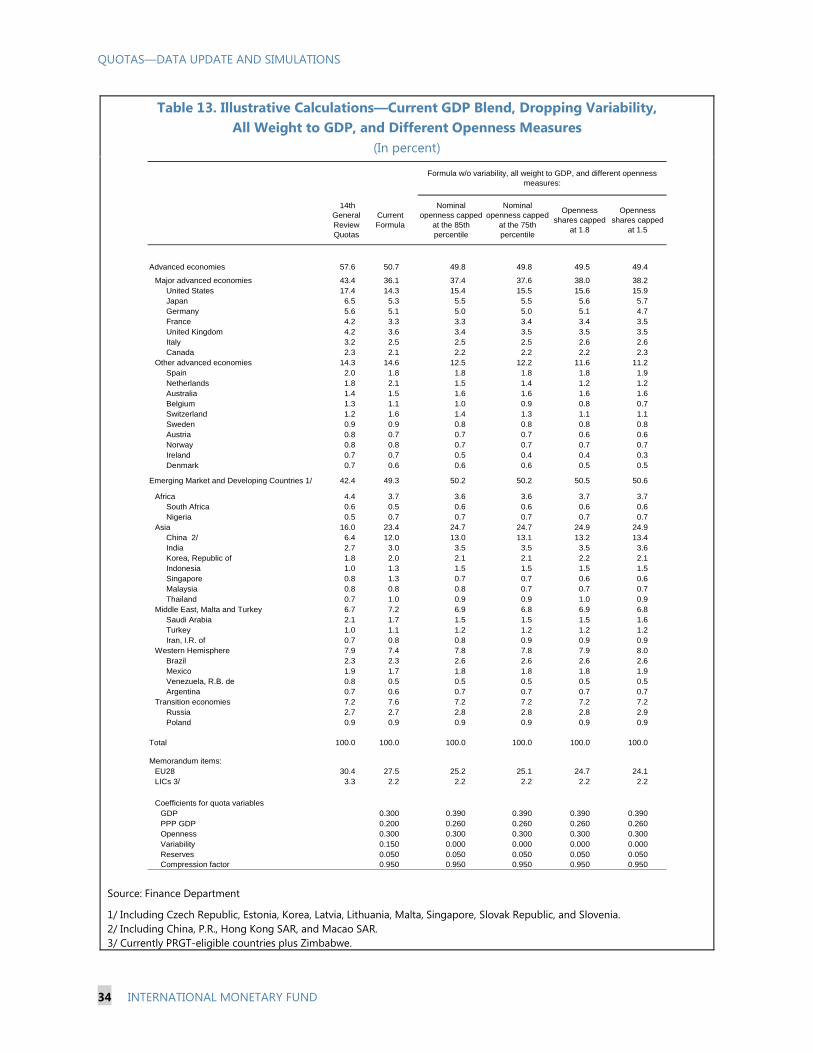
QUOTAS—DATA UPDATE AND SIMULATIONS
34 INTERNATIONAL MONETARY FUND
Table 13. Illustrative Calculations—Current GDP Blend, Dropping Variability,
All Weight to GDP, and Different Openness Measures
(In percent)
Source: Finance Department
1/ Including Czech Republic, Estonia, Korea, Latvia, Lithuania, Malta, Singapore, Slovak Republic, and Slovenia.
2/ Including China, P.R., Hong Kong SAR, and Macao SAR.
3/ Currently PRGT-eligible countries plus Zimbabwe.
14th
General
Review
Quotas
Current
Formula
Nominal
openness capped
at the 85th
percentile
Nominal
openness capped
at the 75th
percentile
Openness
shares capped
at 1.8
Openness
shares capped
at 1.5
Advanced economies 57.6 50.7 49.8 49.8 49.5 49.4
Major advanced economies 43.4 36.1 37.4 37.6 38.0 38.2
United States 17.4 14.3 15.4 15.5 15.6 15.9
Japan 6.5 5.3 5.5 5.5 5.6 5.7
Germany 5.6 5.1 5.0 5.0 5.1 4.7
France 4.2 3.3 3.3 3.4 3.4 3.5
United Kingdom 4.2 3.6 3.4 3.5 3.5 3.5
Italy 3.2 2.5 2.5 2.5 2.6 2.6
Canada 2.3 2.1 2.2 2.2 2.2 2.3
Other advanced economies 14.3 14.6 12.5 12.2 11.6 11.2
Spain 2.0 1.8 1.8 1.8 1.8 1.9
Netherlands 1.8 2.1 1.5 1.4 1.2 1.2
Australia 1.4 1.5 1.6 1.6 1.6 1.6
Belgium 1.3 1.1 1.0 0.9 0.8 0.7
Switzerland 1.2 1.6 1.4 1.3 1.1 1.1
Sweden 0.9 0.9 0.8 0.8 0.8 0.8
Austria 0.8 0.7 0.7 0.7 0.6 0.6
Norway 0.8 0.8 0.7 0.7 0.7 0.7
Ireland 0.7 0.7 0.5 0.4 0.4 0.3
Denmark 0.7 0.6 0.6 0.6 0.5 0.5
Emerging Market and Developing Countries 1/ 42.4 49.3 50.2 50.2 50.5 50.6
Africa 4.4 3.7 3.6 3.6 3.7 3.7
South Africa 0.6 0.5 0.6 0.6 0.6 0.6
Nigeria 0.5 0.7 0.7 0.7 0.7 0.7
Asia 16.0 23.4 24.7 24.7 24.9 24.9
China 2/ 6.4 12.0 13.0 13.1 13.2 13.4
India 2.7 3.0 3.5 3.5 3.5 3.6
Korea, Republic of 1.8 2.0 2.1 2.1 2.2 2.1
Indonesia 1.0 1.3 1.5 1.5 1.5 1.5
Singapore 0.8 1.3 0.7 0.7 0.6 0.6
Malaysia 0.8 0.8 0.8 0.7 0.7 0.7
Thailand 0.7 1.0 0.9 0.9 1.0 0.9
Middle East, Malta and Turkey 6.7 7.2 6.9 6.8 6.9 6.8
Saudi Arabia 2.1 1.7 1.5 1.5 1.5 1.6
Turkey 1.0 1.1 1.2 1.2 1.2 1.2
Iran, I.R. of 0.7 0.8 0.8 0.9 0.9 0.9
Western Hemisphere 7.9 7.4 7.8 7.8 7.9 8.0
Brazil 2.3 2.3 2.6 2.6 2.6 2.6
Mexico 1.9 1.7 1.8 1.8 1.8 1.9
Venezuela, R.B. de 0.8 0.5 0.5 0.5 0.5 0.5
Argentina 0.7 0.6 0.7 0.7 0.7 0.7
Transition economies 7.2 7.6 7.2 7.2 7.2 7.2
Russia 2.7 2.7 2.8 2.8 2.8 2.9
Poland 0.9 0.9 0.9 0.9 0.9 0.9
Total 100.0 100.0 100.0 100.0 100.0 100.0
Memorandum items:
EU28 30.4 27.5 25.2 25.1 24.7 24.1
LICs 3/ 3.3 2.2 2.2 2.2 2.2 2.2
Coefficients for quota variables
GDP 0.300 0.390 0.390 0.390 0.390
PPP GDP 0.200 0.260 0.260 0.260 0.260
Openness 0.300 0.300 0.300 0.300 0.300
Variability 0.150 0.000 0.000 0.000 0.000
Reserves 0.050 0.050 0.050 0.050 0.050
Compression factor 0.950 0.950 0.950 0.950 0.950
Formula w/o variability, all weight to GDP, and different openness
measures:

QUOTAS—DATA UPDATE AND SIMULATIONS
INTERNATIONAL MONETARY FUND 35
Table 14. Illustrative Calculations—Current GDP and Openness Measures, Dropping
Variability, and Higher Compression (0.925)
(In percent)
Source: Finance Department
1/ Including Czech Republic, Estonia, Korea, Latvia, Lithuania, Malta, Singapore, Slovak Republic, and Slovenia.
2/ Including China, P.R., Hong Kong SAR, and Macao SAR.
3/ Currently PRGT-eligible countries plus Zimbabwe.
Formula w/o
variability and:
14th
General
Review
Quotas
Current
FormulaEven split
GDP (2/3),
openness
(1/3)
All to GDP
blend
Weight of
openness
reduced to 0.25
Advanced economies 57.6 50.7 49.8 49.7 49.3 49.0
Major advanced economies 43.4 36.1 35.6 35.7 35.9 36.0
United States 17.4 14.3 14.1 14.2 14.5 14.8
Japan 6.5 5.3 5.2 5.2 5.3 5.4
Germany 5.6 5.1 5.0 4.9 4.8 4.7
France 4.2 3.3 3.3 3.3 3.3 3.2
United Kingdom 4.2 3.6 3.4 3.4 3.3 3.3
Italy 3.2 2.5 2.5 2.5 2.5 2.5
Canada 2.3 2.1 2.2 2.2 2.1 2.1
Other advanced economies 14.3 14.6 14.2 14.0 13.5 13.0
Spain 2.0 1.8 1.8 1.8 1.8 1.8
Netherlands 1.8 2.1 2.0 2.0 1.8 1.7
Australia 1.4 1.5 1.6 1.6 1.6 1.6
Belgium 1.3 1.1 1.1 1.1 1.0 1.0
Switzerland 1.2 1.6 1.5 1.5 1.4 1.3
Sweden 0.9 0.9 0.9 0.9 0.8 0.8
Austria 0.8 0.7 0.7 0.7 0.7 0.7
Norway 0.8 0.8 0.7 0.7 0.7 0.7
Ireland 0.7 0.7 0.7 0.7 0.6 0.6
Denmark 0.7 0.6 0.6 0.6 0.6 0.5
Emerging Market and Developing Countries 1/ 42.4 49.3 50.2 50.3 50.7 51.0
Africa 4.4 3.7 3.8 3.8 3.9 3.9
South Africa 0.6 0.5 0.6 0.6 0.6 0.6
Nigeria 0.5 0.7 0.7 0.7 0.7 0.7
Asia 16.0 23.4 24.1 24.2 24.4 24.6
China 2/ 6.4 12.0 12.0 12.1 12.3 12.5
India 2.7 3.0 3.3 3.3 3.4 3.5
Korea, Republic of 1.8 2.0 2.2 2.1 2.1 2.1
Indonesia 1.0 1.3 1.4 1.4 1.5 1.5
Singapore 0.8 1.3 1.3 1.2 1.1 1.0
Malaysia 0.8 0.8 0.8 0.8 0.8 0.7
Thailand 0.7 1.0 1.0 1.0 0.9 0.9
Middle East, Malta and Turkey 6.7 7.2 7.0 7.0 7.1 7.1
Saudi Arabia 2.1 1.7 1.5 1.5 1.5 1.5
Turkey 1.0 1.1 1.1 1.2 1.2 1.2
Iran, I.R. of 0.7 0.8 0.8 0.8 0.9 0.9
Western Hemisphere 7.9 7.4 7.7 7.8 7.9 8.1
Brazil 2.3 2.3 2.4 2.4 2.5 2.6
Mexico 1.9 1.7 1.8 1.8 1.8 1.8
Venezuela, R.B. de 0.8 0.5 0.5 0.5 0.5 0.5
Argentina 0.7 0.6 0.7 0.7 0.7 0.7
Transition economies 7.2 7.6 7.5 7.5 7.4 7.3
Russia 2.7 2.7 2.7 2.7 2.8 2.8
Poland 0.9 0.9 0.9 0.9 0.9 0.9
Total 100.0 100.0 100.0 100.0 100.0 100.0
Memorandum items:
EU28 30.4 27.5 27.0 26.7 26.0 25.2
LICs 3/ 3.3 2.2 2.3 2.3 2.4 2.4
Coefficients for quota variables
GDP 0.300 0.345 0.360 0.390 0.420
PPP GDP 0.200 0.230 0.240 0.260 0.280
Openness 0.300 0.375 0.350 0.300 0.250
Variability 0.150 0.000 0.000 0.000 0.000
Reserves 0.050 0.050 0.050 0.050 0.050
Compression factor 0.950 0.925 0.925 0.925 0.925
Formula w/o variability, and weight spilt:

QUOTAS—DATA UPDATE AND SIMULATIONS
36 INTERNATIONAL MONETARY FUND
Table 15. Illustrative Calculations—Current GDP and Openness Measures, Dropping
Variability, and Lower Compression (0.975)
(In percent)
Source: Finance Department
1/ Including Czech Republic, Estonia, Korea, Latvia, Lithuania, Malta, Singapore, Slovak Republic, and Slovenia.
2/ Including China, P.R., Hong Kong SAR, and Macao SAR.
3/ Currently PRGT-eligible countries plus Zimbabwe.
Formula w/o
variability and:
14th
General
Review
Quotas
Current
FormulaEven split
GDP (2/3),
openness
(1/3)
All to GDP
blend
Weight of
openness
reduced to 0.25
Advanced economies 57.6 50.7 51.1 50.9 50.6 50.2
Major advanced economies 43.4 36.1 37.5 37.6 37.8 37.9
United States 17.4 14.3 15.5 15.6 16.0 16.3
Japan 6.5 5.3 5.4 5.5 5.5 5.6
Germany 5.6 5.1 5.2 5.1 5.0 4.8
France 4.2 3.3 3.4 3.3 3.3 3.3
United Kingdom 4.2 3.6 3.5 3.4 3.4 3.3
Italy 3.2 2.5 2.5 2.5 2.5 2.5
Canada 2.3 2.1 2.1 2.1 2.1 2.1
Other advanced economies 14.3 14.6 13.5 13.3 12.8 12.3
Spain 2.0 1.8 1.8 1.8 1.7 1.7
Netherlands 1.8 2.1 2.0 1.9 1.8 1.7
Australia 1.4 1.5 1.5 1.5 1.5 1.5
Belgium 1.3 1.1 1.1 1.1 1.0 0.9
Switzerland 1.2 1.6 1.5 1.4 1.4 1.3
Sweden 0.9 0.9 0.8 0.8 0.8 0.8
Austria 0.8 0.7 0.7 0.7 0.6 0.6
Norway 0.8 0.8 0.7 0.7 0.6 0.6
Ireland 0.7 0.7 0.6 0.6 0.6 0.5
Denmark 0.7 0.6 0.6 0.5 0.5 0.5
Emerging Market and Developing Countries 1/ 42.4 49.3 48.9 49.1 49.4 49.8
Africa 4.4 3.7 3.3 3.3 3.4 3.4
South Africa 0.6 0.5 0.5 0.5 0.6 0.6
Nigeria 0.5 0.7 0.7 0.7 0.7 0.7
Asia 16.0 23.4 24.8 24.9 25.1 25.3
China 2/ 6.4 12.0 13.1 13.2 13.4 13.7
India 2.7 3.0 3.3 3.4 3.5 3.6
Korea, Republic of 1.8 2.0 2.1 2.1 2.1 2.0
Indonesia 1.0 1.3 1.4 1.4 1.4 1.5
Singapore 0.8 1.3 1.2 1.2 1.1 1.0
Malaysia 0.8 0.8 0.8 0.7 0.7 0.7
Thailand 0.7 1.0 0.9 0.9 0.9 0.9
Middle East, Malta and Turkey 6.7 7.2 6.6 6.6 6.6 6.6
Saudi Arabia 2.1 1.7 1.5 1.5 1.5 1.5
Turkey 1.0 1.1 1.1 1.1 1.1 1.1
Iran, I.R. of 0.7 0.8 0.8 0.8 0.8 0.8
Western Hemisphere 7.9 7.4 7.3 7.4 7.5 7.6
Brazil 2.3 2.3 2.4 2.4 2.5 2.6
Mexico 1.9 1.7 1.7 1.7 1.8 1.8
Venezuela, R.B. de 0.8 0.5 0.4 0.4 0.4 0.5
Argentina 0.7 0.6 0.6 0.6 0.7 0.7
Transition economies 7.2 7.6 7.0 6.9 6.9 6.8
Russia 2.7 2.7 2.7 2.7 2.8 2.8
Poland 0.9 0.9 0.9 0.9 0.9 0.9
Total 100.0 100.0 100.0 100.0 100.0 100.0
Memorandum items:
EU28 30.4 27.5 26.6 26.2 25.5 24.7
LICs 3/ 3.3 2.2 1.9 1.9 1.9 2.0
Coefficients for quota variables
GDP 0.300 0.345 0.360 0.390 0.420
PPP GDP 0.200 0.230 0.240 0.260 0.280
Openness 0.300 0.375 0.350 0.300 0.250
Variability 0.150 0.000 0.000 0.000 0.000
Reserves 0.050 0.050 0.050 0.050 0.050
Compression factor 0.950 0.975 0.975 0.975 0.975
Formula w/o variability, and weight spilt:

QUOTAS—DATA UPDATE AND SIMULATIONS
INTERNATIONAL MONETARY FUND 37
REALIGNING QUOTA SHARES
26. General quota increases provide an important opportunity to realign quota and voting
shares to reflect changes in members’ relative economic positions. Board of Governors
Resolution 66-2 states that “Any realignment [under the 15th Review] is expected to result in
increases in the quota shares of dynamic economies in line with their relative positions in the world
economy, and hence likely in the share of emerging market and developing countries as a whole.
Steps shall be taken to protect the voice and representation of the poorest members.” The recent
IMFC and G20 communiques also reaffirmed this expectation.19
27. The extent of any realignment depends on the size of the overall quota increase and
how it is distributed. A larger overall increase tends to increase the scope for realigning shares,
particularly where all or most of the increase is distributed to all members based on the quota
formula (referred to as the selective element). However, a large realignment is also possible with a
relatively small overall increase if it is concentrated on a sub-set of members (referred to as the ad
hoc element). Prior to the 14th Review, a significant portion (often more than half) of the overall
increase agreed in previous general reviews was distributed based on actual quota shares (the
equiproportional element), which results in no share realignment.20 In the 14th Review, with its heavy
focus on governance reform, the selective element represented 60 percent of the total, while the
remaining 40 percent was allocated to a sub-set of members as ad hoc increases based primarily on
the GDP-blend variable, with no equiproportional element.
28. Previous general quota reviews have resulted in a partial adjustment of actual toward
calculated quota shares. This in part reflects the need to obtain a broad consensus for adjusting
quota shares. Also, the quota formula only serves as a guide to potential adjustments in quota
shares, and the reasonableness of the results generated by the formula have at times been
questioned, as discussed above. In addition, other considerations outside of the formula, such as
members’ ability or willingness to contribute to the Fund’s liquidity and protection of the poorest,
have also been taken into account. Finally, the practice of adjusting shares through quota increases
means that adjustments in actual quota shares tend to be gradual, even if all of the increase is
distributed based on CQS, because the new quota shares would reflect a weighted sum of existing
AQS and CQS. A measure used in the past of the extent to which the discrepancy between actual
and calculated quota shares has been reduced in previous general reviews highlights this point
(Table 16). The adjustment coefficient was typically fairly low prior to the 9th Review and by far the
largest in the 14th Review. Also, the convergence index, which measures the extent of aggregate
convergence between AQS and CQS, reached its highest level following the 14th Review.
19 See the Communiqué of the Thirty-Third Meeting of the IMFC, April 16, 2016, Washington, D.C. and the
Communiqué of G20 Finance Ministers and Central Bank Governors Meeting, July 24, 2016, Chengdu, China. 20 The sole exception is the Sixth Review, which did not include any equiproportional or selective element. Instead,
the quota shares of the major oil exporters were doubled with the stipulation that the collective share of the
developing countries would not fall. Different increases applied to different groups of countries and individual
countries’ increases within groups varied considerably.

QUOTAS—DATA UPDATE AND SIMULATIONS
38 INTERNATIONAL MONETARY FUND
29. This section presents some initial simulations to illustrate the potential impact of
possible reforms of the quota formula on the adjustment of members’ actual quota shares.
The simulations are intended purely as an aid to future discussions, given that Directors have not yet
explored any of the possible parameters for the 15th Review, including the size of any quota increase
and the extent of any desired overall shifts in shares. Also, as discussed above, considerable
differences of views remain over the quota formula. Against this background, the main purpose of
the simulations is to show how possible changes in the quota formula might feed through into shifts
in actual quota shares in the context of the 15th Review. Given the very early stage of discussions,
the simulations are purely illustrative and do not in any way represent staff proposals.
Table 16. Adjustment Coefficients and Convergence Indices
Source: External Review of Quota Formulas—Annex (EBAP/00/52, Sup 1, 5/1/00); and staff estimates
1/ The adjustment coefficient measures the extent to which deviations between actual and calculated quotas are reduced by
quota share adjustments. The specific formula for the adjustment coefficient is:
{SQRT[SUM((CQS-PQS)^2)]}- {SQRT[SUM((CQS-PropQS)^2)]} x 100
{SQRT[SUM((CQS-PQS)^2)]}
Where SQRT is the square root, CQS is the calculated quota share, PQS is the present quota share and PropQS is the proposed
quota share.
2/ The convergence index is defined as 100 percent minus the total of positive deviations between agreed and calculated quota
shares.
30. For simplicity, simulations are only presented for a sub-set of the alternative formulas
discussed above. The alternative formulas (see also Table 17) build on the earlier illustrative
calculations for alternative quota formulas. In addition to the current formula, which is included for
reference, two simulations illustrate the impact of dropping variability, one by splitting its weight
two-thirds/one-third between GDP/openness, and one by assigning all of its weight to GDP. Two
further simulations explore the impact of a different openness measure, covering again two options
for allocating the weight of the dropped variability variable. Clearly, many other variants can be
considered. Specifically, the following alternative formulas are used:
The second formula in Set 1 (Formula 1.2): current GDP and openness, dropping variability, 2/3
weight of variability to GDP, and 1/3 weight of variability to openness;
The third formula in Set 1 (Formula 1.3): current GDP and openness, dropping variability, all
weight to GDP;
The third formula in Set 3.2 (Formula 3.2.c): current GDP, openness share capped at 1.8,
dropping variability, 2/3 weight of variability to GDP, and 1/3 weight of variability to openness;
and
Fifth
Review
Sixth
Review
Seventh
Review
Eigth
Review
Ninth
Review
Eleventh
Review
2008
Reform
Fourteenth
ReviewCurrent
Adjustment Coefficient 1/ 11.5 5.4 1.7 19.3 28.0 14.4 25.6 55.7 --
Convergence Index 2/ 89.2 85.3 83.2 85.6 89.9 85.6 89.3 94.7 89.0

QUOTAS—DATA UPDATE AND SIMULATIONS
INTERNATIONAL MONETARY FUND 39
The third formula in Set 3.3 (Formula 3.3.c): current GDP, openness share capped at 1.8,
dropping variability, all weight to GDP.
Table 17. Weights of Variables for the Formulas Used for Illustrative Quota Allocations 1/
Source: Finance Department
1/ Formulas 1.2 and 1.3 use the current openness measure. Openness share is capped at 1.8 for Formulas 3.2.c and 3.3.c.
31. Again for purely illustrative purposes, two alternatives are considered for the size of
an overall quota increase. These include an increase of 70 percent, or about SDR 330 billion, which
would broadly maintain the Fund’s current overall lending capacity after the bilateral borrowing
agreements expire. Simulations are also shown for a larger increase of 115 percent, which would
broadly restore the ratio of quotas relative to an average of relevant economic indicators to levels
observed in previous general reviews of quotas.21 Such an increase would also be required to
maintain the Fund’s lending capacity in the absence of both bilateral borrowing and the NAB. While
Directors held an initial discussion of the adequacy of Fund resources in March, the main focus of
the staff paper was on the Fund’s potential resource needs over the medium term, and it did not
consider the appropriate mix of those resources between quotas and borrowed resources. Staff plan
to revisit the issue of the mix of Fund resources in future papers.
32. The simulations consider quota increases that are distributed predominantly as
selective increases, i.e., allocated to all members in accordance with their calculated quota
shares. Clearly many different variants can be considered, including whether there should be any
equiproportional increase, which would slow down the pace of adjustment in shares, and the
possible role for ad hoc increases. All the simulations include ad hoc increases to protect the quota
shares of the poorest members (see below). In addition, the last set of simulations illustrates the
potential effect of allocating 5 percent of the overall increase as ad hoc increases to a sub-set of
members who have made voluntary financial contributions to the Fund.22 As discussed in previous
papers, there are many possible ways of measuring such contributions and further work on this
topic will be needed, including on how to define “very significant” contributions. Annex IV updates
21 A quota increase of 112 percent of post-14th Review quotas would be needed to restore the ratio of quotas
relative to an average of relevant economic indicators (external financing needs, GDP, current payments, capital
inflows of EMDCs, external liabilities) to the average level of the last four reviews with quota increases (i.e., the 8th, 9th,
11th, and 14th Reviews), except for external liabilities where the benchmark is the average value during 1995-2000.
22 As noted above, in concluding the 2013 QFR, Executive Directors agreed to consider whether and how to take into
account very significant voluntary financial contributions through ad hoc adjustments as part of the 15th Review.
(continued)
GDP Openness Variability Reserves Compression Factor
Current Formula 0.50 0.30 0.15 0.05 0.95
Formula 1.2 0.60 0.35 0 0.05 0.95
Formula 1.3 0.65 0.30 0 0.05 0.95
Formula 3.2.c 0.60 0.35 0 0.05 0.95
Formula 3.3.c 0.65 0.30 0 0.05 0.95

QUOTAS—DATA UPDATE AND SIMULATIONS
40 INTERNATIONAL MONETARY FUND
staff’s earlier work on possible composite measures of voluntary financial contributions, and one
such measure has been used in the final simulation set.23
33. As noted, the quota shares of the poorest members are protected against declines
below their 14th Review shares in all scenarios. This is in line with the commitment in Board of
Governors Resolution 66-2, which was reiterated in the outcome of the quota formula review, and
the latest guidance by the IMFC.24 For illustrative purposes, the definition of the poorest members is
the same as that used in the 14th Review, namely those countries that are PRGT-eligible and meet
the IDA per capita GNI cut-off or twice that amount for small states. Based on the 2016 IDA cut-
off—a per capita GNI of up to US$1,215 (previously US$1,135)—this approach generates a list of 36
members eligible for protection (compared with 52 members at the time of the 14th Review). The
cost of protection under this approach is less than 1 percent of the overall increase under all
scenarios. Other options for defining the poorest members in the context of the 15th Review could
also be considered, and Annex III describes three additional country groupings, including all PRGT-
eligible countries, the United Nations list of least developed countries and the WEO’s low income
developing countries.
34. Summary results for 35 members with the largest quotas and for major country
groups are presented below (Tables 19-23). Table 18 provides an overview of the results for major
country groups. The following points may be noted:
All the simulations show a further shift towards EMDCs from their 14th Review quota share.
In the simulations with only selective increases (plus protection for the poorest):
Based on the current formula, the aggregate share of EMDCs increases by
3.0 percentage points with a 70 percent overall quota increase and by
3.9 percentage points with a 115 percent overall quota increase.
The shifts towards EMDCs are larger in all the alternative formulas considered here.
The largest shifts—3.5 percentage points for a 70 percent quota increase and
4.5 percentage points for a 115 percent increase—are indicated by Formula 3.3.c
(which drops variability, shifts all the weight to GDP, and introduces a cap on
openness).
The inclusion of ad hoc increases to recognize voluntary financial contributions reduces the
size of this shift. In the example illustrated here, the reduction is about 0.6 percentage points
for a 70 percent increase and 0.7 percentage points for a 115 percent increase.
Within the group of advanced countries, using the current formula modestly increases the
23 Voluntary financial contributions are calculated here as each member’s share across four types of contributions,
with weights of 0.3 for the NAB, 0.3 for the 2012 Bilateral Borrowing Agreements, 0.2 for PRGT loans and subsidies
combined, and 0.2 for Capacity Development (see VFCS II in Annex IV).
24 “We are committed to protecting the voice and representation of the poorest members.” See the Communiqué of
the Thirty-Third Meeting of the IMFC, April 16, 2016, Washington, D.C.

QUOTAS—DATA UPDATE AND SIMULATIONS
INTERNATIONAL MONETARY FUND 41
share of other advanced countries as a group, while the major advanced countries would
lose share. Both groups lose share under the alternative formulas considered here, though
the declines are dampened somewhat under the simulations that include recognition of
voluntary financial contributions. Clearly, the results for individual countries may differ
significantly.
Table 18. Illustration of Allocation Mechanisms: Summary
Source: Finance Department
Major
Advanced
Other
Advanced EMDCs LICs
14th Review Quota Share 43.36 14.28 42.36 3.31
Based on the Current Formula
1. 70 percent overall Increase 40.27 14.37 45.36 3.12
2. 115 percent overall Increase 39.34 14.40 46.26 3.06
Based on Formula 1.2
1. 70 percent overall Increase 40.50 13.97 45.54 3.12
2. 115 percent overall Increase 39.64 13.88 46.49 3.07
Based on Formula 1.3
1. 70 percent overall Increase 40.56 13.76 45.67 3.13
2. 115 percent overall Increase 39.73 13.61 46.66 3.08
Based on Formula 3.2.c
1. 70 percent overall Increase 41.04 13.22 45.74 3.14
2. 115 percent overall Increase 40.35 12.90 46.75 3.09
Based on Formula 3.3.c
1. 70 percent overall Increase 41.03 13.12 45.85 3.14
2. 115 percent overall Increase 40.33 12.77 46.89 3.10
1. 70 percent overall Increase 40.99 13.91 45.11 3.11
2. 115 percent overall Increase 40.28 13.80 45.93 3.05
Based on Formula 1.3, includes 5 percent ad hoc distribution based on voluntary financial
contributions
Actual Quota Shares (in percent)

QUOTAS—DATA UPDATE AND SIMULATIONS
42 INTERNATIONAL MONETARY FUND
Table 19. Illustration of Allocation Mechanisms: Current Formula 1/
(In percent)
Source: Finance Department
1/ All simulations show distributions based on the quota formula (i.e., selective increases) plus ad hoc increases where needed to
protect the shares of the poorest members.
2/ Including Czech Republic, Estonia, Korea, Latvia, Lithuania, Malta, Singapore, Slovak Republic, and Slovenia.
3/ Including China, P.R., Hong Kong SAR, and Macao SAR.
4/ Currently PRGT-eligible countries plus Zimbabwe.
5/ Updated 14th Review list to include countries that are PRGT-eligible and meet the current IDA per capita GNI cut-off of
US$1,215 (previously US$1,135) and twice that amount for small states, as defined by the IMF. Currently includes 36 member
countries.
Overall Increase 70% 115%
14th
General
Review
CQS based on
the Current
Formula
A1 A2
Advanced economies 57.6 50.7 54.6 53.7
Major advanced economies 43.4 36.1 40.3 39.3
United States 17.4 14.3 16.1 15.7
Japan 6.5 5.3 6.0 5.8
Germany 5.6 5.1 5.4 5.3
France 4.2 3.3 3.8 3.7
United Kingdom 4.2 3.6 3.9 3.9
Italy 3.2 2.5 2.9 2.8
Canada 2.3 2.1 2.2 2.2
Other advanced economies 14.3 14.6 14.4 14.4
Spain 2.0 1.8 1.9 1.9
Netherlands 1.8 2.1 1.9 2.0
Australia 1.4 1.5 1.4 1.4
Belgium 1.3 1.1 1.3 1.2
Switzerland 1.2 1.6 1.4 1.4
Sweden 0.9 0.9 0.9 0.9
Austria 0.8 0.7 0.8 0.8
Norway 0.8 0.8 0.8 0.8
Ireland 0.7 0.7 0.7 0.7
Denmark 0.7 0.6 0.7 0.6
Emerging Market and Developing Countries 2/ 42.4 49.3 45.4 46.3
Africa 4.4 3.7 4.4 4.3
South Africa 0.6 0.5 0.6 0.6
Nigeria 0.5 0.7 0.6 0.6
Asia 16.0 23.4 19.0 19.9
China 3/ 6.4 12.0 8.7 9.4
India 2.7 3.0 2.9 2.9
Korea, Republic of 1.8 2.0 1.9 1.9
Indonesia 1.0 1.3 1.1 1.1
Singapore 0.8 1.3 1.0 1.1
Malaysia 0.8 0.8 0.8 0.8
Thailand 0.7 1.0 0.8 0.8
Middle East, Malta and Turkey 6.7 7.2 6.9 7.0
Saudi Arabia 2.1 1.7 1.9 1.9
Turkey 1.0 1.1 1.0 1.0
Iran, I.R. of 0.7 0.8 0.8 0.8
Western Hemisphere 7.9 7.4 7.7 7.6
Brazil 2.3 2.3 2.3 2.3
Mexico 1.9 1.7 1.8 1.8
Venezuela, R.B. de 0.8 0.5 0.7 0.6
Argentina 0.7 0.6 0.7 0.6
Transition economies 7.2 7.6 7.4 7.4
Russia 2.7 2.7 2.7 2.7
Poland 0.9 0.9 0.9 0.9
Total 100.0 100.0 100.0 100.0
Memorandum items:
EU28 30.4 27.5 29.1 28.7
LICs 4/ 3.3 2.2 3.1 3.1
Updated 14th Review Poorest 5/ 1.7 1.2 1.8 1.8

QUOTAS—DATA UPDATE AND SIMULATIONS
INTERNATIONAL MONETARY FUND 43
Table 20. Illustration of Allocation Mechanisms: Formula 1.2 1/
(In percent)
Source: Finance Department
1/ All simulations show distributions based on the quota formula (i.e., selective increases) plus ad hoc increases where needed to
protect the shares of the poorest members.
2/ Including Czech Republic, Estonia, Korea, Latvia, Lithuania, Malta, Singapore, Slovak Republic, and Slovenia.
3/ Including China, P.R., Hong Kong SAR, and Macao SAR.
4/ Currently PRGT-eligible countries plus Zimbabwe.
5/ Updated 14th Review list to include countries that are PRGT-eligible and meet the current IDA per capita GNI cut-off of
US$1,215 (previously US$1,135) and twice that amount for small states, as defined by the IMF. Currently includes 36 member
countries.
Overall Increase 70% 115%
14th
General
Review
CQS based
Formula 1.2A1 A2
Advanced economies 57.6 50.3 54.5 53.5
Major advanced economies 43.4 36.7 40.5 39.6
United States 17.4 14.9 16.3 16.0
Japan 6.5 5.3 6.0 5.8
Germany 5.6 5.0 5.3 5.3
France 4.2 3.3 3.8 3.7
United Kingdom 4.2 3.4 3.9 3.8
Italy 3.2 2.5 2.9 2.8
Canada 2.3 2.1 2.2 2.2
Other advanced economies 14.3 13.6 14.0 13.9
Spain 2.0 1.8 1.9 1.9
Netherlands 1.8 1.9 1.9 1.9
Australia 1.4 1.5 1.4 1.5
Belgium 1.3 1.1 1.2 1.2
Switzerland 1.2 1.5 1.3 1.3
Sweden 0.9 0.8 0.9 0.9
Austria 0.8 0.7 0.8 0.8
Norway 0.8 0.7 0.7 0.7
Ireland 0.7 0.6 0.7 0.7
Denmark 0.7 0.6 0.7 0.6
Emerging Market and Developing Countries 2/ 42.4 49.7 45.5 46.5
Africa 4.4 3.6 4.4 4.3
South Africa 0.6 0.6 0.6 0.6
Nigeria 0.5 0.7 0.6 0.6
Asia 16.0 24.6 19.5 20.5
China 3/ 6.4 12.7 8.9 9.7
India 2.7 3.3 3.0 3.0
Korea, Republic of 1.8 2.1 1.9 2.0
Indonesia 1.0 1.4 1.1 1.2
Singapore 0.8 1.2 1.0 1.0
Malaysia 0.8 0.8 0.8 0.8
Thailand 0.7 0.9 0.8 0.8
Middle East, Malta and Turkey 6.7 6.8 6.7 6.7
Saudi Arabia 2.1 1.5 1.8 1.8
Turkey 1.0 1.1 1.0 1.1
Iran, I.R. of 0.7 0.8 0.8 0.8
Western Hemisphere 7.9 7.6 7.8 7.7
Brazil 2.3 2.4 2.4 2.4
Mexico 1.9 1.8 1.8 1.8
Venezuela, R.B. de 0.8 0.5 0.6 0.6
Argentina 0.7 0.7 0.7 0.7
Transition economies 7.2 7.2 7.2 7.2
Russia 2.7 2.7 2.7 2.7
Poland 0.9 0.9 0.9 0.9
Total 100.0 100.0 100.0 100.0
Memorandum items:
EU28 30.4 26.5 28.7 28.2
LICs 4/ 3.3 2.1 3.1 3.1
Updated 14th Review Poorest 5/ 1.7 1.1 1.8 1.8

QUOTAS—DATA UPDATE AND SIMULATIONS
44 INTERNATIONAL MONETARY FUND
Table 21. Illustration of Allocation Mechanisms: Formula 1.3 1/
(In percent)
Source: Finance Department
1/ All simulations show distributions based on the quota formula (i.e., selective increases) plus ad hoc increases where needed to
protect the shares of the poorest members.
2/ Including Czech Republic, Estonia, Korea, Latvia, Lithuania, Malta, Singapore, Slovak Republic, and Slovenia.
3/ Including China, P.R., Hong Kong SAR, and Macao SAR.
4/ Currently PRGT-eligible countries plus Zimbabwe.
5/ Updated 14th Review list to include countries that are PRGT-eligible and meet the current IDA per capita GNI cut-off of
US$1,215 (previously US$1,135) and twice that amount for small states, as defined by the IMF. Currently includes 36 member
countries.
Overall Increase 70% 115%
14th
General
Review
CQS based
Formula 1.3A1 A2
Advanced economies 57.6 50.0 54.3 53.3
Major advanced economies 43.4 36.8 40.6 39.7
United States 17.4 15.2 16.5 16.2
Japan 6.5 5.4 6.0 5.9
Germany 5.6 4.9 5.3 5.2
France 4.2 3.3 3.8 3.7
United Kingdom 4.2 3.4 3.9 3.7
Italy 3.2 2.5 2.9 2.8
Canada 2.3 2.1 2.2 2.2
Other advanced economies 14.3 13.1 13.8 13.6
Spain 2.0 1.8 1.9 1.9
Netherlands 1.8 1.8 1.8 1.8
Australia 1.4 1.5 1.4 1.5
Belgium 1.3 1.0 1.2 1.2
Switzerland 1.2 1.4 1.3 1.3
Sweden 0.9 0.8 0.9 0.9
Austria 0.8 0.7 0.8 0.7
Norway 0.8 0.7 0.7 0.7
Ireland 0.7 0.6 0.7 0.7
Denmark 0.7 0.5 0.6 0.6
Emerging Market and Developing Countries 2/ 42.4 50.0 45.7 46.7
Africa 4.4 3.6 4.4 4.3
South Africa 0.6 0.6 0.6 0.6
Nigeria 0.5 0.7 0.6 0.6
Asia 16.0 24.8 19.6 20.6
China 3/ 6.4 12.9 9.0 9.8
India 2.7 3.4 3.0 3.1
Korea, Republic of 1.8 2.1 1.9 1.9
Indonesia 1.0 1.4 1.2 1.2
Singapore 0.8 1.1 0.9 1.0
Malaysia 0.8 0.7 0.8 0.7
Thailand 0.7 0.9 0.8 0.8
Middle East, Malta and Turkey 6.7 6.8 6.7 6.8
Saudi Arabia 2.1 1.5 1.8 1.8
Turkey 1.0 1.1 1.0 1.1
Iran, I.R. of 0.7 0.8 0.8 0.8
Western Hemisphere 7.9 7.7 7.8 7.8
Brazil 2.3 2.5 2.4 2.4
Mexico 1.9 1.8 1.8 1.8
Venezuela, R.B. de 0.8 0.5 0.7 0.6
Argentina 0.7 0.7 0.7 0.7
Transition economies 7.2 7.1 7.2 7.2
Russia 2.7 2.8 2.7 2.7
Poland 0.9 0.9 0.9 0.9
Total 100.0 100.0 100.0 100.0
Memorandum items:
EU28 30.4 25.7 28.4 27.8
LICs 4/ 3.3 2.1 3.1 3.1
Updated 14th Review Poorest 5/ 1.7 1.1 1.8 1.8

QUOTAS—DATA UPDATE AND SIMULATIONS
INTERNATIONAL MONETARY FUND 45
Table 22. Illustration of Allocation Mechanisms: Formula 3.2.c 1/
(In percent)
Source: Finance Department
1/ All simulations show distributions based on the quota formula (i.e., selective increases) plus ad hoc increases where needed to
protect the shares of the poorest members.
2/ Including Czech Republic, Estonia, Korea, Latvia, Lithuania, Malta, Singapore, Slovak Republic, and Slovenia.
3/ Including China, P.R., Hong Kong SAR, and Macao SAR.
4/ Currently PRGT-eligible countries plus Zimbabwe.
5/ Updated 14th Review list to include countries that are PRGT-eligible and meet the current IDA per capita GNI cut-off of
US$1,215 (previously US$1,135) and twice that amount for small states, as defined by the IMF. Currently includes 36 member
countries.
Overall Increase 70% 115%
14th
General
Review
CQS based
Formula 3.2.cA1 A2
Advanced economies 57.6 49.8 54.3 53.2
Major advanced economies 43.4 38.0 41.0 40.3
United States 17.4 15.4 16.5 16.3
Japan 6.5 5.5 6.1 5.9
Germany 5.6 5.2 5.4 5.4
France 4.2 3.5 3.9 3.8
United Kingdom 4.2 3.6 3.9 3.9
Italy 3.2 2.6 2.9 2.9
Canada 2.3 2.2 2.3 2.3
Other advanced economies 14.3 11.8 13.2 12.9
Spain 2.0 1.8 1.9 1.9
Netherlands 1.8 1.3 1.6 1.5
Australia 1.4 1.6 1.5 1.5
Belgium 1.3 0.8 1.1 1.0
Switzerland 1.2 1.2 1.2 1.2
Sweden 0.9 0.8 0.9 0.9
Austria 0.8 0.7 0.8 0.7
Norway 0.8 0.7 0.8 0.7
Ireland 0.7 0.4 0.6 0.5
Denmark 0.7 0.5 0.6 0.6
Emerging Market and Developing Countries 2/ 42.4 50.2 45.7 46.8
Africa 4.4 3.7 4.4 4.4
South Africa 0.6 0.6 0.6 0.6
Nigeria 0.5 0.7 0.6 0.6
Asia 16.0 24.7 19.5 20.6
China 3/ 6.4 13.0 9.1 9.9
India 2.7 3.4 3.0 3.1
Korea, Republic of 1.8 2.2 2.0 2.0
Indonesia 1.0 1.4 1.2 1.2
Singapore 0.8 0.7 0.8 0.7
Malaysia 0.8 0.8 0.8 0.8
Thailand 0.7 1.0 0.8 0.8
Middle East, Malta and Turkey 6.7 6.8 6.8 6.8
Saudi Arabia 2.1 1.6 1.9 1.8
Turkey 1.0 1.2 1.1 1.1
Iran, I.R. of 0.7 0.8 0.8 0.8
Western Hemisphere 7.9 7.8 7.8 7.8
Brazil 2.3 2.5 2.4 2.4
Mexico 1.9 1.8 1.8 1.8
Venezuela, R.B. de 0.8 0.5 0.7 0.6
Argentina 0.7 0.7 0.7 0.7
Transition economies 7.2 7.2 7.2 7.2
Russia 2.7 2.8 2.7 2.8
Poland 0.9 1.0 0.9 0.9
Total 100.0 100.0 100.0 100.0
Memorandum items:
EU28 30.4 25.3 28.2 27.5
LICs 4/ 3.3 2.2 3.1 3.1
Updated 14th Review Poorest 5/ 1.7 1.1 1.8 1.8

QUOTAS—DATA UPDATE AND SIMULATIONS
46 INTERNATIONAL MONETARY FUND
Table 23. Illustration of Allocation Mechanisms: Formula 3.3.c 1/
(In percent)
Source: Finance Department
1/ All simulations show distributions based on the quota formula (i.e., selective increases) plus ad hoc increases where needed to
protect the shares of the poorest members.
2/ Including Czech Republic, Estonia, Korea, Latvia, Lithuania, Malta, Singapore, Slovak Republic, and Slovenia.
3/ Including China, P.R., Hong Kong SAR, and Macao SAR.
4/ Currently PRGT-eligible countries plus Zimbabwe.
5/ Updated 14th Review list to include countries that are PRGT-eligible and meet the current IDA per capita GNI cut-off of
US$1,215 (previously US$1,135) and twice that amount for small states, as defined by the IMF. Currently includes 36 member
countries.
Overall Increase 70% 115%
14th
General
Review
CQS based
Formula 3.3.cA1 A2
Advanced economies 57.6 49.5 54.2 53.1
Major advanced economies 43.4 38.0 41.0 40.3
United States 17.4 15.6 16.6 16.4
Japan 6.5 5.6 6.1 6.0
Germany 5.6 5.1 5.4 5.3
France 4.2 3.4 3.9 3.8
United Kingdom 4.2 3.5 3.9 3.8
Italy 3.2 2.6 2.9 2.8
Canada 2.3 2.2 2.3 2.2
Other advanced economies 14.3 11.6 13.1 12.8
Spain 2.0 1.8 1.9 1.9
Netherlands 1.8 1.2 1.6 1.5
Australia 1.4 1.6 1.5 1.5
Belgium 1.3 0.8 1.1 1.0
Switzerland 1.2 1.1 1.2 1.2
Sweden 0.9 0.8 0.9 0.9
Austria 0.8 0.6 0.7 0.7
Norway 0.8 0.7 0.7 0.7
Ireland 0.7 0.4 0.6 0.5
Denmark 0.7 0.5 0.6 0.6
Emerging Market and Developing Countries 2/ 42.4 50.5 45.8 46.9
Africa 4.4 3.7 4.4 4.4
South Africa 0.6 0.6 0.6 0.6
Nigeria 0.5 0.7 0.6 0.6
Asia 16.0 24.9 19.6 20.7
China 3/ 6.4 13.2 9.1 10.0
India 2.7 3.5 3.0 3.1
Korea, Republic of 1.8 2.2 1.9 2.0
Indonesia 1.0 1.5 1.2 1.2
Singapore 0.8 0.6 0.7 0.7
Malaysia 0.8 0.7 0.8 0.8
Thailand 0.7 1.0 0.8 0.8
Middle East, Malta and Turkey 6.7 6.9 6.8 6.8
Saudi Arabia 2.1 1.5 1.9 1.8
Turkey 1.0 1.2 1.1 1.1
Iran, I.R. of 0.7 0.9 0.8 0.8
Western Hemisphere 7.9 7.9 7.9 7.9
Brazil 2.3 2.6 2.4 2.4
Mexico 1.9 1.8 1.8 1.8
Venezuela, R.B. de 0.8 0.5 0.7 0.6
Argentina 0.7 0.7 0.7 0.7
Transition economies 7.2 7.2 7.2 7.2
Russia 2.7 2.8 2.8 2.8
Poland 0.9 0.9 0.9 0.9
Total 100.0 100.0 100.0 100.0
Memorandum items:
EU28 30.4 24.7 28.0 27.2
LICs 4/ 3.3 2.2 3.1 3.1
Updated 14th Review Poorest 5/ 1.7 1.1 1.8 1.8

QUOTAS—DATA UPDATE AND SIMULATIONS
INTERNATIONAL MONETARY FUND 47
Table 24. Illustration of Allocation Mechanisms: Formula 1.3, Includes 5 percent Ad Hoc
Distribution based on Voluntary Financial Contributions 1/2/
(In percent)
Source: Finance Department
1/ All simulations show distributions based on the quota formula (i.e., selective increases) plus ad hoc increases where needed to
protect the shares of the poorest members and with 5 percent of the overall increase allocated as ad hoc increases based on
voluntary financial contributions.
2/ Voluntary financial contributions are based on VFCS II, which is calculated aggregate measure with weights of 0.3 for NAB, 0.3
for 2012 Bilateral Borrowing Agreements, 0.2 for PRGT loans and subsidies combined, and 0.2 for Capacity Development. See
Annex IV for details.
3/ Including Czech Republic, Estonia, Korea, Latvia, Lithuania, Malta, Singapore, Slovak Republic, and Slovenia.
4/ Including China, P.R., Hong Kong SAR, and Macao SAR.
5/ Currently PRGT-eligible countries plus Zimbabwe.
6/ Updated 14th Review list to include countries that are PRGT-eligible and meet the current IDA per capita GNI cut-off of
US$1,215 (previously US$1,135) and twice that amount for small states, as defined by the IMF. Currently includes 36 member
countries.
Overall Increase 70% 115%
Ad Hoc Increase based on Financial Contribution 5% 5%
14th
General
Review
CQS based on
Formula 1.3A1 A2
Advanced economies 57.6 50.0 54.9 54.1
Major advanced economies 43.4 36.8 41.0 40.3
United States 17.4 15.2 16.3 15.9
Japan 6.5 5.4 6.4 6.3
Germany 5.6 4.9 5.3 5.3
France 4.2 3.3 3.9 3.8
United Kingdom 4.2 3.4 3.9 3.8
Italy 3.2 2.5 2.9 2.9
Canada 2.3 2.1 2.3 2.2
Other advanced economies 14.3 13.1 13.9 13.8
Spain 2.0 1.8 1.9 1.9
Netherlands 1.8 1.8 1.9 1.9
Australia 1.4 1.5 1.4 1.5
Belgium 1.3 1.0 1.2 1.2
Switzerland 1.2 1.4 1.3 1.3
Sweden 0.9 0.8 0.9 0.9
Austria 0.8 0.7 0.8 0.7
Norway 0.8 0.7 0.8 0.8
Ireland 0.7 0.6 0.7 0.6
Denmark 0.7 0.5 0.7 0.6
Emerging Market and Developing Countries 3/ 42.4 50.0 45.1 45.9
Africa 4.4 3.6 4.3 4.3
South Africa 0.6 0.6 0.6 0.6
Nigeria 0.5 0.7 0.6 0.6
Asia 16.0 24.8 19.3 20.3
China 4/ 6.4 12.9 8.9 9.6
India 2.7 3.4 3.0 3.1
Korea, Republic of 1.8 2.1 1.9 1.9
Indonesia 1.0 1.4 1.1 1.2
Singapore 0.8 1.1 0.9 1.0
Malaysia 0.8 0.7 0.7 0.7
Thailand 0.7 0.9 0.8 0.8
Middle East, Malta and Turkey 6.7 6.8 6.7 6.7
Saudi Arabia 2.1 1.5 1.9 1.8
Turkey 1.0 1.1 1.0 1.0
Iran, I.R. of 0.7 0.8 0.8 0.8
Western Hemisphere 7.9 7.7 7.7 7.6
Brazil 2.3 2.5 2.4 2.4
Mexico 1.9 1.8 1.8 1.8
Venezuela, R.B. de 0.8 0.5 0.6 0.6
Argentina 0.7 0.7 0.7 0.7
Transition economies 7.2 7.1 7.1 7.0
Russia 2.7 2.8 2.7 2.7
Poland 0.9 0.9 0.9 0.9
Total 100.0 100.0 100.0 100.0
Memorandum items:
EU28 30.4 25.7 28.7 28.2
LICs 5/ 3.3 2.1 3.1 3.1
Updated 14th Review Poorest 6/ 1.7 1.1 1.8 1.8
QUOTAS—DATA UPDATE AND SIMULATIONS
48 INTERNATIONAL MONETARY FUND
UPDATING COUNTRY GROUPINGS
35. The current country groupings used for quota work date back to the 11th Review. The
current groupings were derived from earlier WEO classifications at the time and have not been
updated since 1998, while there have been several modifications to country classifications used in
the WEO. The main reason for maintaining the current country groupings was to facilitate
comparisons in the cumulative impact of the quota reform process initiated in 2006—including the
cumulative shifts of quota share from AEs to EMDCs—in a way that is not affected by country
reclassifications. The Board considered updating the country classifications used for quotas early in
the 14th Review but there was general support at that time to maintain the current classifications to
ensure continuity with previous quota papers.25
36. The country classifications used for quotas have become increasingly outdated. Since
the 11th Review, several modifications have been introduced to the WEO country groups, but these
have not been reflected in the country groups used for quota purposes. In particular, Czech
Republic, Estonia, Korea, Latvia, Lithuania, Malta, Singapore, Slovak Republic, and Slovenia are all
now classified as advanced economies in the current WEO but are still included in EMDCs for the
purposes of quota work (see Annex II).
37. With a new round of quota discussions now getting underway, staff believes this
would be an appropriate time to align the country groups with the current WEO classification.
Aligning the country groups used for quota purposes with the WEO classification would make them
consistent with those used by the Fund for most other purposes, and provide a more meaningful
basis for country comparisons and organizing the data. It would also signal recognition that country
groupings are dynamic and that countries can be expected to “graduate” over time from the EMDC
group to the AE group. While this would make it harder to measure cumulative changes in the
shares of major country groups over time, the dynamic nature of country groupings also means that
their importance as an indicator of governance reform should not be overstated.
38. The immediate impact of such a realignment is discussed in Annex II. Aligning the
country groups used for quota purposes with the current WEO classification would move
3.7 percentage points of AQS from EMDCs to AEs, and the corresponding shift of CQS from EMDCs
to AEs would be 4.5 percentage points (see Table 25). Staff proposes that starting from the next
quota paper, the country groups should be aligned with the current WEO groupings. The WEO
country classifications are likely to continue to evolve over time and, in the event of future changes,
staff would come back to the Board with a proposal on whether and when to further update the
country groups used for quota purposes.
25 This issue was also discussed in the context of QFR; see Appendix I in Quota Formula Review-Initial Considerations
Supplement (2/10/12).

QUOTAS—DATA UPDATE AND SIMULATIONS
INTERNATIONAL MONETARY FUND 49
Table 25. Changes in CQS resulting from WEO Classification
Source: Finance Department
1/ Includes South Sudan and Nauru which became members on April 18, 2012 and April 12, 2016, respectively; reflects their
quota increases proposed in their respective membership resolutions after the effectiveness of the 14th Review.
2/ Based on the following formula: CQS = (0.50*GDP + 0.30*Openness +0.15*Variability + 0.05*Reserves)^K. GDP blend using 60
percent market and 40 percent PPP exchange rates. K is a compression factor of 0.95. The 2016 data update covers data through
end-2014.
3/ World Economic Outlook April 2016.
4/ Including Czech Republic, Estonia, Korea, Latvia, Lithuania, Malta, Singapore, Slovak Republic, and Slovenia.
5/ The group name under WEO classification is in bold letter. The group name under current classification is in parentheses.
6/ Comprises the WEO categories "Commonwealth of Independent States" and "Emerging and Developing Europe." This
grouping is broadly comparable to the Transition Economies. Includes Turkey.
CONCLUDING REMARKS
39. This paper seeks to provide a basis for an informal discussion of several issues relating
to the 15th Review. It presents the results of updating the quota database by one year to 2014, and
also updates the illustrative simulations presented in previous quota data update papers of possible
reforms of the quota formula based on the outcome of the QFR in 2013. In addition, it provides
some initial simulations to illustrate how possible changes in the quota formula might feed through
into shifts in actual quota shares in the context of the 15th Review. The paper also proposes to
update the current country groupings used in quota work, and presents an updated list of the
poorest members based on the definition used in the 14th Review along with available alternative
options (see Annex III) as well as updated calculations of members’ voluntary financial contributions
(Annex IV).
40. In order to help guide future staff work, Directors’ views on the following issues would
be helpful:
What do Directors see as the relative merits of alternative possible reforms of the quota formula
in light of the latest data update, and have views changed since the previous data update?
Country Groups according to WEO 3/Current
Classification
WEO
Classification
Change resulting
from WEO
classification
Current
Classification
WEO
Classification
Change resulting
from WEO
classification
Advanced economies 4/ 57.6 61.3 3.7 50.7 55.2 4.5
Major advanced economies 43.4 43.4 0.0 36.1 36.1 0.0
Other advanced economies 14.3 17.9 3.7 14.6 19.1 4.5
Emerging Market and Developing Countries 5/ 42.4 38.7 -3.7 49.3 44.8 -4.5
Sub-Saharan Africa (Africa) 4.4 3.6 -0.9 3.7 2.8 -0.9
Developing Asia (Asia) 16.0 13.0 -3.1 23.4 19.8 -3.7
Middle East, North Africa, Afghanistan and
Pakistan (Middle East, Malta & Turkey)6.7 7.1 0.4 7.2 7.4 0.2
Latin America and the Caribbean (Western
Hemisphere) 7.9 7.9 7.4 7.4
CIS and Emerging and Developing Europe
(Transition economies) 6/ 7.2 7.2 0.0 7.6 7.5 -0.1
Total 100.0 100.0 100.0 100.0
14th Review Quota Shares 1/ Calculated Quota Shares (2014) 2/

QUOTAS—DATA UPDATE AND SIMULATIONS
50 INTERNATIONAL MONETARY FUND
Should future staff work on the formula continue to be guided by the outcome of the QFR, or
are there areas where Directors believe a different approach could help achieve a broad
consensus?
More generally, do Directors have any suggestions on how best to bridge the remaining
differences of view and reach agreement on a new quota formula?
What considerations should guide future work on realigning shares under the 15th Review?
Would it be helpful to seek agreement on a target for the overall shift in shares and if so, do
Directors have any preliminary thoughts on how to define such a target?
Do Directors agree that the country groups used for quota purposes should be aligned with the
current WEO country groups, and that country groupings could be reviewed again in the future
when WEO groupings are changed?
What are Directors’ views on the alternative measures of voluntary financial contributions
presented in this paper, and how to define the poorest members for the purpose of protecting
their voice and representation?

QUOTAS—DATA UPDATE AND SIMULATIONS
INTERNATIONAL MONETARY FUND 51
Annex I. Quota Formula Variables
This annex presents an overview of the variables in the current quota formula, including the rationale
for their inclusion, and updates previous analysis of their distributional effects using the latest data.
A. Overview of Quota Variables
1. The quota formula seeks to capture the multiple roles of quotas. These include their key
role in determining the Fund’s financial resources, their role in decisions on members’ access to
Fund resources, and their close link with members’ voting rights. Thus, the formula has typically
sought to capture members’ relative positions in the world economy, their financial strength and
ability to contribute usable resources, as well as their potential need to borrow from the Fund. Some
individual quota variables are intended to capture more than one aspect.
2. The current quota formula was agreed in 2008 and includes four variables and a
compression factor. The four variables are GDP (measured as a blend of market and PPP GDP),
openness, variability, and reserves. All of them are expressed in shares of global totals, with the
variables assigned weights totaling to 1.0. The formula also includes a compression factor that
reduces dispersion in calculated quota shares.1 Figure I.1 presents the calculated quota shares of
major country groups and their shares in each variable in the quota formula, based on the latest
data update. A few points are worth noting: (i) the aggregate shares of AEs and EMDCs in the GDP
blend variable are broadly equal; (ii) AEs have a larger share in openness and variability, but this
reflects the relatively large share of the group of other advanced economies (more than double their
share in GDP); (iii) EMDCs have a much larger share in the reserves variable; and (iv) the aggregate
group shares in openness and variability are virtually identical.
1 The current formula is CQS = (0.50*GDP + 0.30*Openness +0.15*Variability + 0.05*Reserves)^K. GDP is blended
using 60 percent market and 40 percent PPP exchange rates; K is a compression factor of 0.95. For more details, see
Box 2 in the main text of the paper.

QUOTAS—DATA UPDATE AND SIMULATIONS
52 INTERNATIONAL MONETARY FUND
Figure I.1. Shares of Major Country Groups in Each Quota Variable
Source: Finance Department
3. The quota variables are all partly related to economic size, and therefore are quite
highly correlated in most cases. The correlations between variables are shown in Table I.1. At the
aggregate level, the correlations between GDP, openness, and variability are relatively high, while
shares in reserves are less correlated with the other variables. This is particularly the case for AEs,
where there is a very low correlation between reserves and the other variables. Excluding the ten
largest members (by GDP blend share), the correlations between the GDP blend variable and the
other variables in the quota formula decline significantly, while the correlation between openness
and variability remains very high.
36 41 38 36
15
15 9 20 20
8
49 5043 44
77
0
10
20
30
40
50
60
70
80
90
100
CQS GDP Blend Openness Variability Reserves
Major AES Other AEs EMDCs

QUOTAS—DATA UPDATE AND SIMULATIONS
INTERNATIONAL MONETARY FUND 53
Table I.1. Correlation between Quota Variables
Source: Finance Department.
1/ Given the heterogeneity of data and differing distributions, it is possible for correlations for the full sample to
fall outside of the range for the two sub samples.
2/ Large members in terms of share of GDP blend (60 percent market GDP and 40 percent PPP GDP).
4. These effects can be observed also in the relationship between market GDP shares and
shares of the other quota formula variables. Figure I.2 plots this relationship using the latest data
through 2014. As can be seen from the upper left-hand side (LHS) panel, the relationship between
members’ shares in the GDP PPP variable and market GDP is reasonably close for most members.
However, there is a clear distinction between advanced economies and EMDCs: all AEs have higher
shares in market GDP than in PPP GDP, while the converse is true for almost all EMDCs. The
dispersion is wider for openness and variability (upper RHS and lower LHS), where a number of
smaller AEs have significantly higher shares than in market GDP (and conversely, some larger AEs
have larger shares in GDP). A marked differentiation among country groups is evident for reserves,
Advanced Economies
Blend GDP Openness Variability Reserves
Blend GDP 1.00
Openness 0.92 1.00
Variability 0.96 0.98 1.00
Reserves 0.27 0.24 0.32 1.00
EMDCs
Blend GDP Openness Variability Reserves
Blend GDP 1.00
Openness 0.96 1.00
Variability 0.94 0.97 1.00
Reserves 0.95 0.94 0.93 1.00
All Countries 1/
Blend GDP Openness Variability Reserves
Blend GDP 1.00
Openness 0.93 1.00
Variability 0.94 0.98 1.00
Reserves 0.62 0.57 0.55 1.00
All Members excluding Top 10 2/
Blend GDP Openness Variability Reserves
Blend GDP 1.00
Openness 0.78 1.00
Variability 0.76 0.92 1.00
Reserves 0.55 0.55 0.66 1.00

QUOTAS—DATA UPDATE AND SIMULATIONS
54 INTERNATIONAL MONETARY FUND
with several large EMDCs having higher shares in reserves in relation to market GDP, while the
reverse is true for most AEs (lower RHS).
Figure I.2. Relationship between Quota Variables and Market GDP share (2016 Data
Update)
Source: Finance Department.
1/ The dispersion is given by the average of the following measure for each point: [Max (x,y) – Min (x,y)] / [Max
(x,y) + Min (x,y)].
0
1
2
3
0 1 2 3
ln(1
+Mkt
GD
P s
har
e)
ln(1+PPP GDP share)
PPP GDPAdvanced Economies
EMDCs
Dispersion1/: 0.181
0
1
2
3
0 1 2 3
ln(1+Openness share)
Openness
Dispersion: 0.221
0
1
2
3
0 1 2 3
ln(1
+Mkt
GD
P s
har
e)
ln(1+Variability share)
Variability
Dispersion: 0.306
0
1
2
3
0 1 2 3ln(1+Reserves share)
Reserves
Dispersion: 0.314

QUOTAS—DATA UPDATE AND SIMULATIONS
INTERNATIONAL MONETARY FUND 55
B. Variables in the Quota Formula
GDP Blend
5. GDP provides a comprehensive measure of economic size and is relevant for the
multiple roles of quotas. Market GDP is viewed as the single most relevant indicator of a member’s
ability to contribute to the Fund’s finances, though it is not the only such measure. It is also relevant
to a member’s potential demand for Fund resources, and capacity to repay. PPP GDP has been
viewed as a relevant measure of a members’ weight in the global economy from the perspective of
the Fund’s non-financial activities. The GDP blend variable also captures dynamism, as reflected in
the rising share of EMDCs in the global total for this variable in light of their more rapid economic
growth. As Figure I.3 shows, the distribution of members’ ratios of nominal PPP GDP relative to
market GDP has a relatively even downward slope with most EMDCs having a ratio above 1 and
most AEs having a ratio below 1. The statistical measure of skewness is very low.
Figure I.3. Ratio of PPP GDP to Market GDP
Source: Finance Department
6. Relative to market GDP, most EMDCs and LICs benefit from PPP GDP, and the relative
benefits are larger for countries with lower per capita incomes. All but one country in the
bottom quartile of the income distribution benefits from a higher weight on PPP GDP relative to
market GDP, and they also record the largest relative gains (see Table I.2). This pattern is to be
expected, as PPP GDP seeks to capture the output of economies, and the market price of many non-
tradable goods tends to be lower in countries with lower per capita incomes, reflecting in part low
wage costs in services that are not tradable. However, there are no significant differences in terms of
0.0
0.5
1.0
1.5
2.0
2.5
3.0
3.5
4.0
EMDCs
AEs
Top 15 Countries: Mauritania, Myanmar, Pakistan, India, The Gambia, Nepal,
Malaw i, Uganda, Egypt, Madagascar, Bangladesh, Lao P.D.R., Cambodia, Sri Lanka, Bhutan.
Mean = 1.86Median = 1.81Skewness = 0.42
Ratio of 1.5 or more: 130 countries
Ratio of 1 or more: 162 countries
Ratio of 2 or more: 76 countries

QUOTAS—DATA UPDATE AND SIMULATIONS
56 INTERNATIONAL MONETARY FUND
countries that benefit from PPP GDP when countries are grouped by size of their market GDP,
except the top quartile.
Table I.2. Countries that Benefit from PPP GDP
Source: Finance Department
1/ Each quartile includes 47 countries, except the bottom quartile that includes 48 countries.
2/ Average or median ratio among the countries which have ratios greater than 1.
7. Current PPP GDP data are based on the 2011 International Comparison Program (ICP)
global estimates of purchasing power parity rates. The 2011 PPP rates are based on broader
country coverage than the 2005 estimates that had been used until then, as well as further
methodological improvements. Incorporation of these estimates led to a markedly higher aggregate
share of EMDCs in global PPP GDP (58.1 percent vs. 52.8 percent on the basis of the 2005 ICP data).
As a consequence, the CQS of EMDCs increased by 1.0 percentage point.2
8. The current GDP blend variable represented a difficult compromise. PPP GDP was
introduced into the formula for the first time as part of the 2008 reform. It was given a 40 percent
weight in the GDP blend, taking account of the central role of quotas in the Fund’s financial
operations for which market GDP is the most relevant indicator. It was also agreed to include PPP
GDP (and compression) in the formula for a period of 20 years, after which the scope for retaining
them should be reviewed. Since the 2008 reforms, Directors have continued to express diverging
views on the relative importance of market vs. PPP GDP in the formula. Some have favored a higher
or lower weight of PPP GDP in the blend variable, while others have argued that, given the difficult
compromise reached in 2008, the weights in the blend should not be reopened.
Openness
9. Openness has been viewed as an indicator of a member’s integration and stake in the
global economy. The basic premise underlying its inclusion in the quota formula is that countries that
are relatively more open to trade and financial flows may have a greater stake in promoting global
economic and financial stability. Openness may also have a bearing on a member’s ability and
willingness to make financial contributions to the Fund as well as on its potential need for Fund
resources. However, some question the validity of these arguments, noting that larger economies
2 See Quota Formula-Data Update and Further Considerations (7/2/14).
(continued)
Top
Quartile3rd 2nd
Bottom
Quartile
Top
Quartile3rd 2nd
Bottom
QuartileAE (26)
EMDC
excl. LIC
(93)
LIC (70) Total
Number of countries who
benefit (ratio >1)24 42 43 36 16 44 38 47 0 85 60 145
Median 2/ 1.4 1.6 1.6 1.4 1.2 1.3 1.7 1.8 1.4 1.7 1.6
Average 2/ 1.6 1.6 1.7 1.6 1.2 1.4 1.7 1.9 1.5 1.8 1.6
By Size (Market GDP) 1/ By Income (GDP per Capita) 1/ By Grouping
PPP / Market GDP Shares

QUOTAS—DATA UPDATE AND SIMULATIONS
INTERNATIONAL MONETARY FUND 57
tend to be less open but still have major stakes in the global economy. They also argue that the
current gross measure leads to double counting of cross border flows which can exaggerate the
importance of openness,3 and that intra-currency union flows should be excluded. Previous staff
work has also highlighted the very large boost that the current openness variable provides for some
countries, resulting in CQS that appear large in relation to other measures of their relative economic
positions.
10. Key characteristics of the openness variable noted in previous papers include the
following (Table I.3):
Openness benefits many smaller economies. More than two-thirds of the membership
(131 countries based on the latest data update) gain from the inclusion of openness in the
formula. The number of countries that benefit from openness is inversely related to size.
The gains from openness are positively related to income. Over 90 percent of countries
(43 out of 47) in the top quartile in terms of per capita income gain from openness,
compared with less than half (22 countries) in the bottom quartile. Among the gainers, high
income countries also gain more on average than low income countries.
These results are also reflected in the distribution of openness shares across major
country groupings (Figure I.1 in the previous section). The main gainers from openness at
the aggregate level are small advanced countries, whose openness share on average is
roughly double their share in the GDP blend. Smaller EMDCs in aggregate gain modestly
from openness (though some individual countries have large gains), while other country
groups, including LICs as a whole, do not gain from openness.
Table I.3. Countries that Benefit from Openness
Source: Finance Department
1/ Each quartile includes 47 countries, except the bottom quartile that includes 48 countries.
2/ Average or median ratio among the countries which have ratios greater than 1.
11. The distribution of members’ shares in openness relative to GDP is highly skewed.
While the median ratio of openness to market GDP for the membership as a whole is 1, 12 countries
have ratios greater than 2 (with the highest being above 10) and 37 have ratios above 1.5 (Figure
3 Available trade data on a value added basis are not sufficiently comprehensive to be used in quota calculations
(see, for example, Quota Formula—Data Update and Further Considerations (6/6/13)).
Top
Quartile3rd 2nd
Bottom
Quartile
Top
Quartile3rd 2nd
Bottom
QuartileAE (26)
EMDC
excl. LIC
(93)
LIC (70) Total
Number of countries
who benefit (ratio >1)26 29 36 40 43 31 35 22 23 64 44 131
Median 2/ 1.5 1.5 1.4 1.8 1.9 1.5 1.5 1.3 1.6 1.5 1.5 1.5
Average 2/ 2.0 2.2 1.7 2.1 2.7 1.7 1.8 1.5 2.9 1.8 1.8 2.0
By Size (Market GDP) 1/ By Income (GDP per Capita) 1/ By Grouping
Openness / GDP Blend Shares

QUOTAS—DATA UPDATE AND SIMULATIONS
58 INTERNATIONAL MONETARY FUND
I.4a). In terms of openness relative to GDP blend shares, roughly 60 percent of members have shares
of less than 1.5. However, 36 members have a share of openness that is more than double their
share in the GDP blend variable, and one member has ratio of openness to GDP blend share above
19 (Figure I.4b). The combined effect of openness and variability, which have similar highly skewed
distributions (see below) and a collective weight in the formula of 45 percent, generates very large
CQS for some countries relative to their GDP shares.
Figure I.4a. Ratio of Openness to Market GDP
Source: Finance Department
Figure I.4b. Ratio of Openness Share to GDP Blend Share
Source: Finance Department
0
3
6
EMDCs
AEs
Top 15 Countries: Luxembourg, Malta,Singapore, San Marino, Tuvalu, Liberia,
Ireland, Marshall Islands, Lesotho,Netherlands, Seychelles, Hungary, Cyprus, Maldives, Belgium.
Mean = 1.18Median = 1.00Skewness = 6.48
Ratio of 1.5 or more: 37 countries
Ratio of 1 or more: 94 countries
Ratio of 2 or more: 12 countries
Luxembourg 11.24
0
2
4
6
8
EMDCs
AEs
Top 15 Countries: Luxembourg, Malta, San Marino, Singapore, Tuvalu,
Ireland, Marshall Islands, Netherlands, Liberia, Belgium, Kiribati, Micronesia, Cyprus, Nauru, Sw itzerland.
Mean = 1.61 Median = 1.30Skewness = 7.24
Ratio of 1.5 or more: 73
Ratio of 1 or more: 131 countries
Luxembourg 19.45
Ratio of 2 or more: 36 countries

QUOTAS—DATA UPDATE AND SIMULATIONS
INTERNATIONAL MONETARY FUND 59
12. Previous staff work has explored options to address these issues. One approach is to
maintain the current definition of openness but to modestly lower its weight in the formula. If
combined with dropping variability, such an approach would significantly moderate the overall
impact on CQS of the highly skewed distribution of openness (and variability). Staff has also
explored the possibility of introducing a cap on the overall boost that individual countries can
receive from openness. Two types of caps have been considered: one based on capping the
absolute level of openness in relation to market GDP (absolute cap) and the second based on
capping the ratio of openness to GDP blend shares (shares cap).4 Both approaches require an
element of judgment in determining where to set the cap, and also add some complexity to the
calculations. Table I.4 updates earlier calculations to illustrate the impact of capping openness. The
thresholds are the same as in the June 2015 paper.5 Further work to refine the thresholds would be
needed if there is interest in pursuing such an approach.
13. Table I.4 also updates previous estimates of the impact of excluding intra-currency
union trade.6 Staff has explored this idea on several occasions in the past, and noted conceptual
and practical issues with such an approach.7 At a conceptual level, the euro area crisis highlighted
that balance of payments crises can also occur at the intra-currency union level and the importance
of focusing on each member’s external position. Also, potential distortions associated with cross-
border flows arise whenever there is vertical integration in the production process and are not
limited to currency unions, though the existence of a currency union may contribute to the growth
of such flows. At a practical level, available data only cover merchandise trade and are not available
on a comprehensive basis for intra-currency union services flows.8 Also, except for the euro area,
only very few member countries of currency unions report data on intra-currency union trade, and
such an approach is not able to address the issue of relatively large openness shares of financial
centers.
4 Staff also explored the approach of compressing the openness ratio. See Quota Formula – Data Update and Further
Considerations – Annexes (6/6/13), Annex III for a detailed discussion.
5 In the June 2013 paper, the 1.7 cap on the ratio of the openness share to GDP blend share was equivalent to the
75th percentile of the distribution of this ratio. In the July 2014 paper and June 2015 paper, the 1.8 cap was applied to
maintaining the cap at a level broadly corresponding to the top quartile of the distribution based on the updated
data. Based on the current data, 1.8 would be close to the 76th percentile (1.7 would be equal to the 74th percentile).
6 Staff has presented the results of excluding intra-currency union trade as part of the annual update of additional
quota variables.
7 For example, see Quotas—Updated Calculations and Quota Variables (8/28/09), Quota Formula Review—Additional
Considerations—Annexes (9/5/12), and Quota Formula Review—Data Update and Issues (8/17/11).
8 The data on intra-currency union trade in goods is obtained from the IMF’s Direction of Trade database. These data
include all trade in goods, including goods for processing gross flows, while the data underlying openness is on a
BPM6 basis, including in trade flows only the processing fees (services). For the euro area countries as well as the
other currency unions, no adjustment of goods for processing was made due to data constraints. Data on intra-
currency union services flows are not fully available and thus no adjustments are made for these flows.

QUOTAS—DATA UPDATE AND SIMULATIONS
60 INTERNATIONAL MONETARY FUND
Table I.4. Openness Shares Under Caps and Excluding Intra Currency Union Trade 1/
(In percent)
Source: Finance Department
1/ Shading indicates countries with capped openness shares or excluding intra currency union trade lower than their original
openness shares.
2/ These correspond to the thresholds on absolute ratios of openness to market GDP of 2.19, 1.62, and 1.35 for the 95th
, 85th
and 75th
percentile caps, respectively.
3/ Including Czech Republic, Estonia, Korea, Latvia, Lithuania, Malta, Singapore, Slovak Republic and Slovenia.
4/ Including China, P.R., Hong Kong SAR, and Macao SAR.
5/ Currently PRGT-eligible countries plus Zimbabwe.
Openness
Excluding
2.0 1.8 1.5 95th 2/ 85th 2/ 75th 2/
Intra
Currency
Union
Advanced economies 57.29 56.12 55.94 55.36 57.32 56.93 56.91 53.86 50.46
Major advanced economies 37.66 41.03 41.57 42.13 38.61 39.50 40.40 36.48 41.01
United States 12.56 13.68 13.93 14.91 12.87 13.17 13.47 13.67 19.82
Japan 4.16 4.53 4.61 4.94 4.26 4.36 4.46 4.53 5.93
Germany 7.27 7.92 7.86 6.55 7.45 7.62 7.79 5.66 4.37
France 4.07 4.43 4.51 4.80 4.17 4.27 4.36 3.06 3.20
United Kingdom 4.37 4.77 4.85 4.72 4.48 4.59 4.69 4.76 3.15
Italy 2.75 2.99 3.05 3.26 2.82 2.88 2.95 2.09 2.51
Canada 2.49 2.71 2.76 2.95 2.55 2.61 2.67 2.71 2.04
Other advanced economies 19.63 15.09 14.37 13.22 18.71 17.43 16.51 17.38 9.45
Spain 1.99 2.17 2.21 2.36 2.04 2.09 2.13 1.50 1.70
Netherlands 3.75 1.98 1.78 1.49 3.74 2.82 2.41 2.85 0.99
Australia 1.46 1.59 1.61 1.73 1.49 1.53 1.56 1.58 1.61
Belgium 1.91 1.19 1.07 0.90 1.96 1.71 1.46 1.00 0.60
Switzerland 2.19 1.45 1.30 1.09 2.25 2.26 1.93 2.39 0.72
Sweden 1.15 1.24 1.11 0.93 1.18 1.21 1.23 1.25 0.62
Austria 1.01 0.98 0.88 0.73 1.03 1.05 1.08 0.66 0.49
Norway 0.82 0.89 0.91 0.81 0.84 0.86 0.88 0.89 0.54
Ireland 1.23 0.55 0.50 0.41 1.04 0.78 0.67 1.20 0.28
Denmark 0.76 0.73 0.65 0.55 0.78 0.80 0.82 0.83 0.36
Luxembourg 1.31 0.13 0.12 0.10 0.26 0.20 0.17 1.36 0.07
Emerging Market and Developing Countries 3/ 42.71 43.88 44.06 44.64 42.68 43.07 43.09 46.14 49.54
Africa 2.80 3.00 3.03 3.14 2.86 2.90 2.94 3.03 3.26
South Africa 0.50 0.55 0.56 0.60 0.51 0.53 0.54 0.55 0.55
Nigeria 0.43 0.46 0.47 0.51 0.44 0.45 0.46 0.46 0.79
Asia 21.23 21.45 21.63 21.85 20.73 20.85 20.97 23.11 25.77
China 4/ 9.76 10.64 10.83 11.59 10.01 10.24 10.47 10.63 14.42
India 2.09 2.28 2.32 2.49 2.15 2.20 2.25 2.28 4.19
Korea 2.64 2.88 2.93 2.56 2.71 2.77 2.83 2.88 1.71
Indonesia 0.84 0.91 0.93 0.99 0.86 0.88 0.90 0.91 1.70
Singapore 2.29 0.81 0.73 0.61 1.31 0.99 0.84 2.49 0.41
Malaysia 0.97 1.05 0.97 0.81 0.99 1.01 0.92 1.05 0.54
Thailand 1.08 1.18 1.20 1.09 1.11 1.14 1.15 1.18 0.73
Middle East, Malta and Turkey 5.98 6.12 6.07 5.98 6.06 6.16 6.06 6.50 6.06
Saudi Arabia 1.23 1.34 1.36 1.46 1.26 1.29 1.32 1.34 1.19
Turkey 0.89 0.97 0.98 1.05 0.91 0.93 0.95 0.96 1.20
Iran, Islamic Republic of 0.38 0.41 0.42 0.45 0.38 0.39 0.40 0.41 0.96
Western Hemisphere 5.39 5.86 5.94 6.30 5.53 5.65 5.77 5.87 8.17
Brazil 1.27 1.39 1.41 1.51 1.31 1.34 1.37 1.39 3.06
Mexico 1.62 1.77 1.80 1.92 1.66 1.70 1.74 1.76 1.80
Venezuela, República Bolivariana de 0.32 0.35 0.36 0.38 0.33 0.34 0.35 0.35 0.50
Argentina 0.38 0.41 0.42 0.45 0.39 0.40 0.40 0.41 0.79
Transition economies 7.33 7.45 7.38 7.38 7.51 7.50 7.35 7.64 6.28
Russian Federation 2.25 2.45 2.49 2.67 2.30 2.36 2.41 2.45 2.95
Poland 1.02 1.12 1.14 1.15 1.05 1.08 1.10 1.12 0.77
Total 100.00 100.00 100.00 100.00 100.00 100.00 100.00 100.00 100.00
Memorandum items:
EU28 36.63 33.94 33.33 31.16 36.08 35.04 34.58 31.02 21.31
LICs 5/ 1.52 1.63 1.65 1.70 1.56 1.58 1.60 1.64 1.90
Openness
Shares
Capped Openness (Shares) Capped Openness (Absolute)
GDP blend
Shares

QUOTAS—DATA UPDATE AND SIMULATIONS
INTERNATIONAL MONETARY FUND 61
Variability
14. Variability is intended to capture members’ vulnerability to balance of payments
shocks and potential need for Fund resources. However, extensive staff work has failed to find
any significant link between the current variable and actual or potential external vulnerabilities, or to
identify a superior measure. The current measure is also relatively complex, and adds significant
instability to the CQS for a wide range of members. As discussed below, it also generates very
similar results to openness for many countries.
15. Key characteristics of variability identified previously include (Table I.5):
Variability tends to benefit smaller economies. About 87 percent of the countries (42 out
of 48) in the bottom quartile have variability/GDP blend shares larger than 1.
Countries with lower per capita incomes benefit less compared to middle and high
income economies. Only 60 percent of the countries (29 out of 48) in the bottom quartile in
terms of per capita income gain from variability, compared with more than 70 percent of the
countries in the other quartiles.
As with openness, these results are also reflected in the distribution of variability
shares across major country groupings. The main gainers from variability at the aggregate
level are small advanced countries, whose share on average is roughly double their share in
the GDP blend (Figure I.1). Over 70 percent of LICs and other EMDCs also gain from
variability, though on average to a much lesser extent than other advanced countries.
Table I.5. Countries that Benefit from Variability
Source: Finance Department
1/ Each quartile includes 47 countries, except the bottom quartile that includes 48 countries.
2/ Average or median ratio among the countries which have ratios greater than 1.
16. The distribution of members’ shares in variability relative to GDP is also highly
skewed. While the median ratio of variability to GDP blend for the membership as a whole is 1.53,
65 countries have ratios greater than 2 (with the highest being close to 30) and 100 have ratios
above 1.5 (Figure I.4).
Top
Quartile3rd 2nd
Bottom
Quartile
Top
Quartile3rd 2nd
Bottom
QuartileAE (26)
EMDC
excl. LIC
(93)
LIC (70) Total
Number of countries
who benefit (ratio >1)25 31 40 42 40 34 35 29 20 67 51 138
Median 2/ 1.7 1.9 1.9 2.1 2.2 1.7 1.6 2.0 2.1 1.8 2.0 2.0
Average 2/ 2.0 2.8 3.2 2.9 3.7 2.2 2.2 2.9 4.7 2.2 2.8 2.8
Variability / GDP Blend Shares
By Size (Market GDP) 1/ By Income (GDP per Capita) 1/ By Grouping

QUOTAS—DATA UPDATE AND SIMULATIONS
62 INTERNATIONAL MONETARY FUND
Figure I.5. Ratio of Variability Shares to Blend GDP Shares
Source: Finance Department.
Links between Openness and Variability
17. While the specific measures differ, both openness and variability produce similar
results in terms of shares. Both variables use
nominal data on the scale of external flows. In
particular, openness measures the size of current
payments and current receipts, whereas variability
seeks to capture volatility in the level of current
receipts and net capital flows. For many countries,
these yield very similar results. This can be seen
from several angles:
The overall dispersion in the distribution of
openness and variability shares is low, e.g.,
below that between market and PPP GDP and
between other quota variables and market GDP
(see Text Table and Figure I.2 in Section I).
The distribution of openness and variability shares among the main country groups is almost
identical (Figure I.1 in Section I).
As noted, once the largest economies are excluded (their weight tends to dominate the
comparisons of size-related variables), the correlation between openness and variability is 0.92,
well above that between other variables (Table I.1).
0
3
6
9
12
15
18
EMDCs
AEs
Ratio of 1.5 or more: 100 countries
Ratio of 1 or more: 138 countries
Ratio of 2 or more: 65 countries
Top 15 Countries: Iceland, Luxembourg, San Marino, Guinea-Bissau, South Sudan, Malta, Sao Tome and Principe,
Afghanistan, Libya, Liberia, Tuvalu, Marshall Islands, Mauritius, Ireland, Republic of Congo
Mean = 2.22
Median = 1.53Skewness = 6.09
Iceland: 29.78
0
1
2
3
0 1 2 3
ln(1
+Op
enn
ess
sha
re)
ln(1+Variability share)
Openness and Variability
AdvancedEconomies
EMDCs
Dispersion: 0.163

QUOTAS—DATA UPDATE AND SIMULATIONS
INTERNATIONAL MONETARY FUND 63
The distribution of gainers from variability is broadly similar to that for openness, in terms of
both size and income levels, as well as across the major country groupings as shown above
(Tables I.3 and I.5). Small advanced countries gain the most from variability, benefiting almost as
much as from openness. Smaller EMDCs and LICs also gain from variability relative to GDP, but
the gains are more modest.
At the individual country level, the countries that gain the most from openness also have
relatively high shares in variability (Figure I.6).
A hypothetical calculation showing the impact of dropping variability and moving all its weight
to openness shows that the distribution of CQS would be broadly unchanged across the largest
individual countries and major country groups (Table I.6).
Figure I.6. Top 15 Countries—Ratio of Openness Share to GDP Blend Share and Variability
Share to GDP Blend Share 1/
Source: Finance Department
1/ Countries ranked by openness share to GDP blend share.
0
2
4
6
8
10
12
14
16
18
Openness Share to GDP Blend Share Variability Share to GDP Blend Share

QUOTAS—DATA UPDATE AND SIMULATIONS
64 INTERNATIONAL MONETARY FUND
Table I.6 Illustrative Calculations - Current GDP and Openness Measures, Dropping
Variability, and All Weight to Openness
(In percent)
Source: Finance Department.
1/ Including Czech Republic, Estonia, Korea, Latvia, Lithuania, Malta, Singapore, Slovak Republic, and Slovenia.
2/ Including China, P.R., Hong Kong SAR and Macao SAR.
3/ Currently PRGT-eligible countries plus Zimbabwe.
14th General
Review Quotas Current Formula All to openness
Advanced economies 57.6 50.7 51.0
Major advanced economies 43.4 36.1 36.4
United States 17.4 14.3 14.3
Japan 6.5 5.3 5.2
Germany 5.6 5.1 5.3
France 4.2 3.3 3.4
United Kingdom 4.2 3.6 3.5
Italy 3.2 2.5 2.5
Canada 2.3 2.1 2.2
Other advanced economies 14.3 14.6 14.6
Spain 2.0 1.8 1.8
Netherlands 1.8 2.1 2.2
Australia 1.4 1.5 1.5
Belgium 1.3 1.1 1.2
Switzerland 1.2 1.6 1.6
Sweden 0.9 0.9 0.9
Austria 0.8 0.7 0.7
Norway 0.8 0.8 0.7
Ireland 0.7 0.7 0.7
Denmark 0.7 0.6 0.6
Emerging Market and Developing Countries 1/ 42.4 49.3 49.0
Africa 4.4 3.7 3.5
South Africa 0.6 0.5 0.6
Nigeria 0.5 0.7 0.6
Asia 16.0 23.4 24.1
China 2/ 6.4 12.0 12.2
India 2.7 3.0 3.1
Korea, Republic of 1.8 2.0 2.2
Indonesia 1.0 1.3 1.3
Singapore 0.8 1.3 1.4
Malaysia 0.8 0.8 0.8
Thailand 0.7 1.0 1.0
Middle East, Malta and Turkey 6.7 7.2 6.8
Saudi Arabia 2.1 1.7 1.5
Turkey 1.0 1.1 1.1
Iran, I.R. of 0.7 0.8 0.8
Western Hemisphere 7.9 7.4 7.3
Brazil 2.3 2.3 2.3
Mexico 1.9 1.7 1.7
Venezuela, R.B. de 0.8 0.5 0.4
Argentina 0.7 0.6 0.6
Transition economies 7.2 7.6 7.3
Russia 2.7 2.7 2.7
Poland 0.9 0.9 0.9
Total 100.0 100.0 100.0
Memorandum items:
EU28 30.4 27.5 27.9
LICs 3/ 3.3 2.2 2.1
Coefficients for quota variables
GDP 0.30 0.30
PPP GDP 0.20 0.20
Openness 0.30 0.45
Variability 0.15 0.00
Reserves 0.05 0.05
Compression factor 0.95 0.95

QUOTAS—DATA UPDATE AND SIMULATIONS
INTERNATIONAL MONETARY FUND 65
Reserves
18. Reserves provide an indicator of a member’s financial strength and ability to
contribute to the Fund’s finances. Reserves have long been included in the quota formula, though
different views have been expressed on their continued relevance and some concerns been raised
about potential distortions associated with excess reserve accumulations. Previous work by the staff
revisited the case of including reserves in the formula and found no clear relationship between
reserves and members’ contributions to resource mobilization.9 However, some countries with
relatively large reserve holdings have made important contributions.
19. Some key characteristics of the impact of reserves include (Table I.7):
Reserves benefit many smaller economies. About two thirds of the countries (30 out of
48) in the bottom quartile have reserves/GDP blend shares larger than 1, compared with
about one-third for the other 3 quartiles.
Low per capita income countries benefit less compared to middle and high income
economies. Only one-fourth of the counties (12 out of 48) in the bottom quartile in terms of
per capita income gain from reserves, compared with more than 50 percent of the countries
(28 and 26 out of 47) in the second and third quartiles.
In relative terms, EMDCs (excluding LICs) are the main gainers from reserves, with over
half of the countries in this group benefiting. Roughly 45 percent of LICs benefit from
reserves, and only a quarter of AEs.
Table I.7. Countries that Benefit from Reserves
Source: Finance Department
1/ Each quartile includes 47 countries, except the bottom quartile that includes 48 countries.
2/ Average or median ratio among the countries which have ratios greater than 1.
20. The distribution of members’ reserves relative to GDP is quite skewed (Figures I.7a and
I.7b). In terms of shares, 28 members have reserves shares more than double their shares in GDP
blend (the highest ratio is more than 20 times) and 47 members have ratios greater than 1.5. Based
on the latest data, 88 members benefit to some extent from the inclusion of reserves in the formula.
9 See Quota Formula Review-Initial Considerations (2/10/12).
Top
Quartile3rd 2nd
Bottom
Quartile
Top
Quartile3rd 2nd
Bottom
QuartileAE (26)
EMDC
excl. LIC
(93)
LIC (70) Total
Number of countries
who benefit (ratio >1)18 21 19 30 22 28 26 12 7 50 31 88
Median 2/ 1.8 1.7 1.4 1.5 1.7 1.6 1.7 1.4 1.9 1.6 1.4 1.5Average 2/ 2.4 2.2 1.6 2.8 2.1 2.1 3.1 1.4 2.4 2.1 2.7 2.3
By Size (Market GDP) 1/ By Income (GDP per Capita) 1/ By Grouping
Reserves / GDP Blend Shares

QUOTAS—DATA UPDATE AND SIMULATIONS
66 INTERNATIONAL MONETARY FUND
Figure I.7a. Ratio of Reserves to Market GDP
Source: Finance Department
Figure I.7b. Ratio of Reserves Shares to Blend GDP Shares
Source: Finance Department
Compression factor
21. Compression was introduced in the 2008 reform to moderate the role of size in the
formula. In particular, the current formula includes a compression factor of 0.95 applied to a linear
combination of the four variables. Compression maintains the original ranking of the countries and
does not require any additional data. Recognizing that the inclusion of this element was one of the
most difficult aspects of the 2008 reform, the Executive Board decided to include it in the formula
for a period of 20 years, at which point the scope for retaining it would be reviewed.
22. The characteristics of the compression factor are summarized below (Table I.8):
0.0
0.5
1.0
1.5
2.0
2.5
3.0
3.5
EMDCs
AEs
Top 15 Countries: Kiribati, Tuvalu, Libya, Saudi Arabia, Algeria, Singapore, Lebanon, Turkmenistan, Sw itzerland, Bhutan,
Botsw ana, Solomon Islands, Lesotho, Trinidad and Tobago, St. Kitts
Mean = 0.23
Median = 0.16Skewness = 5.62
Ratio of 1.5 or more: 3 countries
Ratio of 1 or more: 4 countries
Ratio of 2 or more: 1 countries
0
2
4
6
8
10
12
14
EMDCs
AEs
Ratio of 1.5 or more: 47 countries
Ratio of 1 or more: 88 countries
Ratio of 2 or more: 28 countries
Top 15 Countries: Kiribati, Tuvalu, Libya, Sw itzerland, Singapore, Saudi Arabia, Lebanon, Algeria, Turkmenistan,
Solomon Islands, Botsw ana, St. Kitts, Trinidad and Tobago, Bhutan, Tonga
Mean = 1.33
Median = 0.92Skewness = 6.76
Kiribati: 22.76

QUOTAS—DATA UPDATE AND SIMULATIONS
INTERNATIONAL MONETARY FUND 67
The compression factor benefits all but the largest economies. The CQS of the largest 9
members (based on the uncompressed formula and using the current quota database) are
reduced, while the CQS of all other members are increased. In total, compared with a linear
combination of the quota formula variables, the compression factor shifts almost 3
percentage points of shares from the 9 largest members to the remaining 180 members.
As a group, low income countries benefit more compared to high income economies.
While the compression factor is unrelated to income, almost all countries in the bottom two
quartiles in terms of per capita income gain from its inclusion.
In terms of major country groups, EMDCs and LICs are the main gainers. All LICs benefit
as do all but three EMDCs. Twenty out of 26 AEs also benefit from compression.
Table I.8. Countries that Benefit from Compression
Source: Finance Department
1/ Each quartile includes 47 countries, except the bottom quartile that includes 48 countries.
2/ Average or median ratio among the countries which have ratios greater than 1.
23. The benefits of compression are inversely related to the country size. As noted, the nine
largest countries lose from compression. The median ratio for the membership as a whole is 1.20,
and 5 countries have ratios greater than 1.5. (Figure I.8). As the figure shows, the lower share of the
nine large countries after including the compression factor enables the allocation of a larger share
for the rest of the 180 countries (ratio of CQS to uncompressed linear combination > 1).
Top
Quartile3rd 2nd
Bottom
Quartile
Top
Quartile3rd 2nd
Bottom
QuartileAE (26)
EMDC
excl. LIC
(93)
LIC (70) Total
Number of countries who
benefit (ratio >1)38 47 47 48 41 45 47 47 20 90 70 180
Median 2/ 1.1 1.2 1.2 1.4 1.1 1.2 1.3 1.3 1.1 1.2 1.3 1.2
Average 2/ 1.1 1.2 1.2 1.4 1.1 1.2 1.3 1.3 1.1 1.2 1.3 1.2
CQS / uncompressed linear combination
By Size (Market GDP) 1/ By Income (GDP per Capita) 1/ By Grouping

QUOTAS—DATA UPDATE AND SIMULATIONS
68 INTERNATIONAL MONETARY FUND
Figure I.8. Ratio of CQS to Uncompressed Linear Combination
Source: Finance Department
0.0
0.5
1.0
1.5
2.0EMDCs
AEs
Ratio of 1.5 or more: 5 countries
Ratio of 1 or more: 180 countries
Nine countries with lower share after compression: United States, China, Japan, Germany, United Kingdom, France, India,
Russia and Italy.
Mean = 1.21
Median = 1.20Skewness = 0.39

QUOTAS—DATA UPDATE AND SIMULATIONS
INTERNATIONAL MONETARY FUND 69
Annex II. Country Groups
This annex discusses the implications of updating the country group classification used in quota work
to align it with that used in the current WEO.
Background
1. The current country group classification used for quota work dates back to the 11th
Quota Review, and has remained unchanged except for the inclusion of new Fund members.
The country classification in the 11th Review adopted the 1998 WEO classification with some
exceptions:
Starting in May 1997, Israel, Korea, and Singapore have been classified as advanced
economies in the WEO. However, for quota purposes, among these three countries, only
Israel was included into the advanced economies group during the 11th Review in 1998.
With the 11th Review in 1998, San Marino has been classified as an advanced economy
although it was not listed in any of the WEO classifications until October 2012.
The 11th Review in 1998 classified Cyprus as an advanced economy, although was not
classified as advanced in the WEO until May 2001.
2. Country classifications in the WEO have evolved over the years since 1998:
Cyprus (2001), Slovenia (2007), Malta (2008), Czech Republic (2009), Slovak Republic (2009),
Estonia (2011), Latvia (2014), and Lithuania (2015) were removed from the EMDCs group and
included into the Advanced Economies group.
Prior to 2012, San Marino was excluded entirely from the WEO classification due to data
restrictions. In 2012, it was introduced into the classification as an advanced economy.
3. Several new member countries were included in the EMDC group for quota work:
Palau in 1998, Timor-Leste in 2003, Kosovo in 2010, Tuvalu in 2011, and South Sudan in 2013
were introduced into the country classification in quota work as EMDCs.1
4. The possibility of updating the country group classifications was discussed at the time
of the 14th Review. However, there was broad support not to change the country classifications at
1 Nauru became an IMF member in 2016 and it is classified as an EMDC in quota work. However, it has not been
introduced in any of the WEO classifications yet.
(continued)

QUOTAS—DATA UPDATE AND SIMULATIONS
70 INTERNATIONAL MONETARY FUND
that time in order to provide continuity in the quota discussions as unchanged classifications would
facilitate comparisons of the changes in quota shares for the main country groups since the start of
the quota reform in 2006. This issue was also discussed in the context of the QFR.2
Implications of aligning with the current WEO classifications
5. With a new round of quota discussions now getting underway, staff proposes aligning
the country groups used for quota purposes with the current WEO. Aligning the country groups
used for quota purposes with the WEO classification would make them consistent with those used
by the Fund for most other purposes, and would ensure a more up-to-date classification of EMDCs
and AEs. It would also recognize that country groups are dynamic, and that some countries
“graduate” over time from the EMDC group to the AE group. Based on these considerations and
with a new round of quota discussion getting underway, staff proposes that starting from the next
quota paper, the country groups be aligned with the current WEO groupings. Ggoing forward,
country groups used for quota purposes would be updated to reflect changes in the WEO group, as
appropriate.
6. Moving to the WEO classification would increase the quota share of AEs due to the
shift of nine EMDCs to the AE group (Table II.1):
AE’s share of 14th Review quotas would be 61.3 percent, a 3.7 pp increase relative to the
current classification. Conversely, EMDCs’ share of quotas would be 3.7 pp lower.
Calculated quota shares of AEs would increase by 4.5 pp to 55.2 percent, whereas calculated
quota shares of EMDCs decline correspondingly.
The difference between the calculated quota shares and 14th Review quota shares of AEs
would be reduced from -6.9 pp to -6.1 pp, with a corresponding reduction in the difference
for EMDCs.
7. For the EMDC subgroups, there would also be several changes:
The classification “Transition economies” would be eliminated, and replaced with two
groups: Commonwealth of Independent States (CIS) and Emerging and Developing Europe.
Africa would be split into a new Sub-Saharan Africa group and an expanded Middle East
group: Middle East and North Africa.
Among the EMDC regions, developing Asia would lose significant quota share (3 pp) due to
the reclassification of Korea and Singapore as advanced economies (see Table II.2 for a
summary of country classification changes).
2 See Appendix I in Quota Formula Review- Initial Considerations Supplement (2/10/12).

QUOTAS—DATA UPDATE AND SIMULATIONS
INTERNATIONAL MONETARY FUND 71
Table II.1. Distribution of Quotas and Calculated Quotas using the WEO Classification
(In percent)
Source: Finance Department
1/ Includes South Sudan and Nauru which became members on April 18, 2012 and April 12, 2016, respectively; reflects their
quota increases proposed in their respective membership resolutions after the effectiveness of the 14th Review.
2/ Based on the following formula: CQS = (0.50*GDP + 0.30*Openness +0.15*Variability + 0.05*Reserves)^K. GDP blend using 60
percent market and 40 percent PPP exchange rates. K is a compression factor of 0.95. The 2016 data update covers data through
end-2014.
3/ World Economic Outlook April 2016.
4/ Including Czech Republic, Estonia, Korea, Latvia, Lithuania, Malta, Singapore, Slovak Republic, and Slovenia.
5/ Korea and Singapore moved from the group currently called "Asia" to the group of "Advanced Economies". Turkey moved
from the group called "Middle East, Malta and Turkey" to the group "CIS and Emerging and Developing Europe".
6/ The group name under WEO classification is in bold letter. The group name under current classification is in parentheses.
7/ Including China, P.R., Hong Kong SAR and Macao SAR.
8/ Comprises the WEO categories "Commonwealth of Independent States" and "Emerging and Developing Europe." This
grouping is broadly comparable to the Transition Economies. Includes Turkey.
9/ Currently PRGT-eligible countries plus Zimbabwe.
Country Groups according to WEO 3/Current
Classification
WEO
Classification
Change resulting
from WEO
classification
Current
Classification
WEO
Classification
Change resulting
from WEO
classification
Advanced economies 4/ 57.6 61.3 3.7 50.7 55.2 4.5Major advanced economies 43.4 43.4 0.0 36.1 36.1 0.0
United States 17.4 17.4 14.3 14.3Japan 6.5 6.5 5.3 5.3Germany 5.6 5.6 5.1 5.1France 4.2 4.2 3.3 3.3United Kingdom 4.2 4.2 3.6 3.6Italy 3.2 3.2 2.5 2.5Canada 2.3 2.3 2.1 2.1
Other advanced economies 14.3 17.9 3.7 14.6 19.1 4.5Spain 2.0 2.0 1.8 1.8Netherlands 1.8 1.8 2.1 2.1Korea, Republic of 5/ 1.8 1.8 2.0 2.0Australia 1.4 1.4 1.5 1.5Belgium 1.3 1.3 1.1 1.1Switzerland 1.2 1.2 1.6 1.6Sweden 0.9 0.9 0.9 0.9Austria 0.8 0.8 0.7 0.7Singapore 5/ 0.8 0.8 1.3 1.3Norway 0.8 0.8 0.8 0.8Ireland 0.7 0.7 0.7 0.7Denmark 0.7 0.7 0.6 0.6
Emerging Market and Developing Countries 6/ 42.4 38.7 -3.7 49.3 44.8 -4.5Sub-Saharan Africa (Africa) 4.4 3.6 -0.9 3.7 2.8 -0.9
South Africa 0.6 0.6 0.5 0.5Nigeria 0.5 0.5 0.7 0.7
Developing Asia (Asia) 16.0 13.0 -3.1 23.4 19.8 -3.7China 7/ 6.4 6.4 12.0 12.0India 2.7 2.7 3.0 3.0Indonesia 1.0 1.0 1.3 1.3Malaysia 0.8 0.8 0.8 0.8Thailand 0.7 0.7 1.0 1.0
Middle East, North Africa, Afghanistan
and Pakistan (Middle East, Malta & Turkey) 6.7 7.1 0.4 7.2 7.4 0.2Saudi Arabia 2.1 2.1 1.7 1.7Iran, Islamic Republic of 0.7 0.7 0.8 0.8
Latin America and the Caribbean
(Western Hemisphere) 7.9 7.9 7.4 7.4Brazil 2.3 2.3 2.3 2.3Mexico 1.9 1.9 1.7 1.7Venezuela, República Bolivariana de 0.8 0.8 0.5 0.5Argentina 0.7 0.7 0.6 0.6
CIS and Emerging and Developing
Europe (Transition economies) 8/ 7.2 7.2 0.0 7.6 7.5 -0.1Russian Federation 2.7 2.7 2.7 2.7Turkey 5/ 1.0 1.0 1.1 1.1Poland 0.9 0.9 0.9 0.9
Total 100.0 100.0 100.0 100.0
Memorandum Item:EU 28 30.4 30.4 27.5 27.5LICs 9/ 3.3 3.3 2.2 2.2
14th Review Quota Shares 1/ Calculated Quota Shares (2014) 2/

QUOTAS—DATA UPDATE AND SIMULATIONS
72 INTERNATIONAL MONETARY FUND
Table II.2. Comparison of Current with WEO Classification 1/
Current Classification Updated WEO Classification Current Classification Updated WEO Classification
Australia Australia
Austria Austria
Belgium Belgium
Canada Canada Albania Albania
Cyprus Cyprus Armenia Armenia (CIS)
Czech Republic Azerbaijan Azerbaijan (CIS)
Denmark Denmark Belarus Belarus (CIS)
Estonia Bosnia-Herzegovina Bosnia-Herzegovina
Finland Finland Bulgaria Bulgaria
France France Croatia Croatia
Germany Germany Czech Republic
Greece Greece Estonia
Iceland Iceland Georgia Georgia (CIS)
Ireland Ireland Hungary Hungary
Israel Israel Kazakhstan Kazakhstan (CIS)
Italy Italy Kosovo Kosovo
Japan Japan Kyrgyz Republic Kyrgyz Republic (CIS)
Korea Latvia
Latvia Lithuania
Lithuania Macedonia, FYR Macedonia, FYR
Luxembourg Luxembourg Moldova Moldova (CIS)
Malta Mongolia
Netherlands Netherlands Montenegro Montenegro
New Zealand New Zealand Poland Poland
Norway Norway Romania Romania
Portugal Portugal Russia Russia
San Marino San Marino Serbia, Republic of Serbia, Republic of
Singapore Slovak Republic
Slovak Republic Slovenia
Slovenia Tajikistan Tajikistan (CIS)
Spain Spain Turkey
Sweden Sweden Turkmenistan Turkmenistan (CIS)
Switzerland Switzerland Ukraine Ukraine (CIS)
United Kingdom United Kingdom Uzbekistan Uzbekistan (CIS)
United States United States
Africa Sub-Saharan Africa
Algeria
Angola Angola
Benin Benin
Afghanistan, IR Botswana Botswana
Bangladesh Bangladesh Burkina Faso Burkina Faso
Bhutan Bhutan Burundi Burundi
Brunei Darussalam Brunei Darussalam Cameroon Cameroon
Cambodia Cambodia Cape Verde Cape Verde
China China Central African Republic Central African Republic
Fiji Fiji Chad Chad
India India Comoros Comoros
Indonesia Indonesia Congo, Dem. Republic of Congo, Dem. Republic of
Kiribati Kiribati Congo, Republic of Congo, Republic of
Korea Cote d'Ivoire Cote d'Ivoire
Lao, People's Dem. Republic Lao, People's Dem. Republic Djibouti
Malaysia Malaysia Equatorial Guinea Equatorial Guinea
Maldives Maldives Eritrea Eritrea
Marshall Islands Marshall Islands Ethiopia Ethiopia
Micronesia, Fed. States of Micronesia, Fed. States of Gabon Gabon
Mongolia Gambia, The Gambia, The
Myanmar Myanmar Ghana Ghana
Nauru* Guinea Guinea
Nepal Nepal Guinea-Bissau Guinea-Bissau
Pakistan Kenya Kenya
Palau, Republic of Palau, Republic of Lesotho Lesotho
Papua New Guinea Papua New Guinea Liberia Liberia
Philippines Philippines Madagascar Madagascar
Samoa Samoa Malawi Malawi
Singapore Mali Mali
Solomon Islands Solomon Islands Mauritania
Sri Lanka Sri Lanka Mauritius Mauritius
Thailand Thailand Morocco
Timor Leste Timor Leste Mozambique Mozambique
Tonga Tonga Namibia Namibia
Tuvalu Tuvalu Niger Niger
Vanuatu Vanuatu Nigeria Nigeria
Vietnam Vietnam
Advanced Economies Emerging Market and Developing Countries continued
Emerging Market and Developing Countries
Developing Asia
Transition EconomiesCIS and Emerging and Developing
Europe 2/

QUOTAS—DATA UPDATE AND SIMULATIONS
INTERNATIONAL MONETARY FUND 73
Table II.2. Comparison of Current with WEO Classification (concluded)
Source: Finance Department
1/ Based on the April 2016 World Economic Outlook.
2/ Comprises the WEO categories "Emerging and Developing Europe" and "Commonwealth of Independent States."
*Countries not covered by WEO.
Current Classification Updated WEO Classification Current Classification Updated WEO Classification
Africa continued Sub-Saharan Africa continued Western Hemisphere continued Latin America and the Caribbean cont.
Rwanda Rwanda Mexico Mexico
Sao Tome and Principe Sao Tome and Principe Nicaragua Nicaragua
Senegal Senegal Panama Panama
Seychelles Seychelles Paraguay Paraguay
Sierra Leone Sierra Leone Peru Peru
Somalia Somalia* St. Kitts and Nevis St. Kitts and Nevis
South Africa South Africa St. Lucia St. Lucia
South Sudan South Sudan St. Vincent and the Grenadines St. Vincent and the Grenadines
Sudan Suriname Suriname
Swaziland Swaziland Trinidad and Tobago Trinidad and Tobago
Tanzania Tanzania Uruguay Uruguay
Togo Togo Venezuela Venezuela
Tunisia
Uganda Uganda
Zambia Zambia
Zimbabwe Zimbabwe Middle East, Malta & Turkey
Afghanistan, IR
Algeria
Western Hemisphere Latin America and the Caribbean Bahrain Bahrain
Antigua and Barbuda Antigua and Barbuda Djibouti
Argentina Argentina Egypt Egypt
Bahamas, The Bahamas, The Iran Iran
Barbados Barbados Iraq Iraq
Belize Belize Jordan Jordan
Bolivia Bolivia Kuwait Kuwait
Brazil Brazil Lebanon Lebanon
Chile Chile Libya Libya
Colombia Colombia Mauritania
Costa Rica Costa Rica Malta
Dominica Dominica Morocco
Dominican Republic Dominican Republic Oman Oman
Ecuador Ecuador Pakistan
El Salvador El Salvador Qatar Qatar
Grenada Grenada Saudi Arabia Saudi Arabia
Guatemala Guatemala Sudan
Guyana Guyana Syrian Arab Republic Syrian Arab Republic
Haiti Haiti Tunisia
Honduras Honduras Turkey
Jamaica Jamaica United Arab Emirates United Arab Emirates
Yemen, Republic of Yemen, Republic of
Emerging Market and Developing Countries continued Emerging Market and Developing Countries continued
Middle East, North Africa,
Afghanistan and Pakistan

QUOTAS—DATA UPDATE AND SIMULATIONS
74 INTERNATIONAL MONETARY FUND
Annex III. Defining the Poorest Members
Board of Governors Resolution 66-2 states that steps shall be taken to protect the voice and
representation of the poorest members under the 15th Review. Accordingly, it will be necessary to
define how such protection would be provided and the definition of members who would qualify for
protection. This annex discusses some available options.
1. In the 14th Review, the poorest members were defined as those PRGT-eligible
countries with annual per capita GNI below the prevailing operational IDA cut-off in 2008
(US$1,135) or below twice the IDA’s cut-off for countries meeting the definition of a “small
country” under the PRGT eligibility criteria. The countries covered included 52 members plus
Zimbabwe, which was not PRGT-eligible at the time. South Sudan, which joined the Fund
subsequently, also met this criterion and was protected through the 14th Review quota increase
included in its membership resolution. The combined AQS for these countries is 3.3 percent.
2. Other options were discussed at the time. These included the full list of 71 PRGT-eligible
countries, as well as the list of 42 low income countries as defined in the IBRD’s World Development
Indicators with an annual per capita GNI of US$975 or less. However, the above definition was seen
as the preferred approach. It was also decided that protection should be provided through ad hoc
quota increases at the individual country level rather than for the group as a whole.
3. Using the same approach and the 2016 IDA income cut-off of US$1,215, the current
list of the poorest members would include 36 countries.1 The reduction in the number of
qualifying members reflects the fact that the IDA cut-off has been increased relatively modestly
since the 14th Review, while many of the poorest countries have enjoyed relatively strong income
growth. The combined AQS for these countries is 1.7 percent.
4. In addition to the approach followed under the 14th Review, other options could also
be considered. These include the full list of PRGT-eligible countries, as well as approaches such as
United Nations list of least developed countries and the WEO’s low income developing countries
(see Table III.1).
The United Nations list of 48 least developed countries (LDCs)
5. This list includes 6 countries that are not among the 54 in the 14th Review list of
poorest country members—Angola, Equatorial Guinea, Samoa, Timor-Leste, Tuvalu, and Vanuatu.
LDCs are defined as low-income countries confronting severe structural impediments to sustainable
1 The IDA per capita GNI threshold is reviewed annually, every July. The threshold was set at US$1,215 for both FY
2015 (July 1, 2014 – June 30, 2015) and FY 2016 (July 1, 2015 – June 30, 2016). The IDA threshold for FY 2017 was
reduced to US$ 1,185 recently.
(continued)

QUOTAS—DATA UPDATE AND SIMULATIONS
INTERNATIONAL MONETARY FUND 75
development, and the list of LDCs is reviewed every three years. Three criteria are used for
identifying countries as LDCs:
Gross National Income (GNI) per capita2
The human asset index (HAI)3
The economic vulnerability index (EVI)4
Both HAI and EVI are composed of several indicators.
The WEO’s Low Income Developing Countries (LIDCs)
6. This group was introduced in 2014 and currently includes 60 countries, of which 43
were included among those eligible for protection under the 14th Review. LIDCs are defined as
countries that have markedly different economic features to higher income countries and are
eligible for concessional financing from both the IMF and the World Bank. More specifically, the
LIDC definition includes countries that (i) were designated PRGT–eligible in the 2013 PRGT eligibility
review and (ii) had a level of per capita GNI less than the PRGT income graduation threshold for
non–small states (that is, twice the IDA operational threshold, or US$2,390 in 2011 as measured by
the World Bank’s Atlas method), and also Zimbabwe. This list is expected to be updated in early
2017.
2 The threshold for inclusion is based on a three-year average of the level of GNI per capita, and is the same which
the World Bank uses for identifying low-income countries; the threshold is currently US$1,035.
3 The HAI is a measure of the level of human capital, and consists of four indicators, two on health and nutrition
(percentage of population undernourished, and mortality rate for children aged five years or under) and two on
education (gross secondary school enrolment ratio, and the adult literacy rate).
4 The EVI measures the structural vulnerability of countries to exogenous economic and environmental shocks and
contains, five of which are grouped into an exposure index and three into a shock index.

Table III.1. Alternative Lists of Poorest Member Countries Qualifying for Protection
Source: Finance Department
1/ Effective October 16, 2015; plus Zimbabwe (which was removed from the PRGT-eligibility list by a Board decision in connection with its overdue obligations to the
PRGT).
2/ Countries that are PRGT-eligible and met the IDA per capita GNI cut-off of US$1,135 in 2008 (or twice that amount for small states, as defined by the IMF), plus
Zimbabwe.
3/ Countries that are PRGT-eligible and meet the current (2016) IDA per capita GNI cut-off of US$1,215 (or twice that amount for small states, as defined by the IMF), plus
Zimbabwe.
Country PRGT-elligible 14th Review Updated IDA United Nations WEO Country PRGT-elligible 14th Review Updated IDA United Nations WEO
countries 1/ List 2/ Cut-Off List 3/ List LIDC List countries 1/ List 2/ Cut-Off List 3/ List LIDC List
1 Afghanistan * * * * * 39 Maldives *
2 Angola * 40 Mali * * * * *
3 Bangladesh * * * * * 41 Marshall Islands *
4 Benin * * * * * 42 Mauritania * * * *
5 Bolivia * 43 Micronesia *
6 Bhutan * * * * * 44 Moldova * *
7 Burkina Faso * * * * * 45 Mongolia *
8 Burundi * * * * * 46 Mozambique * * * * *
9 Cabo Verde * 47 Myanmar * * * *
10 Cambodia * * * * * 48 Nepal * * * * *
11 Cameroon * * 49 Nicaragua * * *
12 Central African Rep. * * * * * 50 Niger * * * * *
13 Chad * * * * * 51 Nigeria *
14 Comoros * * * * * 52 Papua New Guinea * * *
15 Congo, Dem. Rep. of * * * * * 53 Rwanda * * * * *
16 Congo, Rep. of * * 54 Samoa * *
17 Côte d'Ivoire * * * 55 São Tomé and Príncipe * * * * *
18 Djibouti * * * * * 56 Senegal * * * * *
19 Dominica * 57 Sierra Leone * * * * *
20 Equatorial Guinea * 58 Solomon Islands * * * * *
21 Eritrea * * * * * 59 Somalia * * * *
22 Ethiopia * * * * * 60 South Sudan * * * *
23 Gambia, The * * * * * 61 St. Lucia *
24 Ghana * * * 62 St. Vincent and the Grenadines *
25 Grenada * 63 Sudan * * * *
26 Guinea * * * * * 64 Tajikistan * * * *
27 Guinea-Bissau * * * * * 65 Tanzania * * * * *
28 Guyana * * 66 Timor-Leste * *
29 Haiti * * * * * 67 Togo * * * * *
30 Honduras * * 68 Tonga *
31 Kenya * * * 69 Tuvalu * *
32 Kiribati * * * * 70 Uganda * * * * *
33 Kyrgyz Republic * * * 71 Uzbekistan * * *
34 Lao P.D.R. * * * * 72 Vanuatu * *
35 Lesotho * * * * 73 Vietnam * *
36 Liberia * * * * * 74 Yemen * * * *
37 Madagascar * * * * * 75 Zambia * * * *
38 Malawi * * * * * 76 Zimbabwe * * * **
No. of countries 70 54 36 48 60
QU
OTA
S—
DA
TA
UPD
ATE A
ND
SIM
ULA
TIO
NS
76
IN
TER
NA
TIO
NA
L MO
NETA
RY F
UN
D
INTER
NA
TIO
NA
L MO
NETA
RY F
UN
D 7
6

QUOTAS—DATA UPDATE AND SIMULATIONS
INTERNATIONAL MONETARY FUND 77
Annex IV. Voluntary Financial Contributions
This Annex updates earlier staff estimates of members’ voluntary financial contributions to the Fund.
The calculations cover the main forms of financial contributions, including bilateral and multilateral
loans to the GRA, loan and subsidy contributions to the PRGT, and financing for capacity development.
It also illustrates alternative forms of aggregating such diverse contributions, recognizing the
difficulties involved. The calculations are only intended to be illustrative at this stage and further work
would be needed to refine such a measure.
1. Options for recognizing financial contributions were discussed extensively during the
QFR.1 Directors recognized the importance of financial contributions to the Fund. Much of the
discussion focused on whether to include a measure of financial contributions in the quota formula,
and different views were expressed on this issue. One view was that voluntary financial contributions
should be included in the quota formula as it would help incentivize the provision of such
contributions to the Fund. Another view was that such inclusion was inconsistent with the Fund’s
role as a quota-based institution. Following an extensive debate, the Executive Board’s QFR report to
the Board of Governors noted that: “Views diverged on the merits of such an approach. It was agreed
to consider whether and how to take into account very significant voluntary financial contributions
through ad hoc adjustments as part of the 15th Review.”2
2. This Annex updates earlier staff estimates of members’ voluntary financial
contributions. In light of the outcome of the QFR, it focuses solely on voluntary contributions; for
example, members’ participation in the Financial Transactions Plan, which was considered in some of
the earlier calculations, is not covered here as this is an obligation of membership. As discussed
below, there are multiple ways of combining the different forms of financial contributions, and
further work on this topic would be needed to determine which contributions should be included
and how they should be aggregated. Also, further consideration would need to be given to how to
define “very significant” contributions, which is not considered further in this Annex.
3. Members’ voluntary financial contributions to the Fund come in a variety of forms. In
particular, these include: (i) bilateral and multilateral support for Fund liquidity in the General
Resources Account, (ii) loan contributions to the PRGT, (iii) subsidy contributions for concessional
financing, (iv) voluntary SDR trading arrangements, and (v) technical assistance and training, i.e.,
capacity development (CD). Not all of these contributions lend themselves to ready comparison
across members. For example, members’ voluntary SDR trading arrangements are not published and
may be amended at any time. Also, some contributions involve budget outlays while others involve
the temporary provision of loans.
1 See Quota Formula Review—Initial Considerations (2/10/12), Quota Formula Review—Data Update and Further
Considerations (6/28/12), and Quota Formula Review—Additional Considerations (9/4/12), and the Chairman’s
Summing Up of these Board Meetings. See also Quota Formula Review—Further Considerations (11/8/12).
2 See Outcome of the Quota Formula Review—Draft Report of the Executive Board to the Board of Governors (1/18/13).

QUOTAS—DATA UPDATE AND SIMULATIONS
78 INTERNATIONAL MONETARY FUND
4. Therefore, constructing an aggregate measure of voluntary financial contributions
raises a number of issues that require judgment. As recognized during previous discussions,
these include the need to determine the relevant time frame for considering contributions, how to
combine contributions that differ substantially both in magnitude and in form, and how to
aggregate diverse contributions over time. Although in principle computing the opportunity cost of
different contributions would be one way to address issues of comparability, in practice this would
be challenging, requiring an estimate of when resources are actually used and the relevant discount
factors. For example, both the NAB and bilateral loan resources are commitments and the timing
and magnitude of actual drawings is uncertain. Thus, it was recognized during previous discussions
that the only practical way to include such contributions would be on a commitment basis, which
reflects the amounts that members stand ready to provide to the Fund, regardless of how much is
actually drawn.
5. For illustrative purposes, three aggregate measures of voluntary financial
contributions are constructed. Building on the approaches illustrated during the QFR discussions,
and focusing on voluntary contributions consistent with the outcome of the QFR, members’
contribution shares for the following five categories of voluntary contributions are first calculated:
NAB, bilateral borrowing agreements, PRGT loans, subsidy contributions for concessional financing,
and capacity building (see Box IV.1 for more details and Table IV.1 for a summary of selected
indicators of members’ financial contributions to the Fund). These are then used to construct three
aggregate measures of voluntary financial contributions to the Fund (see Table IV. 2 for a summary
of the distribution across broad country groups of these three aggregate measures of voluntary
financial contributions). These measures are defined as follows:
VFCS I – the simple average of member contribution shares to the following five voluntary
financial contributions: i) NAB, ii) the 2012 Bilateral borrowing agreements, iii) PRGT loans,
iv) PRGT subsidies, and v) technical assistance and training (capacity development).
VFCS II – a weighted average of member contributions to the NAB (0.3), the 2012 Bilateral
borrowing agreements (0.3), PRGT loans and subsidies combined (0.2), and capacity
development (0.2). The higher weight on NAB/bilateral resources would reflect to some extent
the large magnitude of resources provided compared to contributions to concessional financing
and capacity development.
VFCS III – uses the higher of the 14th Review quota share or VFCS I share rebased to ensure that
total shares add up to 100 percent. This metric recognizes members that have provided financial
contributions in excess of their respective quota shares. One implication of this approach,
however, is that members that have contributed, but less than their 14th Review quota shares,
are treated the same as other members that have not contributed.
6. Based on all three measures, AEs account for a much larger share of voluntary financial
contributions than their 14th Review AQS or current CQS (see Figure IV.1).

QUOTAS—DATA UPDATE AND SIMULATIONS
INTERNATIONAL MONETARY FUND 79
Figure IV.1. Financial Contributions: Distribution of Aggregate Measures by Major Country
Grouping
Source: Finance Department.
7. The main part of the paper illustrates one possible approach to recognizing significant
voluntary financial contributions through ad hoc adjustments as part of the 15th Review.
These calculations use the measure VFCS II above, and allocate 5 percent of the overall quota
increase to be distributed based on shares in this measure. As noted, considerable further work
would be required to refine such a measure and also to determine how to define “very significant”
for such a purpose.3
3 Box IV.2 provides background information on how liquidity and financial contributions have been taken into
account on several occasions in past quota increases.
0%
10%
20%
30%
40%
50%
60%
70%
80%
90%
100%
AQS 14th Review CQS (2014 data) VFCS I VFCS II VFCS III
Major AEs Other AEs EMDCs

QUOTAS—DATA UPDATE AND SIMULATIONS
80 INTERNATIONAL MONETARY FUND
Box IV.1. Components of Voluntary Financial Contributions Shares
Aggregate measures of Voluntary Financial Contributions by member countries comprise five key
components:
All credit arrangements under the New Arrangements to Borrow (NAB) that were effective as of
end-March 2016.
All bilateral borrowing agreements with the Fund that were effective as of end-March 2016.
All loan commitments by member countries to the PRGT Trust (and its predecessors), cumulative
from 1988 to end-December 2015.
Contributions to various Subsidy Accounts,1/ including:
(i) the PRGF-ESF Trust (1987);
(ii) the PRG-HIPC Trust (1999);
(iii) the MDRI and ESF (2005);
(iv) the PRGT Subsidy Account (2009); and
(v) the CCRT (2015); as well as
(vi) the distribution in 2012/13 of windfall profits from the sale of gold in 2009/10 to the PRGT
Subsidy Account.
Net disbursements for capacity development (technical assistance and training) over the period
FY1999-FY2016.
______________________
1/ Years refer to start of new fundraising round (in some cases multi-year) approved by the Executive Board.

QUOTAS—DATA UPDATE AND SIMULATIONS
INTERNATIONAL MONETARY FUND 81
Box IV.2. Liquidity and Financial Contributions: Considerations in the Past
Liquidity provision by members to the Fund has played a role in several earlier quota reviews. [Several
countries with strong external positions received ad hoc quota increases to improve the liquidity of the
Fund. In this context, financial contributions to the Fund that went beyond the provision of quota resources
have played a role (e.g., GAB, NAB participation). Liquidity considerations and the provision of financial
resources have generally been a supplementary criterion in determining the recipients of ad hoc increases.
In general, the quotas of these recipients were considered to not adequately reflect their economic
positions.]
1958/1959 Review: Special increases in addition to the overall 50 percent increase were given to Canada,
Germany, and Japan to reflect both economic factors (their position in world trade) and their ability to
contribute to the Fund’s liquidity.
4th Quinquennial Review (1965) and ad hoc increase for Italy (1964): Special increases for 16 members
(including Germany, Canada, Japan, and Sweden, which were among the 10 GAB participants at the time)
were provided in addition to the overall 25 percent increase in quotas resulting in a total increase of 30.7
percent. Just prior to the conclusion of the 4th Quinquennial Review, the quota of Italy—another GAB
participant—had been almost doubled to improve Fund liquidity and for comparability with quotas of other
members.
Ad hoc increase for Saudi Arabia (1981): The ad hoc increase for Saudi Arabia which resulted in almost a
doubling of its quota was partly based on the need to improve Fund liquidity and the conclusion of the
borrowing arrangement with the Saudi Arabia Monetary Authority (SAMA).
9th General Review (1990): Japan received an ad hoc increase on top of the overall 50 percent general
increase in light of the large deviation between its actual and calculated quota share as well as its large
potential to strengthen the Fund’s liquidity.
11th General Review (1997): One percent of the overall increase was distributed to five members (Korea,
Luxembourg, Singapore, Malaysia, and Thailand—all NAB participants) whose quotas were significantly out
of line with their relative economic positions and which were expected to contribute to the Fund’s liquidity
over the medium term.

QUOTAS—DATA UPDATE AND SIMULATIONS
82 INTERNATIONAL MONETARY FUND
Table IV.1. Financial Contributions to the Fund: Selected Indicators
Source: Finance Department.
1/ NAB credit arrangements incorporating the rollback agreed by the Executive Board in December 2011.
2/ Based on USD/SDR exchange rate as of March 31, 2016.
3/ Cumulative loan commitments to the PRGT as of End-December 2015.
4/ Total bilateral resources received since 1987 for subsidizing concessional lending, and HIPC and MDRI debt relief, as of
End-December 2015.
5/ Cash contributions to the IMF for technical assistance and training (excluding in kind contributions), FY1999-FY2016.
6/ Including Czech Republic, Estonia, Korea, Latvia, Lithuania, Malta, Singapore, Slovak Republic, and Slovenia.
7/ Except for capacity development, which is in millions of US dollars.
8/ Currently PRGT-eligible countries plus Zimbabwe.
14th Review
Quota NAB with Bilateral Borrowing PRGT PRGT Capacity
Share Rollback 1/ Agreements 2/ Loans 3/ Subsidies 4/ Development 5/
Advanced Economies 57.6 75.0 68.4 91.4 80.2 84.8
Major advanced economies 43.4 57.9 46.0 73.7 60.1 61.7
United States 17.4 15.6 0.0 0.0 12.4 0.9
Japan 6.5 18.6 15.1 26.5 13.8 37.8
Germany 5.6 7.2 11.9 10.5 6.4 2.0
France 4.2 5.3 9.0 18.7 7.5 1.6
United Kingdom 4.2 5.3 3.3 5.1 9.7 9.6
Italy 3.2 3.8 6.7 8.3 5.1 0.9
Canada 2.3 2.1 0.0 4.6 5.2 8.9
Other advanced economies 14.3 17.1 22.4 17.7 20.0 23.1
Spain 2.0 1.9 4.3 4.3 1.3 0.6
Netherlands 1.8 2.5 3.9 3.6 3.2 3.6
Australia 1.4 1.2 1.6 0.0 1.2 3.9
Belgium 1.3 2.2 2.9 2.7 2.4 1.8
Switzerland 1.2 3.1 0.0 4.2 2.2 7.1
Sweden 0.9 1.3 2.4 0.0 3.0 0.9
Austria 0.8 1.0 1.8 0.0 1.4 0.0
Norway 0.8 1.1 2.1 1.7 1.4 2.5
Ireland 0.7 0.0 0.0 0.0 0.2 0.0
Denmark 0.7 0.9 1.5 1.1 1.4 0.9
Emerging Market and Developing Countries 6/42.4 25.0 31.6 8.6 19.8 15.2
Africa 4.4 0.2 1.2 0.0 2.2 5.7
South Africa 0.6 0.2 0.0 0.0 0.4 0.0
Nigeria 0.5 0.0 0.0 0.0 0.4 0.0
Asia 16.0 14.0 18.0 6.1 7.5 1.7
China 6.4 8.8 9.9 3.8 2.0 0.4
India 2.7 2.5 2.5 0.0 1.3 0.0
Korea 1.8 1.9 3.8 2.3 1.6 1.2
Indonesia 1.0 0.0 0.0 0.0 0.2 0.0
Malaysia 0.8 0.2 0.3 0.0 0.8 0.0
Singapore 0.8 0.4 1.0 0.0 0.5 0.0
Thailand 0.7 0.2 0.3 0.0 0.4 0.0
Middle East, Malta, and Turkey 6.7 3.3 4.7 2.5 4.3 5.9
Saudi Arabia 2.1 3.1 3.4 1.9 2.6 0.3
Turkey 1.0 0.0 1.2 0.0 0.4 0.0
Iran, Islamic Republic of 0.7 0.0 0.0 0.0 0.3 0.0
Western Hemisphere 7.9 4.3 2.3 0.0 2.9 1.8
Brazil 2.3 2.5 0.0 0.0 0.2 0.2
Mexico 1.9 1.4 2.3 0.0 1.2 0.9
Venezuela, R.B. de 0.8 0.0 0.0 0.0 0.0 0.0
Argentina 0.7 0.0 0.0 0.0 1.0 0.0
Transition economies 7.2 3.2 5.5 0.0 2.9 0.1
Russia 2.7 2.5 2.5 0.0 1.4 0.1
Poland 0.9 0.7 1.8 0.0 0.2 0.0
Total 100.0 100.0 100.0 100.0 100.0 100.0
Memorandum Item:
Total contributions (in millions of SDRs) 7/ 180,233 281,834 26,158 7,438 1,125
EU28 30.4 33.6 52.3 54.4 44.6 22.6
LICs 8/ 3.3 0.0 0.0 0.0 0.9 2.8
Share in Financial Contributions to

QUOTAS—DATA UPDATE AND SIMULATIONS
INTERNATIONAL MONETARY FUND 83
Table IV.2. Financial Contributions to the Fund: Aggregate Measures
Source: Finance Department.
1/ Average of contribution shares in NAB, 2012 Bilateral Agreements, PRGT-loans, PRGT-subsidies, and TA activities.
2/ Same as 1/ with weights of 0.3 for NAB, 0.3 for 2012 Bilateral Agreements, 0.2 for PRGT loans and subsidies combined, and 0.2
for Capacity Development.
3/ Measure of "generous" contributions which uses the higher of 14th Review quota share or VFCS I share rebased to ensure that
total shares add up to 100 percent.
4/ Including Czech Republic, Estonia, Korea, Latvia, Lithuania, Malta, Singapore, Slovak Republic, and Slovenia.
5/ Including China, P.R., Hong Kong SAR, and Macao SAR.
6/ Currently PRGT-eligible countries plus Zimbabwe.
14th Review Calculated
Quota Quota VFCS I 1/ VFCS II 2/ VFCS III 3/
Share Share (CQS)
Advanced Economies 57.6 50.7 79.9 77.8 68.0
Major advanced economies 43.4 36.1 59.9 57.7 52.1
United States 17.4 14.3 5.8 5.4 12.7
Japan 6.5 5.3 22.4 22.4 16.3
Germany 5.6 5.1 7.6 8.0 5.5
France 4.2 3.3 8.4 7.9 6.1
United Kingdom 4.2 3.6 6.6 5.7 4.8
Italy 3.2 2.5 5.0 4.9 3.6
Canada 2.3 2.1 4.2 3.4 3.0
Other advanced economies 14.3 14.6 20.0 20.1 15.9
Spain 2.0 1.8 2.5 2.7 1.8
Netherlands 1.8 2.1 3.4 3.4 2.5
Australia 1.4 1.5 1.6 1.7 1.2
Belgium 1.3 1.1 2.4 2.4 1.7
Switzerland 1.2 1.6 3.3 3.1 2.4
Sweden 0.9 0.9 1.5 1.4 1.1
Austria 0.8 0.7 0.8 0.9 0.6
Norway 0.8 0.8 1.8 1.8 1.3
Ireland 0.7 0.7 0.0 0.0 0.5
Denmark 0.7 0.6 1.2 1.1 0.9
Emerging Market and Developing Countries 4/ 42.4 49.3 20.1 22.2 32.0
Africa 4.4 3.7 1.9 1.7 3.7
South Africa 0.6 0.5 0.1 0.1 0.5
Nigeria 0.5 0.7 0.1 0.0 0.4
Asia 16.0 23.5 9.5 11.2 11.9
China 5/ 6.4 12.0 5.0 6.4 4.7
India 2.7 3.0 1.3 1.6 2.0
Korea 1.8 2.0 2.1 2.3 1.6
Indonesia 1.0 1.3 0.0 0.0 0.7
Malaysia 0.8 0.8 0.3 0.2 0.6
Singapore 0.8 1.3 0.4 0.4 0.6
Thailand 0.7 1.0 0.2 0.2 0.5
Middle East, Malta, and Turkey 6.7 7.2 4.1 4.2 5.3
Saudi Arabia 2.1 1.7 2.3 2.4 1.7
Turkey 1.0 1.1 0.3 0.4 0.7
Iran, Islamic Republic of 0.7 0.8 0.1 0.0 0.5
Western Hemisphere 7.9 7.4 2.3 2.5 5.8
Brazil 2.3 2.3 0.6 0.8 1.7
Mexico 1.9 1.7 1.2 1.3 1.4
Venezuela, R.B. de 0.8 0.5 0.0 0.0 0.6
Argentina 0.7 0.6 0.2 0.0 0.5
Transition economies 7.2 7.6 2.3 2.7 5.3
Russia 2.7 2.7 1.3 1.6 2.0
Poland 0.9 0.9 0.5 0.8 0.6
Total 100.0 100.0 100.0 100.0 100.0
Memorandum Item:
EU28 30.4 27.5 41.5 40.7 32.7
LICs 6/ 3.3 2.2 0.8 0.6 2.5
Various aggregate measures