Quilcene Bay Shellfish Hatchery Discharge Study
44
Quilcene Bay Shellfish Hatchery Discharge Study PREPARED FOR Coast Seafoods Company A. John Petrie, President 14711 NE 29 th Place, Suite 111 Bellevue, WA 98007 PREPARED BY: J.E. Jack Rensel, Ph.D. Rensel Associates Aquatic Sciences System Science Applications Inc. February 7, 2013
Transcript of Quilcene Bay Shellfish Hatchery Discharge Study

Quilcene Bay Shellfish Hatchery Discharge Study
PREPARED FOR Coast Seafoods Company A. John Petrie, President 14711 NE 29th Place, Suite 111 Bellevue, WA 98007 PREPARED BY: J.E. Jack Rensel, Ph.D. Rensel Associates Aquatic Sciences System Science Applications Inc. February 7, 2013

Quilcene Bay Shellfish Hatchery Discharge Study ii
Table of Content
Executive Summary ......................................................................................................................... 1
Introduction .................................................................................................................................... 4
Location and Setting ................................................................................................................... 4
Quilcene Bay Morphology and Prior Water Quality Studies ...................................................... 5
Environmental Setting, Nutrient Sensitivity ............................................................................... 7
Overview of Facility Processes .................................................................................................... 8
Facility Layout and Study Sampling Strategy: ............................................................................. 9
Methods ........................................................................................................................................ 12
Field Measurements ................................................................................................................. 12
Water Flow Measurement .................................................................................................... 12
Nutrients, Solids and Chlorophyll a Sample Collection ........................................................ 13
Load Calculation ........................................................................................................................ 13
Dissolved Oxygen, Salinity, Temperature, and pH Probe Calibration ...................................... 13
Laboratory Analysis ................................................................................................................... 14
Results and Discussion .................................................................................................................. 15
Water Budget ............................................................................................................................ 15
Tabular Data Tables .................................................................................................................. 16
Dissolved Inorganic Nitrogen (DIN) .......................................................................................... 21
Bay Water Inflow DIN............................................................................................................ 22
DIN Discharge Concentrations .............................................................................................. 23
Discharge DIN Loading .......................................................................................................... 24
Total Nitrogen ........................................................................................................................... 26
Soluble Reactive Phosphorus and Total Phosphorus ............................................................... 26
Total Suspended Solids ............................................................................................................. 27
Chlorophyll a and Phaeophytin a ............................................................................................. 27
Field Measurements of Water Quality ..................................................................................... 30
Potential Discharge Reduction Possibilities .............................................................................. 30
Literature Cited ............................................................................................................................. 32
Appendix ....................................................................................................................................... 34

Quilcene Bay Shellfish Hatchery Discharge Study iii
List of Figures
Figure 1. Vicinity Map of Quilcene Bay in North Hood Canal, adjacent to Dabob Bay. ................. 5
Figure 2. Aerial photograph of Coast Seafoods Company Shellfish Hatchery. ............................... 5
Figure 3. Bathymetric map of Quilcene Bay with location of shellfish hatchery indicated. .......... 6
Figure 4. Schematic layout of Coast Seafoods Company facilities near the shoreline of Quilcene
Bay. Not to scale. ......................................................................................................................... 10
Figure 5. Low tide photo showing the South Channel and other features as noted................... 11
Figure 6. Discharge from Large Setting Tanks shown while periodically flowing. ....................... 12
Figure 7. Mean flow rates of North and South Channels and large setting tank discharge,
adjusted to average daily rates in the case of the tank discharge as described herein. .............. 15
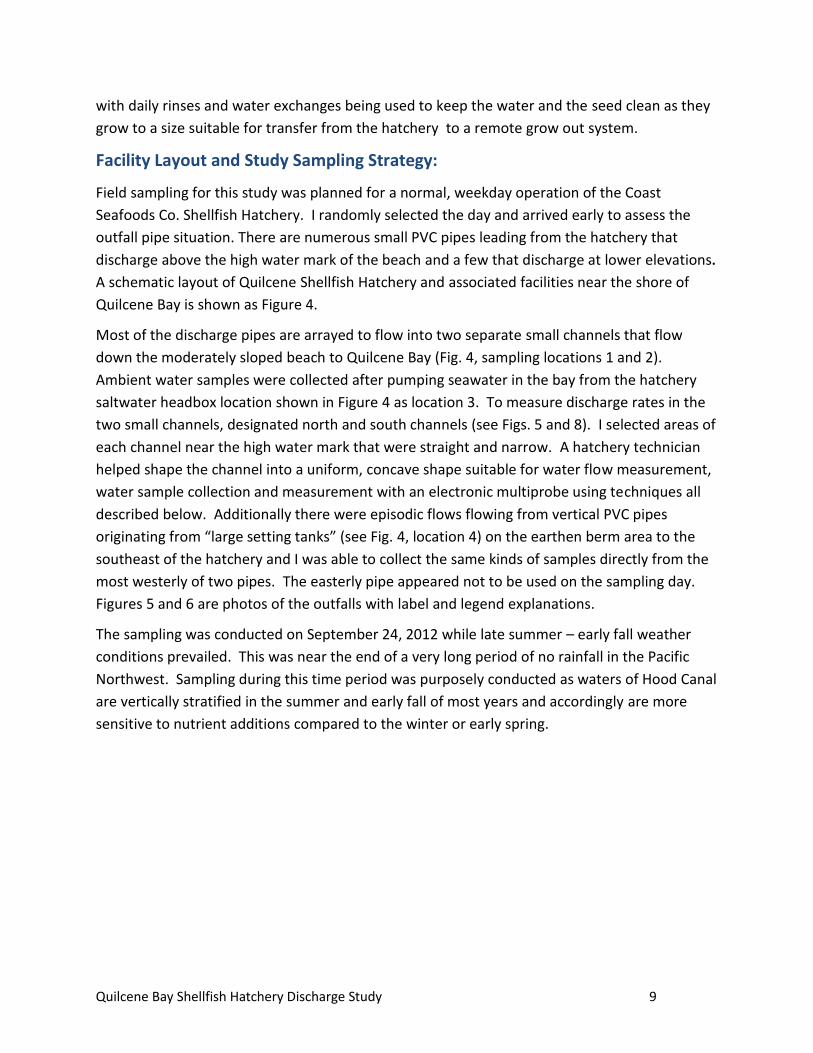
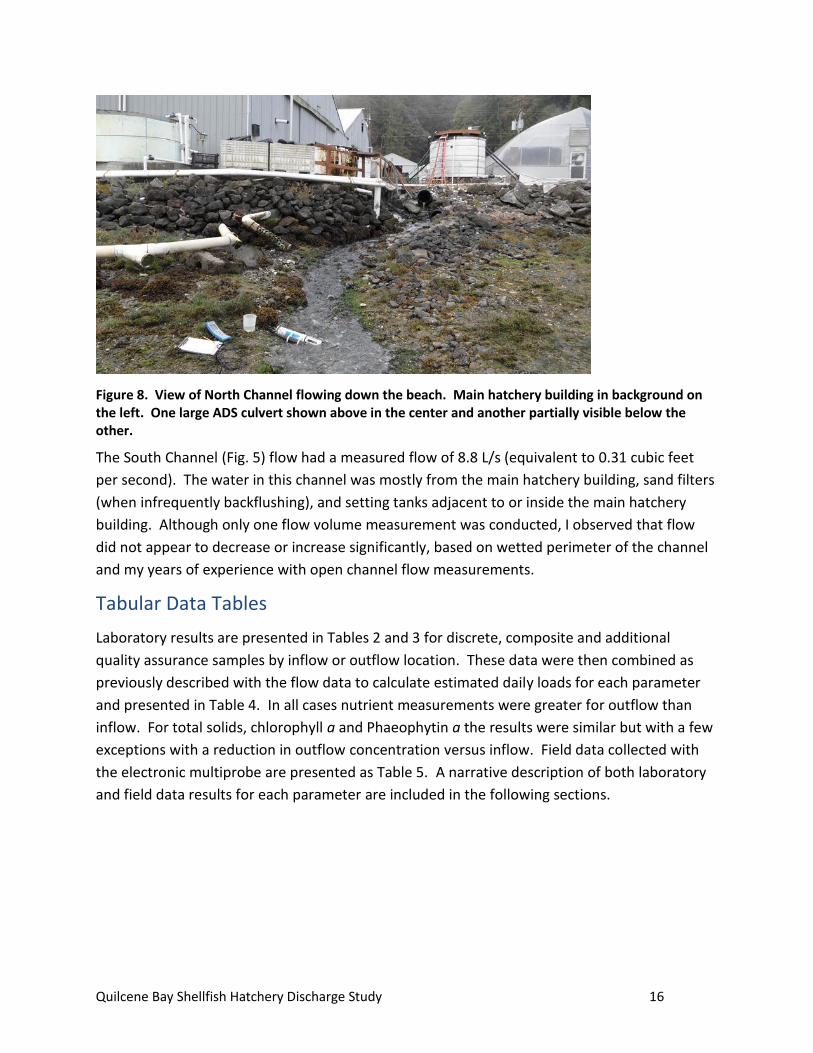
Figure 8. View of North Channel flowing down the beach. Main hatchery building in
background on the left. One large ADS culvert shown above in the center and another partially
visible below the other. ................................................................................................................ 16
Figure 9. Discrete DIN South Channel results (left) and North Channel (right)............................ 21
Figure 10. Composite DIN results both channels (left) and discrete DIN: Large Setting Tanks
(right). ........................................................................................................................................... 21
Figure 11. (Upper left) Discrete chlorophyll a sample results, inflow vs. South Channel outflow.
....................................................................................................................................................... 29
Figure 12. (Upper right) Discrete chlorophyll a sample results, inflow vs. North Channel
outflow. ......................................................................................................................................... 29
Figure 13. (Lower left) Composite chlorophyll a samples from afternoon period from inflow
and both channels outflow. .......................................................................................................... 29
Figure 14. Shellstock with juveniles oysters on Quilcene Bay intertidal beach immediately
north of the beach in front of the main hatchery building. North Channel facility outflow and
seasonal freshwater creek seen in the foreground. ..................................................................... 31
List of Tables
Table 1. Laboratory analysis units, methods, analysis date and detection limits. ...................... 14
Table 2. Laboratory results for discrete, composite and additional quality assurance samples by
inflow or outflow location and flow type for total nitrogen, total phosphorus, soluble reactive
phosphorus (~ orthophosphate) and ammonia nitrogen. ............................................................ 17
Table 3. Laboratory results for discrete, composite and additional quality assurance samples by
inflow or outflow location and flow type for total ammonia nitrogen, nitrate + nitrite nitrogen,
dissolved inorganic nitrogen, total suspended solids, chlorophyll a and phaeophytin a. ........... 18
Table 4. Calculated daily loads in kilograms of each sampled parameters. ................................ 19
Table 5. Field electronic measurement results. Multiple sequential measurements were made
at most of these sampling events, as shown, to evaluate short-term variability. ....................... 20
Table 6. Mean values for field measurements of water quality. ................................................. 30

Quilcene Bay Shellfish Hatchery Discharge Study 1
Executive Summary
This report details the results of sampling and monitoring activities at Coast Seafoods
Company’s shellfish hatchery in Quilcene Bay, Washington. These activities discussed herein
were undertaken at the request of the Washington Department of Ecology in an effort to
determine whether Coast Seafood Company’s hatchery operations negatively impact water
quality and fish species in Quilcene Bay. The results reported here demonstrate that the
amount of change of hatchery intake and the hatchery discharge water, measured in terms of
specific volumes of key parameters, were very small. Collectively, the results suggest that Coast
Seafoods Company’s hatchery discharge water would not negatively or measurably impact
water quality or fish species in Quilcene Bay.
1) Study Purpose
This study was conducted to provide a description of outflow characteristics of the Coast
Seafoods Company shellfish hatchery during a single, typical working day. The hatchery is
located on the shore of Quilcene Bay in Hood Canal, Washington State and has been a long time
and major producer of shellfish seed for the shellfish industry. Quilcene Bay is a productive
estuary with extensive shallows in north Hood Canal. South and central Hood Canal have a
history of nutrient related problems, including hypoxic subsurface waters, and have been the
subject of much study. Prior studies of water quality in Quilcene Bay have focused only on fecal
coliform and other bacterial contaminant measures that affect shellfish growout and other uses
of the area.
2) Study Methods
Field measurements of flow rates and water quality parameters along with collections of water
samples for chemical laboratory analysis were collected in warm, sunny conditions during late
September 2012. Individual discrete samples were collected throughout a normal working day.
Composite samples were collected at four intervals throughout the afternoon and early evening
of the same day. Inflow and discharge concentrations and flow rates were combined to
estimate net increases in measured water quality parameters and daily loading.
3) Seawater Use
Hatchery water use was estimated to be approximately 27.3 liters per second, not including
seawater pumped and returned without use as excess water. Seawater is returned to the bay
and therefore is not a consumptive use.
4) Nitrogen Discharge
Nitrogen is considered the principal limiting nutrient of algae production in local waters of
Puget Sound, Hood Canal and the study area, Quilcene Bay. Inflowing ambient water of

Quilcene Bay Shellfish Hatchery Discharge Study 2
Quilcene Bay was relatively rich in dissolved inorganic nitrogen (DIN) on the day of sampling.
Daily discharge of this biologically important nutrient was estimated to be 0.46 kg. There were
modest amounts of variability in the concentration DIN in measured discharges. The portion of
ammonia nitrogen in the DIN was relatively small (20.1%) and the toxic fraction of free
ammonia (NH3) was very small and would not cause any chronic or acute fish morality, even if
undiluted. Some of the small volume of discharged DIN would contribute to the production of
algae (sea grass and phytoplankton) in Quilcene Bay or Hood Canal over a relatively long period
of time. Total nitrogen input, which includes DIN and other forms, of which some are less
biologically available, was estimated at 0.88kg/d.
5) Phosphorus Discharge
Phosphorus is also an important nutrient for growth of algae in aquatic systems, but not as
important as nitrogen in most marine waters. In this study phosphorus was found to be more
abundant than nitrogen in the inflow, when considered in terms of the physiological
requirements of algae. This analysis shows that background levels of phosphorus were replete
to the point that any added phosphorus from any source would not further increase
phytoplankton abundance, i.e., phosphorus was not limiting to the algal population. Most of
the total phosphorus measured was in the form of soluble reactive phosphorus (SRP), the form
more readily used by algae, and estimated daily discharge loads of both were very small at 0.2
kg/d and 0.08 kg/d for TP and SRP, respectively.
6) Total Suspended Solids
This measure of the amount of dry solids in water was found to be relatively low in both the
inflow and outflow seawater samples, averaging 4.8 mg/L in the former and 6.8 mg/L in the
later. The sample with the highest value measured (13.3 mg/L) was noticeably turbid, but that
condition lasted only for a short interval during the backflushing of raw seawater solids from a
sand filter. Throughout the sampling day, except for the above backflushing event, no other
turbid water was observed. It is important to realize that filter backflushed materials are
naturally occurring from the Bay and not a product of the shellfish hatchery. In other words,
short periods of turbidity in the discharge water are not the result of anything that is added at
the hatchery with the possible exception of some occasional tank-drawdown water.
7) Chlorophyll a and Phaeophytin a
Discrete samples had moderately low mean of 1.8 to 3.7 µg/L chlorophyll a in the inflow and
outflow samples, respectively, with two exceptions. One inflow sample was 5.1 µg/L when
measured just past noon; and composite sample consisting of four parts taken over the entire
afternoon from the North Channel yield the result of 115 µg/L. However, the single discrete
sample from the North Channel taken in late afternoon had a chlorophyll a concentration of
only 2.9 µg/L. The most plausible explanation was that one of the subsamples making up the

Quilcene Bay Shellfish Hatchery Discharge Study 3
composite sample was from a period of algal tank drawdown, which only occurs for short
periods of time that time of day. Naturally occurring breakdown product of chlorophyll a,
known as phaeophytin a, was found in low concentrations in all samples, except for two
samples from the North Channel and one sample from the South Channel collected during the
late morning sand filter backflushing.
8) Field Measurement of Water Quality
Water temperature, salinity, dissolved oxygen and pH were monitored periodically in the inflow
and outflow discharges. There was some variance among locations sampled and time of
sample but nothing notable or remarkable that would affect the Bay given the small volumes of
water involved.
9) Discharge Loading Summary
This study illustrates that the net increase in loading of key discharge components such as
dissolved inorganic nitrogen and total solids to Quilcene Bay from this commercial facility are
very small. The estimated loads are conservatively based as explained herein, and would
probably be considerably lower if not based solely on sampling during daylight, hatchery
operating hours. The results indicated some considerable variability within and among
sampling locations that in most cases could be explained by operations such as culture tank
drawdown or seawater inflow filters being backflushed. Both were arguably sampled more
than adequately compared to the infrequent and short duration of their occurrence.
10) Possible Hatchery Alterations
The measurable discharge characteristic of the Coast Seafoods Company Shellfish Hatchery in
this survey were minimal. There are no permitting or legal requirements for treatment of such
small volumes of discharge from the small biomass of larval shellfish produced. However, there
may be opportunities to further reduce discharge during future hatchery renovation or
remodeling when a more comprehensive planning of the discharge plumbing. Biological and
mechanical treatment options are outlined that may or may not be technically or economically
feasible subject to engineering study.

Quilcene Bay Shellfish Hatchery Discharge Study 4
Introduction
Commercial shellfish hatcheries have existed in the Pacific Northwest U.S. for over four
decades. Prior to their introduction, shellfish growers were required to catch juvenile shellfish
spat (larvae) on shell or other materials. This process was not reliable every year and led to
significant production problems until hatchery-produced seed became available. By necessity,
shellfish hatcheries are located in shoreline areas and must pump seawater to grow the larval
shellfish. Seawater used during normal hatchery operations is returned to the water source.
The purpose of this report is to describe the results of effluent sampling at the Coast Seafoods
Company shellfish hatchery located on the shores of Quilcene Bay in Hood Canal, Washington.
To the best of my knowledge, there have been no prior studies of shellfish hatchery discharge
in the region or elsewhere in North America. In part, this is because most observers recognize
that the volume of water pumped to these hatcheries is small, non-consumptive (i.e., it flows
back near its withdrawal point), and shellfish culture is generally considered ecologically
beneficial due to the removal of phytoplankton and other seston. Many coastal areas suffer
from cultural eutrophication (human caused over-enrichment of key nutrients) that leads to a
variety of water quality problems. But the net flux of nutrients and other properties of sea
water in, versus out, of these hatcheries has never been studied.
This report is organized into an introduction section that provides the physical and ecological
setting of the hatchery and its water supply drawn from Quilcene Bay, an overview of the
processes that occur in the hatchery, the intake and discharge piping arrangements and the
sampling strategy employed for the one day sampling event. A methods section provides
details of field and laboratory protocols and methods. A results and discussion section provides
the water budget and the nutrient, solids, and chlorophyll a budget results.
Location and Setting
The Coast Seafoods Co. Hatchery is located on the west shore of Quilcene Bay in North Hood
Canal, Washington State in an area known as the Olympic Peninsula (Fig. 1). Hood Canal is
connected by seawater to Admiralty Inlet, in the main basin of Puget Sound. The facility is
adjacent and immediately north of a small marina shown in the aerial photo (Fig. 2). The main
hatchery building is apparent as the large building near the shore in Figure 2, and other support
facilities and offices are located in the background, across the public road known as Linger
Longer Road. This road terminates immediately to the south (left) of the facilities shown in
Figure 2.

Quilcene Bay Shellfish Hatchery Discharge Study 5
Figure 1. Vicinity Map of Quilcene Bay in North Hood Canal, adjacent to Dabob Bay.
Figure 2. Aerial photograph of Coast Seafoods Company Shellfish Hatchery.
Quilcene Bay Morphology and Prior Water Quality Studies
Quilcene Bay is a productive estuary that functions as the initial habitat for seaward heading
salmon smolts from two rivers and several small streams. Returning adult salmon wait in the
bay and approaches for freshets and cooler water in the fall to ascend their native streams
(Bernthal and Rot 2001). Historically, in addition to being a premier area for growout of
shellfish such as Pacific and native Olympia oysters, Quilcene Bay was the site of oyster seed
collection on cultch (hard substrate) that the industry relied on for extensive beach culture
stocking. However, Quilcene Bay is physically different from adjacent Dabob Bay, a nearby bay
used for similar shellfish purposes, in that it has three major streams contributing freshwater,

Quilcene Bay Shellfish Hatchery Discharge Study 6
and it is much smaller and shallower. The entry to Quilcene Bay has a maximum depth of about
70 m and about one third of the northern, inner bay is intertidal. The bathymetric chart (Fig. 3)
indicates green shallow areas that are less than zero meter tidal level depth (MLLW datum).
Blue areas of the map range between zero meters and 30 m depth. White areas are > 30 m
deep on this chart, with north direction to the left.
Figure 3. Bathymetric map of Quilcene Bay with location of shellfish hatchery indicated.
The Coast seafood company hatchery is located on shore in the middle regions of Quilcene Bay
shoreline near the end of Linger Longer Road. Saltwater supply to the hatchery for non-
consumptive use is provided by two intake pipes located offshore to about 4 and 6 meters
depth. The lowest intertidal and immediate subtidal areas of Quilcene Bay are replete with
abundant growth of eelgrass. Eel grass not only anchors bottom sediments in place but
provides a matrix for colonization of its surfaces with epiphytic algae and small invertebrates
that are highly important to higher trophic level organisms of the marine food web. The
Quilcene River along with the Little Quilcene River and Donovan Creek dominate this area with
freshwater peak combined flows exceeding 1,000 cubic feet per second (Cook 1984). The
sediment from these flows flux through the Bay and forms a relatively steep drop-off in the
shallow subtidal zone of this area not far from the hatchery intake.
No existing and published water quality data about Quilcene Bay nutrients, solids or chlorophyll
a results were found prior to preparation of this report. Several prior short term studies have
examined fecal coliform bacterial conditions in the bay that was previously a problem (Gately
(1992). Golder Associates (2003) reported a “declining trend in fecal coliform counts over the
period of 1995 to 2001”. Water quality of Quilcene Bay has been classified as “AA” or
“Extraordinary” by the Washington State Department of Ecology (Gately 1992).

Quilcene Bay Shellfish Hatchery Discharge Study 7
Environmental Setting, Nutrient Sensitivity
All of Hood Canal including Quilcene Bay is designated under Washington Administrative Code
173-201-612 (Table 612) to have the highest use rating of “extraordinary” for aquatic life and
shellfish uses. However, this water body has existing problems, some naturally caused and
some a result of human activities. Many of the problems relate to nutrient enrichment,
especially nitrogen. A brief review of the role of nitrogen in Hood Canal and Puget Sound is
warranted here as background to consider the results of this study.
Dissolved nutrients that are typically measured include the dissolved nitrogen forms: nitrate,
nitrite and ammonia. These forms are of principal interest because nitrogen is usually the least
available and hence limiting factor for phytoplankton productivity in Puget Sound waters.
Dissolved organic nitrogen such as urea may also be an important contributing source of
phytoplankton-available nitrogen. Nitrogen pools are not static but cycle relatively rapidly
between dissolved and particulate forms, as well as inorganic and organic forms.
Often nitrogen is in the form of nitrate in the main basins of Puget Sound and is in naturally
abundant supply, and hence are not a limiting factor (Winter et al. 1975). Certain subareas of
Puget Sound are less well flushed with ocean and riverine water during the natural estuarine
flow process (i.e., in from the ocean at depth, out at the surface with riverine flow with some
reflux and mixing at sills). Puget Sound including Hood Canal subareas were first classified as to
nutrient sensitivity and subsurface hypoxia with available data in 1991 (Rensel Associates and
PTI Environmental Services 1991). In this study Hood Canal subareas Dabob Bay and South
Hood Canal were ranked as number one and two in nutrient sensitivity in Puget Sound and
North Hood Canal (excluding Dabob Bay) was ranked 22nd.
South and central Hood Canal have had recurring deepwater hypoxia events, often in summer
or late fall when the deepwater will surface, causing fish or other biota mortality. Subsurface
hypoxia were first discovered during intensive surveys in the 1950s (Collias et al. 1974) and was
found to affect surface waters when deep mixing occurs. The issue has subsequently been
studied by many others along with other forcing factors such as nutrient supply (e.g., Newton et
al. 2002, Paulson et al. 2006). Typically the nitrogen sensitive areas of Puget Sound have strong
vertical density gradients near the surface in the summer and early fall. Surface waters rapidly
become warmer by insolation and/or freshwater stratification. These waters are then depleted
of available dissolved nitrogen by phytoplankton uptake, and the species composition shifts.
Diatoms that cannot survive in quiescent conditions are replaced by dinoflagellates and
microflagellates that are able to utilize subsurface nutrients and vertically migrate upwards in
daytime to obtain sunlight. The warm, nutrient depleted surface layer is often of high
transparency and low productivity in these areas during late spring through part of the fall
season. If anthropogenic nutrients of sufficient quantities are discharged into such waters at

Quilcene Bay Shellfish Hatchery Discharge Study 8
these times, much of these nutrients may be taken up for immediate growth by the existing
stocks of phytoplankton that can lead to eutrophication of the water body.
It may seem counter-intuitive that low levels of nitrogen in surface waters of some Puget Sound
waters during the algal growing season equates to a high degree of nutrient sensitivity. It is
equally puzzling to some that high levels of nitrogen are common in well flushed and physically
active areas such as the Strait of Juan de Fuca and the main basin of Puget Sound. However, in
these latter areas, other factors limit phytoplankton productivity. Among these factors,
availability of sunlight is especially important. Low light levels in the winter or deep vertical
mixing of the algal cells in summer to depths where it is relatively dark directly reduce algal
growth rates. Water temperature also affects algal growth (Eppley 1972) and combined low
light levels and a high degree of vertical mixing negate the importance of nutrient supply.
Considerable variability in estuary type, location, morphology, and function exists with regard
to algal production and eutrophication risks throughout the various US marine ecoregions
(Bricker et al. 1999).
Overview of Facility Processes
The Coast Seafoods Company Quilcene Shellfish Hatchery uses broodstock from its own
sources, which incorporates wild set oysters into the spawns for genetic diversity. These are
spawned to produce larvae in “batches” that are fed with a variety of phytoplankton cultivated
from axenic and unialgal cultures that are commercially available. Sunlight and artificial light
provide for photosynthesis of the phytoplankton that have growth (“doubling”) rates up to 1.5
per day (Toro 1989). Controlling the water temperature, providing adequate nutrients, in
addition to adequate light, carbon dioxide and circulation, facilitate the rapid phytoplankton
growth. The nutrient supply is carefully dosed into the culture tanks, and the rates are reduced
as the phytoplankton get closer to being harvested, in order to avoid any residual nutrients in
the culture that is fed to the shellfish larvae and seed. As the phytoplankton grow the water
becomes more oxygenated due to photosynthesis.
Larvae are held in large tanks with seawater, and fed controlled amounts of the phytoplankton
culture. The feed rate is reduced after 10-15 days when larvae achieve the pediveliger stage.
At this stage, larvae are moved to a setting system, primarily to outdoor tanks containing
bagged oyster shell. The pediveligers settle on a shell, and are raised in the tank for 8 to 15
days, being fed phytoplankton, until they have obtained a big enough size to be shipped to a
grow out nursery. The other method of settling larvae is the downwelling system, which
produces a downward flow of water in a container with a screened bottom. The pediveligers
swim to the bottom to settle and metamorphose into spat on a substrate of ground shell. As
the seed grows, the downwelling is switched to upwelling, changing the flow so that it comes
up through the screen and out the top of the container. The seed is fed algal-rich seawater,
Quilcene Bay Shellfish Hatchery Discharge Study 9
with daily rinses and water exchanges being used to keep the water and the seed clean as they
grow to a size suitable for transfer from the hatchery to a remote grow out system.
Facility Layout and Study Sampling Strategy:
Field sampling for this study was planned for a normal, weekday operation of the Coast
Seafoods Co. Shellfish Hatchery. I randomly selected the day and arrived early to assess the
outfall pipe situation. There are numerous small PVC pipes leading from the hatchery that
discharge above the high water mark of the beach and a few that discharge at lower elevations.
A schematic layout of Quilcene Shellfish Hatchery and associated facilities near the shore of
Quilcene Bay is shown as Figure 4.
Most of the discharge pipes are arrayed to flow into two separate small channels that flow
down the moderately sloped beach to Quilcene Bay (Fig. 4, sampling locations 1 and 2).
Ambient water samples were collected after pumping seawater in the bay from the hatchery
saltwater headbox location shown in Figure 4 as location 3. To measure discharge rates in the
two small channels, designated north and south channels (see Figs. 5 and 8). I selected areas of
each channel near the high water mark that were straight and narrow. A hatchery technician
helped shape the channel into a uniform, concave shape suitable for water flow measurement,
water sample collection and measurement with an electronic multiprobe using techniques all
described below. Additionally there were episodic flows flowing from vertical PVC pipes
originating from “large setting tanks” (see Fig. 4, location 4) on the earthen berm area to the
southeast of the hatchery and I was able to collect the same kinds of samples directly from the
most westerly of two pipes. The easterly pipe appeared not to be used on the sampling day.
Figures 5 and 6 are photos of the outfalls with label and legend explanations.
The sampling was conducted on September 24, 2012 while late summer – early fall weather
conditions prevailed. This was near the end of a very long period of no rainfall in the Pacific
Northwest. Sampling during this time period was purposely conducted as waters of Hood Canal
are vertically stratified in the summer and early fall of most years and accordingly are more
sensitive to nutrient additions compared to the winter or early spring.

Quilcene Bay Shellfish Hatchery Discharge Study 10
Figure 4. Schematic layout of Coast Seafoods Company facilities near the shoreline of Quilcene Bay. Not to scale.

Quilcene Bay Shellfish Hatchery Discharge Study 11
Two types of samples were collected, discrete and composite. Discrete samples are single
samples from one sampling event. Composite samples involve collection of equal aliquots of
sample at different time periods that are combined in a single container for analysis as one
sample. Composite samples help determine the mean concentration of a parameter without
the expense of individual samples. Discrete samples are necessary to estimate variability over
time. In the present context for the two main discharge channels, discrete samples were taken
in the early morning, late morning and again later in the afternoon. Composite samples of the
channels were taken four times throughout the afternoon into the early evening. Only a single
morning sample was collected for the Large Setting Tanks described above, as the flooding tide
covered the outlet by late morning and this source did not flow continuously.
Figure 5. Low tide photo showing the South Channel and other features as noted.

Quilcene Bay Shellfish Hatchery Discharge Study 12
Figure 6. Discharge from Large Setting Tanks shown while periodically flowing.
Methods
Field Measurements
Water Flow Measurement
Seawater is pumped in excess of the needs of the hatchery to keep adequate hydraulic head in
the various headbox supply tanks throughout the system. As a result, many of the discharges
seen from observers are actually just raw, unaffected seawater being returned to the bay and
the flow rates from these pipes were not measured because the data were not needed in the
analysis.
Volumetric discharge of the two discharge channels flowing across the beach were measured
along cross channel profiles using the 2/3 depth method of the USGS. I used a topset wading
rod and a Swoffer 2200 digital time-averaging meter and mini propeller unit, previously
calibrated as per manufacturers recommendations. Usually two readings at each of at least
three cross section centers are taken, but the channels were too shallow and small so only one
velocity measurement per cross channel section was recorded. Efforts were made to use a
hydraulically smooth and straight channel area. The total flow per channel was calculated by
multiplying the discharge velocity in feet per second units multiplied by the cross sectional area
in square feet, resulting in a product in cubic feet per second. Subsequently all units were
converted to Liters per second. In the case of the large setting tank discharge pipe, collection of
water of a known volume was performed while measuring elapsed time to estimate Liters per
second of flow.

Quilcene Bay Shellfish Hatchery Discharge Study 13
Nutrients, Solids and Chlorophyll a Sample Collection
Discrete samples were collected from the target water source by withdrawing 60ml of water
with an acid rinsed, 60ml syringe. A 25 mm filter holder, fitted with a GF/F filter was rinsed
with ~15ml of the sample water and the remaining volume placed in a previously washed (with
10% HCL) poly bottle that was capped, placed immediately in a cooler with slush ice and
delivered to the laboratory the next morning for analysis. The except was for total nitrogen and
total phosphorus samples that were collected similarly, but without the filtration step.
As a quality control measure, a subset of the nutrient samples were also collected in the field
without filtration in the following manner. 250 ml poly bottles that had been previously acid
washed with 10% HCL were rinsed twice with sample water and then filled completely, capped
and placed immediately in a cooler filled with slush ice for transportation to the laboratory the
next morning after sampling. These samples were taken at the same time as a subset of the
discrete samples discussed above so that the results could be compared, to assess the effects of
filtration versus raw water and filtration later in the laboratory. Often samples are collected in
the field without filtration but bacteria and other plankton in the sample can alter the
composition of the nutrient samples and this was a check to see if both methods were
providing similar results or not.
Load Calculation
Loading rates of nutrients, solids, chlorophyll a and Phaeophytin a were calculated by
multiplying the concentration of the parameter in mg/L by the flow rate in liters per second.
Because the first has volume in the denominator and the second in the numerator, the volume
term (liters) cancels out leaving the resulting quotient in weight (milligrams, later converted to
kilograms) per unit time (seconds, later converted to units of days).
For the two main channels that were sampled, I used two sets of discrete samples in the
morning of the sampling day and the composite sample of the afternoon. I considered it four
time periods (early morning, late morning, early afternoon, late afternoon) and therefore
averaged the discrete values with the composite values by using the composite value twice for
a total N of four per parameter, unless you consider there were four parts to the composite
sample and in that case the N would be six per parameter.
Dissolved Oxygen, Salinity, Temperature, and pH Probe Calibration
I measured several water quality parameters directly in the field because of increased accuracy
and precision as recommended by APHA (1989) and the Puget Sound Protocols (EPA 1986,
1990). These include water temperature, pH, salinity, and dissolved oxygen. Anecdotal
information and observations regarding water appearance, plant abundance, fish presence,
water level, and any unusual occurrences are recorded for each station, when appropriate.

Quilcene Bay Shellfish Hatchery Discharge Study 14
A Hydrolab 4a multiprobe sonde connected to a Hydrolab surveyor display and recording unit
were used to monitor these parameters. The dissolved oxygen probe’s membrane and DO
electrolyte were replaced a week prior to sampling. The unit was calibrated the day before
sampling using water saturated air and the Hydrolab’s built in barometer that had been also
calibrated within 10 minutes using real time reports available from the nearest airport, in this
case about 5 miles from my office location. The DO unit again calibrated just prior to sampling
at the site, using the Hydrolab barometer and water saturated air. Readings before and after
calibration were recorded and observed for large variation, but none were seen. The salinity
probe was calibrate as per manufacturer’s recommendations with 25.8 psu salinity filtered
seawater provided by the University of Washington’s Routine Chemical Laboratory in the
Oceanography Department. Water temperature was checked in the field once in the morning
of the sampling against a laboratory grade mercury thermometer and found to be in
compliance. The pH probe was calibrated the day before with fresh pH 7 and pH 10 calibration
buffer to bracket the expected range of seawater pH.
Laboratory Analysis
Samples were transported the following morning after sampling in ice filled coolers to Aquatic
Research Inc., a Washington State Department of Ecology certified laboratory, for analyses.
Methods were used as listed in Table 1. More details including QAQC results available in
Appendix C.
Table 1. Laboratory analysis units, methods, analysis date and detection limits.

Quilcene Bay Shellfish Hatchery Discharge Study 15
Results and Discussion
Water Budget
As described above in the introduction, there are three locations where flow was measured,
two of them are stream-like channels that flow across the beach from a number of contributed
pipes and one pipe discharge from the large setting tanks on the earthen berm between the
hatchery and the marina.
Flow rates appeared relatively constant in both or the measured channels where flow from
most of the hatchery and related facility, with the North Channel being the largest single source
of return flow water from the hatchery to the bay (Fig. 7) at nearly 16.8 Liters per second
(herein units shown as L/s, each equivalent to 0.6 cubic feet per second).
Figure 7. Mean flow rates of North and South Channels and large setting tank discharge, adjusted to average daily rates in the case of the tank discharge as described herein.
Water in the North Channel appeared to originate from the lower of two large culverts shown
in the background of Figure 8, that is a mixture of a small freshwater creek and shellfish
facilities on the west side of Linger Longer Road (located in the background of the photograph
shown as Fig. 2). I noted later in the day visually that the flow appeared to be slightly less, but
the 16.8 L/s value was conservatively used in the calculations of load shown later in this report.
Flow rate from the large setting tanks was much less than the two channels at only 1.6 L/s
when considered on a daily basis. Instantaneous measurements were 5x that value but for
computational purposes all data were considered in terms of daily units.
Quilcene Bay Shellfish Hatchery Discharge Study 16
Figure 8. View of North Channel flowing down the beach. Main hatchery building in background on the left. One large ADS culvert shown above in the center and another partially visible below the other.
The South Channel (Fig. 5) flow had a measured flow of 8.8 L/s (equivalent to 0.31 cubic feet
per second). The water in this channel was mostly from the main hatchery building, sand filters
(when infrequently backflushing), and setting tanks adjacent to or inside the main hatchery
building. Although only one flow volume measurement was conducted, I observed that flow
did not appear to decrease or increase significantly, based on wetted perimeter of the channel
and my years of experience with open channel flow measurements.
Tabular Data Tables
Laboratory results are presented in Tables 2 and 3 for discrete, composite and additional
quality assurance samples by inflow or outflow location. These data were then combined as
previously described with the flow data to calculate estimated daily loads for each parameter
and presented in Table 4. In all cases nutrient measurements were greater for outflow than
inflow. For total solids, chlorophyll a and Phaeophytin a the results were similar but with a few
exceptions with a reduction in outflow concentration versus inflow. Field data collected with
the electronic multiprobe are presented as Table 5. A narrative description of both laboratory
and field data results for each parameter are included in the following sections.

Quilcene Bay Shellfish Hatchery Discharge Study 17
Table 2. Laboratory results for discrete, composite and additional quality assurance samples by inflow or outflow location and flow type for total nitrogen, total phosphorus, soluble reactive phosphorus (~ orthophosphate) and ammonia nitrogen.

Quilcene Bay Shellfish Hatchery Discharge Study 18
Table 3. Laboratory results for discrete, composite and additional quality assurance samples by inflow or outflow location and flow type for total ammonia nitrogen, nitrate + nitrite nitrogen, dissolved inorganic nitrogen, total suspended solids, chlorophyll a and phaeophytin a.

Quilcene Bay Shellfish Hatchery Discharge Study 19
Table 4. Calculated daily loads in kilograms of each sampled parameters.
*average of two AM samples and PM composite sample weighted twice **single estimate only (due to submerged discharge after low tide period

Quilcene Bay Shellfish Hatchery Discharge Study 20
Table 5. Field electronic measurement results. Multiple sequential measurements were made at most of these sampling events, as shown, to evaluate short-term variability.
Location TimeWater
TemperatureSalinity
Dissolved
Oxygen
D.O.
SaturationpH Barometer IBVSvr4a
HHMMSS degree C ppt mg/l Sat Units inHg Volts
Intake 9:21:42 13.4 26.09 6.86 76.6 -- 30.49 7.7
9:27:07 14.2 25.19 6.72 76.0 -- 30.50 7.7
South Channel 9:33:24 12.9 27.31 7.82 87.2 -- 30.49 7.6
North Channel 9:46:19 24.0 24.89 6.86 94.1 7.8 30.50 7.5
9:49:07 23.4 24.65 6.87 93.0 7.8 30.49 7.4
9:52:09 23.5 24.48 6.91 93.5 7.8 30.49 7.4
Lg. Setting Tanks 10:07:56 18.8 25.93 7.31 91.2 7.9 30.48 7.4
South Channel 11:10:33 11.7 27.13 7.05 76.5 7.4 30.46 7.4
11:10:43 11.6 28.45 7.06 77.0 7.4 30.47 7.4
11:10:55 12.1 27.24 7.03 77.0 7.4 30.47 7.4
11:11:03 13.4 25.72 7.06 78.8 7.3 30.46 7.4
11:11:13 14.2 24.23 7.11 79.9 7.2 30.46 7.4
11:11:20 14.3 24.28 7.18 80.8 7.2 30.47 7.4
South Channel 11:13:21 13.0 27.46 7.45 83.3 7.6 30.42 7.3
11:13:41 12.7 27.84 7.57 84.2 7.6 30.44 7.3
11:14:08 13.3 27.15 7.34 82.4 7.6 30.43 7.3
Intake 14:01:49 14.2 27.27 9.07 104.0 7.9 30.44 7.5
14:02:09 14.2 27.34 9.15 104.9 7.9 30.44 7.5
14:02:24 14.2 27.37 9.19 105.4 7.9 30.43 7.4
South Channel 14:03:55 14.2 28.19 8.43 97.1 7.9 30.43 7.4
14:04:17 14.3 27.99 8.47 97.7 7.8 30.43 7.4
14:04:27 14.2 27.96 8.4 96.7 7.8 30.43 7.4
North Channel 14:09:38 14.9 28.49 7.58 88.7 7.7 30.44 7.4
14:10:06 14.9 28.50 7.59 88.8 7.7 30.42 7.4
14:10:30 14.9 28.49 7.56 88.5 7.7 30.44 7.4
14:11:23 14.9 28.44 7.54 88.4 7.7 30.43 7.4
Intake 15:48:22 15.0 27.00 9.16 106.5 8.0 30.40 7.9
15:48:34 15.0 27.02 9.18 106.7 8.0 30.39 7.8
15:48:46 15.0 26.97 9.18 106.7 8.0 30.40 7.8
South Channel 15:51:37 15.4 27.95 8.21 96.9 8.1 30.40 7.8
15:51:52 15.4 27.93 8.22 97.0 8.1 30.40 7.8
15:52:11 15.4 27.96 8.22 97.1 8.1 30.41 7.8
North Channel 15:58:30 19.5 0.84 7.93 86.3 7.8 30.43 7.7
15:58:49 19.5 2.52 7.87 86.3 7.8 30.41 7.7
15:59:22 19.5 2.21 7.89 86.5 7.8 30.40 7.7
Intake 16:41:34 14.5 27.07 9.21 105.9 8.0 30.43 7.7
16:41:42 14.5 27.13 9.23 106.2 8.0 30.43 7.7
16:41:58 14.4 27.12 9.18 105.6 8.0 30.44 7.7
16:42:08 14.5 27.08 9.17 105.5 8.0 30.43 7.6
South Channel 16:46:28 14.8 27.18 8.62 100.0 8.0 30.44 7.6
16:46:41 14.8 27.06 8.62 100.0 8.0 30.43 7.6
16:46:55 14.8 27.27 8.61 99.9 8.0 30.43 7.6
16:47:06 14.8 27.19 8.64 100.2 8.0 30.44 7.6
16:47:20 14.8 24.56 8.62 100.1 8.0 30.44 7.6
16:47:32 14.8 26.68 8.65 100.1 8.0 30.44 7.6
16:47:42 14.9 27.16 8.62 100.1 8.0 30.45 7.6
North Channel 16:51:39 19.5 23.68 6.92 86.4 7.8 30.43 7.5
16:52:04 19.7 23.79 6.85 86.1 7.8 30.43 7.5
16:52:14 19.8 23.87 6.83 85.9 7.8 30.43 7.5
16:52:23 19.9 23.89 6.81 85.8 7.8 30.43 7.5
16:52:33 19.9 23.97 6.78 85.5 7.8 30.42 7.5
16:52:41 20.0 24.00 6.76 85.5 7.8 30.44 7.5
16:52:52 20.1 24.05 6.75 85.5 7.8 30.44 7.5
N Channel Lower
Culvert only16:54:48 21.5 23.99 6.19 80.5 7.8 30.43 7.5

Quilcene Bay Shellfish Hatchery Discharge Study 21
Dissolved Inorganic Nitrogen (DIN)
Dissolved nutrients measured included dissolved nitrogen forms: nitrate, nitrite and
ammonia are of principal interest as nitrogen is usually the least available and hence
limiting factor for phytoplankton and other plant productivity in Puget Sound waters as
discussed in the introduction.
Special emphasis is placed on DIN, as discussed in the introduction, because it is the
primary nutrient controlling biomass of algae (phytoplankton or algae and marine
plants) when other factors such as sunlight or temperature do not exert a controlling
effect. A series of figures below illustrate the change between inflowing bay water
composition and discharge water composition (Figs. 9 and 10, left or right half).
Figure 9. Discrete DIN South Channel results (left) and North Channel (right).
Figure 10. Composite DIN results both channels (left) and discrete DIN: Large Setting Tanks (right).

Quilcene Bay Shellfish Hatchery Discharge Study 22
Bay Water Inflow DIN
The inflowing bay water results indicated DIN values ranging from 0.17 to 0.28 mg/L
DIN with an average of 0.23 mg/L (SD = 0.07 mg/L). Stated in units of µg atoms/L (or
µM, pronounced “micromoles”, the units used in oceanography and ecology
disciplines) the average just stated is equivalent to 16.4 µM. This background
concentration is relatively high value for the open, near-surface waters of North Hood
Canal in late summer. This result may be due to the hatchery intakes drawing seawater
from ~4 to 6 m deep below the MLLW mark and the location in a shallow estuary with
riverine influences. In this study, when river and creek flows were near annual low
volume of late summer, hatchery inflow salinity averaged 26.8 psu during sampling.
This value is slightly less than the broad annual average of ~28.5 psu that occurs in
most Puget Sound basins that do not have major contributing rivers such as the Skagit
River. Some biofouling exists within the hatchery intake pipe (Pers. Comm., David
Vandenberg, Hatchery Operations Manager) and this may account for some of the
higher than expected inflow DIN concentration, but flow rates are high inside the
pumped seawater pipes, so dilution of biofouling wastes would be great and it is
probable that most of the observed high background DIN concentration was due to
existing conditions in the Bay water.
For perspective, historical data from the April through November period of 1975
through 1989 from surface waters of nearby Washington State Dept. of Ecology Dabob
Bay station HCB002 averaged 0.095 mg/L (N = 331, SD = 0.112) and all data (surface,
10m and 30m combined) average 0.215 mg/L (N = 999, SD = 0.169) from the
Department’s Long Term Water Quality Data Base. In oceanographic terms, the
historical averages were 6.8 µM for near surface and 15.4 µM for all depths combined
compare reasonably to the mean intake value in this study of 16.4 µM. Older data such
as the cited historical data were often of poorer accuracy and involved high (i.e., poor)
detection limits and is only cited here to show that the observed values in this study
are not totally unexpected. Furthermore, the main basins of Puget Sound and Hood
Canal often reach maximum values of DIN of about 28 µM in winter (Rensel Associates
and PTI Environmental Services 1991).
It is of interest that background, inflow DIN on the day of sampling was more than
sufficient in Quilcene Bay to provide all types of phytoplankton cells or seaweed with
adequate nitrogen for uptake and growth. How often this condition persists in
Quilcene Bay is unknown, as there are no other quality, recent nutrient data available
to the best of my knowledge. Again, the goal of this study was not to fully characterize
water quality in Quilcene Bay but rather to compare the shellfish hatchery facilities
inflow versus outflow water quality during summer or early fall conditions. See the

Quilcene Bay Shellfish Hatchery Discharge Study 23
introduction for an overview of nutrient sensitivity and how low surface and near
surface concentrations of DIN represent increased nutrient sensitivity during the calm,
warm summer season, which confuses the uninitiated who might think the opposite.
Quilcene Bay is a highly productive estuary, and it would be unjustified and speculative
to infer much more about ambient nutrient conditions based on this set of samples
from a single day.
DIN Discharge Concentrations
In all cases DIN discharge concentrations exceeded DIN inflow values. Upon inspecting
the data (Tables 2 and 3) it is clear there was moderate temporal and spatial variation
of the concentration of DIN in the discharge. This was expected as operation of the
hatchery and related facilities involves a variety of episodic processes, several that are
short term and aperiodic. The most variable results were from the North Channel
discrete samples that ranged from 0.951 mg/L DIN in the midmorning to 0.26 mg/L in
the late afternoon (Fig. 9, right, compared to 0.282 and 0.168 mg/L for the respective
inflows).
A quality control duplicate sample of North Channel 9:45AM sample indicated much
lower results of 0.26 mg/L. See Appendix C for a discussion of this. I conservatively
selected the higher discharge result shown in Figure 9 (right). This altered the total
loading analysis below, but not greatly.
South Channel discharge DIN concentrations were much less and more constant (Fig. 9,
left). The afternoon composite samples from both channels were similar (Fig. 10, left)
and very similar to all other afternoon DIN samples. The single sample from the large
Setting Tank discharge had a concentration of 0.54 mg/L DIN.
These water samples were collected during normal operation with a few exceptions:
1) The 11AM South Channel discrete sample (Fig. 11, left) was collected during raw
water sand filter backflushing event of brief duration. Nevertheless, DIN
concentration was only 38% greater than the prior inflow measurement values.
2) One of the four component samples of the afternoon composite samples for the
North Channel was collected when brownish water was flowing in the channel that
originated from algae tank drawdown that occurs that time of day (Pers. comm. D.
Vandenberg). DIN concentrations for the composite North Channel samples were
67% greater than inflow in this brief event. Because the composite samples were
from four time periods throughout the afternoon and early evening, the effects of
one backflushing in that sample would have been diluted by a factor of four.
Another consideration about DIN is the component ammonia nitrogen, which may
include toxic properties to aquatic organisms. Ammonia nitrogen averaged 20.1% of

Quilcene Bay Shellfish Hatchery Discharge Study 24
the dissolved inorganic nitrogen found in the laboratory DIN samples, with relatively
little variation (SD = 10.1%). The overall mean of all samples was 0.069 mg/L. Aqueous
total ammonia is composed of two constituent forms: ammonium (NH4+) which is not
toxic to marine organisms and ammonia (NH3, sometime termed “free ammonia”) that
is toxic. The proportions of each form vary based on pH and water temperature.
Higher pH and higher water temperatures result in a higher proportion of the toxic
form (NH3), with pH having the largest effect. So with low pH and low water
temperatures, higher total ammonia can be present without it being as toxic as at
higher pH and water temperatures.
In the present case with average water temperature of 16 C and pH 7.8, the proportion
of toxic ammonia would have been very small, about 0.001 mg/L or 1.4% of the
measured total ammonia. Such concentrations are safe for long term exposure to the
most sensitive fish, e.g., salmon, by a factor of about 20 (based on comparison to EPA
1989). These observed ammonia concentrations are also diluted immediately upon
entry into Quilcene Bay. Ammonia is not a conservative compound but is readily
oxidized by aerobic bacteria to nitrate in the presence of dissolved oxygen. The single
highest observed concentration of total ammonia was 0.141 mg/L from the North
Channel outflow at 9:45AM, a value that was still an order of magnitude less than the
chronic (long term) effects exposure concentration for the given conditions cited
above.
Discharge DIN Loading
Daily loads of hatchery source dissolved inorganic nitrogen and other parameters were
calculated from the above flow volume and DIN concentration data and were
summarized in Table 4. Daily loads were small by any consideration, totaling only 0.46
kg DIN per day for all measured sources. Had I used the duplicate data for the North
Channel, the total would have been 0.32 kg/d, but I chose conservatively to use the
higher value. This preliminary loading estimate accounts for the backflushing of
inflowing seawater filter and natural materials from the bay that are returned back to
the bay. The backflushed material is accounted for in both the inflow and outflow
rates, so it zeros out and need not be deducted from the outflow DIN rates. As shown
in Table 4, the largest contributor of DIN was the North Channel with much variability,
the South Channel and Large Setting Tanks yielded much less DIN.
While very small, the daily DIN loads over background conditions could be significant
over a small area if there was no tidal and other circulation in the bay. But there is
continual movement except for four slack tide periods each day, which distributes,
disperses and provides the DIN for food web assimilation over a large area. 1/2 kg of
nitrogen per day would not be detectable a few meters away from the point of

Quilcene Bay Shellfish Hatchery Discharge Study 25
entering the bay given these factors. I inspected the point where the two channels
enter the bay at low tide and did not observe any gross indicators of eutrophication
such as ulva spp. (sea lettuce), darkened sediments (from a shallow redox potential
discontinuity layer) or any other notable perturbation. The thriving food web of
Quilcene Bay, evidenced by the prolific eel grass beds, would have assimilation capacity
for this small amount of nitrogen during the algal growing season and in the winter
added DIN makes little or no biological change in this system.
The estimated natural oceanic input of DIN to Hood Canal varies from 10,100 to 34,000
metric tons per year (Paulson et al. 2006). The DIN load on an annual basis of the Coast
Seafoods Co. Shellfish Hatchery may be conservatively estimated to be 168 kg per year,
or 0.17 metric tons, using the above daily load. Had the sampling been conducted
throughout an entire day to include 2/3rds of the day that are non-working hours for
hatchery staff, the loading rates would have been much less as there would be no
manual filter backflushing or tank drawdowns contributing in the evening or at night.
There are several methods to estimate the diluted concentrations of DIN from any
discharge point at various distances after entering the receiving water. However, these
methods require estimates of the water body area and volume at different tidal levels
that are not presently available for Quilcene Bay. Such measurements and calculations
are beyond the scope of this report and not warranted given the very small loading
rates indicated in this study. Small bays that are relatively shallow with moderate or
more tidal amplitude do flush much quicker than large, deep bays and Quilcene Bay
falls into the former category.
Finally, the average dissolved inorganic nitrogen to phosphorus concentration ratio for
all measurements, by weight, was 4.4 to 1.0, indicating that nitrogen was relatively less
scarce than phosphorus, as expected. However, this metric is usually compared to the
Redfield Ratio of 7:1 (by weight) that reflects the physiological requirements of algae
for DIN and SRP and is often used as an indicator of what nutrient might be limiting to
algal growth (Redfield 1958). Hydrographic analysts use the Redfield Ratio, along with
a knowledge of the range of seasonal DIN concentrations relative to algal DIN kinetics
(i.e., DIN half saturation rates for uptake and growth) to make judgments about if
either N or P is a limiting factor for alga growth. In this case, all but one sample had an
N:P ratio less than 7 (or 16:1 for molecular weight), a point that indicates availability of
nitrogen and phosphorus are in optimum balance for algal growth and physiology.
Therefore, in terms of the physiological requirements of algae, nitrogen was relatively
more scarce but importantly, the nominal values of DIN were so high as to preclude
nitrogen (or phosphorus) limitation of algal growth at the time of sampling. See

Quilcene Bay Shellfish Hatchery Discharge Study 26
Liebig’s law of the minimum (limiting nutrient) for conceptual information on why only
one nutrient is usually considered limiting to algae production.
In summary of DIN results, background concentrations on the day of sampling were
relatively high to what is normally measured offshore in Hood Canal surface and near
surface waters of the so called “mixed” (by wind) layer. The deep layer is always
replete with nutrients. The location and depth of the hatchery intake is uncertain with
regard to most measurements available for Hood Canal mixed layer data. River and
creek contribution in Quilcene Bay may affect background DIN dynamics, along with
mixing caused by tidal action, winds and the abrupt transition of deeper Hood Canal
waters into the shallow inner Quilcene Bay near the hatchery intake location.
Whatever the cause, the total daily DIN loading rates of 0.46 kg for the shellfish
hatchery in this study were minor compared to natural flux of nitrogen into Hood Canal
and most likely also Quilcene Bay that occurs with every flood tide influx.
As mentioned above, there was intentional, conservative bias in the sampling and
loading estimates and because sampling was only conducted during the normal
working day, and did not include evening and nigh periods when hatchery operations
such as tank drawdown are minimal or non-existent.
Total Nitrogen
Total nitrogen (TN) includes all forms of nitrogen, dissolved and particulate as well as
inorganic and organic forms and is a good measure of the total amount of nitrogen that
may be available for cycling between biologically labile (e.g., DIN, urea, amino acids)
and refractive forms that are cycled slowly, or not at all. Concentrations of TN ranged
from 0.27 to 1.67 mg/L with the largest values from the Large Setting Tanks that
discharge infrequently. All TN measurements were only modestly correlated with DIN
results (r = 0.46) and weakly/inversely correlated with total phosphorus (TP). The total
daily load of TN was estimated to be 0.88 kg. The TN measurement may include
refractive forms on nitrogen that are not easily mineralized, hence I focus more on DIN
in this report.
Soluble Reactive Phosphorus and Total Phosphorus
Soluble reactive phosphorus (SRP, approximately equivalent to orthophosphate, PO4) is
the form of phosphorus that algae readily take up and use for growth and supporting
metabolism. It is required at approximately 1 part for each 7 parts nitrogen for algal
metabolism and is usually not limiting to algal growth in marine water due to adequate
supply. Although in estuaries and riverine influenced marine waters such as the South
China Sea (with huge rates of nutrient loading from rivers and other sources) it can be
the algal limiting nutrient (Xu et al. 2008). Total phosphorus (TP) analysis is used to

Quilcene Bay Shellfish Hatchery Discharge Study 27
describe the total pool of phosphorus, dissolved and particulate, organic and inorganic.
SRP is often a major component of TP.
SRP results by source varied from 0.04 to 0.28 mg/L and were greatest for the Large
Setting Tanks discharge. However, difference between inflow and outflow were minor,
only 0.03 mg/L (from calculations based on Table 2). Daily load of SRP was estimated
to be 0.08 kg (80 grams, Table 4).
TP results ranged from 0.05 to 0.32 mg/L, with the largest value from the North
Channel monitoring site. Average TP outflow was higher than inflow (0.07 mg/L and
0.14 mg/L, respectively) and not closely correlated to SPR (r = -0.12) or TSS (r = 0.06) as
is the case in some natural waters or discharge plumes. Daily load of TP was estimated
to be 0.2 kg (200 grams). Nor was TP closely correlated with total nitrogen
concentration (r = -0.18). Most of the measured TP was composed of soluble reactive
phosphorus as easily discerned by comparing the inflow versus outflow concentrations
mentioned above.
Total Suspended Solids
Total suspended solids (TSS) is a measure of the dry weight of solids that can be filtered
from water, typically with a glass fiber filter equivalent to ~0.5 to 2 microns pore size,
with units of measurement of milligrams dry solids per liter of sample water. TSS is
relatively inexpensive analysis and commonly used to characterize water and
wastewater. TSS in this study varied by source from 3.0 to 13.3 mg/L with an average
of 4.8 mg/L (N = 3, SD = 1.3) for the inflow versus outflow mean of 6.8 mg/L (N = 7, SD =
3.8). A one way ANOVA test of these results showed no statistical differences between
the inflow and outflow groups (F = 0.69, P = 0.496, DF = 1, 8). However, the highest
value observed (13.3 mg/L) was from the South Channel during a sand filter
backflushing event at 11:10AM. The water was colored for a short period and was
observed to vary between relatively clear and darker composition in the episode that
lasted less than 2 minutes. Sampling was conducted during the backflushing condition
for worst case analysis. Overall, these results indicate relatively low discharge of solids
from the hatchery. It must be emphasized that the sand filter backflushing is not
producing “new” solids to be discharged to the bay but rather is returning solids that
were previously in the bay and withdrawn from the intake system, although the state
of such materials can be altered through the filtering and backflushing process.
Chlorophyll a and Phaeophytin a
Chlorophyll a measurements represent the concentration of the primary
photosynthetic pigment in algae. For phytoplankton the measure is often used as a
surrogate indicator of the relative abundance or “standing stock” of phytoplankton in

Quilcene Bay Shellfish Hatchery Discharge Study 28
units of µg/L. The measure is widely used and although it does not inform directly with
regard to algal production rates, low chlorophyll a values are often indicative of
oligotrophic (nutrient poor) conditions while high values are often representative of
eutrophic (nutrient rich) conditions and high production rates. Grazing by zooplankton
and vertical stratification of the water column may complicate such oversimplifications.
Moreover, chlorophyll a sampling results are often misused to represent an entirely
benign food web base, when some algal forms (e.g., harmful algae) are not useful or
even harmful to higher food web components. Chlorophyll a measurements in Puget
Sound waters vary from near zero to 25 µg/L or more during major spring
phytoplankton blooms and in windrowed shallows may exceed 50 µg/L. Phaeophytin a
is the breakdown product of chlorophyll a and the ratio of the latter to the former is
sometimes used as an indicator of the status of the phytoplankton stocks being
measured because it is the live to dead ratio. High ratio values indicate healthy
conditions, low values indicate algal stock senescence or decaying conditions.
Hatchery inflow chlorophyll a results were moderate and identical at 2.4 µg/L from
morning and late afternoon inflow results, but increased to 5.1 µg/L for the single
inflow sample at 12:20PM. That result was not paired with any specific discharge
measurement as discrete discharge measurements were taken nearer in time to the
morning or late afternoon inflow sample collections.
Discharge results for chlorophyll a sampling varied extensively, as would be expected in
hatchery that grows and consumes large quantities of laboratory-cultured
phytoplankton. Figure 11 for the South Channel indicates lower chlorophyll a
concentrations for discharge versus intake at morning and late afternoon time
intervals, but the reverse for a sand filter backflushing event at 11AM. By pooling the
data from all time periods, there was no statistical difference (ANOVA, F= 0.001, P =
0.963, DF = 1, 4) between inflow or outflow but obviously any average result would be
influenced by sampling that happened to occur during a filter back flush versus not.
These results are also influenced by the fact that two of the three inflow data results
were identical and one of them, the 9:30AM inflow was also used for the comparison
at 11:00AM. As mentioned above, a separate single collection of inflow chlorophyll a
at 12:20PM yielded a much higher value of 5.1 µg/L. Had I used that value, or a mean
of the 9:30AM results, Figure 11 would indicate no probable increase of chlorophyll a in
any of the discharge results.
The morning and afternoon discrete samples from the North Channel indicated no
change or a reduction in Chlorophyll a content (Fig. 12). Afternoon composite samples
yielded low chlorophyll a results but the afternoon composite sample yielded a high
value of 115 µg/L. It was unlikely that this sample represented a continuous flow of

Quilcene Bay Shellfish Hatchery Discharge Study 29
such plankton rich water, as the single discrete sample result from the North Channel
in late afternoon was only 2.9 µg/L. More likely one of the four component samples in
the composite samples was collected during algal tank drawdown, which occurs in the
afternoon (Pers. comm. D. Vandenberg). The algal tanks in the hatchery are held at
very high chlorophyll a concentrations by an optimum combination of nutrient and
lighting as well as water temperature control.
Figure 11. (Upper left) Discrete chlorophyll a sample results, inflow vs. South Channel outflow.
Figure 12. (Upper right) Discrete chlorophyll a sample results, inflow vs. North Channel outflow.
Figure 13. (Lower left) Composite chlorophyll a samples from afternoon period from inflow and both channels outflow.
The chlorophyll a to phaeophytin a ratio ranged from 0.29 to 37.4 except for one of the
composite samples that was extremely high (720.0) for the North Channel afternoon
composite series. From visual observation during sampling, one of the four
components had a colored discharge that was apparently algal production left overs
that caused this spiking result. The one high sample pointed to a very vigorously
growing culture, with little phaeophytin breakdown product. At other times the North
Channel ratio was low, at 0.3 for both other sampling events.
Setting aside the one extremely high sample, inflow mean chlorophyll a to phaeophytin
a ratio averaged 24.2 (SD = 13.1) vs. outflow at all locations in Tables 2 and 3 that

Quilcene Bay Shellfish Hatchery Discharge Study 30
averaged 4.2 (SD = 6.2). Therefore the inflow was rich in live algae but the outflow
much less so but still well above the 1:1 ratio on average.
Field Measurements of Water Quality
The original field measurements of water quality (Table 5) were reduced to average
results for each sampling location and shown below in Table 6. Inflow and South
Channel were similar in water temperature and pH were similar for inflow and South
Channel but North Channel was considerably warmer and of lower salinity. Higher
temperatures in North Channel may result from hatchery processes including brood
stock maturation flows that are heated. Lower salinity is likely not from the hatchery
operation but rather freshwater seasonal drainage that shares this channel. Dissolved
oxygen was highest in the inflowing water 8.6 mg/L and 98.4% saturated), lower in
South Creek (7.9 mg/L and 90.5% saturated) and lowest in North Channel (7.3 mg/L and
88.6% saturated). The pH was relatively low at all locations averaging 7.93 in the inflow
and 7.77 in both channels. Reduced pH could be due to respiration of the shellfish in
the hatchery that adds carbon dioxide to the water, reducing pH as a result. None of
these results were remarkable or unexpected.
Table 6. Mean values for field measurements of water quality.
Location Water
Temperature Salinity
Dissolved Oxygen
D.O. Saturation
pH
Units degree C psu mg/l Sat Units
Inflow (Ambient) 14.3 26.8 8.6 98.4 7.93
South Channel 13.9 27.3 7.9 90.5 7.77
North Channel 19.5 19.7 7.3 88.6 7.77
Potential Discharge Reduction Possibilities
The measurable discharge characteristics of the Coast Seafoods Co. Shellfish Hatchery
in this survey were minimal. There are no permitting or legal requirements for
treatment of such small volumes of discharge from the small biomass of larval shellfish
produced in aquatic animal production facility such as this hatchery. However, there
may be opportunities to further reduce discharge during future hatchery renovation or
remodeling when plumbing could be more carefully classified and measured with
regard to flow volume and key discharge components. The following possible options
are suggested that would have to be evaluated and ranked for engineering efficiency
and cost:

Quilcene Bay Shellfish Hatchery Discharge Study 31
1) Mechanical Solids Collection: Design collection system of discharges that
separate those flows that include relatively more nutrients, solids and
chlorophyll into a physical or biological treatment. For example, a relatively
inexpensive and low maintenance bar screen or rotating sieve screen with fine
mesh could be fitted to the discharge to collect solids. The solids would contain
salt from the seawater, and would have to be disposed of accordingly in a
landfill, but the volumes are small, so it could be stored on site for some period
of time between transfers.
2) Biological Solids Collection: One possibility is to route the high solids discharges
toward shellstock being held in the nursery on the beach north of the facility
(Figure 14). Oysters are efficient users of solids including non-phytoplankton
seston and could extract some significant amount of backflushing materials and
excess algae or other solids in the waste stream. It may be problematic to route
discharge piping onto the beach near the shellstock, as it is occasionally
necessary to access that area with vehicles to place shellstock for seed
hardening before shipping and for recovery of shellstock for shipping. Also,
there may be limited space available to utilize the hydraulic head of the existing
discharge system for a shallow pond to grow oysters and capture effluent.
However, most of the effluent flow originating from the hatchery is not in need
of any treatment, so the volumes of more significant waste-bearing flows are
not large. This is an engineering topic and detailed discussion of it is beyond the
scope of the present study and report.
Figure 14. Shellstock with juveniles oysters on Quilcene Bay intertidal beach immediately north of the beach in front of the main hatchery building. North Channel facility outflow and seasonal freshwater creek seen in the foreground.

Quilcene Bay Shellfish Hatchery Discharge Study 32
Literature Cited
Bernthal, C. and B. Rot. 2001. Habitat conditions and water quality for selected
watersheds of Hood Canal and the eastern Strait of Juan de Fuca. Point No Point
Treaty Council. Kingston WA. 55 pp.
Bricker, S.B., C.G. Clement, D.E. Pirhalla, S.P. Orlando and D.R.G. Farrow. 1999. National
estuarine eutrophication assessment: Effects of nutrient enrichment in the
nation’s estuaries. NOAA, National Ocean Service, Special Projects Office and the
National Centers for Coastal Ocean Science.
Collias, E.E., N. McGary, and C.A. Barnes, 1974, Atlas of Physical and Chemical
Properties of Puget Sound and Approaches, Washington Sea Grant 74-1, Seattle,
WA.
Cook, K.V. 1984. Water quality study of Quilcene Bay, Jefferson County, Washington. Washington State Department of Social & Health Services, Office of Environmental Health Programs, Shellfish Program. 15 p. and appendix.
EPA. 1989. Ambient Water Quality Criteria for Ammonia (Saltwater)-1989. Office of Water and Regulatory Standards. EPA 440/5-88-004.
Eppley, R. W. 1972. Temperature and phytoplankton growth in the sea. Fish. Bull. 70: 1063–1085.
Gately, G. Final Report. 1992. Water quality in the Quilcene/Dabob watershed 1991. Jefferson County Planning and Building Department for Washington State Department of Ecology. Port Townsend, WA.
Golder Associates. 2003 Quilcene-snow watershed planning (SRIA 17) Water Quality Monitoring Plan. Final Report.
Newton, J.A., Albertson, S.L., Van Voorhis, K., Maloy, C., Siegel, E. 2002. Washington State Marine Water Quality in 1998 Through 2000. Publication #02-03-056. Washington State Department of Ecology, Environmental Assessment Program, Olympia, Washington.
Paulson, A.J., Konrad, D.P., Frans, L.M., Noble, M., Kendall, C., Joshberger, E.G., Juffman,R.L., and Olsen, T.D. 2006. Freshwater and saline loads of dissolved inorganic nutrients to Hood Canal and Lynch Cove, western Washington, U.S.
Geological Survey Scientific Investigations Report, 2006-5106, 92 p.
Rensel Associates and PTI Environmental Services. 1991. Nutrients and Phytoplankton in Puget Sound. Peer reviewed monograph prepared for U.S. Environmental Protection Agency, region 10, Seattle. Report 910/9-91-002. 130 pp.
Toro, J.E. 1989. The growth rate of two species of microalgae used in shellfish
hatcheries cultured under two light regimes. Aquaculture Research 20:249-254.

Quilcene Bay Shellfish Hatchery Discharge Study 33
Winter, D.F., K. Banse and G.C. Anderson. The dynamics of phytoplankton blooms in
Puget Sound, a fjord in the Northwest United States. Marine Biology. 29:139-176.
Xu et al. 2008. Phosphorus limitation in the northern South China Sea during late
summer: Influence of the Pearl River. Deep-sea Research. 55:1330-1342.

Quilcene Bay Shellfish Hatchery Discharge Study 34
Appendix
Appendix A. Aquatic Research Inc. Laboratory Report

Quilcene Bay Shellfish Hatchery Discharge Study 35

Quilcene Bay Shellfish Hatchery Discharge Study 36

Quilcene Bay Shellfish Hatchery Discharge Study 37
Appendix B. Chain of Custody for Laboratory Samples

Quilcene Bay Shellfish Hatchery Discharge Study 38

Quilcene Bay Shellfish Hatchery Discharge Study 39
Appendix C. Quality Assurance Summary
The overall objective of quality assurance/quality control procedures is to provide
useful data of known and acceptable quality. Five basic points describe data quality.
The accuracy of a procedure is determined by how close, on average, its result is to the
actual value. Precision describes the variability of results from a replicated procedure.
With high precision, the results of a procedure will be nearly the same for any number
of replications, whether or not the results are accurate. Data and results can be
considered complete if they satisfy the sampling and analysis plan guidelines and goals
for describing the environment. Representativeness describes how well the data
reflect actual site or regional conditions. Useful comparability of data, between years
and sites, requires consistent use of standardized methods. The certified laboratory
provide data QA/QC analysis for sediment total organic carbon, copper and zinc as well
as total solids, as shown in appendix B and C of this report.
Accuracy. Method accuracy is determined quantitatively using spike recovery results
and qualitatively using positive (QC check sample) and negative (blank) controls.
Matrix spikes determine the method performance for each batch of samples and
whether or not the sample matrix interferes with the method, while QC check samples
provide an independent verification of accurate laboratory standard calibration. See
the laboratory data report at the end of this report for details of results.
Precision. The precision of the TOC and metals duplicates was determined by analyzing
sample splits in the laboratory. It is not appropriate for TOC, in particular, to compare
field duplicates because there is great spatial variability in TOC content that arises from
difference in large organic particles that may or may not be sampled from immediately
adjacent surfaces of sediment in the same sample. Similarly, estimates of field
replicate precision are interesting, but it is not reasonable to expect low variance
because samples are taken from separate grab samples that may vary in their location
of collection on the bottom over a large area due to differences in grab sampler line
angle when sampling. Precision is expressed as relative percent difference (RPD) as
calculated by the spreadsheet use of Equation 1 on the raw data. We do not use
laboratory calculated values but will compare them to our calculated values as another
means to detect possible mistakes.
Equation 1: Precision Calculation:
RPD = [A - B] / (A + B/2) * (100)

Quilcene Bay Shellfish Hatchery Discharge Study 40
Where:
RPD is the relative percent difference between duplicate determinations. A and B are the results for the duplicate determinations. [A-B] is the absolute difference between the determinations
The laboratory report (Appendix A) presents a table of relative percent differences for
sample splits (duplicates), spiked samples and blank tests. All of the results were within
normally acceptable ranges with the nutrients showing the best duplicate analysis
results (<4.1%) , chlorophyll a at 5.7% and phaeophytin at 15.2%. These values are
normal for the latter two parameters. Spike recovery, QC check recovery and blanks
were also within expected ranges. This laboratory will automatically rerun any sample
that has QAQC results outside of expected ranges and will notify the client of the
original and retesting results. No such actions were necessary in this case.
Completeness. The developed data set is complete as stated in the sampling strategy
and methods section and meets the goals of this preliminary study. Samples for TP
(N=11), SRP (N= 14), Ammonia (N=14), NO3+NO2 (N= 14), TN (N=11), Chlorophyll a and
Phaeophytin a (N= 12 each) and TSS (N=10) were collected and analyzed.
Representativeness. The sampling was representative of the season (late summer) in
which nutrient sensitive conditions are most common. No unusual conditions or
weather occurred during the sampling period. The data set is therefore considered to
be representative.
Comparability. Field and laboratory measurements were collected and analyzed using
standard methods discussed in the methods that comply with current EPA and/or
Department of Ecology protocols for NPDES monitoring (although no NPDES permit is
involved for the tested facility discharge). Therefore, these data may be compared to
similarly collected data. Also, comparisons made between samples within the data set
are therefore valid.
Additional QAQC measures
During this survey, samples were filtered in the field as is my normal procedure.
However, it is acceptable to submit samples to a certified laboratory and have them
filtered to remove solids if that is done soon after collection. As an additional quality
control measure, one form of phosphorus (soluble reactive phosphorus) and three
forms of nitrogen (total nitrogen, nitrate+nitrite, ammonia nitrogen) were sampled for
laboratory filtering (done the next morning at the laboratory) at the same time that I
sampled and filtered otherwise duplicate samples. This was done at three intervals as
shown in the table below. All other samples were field filtered.

Quilcene Bay Shellfish Hatchery Discharge Study 41
The results of this comparison showed small (good) relative percent difference (RPD)
for most of the South Channel results and all but one of the inflow result. The inflow
results indicated a higher RPD (26.9) for ammonia nitrogen as a result of increased
concentrations from the laboratory filtered sample. In the North Channel case, the
reverse result was found for ammonia with higher concentration of the field filtered
sample resulting in an ammonia RPD of 20.2. Neither of these comparisons was
considered good, but still reasonably acceptable.
The only other comparison that was flagged was for the North Channel outflow at
9:45AM and was not acceptable, with a very high RPD of 102.9 that clearly indicated
some error in one or both of the sample collection of analysis procedures, more likely
the former that the latter as it is harder to filter in the field properly than in a clean,
controlled laboratory. This result was for the nitrate+nitrite analysis only. As there was
uncertainty regarding which sample would be correct, in this report load calculations
were based on the higher, more conservative result.
Appendix Table 1. QAQC comparison of field-filtered vs. laboratory-filtered nutrient samples.