QUICK SERVICE- FAST CASUAL AND CASUAL DINING …
31
Commercial Revalue 2014 Assessment Roll QUICK SERVICE- FAST CASUAL AND CASUAL DINING RESTAURANTS AREA 413 King County, Department of Assessments Seattle, Washington Lloyd Hara, Assessor
Transcript of QUICK SERVICE- FAST CASUAL AND CASUAL DINING …
Commercial Revalue
2014 Assessment Roll
QUICK SERVICE- FASTCASUAL AND CASUAL
DINING RESTAURANTS
AREA413
King County, Department of AssessmentsSeattle, Washington
Lloyd Hara, Assessor
Department of AssessmentsAccounting Division500 Fourth Avenue, ADM-AS-0740Seattle, WA 98104-2384
(206) 205-0444 FAX (206) 296-0106Email: [email protected]://www.kingcounty.gov/assessor/
Dear Property Owners:
Property assessments for the 2014 assessment year are being completed by my staff throughout theyear and change of value notices are being mailed as neighborhoods are completed. We value propertyat fee simple, reflecting property at its highest and best use and following the requirement of RCW84.40.030 to appraise property at true and fair value.
We have worked hard to implement your suggestions to place more information in ane-Environment to meet your needs for timely and accurate information. The following reportsummarizes the results of the 2014 assessment for this area. (See map within report). It is meant toprovide you with helpful background information about the process used and basis for propertyassessments in your area.
Fair and uniform assessments set the foundation for effective government and I am pleased that we areable to make continuous and ongoing improvements to serve you.
Please feel welcome to call my staff if you have questions about the property assessment process andhow it relates to your property.
Sincerely,
Lloyd HaraAssessor
Lloyd HaraAssessor

AREA 413 MAP
1
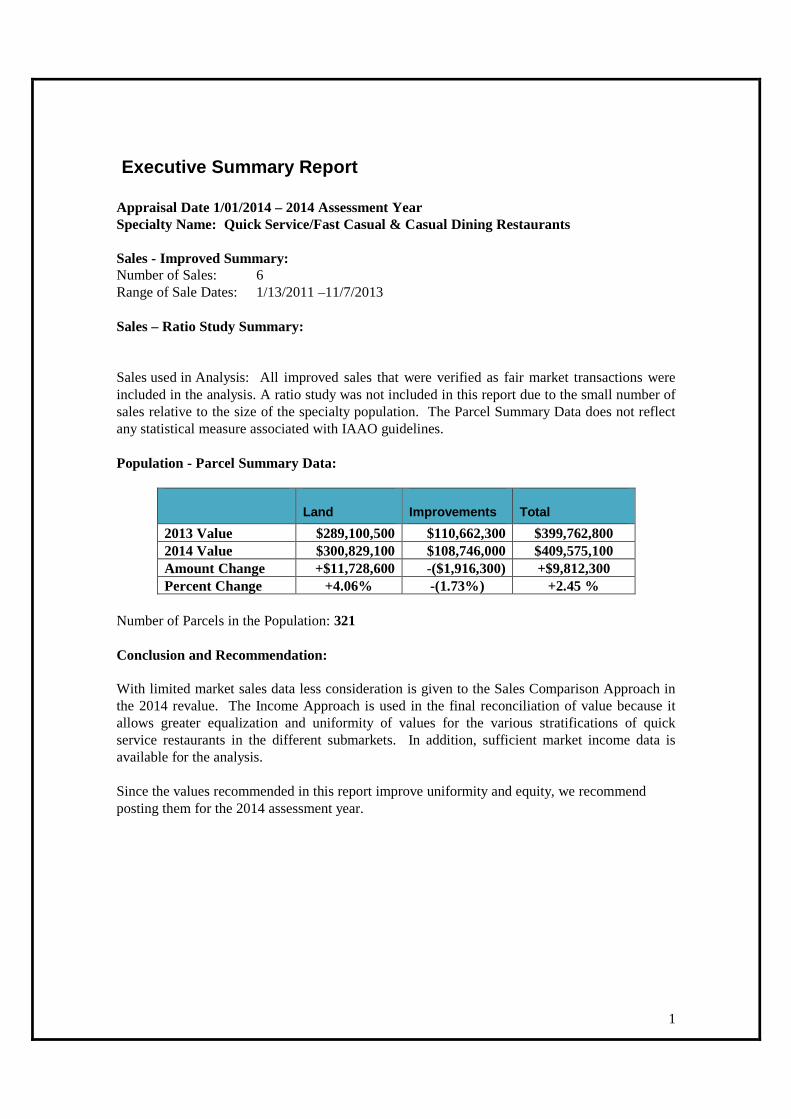
Executive Summary Report
Appraisal Date 1/01/2014 – 2014 Assessment YearSpecialty Name: Quick Service/Fast Casual & Casual Dining Restaurants
Sales - Improved Summary:Number of Sales: 6Range of Sale Dates: 1/13/2011 –11/7/2013
Sales – Ratio Study Summary:
Sales used in Analysis: All improved sales that were verified as fair market transactions wereincluded in the analysis. A ratio study was not included in this report due to the small number ofsales relative to the size of the specialty population. The Parcel Summary Data does not reflectany statistical measure associated with IAAO guidelines.
Population - Parcel Summary Data:
Land Improvements Total
2013 Value $289,100,500 $110,662,300 $399,762,8002014 Value $300,829,100 $108,746,000 $409,575,100Amount Change +$11,728,600 -($1,916,300) +$9,812,300Percent Change +4.06% -(1.73%) +2.45 %
Number of Parcels in the Population: 321
Conclusion and Recommendation:
With limited market sales data less consideration is given to the Sales Comparison Approach inthe 2014 revalue. The Income Approach is used in the final reconciliation of value because itallows greater equalization and uniformity of values for the various stratifications of quickservice restaurants in the different submarkets. In addition, sufficient market income data isavailable for the analysis.
Since the values recommended in this report improve uniformity and equity, we recommendposting them for the 2014 assessment year.
2
Analysis Process
Effective Date of Appraisal: January 1, 2014
Date of Appraisal Report: June 12, 2013
Highest and Best Use Analysis
As if vacant: Market analysis of this area, together with current zoning and currentanticipated use patterns, indicate the highest and best use of the majority of the appraisedparcels as commercial use. Any opinion not consistent with this is specifically noted inour records and considered in the valuation of the specific parcel.
As if improved: Based on neighborhood trends, both demographic and currentdevelopment patterns, the existing buildings represent the highest and best use of mostsites. The existing use will continue until land value, in its highest and best use, exceedsthe sum of value of the entire property in its existing use and the cost to remove theimprovements. We find that the current improvements do add value to the property, inmost cases, and are therefore the highest and best use of the property as improved. Inthose properties where the property is not at its highest and best use, a nominal value of$1,000.00 is assigned to the improvements.
Standards and Measurement of Data Accuracy: Each sale was verified with the buyer,seller, real estate agent, or tenant when possible. Current data was verified and correctedwhen necessary via field inspection.
Special Assumptions and Limiting Conditions
All three approaches to value were considered in this appraisal.
This report intends to meet the requirements of the Uniform Standards of ProfessionalAppraisal Practice, Standard 6.
Identification of the Area
Name or Designation: Area 413
This report contains data pertinent to the revalue of Quick Service Restaurants (QSR),AKA Fast Food Restaurants, Fast Casual Restaurants, and Casual Dining Restaurants.Specialty Area 413 encompasses all QSR restaurants, Fast Casual Restaurants and CasualDining Restaurants.
3
According to the National Restaurant Association (NRA), restaurants are divided intofour types: Type One (quick service); Type Two (fast casual); Type Three (casual dining)and Type Four (fine dining). McDonalds, Wendy’s, Burger King, Taco Bell, KFC, etc.are examples of QSR type restaurants. Examples of Type Two restaurants, fast casual;include Pizza Hut, Chipotle, Five Guy Burgers, Panera Bread, etc. Type Three, casualdining, examples include; Denny’s, IHOP, Applebee’s, Red Robin, Olive Garden, etc.Type Four, fine dining, are not valued in this report as they are valued by the King CountyAssessor’s area appraiser.
QSR, fast casual dining and casual dining restaurants are special-purpose properties oftenspecifically designed and tailored for major brand recognition. Area 413 includes thoserestaurants that have National recognition and are listed in the top 50 restaurant chains ineach category by the NRA.
The majority of the restaurants are “stand alone” structures with both land and buildingincluded in the property description. Restaurants that are not included in Area 413 suchas Subway and Starbucks is because they are, in most cases, located in retail centers inwhich they lease the space as part of a larger complex and are not stand alone facilities.
Ownership of QSR facilities includes both corporate owned restaurants and franchiseowned restaurants. The majority of the restaurants are owned by franchisees. Most of therestaurants are leased, with typical lease terms of twenty years with options for additionalfive year terms, with the exception of McDonalds. McDonalds has approximately 14,150restaurants in the USA of which approximately 12,600 (89%) are franchisee owned andthe balance are corporate owned stores, however McDonalds owns the land and buildingsof all of their stores and charges rent for the franchisee owned stores. The majority of therestaurants in the 413 Specialty are franchisee owned and operated stores. Burger Kinghas 97% of their restaurants franchised. On the other end of the relationship, i.e.franchisor/franchisee, is Subway with 25,500 outlets of which none are franchisee owned.
Boundaries:
The properties are located within King County.
Maps:
Assessor’s maps are located on the 7th floor of the King County Administration Building.
Area Description:
The QSR and casual dining restaurants in King County have been segmented into fiveneighborhood regions. These regions are described by their geographic location andrestaurant style. Significant concentrations, approximately 50%, are located in the SouthEnd (Kent, Auburn, Federal Way, Renton, & Tukwila) of the county. All QSR, fastcasual and casual dining restaurant specialty properties were revalued this year.
4
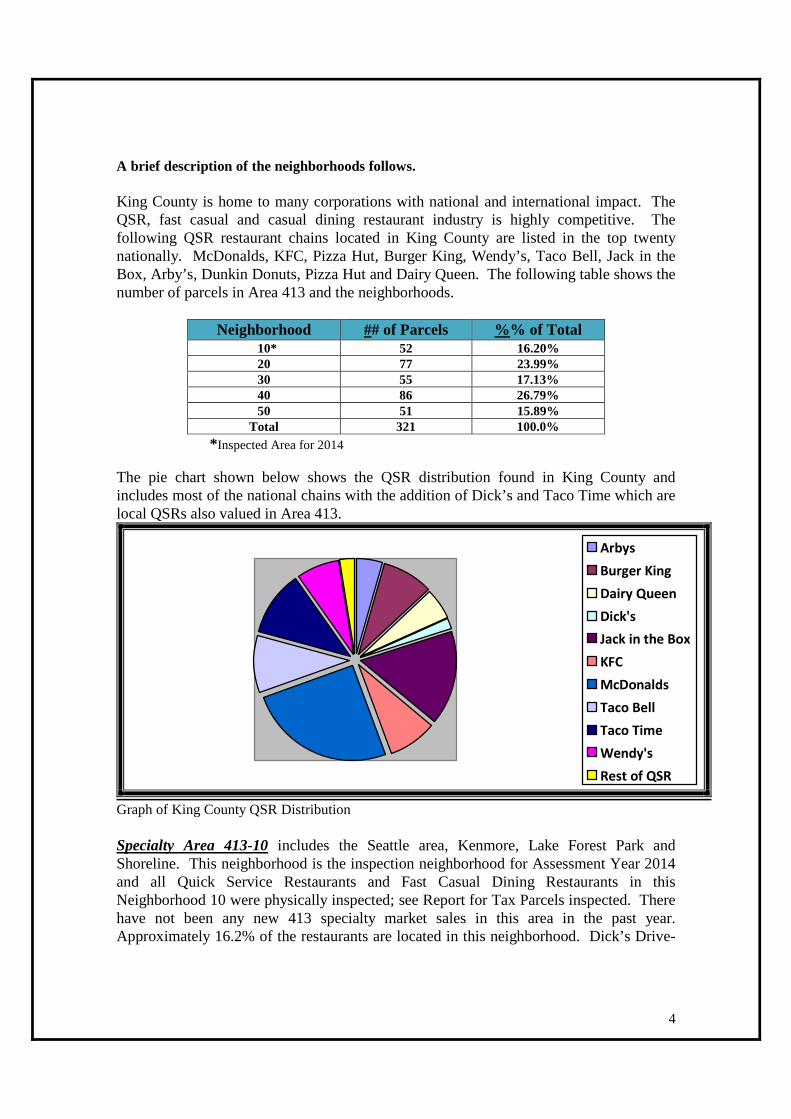
A brief description of the neighborhoods follows.
King County is home to many corporations with national and international impact. TheQSR, fast casual and casual dining restaurant industry is highly competitive. Thefollowing QSR restaurant chains located in King County are listed in the top twentynationally. McDonalds, KFC, Pizza Hut, Burger King, Wendy’s, Taco Bell, Jack in theBox, Arby’s, Dunkin Donuts, Pizza Hut and Dairy Queen. The following table shows thenumber of parcels in Area 413 and the neighborhoods.
Neighborhood ## of Parcels %% of Total10* 52 16.20%20 77 23.99%30 55 17.13%40 86 26.79%50 51 15.89%
Total 321 100.0%
*Inspected Area for 2014
The pie chart shown below shows the QSR distribution found in King County andincludes most of the national chains with the addition of Dick’s and Taco Time which arelocal QSRs also valued in Area 413.
Arbys
Burger King
Dairy Queen
Dick's
Jack in the Box
KFC
McDonalds
Taco Bell
Taco Time
Wendy's
Rest of QSR
Graph of King County QSR Distribution
Specialty Area 413-10 includes the Seattle area, Kenmore, Lake Forest Park andShoreline. This neighborhood is the inspection neighborhood for Assessment Year 2014and all Quick Service Restaurants and Fast Casual Dining Restaurants in thisNeighborhood 10 were physically inspected; see Report for Tax Parcels inspected. Therehave not been any new 413 specialty market sales in this area in the past year.Approximately 16.2% of the restaurants are located in this neighborhood. Dick’s Drive-
5
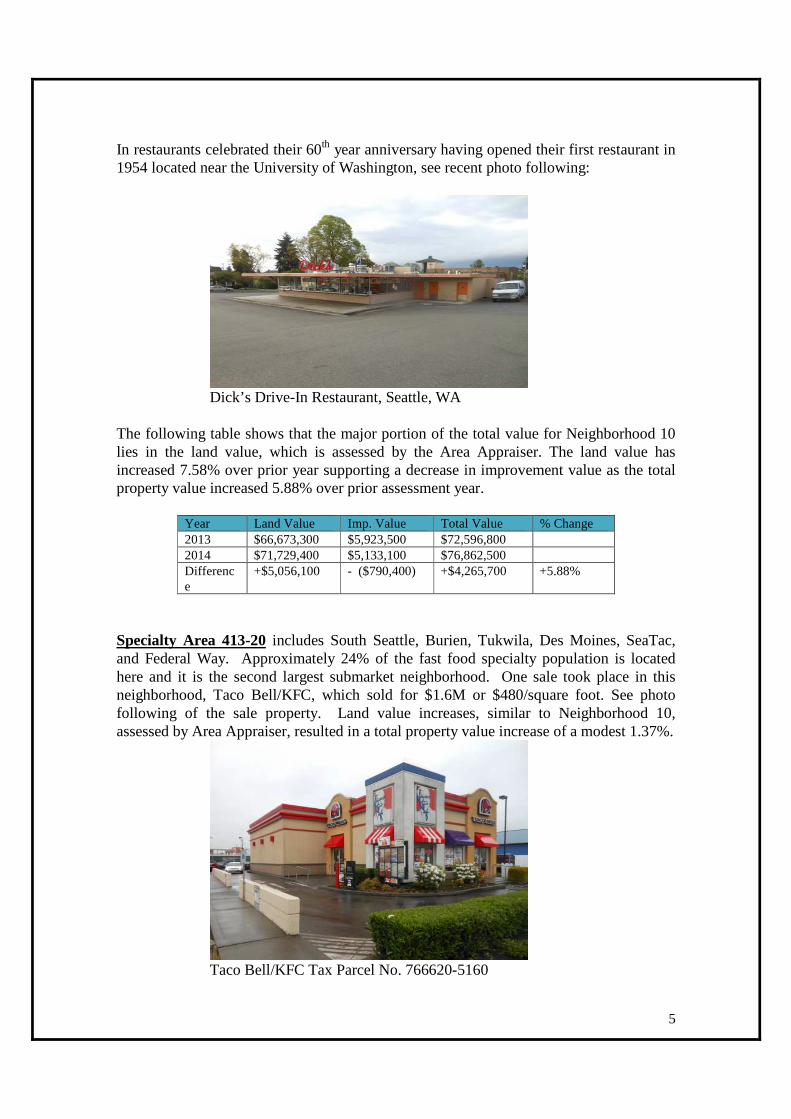
In restaurants celebrated their 60th year anniversary having opened their first restaurant in1954 located near the University of Washington, see recent photo following:
Dick’s Drive-In Restaurant, Seattle, WA
The following table shows that the major portion of the total value for Neighborhood 10lies in the land value, which is assessed by the Area Appraiser. The land value hasincreased 7.58% over prior year supporting a decrease in improvement value as the totalproperty value increased 5.88% over prior assessment year.
Year Land Value Imp. Value Total Value % Change2013 $66,673,300 $5,923,500 $72,596,8002014 $71,729,400 $5,133,100 $76,862,500Difference
+$5,056,100 - ($790,400) +$4,265,700 +5.88%
Specialty Area 413-20 includes South Seattle, Burien, Tukwila, Des Moines, SeaTac,and Federal Way. Approximately 24% of the fast food specialty population is locatedhere and it is the second largest submarket neighborhood. One sale took place in thisneighborhood, Taco Bell/KFC, which sold for $1.6M or $480/square foot. See photofollowing of the sale property. Land value increases, similar to Neighborhood 10,assessed by Area Appraiser, resulted in a total property value increase of a modest 1.37%.
Taco Bell/KFC Tax Parcel No. 766620-5160

6
Year Land Value Imp. Value Total Value % Change2013 $62,664,200 $24,292,600 $86,956,8002014 $64,040,900 $24,110,800 $88,151,700Difference + $1,376,700 -($181,800) +$1,194,900 +1.37%
Specialty Area 413-30 includes the East side of King County; Redmond, Kirkland,Woodinville, Bellevue, Sammamish and Issaquah. Approximately 17.13% of therestaurants are located within this neighborhood. One sale has taken place in thisneighborhood over the past three years, which was a Taco Time located at 3920 FactoriaBlvd SE in Bellevue that sold for $1,500,000 on January 13, 2011 and it supported a CAPrate of 7.0%. The price per square foot for the sale was $535. The Taco Bell/Pizza Hutlocated at 1960 148th Ave. NE has been upgraded with new exterior and interior finishing.The McDonalds located at 1401 156th Ave. NE was razed to make way for a newMcDonalds constructed on the same footprint. Land values increased 3.26% similar toNeighborhoods 10 & 20. Also resulting in a decrease in improvement values and a totalproperty value increase of a modest 2.15%. Taco Time purchased a site in Issaquah andis constructing a new restaurant on the property. The quick service restaurant will becompleted June 2014, see photo of new building following.
Year Land Value Imp. Value Total Value % Change2013 $65,317,000 $11,466,400 $76,783,4002014 $67,448,700 $10,985,500 $78,434,200Difference
+$2,131,700 -($480,900) +$1,650,800 +2.15%
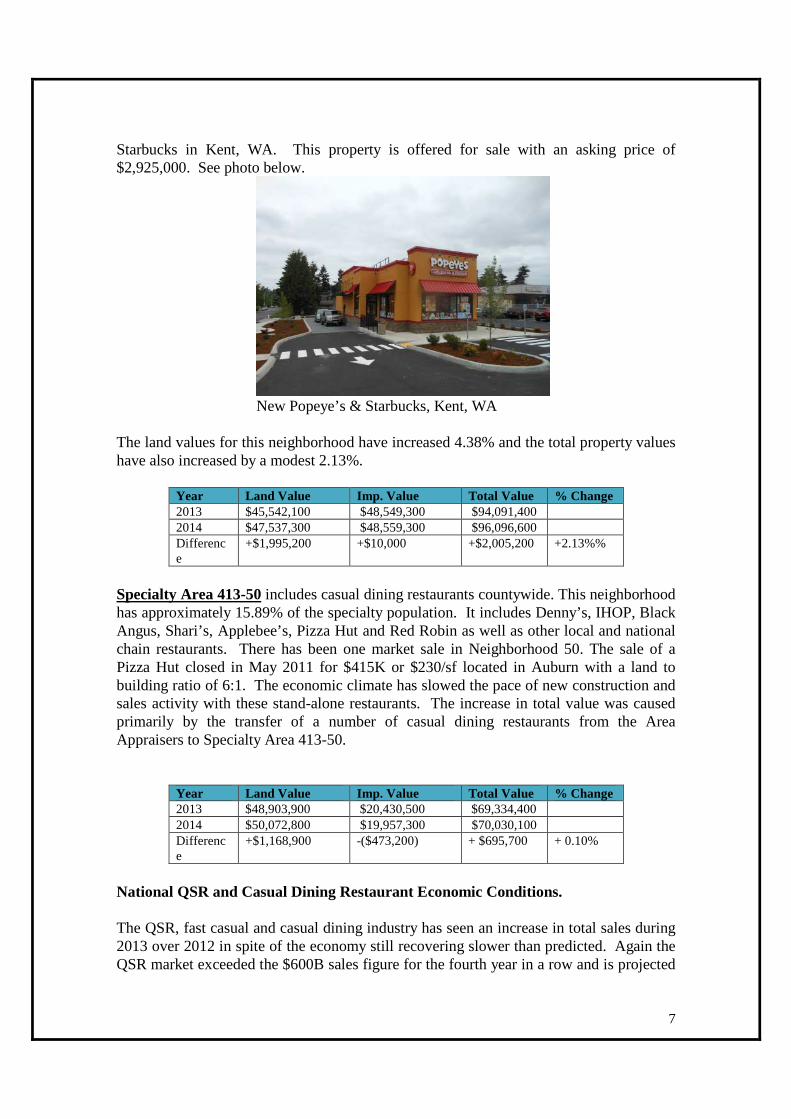
Specialty Area 413-40 includes rural King County. The areas are Auburn, Newcastle,Renton, Kent, Covington, Enumclaw, Maple Valley, and North Bend. There are 86parcels in this sub area representing approximately 26.79% the largest Neighborhood inArea 413. Two transactions have taken place in the Neighborhood over the past year; theStarbucks located in Renton sold June 11, 2013 for $1.2M or approximately $429/sf.Also, the Burger King in North Bend sold November 2013 for $2,235,000 orapproximately $643/sf. New construction includes the building of a Popeye’s and
7
Starbucks in Kent, WA. This property is offered for sale with an asking price of$2,925,000. See photo below.
New Popeye’s & Starbucks, Kent, WA
The land values for this neighborhood have increased 4.38% and the total property valueshave also increased by a modest 2.13%.
Year Land Value Imp. Value Total Value % Change2013 $45,542,100 $48,549,300 $94,091,4002014 $47,537,300 $48,559,300 $96,096,600Difference
+$1,995,200 +$10,000 +$2,005,200 +2.13%%
Specialty Area 413-50 includes casual dining restaurants countywide. This neighborhoodhas approximately 15.89% of the specialty population. It includes Denny’s, IHOP, BlackAngus, Shari’s, Applebee’s, Pizza Hut and Red Robin as well as other local and nationalchain restaurants. There has been one market sale in Neighborhood 50. The sale of aPizza Hut closed in May 2011 for $415K or $230/sf located in Auburn with a land tobuilding ratio of 6:1. The economic climate has slowed the pace of new construction andsales activity with these stand-alone restaurants. The increase in total value was causedprimarily by the transfer of a number of casual dining restaurants from the AreaAppraisers to Specialty Area 413-50.
Year Land Value Imp. Value Total Value % Change2013 $48,903,900 $20,430,500 $69,334,4002014 $50,072,800 $19,957,300 $70,030,100Difference
+$1,168,900 -($473,200) + $695,700 + 0.10%
National QSR and Casual Dining Restaurant Economic Conditions.
The QSR, fast casual and casual dining industry has seen an increase in total sales during2013 over 2012 in spite of the economy still recovering slower than predicted. Again theQSR market exceeded the $600B sales figure for the fourth year in a row and is projected
8
to top $683.4B in 2014, up 3.6% over 2013, according to National RestaurantAssociation’s 2014 Restaurant Industry Forecast. Nationwide the QSR industry added4,037 units from fall 2011 to fall 2012, according to The NPD Group. Subway led theway with 956 units added from 2011 to 2012, followed by Starbucks with 341, andDunkin Donuts with 291. Fast casual dining restaurant additions during the same timeperiod leaders included Chipotle with 180 units, Pizza Hut with 156 new restaurants andPanera Bread with 111. McDonalds, with a total of 14,157 restaurants, added only 59new units. QSR restaurants that reduced the number of outlets included KFC - minus162, Quiznos - minus 150, Arby’s - minus 83, Wendy’s minus - 34 and Dairy Queen -minus 23. Although not approaching the total number of QSR restaurants, the fastestgrowing segment of the restaurant industry is the fast casual section with Panera Bread,Chipotle and Pizza Hut leading the way. Conversely, the QSR segment has been staticover the same time period.
Trends for the restaurant industry in 2014, according to National Restaurant Association,will include the following:
Quality ingredients and more transparency-“customers are more interestedin what they’re eating and where it comes from”.
Bold flavors-the trend is for new, exciting, and bold flavors, includingAsian, Latin and both nuevo Mexican and regional Mexican.
Stabilized food costs-estimates are that food costs will rise 2 percent thisyear, a slight reduction from 2013.
Tea as a Drink and Ingredient-some experts believe tea is on the cusp ofbeing the next great drink and flavoring additive.
Mobile technology as new norm-mobile technology, both for customersand for operators, will continue to open new doors in the quick-serviceindustry.
Better-for-you-foods go mainstream- many quick-service restaurantsalready serve at least some healthy menu items and will continue addingmore.
Flexibility in food and hours-snacks were big last year, and that shouldcontinue in 2014, but there is an even bigger trend now into which snacksfit: flexibility. Some restaurants are serving burgers all day.
Sour and tart tastes-just as Americans’ taste for hot and spicy itemscontinues to get hotter and spicier, their taste for sour and tart foods willcontinue along the same path.
The QSR and Casual Dining restaurant market has seen a leveling off of new constructionwith an upward trend in gross sales over the past year and is adjusting to the recoveryfaster than similar commercial properties in King County and Washington State. Thelowering of the CAP rate with income remaining the same will trend the values upward,supporting the Assessors increase in total property values of 2.45%.

9
Two new fast casual restaurants in Area 413 include The Wings Stop, which has one storein the Bellevue, with more planned in the near future, and MOD Pizza, which has eightstores in the King County area and the newest addition planned for the Ridge PlazaHighlands in Issaquah.
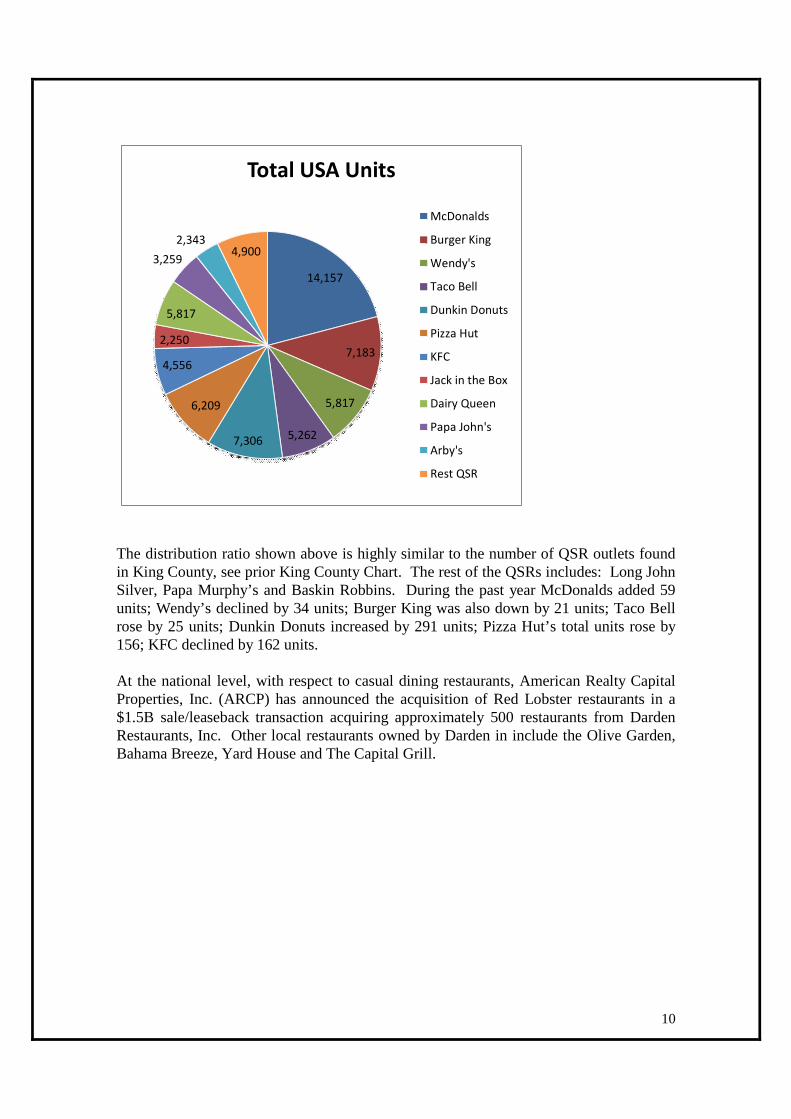
The top eleven QSR restaurant units in the nation based upon gross sales are listed asfollows: 1) McDonald’s [$35.6B], 2) Wendy’s [$8.6B], 3) Burger King [$8.6B], 4) TacoBell [$7.5B], 5) Dunkin Donuts [$6.3B], 6) Pizza Hut [$5.6B], 7) KFC [$4.5B], 8) Chick-fil-A [4.05B], 9) Sonic Drive-In [$3.7B] 10) Arby’s [$3.02B], 11) Jack in the Box[$2.9B]. Starbucks with $10.6B and Subway with $12.1 in sales are not listed as QSRrestaurants as explained previously. Subway surpasses McDonald in total stores with25,449 in the USA, while McDonalds has 14,157. Starbucks is third with 11,128.McDonalds still leads in total gross sales with $35.6B in 2013, while Subway had $12.1Bin gross sales and Starbucks had $10.6B.
Burger King has sold all but about 50 restaurants to their franchisees over the recent pastand during 2013 has remodeled 600 restaurants or approximately 30% with plans to reach40% by end of 2015. This refranchising has allowed for Burger King to add 670restaurants worldwide bring its total to 13,667. McDonalds continues to remodel itsrestaurants with 1,000 planned for this year along with adding 1,500-1,600 newrestaurants worldwide. Wendy’s is also planning to sell 425 of its restaurants tofranchisees, hoping to boost its profit margin. Twenty four of the restaurants sold were toCedar Enterprises for $14M all of which are located in the Seattle Metro market area,giving Cedar Enterprises a total of 47 locations in Washington State.
10
14,157
7,183
5,817
5,2627,306
6,209
4,556
2,250
5,817
3,259
2,3434,900
Total USA Units
McDonalds
Burger King
Wendy's
Taco Bell
Dunkin Donuts
Pizza Hut
KFC
Jack in the Box
Dairy Queen
Papa John's
Arby's
Rest QSR
The distribution ratio shown above is highly similar to the number of QSR outlets foundin King County, see prior King County Chart. The rest of the QSRs includes: Long JohnSilver, Papa Murphy’s and Baskin Robbins. During the past year McDonalds added 59units; Wendy’s declined by 34 units; Burger King was also down by 21 units; Taco Bellrose by 25 units; Dunkin Donuts increased by 291 units; Pizza Hut’s total units rose by156; KFC declined by 162 units.
At the national level, with respect to casual dining restaurants, American Realty CapitalProperties, Inc. (ARCP) has announced the acquisition of Red Lobster restaurants in a$1.5B sale/leaseback transaction acquiring approximately 500 restaurants from DardenRestaurants, Inc. Other local restaurants owned by Darden in include the Olive Garden,Bahama Breeze, Yard House and The Capital Grill.
11
Physical Inspection Identification:
The physically inspected neighborhood was the King County Assessor’s neighborhood413-10 for assessment year 2014 as required by WAC 458-07-015 4 (a). Neighborhood10 includes all QSR and fast casual dining restaurant such as McDonalds, KFC/TacoBell, Dairy Queen, Taco Time, Pizza Hut, and Dick’s Drive-In. An exterior observationof the properties was made to verify the accuracy and completeness of propertycharacteristic data that affect value.
Preliminary Ratio Analysis
There were insufficient sales in 2011 thru 2013 to include before and after ratio studies.

12
Scope of Data
Land Value
Land Sales, Analysis, Conclusions
The geographic appraiser in the area in which the specialty fast food or institutionalrestaurant property is located is responsible for the land value used by the specialtyappraiser. See appropriate area reports for land valuation discussion. Graph of Area 413Land Values for 2013 and 2014 shown following.
Land Assessed ValuesArea 413
Neighborhood Value 2013 Value 2014 $ Change % Change10 $66,673,300 $71,729,400 $5,056,100 7.58%20 $62,664,200 $64,040,900 $1,376,700 2.20%30 $65,317,000 $67,448,700 $2,131,700 3.26%40 $45,542,100 $47,537,300 $1,995,200 4.38%50 $48,903,900 $50,072,800 $1,168,900 2.39%
Totals $289,100,500 $300,829,100 $11,728,600 4.06%
Improved Parcel Total Values:
Sales Comparison Approach model description
Improved sales for Area 413 were verified by the specialty appraiser and entered into theReal Property Sales application. The sales used range in date from 01/13/2011 to11/07/2013 and are shown in the following chart. Due to the credit crisis and economicdownturn, there were fewer market sales than past years. Verification consisted of contactwith Buyer, Seller or Broker if possible or information from the COMPS InfoSystem,Inc., real estate sales verification service. At the time of sale, information on vacancy andmarket absorption rates, current and anticipated rents, capitalization rates and thecompetitive position of the property were also gathered when available. The data wasused in the income approach. Because of the limited number of comparable sales, thesales comparison approach was not used exclusively.

13
There were six closed market sales in this specialty in 2011 thru 2013. There are fewerdistressed or forced sales in the quick service restaurant and casual dining restaurantsector than in the commercial real estate market. Sales are shown in the following table.
Nbdh Major Minor E Tax # Sale Date Sale Price SizeNRA
Land toBuilding
Ratio
Price PerNRA
30 092405 9204 2478339 01/13/2011 $1,500,000 2,803 sf 7.23:1 $535.1450 869560 0060 2498597 05/19/2011 $415,000 1,800 sf 6.23:1 $230.5620 766620 5160 2577649 11/15/2012 $1,600,000 3,333 sf 6.88:1 $480.0550 202406 9096 2610398 05/30/2013 $1,505,000 4,944 sf 9.34:1 $304.4140 516970 0092 2611357 06/11/2013 $1,200,000 2,796 sf 10.15:1 $429.1840 789390 0041 2640112 11/07/2013 $2,235,000 3,473 sf 13.17:1 $643.54
Sales comparison calibration
Calibration of the coefficients utilized in the models applied via the sales comparisonapproach was established by an analysis of sales within each neighborhood, if possible.Individual prices were applied based on various characteristics deemed appropriate byeach market. Specific variables and prices for each neighborhood are discussed in moredetail above. The sales comparison approach was given some weight, but the incomeapproach was used in the final reconciliation of value to provide greater equalization anduniformity of values.
Cost Approach model description
Cost estimates are automatically calculated via the Marshall & Swift Valuation modelingsystem. Depreciation was based on studies done by Marshall & Swift Valuation Service.The cost was adjusted to the western region and the Seattle area. The Marshall & Swiftcost calculations are automatically calibrated to the data in the Real Property Application.Because of the difficulty in accurately determining the depreciation of older properties,this approach to value was given the least weight in the final reconciliation of values.Cost estimates were relied upon for valuing on going new construction where comparablesales data and/or sufficient income and expense information is not available.
Cost calibration
The Marshall & Swift Valuation modeling system which is built in the Real PropertyApplication is calibrated to the region and the Seattle area.
Income Capitalization Approach model description
The income approach is considered the most reliable approach to valuation in area 413where relevant income and expense data is available to ascertain market rates. During thesales verification process, an attempt is made to obtain income and expense data from theparties involved in the transactions through interviews or via mail. The information

14
requested includes current and anticipated future rents, operating expense breakdown andassigned responsibility for the expenses, and estimated capitalization rates associated witha sale. In addition, owners, tenants, and agents of non-sale properties are surveyed tocollect similar data. Disclosure of this information is not required by law and therefore isoften difficult to obtain. The return rate of mail surveys varies and the data can beincomplete. Telephone interviews are dependent upon obtaining a valid number for aknowledgeable party and the opportunity to contact them. Due to the highly competitivenature of this specialty, information of a confidential nature is very difficult to obtain. Asa supplement, lease information is gathered from Costar and other websites.
In order to calibrate a credible income model, it is necessary to consider data fromrecognized published sources to assist in developing capitalization rates. The followingtable recaps the capitalization rates as reported by these publications.
National/Regional CAP Rates for QSR/Fast Casual and Casual Dining Restaurants
RestaurantType
2012 2013 % Change ChangeBasis
Points*
Remarks
QSR 7.24% 6.50% -10.22% -(74) Restaurant Research-Marcus &Millichap (QSR 2013Q3)
QSR 7.20% 6.60% -8.33% -(60) Calkain Research Cap Rate Reports, End2013.
QSR 7.25% 6.85% -5.52% -(40) The Boulder Group, Single Tenant NetLease
QSR 6.93% 6.30% -9.09% -(63) Net Lease Advisor, Average CAP ratesfor following sale properties:McDonalds, Arby’s, Wendy’s, BurgerKing, Taco Bell, KFC, Jack-in-the-Box
QSR 5.58% 5.35% -4.12% -(23) Fall 2013Cassidy/Turley West RegionCAP rates for Jack-in-the-Box, BurgerKing, KFC, Taco Bell, Arby’s andMcDonalds sales.
Restaurant 7.25% 7.17% -1.1% -(8) Calkain Research Cap Rate Reports
Restaurant 6.96% 6.56% -5.75% -(40) National Average Cap Rates, RestaurantQ4, 2013 Cap Rates
*Note a change in 50 basis points or 0.50% can have a major effect on the total value of a property: Forexample, if all factors remain the same (vacancy, expenses, rental rate) and the NOI is $100,000 then avalue estimate based upon a CAP rate of 7.50% would be $1,333,300 and if the CAP rate was lowered to7.00% the indicated value would be $1,428,500 for an approximate increase in value of near 7% for theproperty.

15
The table demonstrates ranges of capitalization rates and trends that are compiled withinformation that is collected on a national or broad regional scale. This information isreconciled with data specific to the real estate market of QSR properties to develop theincome model. The overall quick service restaurants capitalization rates have declinedover the past year with older casual dining restaurants capitalization rates remaining thesame in King County. Nationally, Marcus & Millichap, RetailResearch, Net-LeasedOutlook reported that average cap rates were in the mid-6 percent range in the last year,though first year returns vary depending on tenant. McDonald’s trades in the low-4percent range, while corporate-backed Burger King trade in the mid-5 percent area.
2013 Year End Metrics
QSR Fast Casual Casual Dining
Vacancy↔ ↔ ↔
(stable) (stable) (stable
Rental Rate↗ ↗ ↘
(slight increase) (slight increase) (slight decrease)
CapitalizationRate
↘ ↘ ↔
(slight decrease) (slight decrease) (stable)
ImprovedProperty Values
↗ ↗ ↔
(slight increase) (slight increase) (stable)
Land Values↗ ↗ ↗
(slight increase) (slight increase) (slight increase)
Rental rates, vacancy levels and operating expenses are derived by reconciling all of theinformation collected through the sales verification process, completed surveys,publications, and interviews with tenants, owners, and brokers and the appraiser'sindependent market research. Quality, effective year, condition, and location arevariables considered in the application of the income model to the parcels in thepopulation.

16
Income approach calibration
The models were calibrated after setting economic base rents, vacancy rates, expenses,and capitalization rates by using adjustments based on size, effective age, and quality ofconstruction as recorded in the Assessor’s records. When the value of the property by theincome approach was significantly less than the land value, a minimal $1,000 value wasallocated to the improvements. The following table outlines specific income parameters:PROPERTYTYPE
TYPICAL RENTRANGE
VACANCY EXPENSE RATE CAP RANGE
Quick ServiceRestaurant/FastCasual
$18.00 to $38.00 3% to 7% 10% 6.75% to 8.00%
Casual Dining $18.00 to $26.00 5% to 7% 10% 7.00% to 8.00%
Metrics**Change fromPrior Year
Stable/ SlightIncrease
Stable No Increase Stable No Increase Slight Decrease
Reconciliation
All parcels were individually reviewed for correctness of the model application beforefinal value selection. All of the factors used to establish value by the model were subjectto adjustment. Under no circumstances were business enterprise or personal propertyvalues included in the Assessor’s appraisals. Every effort was made, through the use ofmarket rent, to eliminate any possibility of value estimates that included anything but thevalue of the real estate. The market sales approach is considered the most reliableindicator of value when comparable sales were available, however, the income approachwas applied to most parcels in order to better equalize comparable properties. Wheneverpossible, market rents, expenses, and cap rates were ascertained from sales, and alongwith data from surveys and publications these parameters were applied to the incomemodel. An administrative review of the selected values was made by Ruth Peterson,Senior Appraiser for quality purposes.

17
Model Validation
Total Value Conclusions, Recommendations and Validation:
Appraiser judgment prevails in all decisions regarding individual parcel valuation. Avalue is selected based on general and specific data pertaining to the parcel, theneighborhood, and the market. The Appraiser determines which available value estimateis appropriate and may adjust for particular characteristics and conditions as they occur inthe valuation area.
The income approach to value was considered on all of the Quick Service/Fast CasualRestaurants and the Casual Dining Restaurants and is the most reliable approach for thesespecialty properties.
The total assessed value for the 2013 assessment year for Area 413 was $399,762,800.The total recommended assessed value for the 2014 assessment year is $409,575,100.
Both land values and improvement value increased over prior year. Land values increaseda 4.06% while improvement values decreased slightly at a minus 1.73% mainly due tothe increase in land value resulting in existing improvements having a nominal value of$1,000. The application of these recommended values for the 2014 assessment yearresults in a total change from the 2013 assessments of a modest plus 2.45% increase.
Land Improvements Total
2013 Value $289,100,500 $110,662,300 $399,762,8002014 Value $300,829,100 $108,746,000 $409,575,100Amount Change +$11,728,600 -($1,916,300) +$9,812,300Percent Change +4.06% -(1.73%) +2.45 %
18
Client and Intended Use of the Appraisal:This mass appraisal report is intended for use only by the King County Assessor and otheragencies or departments administering or confirming ad valorem property taxes. Use of thisreport by others is not intended by the appraiser. The use of this appraisal, analyses andconclusions is limited to the administration of ad valorem property taxes in accordance withWashington State law. As such it is written in concise form to minimize paperwork. Theassessor intends that this report conform to the Uniform Standards of Professional AppraisalPractice (USPAP) requirements for a mass appraisal report as stated in USPAP SR 6-8. Tofully understand this report the reader may need to refer to the Assessor’s Property RecordFiles, Assessors Real Property Data Base, separate studies, Assessor’s Procedures, Assessor’sfield maps, Revalue Plan and the statutes.
The purpose of this report is to explain and document the methods, data and analysis used in therevaluation of King County. King County is on a six year physical inspection cycle with annualstatistical updates. The revaluation plan is approved by Washington State Department ofRevenue. The Revaluation Plan is subject to their periodic review.
Definition and date of value estimate:
Market Value
The basis of all assessments is the true and fair value of property. True and fair value meansmarket value (Spokane etc. R. Company v. Spokane County, 75 Wash. 72 (1913); Mason CountyOvertaxed, Inc. v. Mason County, 62 Wn. 2d (1963); AGO 57-58, No. 2, 1/8/57; AGO 65-66,No. 65, 12/31/65). The true and fair value of a property in money for property tax valuationpurposes is its “market value” or amount of money a buyer willing but not obligated to buywould pay for it to a seller willing but not obligated to sell. In arriving at a determination ofsuch value, the assessing officer can consider only those factors which can within reason be saidto affect the price in negotiations between a willing purchaser and a willing seller, and he mustconsider all of such factors. (AGO 65,66, No. 65, 12/31/65)
Retrospective market values are reported herein because the date of the report is subsequent tothe effective date of valuation. The analysis reflects market conditions that existed on theeffective date of appraisal.
Highest and Best Use
RCW 84.40.030 All property shall be valued at one hundred percent of its true and fairvalue in money and assessed on the same basis unless specifically provided otherwise bylaw.
An assessment may not be determined by a method that assumes a land usage or highestand best use not permitted, for that property being appraised, under existing zoning orland use planning ordinances or statutes or other government restrictions.
WAC 458-07-030 (3) True and fair value -- Highest and best use. Unless specificallyprovided otherwise by statute, all property shall be valued on the basis of its highest andbest use for assessment purposes. Highest and best use is the most profitable, likely useto which a property can be put. It is the use which will yield the highest return on theowner's investment. Any reasonable use to which the property may be put may be takeninto consideration and if it is peculiarly adapted to some particular use, that fact may betaken into consideration. Uses that are within the realm of possibility, but not

19
reasonably probable of occurrence, shall not be considered in valuing property at itshighest and best use.
If a property is particularly adapted to some particular use this fact may be taken intoconsideration in estimating the highest and best use. (Sammish Gun Club v. Skagit County, 118Wash. 578 (1922)) The present use of the property may constitute its highest and best use. Theappraiser shall, however, consider the uses to which similar property similarly located is beingput. (Finch v. Grays Harbor County, 121 Wash. 486 (1922)) The fact that the owner of theproperty chooses to use it for less productive purposes than similar land is being used shall beignored in the highest and best use estimate. (Sammish Gun Club v. Skagit County, 118 Wash.578 (1922))
Where land has been classified or zoned as to its use, the county assessor may consider this fact,but he shall not be bound to such zoning in exercising his judgment as to the highest and bestuse of the property. (AGO 63-64, No. 107, 6/6/64)
Date of Value Estimate
All property now existing, or that is hereafter created or brought into this state, shall be subjectto assessment and taxation for state, county, and other taxing district purposes, upon equalizedvaluations thereof, fixed with reference thereto on the first day of January at twelve o'clockmeridian in each year, excepting such as is exempted from taxation by law. [1961 c 15§84.36.005]
The county assessor is authorized to place any property that is increased in value due toconstruction or alteration for which a building permit was issued, or should have been issued,under chapter 19.27, 19.27A, or 19.28 RCW or other laws providing for building permits on theassessment rolls for the purposes of tax levy up to August 31st of each year. The assessedvaluation of the property shall be considered as of July 31st of that year. [1989 c 246 § 4]
Reference should be made to the property card or computer file as to when each property wasvalued. Sales consummating before and after the appraisal date may be used and are analyzedas to their indication of value at the date of valuation. If market conditions have changed thenthe appraisal will state a logical cutoff date after which no market date is used as an indicatorof value.
Property rights appraised:
Fee Simple
Wash Constitution Article 7 § 1 Taxation: All taxes shall be uniform upon the same class ofproperty within the territorial limits of the authority levying the tax and shall be levied andcollected for public purposes only. The word "property" as used herein shall mean and includeeverything, whether tangible or intangible, subject to ownership. All real estate shall constituteone class.Trimble v. Seattle, 231 U.S. 683, 689, 58 L. Ed. 435, 34 S. Ct. 218 (1914) “the entire [fee]estate is to be assessed and taxed as a unit”Folsom v. Spokane County, 111 Wn. 2d 256 (1988) “the ultimate appraisal should endeavor toarrive at the fair market value of the property as if it were an unencumbered fee”
20
The definition of fee simple estate as taken from The Third Edition of The Dictionary of RealEstate Appraisal, published by the Appraisal Institute. “Absolute ownership unencumbered byany other interest or estate, subject only to the limitations imposed by the governmental powersof taxation, eminent domain, police power, and escheat.”
Assumptions and Limiting Conditions:
1. No opinion as to title is rendered. Data on ownership and legal description wereobtained from public records. Title is assumed to be marketable and free and clear ofall liens and encumbrances, easements and restrictions unless shown on maps orproperty record files. The property is appraised assuming it to be under responsibleownership and competent management and available for its highest and best use.
2. No engineering survey has been made by the appraiser. Except as specifically stated,data relative to size and area were taken from sources considered reliable, and noencroachment of real property improvements is assumed to exist.
3. No responsibility for hidden defects or conformity to specific governmentalrequirements, such as fire, building and safety, earthquake, or occupancy codes, can beassumed without provision of specific professional or governmental inspections.
4. Rental areas herein discussed have been calculated in accord with generally acceptedindustry standards.
5. The projections included in this report are utilized to assist in the valuation process andare based on current market conditions and anticipated short term supply demandfactors. Therefore, the projections are subject to changes in future conditions thatcannot be accurately predicted by the appraiser and could affect the future income orvalue projections.
6. The property is assumed uncontaminated unless the owner comes forward to theAssessor and provides other information.
7. The appraiser is not qualified to detect the existence of potentially hazardous materialwhich may or may not be present on or near the property. The existence of suchsubstances may have an effect on the value of the property. No consideration has beengiven in this analysis to any potential diminution in value should such hazardousmaterials be found (unless specifically noted). We urge the taxpayer to retain an expertin the field and submit data affecting value to the assessor.
8. No opinion is intended to be expressed for legal matters or that would requirespecialized investigation or knowledge beyond that ordinarily employed by real estateappraisers, although such matters may be discussed in the report.
9. Maps, plats and exhibits included herein are for illustration only, as an aid invisualizing matters discussed within the report. They should not be considered assurveys or relied upon for any other purpose.
10. The appraisal is the valuation of the fee simple interest. Unless shown on the Assessor’sparcel maps, easements adversely affecting property value were not considered.
11. An attempt to segregate personal property from the real estate in this appraisal hasbeen made.
12. Items which are considered to be “typical finish” and generally included in a realproperty transfer, but are legally considered leasehold improvements are included in thevaluation unless otherwise noted.

21
13. The movable equipment and/or fixtures have not been appraised as part of the realestate. The identifiable permanently fixed equipment has been appraised in accordancewith RCW 84.04.090 and WAC 458-12-010.
14. I have considered the effect of value of those anticipated public and privateimprovements of which I have common knowledge. I can make no special effort tocontact the various jurisdictions to determine the extent of their public improvements.
15. Exterior inspections were made of all properties in the physical inspection areas(outlined in the body of the report) however; due to lack of access and time few receivedinterior inspections.
Scope of Work Performed:
Research and analyses performed are identified in the body of the revaluation report. Theassessor has no access to title reports and other documents. Because of legal limitations we didnot research such items as easements, restrictions, encumbrances, leases, reservations,covenants, contracts, declarations and special assessments. Disclosure of interior homefeatures and, actual income and expenses by property owners is not a requirement by lawtherefore attempts to obtain and analyze this information are not always successful. The massappraisal performed must be completed in the time limits indicated in the Revaluation Plan andas budgeted. The scope of work performed and disclosure of research and analyses notperformed are identified throughout the body of the report.

22
CERTIFICATION:
I certify that, to the best of my knowledge and belief:
The statements of fact contained in this report are true and correct
The report analyses, opinions, and conclusions are limited only by the reportedassumptions and limiting conditions and are my personal, impartial, and unbiasedprofessional analyses, opinions, and conclusions.
I have no present or prospective interest in the property that is the subject of this reportand no personal interest with respect to the parties involved.
I have no bias with respect to the property that is the subject of this report or to theparties involved.
My engagement in this assignment was not contingent upon developing or reportingpredetermined results.
My compensation for completing this assignment is not contingent upon the developmentor reporting of predetermined value or direction in value that favors the cause of theclient, the amount of the value opinion, the attainment of a stipulated result, or theoccurrence of a subsequent event directly related to the intended use of this appraisal.
My analyses, opinions, and conclusions were developed, and this report has beenprepared, in conformity with the Uniform Standards of Professional Appraisal Practice.
The area(s) physically inspected for purposes of this revaluation are outlined in thebody of this report.
The individuals listed below were part of the “appraisal team” and provided significantreal property appraisal assistance to the person signing this certification.
Any services regarding the subject area performed by me within the prior three years,as an appraiser or in any other capacity is listed below:
Physical inspection, revalue, appeal response preparation, appeal hearing appearance,data collection, sale verification, new construction evaluation

Area 413 - Quick Service Restaurants2014 Assessment Year
ParcelNumber
AssessedValue Sale Price
SaleDate Ratio
Diff:Median
092405-9204 1,188,600 1,500,000 1/13/2011 0.7924 0.0455
869560-0060 594,400 415,000 5/19/2011 1.4323 0.5944
766620-5160 1,413,300 1,600,000 11/15/2012 0.8833 0.0455
202406-9096 1,434,600 1,505,000 5/30/2013 0.9532 0.1154
516970-0092 774,700 1,200,000 6/11/2013 0.6456 0.1923789390-0041 1,338,200 2,235,000 11/7/2013 0.5987 0.2391
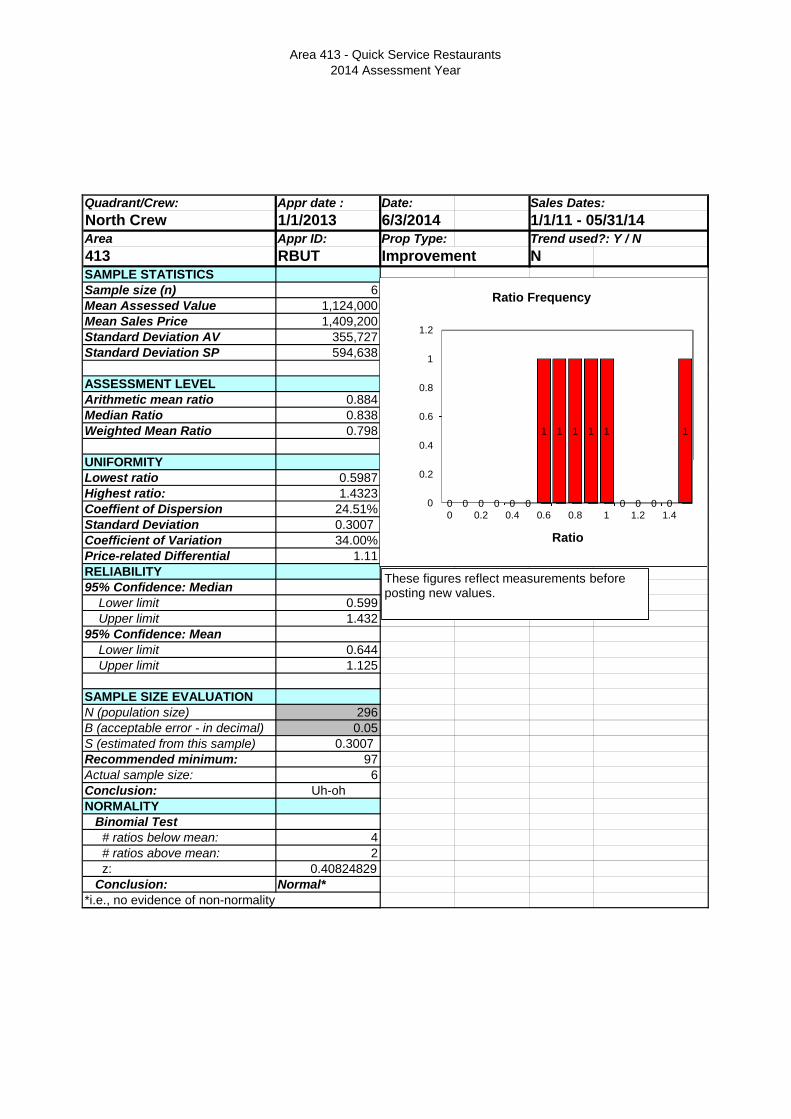
Area 413 - Quick Service Restaurants2014 Assessment Year
Quadrant/Crew: Appr date : Date: Sales Dates:
North Crew 1/1/2013 6/3/2014 1/1/11 - 05/31/14Area Appr ID: Prop Type: Trend used?: Y / N
413 RBUT Improvement NSAMPLE STATISTICSSample size (n) 6Mean Assessed Value 1,124,000Mean Sales Price 1,409,200Standard Deviation AV 355,727Standard Deviation SP 594,638
ASSESSMENT LEVELArithmetic mean ratio 0.884Median Ratio 0.838Weighted Mean Ratio 0.798
UNIFORMITYLowest ratio 0.5987Highest ratio: 1.4323Coeffient of Dispersion 24.51%Standard Deviation 0.3007Coefficient of Variation 34.00%Price-related Differential 1.11RELIABILITY95% Confidence: Median
Lower limit 0.599Upper limit 1.432
95% Confidence: MeanLower limit 0.644Upper limit 1.125
SAMPLE SIZE EVALUATIONN (population size) 296B (acceptable error - in decimal) 0.05S (estimated from this sample) 0.3007Recommended minimum: 97Actual sample size: 6Conclusion: Uh-ohNORMALITY
Binomial Test# ratios below mean: 4# ratios above mean: 2z: 0.40824829
Conclusion: Normal**i.e., no evidence of non-normality
0 0 0 0 0 0
1 1 1 1 1
0 0 0 0
1
0
0.2
0.4
0.6
0.8
1
1.2
0 0.2 0.4 0.6 0.8 1 1.2 1.4
Ratio
Ratio Frequency
These figures reflect measurements beforeposting new values.
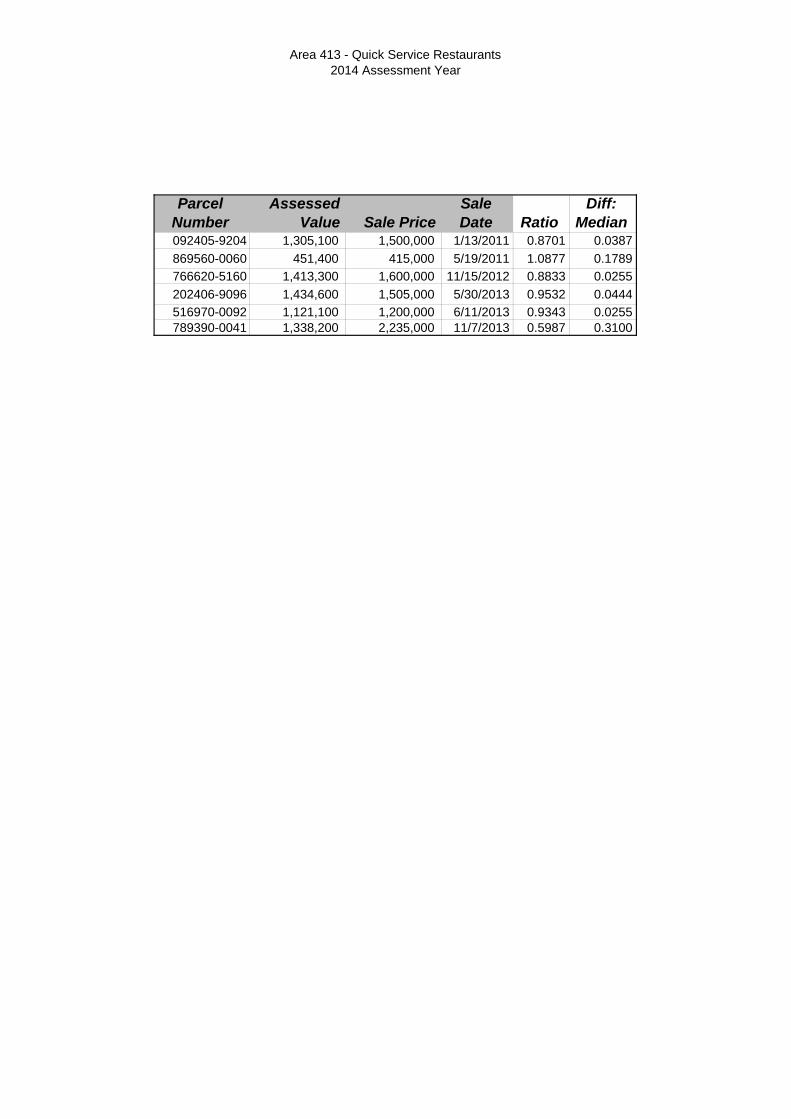
Area 413 - Quick Service Restaurants2014 Assessment Year
ParcelNumber
AssessedValue Sale Price
SaleDate Ratio
Diff:Median
092405-9204 1,305,100 1,500,000 1/13/2011 0.8701 0.0387
869560-0060 451,400 415,000 5/19/2011 1.0877 0.1789
766620-5160 1,413,300 1,600,000 11/15/2012 0.8833 0.0255
202406-9096 1,434,600 1,505,000 5/30/2013 0.9532 0.0444
516970-0092 1,121,100 1,200,000 6/11/2013 0.9343 0.0255789390-0041 1,338,200 2,235,000 11/7/2013 0.5987 0.3100
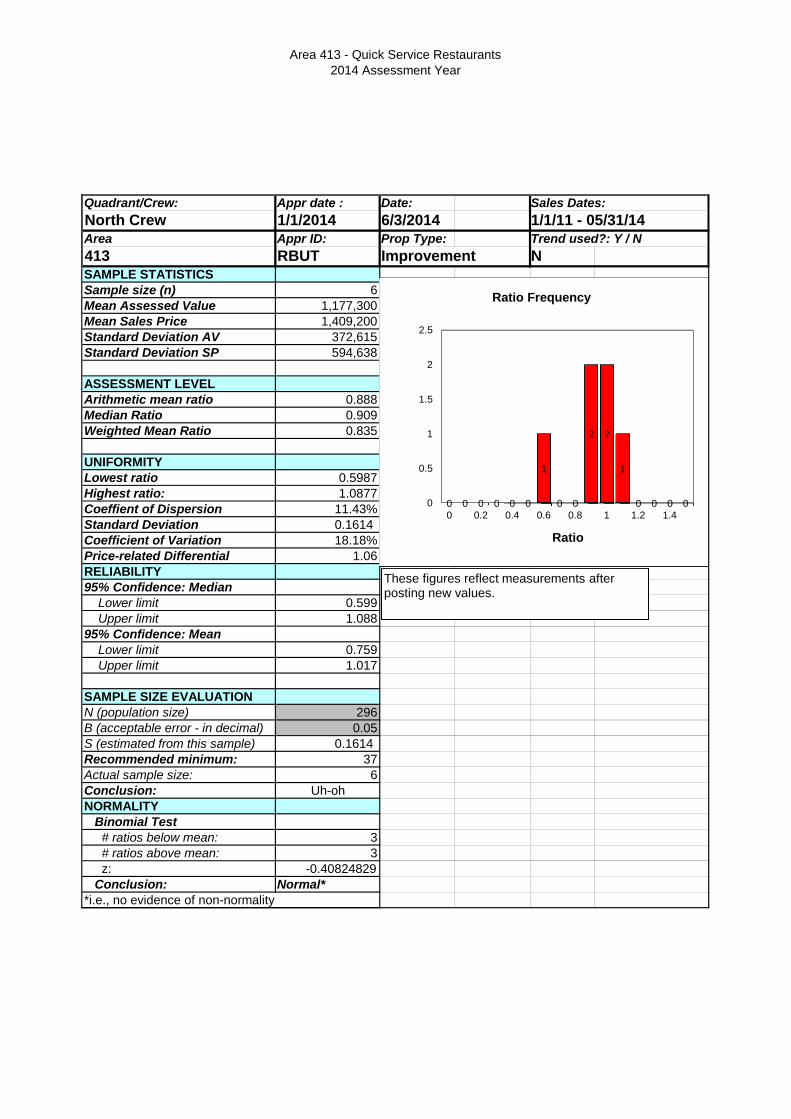
Area 413 - Quick Service Restaurants2014 Assessment Year
Quadrant/Crew: Appr date : Date: Sales Dates:
North Crew 1/1/2014 6/3/2014 1/1/11 - 05/31/14Area Appr ID: Prop Type: Trend used?: Y / N
413 RBUT Improvement NSAMPLE STATISTICSSample size (n) 6Mean Assessed Value 1,177,300Mean Sales Price 1,409,200Standard Deviation AV 372,615Standard Deviation SP 594,638
ASSESSMENT LEVELArithmetic mean ratio 0.888Median Ratio 0.909Weighted Mean Ratio 0.835
UNIFORMITYLowest ratio 0.5987Highest ratio: 1.0877Coeffient of Dispersion 11.43%Standard Deviation 0.1614Coefficient of Variation 18.18%Price-related Differential 1.06RELIABILITY95% Confidence: Median
Lower limit 0.599Upper limit 1.088
95% Confidence: MeanLower limit 0.759Upper limit 1.017
SAMPLE SIZE EVALUATIONN (population size) 296B (acceptable error - in decimal) 0.05S (estimated from this sample) 0.1614Recommended minimum: 37Actual sample size: 6Conclusion: Uh-ohNORMALITY
Binomial Test# ratios below mean: 3# ratios above mean: 3z: -0.40824829
Conclusion: Normal**i.e., no evidence of non-normality
0 0 0 0 0 0
1
0 0
2 2
1
0 0 0 00
0.5
1
1.5
2
2.5
0 0.2 0.4 0.6 0.8 1 1.2 1.4
Ratio
Ratio Frequency
These figures reflect measurements afterposting new values.

Improvement Sales for Area 413 with Sales Used 06/02/2014
Area Nbhd Major Minor Total NRA E # Sale Price Sale Date
SP /
NRA Property Name Zone
Par.
Ct.
Ver.
Code Remarks
413 030 092405 9204 2,803 2478339 $1,500,000 01/13/11 $535.14 Taco Time CB 1 Y
413 050 869560 0060 1,800 2498597 $415,000 05/19/11 $230.56 PIZZA HUT C1 1 Y
413 020 766620 5160 3,333 2577649 $1,600,000 11/15/12 $480.05 TACO BELL IG1 U/85 1 Y
413 050 202406 9096 4,944 2610398 $1,505,000 05/30/13 $304.41 IHOP Restaurant PO 1 Y
413 040 516970 0092 2,796 2611357 $1,200,000 06/11/13 $429.18 STARBUCKS COFFEE RENTON HIGHLAND (SUNSET)CA 1 Y
413 040 789390 0041 3,473 2640112 $2,235,000 11/07/13 $643.54 BURGER KING IC 1 Y
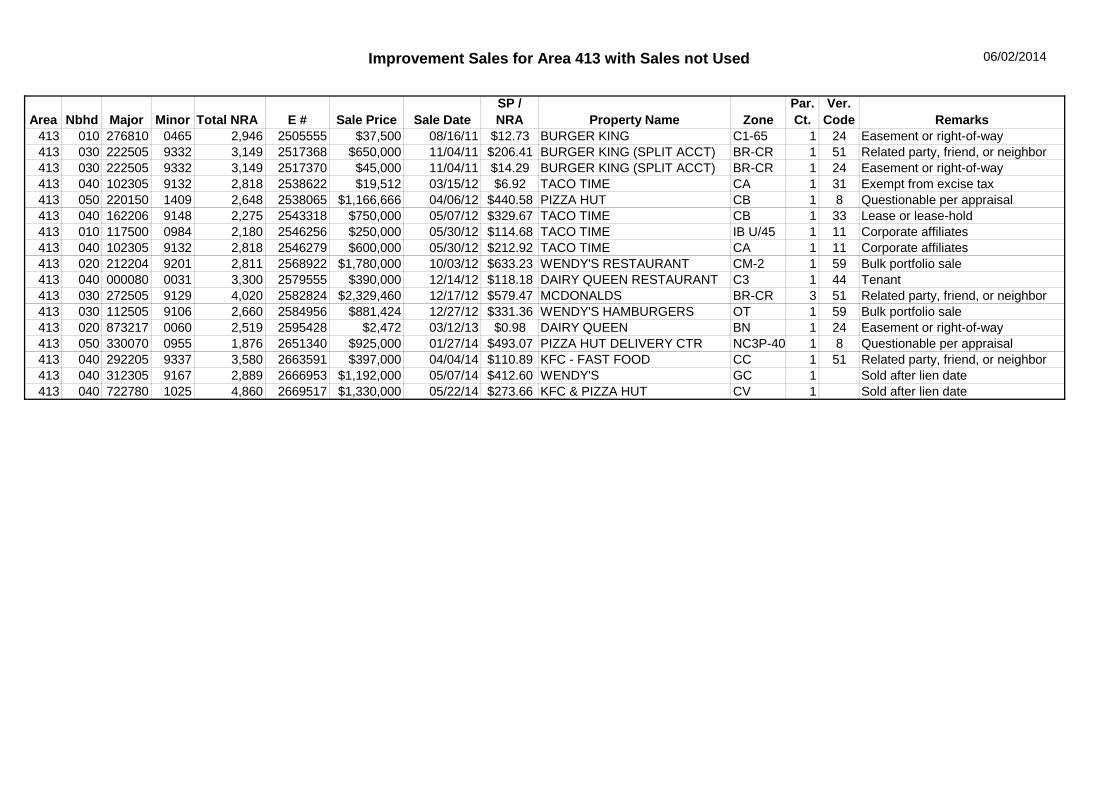
Improvement Sales for Area 413 with Sales not Used 06/02/2014
Area Nbhd Major Minor Total NRA E # Sale Price Sale Date
SP /
NRA Property Name Zone
Par.
Ct.
Ver.
Code Remarks
413 010 276810 0465 2,946 2505555 $37,500 08/16/11 $12.73 BURGER KING C1-65 1 24 Easement or right-of-way413 030 222505 9332 3,149 2517368 $650,000 11/04/11 $206.41 BURGER KING (SPLIT ACCT) BR-CR 1 51 Related party, friend, or neighbor413 030 222505 9332 3,149 2517370 $45,000 11/04/11 $14.29 BURGER KING (SPLIT ACCT) BR-CR 1 24 Easement or right-of-way413 040 102305 9132 2,818 2538622 $19,512 03/15/12 $6.92 TACO TIME CA 1 31 Exempt from excise tax413 050 220150 1409 2,648 2538065 $1,166,666 04/06/12 $440.58 PIZZA HUT CB 1 8 Questionable per appraisal413 040 162206 9148 2,275 2543318 $750,000 05/07/12 $329.67 TACO TIME CB 1 33 Lease or lease-hold413 010 117500 0984 2,180 2546256 $250,000 05/30/12 $114.68 TACO TIME IB U/45 1 11 Corporate affiliates413 040 102305 9132 2,818 2546279 $600,000 05/30/12 $212.92 TACO TIME CA 1 11 Corporate affiliates413 020 212204 9201 2,811 2568922 $1,780,000 10/03/12 $633.23 WENDY'S RESTAURANT CM-2 1 59 Bulk portfolio sale413 040 000080 0031 3,300 2579555 $390,000 12/14/12 $118.18 DAIRY QUEEN RESTAURANT C3 1 44 Tenant413 030 272505 9129 4,020 2582824 $2,329,460 12/17/12 $579.47 MCDONALDS BR-CR 3 51 Related party, friend, or neighbor413 030 112505 9106 2,660 2584956 $881,424 12/27/12 $331.36 WENDY'S HAMBURGERS OT 1 59 Bulk portfolio sale413 020 873217 0060 2,519 2595428 $2,472 03/12/13 $0.98 DAIRY QUEEN BN 1 24 Easement or right-of-way413 050 330070 0955 1,876 2651340 $925,000 01/27/14 $493.07 PIZZA HUT DELIVERY CTR NC3P-40 1 8 Questionable per appraisal413 040 292205 9337 3,580 2663591 $397,000 04/04/14 $110.89 KFC - FAST FOOD CC 1 51 Related party, friend, or neighbor413 040 312305 9167 2,889 2666953 $1,192,000 05/07/14 $412.60 WENDY'S GC 1 Sold after lien date413 040 722780 1025 4,860 2669517 $1,330,000 05/22/14 $273.66 KFC & PIZZA HUT CV 1 Sold after lien date