
Questionnaire on Environmental Problems and the … · Facts about the “Questionnaire on...
12
Questionnaire on Environmental Problems and the Survival of Humankind A 20-Year Summary Preview —Environmental Doomsday Clock and Agenda 21— September, 2012 9:17 9:05 8:19 9:08 8:47 8:56 9:08 8:49 9:31 9:13 9:33 9:04 9:22 9:08 7:49 9:05 9:19 9:01 9:05 9:15 3 9 12 6 3 9 12 6 3 9 12 6 3 9 12 6 3 9 12 6 3 9 12 6 3 9 12 6 3 9 12 6 3 9 12 6 3 9 12 6 3 9 12 6 3 9 12 6 3 9 12 6 3 9 12 6 3 9 12 6 3 9 12 6 3 9 12 6 3 9 12 6 3 9 12 6 3 9 12 6 3 9 12 6 3 9 12 6 3 9 12 6 3 9 12 6 3 9 12 6 3 9 12 6 3 9 12 6 3 9 12 6 3 9 12 6 3 9 12 6 3 9 12 6 3 9 12 6 3 9 12 6 3 9 12 6 3 9 12 6 3 9 12 6 3 9 12 6 3 9 12 6 3 9 12 6 3 9 12 6
Transcript of Questionnaire on Environmental Problems and the … · Facts about the “Questionnaire on...

Questionnaire on Environmental Problemsand the Survival of HumankindA 20-Year Summary Preview
—Environmental Doomsday Clock and Agenda 21—
September, 2012
9:17
9:05
8:19
9:08
8:47
8:56
9:08
8:49
9:319:13
9:33
9:04
9:22
9:08
7:49
9:05
9:19
9:01
9:059:15
39
12
6
39
12
6
39
12
6
39
12
6
39
12
6
39
12
6
39
12
6
39
12
6
39
12
6
39
12
6
39
12
6
39
12
6
39
12
6
39
12
6
39
12
6
39
12
6
39
12
639
12
6
39
12
6
39
12
6
39
12
6
39
12
6
39
12
6
39
12
6
39
12
6
39
12
6
39
12
6
39
12
6
39
12
6
39
12
6
39
12
6
39
12
6
39
12
6
39
12
6
39
12
639
12
6
39
12
6
39
12
639
12
6
39
12
6

Table of Contents
Introduction
Survey Results .............................................................................................................................................................. 11. The Environmental Doomsday Clock .................................................................................................................... 1 I-1. The Average Global Time over the 20 Years of the Survey ............................................................................. 1 I-2. The Average Time by Region ........................................................................................................................... 2 I-3. Environmental Conditions of Concern ............................................................................................................ 4 I-4. Environmental Conditions of Concern in Selecting the Time—A New Approach ......................................... 5
II. Progress Towards Agenda 21 .................................................................................................................................. 7 II-1. Progress in 20 Categories of Agenda 21 ......................................................................................................... 7 II-2. Progress in 10 Categories of Agenda 21 ......................................................................................................... 8
Facts about the “Questionnaire on Environmental Problems and the Survival of Humankind” ................................. 9
Introduction
Since the United Nations Conference on Environment and Development was held in Rio de Janeiro in 1992, the Asahi Glass Foundation has conducted the “Questionnaire on Environmental Problems and the Survival of Human-kind” each year with environmental experts around the world. To date, we have surveyed more than 14,000 respon-dents in 174 countries worldwide on their opinions about the problems faced by the global environment.
In A 20-Year Preview Summary, we have highlited “the Environmental Doomsday Clock,” an illustrative device at-tracting keen interest, as well as the continuous survey results on Agenda 21, the action plan adopted at the Rio Sum-mit to achieve sustainable development. In addition, we have also featured a new approach to the Environmental Conditions of Concern in selecting the time on the Environmental Doomsday Clock, introduced in 2011 to capture changes in the global environment with an even clearer perspective.
This preview report was produced to introduce our questionnaire to participants at the IUCN World Conservation Congress to mark the 20th anniversary of the survey. The full report will be published as part of a series of books commemorating the 80th anniversary of the Asahi Glass Foundation, and will be available next year on the Founda-tion’s web site at http:// www/af-info.or.jp.
In the coming years, the Asahi Glass Foundation will continue to probe the world’s environmental experts for their opinions through the questionnaire. We ask for your continued understanding and cooperation in our endeavors.
September, 2012The Asahi Glass Foundation

1
0:01 – 3:00Barely concerned
3:01 – 6:00Slightly concerned
9:01 – 12:00Extremely concerned
6:01 – 9:00Fairly concerned
12
6
39
1997
9:04
1992
7:49
(+30 min.) (+2 min.) (-9 min.)(+28 min.) (+24 min.)1993
8:19
1994
8:47
1995
8:49
199612
639
12
639
12
639
12
639
(+1 min.) 1998
9:059:13
12
69 3
12
639
12
639
9:22 9:19
12
639
12
639
20041999
9:08
(-12 min.) (-3 min.) (-7min.)(+12 min.) (+10 min.)2000 2001
9:08
2002
9:05
2003
9:15
12
639
12
639
12
639
(+3 min.)
9:08
12
639
8:56
12
639
12
639
2005
9:05
12
63
2006
9:17
(+14 min.) (-11 min.)(+2 min.) (-3 min.)2007
9:31
2008 2009 2010
9:33
12
639
9
(+12 min.)(-3 min.)
12
639
9:01 To be announced in September, 2012
12
639
12
639
(-18 min.) (? min.)2011 2012
?12
639
Survey Results
1. The Environmental Doomsday Clock
The Environmental Doomsday Clock is a survey item indicating the sense of crisis respondents feel about the contin-ued survival of humankind given the deterioration of the environment. The degree of crisis is expressed by selecting a time on the clock, a device that the Foundation created independently.
I-1. The Average Global Time over the 20 Years of the SurveyThe following diagram shows the average global time over the 20 years of the questionnaire. It responds to the question, “To what extent do you feel that the current deterioration of the global environment has created a crisis that will affect the survival of the human race? Write a time within the range 0:01 to 12:00 corresponding to the extent of your concern.”
The time on the Environmental Doomsday Clock has moved forward gradually since the inception of the survey in 1992. In 1996, the time entered the quadrant, “Extremely Concerned,” and with the exception of the year 2000, has consistently ranged in the nine o’clock hour.
Figure-1 Changes in Time from Year to Year

2
1992 1993 1994 1995 1996 1997 1998 1999 2000 2001 2002 2003 2004 2005 2006 2007 2008 2009 2010 2011
Japan 7:38 7:33 8:01 8:08 8:51 8:42 9:01 9:07 8:56 9:04 9:18 9:20 9:06 9:07 9:15 9:34 9:42 9:08 9:09 8:46
United States & Canada
8:35 8:58 9:07 8:52 9:30 9:09 8:40 9:03 8:49 9:54 8:23 9:03 9:14 8:54 9:18 9:40 10:13 10:01 10:13 9:35
Western Europe 8:54 9:02 9:35 9:02 9:46 9:53 9:37 8:46 8:46 8:58 8:44 8:52 8:56 8:43 9:08 9:23 9:44 9:55 9:45 9:28
Asia 8:10 8:19 9:16 9:41 9:41 9:25 8:59 9:47 9:16 9:04 8:36 9:41 9:32 9:41 9:17 9:10 8:52 9:04 9:01 8:51
Latin America 8:57 8:37 9:37 9:23 9:28 9:26 9:04 9:14 8:52 9:00 9:22 9:19 9:12 9:08 9:31 9:38 9:49 9:28 9:48 9:18
Africa 8:10 8:43 9:14 9:33 9:25 9:15 9:08 9:13 9:17 9:37 9:29 9:22 9:04 9:03 9:32 10:02 10:31 10:15 10:24 9:09
Oceania 9:58 8:23 8:53 9:44 9:43 8:52 9:34 8:52 8:31 8:58 9:22 9:37 9:08 9:18 9:18 10:27 10:34 10:10 10:29 10:06
Eastern Europe & former Soviet Union
9:27 7:02 8:10 9:29 9:12 9:37 9:44 9:21 8:21 8:17 9:28 9:02 8:30 8:26 9:07 9:20 9:37 10:00 9:47 9:13
Middle East 8:10 8:12 — 9:09 8:30 9:33 8:47 9:32 9:38 9:01 8:02 8:52 8:41 9:18 10:05 9:41 9:24 9:42 10:47 10:24
Total 7:49 8:19 8:47 8:49 9:13 9:04 9:05 9:08 8:56 9:08 9:05 9:15 9:08 9:05 9:17 9:31 9:33 9:22 9:19 9:01
(The time marked in blue represents the lowest sense of crisis since the inception of the survey in 1992; the red marks the highest.)
I-2. The Average Time by RegionThe following chart and graph indicates the time on the Environmental Doomsday Clock from 1992 to 2011 by re-gion. The lowest sense of crisis in the 20 years of the survey came in 1993 from respondents in Eastern Europe and former Soviet Union, who gave an average time of 7:02. In contrast, the highest sense of crisis came from Middle East in 2010, at 10:47. Three regions have never entered the 10 o’clock hour: Asia including Japan, Western Europe, and Latin America.
The graph below shows the time over 20 years across all regions. In all regions, the time moved from the 8 o’clock hour to the 9 o’clock hour in the 12 years from 1994 to 2005. As of 2006, Middle East, Africa, Oceania, and the United States and Canada moved from the 9 o’clock hour to the 10 o’clock hour, indicating a heightened sense of crisis in these four regions. However, the average overall time has been showing a gradual reversal since 2008.
Table-1 Changes in the Environmental Doomsday Clock (1992-2011)
Figure-2 Changes in the Environmental Doomsday Clock (1992-2011)
201120102009200820072006200520042003200220012000199919981997199619951994199319927:00
8:00
9:00
10:00
11:00
Extremely concerned
Fairly concerned Middle East
Eastern Europe & former Soviet Union
Oceania
Africa
Latin America
Asia
Western Europe
United States & Canada
Japan
Total
Regions in the report are categorized as follows: Developed regions: The United States and Canada, Western Europe, Japan, Asian Four (South Korea, Hong Kong, Taiwan, and Singapore). Developing regions: Rest of Asia, Latin America, Africa, Others: Oceania, Eastern Europe and former Soviet Union, Middle East

3
Western Europe1992 8:542001 8:582011 9:28
Eastern Europe & former Soviet Union
1992 9:272001 8:172011 9:13
Middle East1992 8:102001 9:012011 10:24
Asia(except Japan)
1992 8:102001 9:042011 8:51
Japan1992 7:382001 9:042011 8:46
United States & Canada
1992 8:352001 9:542011 9:35
Africa1992 8:102001 9:372011 9:09
Oceania1992 9:582001 8:582011 10:06
Latin America1992 8:572001 9:002011 9:18
The following diagram shows the movement of time on the Environmental Doomsday Clock in 10-year increments, by region, on a world map. In Western Europe (8:54 to 8:58 to 9:28), Middle East (8:10 to 9:01 to 10:24), and Latin America (8:57 to 9:00 to 9:18), the time has consistently moved forward with no reversals.
Figure-3 Regional Times (1992, 2001, 2011)

4
I-3 Environmental Conditions of ConcernSince 2003, the questionnaire has probed respondents about the environmental conditions of concern that influenced their selection of the time on the Environmental Doomsday Clock. The following chart shows the results from 2005, when respondents from all regions except Asia and Eastern Europe & former Soviet Union cited global warming ei-ther as the highest or the second highest environmental conditions of great concern.
Table-2 Environmental Conditions of Concern in Determining the Doomsday Clock Time (2005)
■ :Answer with the highest number of replies ■ :Answer with the second highest number of repliesNotes: The % refers to the total number of valid responses while excluding any unknowns. The total is to be 100%.
Developed Regions Developing Regions Others
Overseas Total
Developed
Regions
Developing
Regions
Others
Total
Japan
United States &
C
anada
Western E
urope
Asian Four
Rest of A
sia
Latin A
merica
Africa
Oceania
Eastern Europe & former Soviet Union
Middle E
ast
General environmental problems 30 18 16 37 31 13 15 31 29 30 23 27 22 29 26
Global warming 73 55 69 60 40 44 51 54 29 60 52 69 44 41 61
Air pollution, water contamination, river/ocean pollution
21 32 31 67 52 44 46 27 45 30 41 27 48 37 32
Water shortage, food problems 42 43 48 33 32 34 41 38 26 50 39 43 35 33 40
Deforestation, desertification, loss of biodiversity
41 35 36 47 53 69 64 50 33 40 46 40 60 40 44
People’s lifestyles, waste-related problems
25 22 24 27 29 41 18 15 50 10 27 25 29 33 26
Environmental problems and economics/trade-related activities
16 15 16 7 8 16 15 23 43 0 17 16 12 31 17
Population, poverty, status of women 16 51 33 0 37 25 36 35 29 50 34 23 34 33 26
Others 6 11 10 10 2 0 3 12 7 0 7 8 2 8 6
No response 2 3 2 0 5 3 0 4 0 10 3 2 3 3 2
JapanUnited
States & Canada
Western Europe Asia Latin
America Africa OceaniaEastern Europe
& former Soviet Union
Middle East
Overseas Total
Human Activities
1. Explosive population growth 43 59 49 57 42 34 77 37 55 51
2. Economic development that disregards the environment 46 47 51 54 54 66 71 68 55 55
3. Nuclear threats 11 3 5 11 4 4 12 0 18 6
4. Epidemics 0 7 1 3 0 9 12 11 0 5
5. Water and food shortages 18 23 18 21 27 26 6 5 9 20
Atmospheric
6. Global warming 41 20 36 28 12 30 18 32 18 27
7. Abnormal climate 5 10 5 12 12 6 12 11 0 9
8. Air pollution and acid rain 4 3 1 21 4 6 6 5 9 7
9. Destruction of the ozone layer 8 3 2 19 4 11 12 16 0 8
Ecological
10. Destruction of forests and desertification 24 13 19 52 50 55 29 32 46 33
11. Reduction of genetic diversity 9 5 10 16 8 11 6 11 9 10
12. Pollution of oceans and rivers 9 12 6 19 27 9 29 5 18 13
■ :Answer with the highest number of replies ■ :Answer with the second highest number of replies
However, in 2000, respondents from all regions except Latin America and Africa indicated that the greatest causes of environmental degradation were “1. Explosive population growth” and “2. Economic development that disregards the environment.” As a result the sense of crisis caused by global warming was low in all regions except in Japan.
Table-3 Causes of Global Environmental Degradation (2000)
(%)

5
Total
area
Overseas Total
Developed R
egions
Developing R
egions
Others
Asian Four
Rest of A
sia
China
Korea
IndiaJapan
United States &
C
anada
Western E
urope
Asia
Latin A
merica
Africa
Oceania
Eastern Europe &
former Soviet U
nion
Middle E
ast
1. Climate Change 23 23 25 21 25 23 30 23 14 30 24 24 23 18 29 22 20 29 17
2. Biodiversity 10 8 13 15 9 14 14 14 14 0 11 10 10 13 9 9 8 10 15
3. Land Use 7 6 6 9 7 13 11 14 15 0 8 6 10 13 4 9 8 2 12
4. Pollution Contamination 12 11 8 9 19 5 2 5 13 20 13 11 18 10 14 23 27 12 15
5. Water Resources 9 7 12 11 10 10 14 7 11 10 11 8 13 10 5 13 13 2 10
6. Population 12 15 15 14 6 10 5 16 4 10 10 14 7 9 6 6 5 6 10
7. Food 7 9 4 6 5 3 10 2 1 10 5 8 4 2 7 3 3 7 0
8. Lifestyle 7 8 4 5 6 5 2 9 6 0 5 7 5 6 8 5 5 9 12
9. Global Warming Measures 3 3 1 2 6 1 2 2 6 10 4 3 2 5 10 3 2 15 2
10. Environment and Economy 4 4 6 4 4 8 3 9 8 0 5 4 5 8 4 4 5 2 0
11. Environment and Society 3 3 4 4 3 5 5 0 7 10 3 3 3 5 2 3 3 2 7
12. Other 2 3 2 1 1 3 3 0 1 0 1 3 1 1 2 0 0 3 0
■ :Answer with the highest number of replies ■ :Answer with the second highest number of replies
Notes: The % refers to the total number of valid responses while excluding any unknowns. The total is to be 100%.
I-4 Environmental Conditions of Concern in Selecting the Time—A New ApproachStarting with the 2011 Questionnaire, the traditional categories of environmental conditions of concern that informed the selection of time on the Environmental Doomsday Clock were reorganized, and a new axis was incorporated. The following graph shows the results of the 2011 survey, in which respondents from both developed and developing re-gions most frequently selected “1. Climate change.” This was followed by “6. Population” among respondents in developed regions, and “4. Pollution/Contamination” in developing regions.
Table 4 Environmental Conditions of Concern in Determining the Environmental Doomsday Clock Time (2011)(%)

6
New Approach
In order to observe the changing global environment with the clearest possible perspective, we have reorganized and rebuilt the “environmental conditions of concern,” using a new basis described following. This new basis, which in-cludes additional societal considerations, was created by referencing the paper “Planetary Boundaries: Exploring the Safe Operating Space for Humanity” by Carl Folke, Johan Rockstrom, Jonathan Foley, James Hansen, and others: 2009 Ecology and Society, 14 (2)32.
Table-5 New Basis for Environmental Conditions of Concern
Item Main Elements
1. Climate Change Atmospheric concentration of CO2; global warming; ocean acidification; climatic aberrations (droughts, torrential rains and flooding, severe storms, heavy snow, abnormal temperatures, drying of rivers and lakes, desertification, etc.)
2. Biodiversity Acceleration of species extinction; effects of contamination, climate change, land use
3. Land Use Expansion of cultivated land mass; destruction of forests due to erratic development;desertification caused by overgrazing; agriculture and land use without regard for theenvironment; urbanization
4. Pollution / Contamination
River and ocean pollution: eutrophication caused by excessive nitrogen and phosphorus and contamination by chemical substances; atmospheric pollution: particulates suspended in the atmosphere, soot and chemical substances
5. Water Resources Diminution of usable fresh water resources (depletion, contamination)
6. Population Population growth beyond what the Earth can support; aging of the population
7. Food Diminution of food supply from land and oceans
8. Lifestyles Transformation of lifestyles away from excessive consumption of resources like energy
9. Global Warming Measures
Progress of measures for mitigation and adaption
10. Environment and Economy
Progress towards implementing an economic system to reflect environmental costs,the bearing of social costs: imposition of taxes for fossil fuels that emit CO2, which cause global warming-related damages; TEEB (The Economics of Ecosystems and Biodiversity), etc.The operation of an environmentally conscious economy:the realization of a green economy, sustainable economic development, etc.
11. Environment and Society
Environmental awareness at the individual and societal levels, progress of environmental education; poverty; the status of women
12. Other (� )
7
II. Progress Towards Agenda 21
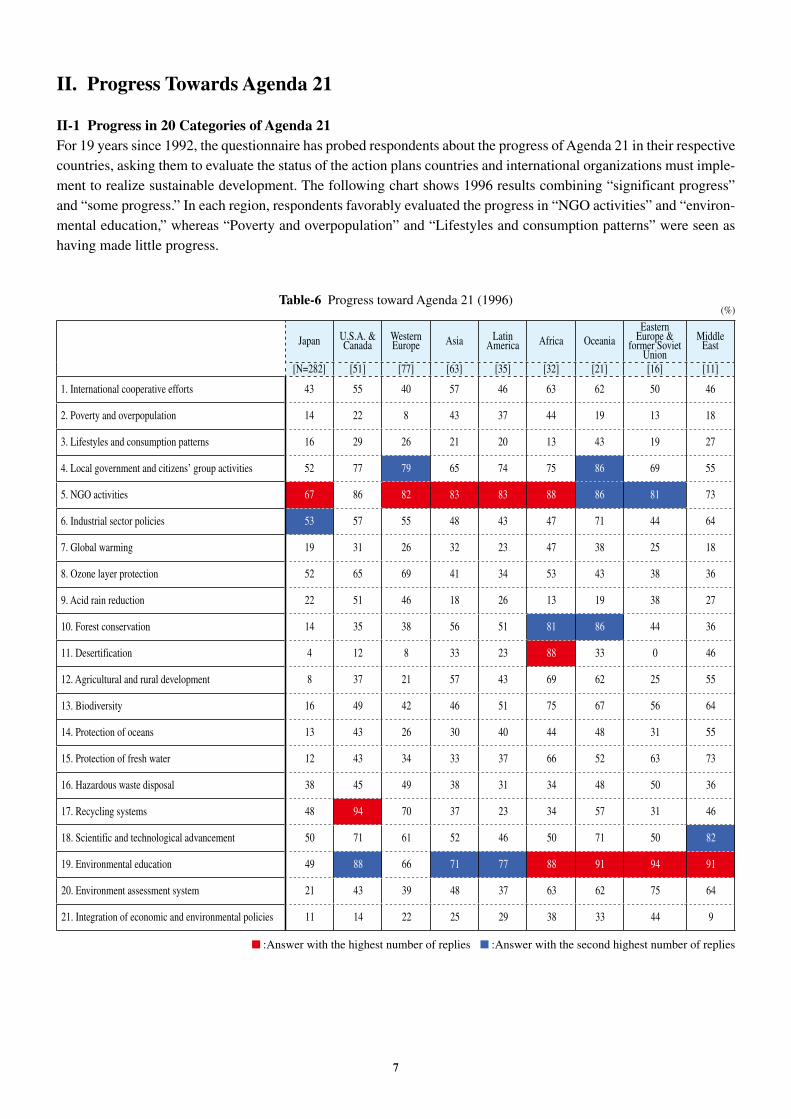
II-1 Progress in 20 Categories of Agenda 21For 19 years since 1992, the questionnaire has probed respondents about the progress of Agenda 21 in their respective countries, asking them to evaluate the status of the action plans countries and international organizations must imple-ment to realize sustainable development. The following chart shows 1996 results combining “significant progress” and “some progress.” In each region, respondents favorably evaluated the progress in “NGO activities” and “environ-mental education,” whereas “Poverty and overpopulation” and “Lifestyles and consumption patterns” were seen as having made little progress.
Japan U.S.A. & Canada
Western Europe Asia Latin
America Africa OceaniaEastern
Europe & former Soviet
Union
Middle East
[N=282] [51] [77] [63] [35] [32] [21] [16] [11]
1. International cooperative efforts 43 55 40 57 46 63 62 50 46
2. Poverty and overpopulation 14 22 8 43 37 44 19 13 18
3. Lifestyles and consumption patterns 16 29 26 21 20 13 43 19 27
4. Local government and citizens’ group activities 52 77 79 65 74 75 86 69 55
5. NGO activities 67 86 82 83 83 88 86 81 73
6. Industrial sector policies 53 57 55 48 43 47 71 44 64
7. Global warming 19 31 26 32 23 47 38 25 18
8. Ozone layer protection 52 65 69 41 34 53 43 38 36
9. Acid rain reduction 22 51 46 18 26 13 19 38 27
10. Forest conservation 14 35 38 56 51 81 86 44 36
11. Desertification 4 12 8 33 23 88 33 0 46
12. Agricultural and rural development 8 37 21 57 43 69 62 25 55
13. Biodiversity 16 49 42 46 51 75 67 56 64
14. Protection of oceans 13 43 26 30 40 44 48 31 55
15. Protection of fresh water 12 43 34 33 37 66 52 63 73
16. Hazardous waste disposal 38 45 49 38 31 34 48 50 36
17. Recycling systems 48 94 70 37 23 34 57 31 46
18. Scientific and technological advancement 50 71 61 52 46 50 71 50 82
19. Environmental education 49 88 66 71 77 88 91 94 91
20. Environment assessment system 21 43 39 48 37 63 62 75 64
21. Integration of economic and environmental policies 11 14 22 25 29 38 33 44 9
■ :Answer with the highest number of replies ■ :Answer with the second highest number of replies
Table-6 Progress toward Agenda 21 (1996)(%)

8
Significant progress Some progress Alomost no progress No progress
Promotion of environmental education
【Progress】
【No Progress】
13
6
7
10
10
5
3
2
3
61 12
12
14
10
13
31
33
34
34
36
63
52
55
51
27
22
1
14
14
8
12
8
14
18
16
15
25
1
Activities by local governments andcitizens' groups
Environmental measures by industry
Scientific and technological contributions
Formation of recycling systems
Conservation of forest resources
Greenhouse gas prevention measures
Conservation of biodiversity
Population and poverty problems
Lifestyle alteration100 80 60 40 20 0
0 20 40 60 80 100
(%)
(%)
II-2 Progress in 10 Categories of Agenda 21After 2001, the questionnaire probed respondents about the progress made in their countries in the 10 categories of Agenda 21 considered particularly important. The following graph shows the results from 2006. Respondents who reported progress (combined total of “significant progress” and “some progress”) surpassed 50% in the categories of “promotion of environmental education,” “activities by local governments and citizens’ groups,” “environmental measures by industry,” “scientific and technological contributions,” and “formation of recycling systems.” On the other hand, respondents reporting no progress (combined total of “almost no progress” and “no progress”) exceeded those who stated progress had been made in the five categories of “conservation of forest resources,” “greenhouse gas prevention measures,” “conservation of biodiversity,” “population and poverty problems,” and “lifestyle alteration.”
Figure 4 Progress toward Agenda 21(2006)
The graph below shows the results on the progress made in the respondents’ countries in the 10 categories of Agenda 21 over 18 years from 1993 to 2010. The top five categories, in which more than 50% of respondents indicated prog-ress, have always remained in the top five, whereas the bottom five have also consistently remained in the bottom five. Further, the discrepancy between the top five categories where progress has been seen and the bottom five categories where progress is lacking has continued to grow since the late 1990s.
1993 1994 1995 1996 1997 1998 1999 2000 2001 2002 2003 2004 2006 2007 2008 2009 20102005
Promotion ofenvironmental education
Activities by local governments and citizens' groups
Environmental measuresby industry
Scientific and technologicalcontributions
Formation of recycling systems
Conservation of forest resources
Greenhouse gasprevention measures
Conservation of biodiversity
Population and poverty problems
Lifestyle alteration
(Percentage of respondents who indicated progress)
(Surveyed year)
(%)
0
10
20
30
40
50
60
70
80
90
Figure 5 Progress toward Agenda 21(1993-2010)

9
Facts about the “Questionnaire on Environmental Problems and the Survival of Humankind”
The questionnaire is distributed to environmental experts around the world, including members of government orga-nizations, NGOs, academic and research institutions, corporations, and mass media. It is published in Japanese, English, Chinese, Korean, and Spanish, and is sent to approximately 7,000 respondents each April. Responses are gathered by June, and results are published in September. (Supervision is provided by Professor Akio Morishima, Special Research Advisor of the Institute for Global Environmental Strategies and board member of the Founda-tion.)
Table-7 Shift in the Number of Respondents Over 20 Years (1992-2011)
1st 2nd 3rd 4th 5th 6th 7th 8th 9th 10th1992 1993 1994 1995 1996 1997 1998 1999 2000 2001
Japan 877 61 189 248 282 306 279 293 311 292United States & Canada 49 22 23 25 51 38 62 59 93 58Western Europe 39 38 62 79 77 65 60 79 88 84Asia (except Japan) 30 43 92 62 63 63 54 60 81 83Latin America 11 37 36 48 35 41 33 27 26 35Africa 9* 40 53 62 32 52 51 39 53 55Oceania 9 22 22 22 21 18 21 13 17 30Estern Europe & former Soviet Union 13 13 17 14 16 15 18 14 19 22Middle East 9* 6 4 16 11 14 15 12 11 22Region of respondents unknown 17 0 6 0 1 1 2 1 3 3Overseas Total 168 221 315 328 307 307 316 304 391 392Total 1054 282 504 576 589 613 595 597 702 684Response Rate 28.3% 11.0% 20.8% 21.7% 18.4% 19.1% 17.9% 18.5% 20.5% 17.3%
11th 12th 13th 14th 15th 16th 17th 18th 19th 20th2002 2003 2004 2005 2006 2007 2008 2009 2010 2011
Japan 303 315 324 312 307 322 314 324 292 468United States & Canada 55 76 68 65 49 47 32 42 28 129Western Europe 79 98 90 91 70 70 67 60 55 80Asia (except Japan) 68 88 139 92 90 140 187 192 212 223Latin America 27 37 40 32 23 36 50 46 27 26Africa 41 55 44 39 37 35 24 28 20 24Oceania 24 39 32 26 22 18 14 23 13 17Estern Europe & former Soviet Union 29 66 57 42 36 30 28 35 21 27Middle East 12 30 9 10 21 17 15 7 6 5Region of respondents unknown 1 2 0 0 0 0 1 0 1 1Overseas Total 336 491 479 397 348 393 418 433 383 532Total 639 806 803 709 655 715 732 757 675 1000Response Rate 16.0% 18.0% 22.2% 19.5% 16.4% 18.3% 16.8% 17.8% 15.7% 14%
* Figure includes the total for Africa and Middle East
Table-8 Number of Countries Surveyed Figure-6 Affiliation of Respondents
Government
University and research institute
NPO/NGO
Industry
Media
OthersUnknown
11%
37%
19%
12%
13%
1%
7%
The following chart and graph show the breakdown of number of countries surveyed and affiliation of respondents in 2011.
Number of countries surveyed
Asia 23Africa 47Oceania 9Western Europe 20Eastern Europe & former Soviet Union 23
Middle East 14United States & Canada 2Latin America 31Total 169

10
2nd Floor, Science Plaza, 5-3, YonbanchoChiyoda-ku, Tokyo 102-0081, JapanTel.: +81 3 5275 0620 Fax: +81 3 5275 0871E-Mail: [email protected]: http://www.af-info.or.jp


![Environmental problems [autosaved]](https://static.fdocuments.in/doc/165x107/55ab5fd31a28ab651a8b46ed/environmental-problems-autosaved.jpg)