Questionnaire analysis Advisory Group v1 · 2011. 7. 26. · Probably the most interesting analysis...
Transcript of Questionnaire analysis Advisory Group v1 · 2011. 7. 26. · Probably the most interesting analysis...
RSGB
1
RSGB
(c) RSGB 2011
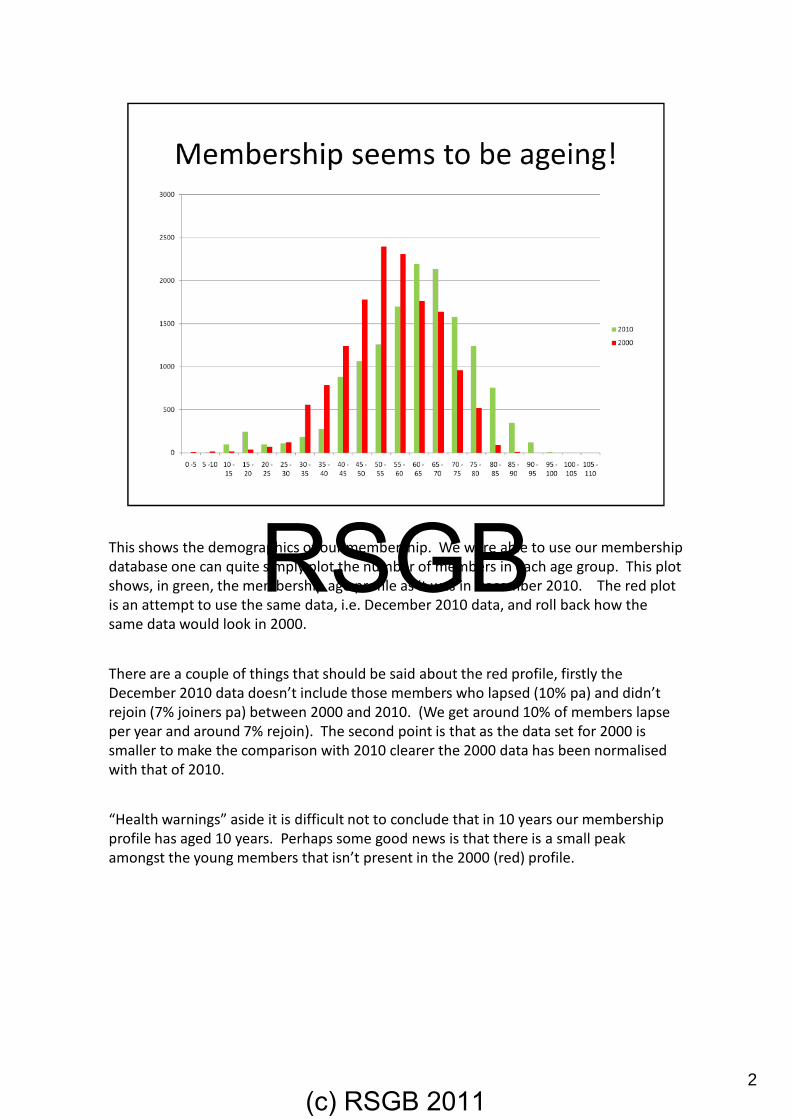
RSGBThis shows the demographics of our membership. We were able to use our membershipdatabase one can quite simply plot the number of members in each age group. This plotshows, in green, the membership age profile as it was in December 2010. The red plotis an attempt to use the same data, i.e. December 2010 data, and roll back how thesame data would look in 2000.
There are a couple of things that should be said about the red profile, firstly theDecember 2010 data doesn’t include those members who lapsed (10% pa) and didn’trejoin (7% joiners pa) between 2000 and 2010. (We get around 10% of members lapseper year and around 7% rejoin). The second point is that as the data set for 2000 issmaller to make the comparison with 2010 clearer the 2000 data has been normalisedwith that of 2010.
“Health warnings” aside it is difficult not to conclude that in 10 years our membershipprofile has aged 10 years. Perhaps some good news is that there is a small peakamongst the young members that isn’t present in the 2000 (red) profile.
2
RSGB
(c) RSGB 2011
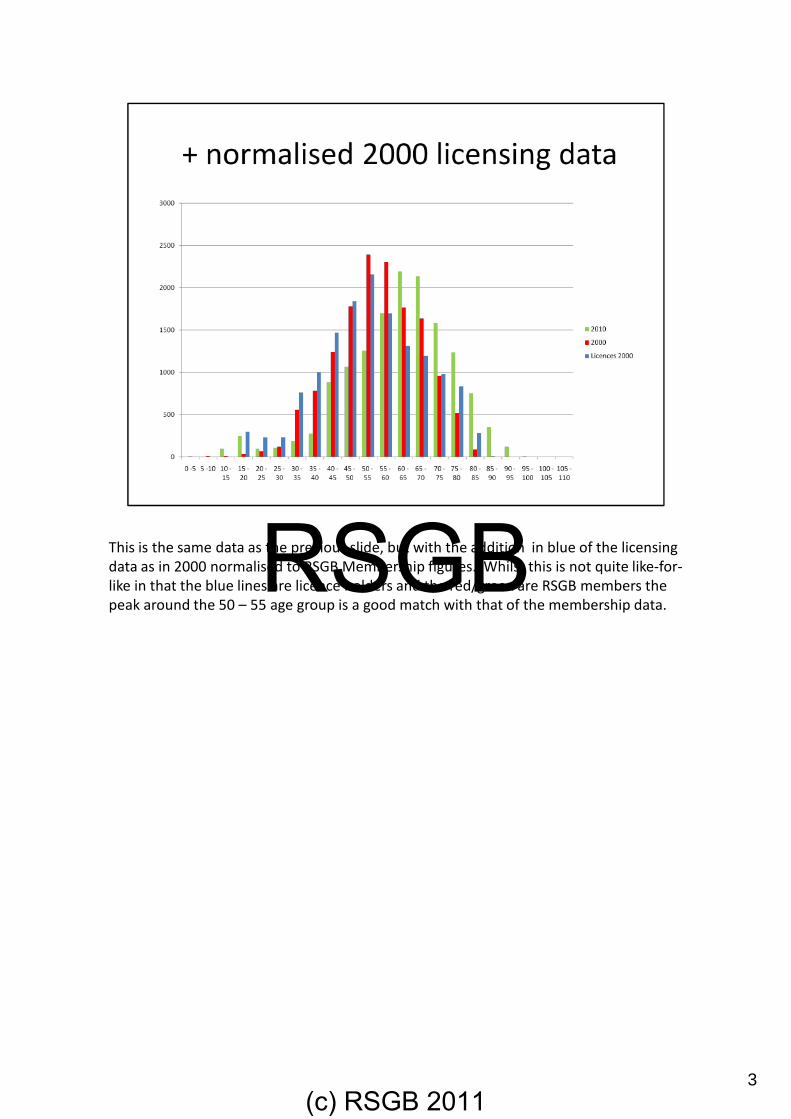
RSGBThis is the same data as the previous slide, but with the addition in blue of the licensingdata as in 2000 normalised to RSGB Membership figures. Whilst this is not quite like-for-like in that the blue lines are licence holders and the red/green are RSGB members thepeak around the 50 – 55 age group is a good match with that of the membership data.
3
RSGB
(c) RSGB 2011

RSGBThis is the demographics of our lapsed members. In green we have the membership ageprofile. In red is the age profile of members that have lapsed but not subsequentlyrejoined. Again, as before the lapsed profile (red) has been normalised to that of themembership so that comparison is easier.
The loss of the 20 – 35 year olds is understandable, as these are young adults withcareers and perhaps relationships/families on which to focus. More concerning is whythe hobby is loosing a disproportionate number of people in the 40 – 50 age group. Onethought that this is when their children are teenagers and perhaps joining for free, thustheir father (mother) lapses his (her) membership as the family gets RadCom, etc,through the child’s membership.
Interestingly, members in the 60 – 80 year old age group seem less likely to leave
4
RSGB
(c) RSGB 2011

RSGBBefore leaving demographics let’s look at those who responded to our Questionnaire,but who claimed to have never been members of the RSGB. As before the membershipprofile is in green and this time it is normalised to the data for never-been-members.
The interesting factor from this comparison is why we get a peak of never-been-members answering the Questionnaire in the 40 – 45 age group. Is there some un-tapped group of amateurs who we have not attracted into the Society? If so, whyhaven’t they joined? Why too, was the Questionnaire less attractive to never-been-members in the 55 – 65 year old age group?
5
RSGB
(c) RSGB 2011

RSGBThis doesn’t match too well the nominal 1:1 ratio
6
RSGB
(c) RSGB 2011

RSGBThis was an optional question – interesting that only about 6% declined to answer. Incomparison to recent statistics on ethnicity within England, this strongly suggests thatthe non-White and White British ethnic groups are significantly under-represented in thehobby. The figures (2009) for England are
White or White British – 88%
Mixed Ethnicity – 1.7%
Asian or Asian British – 5.7%
Black or Black British – 2.8%
Chinese and other ethnic groups – 3.4%
7
RSGB
(c) RSGB 2011

RSGBAll of the “none” group either accessed the Questionnaire via a friend’s computer orelse at the local library.
8
RSGB
(c) RSGB 2011
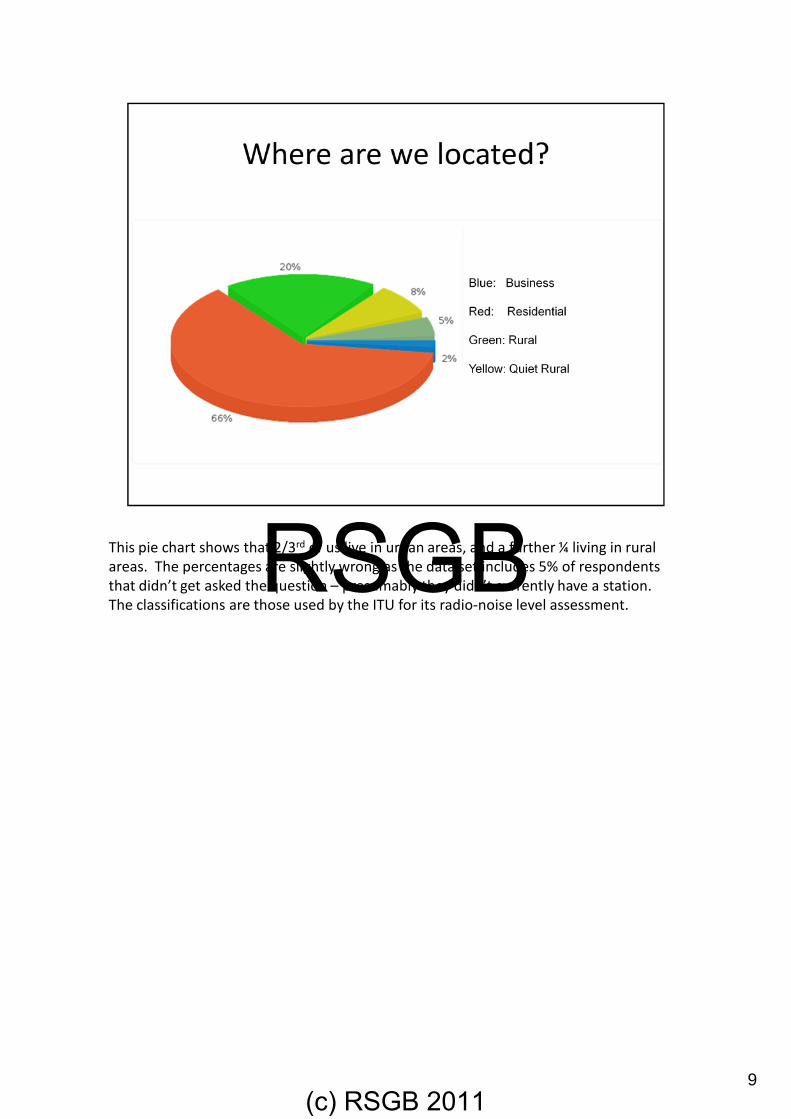
RSGBThis pie chart shows that 2/3rd of us live in urban areas, and a further ¼ living in ruralareas. The percentages are slightly wrong as the data set includes 5% of respondentsthat didn’t get asked the question – presumably they didn’t currently have a station.The classifications are those used by the ITU for its radio-noise level assessment.
9
RSGB
(c) RSGB 2011

RSGBThis view of the data shows that a 1/3 of us live in detached houses, with a further ¼ insemi-detached houses. Interestingly, 2% only have a /M or /P station.
10
RSGB
(c) RSGB 2011

RSGBThis is where we look at the space for aerials. Nearly 2/3rd of us have a garden between26 sq yards and an acre. For the future, perhaps we ought to be planning for a higherpercentage of members living in urban areas and in houses and gardens that aregenerally smaller. The Government policy of creating high-density housing in new buildswill perhaps make this worse.
11
RSGB
(c) RSGB 2011

RSGBThe activity is colour coded such that the darker the green the greater the activityamongst groups with the various different spaces for aerials. Whilst those with largerspace for aerials focus on HF operating and SSB more so than CW, there is a generaltrend toward general QSOs. What is quite interesting that those with least aerial spaceand those with most seem to spend more time than those with average space for aerialson contesting; in the case of those with very limited space this could mean operating asmembers of contest groups.
12
RSGB
(c) RSGB 2011

RSGBProbably the most interesting analysis that we have done from the Questionnaire isshown in this and the next slide.
Here we are looking at the data that came from the questions about your currentactivity in the hobby.
Activity is colour coded on a scale of black for very high levels of activity to feint greenfor low levels of activity, with no tint for very low levels. From a statistical viewpoint wecan only treat these outcomes as “Trends” for all sorts of technical reasons.
Thus, in terms of trends we see that there is generally more interest in operatingbetween 160m and 10m than on the VHF and UHF bands, and that activity, certainly onthe 160m to 10m become more so with increasing age.
SSB operating and CW are more popular than FM and Digimode in that order, and thatSSB and CW activity peak in amongst our pensioners. DXing seems to have two peaks –in the 35 – 44 age group and then again in the 85+ age group.
Of interest in the real peak of activity amongst our young members in general QSOs andalso Public Service. There is perhaps a slight “health warning” warning with apparent“Trends” in both the 85+ age group and those under 15s, as the data has been weightedto adjust the sample age demographics to that of the whole membership. Thus, theindividual responses will have more weight (as there were fewer responses inpercentage terms for both of these groups). It’s possible that we had a few in the 85+age group that answered this question retrospectively, i.e. what they used to do ratherthan what is their current activity. We may have had a few enthusiasts for general QSOsand RAYNET amongst the younger teenagers.
13
RSGB
(c) RSGB 2011

RSGBThis second chart shows the remainder of the data. There was an error in the logic ofthe Questionnaire so this set of activities was collected for all members, irrespective ofhow long they had been in the hobby. This meant that there were 263 or just over 10%more contributions to the data set.
Here the interest in local clubs and repeater working is clear amongst the youngsters,but interestingly some retained level of activity in technical and scientific aspects of thehobby. As could be expected the younger members are generally more active in Internetreflectors, and interestingly in attending rallies, conventions, etc.
14
RSGB
(c) RSGB 2011

RSGBThis was an open question, with a number of suggested answers but also theopportunity to add one’s own reasons if they were not otherwise covered. Withover 5,000 different answers each member on average selected just fewer thantwo reasons. The 304 additional reasons have been manually reviewed andeither added as additional reasons or else scored with one of the existingreasons.
The most popular single reason gaining nearly a third of the vote was “an interestin technical things – understanding how they work, using them, etc”. About 20%joined the hobby because they already knew an amateur and another 20% joinedbecause they were employed in the radio communications or the electronicssectors . Around 10% took up the hobby as they wanted to do something new –a few who completed the “other” text box mentioned the need for a hobby onreaching retirement, so some clearly got involved later in life. 5% of the reasonsclaim that they joined the hobby to socialise; one disabled member sums this uprather well by commenting that one can participate yet be anonymous.
15
RSGB
(c) RSGB 2011

RSGBTwo of these “other reasons” for joining the hobby are or soon will be lost to us – CB isalready much less popular than it was in the 80s and with the demise of analogue radiothe opportunity to stumble across amateur traffic will be reduced further. Indeed, ashas been pointed out in the Focus Group with the source and delivery means ofbroadcast news and entertainment being less significant the skill of “tuning in” a radiobe soon be more or less relegated to history.
16
RSGB
(c) RSGB 2011
RSGBThe feedback on Book sales is one of the few analysis outcomes from the Questionnairethat we can state with any degree of statistical confidence. But there were also strongtrends in terms of the Membership and RadCom “departments”.
17
RSGB
(c) RSGB 2011

RSGBThis plot needs some explanation. Lapsed members were asked to rank some givenreasons why they haven’t re-joined. The first rank choice seems to be Membership Feethough with RSGB policy being quite close. The second ranked reason is more clear cut,being Improved RadCom (content/focus). There seems to be no real trend with the thirdrank option, though the least ranked item seems to be RSGB policy and the website.
18
RSGB
(c) RSGB 2011

RSGBWith the “other” category roughly 50% of the pre-set options, the tail is large in terms ofreasons for not re-joining. Lots of hobby-horses, but the above subjectively assessedtrends are visible.
19
RSGB
(c) RSGB 2011

RSGBThis somewhat random set of comments represents a few of the more eloquentcontributions. An example of the less eloquent ones was in respect of the question as to
why the individual was not active the response was “40's reenactment eandmootorsport” - this underlines the broad competition that we face in terms ofattracting and retaining members.
20
RSGB
(c) RSGB 2011

RSGB
21
RSGB
(c) RSGB 2011

RSGBThere were many suggestions concerning the web, the above is just a few to give aflavour of the detailed nature of the feedback.
22
RSGB
(c) RSGB 2011
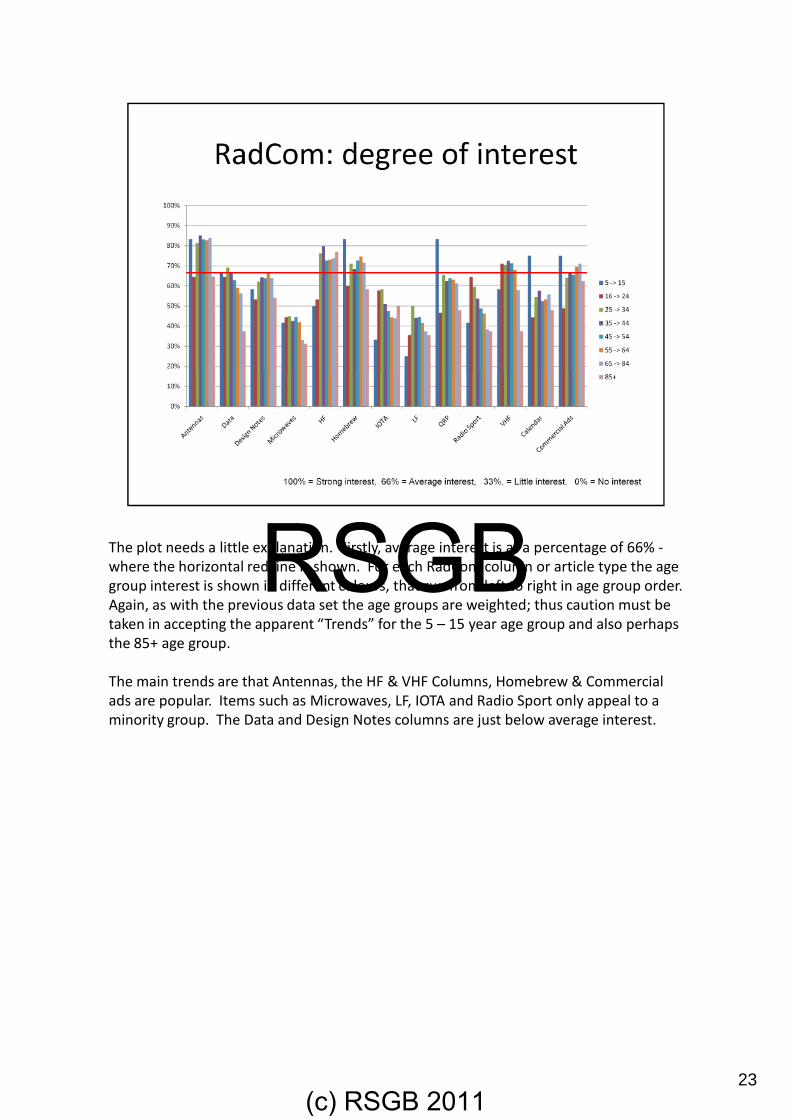
RSGBThe plot needs a little explanation. Firstly, average interest is at a percentage of 66% -where the horizontal red line is shown. For each RadCom column or article type the agegroup interest is shown in different colours, that run from left to right in age group order.Again, as with the previous data set the age groups are weighted; thus caution must betaken in accepting the apparent “Trends” for the 5 – 15 year age group and also perhapsthe 85+ age group.
The main trends are that Antennas, the HF & VHF Columns, Homebrew & Commercialads are popular. Items such as Microwaves, LF, IOTA and Radio Sport only appeal to aminority group. The Data and Design Notes columns are just below average interest.
23
RSGB
(c) RSGB 2011

RSGBHere all but Members Ads, seem to be read by most members
24
RSGB
(c) RSGB 2011

RSGBWhilst on RadCom we asked for people’s preference on how they received it. As you cansee there is a spread of views, except that most agree on not having an Electronic onlycopy of RadCom.
25
RSGB
(c) RSGB 2011

RSGBThe comments on RadCom, as with other aspects of the hobby are both broad andcontradictory.
Whilst there are probably, almost certainly, some gems within the comments the broadtrends detailed in the previous slides are the main outcomes that come from theQuestionnaire.
26
RSGB
(c) RSGB 2011

RSGBHere, the plot has the same age group structure with the previous plots, but you shouldinterpret the 0% line as the status quo, i.e. “maintain” the service. For example forRadCom 40% in the 16 – 24 age group, along with relatively high percentages in theother age groups voted for this to “improve”. This outcome isn’t necessarily saying thatit’s bad, but just that members would like it to be even better. Plots below the 0%suggest that the service could be discontinued, for example the Insurance service – herethe question was probably not understood by most respondents as the RSGB providesessential insurance service for some repeaters, clubs, beacons and RAYNET activities,etc.
Apart from RadCom the other most significant trend is for an improvement in EMCAdvice.
27
RSGB
(c) RSGB 2011

RSGBThis plot of the remaining services shows that members would like to see improvementsin the all of the services except the RSGB Credit Card. But the website, EMC liaison withOfcom, Spectrum Management through IARU, ITU and CEPT, and also our licensing andenforcement relationship with Ofcom. Taken as a whole asking the question in the waythat we did the result that most members would like most of the services to be retainedand improved is unsurprising. What we get from this plot is the relative importancebetween the services; this will be important for our future planning.
28
RSGB
(c) RSGB 2011
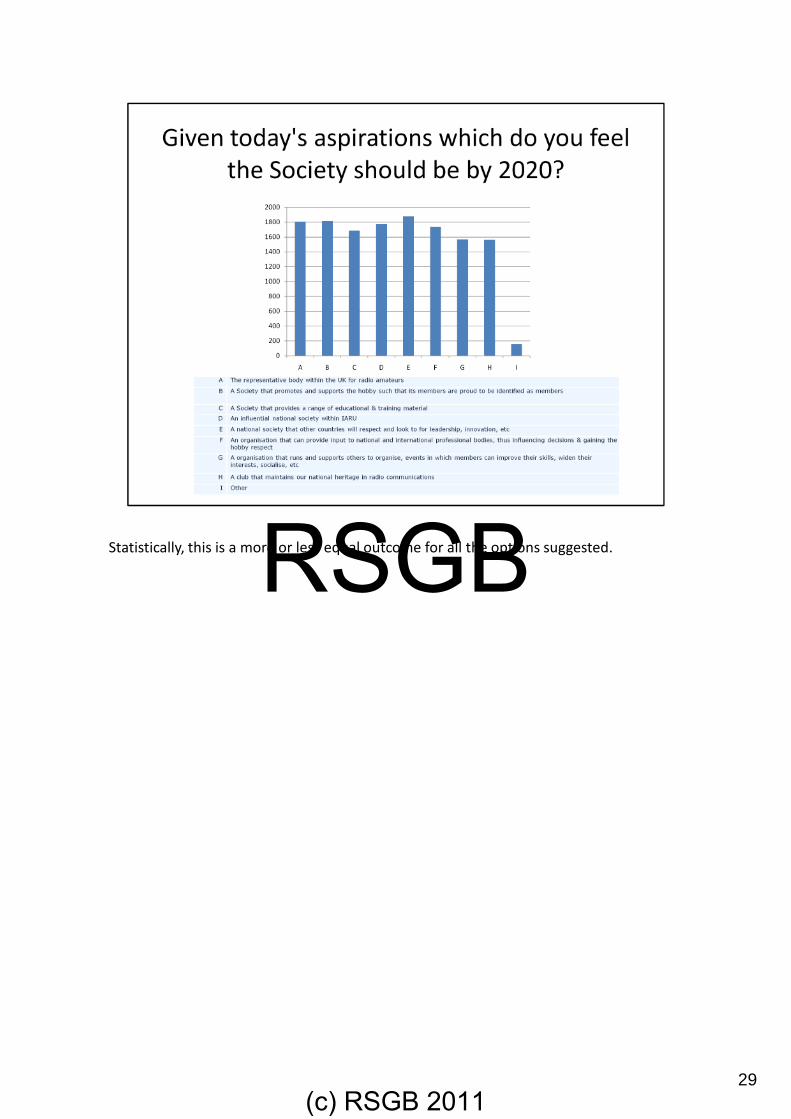
RSGBStatistically, this is a more or less equal outcome for all the options suggested.
29
RSGB
(c) RSGB 2011

RSGBRemember, these are themes – only 154 people out of the 2,000 odd who respondedopted for some other aspiration.
30
RSGB
(c) RSGB 2011

RSGBClearly, many leave – especially with the squeeze that is now on us all - because theydecide to no longer afford the membership fee. But there are some disquietingcomments about the way in which the Society is run.
There were also quite a lot of issues about balance, e.g. “Why does the RSGB runpages about ARDF? There must be a maximum of 2% of UK Amateurs who wantto run round in the rain so why fill so many pages with their exploits”.
31
RSGB
(c) RSGB 2011

RSGBThis is what lapsed members would like to see improved for them to consider rejoiningthe RSGB. For this group improvements in RadCom seem to be the single largest areafor improvement, though the trends also mirror those wishes expressed by memberswith the exception of Aerial Planning support, which has a higher profile amongst lapseas opposed to current members.
32
RSGB
(c) RSGB 2011

RSGBLooking at the preferences for people who have never-been-members. Interestingly,again many of the needs are the same as those of Members and Lapsed Members, butunderstandably more or a focus on Training and Exams.
33
RSGB
(c) RSGB 2011

RSGB
34
RSGB
(c) RSGB 2011

RSGB
35
RSGB
(c) RSGB 2011

RSGBThis is the summary of the question that asked an open question on what we needed todo in order to attract newcomers, especially from the younger generation, into thehobby.
The percentages represent the numbers of times for which a particular trend was voted.The problem is that the most popular trend was itself a circular argument.
36
RSGB
(c) RSGB 2011

RSGBInteresting to see that whilst the order and most of the suggestions are the same.Unsurprisingly, this age group trend more to the website and online presence.
37
RSGB
(c) RSGB 2011
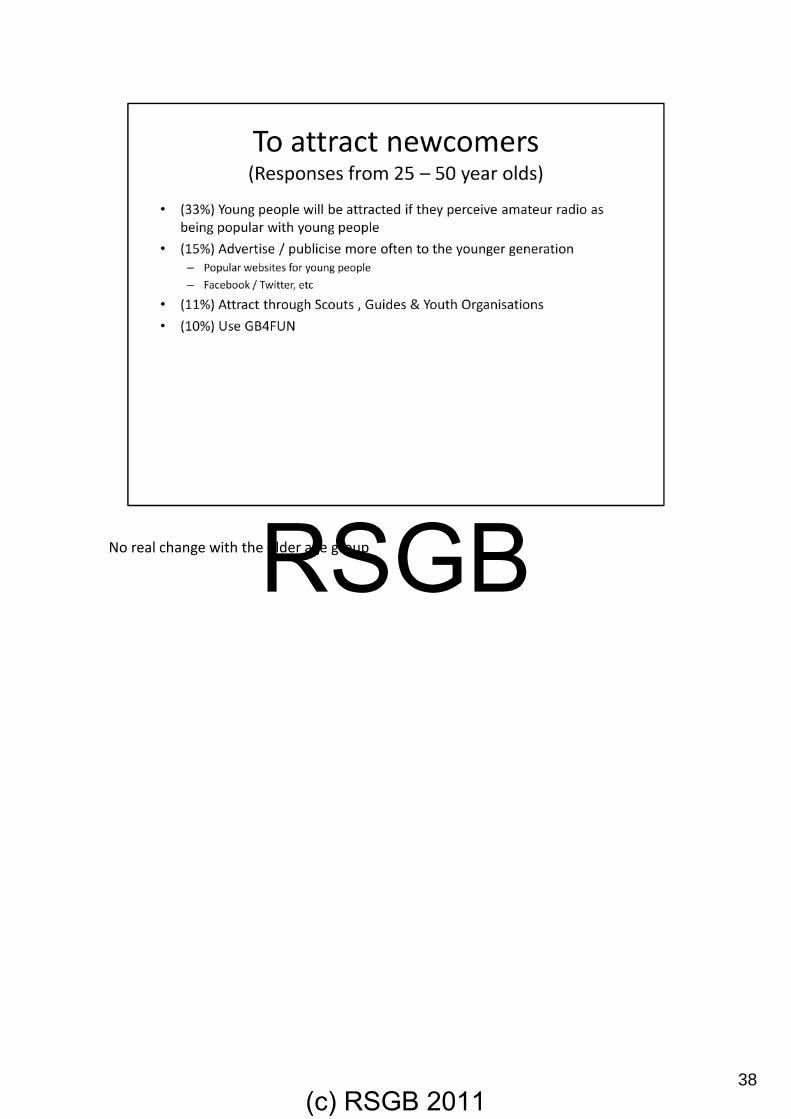
RSGBNo real change with the older age group
38
RSGB
(c) RSGB 2011

RSGBFinally, the “noise”. Just possibly a trend the older age group put cost of membership asan issue – this is at variance with free membership for students (maybe some of theolder members are feeling the pinch)
39
RSGB
(c) RSGB 2011

RSGBThis is a further set of comments, which whilst not the most popular were highlightedduring the analysis.
40
RSGB
(c) RSGB 2011
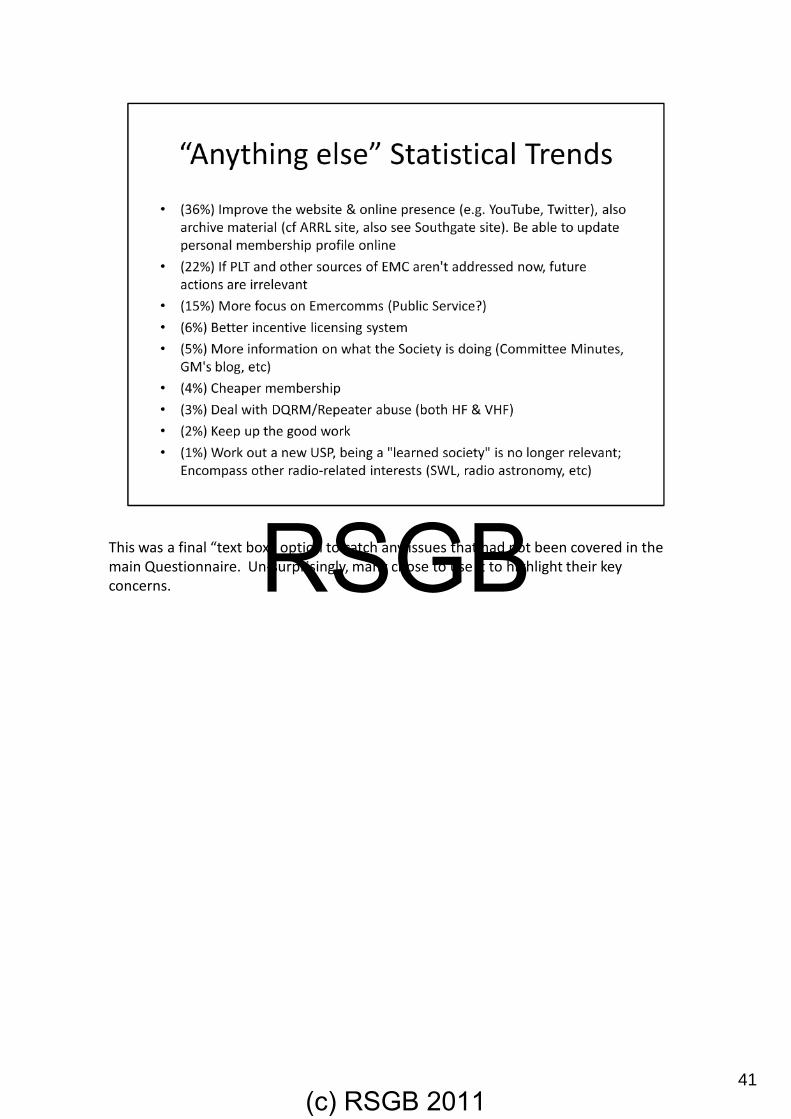
RSGBThis was a final “text box” option to catch any issues that had not been covered in themain Questionnaire. Un-surprisingly, many chose to use it to highlight their keyconcerns.
41
RSGB
(c) RSGB 2011

RSGBThe “tail” with this type of open text question is always going to be long. There is alwaysgoing to be un-substantiated opinion, but a clear message comes across that we are notgood at getting messages across.
To use a metaphor we are perhaps not transmitting as much information as we should –we’re too reliant on a 599 TU type of QSO - and watching the DX Cluster rather thanlistening…
42
RSGB
(c) RSGB 2011