
Questioning the questionnaire
97
Bachelor Thesis Questioning the questionnaire Augmenting the User Experience and Engagement of young people in a value exploration survey - By Jana Bergmann S1994433 Faculty of Behavioural and Social Sciences (BMS) Communication Science (CS) Degree: Bachelor of science Supervision Dr. Hanneke Scholten Date of Submission August 2nd, 2021
Transcript of Questioning the questionnaire

Bachelor Thesis
Questioning the questionnaire
Augmenting the User Experience and
Engagement of young people in a value
exploration survey
-
By Jana Bergmann S1994433
Faculty of Behavioural and Social Sciences (BMS)
Communication Science (CS)
Degree: Bachelor of science
Supervision
Dr. Hanneke Scholten
Date of Submission
August 2nd, 2021

1
Contents
Abstract ........................................................................................................................................................................... 3
Introduction ..................................................................................................................................................................... 4
Theoretical Framework ................................................................................................................................................... 7
The Xcavo project ...................................................................................................................................................... 7
Intrinsic motivation..................................................................................................................................................... 8
Human-Computer Interaction – user-centred designs ................................................................................................ 9
User Engagement ...................................................................................................................................................... 11
Gamification and Playfulness ................................................................................................................................... 13
Combining UX-related theories into one model ....................................................................................................... 14
Sub-questions ...................................................................................................................................................... 16
Data collection .......................................................................................................................................................... 17
Stage 1 – Pre-tests ............................................................................................................................................... 18
Stage 2 – Online interviews................................................................................................................................ 20
Stage 3 – Online focus groups ........................................................................................................................... 22
Strategy of analysis ................................................................................................................................................... 23
The analytical cycle ............................................................................................................................................ 23
Application and assessment of the coding scheme ........................................................................................... 24
Validity and reliability ....................................................................................................................................... 25
Results ........................................................................................................................................................................... 26
Results of the second data collection stage ................................................................................................................... 26
Frequencies ............................................................................................................................................................... 26
Key findings - sentiments ......................................................................................................................................... 29
Primary sentiment – perceived usefulness ................................................................................................................ 30
Context appropriateness .................................................................................................................................... 30
Goal setting ......................................................................................................................................................... 30
Control and Security .......................................................................................................................................... 31
Primary sentiment – perceived usability ................................................................................................................... 32
Clarity and feasibility ......................................................................................................................................... 32
Accessibility ........................................................................................................................................................ 33
Primary sentiment – Hedonic Qualities .................................................................................................................. 33
Visual appeal ....................................................................................................................................................... 33
Entertainment ..................................................................................................................................................... 34
Curiosity and originality .................................................................................................................................... 34
Secondary sentiments Motivation and Attention ...................................................................................................... 35
Instructional video example-screenshots .......................................................................................................... 37
Results of the third data collection stage ....................................................................................................................... 37

2
Atmospheric ............................................................................................................................................................. 39
Interactive ................................................................................................................................................................. 40
Informative ............................................................................................................................................................... 41
Model based on both result stages ............................................................................................................................ 41
Discussion ..................................................................................................................................................................... 42
Theoretical implications ........................................................................................................................................... 47
Practical implications ............................................................................................................................................... 49
Limitations ................................................................................................................................................................ 49
Suggestions for future research ................................................................................................................................ 50
Conclusion .................................................................................................................................................................... 52
References ..................................................................................................................................................................... 53
Appendix ....................................................................................................................................................................... 61

3
Abstract
Aim: This study sought to deliver a holistic view on design elements, which can improve the User
Experience (UX) of young people when filling in questionnaires. Since questionnaires (especially
academic ones) are frequently measuring user experiences of technologies without the UX survey
itself providing experiences of high quality to survey respondents, this study turns around the
status quo. To make advancements in filling the knowledge gap of engaging survey designs, the
Portrait Value Questionnaire (PVQ) was chosen to be investigated accordingly in collaboration
with the Xcavo Project.
Method: This study was conducted qualitatively across three stages of data collection: 1. Pre-
tests; 2. In depth-Interviews 3. Focus groups. In total 24 young people between the age of 18 and
25, across differing cultural, educational backgrounds and nine experts from five professional
orientations were consulted.
Results: After pre-tests, stage 2 of data collection resulted in design mock-ups based on the
suggestions of young people and experts. Testing these design examples in comparison to the
original version of the PVQ in stage 3, a list of seventeen design elements became apparent. Each
design element hereby was associated with thirteen main perceptions and feelings (sentiments),
which need to be guarded when designing for a good UX. The User Experience-User
Engagement-Technology Acceptance Model (UXUETAM) was proposed by the researcher of this
study to illustrate those associations in the context of the PVQ and supposedly other surveys.
Conclusion: Merging former theories into an UX design model for questionnaires, this paper
concludes that three categories of design elements can augment the Perceived Usefulness,
Perceived Ease of Use, Hedonic Qualities and consequently Motivation and Attention. This in
return can enhance the UX of, engagement with and repeated usage behaviour of the PVQ and
potentially other surveys. Whereas the UXUETAM accounts for former shortcomings of need-
based (motivation) and time bound (engagement) aspects in UX as merged with Technology
Acceptance models, specific effects could not be measured quantitatively. Besides these
limitations, should others be overcome by focusing on a universal sample and measuring design
effects more interactively than this study could provide. Lastly identifying implication differences
across various survey contexts appears to be essential in testing the boundaries of the UXUETAM
model in follow up studies.
Keywords: User experience design, questionnaire engagement, self-determination theory,
gamification, technology adoption, Xcavo project

4
Introduction
For centuries, questionnaires have been used to conduct research and quality tests within a broad
spectrum of sectors, both for scientific and non-scientific purposes. In recent years it has become
the most prominent tool to measure, among others, user experience and usability of various
products and services. Surveys are nowadays foremost being introduced in online settings due to
being cost and time-efficient (Boynton & Greenhalgh, 2004; Schrepp et al., 2014). Especially
technologies and innovations are often tested via surveys in terms of their user-friendliness and
the experience these products provide for the user. Also, within educational environments, user
experience reflections, tests and surveys are on the rise to enhance and adjust the designs of
learning systems and interfaces to the user’s needs (Santoso et al., 2016; Buckley et al., 2018).
Playful designs of learning systems are supposed to help children and young students to access
knowledge and trainings with more depth, ease or joy (Giannakos et al., 2014; Welbers et al.,
2019).
Whereas software such as the afore mentioned educational interfaces are undergoing
constant advancements in terms of customization and targeted user design, the questionnaires
measuring the user experience of software and online programs are often lacking those
amendments. Across centuries, surveys are predominantly assessed with respect to the validity,
accuracy and reliability of the outcome they are providing for its developer or in how far drop-out
rates can be reduced through usability and time factors (Sinclair, 1975; Sanchez, 1992; Hoerger,
2010; Roopa & Rani, 2012, Menold et al., 2018). The experiences of participants in surveys,
outside of functionality and results, are barely being investigated or evaluated and thus not
regularly improved upon. Just like any other technological tool, digital questionnaires are causing
or changing certain feelings, perceptions, thought processes and reactions in a user. The tiredness
and demotivation that occurs widespread across survey participants was even given the specific
label ‘respondent fatigue’ (Adamowicz et al., 1998; Holmes & Boyle, 2005; Savage & Waldman,
2008; Caussade et al., 2005). This can lead to relatively high participant drop-out-rates or falsified
responses and thus sampling bias (Cook et al., 2000). According to a study of Survey Sampling
International [SSI] (2010), participants are likely to provide random or false responses when
experiencing fatigue. Participants also perceive high numbers of items as an obstacle to
accomplishing their task and consequently skip items (Toepoel et al., 2009) or abandon the
questionnaire entirely (Sleep & Puleston, 2008). Changing contents after the data collection to
account for bias, is more costly than introducing design features for the prevention of boredom,

5
frustration and fatigue of participants (Couper, 2000).
In situations where young people feel the urge to explore their own needs and goals, a
questionnaire can be a useful tool. Introspection and reflection are not easy and often not reliable
if not sustained with more objective observation, such as quantitively collected data (Peels, 2016;
Silvia & Gendolla, 2001; Helyer, 2015). Phillip (2006) even implies that reflection is not only
difficult to do and learn, but also to teach, which emphases the need for a more objective
instrument. One specific case, in which young people often show too little thorough reflective
activity, as little support is offered for respective literacy, relates to their social media behavior
(De Leyn et al., 2021). Young people (age 18 to 30) are the most frequent users of social media
platforms, accounting for more than half of the all adult internet users with about 18% of overall
internet users being younger than 24 in 2019 (Johnson, 2021).
Despite social media offering a conglomeration of useful or entertaining features (Ito et
al., Blomfield Neira & Barber, 2014, Deters & Mehl, 2013; Lenhart et al.,2015; Lilley, Ball, &
Vernon, 2014; O’Keeffe & Clarke-Pearson, 2011; Rosen, 2011), some of these studies as well as
further research also indicate that social media can have harmful effects on the general well-being
of young people. Platform owners are striving to keeping people engaged as long as possible and
make them susceptible to whatever product or service they or their clients are trying to sell aiming
at creating foremost the largest benefit for their corporations (Peacock, 2014). This represents one
of the possible reasons why young people do not always have the control over their own social
media behaviour, which would however be required to make them feel good about themselves.
The user can benefit from social media regardless of these pitfalls but needs to be supported in his
or her agency.
Young people are undergoing an important developmental stage towards independence of
their parents and are on the verge of shaping their own lives and conceptualization of themselves
within frequently changing environments. Wood et al., (2017) summarize this developmental
phenomenon as a stage in which the young person increasingly has to rely on his or her own
resources with less surrounding structure through parenthood and education, with differing
outcomes based on the quality of these resources and continuous support of others. One solution
to provide young people with a higher degree of agency of their own social media behavior, could
be the continuous exploration of their own goals and needs in form of values. These are crucial
for the formation of identities (Boyd and Bee 2012; Reker 2005) and thus development of digital
literacy or resistance towards harmful external factors in the digital context (Granic et al., 2020).
Hence, exploring their own values repeatedly could help to create awareness in terms of social
media behaviour. However, tools are needed to facilitate the reflective process. Questionnaires

6
could be a good instrument for such a purpose but lack engaging designs, especially to motivate
for repeated participation. User experience design principles and theories are expected to help the
developer of a questionnaire to anticipate upon the feelings and perceptions that evolve around the
process of filling in surveys.
To fill the knowledge gap of engaging survey designs and a holistic guidance model as
accomplished through the consultation of UX design principles, a value exploration questionnaire
was tested within the subsequent study. The following research question (RQ) thereby stirred the
direction of the data collection and analysis: Can the User Experience of a value exploration
questionnaire be improved through hedonic qualities, perceived ease of use and perceived
usefulness factors by implementing specific design elements?

7
Theoretical Framework
The Xcavo project
The Xcavo project has been set up in the year of 2020 to create a supportive tool for young people
on a multimodal expertise level. The team strives for the development of a mobile app, which can
support the wellbeing of young social media users by restoring a certain degree of agency over
their behaviour. Specifically, the app is supposed to help young people counterfeit a constant
cognitive dissonance as resulting from values deviating from their actual behaviour on social
media.
Figure 1
The value categories of the PVQ as proposed by Schwartz et., (2012)
One of the app features focuses on the identification of values as part of a questionnaire. In one of
the first stages of the app development, the values of young people have been explored by
inquiring young people from all over the globe with varying backgrounds to approximate their
perspectives and needs as accurately as possible next to literature reviews. Subsequently, the

8
research group in collaboration with the main investigator of this study was seeking to discover
potential design capacities and flaws in and surrounding the selected value measurement tool.
The Portrait Value Questionnaire (PVQ) was chosen by the Xcavo project to be used for
measuring the values of young people within the mobile app. The value-items have been proposed
to the field of Psychology and Behavioural Management research by Schwartz et al. (2012). In
Appendix A, it can be observed how the items are available in a male as well as in a female
version and how they are numbered according to a scoring scheme, as well as their placement
within the survey. Besides the indication of a gender, both versions do not differ from one another
in terms of content or structure. Each item, as can be seen in Appendix A, is part of a bigger
group defining one value, of which some again are incorporated into a conceptualization of value-
groups (see Figure 1).
The respondent of the PVQ is asked to indicate on a six-point Likert scale to what extent
he or she recognizes him- or herself in a statement about another unknown person ‘he’ or ‘she’.
The scale options are: ‘Very much like me’, ‘Like me’, ‘Somewhat like me’, ‘Moderately like
me’, ‘Not like me’, ‘Not at all like me’.
One prerequisite of the research group is the avoidance of extrinsic incentives for the
engagement of young people as posed by challenges and rewards only, whereas this approach is
usually found within gamified designs. The focus shall rather lie on creating a fun experience
emerging through the implementation of design factors, which are expected to enhance the
engagement through intrinsically motivating factors. This gives motive to further explain which
aspects motivation consists of and can be provoked as well as maintained by.
Intrinsic motivation
Ryan and Deci (2000b) have developed the self-determination continuum as a macro model of
eleven other models in Behavioural Management research and Psychology, which attempts
explaining how higher degrees of autonomy are positively linked with intrinsic motivation,
whereas lower ones induce extrinsic motivation (see Appendix B.). The continuum implies on the
intrinsic motivational side of the spectrum one central theory as proposed by the same authors:
Self-determination theory (SDT). SDT signifies that we have basic human needs, which can
intrinsically motivate us to participate in certain activities or positively influence our behaviour
(Ryan and Deci, 2000a). These needs are by Ryan and Deci (2000a) divided into: Autonomy,
Competence and Relatedness. The latter hereby deems less predictive for motivation than the first
two (Ryan and Deci, 2000a).

9
If used as guidelines for motivational task designs, all three SDT constituents were found
by Leptokaridou et al., (2015) to not only improve upon the self reported joy of primary school
students but also the effort, which they put into their school assignments. Relatedness hereby
represents the need to feel socially connected with others through, for instance, collaboration or
perceived social presence (Ryan and Deci (2000a). Autonomy in return can be achieved through a
high level of agency, specifically by enabling people to act freely and independently without
being coerced into specific directions. Competence, also referred to as mastery, is the perception
of self-improvement, learning and personal growth, which a person seeks to experience. Peters et
al., (2018) regarded technology adoption behaviour resulting in wellbeing of the user by defining
it aligned with the principles of the SDT as “the degree to which a person believes that using a
particular system would enhance his or her sense of autonomy, competence or relatedness in any
facet of life”. Pink (2009) as cited in Spawr (2011) recommends another driver of motivation
being a (meaningful) purpose. Implementing these drivers in terms of meaningful user-centred
technology adoption behaviour, requires an understanding of the user of the PVQ and what design
elements create a good user experience encompassing, among other feelings and perceptions,
motivational factors.
Human-Computer Interaction – user-centred designs
User Experience (UX) as a concept is part of Human-Computer-Interaction (HCI) and can be
defined as “the combined experience of what a user feels, perceives, thinks, and physically and
mentally reacts to before and during the use of a product or service” (International Organization
of Standardization, 2019). The experience hereby starts with the first encounter of the product and
proceeds until the termination of use (Kujala et al., 2011), potentially with changing experiences
in different phases of use. User experience is an overarching terminology combining, among
others, measurements of User Engagement (UE), User Interface (UI), usability and more.
When UX was first introduced in design processes of technologies, it aimed more at
perceptions of usability. While usability can be evaluated more objectively and mostly measured
with quantitative methods, user experience involves more subjective perceptions of the user as its
core can be described by the feeling, which the product evokes in that individual (Punchoojit &
Hongwarittorrn, 2017). Besides earlier focal points of satisfaction, effectiveness and efficiency
(Ferreira, et al., 2019), further measurements of usability and user experience refer to the
following in literature: safety (error tolerance), utility, learnability (ease of learning),
memorability and lastly, how engaging a product is (Hoehle & Venkatesh, 2015; De Jong, 2014;

10
Lim et al., 2012). Since frustration, for instance, (as i.e. caused by difficulties handling a
technology’s interface) lowers the overall satisfaction and user engagement (Sutcliffe, 2016), both
additional to usability are inevitably contributing to the user’s overall experience.
The PVQ as a component of a mobile application is intended to be made use of more than
once by its target audience in order to let the user see his or her progress or changes in values over
time. As an app component, which shows its greatest potential as a continuously applied digital
tool, it should thus be properly adopted by young people. The technology acceptance model as
developed by Venkatesh and Bala (2008) based on the Theory of Planned Behaviour of Ajzen
(1991) is one of the most well-known theories to explain and measure a technology’s adoption
and usage behaviour. This original version suggests that Perceived Usefulness (PU) and Perceived
Ease of Use (PEOU) each influence what type of behaviour the user intents to show towards the
technology, which in return results in specific user behaviour relating to the technology.
Whereas several extensions of the model have been proposed and applied to a variety of
contexts, the components, characteristics and effects the technology itself brings along, were not
specialized within the TAM until Mlekus et al. (2020) developed the UX TAM in 2020 (see
Appendix B). They reasoned their changes based on the arguments as brought up within the
socio-technical approach (Trist & Bamforth, 1951), which point towards the importance of
considering the characteristics of a technology when aiming at increasing its acceptance. They
also build upon the criticism of Hornbæk and Hertzum (2017), which indicates that the
combination of UX principles and the Technology Acceptance Model have previously not been
sufficiently investigated despite its great potential to let novel practical and theoretical insights
emerge.
Since UX frequently distinguishes between functionality and hedonic qualities
(Hassenzahl, 2003; Khalid, 2006), Mlekus et al. (2020) also continued upon these
distinguishments when relating them to the TAM. Within UX TAM of Mlekus et al. (2020),
hedonic qualities (HQ) were placed as a separate factor from PU and PEOU, directly influencing
the Behavioral Intention of a user (see Appendix X). The HQ component distinguishes within the
UXTAM between novelty [innovation and interest-arousing as defined by Schrepp (2015)] as
well as stimulation (excitement and motivation). The understanding of hedonic attributes (HQ) as
suggested by Hornbæk et al., (2017) was followed in this study, defining HQ as having an
exciting or stimulating effect on the user caused by the technology itself.
Mlekus et al., (2020) recommend after testing the UXTAM on students, who supposedly
all participated in the study based on a high level of voluntariness, to test voluntariness as a
potentially important additional or mediating factor within the UXTAM. Voluntariness in return

11
is one of the essential determinants proposed by the TAM2 to be influencing the subjective norm
of people and thereby affecting the intention of use. Similarly, following up on former theories of
action, motivation and decision making, Venkatesh and Davis (2000) indicate that engagement
behaviour can be identified when the user perceives a linkage of “instrumental behaviours to
higher-level goals or purposes” as represented in TAM2 as an extension of TAM. Since the
intrinsic motivation and the free will of usage is important for the Xcavo app to be used as
intended and show the designated effect, voluntariness will for this study be added to the
guidelines of the UXTAM.
Reviewing 37 papers, which elaborate on the overlapping elements of the HCI models of
TAM and UX, Hornbæk and Hertzum (2017), conclude that enjoyment (one aspect of HQ) seems
to show stronger effects than only usability and usefulness perceptions on attitude towards
technology use. Additionally, they emphasize that psychological needs as well as momentary
changes of usage phases are not sufficiently included in these models (Hornbæk & Hertzum,
2017). This study strives to account for these shortages by expanding the UXTAM with the need-
based Self-determination theory and the engagement phases as time-bound HCI theories.
User Engagement
User Engagement (UE) is inherently interrelated with User Experience facets as UE represents
one component of UX. Sutcliffe (2016) elaborates on differences how User Engagement (UE) is
rather bound to time than UX, as UE measures the prevailing feelings and motivation in one
session but reflects less on the long-term experience a product brings along. The user’s full
experience is hence not limited to one point in time but encompasses the adoption and use over
longer periods. Like UX, feelings of fun and excitement are common qualities of UE measured
with regard to a technology. Laurel, 1993 as cited by O'Brien and Toms, 2008, p. 939 define UE
further as “a desirable— even essential—human response to computer-mediated activities” and
divide this response into four stages. In stage 1, the first point of engagement is detected, followed
by sustained engagement in the next period and final disengagement. Lastly, they also identify a
stage of re-engagement. Bickmore (2003) highlights that engagement and trust are crucial
concepts to guard in case a technology interaction requires significant efforts on the side of the
user, for example due to intended behavioural change. These efforts can be of cognitive nature or
based on emotion and motivation (Bickmore, 2003), which can be recognized in various
engagement phases.
The User engagement model of O’Brien and Toms (2008), depicts the process of

12
engagement in three phases 1) Point of engagement 2) the main Engagement phase and 3)
Disengagement. These phases are following a timeline parallel to the above-described order. The
start and ending points of each phase do not resemble clear cuts but can be distinguished through
the feelings and perceptions, which are central to each phase and therefore determine how much a
person engages with a technology and its interface (O’ Brien & Toms, 2008). Hence, the model in
cross-section to the three time periods displays three threads of experience (A) Sensual
(perceptions created by the user’s senses), (B) Emotional (affective response to sense stimulation)
and (C) Spatiotemporal (effects on the perceptions of time and surroundings). Each thread hereby
enhances or reduces the level of engagement per phase with varying focal points. O’Brien and
Toms (2008), suggest that upon the final disengagement, a phase of re-engagement could follow,
if the overall evaluation of the user results in positive perceptions. Specifically, if all threads
across the three engagement phases, resulted in high levels of engagement and positive
perceptions, it can be expected that the user wants to make use of the technology a second or even
multiple times.
Table 1
Summary of the engagement attributes to the threads of experience across the engagement phases
of O’Brien and Toms (2008)
Constituents of both the UXTAM and motivation behavioural theories can be recognized in the
overview created by O’Brien and Toms (2008). For instance, HQ elements of entertainment play

13
a significant role in the first and second engagement phase as an emotional and sensual thread,
whereas frustration, due to a lack of perceived ease of use (usability) or interruptions can lead to
unsatisfactory disengagement. Motivation is according to O’Brien and Tom’s (2008) overview
essential to evoke a first point of engagement and can supposedly lead to continuous engagement,
if it faces reinforcement through feedback and control. This in return is largely in line with the
principles of Self-determination theory. One aspect, which more dominantly appears within UE
than other UX related theories, is attention. Besides interest, attention is according to O Brien and
Toms (2008) central to uphold in the main phase of engagement through sensual threads, which
can among others also be created through customization. Since customization is considered a
gamified element that increases the intrinsic motivation of users through “autonomy-support”
(Calvo et al., 2014), it can be concluded that gamified elements can also contribute to an
improved user engagement.
Gamification and Playfulness
Gamification is another component of User Experience, which has been applied to a variety of
systems, services and software in order to increase positive perceptions of tasks and the
engagement with it. De Freitas et al., (2015) distinguish between different elements, which can
improve the engagement of MOOC (massive online open course) engagement of students, among
others, through gamified and interactive digital content. One of their findings is the decrease in
usually rather high drop-out rates of those classes based on the engagement, creativity and
experimentation as achieved via means of gamified learning tactics and simulations (De Freitas et
al., 2015).
User experience of surveys is barely being adjusted and measured in terms of non-
efficiency-related design aspects. Whereas Guin et al., (2012) were neither able prove that game
elements enhance the commitment a participant shows, nor how accurate the results turn out to
be, they could verify that they advance the enjoyability of questionnaires. Cechanowicz et al.,
(2013) presented comparable outcomes investigating participation and motivation. They find that
both concepts rise with the gamification level of a questionnaire. Baker and Theodore (2011)
evaluated gamification not based on the quality of survey output data, but on its quantity and find
that it increases through gamification. Bailey, et al., (2015, p.19) in return focus on the outcome
quality and claim that “gamification may allow participants to better reflect the context in which a
decision/choice is made, hence providing more valid data than in a standard survey”.
Triantoro et al., (2019) tested whether cognitive and affective reactions of the user would

14
be higher when using a gamified survey as opposed to a non-gamified survey. Comparing their
outcomes to the Stimulus-Organization-Response Model of Aurora (1982) focusing on
involvement, resulted in their conclusion that gamified online surveys are perceived as a stimulus
by the user. Furthermore, they concluded that affective responses increased through both extrinsic
means of motivation (i.e. rewards) and intrinsic means of motivation (i.e. constraints). However,
intrinsic means also predicted cognitive responses. Triantoro et al., (2019) identify the reason for
that to be of the same nature as former research into extrinsic motivational factors has suggested,
to be based on the decrease of its effect over time (Magni et al., 2010).
To prevent focusing largely on extrinsic regulations, a distinction can be made within this
study between playfulness and play- or game-based activities. Philosopher Sicart, (2014; 2016)
differentiates mostly based on the termination and locality of both concepts. Games accordingly
come to an end, as the player at some point either fails or succeeds in meeting a goal, whereas this
is not a core objective of playfulness. Play is giving meaning within the action itself not by
achieving pre-determined goals Sicart (2014). In line with the guidelines of self-determination
theory of Ryan and Deci (2000a), gamified elements within this study will thus be more oriented
towards playfulness, such as perceived social presence (Relatedness) of characters, perceived
levels of creativity and customization (Autonomy), achievability within the skill level of the user,
as well as feedback (Mastery) with an emphasis on higher goals giving the user a feeling of
importance (Purpose).
Combining UX-related theories into one model
When seeking to engage young people through a good user experience with questionnaires
integrated in mobile apps, formerly explained HCI theories were based on common ground and
suggestions of former research fused into one holistic model. It is hereby essential that young
people participate in the questionnaire based on their intrinsic motivation voluntarily, which in an
optimal scenario endures over time to allow for repeated use. This usage behaviour can be seen as
a form of technology adoption, which is why an extension of the TAM specifically pointing at
hedonic qualities (HQ) as a core UX factor will deliver the base for the following model. The
STD in return delivers guidelines for determining which types of design elements can intrinsically
motivate survey users. The three main elements of SDT will additionally be supplemented with
the by Pink (2009) as cited by Spawr (2011) proposed component: Purpose.
Playfulness elements (gamified design factors, which intrinsically motivate) will be
investigated due to their expected altering effect on the afore mentioned STD factors and

15
consequently engagement as well as the overall UX of the PVQ. Finally, User Engagement (UE)
is expected to convey the time-bound facet of the subsequently suggested model by presenting
three different phases of engagement. The interrelated network of these components forms a
behavioural intention after the user disengaged with the technology and is expected to lead to an
intention of further usage. The actual repeated survey usage and potential recommendation
towards peers follows up on the formation of behavioural intentions of the user in a form of re-
engagement (see Figure 2.).
To explore the relevance of afore discussed UX components for the Portrait Value Questionnaire,
it will be investigated whether its User Experience can be improved through design elements,
which evoke perceptions of hedonic qualities, ease of use and usefulness? The model below
depicts the researcher’s expectations based on UX related theories. The subsequent sub-questions,
each reflecting one focal point of that model, were in this study tested during three stages of data
collection via means of interviews and focus groups.
Figure 2
The User Experience-User Engagement-Technology Acceptance Model (expectations)

16
Sub-questions
Hedonic Quality
Q1 - What role do aesthetics, further atmospheric factors playfulness and information play in the
User Experience of the PVQ?
Perceived Ease of Use
Q2 - What role does usability play in the User Experience of the PVQ?
Perceived usefulness
Q3 - What role does the recognition of a useful goal and effort expectancy play in the User
Experience of the PVQ?
User engagement
Q4 - To what extent can HQ, PEoU and PU as achieved through design elements positively
influence User Engagement with the PVQ?
Motivation & Gamification
Q5 - To what extent does intrinsic motivation as prompted by need satisfaction and gamified
elements contribute to the UX of the PVQ?

17
Method
A qualitative research method has been chosen to ensure for richer data within a rather
explorative research procedure. Since survey designs have barely been investigated in the context
of user engagement outside of usability and functionalities, the strategy is to allow for a variety of
outcomes through an open-minded design process. In the current study neither deductive nor
inductive approaches were chosen as an exclusive strategy as a combination deemed more
conducive. A qualitative approach has also been chosen based on prior research indicating that
these methods are in some cases more suitable to more precisely account for the perceptions and
feelings related to the user’s experiences (Punchoojit et al., 2017). Qualitative data analysis is
according to Babbie (2007) the performing of data interpretations, which are of non-numerical
nature to reveal patterns and meaningful relations between data segments.
Data collection
The data collection phase consisted of three different stages. In the first phase, pre-tests have been
conducted to validate certain choices about the phrasing of questions, addressed subjects and
structure of interview sessions. Within the second stage, ideas and opinions were collected among
experts and young people about potential improvement points of questionnaires in terms of
design. In the third stage, mock-ups and an instructional video were created by the researcher
based on the input that was gathered in stage 2. These design elements were presented to four
different focus groups in order to test to what extent young people think certain elements would
increase the User Experience of the value exploration questionnaire.
Non-probability methods are frequently used to comprehend complex social phenomena
(Marshall, 1996; Small, 2009). This study cannot be placed in that category of research, but two
non-probability sampling methods were applied for the two targeted participant groups due to its
explorative nature. As a sample characteristic-efficient method, quota sampling (Davis, 2000) to
reach young people was applied whereby the researcher strived for reaching a large variety in
demographics. All participants were thus contacted via members of the researcher’s network
without being part of one specific group close to the researcher as it would usually be the case for
convenience sampling (Lavrakas, 2008). Experts in return were chosen selectively and
purposefully (Berndt, 2020) based on the perspective they could provide for surveys, (UX)
design, gamification and psychological processes.

18
Stage 1 – Pre-tests
To pre-select certain areas of interest, a short interview with a design-expert was conducted.
Taking a rather practical perspective, the designer suggested focusing less on the outcome for the
researcher in terms of design of questionnaires but more on means of making the survey engaging
for specific target groups. The designer emphasized the importance of user-friendly
questionnaires, especially when the aim is to engage a user several times in one survey. One point
of criticism towards the status quo of survey items is the choice and arrangement of wording.
Typically, academics specify their items as accurately as possible to avoid ambiguity, which in
some cases causes the item to be less perspicuous for the average user as non-colloquial language
might not always be comprehensible.
In terms of usability, the designer’s advice was largely in line with suggestions of previous
academic literature. He emphasized that questionnaire should create a compact impression by
grouping the items instead of displaying all of them at the same time. With this, initial (potentially
overwhelming) expectations of high effort and time investment can be decreased for the user,
while improving the engagement and overall user experience. Furthermore, it was mentioned that
addressing the user directly instead of indirectly (through comparison) would be a more suitable,
less distracting approach. Humour was considered to have shown great potential for improving
the User Experience, while visual elements (colour schemes, images, icons) should only be used
carefully. Gamified elements were rather advised against for the same reason of potentially
causing distraction.
Pre-tests with five young people (19-23) of different gender and academic level showed
large similarity with respect to the perceived effort a questionnaire should cause. Academics were
slightly more elaborate in their responses and had an easier time reflecting upon potential
universal issues, which could arise, such as cultural differences in interpretation as opposed to
primary personal design preferences. Gender did not reveal any specific preferences or
differences. All respondents wished for a ‘digestible’ questionnaire, either designing it as short as
possible or displaying it in a way that it seems less overwhelming. All respondents were generally
positive about the implementation of visual elements such as photos, colours and icons. Four
interviewees liked the idea of introducing narrative or story-like elements whereas the other two
were against it as it could distract the respondent of a questionnaire. While all thought humour
would be a good addition, game-like elements were either hard to imagine for participants or not
commented with strong preferences in favour or against with a respondent of a lower educational

19
background being the exception. With respect to further comments, participants suggested the
wording of questions should be as clear as possible and positively phrased, where possible.
Lastly, according to the pre-test interviewees the instructions are a key element in clarifying for
the respondent of a questionnaire of any kind what needs to be done and how it needs to be done.
To increase the validity and reliability of the chosen method in stage 2 and 3, several practical
tests were executed within or after pre-test interviews. Accordingly, certain terminology and the
length of interviews with young people (suggesting 20-25 minutes) were tested. Moreover, the
focus group setting using ‘BlueJeans’ conferences appeared to work well for this study’s purpose
but small adjustments were made with respect to specific functions of the platform and facilitation
of mutual communication of participants and the researcher.
Regarding the wording used, the Table 2 below depicts in how far specific terms were
familiar and comprehensible for young people of different backgrounds. The x indicates the
perception of the majority of pre-test respondents regardless of their demographics. Terminology
that was un-familiar or semi-familiar was accordingly either explained during interviews or
avoided and replaced by synonyms as well as descriptions.
Table 2
Familiarity of UX related terminology among young people
Terms/concepts Un-familiar Semi-familiar Familiar
Questionnaires/Surveys x
Gamification x
Engagement x
Flow state x
Layout of surveys x
Colour schemes x
Storytelling/narratives
within surveys
x
(Intrinsic/extrinsic)
motivation
x
Haptics x

20
Stage 2 – Online interviews
Based on the insights gained in stage 1, nine expert interviews were held online as well as
fourteen interviews with young people of various backgrounds. Kvale and Brinkman (2009) set
the threshold for sufficient content to be gathered at ten to fifteen participants. Above this number
the law of ‘diminishing returns’ makes it hard to find new input. Since experts and participants
were expected to deliver varying perspectives, expert interviews were collected apart from each
other. For the expert interviews, differing fields of expertise were chosen: one academic expert in
the field of gamification, two in User Experience (UX) from an academic perspective, on UX
expert combining the field knowledge with aspects of mental health and privacy, one User
Interface (UI) expert, one UX and product design manager, one web-designer and one manager in
customer relations. Three experts were Dutch, one German, one French, one from Canada and
two from the United States. This variety of interviewees was chosen so that a large spectrum of
perspectives in terms of questionnaire usage and design could be explored. The expert interviews
took between 25 and 45 minutes.
Complementing expert opinions, young people were interviewed in order to understand
the target audience of the final application better. Each interview took 15 to 25 minutes. The
participants were between 18 and 25 years old, had thirteen different nationalities as displayed in
participant Table 3 below and came from differing educational backgrounds. In terms of
educational level, some participants finished high school with a degree suitable to follow higher
education, some finalized middle school and started working, some were studying at Universities
of Applied Science and others at Academic institutions, both in Bachelor and Master
programmes. To increase the validity of transcripts and interpretations, the researcher had to be
fully able to understand statements and notions being provided by participants and was thus
limited to the German and English language. Hence, participants needed to be able to fully
express themselves in either one of those languages.
Usability x
User Experience x
Personality tests x
Humorous instructions x
Wording & directness
of questions
x

21
Three interviews differed from other interviews in structure. Firstly, the interview with the
customer relations manager was a hybrid interview as a young person was also present and
wanted to provide input. Secondly, among the interviews with young people, one interview also
took place with two respondents at the same time as they agreed to having the interview at the
same time based on their availability. Lastly, one interview recording was barely audible. For that
reason, the interviewer noted the audible parts of the participant, sorted it in categories and let the
participant fill up missing aspects of statements in written form in his/her own words.
Table 3
Overview of interview participant’s nationality
Nationality Number
Dutch
4
German 2
Finnish 1
Portuguese 1
French 1
Chinese 1
Indonesian American 1
Turkish 1
Indian 1
Bulgarian 1
Each interview (expert and young people) was semi-structured, meaning that a set of questions
were prepared to guide the interview. One example of each set of questions for experts can be
found in Appendix C. After some welcoming small-talk, an introduction was provided to give the
interviewee an overview of the research topic. Subsequently, the interviewee was introduced into
the approximate procedure of the interview and his or her rights in terms of data protection via a

22
briefing and informed consent (see Appendix C). The interviewee was made aware that he or she
can leave at any point and is welcome to ask questions in case of uncertainties during and after
the session. Each interview started with a question that does not imply any design elements, such
as gamification, layout, wording or length, to reduce the impact on first impressions and ideas the
interviewee might recommend independently. These open questions were also comparably ‘easy’
as advised by Jacobsen (1993), and stated in line with the suggestions of Jacobsen (1993),
Schoultz et al., (2001) as well as Bell (2014) to create an atmosphere of interest towards the
participant in the beginning of the interaction. Afterwards, each interviewee was asked to evaluate
to what extent they consider specific design elements and ideas as addressed by the researcher to
have a positive effect on the user’s experience with questionnaires.
Stage 3 – Online focus groups
The focus groups in stage 3 have been conducted to deliver feedback on the value exploration
questionnaire itself, as well as design choices as implemented in mock-ups based on the input of
interviews of stage 2. With focus groups as a method mostly being used for generating new ideas
and detecting opportunities (McQuarrie & McIntyre, 1986; Fern, 1982), problems or needs of the
target audience, which could formerly not be identified due to the absence of tangible design
examples, were investigated.
The participants who were included in stage 3 were within the same age-range as the
young adults in stage 2. Furthermore, for the focus groups, different nationalities were chosen,
among which, German, African-German, Dutch-German, Dutch-Turkish, Dutch, Pakistani,
Montenegro-Croatian, Zambian-Portuguese, Brazilian, Belgian, Italian, and Iranian-American. In
total eight young women and twelve young men participated. One focus group took place in
German with young people of non-academic backgrounds. Respectively two focus group sessions
took place in English with one group being of academic and one of a non-academic background.
Since several initially invited participants were hindered to join the sessions due to i.e. technical
problems, each of them was offered to experience the PVQ and afterwards responding to
questions as written down by the researcher. Three participants took that offer and responded to
some of the provided questions.
The procedure chosen for the focus groups in stage 3 was partly similar to the procedure
of the interviews in stage 2. Just as in stage 2, an informal introductory round was provided (see
Appendix C, which was excluded from the transcripts as a lot of personal information was shared.
Following up on the informal part, a formal briefing about the timespan and structure of the

23
session was held. Furthermore, an informed consent was provided (see Appendix C). After asking
the participants to elaborate on one specific memory they have with any type of questionnaire as
part of an introduction round, each participant was asked to fill out the value exploration
questionnaire.
The researcher had previously put the updated Schwartz et al. (2012) values (see
Appendix A) into the questionnaire application Qualtrics. After each participant had filled out the
questionnaire, they were asked to share how they experienced the activity and suggestions they
had for improvement in terms of content, layout, wording and any other recommendations.
Subsequently, the researcher initially intended to hold discussions in break-out rooms but as less
participants showed up for each focus group than had confirmed their participation, the researcher
decided to not split this group into even smaller groups. Instead, they were asked to share their
thoughts, feelings, concerns, and suggestions with the whole group immediately instead of in
form of small presentations. They were asked to provide input on an instructional video and
mock-ups of an app to evaluate in how far these design ideas would deliver a good user
experience to young people from their perspective. The sessions ended with a debriefing on how
the study will proceed and the possibility to receive a summary of the study results.
Strategy of analysis
The analytical cycle
To identify a specific theory a mostly inductive approach was chosen, while deductively taking
former User Experience related theories into account. Through interviews and focus groups,
empirical qualitative data is being collected within a ‘generic analytical cycle’ (Bendassoli, 2013).
According to Bendassoli (2013) three key-phases can be identified in generic analytical cycles.
In the first phase, the researcher reads all available and relevant information, such as transcripts,
secondary data (e.g., documents) and visuals (e.g., photos) several times. Cobin and Strauss
(1998) clarified that in this phase it is essential for further progress that some notes are taken on
the side. These types of memos help the researcher compare earlier ideas and findings to latter
ones, refine initial insights, and adjust the data collection methods in between of sessions, where
needed, to fill knowledge gaps.
In the second phase, the researcher can take two routes to proceed (Bendassoli, 2013). It

24
can either be chosen to make use of existing frameworks in order to sort out and make sense of
the collected data (e.g., deduction). Otherwise, an inductive strategy is selected as a more
appropriate means of conceptualizing the gathered data. In the latter case, the researcher needs to
detect certain patterns, regularities or overarching themes within the existing data. Codebooks can
accordingly be based on previously developed frameworks (deductive) and developed based on
connections made within the collected empirical data (inductive). Within this phase pre-
determined terms in form of codes were used at first as deducted from existing literature. These
codes were complemented by codes, which emerge through inspection of patterns and themes
after the first interviews and the coding scheme finalized as soon as interviews and focus groups
had been held.
Lastly, the detected patterns and themes are accounted for through conceptualization and
categorization. Codes are being grouped into meaningful main- and sub-categories, while the
abstraction level of the analysis outcomes rise (Thomas, 2006). Each in-vivo code was clustered
and classified into meaningful overarching themes and sub-groups to allow for a more thorough
and specified organization and structuring of the data. By providing context to the categories, the
researcher can explain the findings. Moreover, comparing subgroups with one another or the
backgrounds of individuals can provide input for a category, which helps the researcher to
establish significant differences. Former theories developed in a certain field of interest are
usually also being related towards emerging concepts (Bendassoli, 2013). Relating these concepts
with one another will set the foundation for the researcher to develop a final theory and
potentially a new model.
Application and assessment of the coding scheme
To assist the researcher in applying the coding scheme to the data, codes were assigned with the
aid of a computer-assisted qualitative data analysis program (CAQDAS), namely Atlas.ti. Saldaña
(2009) defines codes as a ‘word or short phrase that symbolically assigns a summative, salient,
essence-capturing, and/or evocative attribute for a portion of language-based or visual data’. As
suggested by Saldaña (2016), the data was first divided into meaningful segments and coded
according to its literal content by assigning in-vivo codes to the data. Saldaña (2016) determines
in-vivo coding to represent the content of a segment as much as possible like the respondent
intended it.
Hence the researcher was interpreting the data as little as possible within the first coding
rounds. Thereupon, Atlas.ti was used to turn those rather literal codes into patterns and themes, of

25
which some codes emerged through the data itself and some were used based on suggestions of
literature. Subsequently, in an iterative, axial coding process, the existing codes were adjusted,
and the number of codes expanded with regards to surfacing discoveries until the final interview
and focus group session were conducted and analysed.
Validity and reliability
To enhance validity of the coding process and decrease chances of missing valuable information,
all transcripts were coded by the same researcher manually. Moreover, to increase the validity and
reliability of the coding scheme, the Cohen’s Kappa was calculated (Mc Hugh, 2012). The
Cohen’s Kappa measures the agreement between researchers in assigning codes to a segment on a
scale from -1 to 1 to ensure more ‘interrater-reliability’. A person with an academic background
double-coded 10-20% of the transcripts as soon as a first codebook was developed by the
researcher. This process was repeated until each category of codes showed an overlap of at least
60%, preferably higher. By doing so, researcher bias can be minimized (Sim & Wright, 2005).
For each bigger category a Cohen’s Kappa was calculated, with each reaching at least 65%.
Survey type presented 89% agreement, Demographics 83%, Sentiment 67%, Specific (UX)
Design elements 78% and further recommendations 82%. Sentiment showed the lowest level of
reliability, which can partially be explained in the interactivity of certain sentiment codes and a
remaining degree of subjectivity how emotions are interpreted.

26
Results
In this chapter the results of the raw data’s analysis will be presented. Based on the codebook (see
Appendix X), four main categories have emerged within the coding process: 0. Survey type; 1.
Demographics 2. Sentiment; 3. Design elements. Respective to data collection stage 2 and 3, first
13 sentiments could be identified and subsequently 17 design elements, which are expected to
improve upon the UX of the PVQ if guarded carefully within the design process. Engagement
will be discussed within result stage 2 as the third stage measures the overall improvement of UX
and engagement through specific designs. The User Experience-User Engagement-Technology-
Acceptance-Model (UXUETAM) as summarized at the end of the result section combines all the
findings in one theory about UX design guidelines for the PVQ and potentially other types of
surveys. The main comments were gathered in Appendix G with its most important contents
being discussed subsequently.
Results of the second data collection stage
Within the second data collection phase, ideas and suggestions were gathered on how survey
design in general could be improved upon in order to create design mock-ups. The latter can be
found at the end of this chapter. Young people and experts did not only make suggestions of
positive effects design elements can have on survey respondents, but also voiced certain concerns
towards their pitfalls. Design elements, which are poorly implemented, not adjusted to the target
audience or not in line with one another as well as the overall survey’s goals can show contrary
effects of the positive influence they would have otherwise.
Frequencies
Within qualitative research, data is typically analysed with respect to content and less regarding
frequencies, percentages and further numerical interpretations. The numerical input as follows
was thus used as mere guidance to prioritize certain themes over others and choosing the most
salient design elements to be part of the designs proposed at the end of stage 2. This salience is
displayed in subsequent Table 4 including a definition of each theme.
Moreover, to present the reliability of themes to be discussed across participant, a
percentage was calculated per sentiment subcategory. Very reliable sentiments had to be brought
up by at least 76% of the participants (4), reliable sentiments by at least 51% (3), rather reliable

27
sentiments by at least 26% and unreliable sentiments were mentioned by 25% of the interviewees
or less. Both salience and reliability estimations combined led to the sentiment receiving a
specific rank to indicate what feelings and perceptions appear to be most relevant to pay attention
to when designing for a good UX. The rank should hereby not function as the only indication of
why a sentiment should be focused on within design-related decisions but represent an overall
guideline of interpretation for this study’s results.
Table 4
Rank and definition of sentiments based on interviews
Rank Sentiment Frequency Reliability Definition of survey
design elements
1. Appropriateness Very high 4 Design elements are suitable for the context
of the survey.
2. Clarity Very High 4 Design elements are unambiguous, non-
biased and comprehensible.
3. Feasibility High 4 Design elements are making it possible to
master a task and are not distracting from
that goal.
4. Visual Appeal High 3 Design elements are attractive to look at.
5. Entertainment Rather high 3 Design elements are fun or enjoyable.
6. Curiosity Rather high 3 Design elements create interest and make
curious.
7. Motivation Mediocre 3 Design elements encourage and reinforce or
motivate.

28
8. Goal setting Mediocre 2 Design elements make the purpose or benefit
clear.
9. Attention Rather low 3 Design elements reduce boringness and
enable attention keeping.
10. Security Rather low 3 Design elements create a safe (i.e. data
privacy) and relaxing atmosphere.
11. Control Rather low 2 Design elements allow for customization or
enhance agency.
12. Accessibility Low 2 Design elements are inclusive for specific
groups (i.e. with disabilities).
13. Originality Very Low 1 Design elements are not stereotypical but
rather novel or unique.
The Table 4 above illustrates how saliently certain sentiments were discussed among all interview
participants. The approximate differences in salience across participants can be observed in the
separate Tables 7 and 6 (see Appendix E) for young people and experts. Summarizing the
agreement between those two groups, the primary sentiments of clarity, feasibility, goal setting
(usefulness), curiosity, originality, context appropriateness were very similar in salience.
Accessibility was slightly more saliently alluded to among experts, whereas control mostly with a
focus on customization was more dominantly discussed among young people. Larger
disagreement could be found with respect to attention, entertainment, visual appeal and security.
Whereas the latter seemed to be of higher importance for experts, especially in terms of data
safety, were the first three sentiments considerably more relevant to young people.

29
Key findings - sentiments
This collection of sentiments has been divided into three primary sentiment categories (perceived
usefulness, perceived usability and hedonic qualities) and two secondary sentiments (motivation
and attention), which all influence the intention a survey participant would have towards the PVQ
(or questionnaires in general). The three primary categories each entail several subcategories (see
Table 5), which describe the feelings and perceptions survey participants develop towards parts of
the questionnaire or the questionnaire itself. Motivation and attention stand separate from these
primary sentiments as they can both emerge within a survey participant independently from other
sentiments but are also influenced by the primary sentiment categories. All three primary
sentiment categories according to the results of stage two seem to be of approximate equal
importance as each contains sub-categories within the higher and lower ranks. Motivation as a
secondary sentiment appeared to be less relevant than attention, even though both had a
comparable degree of reliability across participants.
Table 5
Categorization of primary and secondary sentiments
Primary sentiments Secondary sentiments
Perceived usefulness
a1. Context appropriateness
a2. Goal setting
a3. Control
a4. Security
Perceived usability
b1. Clarity
b2. Feasibility
b3. Accessibility
Motivation
Attention
Hedonic qualities
c1. Visual appeal
c2. Entertainment
c3. Curiosity
c4. Originality

30
Primary sentiment – perceived usefulness
Perceived usefulness in this result analysis refers to the overall perception of the survey use being
beneficial for a participant as well as protecting his or her agency and safety. The theme
encompasses four subcategories respectively. Of which context appropriateness was the most
important subcategory, followed by goal setting. The latter two were found less prevalent in the
data.
Context appropriateness
This category encompasses comments which relate to the suitability of certain design elements for
the given context but also positive perceptions, which could not be assigned to other categories.
The design elements, which received the most salient recommendations of having to be checked
for their suitability were gamified elements, such as storytelling and the implementation of an
avatar, as well as visual design elements such as photos and colours. Age was the most frequently
mentioned demographical factor, which could influence the suitability of certain design elements
for specific questionnaires. “I think I think it would add value. I mean, people people like seeing
progress and they're like building things and they like seeing immediate. Yeah. Immediate
feedback. And so I think especially with a younger population, you know, whatever. I mean, it's
not exclusive to a younger population like teenagers or children, but I think they would get a lot
of sense of satisfaction and something grow like that immediately.” Lastly, the length of a
questionnaire was advised to be kept in line with its purpose. A survey can accordingly be more
extensive, if the outcome would otherwise not be beneficial for the user. “I know it's serious
because it's really serious. I think they're really serious about that thing. But sometimes it's like,
no, I don't want to do it for so long. But if they make it a lot shorter, then it will not be that
perfect. So I understand that it's such a dilemma, but it's OK. But at the end of the test, you get a
great explanation. “
Goal setting
Goal setting refers to the purpose, benefit(s) aim and reasoning a user recognizes in the
questionnaire, which can be influenced by the survey’s design. A young person emphasizes that
the lack of a recognizable “direct benefit” will especially with regard to long-lasting
questionnaires increase the negative effect of low attention spans, which “people tend to have”.

31
With two exceptions, all young people indicated that they only fill in questionnaires because they
see it as their duty, responsibility or simply a nice gesture towards personal contacts to do so. This
implies that they need a clear purpose of filling in the questionnaire and if the goal is not to
support others, it needs to be made clear what other benefits the survey respondent gains through
participation. The primary platform to convey the benefits of and reason for filling in the survey is
the introduction into and information-provision during the questionnaire. Both should make the
user feel addressed personally, which the design expert claims to be activating the right mindset.
An example of how sensemaking should be applied during the process of filling in the survey was
proposed by the gamification expert with respect to meaningful feedback in combination with a
changing avatar: “It’s not like ‘hey you made it through a third of the questionnaire. Your plant is
now going to be bigger!’”.
Control and Security
Control refers to the agency of the questionnaire respondent, whereas security encompasses both
the feeling of safety in terms of i.e. data protection and a relaxing environment, in which the user
feels calm and protected enough to provide honest and genuine responses. Agency in the survey
as part of a mobile app context can according to as well experts as young people be approached
via means of customization and personalization. Ideas hereby mostly pointed towards to
adjustable avatars, which according to the gamification expert not only need to be possible to
“personalize”, but also “relatable” for the target audience. Control can also refer to being able to
plan and time one’s actions based on needs. Ahh I think that's useful. Maybe on a mobile version
is going to be a bit too much if it is huge. But if it's on like a computer version or rather small,
then it's not too much to have it like at the bottom. It also kind of gives you an idea if you're going
to have enough time to finish it right away or you need to, like, do something very quickly and
come back. You know, it always helps people, especially if they're not the most patient type to see
how far they are on what's left.
Regarding data protection was highlighted by the UX product designer how transparency
is essential for success but that also unconventional design elements like humour could be used
with respect to a serious topic like privacy, if that approach was coherent with the overall
communication strategy of the survey and/or mobile app. A young person summarizes the
opinions of experts and young interviewees: 2:4 I think privacy should be guarded. The
questionnaire responses should be handled in a way that the respondent feels safe and ethically
guarded while filling them out. On the other hand, with respect to relaxing safe zones to be

32
created within a questionnaire, one young person suggests applying “Lo-fi music” in the app
background. Colours were furthermore also rated by one UX expert to take away uncertainties,
which can otherwise arise looking at non-coloured “blank canvas”.
Primary sentiment – perceived usability
Perceived usability in return focuses more on the functional aspects of the questionnaire. Clarity
and feasibility are hereby the most relevant subcategories. They are inherently interrelated as i.e.
clear instructions also usually make a questionnaire component feasible to master. Nevertheless,
is this data analysis making a distinction between the two because the instructions of a survey
could, for instance, be very clear but other elements, such as distracting animations, could
diminish the extent to which a questionnaire task is achievable. Accessibility relates to both
formerly mentioned categories but puts specific emphasis towards inclusive measures for people
with special needs, i.e. behavioural disorders and/or disabilities.
Clarity and feasibility
On the one hand, clarity refers to unambiguous instructions, questions and the connected tasks,
but also to reducing bias. The latter can hereby be best illustrated with respect to wording and
colours. If specific words used within the survey items or respective instructions are leading, there
is an increased chance that the responses turn out to be biased. On the other hand, feasibility can
be advanced by displaying questions in “digestible” portions supported by progress indications to
manage expectations was considered to be useful by both experts and young people. Gamified
design elements like avatars were mostly commented upon positively in terms of feasibility, but
the gamification expert warned that the avatar should not be too open in changes and
interpretations as the “blank state syndrome” enhances chances of people filling in “random
nonsense” as they feel like “nothing they do matters”. Simultaneously can storytelling for
instance occasionally be distracting or too mentally loading. Information in return both improves
upon the clarity as well as feasibility of the survey and should be provided consistently
throughout the questionnaire. Also be careful what contexts to provide [...] Movies also only
display some chosen parts of their whole personality. If they were humans that you meet in real
life, there would be way more to their character than what is shown in a couple of movies, they
would react differently in varying situations. The same counts for people of course, so you make

33
things too simple and potentially bias your respondents, if you let them compare themselves with
film characters that they already have certain associations with.
Accessibility
Accessibility can be a side-effect of inclusive clarity as well as feasibility. It is close to impossible
to account for all special needs, which can occur within one target audience, but taking certain
common physical or mental restrictions into account, does not always mean that the design has to
be changed entirely. With respect to colour-blindness one young participant explains how Putting
“red on the one end and green on the other” can also still provide sufficient clarity, these colours
just should not be placed directly next to one another. Another one emphasizes that audio could
be useful for people facing dyslexia, while a third mentions that leaving sufficient space between
design elements and thus not overwhelming the survey respondent helps people with ADHD or
autism.
Primary sentiment – Hedonic Qualities
Hedonic qualities in this result analysis refer to positive appeal and pleasure and interest. The
subcategories are accordingly: Visual appeal, entertainment, curiosity and originality. The latter
two were hereby considerably less dominantly found within the data than the first two. Curiosity
is to some extent resulting from perceptions of originality and visual appeal but can also be
evoked separate from these sentiments. Entertainment faces a similar phenomenon, in which
visual appeal, feelings of originality and curiosity also improve overall enjoyment and fun.
Visual appeal
Colours played a central role in making the survey appealing. Visual design elements were mostly
judged to enhance the experience, for instance, by delivering more diverse visual input. “[...] for
the instructions, it needs to be visually appealing. Not necessarily what's in the text. So also, when
you look at the phone or a laptop, how does the instructions look on the screen and then you
switch it up maybe with icons and a picture or whatever, just so that it's not like a block of text?
Basically, this looks more appealing through that.”
it was mentioned repeatedly that using very dominant or intensively varying colours, would
cause discomfort or be repulsive towards young people. “Oh, interesting. Oh, for sure. I mean,
just even like I mean, there's so much emotion that can be conveyed through color.” And so I

34
could see color being used to reflect back. Generally speaking, did young participants emphasize
how important it is to align the styles of and messages behind visual elements to maintain
attractiveness. Also, icons placed within very narrow spaces could “clutter” instead of increasing
the appeal. One advice, mostly brought up by experts but also highlighted by some young
participants, was to not let attractive elements hinder functionality but rather enhance it by
making tasks more comprehensible. ”You could definitely use colors to amplify the gamified
approach, so, for example, a question could become gray or a less prominent color if it's already
been answered. So then that way that the user feels them on the page itself, they're kind of like
knocking off the items which kind of adds to gamified approach or whatever, the feeling that
you're, like answering things.”
Entertainment
Personality tests were indicated to inherently be more entertaining than other surveys as the
respondent usually fills them in to learn something about him or herself. “It can also be quite
interesting because you get to know yourself better because you're answering questions about
yourself. Yes, I think you are your are exploring your own personality.” If it's too serious than it
might bore somebody out. Nevertheless, could some design elements considerably augment the
level of entertainment of such a survey and potentially even more of other questionnaire types. “I
took a couple of personality test there out of curiosity. It was a lazy afternoon.” I think I did one
of these before, but the fun, the fun part was seeing how they used infographics for my results.”
Besides those visual elements, humour and gamified elements occurred the most frequently in
associations of fun, enjoyment and entertainment looking at younger audiences. Maybe if it's
possible that the questionnaire is interactive, I don't know if that's, maybe videos on top of
pictures and also the color scheme and rather than just the white paper. Humorous elements were
rated as an effective fun element, if the serious goal of the questionnaire does not get lost.”If its
all serious questions I think it might be a little bit distracting if you're really funny. But I would be
going for a slightly goofy approach, then it might... It might be more easy to fill in. If it's too
serious than it might bore somebody out”.
Curiosity and originality
Curiosity and originality were connected as the latter often causes or comes along with the first.
Introducing novel approaches via avatars, storytelling or other gamified elements or unique
questions, awaken or sustains the user’s interest. Displaying results in a manner that respondents
35
can compare their answers over time was suggested to maintain interest over longer periods. The
UI designer suggested that “you have to do more than what’s already out there” referring to
visual and interactive elements delivering a “premium experience”. The gamification expert also
added a specific comment about extrinsically motivating gamified elements having undergone a
type of stigma, due to being overly used in certain contexts and thus not being recommended.
“Whenever I think of gamification, I think of the worst kinds first, because they're the ones that I...
That I hate that a lot of games scholars also hate because if you say the word gamification in the
wrong areas of a gaming conference, then they will come to you with fists up. Because
gamification has been misused so often, that people start to think of it as either being absolutely
crap and or manipulative or they think this is this is everywhere, because a lot of forms of
gamification are so heavily used that they have the old Seidenfeld conundrum where I guess that's
the last word, but something where they feel like you're not being original with this. Everybody
else is doing the same thing..”.
Secondary sentiments Motivation and Attention
Motivation and attention are a gateway for allowing a positively connotated respondent
evaluation of the UX, as well as engagement during and re-engagement after usage. Since they
mostly result out of primary sentiments, they can be used as a summary of important findings of
stage two. Boringness (and hence lack of attention) was named as the main argument for not
considering the participation in surveys to be an enjoyable (and sometimes also not useful)
activity. Creating appealing and exiting designs, which uphold the attention can prevent early
drop-out and the provision of randomized, non-genuine responses. Receiving feedback and seeing
progress were to means of reinforcement, which were especially well perceived. “I'm thinking
like in a score, like people always want to see their progress in something. So if you're not if you
have a survey that's consistent up to a hundred questions, that can be daunting. You don't want a
one on one hundred counter frustrating, but you change it with the progress bar. Like, can you
see something that lets you know how much there is still left to do... and if I don't use it on a daily
basis, I see my streak as a going down, what a bummer, like I lost it. It's such a small, subtle way
of keeping me, like, invested in it”. But no real incentive Similarly does motivation help to
deliver the energy a respondent needs to finalize the survey and thus entirely going through the
reflective process. If the motivation was existent during the questionnaire experience, it becomes
more likely that motivation is still existent when a new survey encounter is taking place. In
relation to motivation, certain needs could be recognized. On the one hand, the wish for relatable
designs (i.e. avatar) was addressed as well as design, which makes it clear and easy to master the

36
questionnaire, potentially even allowing for personal growth over time through
reinforcement.Talking about avatars, one UX expert summarized “I think this makes a survey not
only more attractive, but it's also I think that that will motivate people to to enter the survey and
to to not stop answering the questions when the survey takes a lot of time. So I think that may
really help.”. The need to recognize a direct benefit or purpose was similarly important to feeling
agent in their own actions and having the opportunity to customize design elements. Satisfying
these needs largely enhances chances for repeated questionnaire usage (re-engagement and
adoption).
Below some design examples of both the instructional video as some mobile survey mock-ups
can be found below, with more screenshots being placed in Appendix F.
App design mock-ups of questionnaire outlook

37
Instructional video example-screenshots
Results of the third data collection stage
In the third data collection stage both the original version of the PVQ was tried out and provided
feedback on by survey participants. Besides this, specific design mock-ups have been tested.
These design examples were inquired based on their potential to enhance the UX of and
engagement with the PVQ, if they were to be implemented within the mobile application feature.
Based on similarities and differences in the effects, which they create, three main categories were
identified: Interactive, Informative and further Atmospheric design elements (see Table 6). All
three cannot fully be considered to function exclusively from one another. On the contrary, they
can reduce the effect of other elements, if not designed aligned with one another. Simultaneously,
they show the potential of enhancing the effect of one another, if combined strategically and in
line with the user’s needs. Interactive and atmospheric elements evoked most excitement, arousal,
joy, curiosity or similar positive affect and therefore were suggested to be positively influencing
the focus group participant’s attention and motivation. Especially interactive elements, which are
gamified (playfulness) elements created reactions of positive surprise and its innovativeness was
indicated to increase chances of young people being encouraged to start with the survey, as well
as likely to continue being engaged and even re-engaging with it. Atmospheric and informative
elements were especially in combination with those elements considered to be of high value,
whereby these should not contradict one another in the type of effect and image they provide
towards the survey respondent.

38
Table 6
Categorization of design elements
Overarching category Sub-category Specification
Information
a1 Result display
a2 Instructions
Options to visualize/explain results
Video instructions
Written instructions
Information button
Interactivity
b1 Intrinsic
gamification means
b2 Extrinsic
gamification means
Interactive elements
Feedback
Progress indication
Avatar
Storytelling
Point systems
Challenges
Monetary rewards
Atmospheric
c1 Visual design
c2 Non-visually
centralized ambience
Colours
Images/icons
Question arrangement
Scale-layout
Audio
Length
Haptics

39
Tone of voice/Humour
Wording
Atmospheric
Atmospheric elements are named this way as they create an overall ambience within the app via
sensual, spatiotemporal and also emotional effects outside of elements focusing on information
and interactive elements.
The tone of voice and established humour were generally evaluated positively by focus group
participants but were emphasized having to be consistent across the survey and its instructions.
Despite some participants suggesting rather aggressive humour, the majority advised to not apply
too offensive or extreme humorous language to not discouraging or distracting people from
reflecting and being honest. “What I think, a bit of humor is always important just to lose lose it
up or I'd like to make it more lose. But there should still be a sense of seriousness like that, they
are like professional and really want to get the customer or the person behind the screen”. With
respect to the PVQ’s items, its indirect manner of asking was perceived as innovative but also
difficult to understand or irritating. Whereas no strong preferences could be distinguished based
on majority’s the formerly established importance of clarity above originality hints towards
straightforward questions being more effective than ones indirectly addressing the respondent.
Additionally, should words be avoided, which put goals in a negative lighting, while
negations, such as the introduction of a ‘not’ in an item should be highlighted to not be
overlooked. “And I think maybe a few questions where I have a negative feeling when I when I
read them, like, do I... do I need the power that money briongs or something like that? I'm pretty
fast inclined to think, no, I'm not, because that doesn't sound right. But maybe I am. So I don't I
don't know. It makes me think “. The PVQ was not perceived to be too time consuming, especially
if appealing audio and visual design elements would be introduced. Whether icons or photos are
thereby more effective was debated upon and deviated across participants. Both should however
be decreased as much as possible in potential bias while remaining attractive. Grouping items was
generally perceived to be a good idea, whereas the number of categories to be displayed at the
same time did not lead to clear preferences across participants. The established colours were
overall perceived well but should be adjusted in saturation to align as one recognizable colour

40
scheme.” Yeah, I think that's actually a good point. To me, it does look like they're different color
schemes because the first two are more pastel and then I would say number three and six and
even probably like, yeah, seven, eight look more vibrant, like more saturated than the first ones”.
The item scale should not be too leading but differently sized circles are mostly considered to be
helpful to underline the differences across responses.” I actually liked that because there are some
things that I was just unsure of. So it was easier for me to put it like that and for other things,
which I was more sure of, I would go for moderately. So for me, I think it was quite helpful.”
Interactive
Especially reinforcing feedback and a customizable (changing) avatar were perceived very well
besides a progress indication. A combination of these three and further animations created the
highest degree of arousal and positive responses. It should hereby be paid attention to not making
these elements appear too childish and the cup should not walk in another direction than what the
progress indication is attempting to illustrate. Storytelling can be a good addition whereby bias
through the introduction of names should be avoided, especially in a cultural context”. I realized it
will probably induce some sort of bias because yeah if you just named Maria, maybe that would
created some sort of dissonance. If you're from a culture where Maria isn't a common name,
perhaps that's just something to think about.” Generally, should the PVQ items take into account
that there are cultural differences. “I think there's one thing that I also wanted to add to the
previous point that I'm going to answer this in a series as well. One challenge that I was also
facing was with the norms you have when you compare yourself, because one of the questions,
especially if they were about your commitment to family, for example, if I see myself in terms of in
any way to compare, the thing is that the norms in my home country far away and the
Netherlands, they are very different. So how I act in the Netherlands, others would say 'oh he's
taking care of a family a lot.” But back home, that norm is just very integrated. So I was sort of
challenging myself as well. Look at what sort of language were put on the scale because
commitment to family, the way I do it all the way, for example, the Dutch friends would see it is
that awkward as a lot, but not one that is so normal that I don't feel like I'm doing much more than
anyone else. But that was a bit of a challenge that I was facing in some questions that was likely a
bit too personal because you're sort of living in two very different worlds Feedback should come
across genuine and reasonable while being suggested to not occur too frequently because it could
disrupt the respondents flow in filling in responses.

41
Informative
While informative design elements received the least comments, they were considered essential in
accomplishing the questionnaire as even with orally provided instructions it was not entirely clear
to participants how to interpret the PVQ items. The preferences towards different types of
instructions differed. Therefore, it can be proposed that providing both an instructional video
(which can be skipped) and written instructions would contribute to usability, goal setting and
enjoyment to the largest extent. It specifically needs to be clarified better whether the intention of
the survey is to let respondents indicate what values are societally acceptable or what the young
person really values for him or herself. Furthermore, does the video need to be adjusted in terms
of usability.”I think that it wasn't that clear, and that was mainly because it was so wordy. I think
there was a lot of words in one kind of frame, let's say. I think splitting up that information across
more like slides, so to say, or even making that interactive so that you're the one that taps to the
next slide so that you don't have to worry about the pace of the video so much. It could be better
for number one clarity and I would imagine in an instruction you just want to read the
instructions.” Whereas animations worked well for the video, it was
criticised that it reminded of a “PowerPoint presentation”. It was also by some participants
perceived as displaying input to shortly while others found it to be to slow. Information buttons
were, as previous interviews already implied, perceived well in between of questions for
clarification and could maybe replace some instructions in the beginning of the survey. “Oh, it
definitely adds value, because sometimes there's words that you maybe you don't know the
definition of or just concepts that you haven't heard in that exact like being used in that exact
way. So I think that's great.”
Model based on both result stages
The point of engagement starts, when the first expectation of the experience is formed during a
first encounter with the questionnaire’s design. These feelings and perceptions, which occur in
that phase can not all be experienced at the same time and might change in the (subconscious)
experience of the survey respondent. For instance, could visual pleasance or contradictory
unpleasantness be experienced in a rather early stage of the survey encounter, whereas feasibility

42
might only become apparent in later stages of engagement or differ during various phases of
engagement. Motivation and attention could be a given from the first encounter with the survey
but could also change over time based on the primary perceptions and feelings. Both are mainly
responsible for the main phase of engagement, but that continuous involvement could also
directly be affected by primary sentiments, such as context appropriateness. What design
elements evokes specific sentiments, depends on the survey context and also in how far they are
combined with one another. Behavioural intentions are predominantly formed based on the main
engagement phase and disengagement and thus determine whether a survey respondent is going to
re-engage with the questionnaire as intended for the PVQ.
Figure 3
User Experience – User Engagement – Technology Acceptance Model
Discussion
Investigating in how far Perceived Ease of Use (PEoU), Perceived Usefulness (PU) and Hedonic
Qualities (HQ) can help to improve upon the overall User Experience of the Portrait value
Questionnaire, not only these three factors could be confirmed to be of high importance but the

43
role of need-satisfaction leading to intrinsic motivation, and user engagement was also
highlighted. Therefore, the User Engagement-User Experience Technology Acceptance Model
was created to illustrate these connections and delivering theoretical ground for improving upon
survey designs. Primary and secondary sentiments hereby composed the survey specific definition
of PEoU, PU and HQ as deviating from the understanding applied towards these determinants in
previous research. The most apparent differences in the characterization of these factors in the
afore proposed model can be recognized in the role of need-based aspects namely autonomy,
mastery, relatedness and purpose. Since autonomy also entails voluntariness, previous
shortcomings in the appliance of the UXTAM of Mlekus et al., (2020) could be accounted for.
This study’s initial expectation of that factor being separate from PEoU, PU and HQ, could be
revoked in the survey context. Additionally, the gap of time-bound aspects in merged technology
adoption and UX models could be filled by including engagement over three time-related phases.
Similar to findings of other studies in the field of technology adoption and experience research,
did HQ play the most salient role in terms of UX advancements compared to PEoU and PU for
the young target audience as it counterfeits perceptions of boringness as the most frequently
named reason for disliking questionnaire interaction. HQ could hereby largely be augmented
through the implementation of interactive (playfulness), so intrinsically motivating gamified
elements, which in return function most effectively in combination with informative and further
atmospheric elements.
Hedonic Quality
Q1 What role do hedonic feelings and perceptions play in the User Experience of the PVQ?
The findings as elaborated upon in the result section of this paper indicate that hedonic qualities
play an extensive role in the UX of the Portrait Value Questionnaire. In line with findings of
Hornbæk and Hertzum (2017), it can even be argued that it was given the highest priority of all
three determinants. Whereas interviewees focused on each determinant with comparable salience
did focus group participants besides clarity mostly pay attention to aspects of fun, attractiveness
and awakened interest (curiosity). Since questionnaires are often perceived as boring or inherently
not evoking enjoyment, it appears to be of importance to find ways of making the questionnaire
more entertaining. Especially young people seemed to value entertainment factors extensively and
also emphasized the importance of visual appeal. Also establishing original designs would create
memorable experiences, which enhance chances of repeated usage. These findings were expected
and are in line with the HQ components named by Mlekus et al., (2020) as crucial for a good User

44
Experience. Nevertheless, was curiosity previously not specified as an HQ factor but included in
this study
Perceived ease of use
Q2 What role does usability play in the User Experience of the PVQ?
This study’s findings suggest that perceived ease of use (usability) is essential to take into account
when seeking to design for a good user experience of the Portrait Value Questionnaire and
surveys in general. Frustrations are one of the main reasons why user experiences are rated low
(Ceaparu et al., 2004) and users refrain form adapting a technology. Mlekus et al., (2020) found
that comprehensibility and learnability of the technology as well as dependability (reliability of
the technology) to be the main determinants of the user perceiving the interaction with a
technology as easy and tasks as achievable. This study revealed a comparable but adjusted focus
dividing ease of use into clarity, feasibility and accessibility.
Clarity besides the comprehensibility of instructions also advises on the diminishment of
bias, which is largely in line with the dependability of a technology but is less specifically pointed
towards when seeking to increase the dependability of other technologies. Where possible, the
user should receive the survey outcome, which is most representative for reality and thus is
expected to be most valuable for the further reflection process. The feasibility aspect of reduction
of distractions from the task, which hinder instead of supporting the further progress of the user
also seems to be of high relevance in the survey context but is a dependability aspect of various
technologies next to other functionality aspects. That moving from one page to another between
questions, could lead to loading errors was the only typical dependability facet, which came
apparent in the survey context. Lastly, did the HQ factor of the UXTAM of Mlekus et al., (2020)
not point at physical or mental disabilities, or cultural differences, which not necessarily for all
surveys but at least the PVQ might be of importance. The PVQ in the app context has a rather
broadly defined target audience when being designed for young people, of which some could be
facing aforementioned restrictions. Preliminary aiming at making the app available for young
people globally, can lead to varying interpretations of survey items and also challenge design
elements like storytelling.
Perceived usefulness

45
Q3 What role does the recognition of a useful goal and effort expectancz play in the User
Experience of the PVQ?
Next to hedonic qualities and perceived ease of use was also perceived usefulness, was found to
be a key factor in the overall UX of the PVQ. This category hereby has undergone changes in
interpretation compared to former understandings of PU within technology acceptance models
(Davis, 1989; Venkatesh & Davis, 2000). With respect to questionnaires, not only “the degree to
which a person believes that using a particular system would enhance his/her job performance”
(Davis, 1989) relevant but also the overall expectation of resulting benefits as well as perceived
control, security and context appropriateness. The latter appeared to even be the most salient
concept as design elements showed contradictory (or negative) effects when not being adjusted to
the target audience or in line with the PVQ’s goals on personal or societal levels. The suitability
dimension revealed itself pre-dominantly with respect to age and the reflective nature of the PVQ.
Based on the reflectiveness condition, context appropriateness was determined to add to
the PU determinant as the usefulness of the PVQ gets lost when its design reduces the quality of
the reflection process. The same counts for the perception of interacting with a privacy-wise safe
as well as relaxing environment when it comes to the security of the technology. Control as
referring to the survey respondent’s agency corresponds with the self-determination theory
component of autonomy (Ryan and Deci, 2000a) and together with the herein emerged goal
setting concept creates a voluntary interaction with the survey. Usually being in need of extrinsic
motivators to engage in a questionnaire, seeing a beneficial outcome and feeling in control of
their own actions, young people implied of being more likely to start the questionnaire as it deems
useful. Whereas PU was originally mostly tested in terms of output quality and efficiency within
the UXTAM, are survey-related usefulness perceptions not limited to functionality but also the
need satisfaction of the purpose facet introduced by Pink et al. as cited in Spawr (2011) besides
autonomy making the interaction voluntary.
User engagement
Q4 In how far can hedonic qualities, perceived ease of use and perceived usefulness as achieved
through design elements positively influence User Engagement with the PVQ across different
phases of engagement?
The results of this study can be compared to the User Engagement model of O’ Brien and Toms
(2008) as the sentiments and design elements, which emerged through the data analysis largely
resemble the key factors named in that theory. The User Engagement Model separates the
engagement with a technology in three phases of engagement and additionally the potential phase

46
of re-engagement. The Point of Engagement is according to O’Brien and Toms (2008) evoked by
aesthetics, novelty, interest, motivation and a specific or experiential goal. All of these facets are
addressed in the UXUETAM as developed in this study within the HQ determinant and goal
setting within perceived usefulness. Motivation represents an exception to that finding as it is
together with attention placed more central in this study’s model than in the model created by
O’Brien and Toms (2008), hence playing a role in the first and second engagement phase but
additionally also being crucial to allow for re-engagement.
The facets of importance as named in the second engagement phase, are again aesthetics,
as well as sensory appeal besides awareness, control, interactivity, novelty, challenge, feedback,
interest and positive affect (O’ Brien and Toms, 2008). Whereas this study does not reveal a
specific relevance of awareness, feedback and control appeared to be of high relevance for
upholding engagement through reinforcement. Interactivity was in the UXUETAM mostly
understood in the gamified context via animations and customization as well as feedback.
Challenges were understood by this study to function as extrinsic motivators and were hence
excluded due to afore mentioned reasons. Nevertheless, the reflection process of the PVQ inherits
a certain degree of challenge, which is more intrinsically motivating.
The disengagement phase is the final stage (O’ Brien & Toms, 2008) and in the
UXUETAM determines, whether the user evaluates the overall engagement and experience to be
good enough in order to re-engage with the technology at another point. Again, challenge and
positive affect are listed but also negative affect pointed out and perceived time, usability as well
as interruptions. Interruptions and negative effect are not specifically illustrated in the
UXUETAM but implied across the dimensions of perceived ease of use and partially perceived
usefulness as well as hedonic quality.
Motivation
Q5 To what extent does intrinsic motivation as prompted by need satisfaction and gamified
elements contribute to the UX of the PVQ?
With motivation being considered a secondary sentiment in this study’s outcome, it is essential in
forming a behavioural intention within the user towards repeated use of the PVQ. This is largely
resembling the expectations proposed prior to the data collection. It also reflects upon the three
main categories of self-determination theory (SDT): Autonomy, Relatedness and Competence.
The suggestion of Pink et al., as cited in Spawr (2011) to add purpose as a category in the SDT
appeared to be central for motivating users to participate in a survey as previously described. As a

47
secondary sentiment it is not only important during the first point of engagement and can be
existent without other sentiments preceding it, but it can also be enhanced or decreased through
other sentiments, such as entertainment or clarity of instructions. Intrinsically motivating gamified
features, such as feedback, animations, social characters (avatars) and progress indications allow
for reinforcement and thus feelings of autonomy, relatedness and competence. They can even
deliver a meaningful purpose, if targeted towards the user’s needs by, for instance, encouraging
the user to explore his/her values to thrive in various situations of their lives in a playful manner.
Relatedness hereby surprisingly is not only created through some type of felt social
interaction or presence by implementing i.e. avatars or storytelling but also was mentioned to be
evoked through humour as the survey respondent feels connected to peers. How related young
people feel hereby depends on the type of humour i.e. degree of aggressiveness being used.
Despite some participants wishing for a high degree of aggressiveness, this study advises to focus
on self-enhancing humour, which prevents diminishment or offensiveness towards the survey
respondent to uphold a kind of reflective safe zone. These suggestions were also formed by
comparing this study’s results to a study on humour in relation to the sense of belonging as
conducted on students by Sukor et al., (2019) following the guidelines of even earlier studies
(Martin et al., 2003; 2004; Edwards, 2014). Gamified (interactive) elements appeared to be most
effective when being introduced in combination with atmospheric or informative elements to
cover several needs at the same time, making a task, for instance, easier to master by animating
information provision and augmenting the effect with colours.
Theoretical implications
This study delivers a holistic view on the UX of questionnaires with results that show extensive
similarities with formerly developed theories, specifically the UXTAM, the User Engagement
Model, Self-Determination Theory and gamification constituents. Sharing qualities and showing
overlap in prerequisites (i.e. functionality aspects, feedback and entertainment), did these former
theories form a good base for the model created in this study (see Figure 3). The shortcomings of
going beyond functionality aspects when designing for an improved UX and UE of questionnaires
could be accomplished by this study through especially the focus on need-based facets. The User
Engagement-User Experience- Technology Acceptance Model integrates those into the three
formerly suggested UXTAM components, which lead to the secondary sentiment of intrinsic
motivation.

48
Also missing insights into varying effects of design elements on the User Experience of
technologies, were approached by this study leading to the proposal that four engagement phases
are crucial and can be aligned with perceptions and feelings over time. Whereas a collection of in
this study named primary sentiments is most important in the first stage of engagement, others
evoke the urge to continue upon and finalize survey participation. Regarding the PVQ re-
engagement with the survey plays an important rule, which cannot be said for every survey.
However, especially looking at academic surveys, it can be argued that survey respondents
evaluating their overall experience with an academic questionnaire as positive, might enhance
chances of that individual repeatedly and voluntarily re-engaging with academic surveys in
general. Voluntariness is another element, which was suggested by Mlekus et al., (2020) to be
investigated and was to a certain extent confirmed to be essential in designing for a good survey
UX through autonomy (control) and purpose (goal setting) perceptions. The latter also confirms
the suggestion made by Pink as cited in Spawr (2011) to add the fourth dimension to self-
determination theory can be of use, specifically with respect to questionnaire design.
One finding resembling the conclusions of Hornbæk and Hertzum (2017), is the importance of
hedonic qualities when attempting to increase the UX of surveys compared to the traditional
technology adoption factors of PEoU and PU, slightly higher. Whereas all three should not be
ignored as they create the essential reasoning behind and good interaction with the questionnaire,
especially young people seem to highly value entertainment and visual appeal. Hedonic qualities
were hereby repeatedly mentioned to only be effective, if they do not hinder the other two main
determinants of PEoU and PU. This in return points at this study’s central concept of context
appropriateness, which needs to be guarded as questionnaires inherit a large spectrum of goals,
circumstances and target audiences. Each distinctive entity thus comes along with surrounding
and internal conditions that require careful consideration when judging upon the suitability of
specific design elements for a certain type of survey. Whereas for instance extrinsically
motivating gamified elements would not work for a reflective tool like the PVQ, they might
deliver desired outcomes for other questionnaires. Hereby it needs to be said that this study’s
results mostly confirm how extrinsically regulated motivation seldomly functions sustainable in
terms of re-engagement, nor allowing for a more meaningful interaction with the technology, as
Triantoro et al., (2019), Ryan and Deci (2000a) and Magni et al., (2010) already implied, but
could lead to a quicker reach of respondent saturation.

49
Practical implications
Besides these theoretical insights, could this study also provide valuable information for the
Xcavo project’s PVQ within the mobile application on a more practical level. The three design
categories of informative, atmospheric and interactive design elements as emerged based on the
ideas of study participants, can not only be of value in designing for a better survey UX and
engagement but also amplify the effect of one another. The interactive design elements for
instance are of greatest value if they also look appealing and deliver information, which the
survey respondent needs. They can hence separately evoke primary and secondary sentiments but
collectively will cause outcomes of higher quality. It also needs to be ensured that for instance the
attractiveness elements do not counterfeit or limit the functionality of the PVQ. Lastly, designing
according to the needs and characteristics auf the PVQ’s target audience is a key factor to the
app’s success, which can be enabled through defining and understanding the target group
extensively.
Other surveys aiming at young people can practically also benefit from the findings of this
study, as long as the awareness for potential differences in the nature and further context of the
survey compared to the PVQ will be sought to be identified prior to applying similar design
elements. Especially informative design elements as well as feedback and a progress indication
are however expected to contribute extensively to the UX of digital questionnaires also outside of
a young respondent audience. The type of feedback that is provided similar to i.e. colour schemes
should hereby be tailored towards the cultural, educational and age-related needs of the desired
questionnaire respondents.
Limitations
Respondents
A few respondents were dealing with physical limitations or mental disorders but to really design
within UX principles it would need to be explored even more what challenges people with those
conditions are facing and how you can facilitate their experience. Within Human-Computer-
Interaction and accordingly within UX striving for universalism in terms of who is included in the
user considerations of the design is a key factor (Vanderheiden, 1992; Abascal & Nicolle, 2001).
This is particularly important if the target audience of the Xcavo application and thus the PVQ
remains rather broad in definition. Moreover, data was collected among in total 35 young people,
which delivers a great overview about young people’s user experience requirements in the

50
broader sense. However, it does not quantitatively confirm any specific effects. Furthermore, the
feedback, which respondents could provide was limited based on the static nature of design mock-
ups. Whereas haptic experiences were emphasized during interviews to be of high importance, the
interactive elements as presented during focus groups were mostly based on the participants
imagination through providing a thought-experiment of actually interacting with the app interface.
Sampling
Despite showing clear advantages, the applied sampling strategies can also affect the quality of
this study’s outcome. Quota sampling is especially vulnerable towards sampling bias and does not
allow for calculating a sampling error (Berndt, 2020). Moreover, it was timewise not possible to
create a one-on-one quota for the actual population. Purposive sampling is generally prone to a
lack of representativeness and researcher bias (Berndt, 2020). However, since this strategy was
applied to experts, whose behaviour or responses aimed at providing ideas and guidance, the
negative influence is expected to be low.
Researcher bias
Conducting interviews and focus groups, the researcher will inevitably stir the participant in
certain directions or ask more questions about some topics as opposed to others, which can lead to
imbalance in conclusive judgements. Consequently, some respondents might to a large extent
have provided predominantly reactive responses to satisfy the needs of the researcher as they
might believe deviating opinions are not worthy enough or required. Already Orne (1962)
emphasized that interviewer characteristics on top of the interview context are influencing
responses of the interviewee. The threat to accuracy of data based on researcher-participant
interactions became predominantly apparent during focus groups when gathering feedback for
design mock-ups. It can be expected that some participants did not provide as extensive criticism
towards certain design elements, as they might have provided, if the role of the designer,
researcher and focus group moderator would have been separated from one another.
Suggestions for future research
To overcome the limitations this study is facing, four focal points should particularly become the
centre of attention. First of all, the survey’s target group of young people should be specified in
more detail. This enables to satisfy the user’s needs because those can differ especially across age

51
groups and with respect to physical or mental restrictions. Aside from this advice for especially
the PVQ in the app context, it is essential that future studies also quantitatively test whether the
design elements show the same effects in various survey contexts and the respectively targeted
respondents compared to the PVQ. Since the results indicated that context appropriateness is of
high relevance as design elements can show contrary effects based on differing circumstances, it
is likely that this study’s model can be applied for other questionnaires as long as the design
elements are adjusted to the survey’s characteristics and goals. Lastly, it is advised to let survey
respondents experience design elements interactively instead of via static mock-ups as. For
instance, haptics were proposed to be of high importance.

52
Conclusion
This study investigated to what extent the User Experience of a value exploration questionnaire
(PVQ) as integrated in an app, could be improved through Perceived Usefulness (PU), Perceived
Ease of Use (PEoU) and Hedonic Qualities (HQ) via specific design elements. On the one hand,
based on this study, the determination and interplay of relevant sentiments is expected to show the
largest theoretical impact on digital survey design advancements. This study’s User Experience-
User Engagement-Model (UXUETAM) delivers a targeted approach for questionnaires taking a
unique UX perspective. It is hereby more holistic than former theories, due to voluntariness being
integrated in PU, as well as need-based (motivational) and time-bound (engagement) dimensions
being included in the intersection of technology adoption and User Experience. On the other
hand, a variety of effective design elements could be identified on a rather practical level. Playful
design elements, which are intrinsically motivating gamified elements, were found to be
especially suitable for augmenting the UX of the PVQ for a young target audience. Since the
results of this study show potential to improve the UX and thereby engagement of respondents
with surveys in general, it needs to be investigated quantitatively, which degree of playfulness is
suitable in different survey contexts. These follow-up studies could significantly increase this
study’s impact especially in the academic world to increase engagement and thus genuine
responses while lowering drop-out rates.

53
References
Abascal, J., & Nicolle, C. (2001). Why inclusive design guidelines? In Nicolle, C., &
Abascal, J. (Eds.), Inclusive Design Guidelines for HCI (pp. 3–13). Taylor & Francis.
Adamowicz, W., Boxall, P., Williams, W., & Louviere, J.J. (1998). Stated preference
approaches for measuring Passive use values: choice experiments and contingent
valuation. American Journal of Agricultural Economics, 80(1), 64–75.
https://doi.org/110.2307/3180269
Ajzen, I. (1991). The theory of planned behavior. Organizational Behavior and Human Decision
Processes, 50, 179–211. https://doi.org/110.1016/0749-5978(91)90020-T
Arora, R. (1982). Validation of an S-O-R Model for Situation, Enduring, and Response Components of
Involvement. Journal of Marketing Research, 19(4), 505-516.
https://doi.org/110.2307/3151723
Babbie, E. (2007). The practice of social research (11th ed.). Wadsworth.
Bailey, P., Pritchard, G., & Kernohan, H. (2015). Gamification in market research: increasing
enjoyment, participant engagement and richness of data, but what of data validity?
International Journal of Market Research, 57(1), 17-28.
https://doi.org/110.2501/IJMR-2015-003
Bell J. (2014). Doing your research project: a guide for first-time researchers. Berkshire:
McGraw-Hill Education Ltd.
Bendassolli, P.F. (2013). Theory Building in Qualitative Research: Reconsidering the
Problem of Induction. Forum Qualitative Social Research, 14(1), 1-20.
https://doi.org/110.17169/FQS-14.1.1851
Bickmore, T. (2003). Relational agents: effecting change through human-computer
relationships (PhD thesis). Massachusetts Institute of Technology, Massachusetts.
Blomfield Neira, C.J., & Barber, B. (2014). Social networking site use: Linked to adolescents'
social self‐concept, self‐esteem, and depressed mood. Australian Journal of Psychology,
66, 56 - 64.https://doi.org/10.1111/ajpy.12034
Boyd, D., & Bee, H. (2012). Lifespan development (7th ed.). Pearson.
Boyd, D. (2007). Why youth (heart) social networking sites: The role of networked publics in
teenage social life. In D. Buckingham, Ed., MacArthur Foundation Series on Digital
Learning: Youth, Identity and Media Volume (pp. 119-142). Cambridge, MA: MIT Press.
Boynton, P. M., & Greenhalgh, T. (2004). Selecting, designing, and developing your
questionnaire. BMJ (Clinical research ed.), 328(7451), 1312–1315.
https://doi.org/110.1136/bmj.328.7451.1312
Buckley, J., DeWille, T., Exton, C., Exton, G., & Murray, L. (2018). A Gamification–
Motivation for Educational Software Developers. Journal of Educational Technology
Systems, 47(1), 101–127. https://doi.org/110.1177/0047239518783153

54
Calvo, R., Peters, D., Johnson, D., & Rogers, Y. (2014). Autonomy in Technology Design.
CHI'14 Extended Abstracts on Human Factors in Computing Systems, 37–40.
https://doi.org/10.1145/2559206.2560468
Caussade, S., Ortúzar, J.deD., Design Framework Rizzi, L., & Hensher, D.A. (2005).
Assessing the influence of design dimensions on stated choice experiment estimates.
Transportation Research Part B, Methodological, 39(1), 621–640.
https://doi.org/110.1016/j.trb.2004.07.006
Ceaparu, I., Lazar, J., Bessiere, K., Robinson, J., Ben Shneiderman, B. (2004) Determining
Causes and Severity of End-User Frustration, International Journal of Human–Computer
Interaction, 17:3, 333-356. https://doi.org/110.1207/s15327590ijhc1703_3
Cechanowicz, J., Gutwin, C., Brownell, B., & Goodfellow, L. (2013). Effects of gamification
on participation and data quality in a real-world market research domain. Proceedings
of the First International Conference on Gameful Design, Research, and Applications,
68-65. https://doi.org/110.1145/2583008.2583016
Cook, C., Heath, F., & Thompson, R. L. (2000). A meta-analysis of response rates in web- or
internet-based surveys. Educational and Psychological Measurement, 60, 821–836.
https://doi.org/110.1177/00131640021970934
Couper, M. (2000). Web surveys: a review of issues and approaches. Public opinion
quarterly, 64(4), 464–94. https://doi.org/10.1086/318641
Davis, F. (1989). Perceived Usefulness, Perceived Ease of Use, and User Acceptance of Information
Technology. MIS Quarterly, 13(3), 319-340. https://doi.org/1:10.2307/249008
Deters, F. G., & Mehl, M. R. (2013). Does posting facebook status updates increase or
decrease loneliness? An online social networking experiment. Social Psychological
and Personality Science, 4(5), 579–586. https://doi.org/110.1177/1948550612469233
De Freitas, S. I., Morgan, J., & Gibson, D. (2015). Will MOOCs Transform Learning and
Teaching in Higher Education? Engagement and Course Retention in Online Learning
Provision. British Journal of Educational Technology, 46, 455-471.
https://doi.org/110.1111/bjet.12268
De Jong, M. (2014). The Quest for a Usability Theory. Technical Communication, 61(3), 145-146.
http://www.ingentaconnect.com/contentone/stc/tc/2014/00000061/00000003/art00001
De Leyn, T., Waeterloos, C., De Wolf, R., Vanhaelewyn, B., Ponnet, K., De Marez, L.
(2021) Teenagers’ reflections on media literacy initiatives at school and everyday media
literacy discourses. Journal of Children and Media. 1-19.
https://doi.org/10.1080/17482798.2021.1952463
Edwards, K. R., & Martin, R. A. (2014). The conceptualization, measurement, and role of humor
as a character strength in positive psychology. Europe’s Journal of Psychology, 10, 505
519.

55
Fern, E. (1982). The Use of Focus Groups for Idea Generation: The Effects of Group Size,
Acquaintanceship, and Moderator on Response Quantity and Quality. Journal of Marketing
Research, 19(1), 1-13. https://doi.org/110.2307/3151525
Ferreira, J. M., Acuña, S. T., Dieste, O., Vegas, S., Santos, A., Rodríguez, F., & Juristo, N.
(2019). Impact of usability mechanisms: an experiment on efficiency, effectiveness
and user satisfaction. Information and Software Technology, 106195.
https://doi.org/110.1016/j.infsof.2019.106195
Granic, I., Morita, H., & Scholten, H. (2020). Beyond Screen Time: Identity Development in the
Digital Age. Psychological Inquiry, 31(3), 195 -223.
https://doi.org/10.1080/1047840x.2020.1820214
Guin, T. D. L., Baker, R., Mechling, J., & Ruyle, E. (2012). Myths and realities of respondent
engagement in online surveys. International Journal of Market Research, 54(5), 613-
633. https://doi.org/110.2501/IJMR-54-5-613-633
Giannakos, M., Jones, D., & Crompton, H. (2014). Designing Playful Games and Applications to
Support Science Centers Learning Activities. 16th International Conference on Human-
Computer Interaction, 8514, 561-570. https://doi.org/110.1007/978-3-319-07440-5_51
Hassenzahl, M. (2003). The thing and I: Understanding the relationship between user and
product. In M. A. Blythe, K. Overbeeke, A. F. Monk & P. C. Wright
(Eds.), Funology: From usability to enjoyment (pp. 31–42). Springer Netherlands.
Helyer, R. (2015). Learning through reflection: the critical role of reflection in work-based
learning (WBL). Journal of Work-Applied Management, 7(1), 15–27.
https://doi.org/110.1108/jwam-10-2015-003
Hornbæk, K., & Hertzum, M. (2017). Technology acceptance and user experience: A review
of the experiential component in HCI. ACM Transactions on Computer-Human
Interaction, 24(5), 33. https://doi.org/110.1145/3127358
Hoehle, H., & Venkatesh, V. (2015). Mobile application usability: Conceptualization and
instrument development. MIS Quarterly, 39(2), 435-472.
https://doi.org/10.25300/MISQ/2015/39.2.08
Hoerger, M. (2010). Participant Dropout as a Function of Survey Length in Internet-
Mediated University Studies: Implications for Study Design and Voluntary
Participation in Psychological Research. Cyberpsychology, Behavior, and Social
Networking, 13(6), 697–700. https://doi.org/110.1089/cyber.2009.0445
Holmes, T., & Boyle, K.J. (2005). Dynamic learning and context-dependence in sequential,
attribute-based stated-preference valuation questions. Land Economy, 81, 114–126.
https://doi.org/110.3368/le.81.1.114
Ito, M., Baumer, S., Bittani, M., Boyd, D., Cody, R., Stephenson, B.H., …Tripp, L. (2010).
Hanging Out, Messing Around, and Geeking Out: Kids Living and Learning with New
Media. MIT Press.
Jacobsen, J. K. (1993). Intervju, konsten at lyssna och fråga. (1 ed.) Lund: Studentlitteratur.

56
Johnson, J., (2021, January 27) Distribution of internet users worldwide as of 2019, by age
group. Retrieved from: https://www.statista.com/statistics/272365/age-distribution-
of-internet-users-worldwide/
Khalid, H. M. (2006). Embracing diversity in user needs for affective design. Applied
Ergonomics, 37(4), 409–418. https://doi.org/110.1016/J.APERGO.2006.04.005
Kujala, S., Roto, V., Väänänen-Vainio-Mattila, K., Karapanos, E., & Sinnelä, A. (2011). UX
Curve: A method for evaluating long-term user experience. Interacting with
Computers, 23(5), 473–483. https://doi.org/110.1016/j.intcom.2011.06.005
Kvale, S. & Brinkmann, S. (2009). InterViews: Learning the Craft of Qualitative Research
Interviewing. Sage Publications, Inc.
Lenhart, A., Smith, A., Anderson, M., Duggan, M., & Perrin, A. (2015). Teens, Technology &
Friendship (Vol. 10). Pew Research Center.
Leptokaridou, E., Vlachopoulos, S., & Papaioannou, A. (2015). Associations of autonomy,
competence, and relatedness with enjoyment and effort in elementary school physical
education: The mediating role of self-determined motivation. Educational Psychology,
36(7), 1-22. https://doi.org/10.1080/01443410.2014.950195
Lilley, C., Ball, R., & Vernon, H. (2014). The experiences of 11–16-year-olds on social
networking sites [Online report]. London: NSPCC.Computers, 23(5), 473–483.
https://doi.org/110.1016/j.intcom.2011.06.005
Lim, C., Song, H., & Lee, Y. (2012). Improving the usability of the user interface for a digital
textbook platform for elementary-school students. Educational Technology Research
and Development, 60(1), 159-173. https://doi.org/10.1007/S11423-011-9222-5
Magni, M., Susan Taylor, M., & Venkatesh, V. (2010). “To play or not to play”: A cross-
temporal investigation using hedonic and instrumental perspectives to explain user
intentions to explore a technology. International Journal of Human-Computer Studies,
68(9), 572-588. https://doi.org/110.1016/j.ijhcs.2010.03.004
Martin, R. A., Puhlik-Doris, P., Larsen, G., Gray, J., & Weir, K. (2003). Individual differences in
uses of humor and their relation to psychological well-being: Development of the Humor
Styles Questionnaire. Journal of Research in Personality, 37(1), 48-75.
https://doi.org/10.1016/S0092-6566(02)00534-2
Martin, R. A. (2004). Sense of humor and physical health: Theoretical issues, recent findings, and
future directions. Humor: International Journal of Humor Research, 17, 1-19.
https://doi.org/10.1515/humr.2004.005
Mlekus, L., Bentler, D., Paruzel, A., Kato-Beiderwieden, A.-L., & Maier, G. W. (2020). How
to raise technology acceptance: user experience characteristics as technology-inherent
determinants. Gruppe. Interaktion. Organisation. Zeitschrift Für Angewandte
Organisationspsychologie (GIO), 51(3), 273-283.
https://doi.org/110.1007/s11612-02000529-7

57
McQuarrie, E. F., & McIntyre, S. H. (1986). Focus Groups and the Development of New
Products by Technologically Driven Companies: Some Guidelines. Journal of Product
Innovation Management, 3(1), 40–47. https://doi.org/110.1111/1540-5885.310040
McHugh, M. L. (2012). Interrater reliability: the kappa statistic. Biochemia medica, 22(3),
276–282. https://doi.org/110.11613/BM.2012.031
O'Brien, H., & Toms, E. (2008). What is user engagement? A conceptual framework for defining
user engagement with technology. Journal of the American Society for Information
Science and Technology, 59(6), 938-955. https://doi.org/110.1002/asi.20801
O'Keeffe, G.S., & Clarke-Pearson, K. (2011). The Impact of Social Media on Children,
Adolescents, and Families. Pediatrics, 127, 800 – 804.
https://doi.org/110.1542/peds.2011-0054
Orne, M.T. (1962). On the social psychology of the psychological experiment: with particular
reference to demand characteristics and their implications. American Psychologist, 17(11),
776-783. https://doi.org/10.1037/h0043424
Peacock, S. E. (2014). How web tracking changes user agency in the age of Big Data: The
used user. Big Data & Society, 1(2), 1-11. https://doi.org/110.1177/2053951714564228
Peels, R. (2016). The empirical case against introspection. Philosophical Studies: An International
Journal for Philosophy in the Analytic Tradition, 173(9), 2461-2485.
https://doi.org/110.1007/s11098-016-0623-5
Peters, D., Calvo, R. A., & Ryan, R. M. (2018). Designing for Motivation, Engagement and
Wellbeing in Digital Experience. Frontiers in Psychology, 9, 797.
https://doi.org/110.3389/fpsyg.2018.00797
Philip, L. (2006). Encouraging reflective practice amongst students: a direct assessment
approach. Planet, 17(1), 37-39. https://doi.org/110.11120/plan.2006.00170037
Punchoojit, L., & Hongwarittorrn, N. (2017). Usability Studies on Mobile User Interface
Design Patterns: A Systematic Literature Review. Advances in Human-Computer
Interaction, 2017(16), 1–22. https://doi.org/110.1155/2017/6787504
Reker, G. T. (2005). Meaning in life of young, middle-aged, and older adults: Factorial validity,
age, and gender invariance of the Personal Meaning Index (PMI). Personality and
Individual Differences, 38(1), 71–85. https://doi.org/110.1016/j.paid.2004.03.010
Rogers, Y., Preece, J., & Sharp, H. (2007). Interaction Design: Beyond Human-Computer
Interaction. John Wiley & Sons.
Rosen, L. D. (2011). Social networking’s good and bad impacts on kids. American Psychological
Association.
Ryan, R. M., and Deci, E. L. (2000a). Intrinsic and extrinsic motivations: classic definitions and
new directions. Contemp. Educ. Psychol. 25, 54–67.
https://doi.org/110.1006/ceps.1999.1020

58
Ryan, R. M., & Deci, E. L. (2000b). Self-determination theory and the facilitation of intrinsic
motivation, social development, and well-being. American Psychologist, 55(1), 68–
78. https://doi.org/110.1037/0003-066X.55.1.68
Saldana, J. (2009). The coding manual for qualitative researchers (1st ed.). Thousand Oaks,
CA: Sage Publications, Inc.
Saldana, J. (2015). The coding manual for qualitative researchers (3rd ed.). Thousand Oaks,
CA: Sage Publications, Inc.
Santoso, H., B., Schrepp, M., Isal, Y., K., & Utomo, A., J. (2016). Measuring User
Experience of the Student-Centered e-Learning Environment. Journal of Educators
Online, 13(1), 1-79. https://doi.org/110.9743/JEO.2016.1.5
Savage, S., & Waldman, D. (2008). Learning and fatigue during choice experiments: a
comparison of online and mail survey modes. Journal of Applied Econometrics 23(3),
351-371. https://doi.org/10.1002/jae.984
Schoultz, J., Säljö R., & Wyndhamn J. (2001). Heavenly talk: Discourse, artifacts, and
children’s understanding of elementary astronomy. Human Development, 44(2), 103–
118. https://doi.org/110.1159/000057050
Schrepp, M., Hinderks, A., & Thomaschewski, J. (2014). Applying the User Experience
Questionnaire (UEQ) in Different Evaluation Scenarios. Lecture Notes in Computer
Science, 8517, 383–392. https://doi.org/110.1007/978-3-319-07668-3_37
Schwartz, S.H., Cieciuch, J., Vecchione, M., Davidov, E., Fischer, R., Beierlein, C., Ramos, A.,
Verkasalo, M., Lönnqvist, J.-E., Demirutku, K., Dirilen-Gumus, O., & Konty, M. (2012).
Refining the theory of basic individual values. Journal of Personality and Social
Psychology, 103(4), 663-688. https://doi.org/110.1037/a0029393
Sicart, M. (2014). Play matters. Cambridge, MIT Press.
Sicart, M. (2016). Play and the City. In J. Ackermann, A. Rauscher, & D. Stein (Eds.), Playin' the
City: Artistic and Scientific Approaches to Playful Urban Arts, UniPrint.
Silvia, P. J., & Gendolla, G. H. E. (2001). On introspection and self-perception: Does self-
focused attention enable accurate self-knowledge? Review of General Psychology,
5(3), 241–269. https://doi.org/110.1037/1089-2680.5.3.241
Sim, J., & Wright, C. (2005). The kappa statistic in reliability studies: use, interpretation, and
sample size requirements. Physical therapy, 85(3), 257-268.
https://doi.org/10.1093/PTJ/85.3.257
Sleep, D., & Puleston, J. (2008). The survey killer. Quirks, (November), 54–58. Retrieved (June
2021) from: https://www.quirks.com/articles/does-interactivity-hold-the-key-to-
respondent-engagement
Spawr, A. L. (2011). Drive: the surprising truth about what motivates us, Pink, D.H. (2009).
New York, NY (pp. 1-242). Journal of Community & Applied Social Psychology, 22(1),
92-94. https://doi.org/110.1002/casp.1085

59
Strauss, A., & Corbin, J. (1998). Basics of qualitative research: Techniques and procedures
for developing grounded theory. Sage Publications, Inc.
Sukor, M. S., Panatik, S. A., & Noordin, N. F. (2019). The Influence of Humor Styles on The
Sense of Belonging among University Students. Sains Humanika, 12(1).
https://doi.org/10.11113/sh.v12n1.1620
Sutcliffe, A. (2016). Designing for User Experience and Engagement. Why Engagement Matters,
105–126. https://doi.org/110.1007/978-3-319-27446-1_5
Survey Sampling International. (2010). Questionnaire length, fatigue effects and response
quality revisited [White Paper]. Retrieved (May 2021) from:
http://www.researchvoice.com/en/KnowledgeLink/learn-more.aspx
Thomas, D. (2006). A general inductive approach for analysing qualitative evaluation data.
American Journal of Evaluation, 27(2), 237–246.
https://doi.org/110.1177/1098214005283748
Toepoel, V., Das, M., & Van Soest, A. (2009). Design of Web Questionnaires: The Effects of
the Number of Items per Screen. Field Methods, 21, 200–213.
https://doi.org/110.1177/1525822X08330261
Triantoro, T., Gopal, R., Benbunan-Fich, R., & Lang, G. (2019). Would you like to play? A
comparison of a gamified survey with a traditional online survey method. International
Journal of Information Management, 49, 242-252.
https://doi.org/110.1016/j.ijinfomgt.2019.06.001
Trist, E. L., & Bamforth, K. W. (1951). Some social and psychological consequences of the
longwall method of coal-getting. Human Relations, 4, 3–38.
https://doi.org/110.1177/001872675100400101
Vanderheiden, (1995) Application Software Design Guidelines: Increasing the Accessibility
of Application Software for People with Disabilities and Older Users, Trace Research
and Development Center, Madison, Wis, USA.
https://doi.org/110.1177/1525822X08330261
Venkatesh, V., & Davis, F. D. (2000). A Theoretical Extension of the Technology
Acceptance Model: Four Longitudinal Field Studies. Management Science, 46(2),
186–204. https://doi.org/110.1287/mnsc.46.2.186.11926
Venkatesh, V., & Bala, H. (2008). Technology acceptance model 3 and a research agenda on
interventions. Decision Sciences, 39, 273–315.
https://doi.org/110.1111/j.1540-5915.2008.00192.x
Welbers, K., Konijn, E. A., Burgers, C., de Vaate, A. B., Eden, A., & Brugman, B. C.
(2019). Gamification as a tool for engaging student learning: A field experiment with
a gamified app. E-Learning and Digital Media, 16(2), 92-109.
https://doi.org/10.1177/2042753018818342

60
Wood, D., Crapnell, T., Lau, L., Bennett, A., Lotstein, D., Ferris, M., & Kuo, A. (2017).
Emerging Adulthood as a Critical Stage in the Life Course. Handbook of Life Course
Health Development, 123–143. https://doi.org/10.1007/978-3-319-47143-3_7

61
Appendix
A. PVQ items, dimensions and scoring key
Self-Direction: Freedom of thought and action
Autonomy of Thought: Freedom to cultivate one’s own ideas
1 It is important to him/her to form his/her views independently.
23 It is important to him/her to develop his/her own opinions.
39 It is important to him/her to figure things out him/herself.
Autonomy of Action: Freedom to determine one’s own actions
16 It is important to him/her to make his/her own decisions about his/her life.
30 It is important to him/her to plan his/her activities independently.
56 It is important to him/her to be free to choose by him/herself what he does
Stimulation: Excitement, novelty, and change
10 It is important to him/her always to look for different things to do.
28 It is important to him/her to take risks that make life exciting.
43 It is important to him/her to have all sorts of new experiences.
Hedonism: Pleasure or sensuous gratification
3 It is important to him/her to have a good time.
36 It is important to him/her to enjoy life’s pleasures.
46 It is important to him/her to take advantage of every opportunity to have fun
Achievement: Success according to social standards
17 It is important to him/her to have ambitions in life.
32 It is important to him/her to be very successful.
48 It is important to him/her that people recognize what he achieves.
Power: Control over resources and people Dominance over people
6 It is important to him/her that people do whatever he says they should.
29 It is important to him/her to have the power to make people do what he wants. 41 It is
important to him/her to be the one who tells others what to do.
Resources: Wealth and material resources
12 It is important to him/her to have the power that money can bring.
20 It is important to him/her to be wealthy.
44 It is important to him/her to own expensive things that show his/her wealth.
Face: Maintaining public image

62
9 It is important to him/her that no one should ever shame him/her.
24 It is important to him/her to protect his/her public image.
49 It is important to him/her never to be humiliated.
Security: Safety, stability and order Societal: Security in the wider society
2 It is important to him/her that his/her country is secure and stable.
35 It is important to him/her that the state is strong and can defend its citizens.
50 It is important to him/her that his/her country protect itself against all threats.
Personal: Security of self and one’s immediate environment
13 It is very important to him/her to avoid disease and protect his/her health.
26 It is important to him/her to be personally safe and secure.
53 It is important to him/her to avoid anything dangerous.
Tradition: Maintaining and preserving cultural, family and/or religious traditions
18 It is important to him/her to maintain traditional values and ways of thinking.
33 It is important to him/her to follow his/her family’s customs or the customs of a religion.
40 It is important to him/her to honour the traditional practices of his/her culture.
Conformity: Avoidance of violating informal or formal social expectations Rules:
Compliance with rules, laws and formal obligations
15 It is important to him/her never to violate rules or regulations.
31 It is important to him/her to follow rules even when no-one is watching.
42 It is important to him/her to obey all the laws.
Interpersonal: Avoidance of upsetting or harming others
4 It is important to him/her to avoid upsetting other people.
22 It is important to him/her never to annoy anyone.
51 It is important to him/her never to make other people angry.
Humility: Recognizing one’s insignificance in the larger scheme of things
7 It is important to him/her never to think he deserves more than other people.
38 It is important to him/her to be humble.
54 It is important to him/her to be satisfied with what he has and not ask for more.
Benevolence: Promoting the welfare of one’s ingroups
Dependability: Trustworthy and reliable
19 It is important to him/her that people he knows have full confidence in him/her.
27 It is important to him/her to be a dependable and trustworthy friend.

63
55 It is important to him/her that all his/her friends and family can rely on him/her completely.
Caring: Devotion to the needs of the in-group
11 It is important to him/her to take care of people he is close to.
25 It is very important to him/her to help the people dear to him/her.
47 It is important to him/her to concern him/herself with every need of his/her dear ones.
Universalism: understanding, appreciation, tolerance, and protection for the welfare of all
people and for nature
Concern: Equality, justice and protection for the weak in society
5 It is important to him/her that the weak and vulnerable in society be protected.
37 It is important to him/her that every person in the world have equal opportunities in life.
52 It is important to him/her that everyone be treated justly, even people he doesn’t know.
Nature: Preservation of the natural environment
8 It is important to him/her to care for nature.
21 It is important to him/her to take part in activities to defend nature.
45 It is important to him/her to protect the natural environment from destruction or pollution.
Tolerance: Acceptance and understanding of those who differ from oneself
14 It is important to him/her to be tolerant toward all kinds of people and groups.
34 It is important to him/her to listen to and understand people who are different from him/her.
57 It is important to him/her to accept people even when he disagrees with them.
Scoring Key for 19 Values in the PVQ-RR Value Scale
Self-direction Thought 1,23,39 Tradition 18,33,40
Self-direction Action 16,30,56 Conformity-Rules 15,31,42
Stimulation 10,28,43 Conformity-Interpersonal 4,22,51
Hedonism 3,36,46 Humility 7,38,54
Achievement 17,32,48 Universalism-Nature 8,21,45
Power Dominance 6,29,41 Universalism-Concern 5,37,52
Power Resources 12,20,44 Universalism-Tolerance 14,34,57
Face 9,24,49 Benevolence –Care 11,25,47
Security Personal 13,26,53 Benevolence-Dependability 19,27,55
Security Societal 2,35,50

64
Scoring Key for Higher Order Values in the PVQ-RR Value Scale
Self-Transcendence Combine means for universalism-nature, universalism-concern,
universalism-tolerance, benevolence-care, and benevolence- dependability
Self-Enhancement Combine means for achievement, power dominance and power resources
Openness to change Combine means for self-direction thought, self-direction action, stimulation
and hedonism
Conservation Combine means for security-personal, security-societal, tradition, conformity-rules,
conformity-interpersonal
Side info (as provided by the Xcavo project):
Humility and Face may also be included in conservation, if no structural analysis is done to check
their location in your own sample. Alternatively, they could be treated as separate values.

65
B. Models
Figure 4
User Experience extension of the Technology Acceptance Model by Mlekus et al. (2020)
Figure 5
Self determination continuum and extrinsic to intrinsic motivation by Ryan and Deci (2000b)

66
C. Interviews and Focus groups
a. Expert interview questions (semi structured)
Short explanation of the expert interviews
Each expert will have a differently structured interview based on his or her specific expertise and
based on the data that has been collected in former interviews. This grounded theory approach
helps the researcher to fill knowledge gaps and compare responses to one another. The themes
below each have sub-questions, which help the researcher to understand the theories and
experiences experts encountered in the field of (UX) design. They will be asked for suggestions
and ideas with respect to (novel) design of questionnaires. Not every question will be asked to
each expert and additional questions, which emerge based on their responses will be asked outside
of the list below. No expert has to respond to specific questions, if they do not feel comfortable to
and will be informed about that.
Before these interview questions are asked, each expert will receive a briefing about the value
exploration questionnaire of the Xcavo project and the procedure of the interview. They will
receive a survey, which asks for their consent, similar to the one that is provided for focus group
participants but adjusted to the expert interview situation. After the interview the researcher again
informs each expert about their rights of withdrawing information, asking questions during further
phases of the study and receiving a summary of the findings. The recording of interview sessions
will only be saved for transcribing purposes and deleted as soon as the transcripts are finalized.
The experts will be informed about the extent to which their data is being used and which
measures are being taken in order to protect their privacy. Any data, which makes it possible to
identify the experts will be anonymized.
Pre-test interviews will take a maximum of 20 minutes, whereas interviews in later stages are
expected to take around 30-45 minutes, including the introduction and debriefing phase of each
session.
Design experiences
1. In your own words, to what extent does your job and expertise relate to design? Follow up:
What is your specified area of interest within the design field (What aspects of design are
you focusing on)?
2. To what extent are you involved with UX Design? Follow up: Which UX design elements
do you come across the most within your profession? Follow up: Which UX design
elements do you consider the most interesting within your job?
Experiences with surveys
1. According to your experiences, are there differences between academic surveys and non-
academic surveys in terms of design? Which ones? Follow up: Do you see advantages or
disadvantages for either approach?

67
2. What type of design choices are generally making questionnaires engaging for young
people (18-25)?
3. Based on your expertise, to what extent do you (not) consider questionnaires to be
generally designed in a user-friendly manner?
4. Based on your expertise, to what extent do you (not) consider questionnaires to be
generally designed in a manner that delivers a good user experience?
5. To what extent are in your experience questionnaires generally designed taking UX
principles into account?
6. Which design elements should in your opinion be taken into account more in terms of
UX?
7. Do any of the responses you gave with respect to your experiences with surveys differ
significantly amongst different demographic backgrounds of young people (age,
nationality, gender, academic/professional background)?
General design ideas
1. What design ideas for surveys should be explored more to increase engagement and/or the
User Experience of surveys?
2. Taking differences among members of the age-group (18-25) into account, what would be
a design idea, which in your opinion is appealing and engaging to a vast majority of young
people despite the variety of backgrounds?
3. How would you envision engaging survey designs to look like in the future?
4. Do any of your responses on questions about general design ideas differ if you specifically
look at it from a UX angle again?
5. What would be fun elements that you could envision make a questionnaire design more
engaging?
Specified design ideas
1. To what extent are you familiar with gamified elements of survey designs? Follow up: Do
you see potential in those aspects, why or why not?
2. To what extent would you differentiate between the term play and the term game in your
field of expertise? Follow up: Do you see more potential in either one with respect to
questionnaire design choices?
3. In what manner could you envision humour being used in questionnaire designs? Follow
up: Do you see advantages or pitfalls?
4. What would be elements of attractiveness that you would expect to increase the
engagement of young people (f.e. layout-design, colours, fonts, icons etc.)? Follow-up:
Are there elements that would have a counterproductive or only a minor effect?

68
b. Informed consent and briefing content example
Purpose of the study
You are being asked to take part in a study. Before you decide to participate in this study, it is
important that you understand why the study is being conducted and what it will involve. Please
read the following information carefully. Please ask the researcher if there is anything that is not
clear or if you need more information.
The purpose of this study is to find an engaging (fun) design for a questionnaire, which helps
young people discover their values.
Study procedures
Phases of the session
We will start the session with an explanation of the researcher and afterwards have a short
introduction round (15 minutes in total). You do not have to tell anything about yourself that you
do not feel comfortable with. In a next step, we will shortly discuss in which moments of your
lives (if at all) you came across questionnaires of any kind and what you did or did not like about
them (5 minutes in total). The last part of the focus group will also be the longest (30-45 minutes
in total). You will first get some instructions on the questionnaire as provided to you and get a
chance to ask questions. Then we will all separately but at the same time fill out that
questionnaire. If you prefer not filling it out, you can have a look at it and let us know about your
general opinion on it. You do not have to share the results of the questionnaire with anybody,
except when you want to. It would however be very nice, if you could tell us about the
experience, which you had while filling it out. Towards the end of this part, the researcher will
present 3 design options to you, which have been changed in terms of attractiveness, fun aspects
and playful elements. The researcher will ask about your thoughts on these three options through
means of turn-taking. The researcher will give a short debriefing about the project in which we
are developing an app, which you have now contributed towards. You will be informed in how far
the researcher is involved in the app development project. And finally, you will get to know about
the extent to which your data is being used. You will learn that you can withdraw your data at any
point and that you will have the chance to ask questions and be sent a summary of our research.
Recording
The session will be recorded with means of video and/or audio. The sole purpose of this is for the
researcher to have an opportunity of speaking freely during the session and not having to take
notes. The recording will be saved securely on a separate hard-drive and deleted as soon as the
transcription is finalized.
Risk handling
You may decline to answer any or all questions and you may terminate your involvement at any
time. In the latter case, you can send the researcher a private message about wanting to leave the
session. You do not have to provide a reason for that. No risks are expected but your personal

69
well-being is very important to the researcher, so do not hesitate to make your own boundaries
clear.
Benefits
The researcher hopes that the information obtained from this study may give you some personal
insights into your overall values. You will hear about nice design ideas as proposed by me and
other participants of the study and have an interactive and fun time in this session. You will also
significantly contribute to the development of an application, which the researcher will elaborate
on at the end of this session. Thank you very much for your input.
Confidentiality
Your responses during this session will be anonymous and information that could be traced back
to you, will be deleted. Every effort will be made by the researcher to preserve your
confidentiality including the following:
1) Assigning code names/numbers for participants that will be used on all research notes and
documents
2) Keeping notes, interview transcriptions, and any other identifying participant information
in a locked file cabinet in the personal possession of the researcher.
3) The recordings will be transcribed as soon as possible and deleted right after.
Contact information
If you have questions at any time about this study, or you experience adverse effects as the result
of participating in this study, you may contact the researcher whose contact information is
provided on the first page. If you have questions regarding your rights as a research participant, or
if problems arise which you do not feel you can discuss with the Primary Investigator, please
contact the Ethical Committee of BMS: [email protected].
Voluntary participation
Your participation in this study is voluntary. It is up to you to decide whether or not to take part in
this study. If you decide to take part in this study, you will be asked to sign a consent form. After
you sign the consent form, you are still free to withdraw at any time and without giving a reason.
If you withdraw from the study before data collection is completed, your data will be destroyed.
Consent
Survey
➔ Provision of the following link:

70
https://utwentebs.eu.qualtrics.com/jfe/form/SV_3gccYJnnaLTn6gS
I am now sending you a survey link, in which it is summarized, what I just explained to you. You
can take your time to read it again and ask questions. You would agree to the following, if you
tick the box:
‘I have read, and I understand the provided information and have had the opportunity to ask
questions. I understand that my participation is voluntary and that I am free to withdraw at any
time, without giving a reason and without cost. I understand that I will be given a copy of this
consent form. I voluntarily agree to take part in this study.’
➔ If you consent to this, please tick the box in the survey
c. Focus Group summarized outline d.
Briefing (before the session)
- Short introduction of myself and welcoming everybody
- Explaining the main points as mentioned on the consent form (procedure, recording, data
handling, the participants rights)
- Short explanation about general turn-taking rules and when/how to speak, f.e. (un-
)muting, comment section in the chat, curtesy to another
- Introduction of playful element, making it fun to introduce each other
Guidance (during session)
- Facilitate turn-taking
- Encourage people to share their opinion and interact with one another
- Create a welcoming, open-minded and fun experience as far as that is possible to influence
- Remind people of their rights, if needed and clarify questions of any kind
Content of the session
- Let the participants experience the PVQ while providing a thought experiment of it being
part of an app
- Let the participants report upon their experience and suggestions regarding specific design
suggestions
Debriefing
- Short explanation of the questionnaire’s context
- Short explanation of Xcavo project (no confidential information)
- Elaborating on the further process of my research
- Offering possibility to receive a summary of as well the session, as the research results
- Clarify data-related rights again briefly

71
D. Intercoder instructions and codebook
Thank you very much for helping me establish the intercoder reliability of the codebook. Please,
try to assign the following codes to the transcripts you received. The coding scheme is divided
into separate categories and each category contains several sub-codes. Only assign the sub-codes
to a segment. In some cases, assigning two to three codes can be sufficient. Accordingly, you
would assign one that describes a specific design element and one or two codes, that explain the
segment’s sentiment the best. A segment can be one sentence, several sentences or one paragraph
(depending on whether the participant starts talking about a different design element or his or her
changes in sentiment). The questions of the interviewer do not need to be coded, except of when a
response such as ‘yes I agree’ would otherwise not provide sensible information. Demographics
should be assigned when mentioned separately. The type of questionnaire should be assigned
once the participant talks about a specific type of survey, except of during the focus group
transcripts, there you always need to code everything as ‘value exploration questionnaire’.
Main-Code Subcode Explanation
Survey type 1 sentence to 1 paragraph
0.1 The value exploration
questionnaire
The participant is talking about the
specific questionnaire of this study.
Personality test
The participant is talking about a
personality test (e.g. in school, on
Facebook, Hogwarts-house test)
Other questionnaires
The participant is talking about any
other questionnaire or test (evaluations,
product reviews, apps like Cahoot,
academic surveys).
Demographics Sentences
1.1 Age
A participant gives input regarding
his/her or somebody else’s age.
1.2 Gender
A participant gives input regarding
his/her or somebody else’s gender.
1.3 Nationality
A participant gives input regarding
his/her or somebody else’s nationality
or culture.
Occupation
A participant gives input regarding
his/her or somebody else’s occupation.

72
1.5 Other
A participant gives input regarding
his/her or somebody else’s background,
which is not mentioned above.
Sentiment 1-4 sentences
2.1 Visual appeal
2.1.1 Pleasant
2.1.2. Unpleasant
An aspect of a questionnaire looks
visually appealing/good/attractive.
An aspect of a questionnaire does not
look visually appealing/good/attractive.
2.2 Motivation
2.2.1 Motivating
2.2.2 Discouraging
An aspect of a questionnaire has a
motivating effect on the user.
An aspect of a questionnaire does not
have a motivating effect on the user or
is frustrating/discouraging.
2.3 Entertainment
2.3.1 Fun
2.3.2 Lack of enjoyment
The user is enjoying him-/herself while
being involved in the questionnaire.
The user is not having fun while being
involved in the questionnaire.
Clarity
Clear
Ambiguous
An aspect of a questionnaire is
clear/comprehensible or does not
induce bias.
An aspect of the questionnaire is
vague/not clear/confusing or leads to a
bias in participant responses.
Attention

73
2.5.1 Exiting
2.5.2 Boring
An aspect of the questionnaire or the
questionnaire itself is
exiting/arousing/draws or keeps up the
attention.
An aspect of the questionnaire or the
questionnaire itself is boring/makes it
difficult to keep the user’s attention up.
2.6 Curiosity
2.6.1 Interest
2.6.2 Lack of interest
An aspect of the questionnaire or the
questionnaire itself is perceived
interesting by the user or triggers
his/her curiosity.
An aspect of the questionnaire does not
trigger the interest/curiosity in the user.
2.7 Accessibility
2.7.1 Inclusive
2.7.2 Inaccessible
An aspect of a questionnaire makes it
easier to understand, more inclusive for
specific groups, or possible to use
under certain circumstances, e.g.
people with disabilities.
An aspect of a questionnaire excludes
certain groups of people or people
living under certain circumstances/with
certain conditions or makes it difficult
for them to finalize the survey
comparably equal to others.
2.8 Security
2.8.1 Perceived safety
2.8.2 Perceived
vulnerability
An aspect of a questionnaire gives the
user a feeling of being in a calm/safe
space, being able to be honest or his/her
data is protected.
An aspect of a questionnaire gives the
user a feeling of being exposed, unsafe
or his/her data being used in a way he
or she did not consent to.

74
2.9 Feasibility
2.9.1 Achievable
2.9.2 Complex
An aspect of the questionnaire or the
questionnaire itself seem possible to
finalize easily and/or without asking
another person for help and/or aspects
of the questionnaire do not distract a lot
from further progress within the survey.
An aspect of the questionnaire or the
questionnaire itself make it difficult for
users to finalize the task and/or aspects
of the questionnaire distract the user
from further progressing within the
questionnaire.
2.10. Appropriateness
2.10.1 Suitable for its
purpose
2.10.2 Inappropriate
An aspect of the questionnaire is
considered to be in line
with/appropriate for the purpose and
target audience of a questionnaire (also
assign for general expressions of
approval/liking that cannot be assigned
to other codes).
An aspect of the questionnaire is
considered to be in line with or suitable
for the purpose and target audience of a
questionnaire (also assign for general
expressions of disapproval/disliking
that cannot be assigned to other codes).
2.11 Originality
2.11.1 Uniqueness
2.11.2 Stereotypical
An aspect of the questionnaire makes it
come across as special/ outstanding/
original.
An aspect of the questionnaire makes it
come across as cliché/obsolete/overly
used/not unique.
2.12. Usefulness
2.12.1 Goal setting

75
2.11.2 Lack of meaning
An aspect of the questionnaire or the
questionnaire itself is considered useful
or meaningful by the participant or a
goal/purpose recognized.
An aspect of the questionnaire or the
questionnaire itself is considered
meaningless, useless or no clear
goal/purpose is recognized by the
participant.
2.13. Control
2.13.1 Agency
2.13.2 Lack of control
An aspect of a questionnaire or the
questionnaire itself gives the user a
feeling of having a certain degree of
control over his/her own actions or
he/she is aware of the impact his/her
decisions have within the
questionnaire.
An aspect of the questionnaire or the
questionnaire itself make the user feel
powerless, non-agent or aware of the
impact his or her own decisions have
within the questionnaire.
Specific (UX)
design elements
1-4 sentences
3.1 Atmosphere
3.1.1 Humour
3.1.2 Tone of voice
3.1.3 Wording
An element of a questionnaire is funny
or contains a joke.
An element of a questionnaire has a
specific tone of voice/uses a specific
type of language.
An element of the questionnaire uses a
specific word, which the participant
points out/uses a specific sentence
structure/ addresses the user directly or
indirectly, in i.e. question, instructionss
or scale.

76
3.1.4 Haptics
3.1.5 Length
3.1.6 Audio
An element is related to the impression
the user gets when touching the
interface (i.e. how the interface reacts
when clicking it).
The participant makes a comment
regarding the length of a questionnaire
or mentions time investment.
The participant makes a comment
regarding (background) music, voice-
overs or other audio-related aspects.
3.2 Gamification
3.2.1 Interactive elements
3.2.2 Storytelling
3.2.3 Avatar
3.2.4 Progress-indication
3.2.5 Feedback
3.2.6 Means of extrinsic
motivation
A participant makes a comment
regarding the animation of
questionnaire elements or in how far it
is interactive.
A narrative (story) is introduced in a
questionnaire, or a specific character is
introduced.
An avatar is mentioned or commented
on by a participant.
A progress-bar or similar indication is
mentioned or commented one by a
participant.
A participant mentions feedback or
comparable interactions between the
interface and the user being provided.
A participant mentions challenges,
rewards or point systems.
3.3 Visual design

77
3.3.1 Arrangement of
questions
3.3.2 Colours
3.3.3 Photos
3.3.4 Icons
3.3.5 Scale-Layout
A participant mentions or comments on
how the questions should be displayed,
i.e. at once or in bits (categories), or
elaborates how many there should be
per page.
A participant mentions or comments on
colours being used.
A participant mentions or comments on
photos/images being used.
A participant mentions or comments on
icons being used.
A participant mentions or comments on
a specific scale outlook/layout or order
being used.
3.4. Information
3.4.1 Introduction
3.4.2 Information-button
3.4.4 Result display
3.4.5 Introduction-video
A participant mentions or comments on
an introduction into the questionnaire.
being used.
A participant mentions or comments on
information buttons being used.
A participant mentions or comments on
the display of the results.
A participant talks about an intro-video.
4.Further
recommendations
1 sentence to one paragraph
4.1 Other development
suggestions
A participant makes suggestions to the
designer regarding, i.e. brand
reputation, marketing, distribution,
resources (investment of time/money
and skills of employees).
4.2 Apps and services A participant mentions or suggests
another app or service as examples for
design choices.

78
E. Frequencies
Table 7
Expert – sentiment frequencies
Table 8
Young people – sentiment frequencies
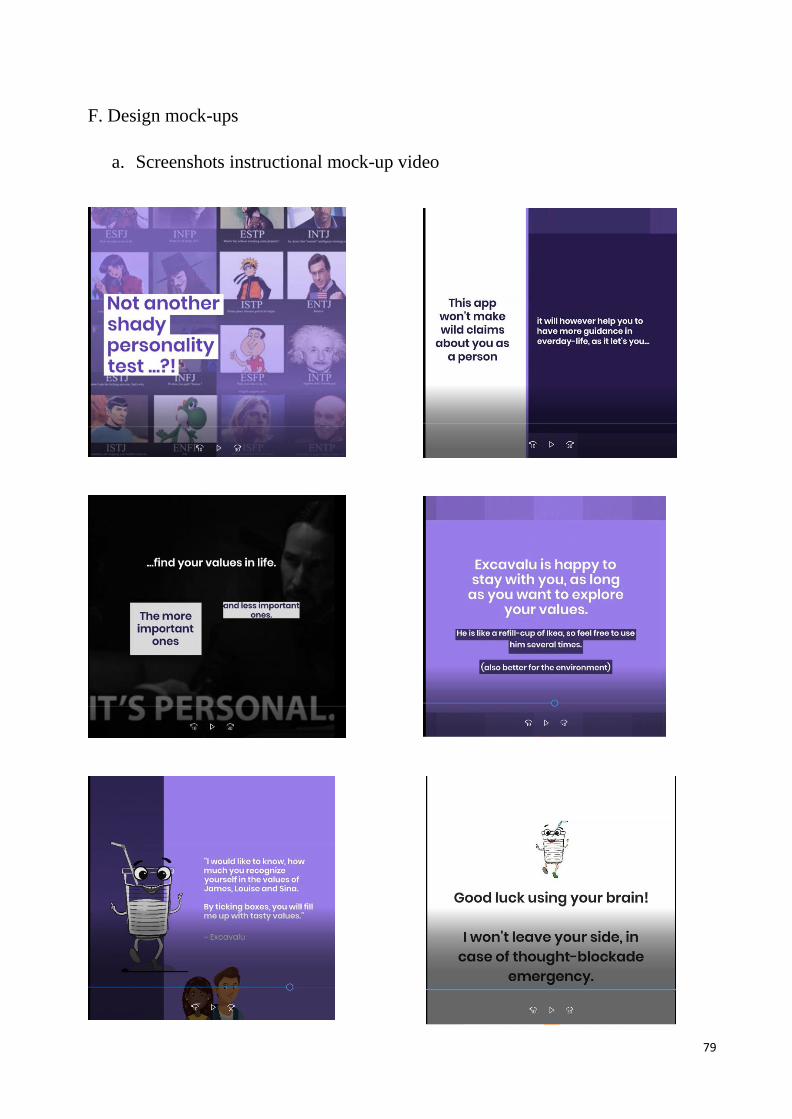
79
F. Design mock-ups
a. Screenshots instructional mock-up video

80
b. Screenshots mobile survey component design mock-ups

81
G. Participant input tables
Table 9
Sentiments and respective interviewee input
Sentiment Most relevant comments
Context
appropriateness
+ Avatars suitable for questionnaires and personality tests
+ Avatars are better as animals than human characters
+ Food was positively judged with the exception of dangers in
terms of eating disorders
+ Storytelling overall was evaluated to work well as long as an
informal story is not used in a formal setting
+ According to young people humour should create a relatable
atmosphere for the targeted age-group with one way of creating
that relatability being the use of memes or gifs. Most young
people and one UX expert considered humour to work as
gateway for people to open up.
+/- Age was suggested to influence in how far story telling
would engage the user more or be seen as being inappropriate,
with latter mostly being the case for older age groups.
+/- Humour mostly positively connotated but has to be used
carefully with serious topics, It should not be applied when the
sensitivity of a topic is very high or when it is more important
that the user is critical towards him or herself than him or her
having fun.
+/- The UX product design manager highlighted that humour
should only be used if it is generally in line with the goals of
the organization developing and distributing the questionnaire.
+/- Photos should not be too ‘childlike’ for young adults and be
directly relatable to the topic they refer to.
+/- Photos should be in line with the topic
+/- If it fits the overall topic ‘brighter’ colours could be used as
well, even though less bright colours were generally suggested.
+/- If each category had a colour, it was suggested to make the
colours fitting towards the topic of each category.
+/- With respect to length, it was mentioned during various
interviews that the time investment needs to be aligned with the
purpose of the study. It should generally be a short as possible
but, if a questionnaire needs to be longer in order to be
accurate, that should be guarded regardless

82
- The UI expert mostly deemed humour to be suitable, if the
demographic can be narrowed down so that the subjectivity of
humour does not have as much of an effect.
- One UX expert suggested using humour more in the sense of
a ‘light-hearted’ tone of voice than actual jokes as it is
otherwise too subjective for different tastes in humour, which
several young people affirmed.
- One participant advised to not assign one definitive category
to the participants responses but more show the participant per
category to what percentage his or her responses reflect each
category.
Motivation - Several experts were stating that extrinsic rewards (i.e.
money) would not only uphold motivation rather on the short-
term instead of on the longer run, they were also proclaimed to
be less meaningful than intrinsic motivation.
+ Making use of differing levels could work motivating as long
as they are more reflections of progress than distinctions
between skills and lacking accomplishments.
+ The systematic youth expert advocates point systems as these
can function as motivational alternators but also relativizes the
argument specifically for reflection processes:
+ The systematic youth therapist implies that feedback is
important for upholding the motivation in reflection processes,
whereby not every step the user takes needs to be validated but
the overall progress and accomplishments should be given
feedback on.
+ Experts and young participants stressed the positive influence
and need for a progress indication, predominantly referring to a
progress bar of some kind.
- The UI expert and one UX expert and young person hereby
state that the impact is only of positive nature if the progress
bar indicates advancement representations i.e. percentages as
opposed to numbers, particularly for long questionnaires.
- One young person mentions that an avatar guiding a young
person through the entirety of the questionnaire could inherit
the function of a feedback-provider, whereas another implied
that avatars could also frustrate due to distraction. Two of the
UX experts confirm the first opinion with one stating that
especially young people would “get a lot of satisfaction out of
seeing something grow like that immediately”.

83
Three proposals were made, which are expected to show a
similar effect as progress bars: 1. Using colour-interactive
elements changing with accomplished questions; 2. Sounds or
3. Animations appearing when certain parts of the
questionnaire are completed.
+ One participant also implied that storytelling might function
as a motivational factor, due to the felt interaction with another
character, if its implementation is not “too complex", while
another states that fictive characters can help to keep up
motivation as it awakes curiosity for the development and
outcome of the plot.
+ Also, humour was evaluated positively in terms of motivation
with one UX expert pinpointing that even in moments of failure
“finding humour in the situation or just in humans in general is
very healthy”
- The first and enduring impression questionnaire participants
get seem to be relevant with respect to its length as particularly
young people consistently indicate that survey which are
seemingly taking more than on average 15 minutes of their
time are demotivating or tiring and evoking boredom or
frustration.
- Questions should also not resemble each other too much, as
variety was claimed to be more motivating.
Usefulness - Many interviewees highlighted directly by referring to
benefits or indirectly by implying a lack of reasons to engage in
a questionnaire that perceived usefulness is of importance when
designing surveys.
+ Experts repeatedly pointed towards goal setting in terms of
developmental benefits and personal interests in the survey’s
topic or outcome, which should be highlighted within the
instructions of questionnaires or in the general communication
about it.
+ Young people described how they are usually keen to fill in a
questionnaire when that action supports a family member,
friend or similar personal contact or if they are being coerced to
do so by authorities in their life, i.e. their teachers or
employers.
+ Filling in questionnaires for a specific field of interest
(benefit for themselves) or when they recognize societal
benefits makes the process more enjoyable and provides a
reason to start with the questionnaire in the first place.

84
+ One young person also stressed that the survey respondent
should still feel addressed personally if a story is being created
around the questions.
+ The design expert declared that phrasing in a manner that the
respondent feels personally addressed, activates the right
mindset of having a reason to fill in the survey.
- The lack of a recognizable “direct benefit” will with regard to
long-lasting questionnaires increase the negative effect of low
attention spans, which “people tend to have”.
+/- Three slightly deviating points emerged based on the
expertise of interviewees.
The systematic youth therapist approached the need for goal
setting with a practical advice for managing expectations: “You
have to clearly indicate within the introduction what [the
questionnaire] is all about and what is expected of people,
which can be crafted in a rather creative manner.”
The UX product design manager focused on the privacy
paradox and acknowledged that people are usually willing to
give up a certain degree of their privacy, if they recognize the
outcome to be beneficial through transparent communication of
the app’s developers.
The gamification expert refers to sensemaking theories relating
to specific gamified design elements, the changes an avatar in
combination with a progress indication undergoes based on the
user’s actions within an app need to be meaningful: ‘It’s not
like ‘hey you made it through a third of the questionnaire. Your
plant is now going to be bigger.’
Control + Firstly, the gamification expert proclaimed that characters of
avatars need to be relatable and possible to personalize for the
target audience.
+ Four young persons also mentioned that customization of
avatars is generally appreciated within apps, whereby one
mentioned that the customization does not need to be very
advanced in order to be helpful.
+/- The type of questionnaire needs to be evaluated to decide
what customization approach is suitable
+ One young person suggests enabling people to customize
buttons.
+ (focusing on agency) one young person emphasized that
informative buttons give people the chance to decide for
themselves when and how much information they would like to
receive and also states that progress bars can be of use in terms
of the time a person needs for a survey.

85
Security + The feeling of one’s data safety and privacy being guarded
and the communication about those regulative aspects is
important.
+ The UX product design manager highlighted how also
humour could be used with respect to a serious topic like
privacy, if humour was coherently applied within the whole
mobile application or survey.
+ The other angle focuses more on creating a welcoming and
calm atmosphere, in which young people are not afraid to share
their honest opinion. The systematic youth therapist hereby
distinguished between children and teenagers but emphasized
that
+ Colours should according to UX experts and young
interviewees have a calming effect as tranquillity enhances the
experience with the survey and potentially increases the quality
of responses.
+ A young interviewee for this purpose also proposed to make
use of calm “Lo-fi music” in the background.
+ Colours were furthermore also rated by one UX expert to
take away uncertainties, which can arise looking at a black and
white “blank canvas”.
+ One young study participant indicated that a clarification for
why certain design elements are being used, might also be
supportive in creating a good atmosphere:
Clarity Every interviewee made at least one comment which implied
that the clarity and/or chance to achieve as unbiased results as
possible are of high relevance. Many comments hereby related
to the comprehensiveness of wording of questions, the survey’s
purpose and instructions.
+/- Humour could potentially lead to a certain degree of bias in
responses
+/- Colours can underline instructional contents or scale layouts
but also make both more ambiguous, or prone to bias. The first
would be the case, if commonly implied meaning of colours is
being switched up against novel interpretations and the latter, if
the survey respondent is stirred too much in one direction due
to a lack of room for interpretation of the survey participant.
+ One UX expert also emphasized the importance of “having a
good contrast” to the interface background.
+ A young person also indicated that displaying important parts
of questions in bold was in line with the idea of highlighting
parts of instructions by having bullet point instead of only blog
text, as brought up by another interviewee.

86
+/- Icons and photos were evaluated to present a similarly
conflicting potential of effects. They should furthermore be
aligned with the content of the text.
- Formulating survey items in a way that the respondent has to
compare him- or herself to another fictional person was
criticised to leave room for confusion by several interviewees.
- One UX expert advised to reduce the abstraction of questions
by asking “how often has that [incident] happened” and
thereby applying a more tangible time-frame.
- It was also proposed to keep the questions as much “to the
point”, simple and unambiguous as possible.
- Ambiguity was also expected to arise when humour or a
leading choice of words is being implemented within the
survey’s questions.
+ Progress indications were also emphasized to contribute to
the clarity of the questionnaire’s process. One young person
proposed also adding a “clear starting and ending point of the
questionnaire, maybe with some interactive parts” to improve
its overall comprehensiveness.
+ Diving questions into visible thematic categories would
according to interviewees also result in advanced clarity.
Feasibility + Questionnaires were evaluated to show varying degrees of
feasibility. One aspect which was brought up was relatability of
contents and design elements as the target group should be able
to make sense of tasks easier when being supported to
accomplish tasks by using familiar examples of day-to-day
situations.
+ Progress indications were rated to be a supportive means
making tasks seem more achievable and also pictures,
infographics or icons were suggested to be used as explanatory
additions making immediate interpretation easier.
- Make questions/tasks digestible
+/- Avatars were mostly commented upon positively in terms
of feasibility, but the gamification expert warned that the avatar
should not be too open in changes and interpretations as the
“blank state syndrome” enhances chances of people filling in
“random nonsense” as they feel like “nothing they do matters”.
- Storytelling was in terms of complexity by many interviewees
regarded to be mentally loading and not straightforward enough
to make the survey seem feasible to end successfully,
especially, if the characters one compares oneself to via items
are being given names.

87
- The UX product designer suggested making use of as many
stories after one another as possible, however less referring to
told stories than tasks and interesting, curiosity awakening
elements occurring within short timeframes.
+ Another UX designer suggests starting with comparably easy
questions to ease the user into the survey, while the UI designer
considers the use of fluent interface interactions and haptics to
be a suitable means of reducing complexity. The expert adds
that also information pieces to be accessed by the respondent
help to make it achievable, which a young person affirms.
Attention + Comments about progress bars, humour, pictures, icons and
interactive elements and storytelling combined with an avatar
were hereby mostly positively connotated (exiting).
+ A “catchy” way of displaying feedback was proposed by one
young person to contribute to the attention a survey respondent
can offer.
+ Another advice implied by both young people and experts
was to show original item structures and contents as that is
supposed to increase excitement or at least prevent boredom.
+ Finally, one UX expert commented that “there is so much
emotion that can be conveyed through colour”, which could
also decrease boringness.
+ Another UX expert found that effect in clarifying how much
time the survey would take in total, so that the expectation to
finalize the questionnaire in a foreseeable time prevents
boredom.
+ Excitement in return was twice also brought up in the context
of audio.
- Long-lasting questionnaires as well as survey with many
items, particularly those without creative design elements were
across various study participants considered to be boring.
- The systematic youth therapist also highlighted that survey
items should not be too confusing or complex in structure as
that specifically for young people enhances the effect of low
attention spans.
- A young person added to this that surveys with “a lot of text”
are more boring than others.
- Content-wise should questionnaires according to young
people also not be of boring nature. However, the judgement of
that is very subjective as everybody has different interests.
- Lastly, was one critical point referring to the effect boredom
has on attention, which is paid to the quality of responses.

88
Accessibility - A youth expert emphasized that certain youth groups will face
more understanding in complex questions and instructions than
others
- The gamification expert raises the concern of aid for young
people with autism to interpret items.
- The colours of scale and buttons can play an essential role for
colour-blind people. For people with red-green vision
restrictions, the interviewee clarifies
+ One young interviewee deliberates speaking from experience
about design factors, which can help people with autism and
attention deficit hyperactivity disorder (ADHD). The young
person mainly points at simple, short instructions and use of
visuals as opposed to mere text for people with ADHD.
- For people with autism, a young interviewee advises to not
implement a huge number of moving elements or distracting
illustrations but keep as simple as possible to avoid
overwhelming these young people.
+ One UX expert generalizes with respect to images that while
selecting pictures for a questionnaire it is important to be as
inclusive as possible so that large groups of respondents feel
addressed.
Visual appeal + Questionnaires without any visual design elements being
introduced as too ‘basic’, so the general consensus was that
surveys should look appealing.
+ Attractiveness was mostly mentioned with respect to layouts,
colours and some also mentioned fonts, icons, photos and
game-elements to create visual appeal.
+/- Whereas many participants generally described their ideals
of colour schemes to “look nice”, in some occasions they
clarified that colours should not be too bright or intense but
rather “relaxing” with pastel-like shades.
+ In terms of categories colours were suggested to also make it
attractive to switch up what one is looking at.
+ Colours were also suggested to make information more
memorable through its attractiveness effect.
- The design expert addressed, for instance, how colour and
symbols not being in line with each other can cause the user to
feel displeased. A young person mentioned that icons placed in
very narrow spaces, could cause the visual outlook to appear
“cluttered”, which others confirmed.

89
- For icons and photos, it was added that these visual elements
should be in line with one another and not contradict in terms
of their effect on the user, i.e. calming versus shocking. Photos
should be of high resolution to be appealing.
- One participant also criticized that the use of too many
colours could have an overwhelming effect.
- Some participants mention that it does not need to be “overly
designed” but generally look nice and create a
welcoming/professional but not too formal atmosphere.
- Attractiveness should not stand in the way of functionality.
(Mostly addressed by experts)
+ The appeal was mentioned to have several effects: a
generally good feeling, the motivation to start or continue with
the questionnaire, to make it stand out towards the competition.
Entertainment - The clear majority of interviewees (experts and young people)
implied that filling in questionnaires is usually not the most
entertaining, if not boring activity.
+ A few individuals explain how single surveys (predominantly
personality tests), which they participated in were in fact fun to
some extent.
- Two interviewees emphasized that they genuinely enjoy
filling in questionnaires, if they are of academic nature or
present a recognizable societal benefit.
+Humour was considered to loosen up the atmosphere of the
survey and making contents more relatable.
+ Gamified elements in this context entail avatars, interactive
elements (moving survey items and animations) as well as story
telling. One young person hereby explained how Hogwarts-
personality tests are entertaining, but the fun would
“exponentially decrease eventually” when made use of
repeatedly because no new aspects are brought up
+ Colours were also suggested to potentially bring along a fun
factor, if implemented for instance to assign visual meaning to
personality traits, but for one interviewee could also decrease
enjoyment when standing out too much.
+ According to one young person creating a fun introduction
also helps keeping up attention.
- Overall complexity of questionnaires was evaluated by one
interviewee to decrease enjoyment.
+ Content wise also reliability and creative presentations of
results was proclaimed to be fun.

90
Curiosity + Among others the gamified storytelling approach was
suggested to awake curiosity.
+ Also, illustrations such as pictures as well as colours, avatars
and animations were mentioned to have a positive influence on
the overall interest towards the questionnaire.
+ The gamification expert outlined that customization is also
useful to take into account when seeking to make the survey
interesting for young people (thus making them curious).
- Survey items lacking in originality were stated to diminish
feelings of curiosity, whereas interactive elements on a haptic
level enhance them.
+ Storytelling was also evaluated to potentially cause curiosity
to increase. Having the ability to receive additional information
supposedly adds to these effects, which could be achieved via
information buttons.
+ Instructions could also let interest emerge by explaining the
goal of the questionnaire.
.
+ One young interviewee also pointed out that making the
result display a continuous process will create sustain the
interest of young people for longer.
Originality
+ Young people as well as experts indicated that they would
appreciate it, if the content or structure of questions stand out
compared to other questionnaires.
+ One young person specifically pointed at the tone of voice
and the feeling of interacting with the interface in a
conversation-like setting.
- Young people in particular also indicated during several
occasions that survey designs, which are lacking creativeness,
increase feelings of boredom and not being able to thoroughly
get interested or keep attention to the task.
- Another downside brought up by a young person relates to the
example of the personality tests, which lets participants find out
what type of Hogwarts house they would be if they lived in the
world of Harry Potter. It lacks novelty not due to being
unoriginal at first but due to being copied by so many times
that it starts missing appeal and less well thought-through
versions are even perceived to be of diminished quality as
participants get a chance to compare it.
- Overly used (extrinsically motivating) gamified design appear
stereotypical

91
Table 10
Participant feedback for proposed design elements
Atmosphere
Design element Sentiments
Humour
+ Humour generally contributes to a good atmosphere and entertainment
+ Humorous instructions are better than plain text
+ Especially in a professional setting some sense of seriousness should remain
+ Memes are perceived positively
+ Humour is a good way of approaching the discovery of one’s own character
traits, problems and/or values
- Humour is very subjective and its difficult to meet the right balance between
being funny (and daring in terms of how extreme jokes are) and not getting too
offensive
- Humour might distract from the actual serious task
- Instructions should be primary clear, not funny
- A funny video is not in line with the rather serious tone of the items
Tone of voice
+ The tone of voice in instructions was perceived as inviting
+ The choice of words was suitable for young people
- The sarcasm in the beginning of the video does not create a nice
atmosphere
- The tone of voice in instructions and actual questionnaire are different
from one another (instructions were phrased more personal, more
refreshing and aimed at young people)
Wording
+ Indirect questioning was perceived as being original, refreshing and creative
+ Being approached from a third person perspective was also making the
reflection process more accessible or enjoyable for some participants
- Some items of the PVQ evoked negativity through the use of words, which
are usually used with a negative connotation (i.e. power)
It was not clear to every participant what the actual goal was of the items
- Using names to let survey participants compare themselves to a fictional
character evokes bias if specific names are mentioned

92
- Using names for PVQ items can reduce the level of identification between
survey respondent and imaginative comparison from a cultural perspective
Cultural differences (especially if one person identifies oneself with more than
one) make the interpretation of the items challenging
- An established ‘None’ or ‘not’ in statements should be highlighted in bold or
underlined to not be overlooked
- Some participants experienced emotional distance through the indirect
wording of items
- The provision of more than one gender complicates the flow of the
questionnaire and makes it less appealing; ‘they’ was suggested to be used
instead
Length/time
- The timing of the video instructions could be manged better by using shorter
sentences (some participants found it too slow, others too fast)
- Participants dislike long questionnaires
+ The length of questions was appropriate
+ The PVQ was not commented upon to be too long
+ Instructions were short, which also makes them more inclusive for people
with attention deficits or dyslexia
Audio
- It would have been nice to have more audio with the video of somebody
speaking the instructions (i.e. cute voices)
- One participant suggested playing music while filling in the PVQ, relaxing
background music might thus have a nice effect for people
- The video could have contained more pleasant music
Photos/icons
+ Each question and/or item category could have one explanatory icon
+ Some participants liked all visuals used in the mock-up and video
+ Most participants generally speaking considered illustrations like photos and
icons to be useful as they support the comprehensibility of instructions and/or
questions
+ Icons were proposed to bring liveliness and visual appeal to a questionnaire
+ Icons could also reduce bias compared to photos due to their abstraction
-/+ about half seemed to prefer icons, the other half photos
- Relatable photos should be chosen, instead of the illustrations used were
asked for by one participant
- The 18-21 year-olds seemed to like the photos and visuals used slightly more
than 22-25 year-olds
- Icons are not always easy to interpret
- As well icons as photos could show the potential to bias people, if not chosen
carefully as people compare the illustrations to their own context and interpret
them differently from others

93
- The photo used in the mock-up was considered to come across too
stereotypical, cheap and non-inspiring (recognizable as a stock-photo),
especially for politically loaded pictures (like one about climate change)
- Pictures could be distracting as they usually convey more details than icons
Question arrangement
+ Some participants liked how the questions were placed in categories and only
one category be seen at once as it prevents confusion and distraction as the
survey participant focuses on one topic at a time
+ Grouping items makes the entirety of the PVQ seem less overwhelming
- One category per page would be nice for most participants, whereas several
some participants preferred to see several categories displayed at the same time
- It could be nice to change up questions a bit so that not too many questions
follow up on each other, which are very similar to one another
Colours
+ To a large extent were the chosen colours perceived positively
+ Colours are generally advised to be used as opposed to black and white
designs or the Qualtrics design used for displaying the PVQ (for reasons of
attractiveness, entertainment and clarity)
+ Displaying the results in different colours was not only supported but even
caused excitement in the participants
- It was suggested to pay closer attention to really using only colour of one
colour scheme in terms of saturation and vibrance (especially green, pink and
purple) but pastel colours as a colour scheme was liked by all participants
- Some people considered the colour scheme to be a bit more suitable for
people younger than themselves (less than 23 years)
- Using green and red could induce bias as those two colours are usually used
for marking positive and negative
- Regarding the choice of red and green in scale designs it was proposed to
maybe use two opposing colours but not necessarily red and green even though
red and green in this context was also liked by nearly half of the participants
- One participant mentions that he/she finds the avatar in combination with the
colour scheme looks as if the creator of the app is trying too hard to make it
look attractive for young people
Scale layout
+ Most participants found 5 to 6 response options within the scale to be suitable
+ Differently sized circles were also by many considered to be useful to
understand the meaning behind scale response options
-/+ Also differently sized circles in the scale layout were evaluated to push/
encourage to give more extreme responses
- Some participants for different reasons found the scale difficult to work with
(some considered the response options to be too many, others would have

94
preferred to have more, whereas again others found it difficult to distinguish
between two specific response options such as ‘not at all like me’ and ‘not like
me’)
- Colours (green and red) were considered to push survey respondents more to
give extreme responses and could lead to bias
- One participant criticised that there was no ‘neutral’ response option
Interactivity
Design elements Sentiment
Avatar
+ The idea of an avatar, which changes/adjusts according to survey responses
was perceived very well and evoked excitement among participants (also
specifically a cup filling up over time)
+ The avatar as a cup was perceived as creative, nice-looking and cute, while
also increasing interactivity
+ The idea of an avatar guiding the survey participant through the questionnaire
was also perceived very well as long as it does not appear too frequently and
move too actively as it would otherwise more distract or interrupt than being of
use
-/+ Two participants criticised that the funny nature of the cup would distract
too much from the serious topic, whereas the majority found the humorous
character to be suitable to help survey participants loosen up and thus making
the experience more pleasurable or easy
- The cup design reminded some participants too much of childhood or school
settings to be very likable
- The mock-up specific avatar design was evaluated to be slightly more suitable
for younger people than the age of 23
- The cup should not reveal any survey responses in terms of colours before the
participant finishes the survey
- The interaction between the avatar and user should be reasonable (one
participant addressed that concerned-sounding questions about the user’s
wellbeing coming from the avatar itself, would not be suitable for the setting as
the user is too aware of speaking to a machine)
Progress indication
+ The progress indication was perceived as a very useful and motivating
addition to the bland version of the PVQ
+ The combination of avatar and progress indication was also generally
perceived well

95
+ Without seeing the mock-ups participants already suggested to include a
progress indication
- Regarding the specific design of the progress indication in combination with
the avatar it was criticised that the avatar seems to walk in the wrong direction
Interactive elements
+ Animated videos were generally perceived well
+ Further animations of questions (i.e. after the respondent answered a
question) were suggested
+/- An animated avatar was perceived well as long as the animation does not
start to be distracting
Storytelling
+ Creating a story, which lets the participant be guided through the
questionnaire via an avatar was considered a good addition whereby no specific
recommendations for the type of story were made, which would be attractive to
young people
- Asking young people to compare themselves to others could let to confusion
- Introducing characters with specific names could lead to bias in responses as
people will make associations with characters or humans, whom they know
outside of the survey context
- Choosing specific names in the survey to be presented could also increase
bias specifically with respect to cultural differences across participants
Feedback
+ Having feedback in between of some combinations of categories or i.e. every
third of the questionnaires was perceived well
+ Having feedback within the result display in terms of having made the
achievement of taking time for oneself was perceived well
- Feedback after every question or category would be overloading or annoying
The feedback should not make participants feel like they should hurry up to
provide their responses and finalize the survey as quickly as possible
Extrinsic means of
motivation
-/+ One participant mentioned that rewards could be of use to motivate people
to fill in questionnaires in general but not for a reflective tool like the PVQ
Information
Design elements Sentiments

96
Instructions (general)
- Being able to choose between written and video instructions would be
preferrable
- It was not clear to some participants whether they have to respond in terms of
what is acceptable for society or what is true for themselves
Instructions (video)
+ Most participants generally prefer a video over only using written
instructions
+ the video is an additional motivational factor
+ Animations work very well for videos like the one for the PVQ
- The video contains too many elements, which are moving and distract
- The video comes across stereotypical for a Facebook video or PowerPoint -
presentation
- It would have been better to have an interactive video or similar, where
participants can decide themselves when to click further
- If the video contains mostly text, a simple text would be preferred
- Seeing pictures and videos of people in the background was by one
participant suggested to be nicer
- Other colours would have been preferred by at least two participants
Information button
+ Information buttons to clarify words, which are unknown to the survey
participant
+ they are perceived as being very supportive of clarity and feasibility
+ Info buttons are an attractive alternative to instructions in between of
questions
- Info-buttons should not be place too close to icons as that can make the
impression, as if one explains the other
Result display
+ Displaying the results via means of colour is a good solution
+ The cup is an exciting solution for the result display
- Colour results should not be revealed before the end of filling in the PVQ
It would be nice if the categories were also displayed via separate headlines
according to one participant