Questionable care - 150813 --- FINALQuestionable care: Avoiding ineffective treatment Stephen...
46
Questionable care: Avoiding ineffective treatment Stephen Duckett and Peter Breadon August 2015
Transcript of Questionable care - 150813 --- FINALQuestionable care: Avoiding ineffective treatment Stephen...

Questionable care:Avoiding ineffective treatmentStephen Duckett and Peter Breadon
August 2015

Questionable care
Grattan Institute 2015
Grattan Institute Support Grattan Institute Report No. 2015-7, August 2015
This report was written by Stephen Duckett, Grattan Institute Health Program Director and Peter Breadon, Health Fellow. Danielle Romanes, Paul Fennessy, Jonathan Nolan and Dimitri Giannios provided extensive research assistance and made substantial contributions to the report.
We would like to thank our colleagues in the health industry and government (including Stephen Blamey, Brian Hanning, Michael Humphrey, Christine Jorm, Brendan Murphy, Michael Quinn, Ian Scott, Sharon Willcox) for their helpful comments for their input.
The opinions in this report are those of the authors and do not necessarily represent the views of Grattan Institute’s founding members, affiliates, individual board members, reference group members, reviewers or people acknowledged above. Any remaining errors or omissions are the responsibility of the authors.
Grattan Institute is an independent think-tank focused on Australian public policy. Our work is independent, practical and rigorous. We aim to improve policy outcomes by engaging with both decision-makers and the community.
For further information on the Institute’s programs, or to join our mailing list, please go to: http://www.grattan.edu.au/
This report may be cited as: Duckett, S., Breadon, P, Romanes, D. Fennessy, P., Nolan, J. 2015, Questionable care: Stopping ineffective treatments, Grattan Institute
ISBN: 978-1-925015-73-7
All material published or otherwise created by Grattan Institute is licensed under a Creative Commons Attribution-NonCommercial-ShareAlike 3.0 Unported License
GoogleOrigin Foundation
EYPwCThe Scanlon FoundationWesfarmers
AshurstCorrsDeloitteUrbisWestpac
Founding Members Program Support
Affiliate Partners
Senior Affiliates
Affiliates
Higher Education Program

Questionable care
Grattan Institute 2015 1
Overview
In some hospitals, far too many people get a treatment they should not get, even when the evidence is clear that it is unnecessary or doesn’t work. Australia urgently needs a system to identify these outlier hospitals and make sure they are not putting patients at risk.
To show how such a system could work, this report examines five treatments that should not be used on certain patients. One is treating osteoarthritis of the knee with an arthroscope – putting a tube inside the knee to remove tissue. Another is filling a backbone (vertebrae) with cement to treat fractures. A third is putting patients in a pressurised oxygen chamber when it will not help treat their specific condition.
Expert guidance labels most of these five treatments do-not-do, yet in 2010-11 nearly 6000 people – or 16 people a day – received them.
These procedures can harm. Some people who had them developed infections or other complications during their hospital visit. Some could have avoided the stress, cost, inconvenience and risk of a hospital stay altogether.
Do-not-do treatments happen in all states, cities and rural areas, in public and private hospitals. But the ones we measured only happen in a minority of hospitals, some of which provided do-not-do treatments at 10 or 20 times the average rate.
We also examined three procedures that are sometimes appropriate, but should not be offered routinely. Again, a few hospitals have very different treatment patterns from their peers.
There are important reasons why clinicians sometimes choose inappropriate treatments. Evidence about treatments can be hard for clinicians to access, evaluate and use. Second, there is little systematic monitoring of where do-not-do treatments happen, leaving clinicians and hospitals in the dark about where problems might exist.
Finally, the health system does not manage this problem well. There are rarely major negative consequences for providing ineffective care. In fact, there are incentives that go the other way – hospitals and clinicians get income for giving ineffective care.
To fix the problem, the Australian Commission on Safety and Quality in Health Care should publish a list of do-not-do treatments. It should then identify public and private hospitals that provide these treatments more often than usual. There could be a good reason for a do-not-do treatment, but if some hospitals provide them consistently it is a real concern.
These outlier hospitals should be asked to improve. If they do not, a clinical review by the state health department should check whether the hospital is providing the right care. If it is not, and if it still fails to improve, there should be consequences for the hospital’s management and funding.
The approach in this report can easily be used for many more treatments, using evidence and data that governments already have. Governments should use the approach demonstrated in this report to make sure that far fewer people get the wrong treatment.

Questionable care
Grattan Institute 2015 2
Table of contents Overview ........................................................................................... 1
1. Finding questionable care ........................................................... 2
2. Measuring questionable hospital care ......................................... 7
3. Stopping the wrong choices ...................................................... 16
4. Identifying ineffective treatments ............................................... 18
5. Providing better information ...................................................... 22
6. Tackling poor performance ....................................................... 27
7. Measuring more and measuring better ..................................... 33
8. Conclusion ................................................................................ 37
References ...................................................................................... 38

Questionable care
Grattan Institute 2015 2
1. Finding questionable care
Quality health care involves correctly diagnosing a health problem, choosing the right treatment and delivering it effectively and safely. This report examines one part of quality care: preventing the wrong treatment from being chosen.
Patients expect their treatment to be based on the best evidence about what works. But sometimes treatments are chosen that do not work, and may do harm, even when the evidence is clear. This report focuses on these choices.
Getting the wrong treatment has serious consequences for patients. It puts their health at risk, wastes their time and, often, their money. It can even generate new health problems, while the original health problem may get worse.
There are two signs that some patients are getting the wrong treatment. The first is that some treatments have been proven not to work but keep happening anyway. The second is extreme variation in patterns of care among hospitals. This suggests that in some places treatments are provided too often.1
Both these ways to assess the effectiveness of care have merit, but also weaknesses. We combine them to create a new way to identify questionable care.
1 Or that treatments are provided too rarely in some areas, as discussed further below.
1.1 Ineffective treatments are hard to measure
There is growing concern about treatments that don’t work. Once treatments become established, they often linger on, even after they have been disproven or discredited.2
While no-one knows how much ineffective care is given, clinicians have raised the alarm for many years. A string of studies has found that evidence and clinical guidance are often not followed in Australia (Box 1).
Unfortunately, ineffective care is hard to pin down. Few treatments are given that clearly don’t work for anyone. Typically, treatments are only proven not to work for a specific type of patient. Even then, the advice may be to not use the treatments routinely, rather than not at all.
Another challenge is that the evidence on what doesn’t work can be unclear, out-of-date, low quality, or hard to find and interpret.
Finally, there have been few convincing efforts to measure ineffective care across the health system, and it can be difficult to do so using existing data.
2 This is demonstrated in Chapter 2. Chapters 3 and 6 discuss why ineffective treatments persist and outline some existing efforts to remove them.
Questionable care
Grattan Institute 2015 3
Box 1: Inappropriate care in Australia
Several studies have found that evidence and best practice guidelines are not always used to choose treatments. These studies look at different questions to this report. Our topic is unnecessary hospital treatments, but many of the studies look at under-provision, or at primary care. Nonetheless, they do suggest that there are real problems with clinical choices. For example:
x A 2003-05 study audited Australian hospital emergency department management of community-acquired pneumonia, a condition that causes a significant amount of illness and death. It found that fewer than one in every five patients was treated in line with national guidelines.3
x A 2005-08 survey examined GP treatment of lower back pain, a condition that cost more than $9 billion in Australia in 2010. It found that care regularly failed to match best practice recommendations, with high rates of patients receiving inappropriate imaging, specialist referrals, and medicines.4
x A 2004-06 population survey examined adherence to national guidelines for lipid management, which is critical to the prevention of cardiovascular disease. It found that most high risk patients did not receive primary prevention, and that most of those who did were not achieving target lipid levels.5
3 Maxwell, et al. (2005) 4 Williams, et al. (2010) 5 Janus, et al. (2010)
1.2 Variation: an inconclusive warning
The most striking fact about the large and extensively documented variations in patterns of medical practice, throughout the developed world, is the minimal impact this information has had on policy - Robert G. Evans6
For decades, there has been concern about variation in health care. Why are people in some parts of the country up to five times more likely to get a tonsillectomy, for example? Does it mean some people are getting the wrong treatment?
US research has found large, persistent variation in procedure rates for similar populations.7 There is less research in Australia, but significant variation has been found in surgery, diagnosis and prescribing.8 In all three areas, there is compelling evidence that clinician choices and availability of care, not just differences among patients and their health needs, drive the variation.
There are large variations in rates of common surgical procedures in different parts of Australia. After standardising for age and sex, these rates sometimes vary by more than 12 times in different Medicare Local Areas (MLAs) (Figure 1).
6 Evans (1990) 7 US research finds high regional variation in hospital procedures and in tests, prescribing, primary care and elsewhere. Wennberg, et al. (1987); Phelps (1992); Burge, et al. (2000); Sepucha, et al. (2006); Filan, et al. (2007); Forte, et al. (2008); Morden, et al. (2012); Pham, et al. (2012); Birkmeyer, et al. (2013). 8 Byles, et al. (2000); Australian Commission on Safety and Quality in Health Care (2013); Filan, et al. (2007); Hickie, et al. (1999); Barton, et al. (2006), p 322; Ilett, et al. (2010); Richardson (2001); Runciman, et al. (2012); OECD (2014).

Questionable care
Grattan Institute 2015 4
Figure 1: There is great variation in how often procedures are given in different parts of Australia – a troubling but inconclusive finding
Notes: Age and sex-adjusted rates of procedures in Medicare Local Area populations. CABG = Coronary Arterial Bypass Graft. All rates are standardized for age and sex. Source: Grattan Institute analysis of the National Hospital Morbidity Database (NHMD), 2010-11
-100% -75% -50% -25% 0% 25% 50% 75% 100% 125%
Cholecystectomy
Colectomy
Hip replacement
Lumpectomy
Mastectomy
Knee replacement
CABG
Open prostatectomy
Closed prostatectomy
Tonsillectomy
Appendectomy
Hysterectomy
Deviation from national average
Medicare Local areas

Questionable care
Grattan Institute 2015 5
This variation is dramatic and troubling. But while it hints at inappropriate care, it is difficult to interpret. Just because an area has a high rate of a treatment, it does not mean the rate is too high. Instead, people in other areas may be getting too few treatments.
There are reasons why some variation is legitimate. Patients in different areas might have different health problems, more severe health problems, or different preferences about their treatment. Sometimes, there might be too little evidence to guide consistent choices.9
The variation in Figure 1 is high enough to suggest that something is probably wrong. But to date, variation has been an inconclusive way to evaluate the quality of health care and has produced little policy action. An important reason is the lack of a convincing way to distinguish between legitimate and unwarranted variation.
1.3 A new method: combine variation and ineffective care
In the past, researchers have typically focused either on identifying ineffective treatments, or on variation among hospitals. To minimise the limitations of using variation and ineffective care separately, this report combines them to better identify troubling patterns of care.
9 In line with the international literature, we found that variation was lower for gall bladder removal where evidence is relatively unambiguous (the extremal quotient, which is highest rate as a multiple of the lowest rate, is 2.2), than for tonsil removal (extremal quotient of 5.8). However, even the lower range indicated big differences in care. Variation is also higher in rural areas. See the methodological supplement for more detail on our findings.
1.3.1 Variation
The first step is measuring variation in how often a procedure is given. Figure 1 above follows the same approach used in most previous research, but for the rest of this report we make three improvements to the way variation is measured. Each helps to zero in on illegitimate variation.
First, we measure variation among hospitals, rather than among geographic areas where patients live.10
Second, we measure the rate of procedures only among relevant patients – people who have the disease the procedure is intended to treat. Many previous studies of variation measured how often patients in different hospitals got a particular procedure, such as a lumpectomy. Instead, we measure the rate of lumpectomies only among patients with breast cancer. This takes one of the big, legitimate causes of variation out of the equation. It means that a hospital will not seem to have an unusually high rate of lumpectomies simply because it has a large number of breast cancer patients.11
The change makes a big difference. The hospital with the top rate using the crude measure (the rate among all patients) is different to the hospital with the highest rate using the new measure (the
10 There are current debates about analysis of cost variation at the geographic level in the US, where state-level population health may legitimately determine most variation, see Sheiner (2014). However, our focus is on variation in clinical choices and on variation within as well as between states. 11 Under the old approach, having an unusually large number of breast cancer patients would tend to result in a high lumpectomy rate. This is not the case after our adjustment.

Questionable care
Grattan Institute 2015 6
rate among patients with malignant tumours). The two measures provide starkly different pictures of care. Most of the ten hospitals with the highest rates under the first measure are not among the top 10 under the second.12
Just as we only compare relevant patients, we only compare relevant hospitals. If a hospital never gives a certain treatment, it might be because it doesn’t have the specialist doctors, equipment or facilities to do so. Or it might never see a patient with the relevant health condition. We are looking for variation caused by clinical choices, not by the specialisation of a hospital or the mix of patients it treats.
For this reason, we only compare hospitals that provide the procedure we’re examining, and that also treat at least five patients with the relevant health problem each year.13
1.3.2 Adding assessment of clinical effectiveness
Despite all these improvements, variation still means different things for different types of procedures. That is where the effectiveness of a treatment comes into the picture.
12 Our analysis of the National Hospital Morbidity Database showed that the top 10 hospitals (by lumpectomy rate) for each measure are the same in only 3 cases. Hospital rankings using each measure are only weakly correlated (0.48). The comparison only includes hospitals that perform lumpectomies. 13 This helps ensure that hospitals with very few patients in the relevant group are not unfairly penalised (e.g. getting a 100% do-not-do rate for treating one patient). At least 1 procedure must be provided. For hyperbaric oxygen therapy at least 5 must be provided (see methodological supplement for discussion).
If a treatment generally works, a hospital that provides it more often than others might be using it appropriately. If a treatment is proven to be ineffective, above-average rates are certainly a problem. For this reason, we look at variation in two kinds of procedures, based on the evidence about their effectiveness.
The first are do-not-do treatments, which evidence shows should never be given to a specific type of patient. Variation can distinguish hospitals that provide these treatments rarely and hospitals that offer them more often. If a hospital only records a few do-not-dos, it could be due to data errors, or to a few extremely unusual patients. Where the treatments are more common, there is almost certainly a problem.
The second category is do-not-do routinely treatments. Evidence shows they should not be given automatically to a specific type of patient. They should only be used for unusual patients, or if other options have failed or are inappropriate. Here variation is even more important. If a hospital provides the treatment much more than others do, some of its clinicians might have an unusual interpretation of ‘routinely’.
Looking at patterns of care this way helps show where some treatments are highly suspect. It can never be perfect. It cannot capture all the complexity of clinical decisions. But it does provide useful new estimates about the appropriateness of care.
The next chapter explains which procedures we looked at and what we found. The final chapters explain how to build on our approach to improve the quality of care.

Questionable care
Grattan Institute 2015 7
2. Measuring questionable hospital care
2.1 Do-not-dos
We started by looking for treatments that don’t work, drawing on lists of treatments that should not be given to certain kinds of patients, or to anyone.14 In some cases, clinical evidence has shown that the treatments do not work. In others, studies have failed to prove that they work.
We drew on two academic studies and the work of two government advisory bodies (Box 2). Their advice about more than 1200 treatments was publicly available during the period covered by our data.15 However, limitations in the data released to us often meant we could not measure whether the advice was being followed (see the methodological supplement).
Some advice was undermined by subsequent research, or it referred to treatments that only happened once or twice a year.16 Some of the do-not-do recommendations from academic sources 14 MSAC (1999d); ibid.; MSAC (1999a); MSAC (1999c); MSAC (1999b); MSAC (2000c); MSAC (2000a); MSAC (2001); MSAC (2002a); MSAC (2002b); MSAC (2003); MSAC (2004); MSAC (2005); MSAC (2006a); MSAC (2006b); MSAC (2007); NICE (2007c); NICE (2007b); NICE (2007a); MSAC (2008a); MSAC (2008b); MSAC (2008c); NICE (2010); Cassel and Guest (2012); Elshaug, et al. (2012); Prasad, et al. (2013). 15 Findings published during or after our data period (2010-11) were not used. 16 Four with insufficient volume were: therapeutic dilation and curettage for heavy menstrual bleeding, NICE (2007a); vagus nerve stimulation for epilepsy, MSAC (2008c); chemotherapy for patients with carcinoid heart disease; and lung transplants for cystic fibrosis, Prasad, et al. (2013). For the first two, there were no occurrences once legitimate uses were excluded, for the latter two there were only one or two a year. See the methodological supplement for more information.
were based on relatively weak evidence. After we removed the do-not-do treatments in these categories, five remained.
Many more do-not-do treatments could be measured by drawing on more sources and by using data that is available to government, but not available to us (see Chapter 7).
Box 2: Sources for ineffective treatment list
National Institute for Health and Care Excellence: (UK): NICE has produced do-not-do recommendations as part of an initiative to develop national evidence-based clinical guidance.
Medical Services Advisory Committee (Australia): MSAC (which advises the Commonwealth Health Minister) has no explicit do-not-do list, but makes do-not-fund recommendations based on clinical and cost-effectiveness analysis of services that have, or are seeking, Medicare rebates.
Prasad et al. (United States): researchers used studies from the New England Journal of Medicine to produce a list of 146 treatments that were proven ineffective when new evidence contradicted previous research.
We also used Elshaug et al. (Australia), but all the treatments we included were already covered in NICE guidance. It used published clinical evidence of potentially ineffective and/or unsafe non-pharmaceutical health services to produce a list of 156 low value health care practices.

Questionable care
Grattan Institute 2015 8
As a final check, a panel of experienced clinicians reviewed our list for clinical relevance. The do-not-do treatments we focus on are:
x vertebroplasty for osteoporotic spinal fractures: surgery to fill a backbone (vertebrae) with cement
x arthroscopic debridement for osteoarthritis of the knee: inserting a tube to remove tissue
x laparoscopic uterine nerve ablation for chronic pelvic pain: surgery to destroy a ligament that contains nerve fibres
x removing healthy ovaries during a hysterectomy and
x hyperbaric oxygen therapy (breathing pure oxygen in a pressurised room) for a range of conditions including osteomyelitis, cancer, and non-diabetic wounds and ulcers.17
Expert evaluation has found that these treatments are ineffective, but the strength of the evidence varies. Well-designed studies show that arthroscopic debridement is no better than a placebo for osteoarthritis of the knee. By contrast, studies of hyperbaric oxygen therapy (for certain conditions) found no conclusive evidence of effectiveness, rather than conclusive evidence that it does not work.
Nevertheless, we consider all five do-not-do treatments. None were supported by evidence. Four were listed as do-not-do
17 MSAC (2000b); Moseley, et al. (2002); National Institute for Health and Care Excellence (2007a); National Institute for Health and Care Excellence (2007b); Kirkley, et al. (2008); Buchbinder, et al. (2009); Kallmes, et al. Ibid.; National Institute for Health and Care Excellence (2010).
treatments by an expert government body.18 The other treatment, vertebroplasty, was listed as a do-not-do in Australia immediately after our data period, but this judgement was based on solid evidence published before 2010-11.19
2.1.1 How many do-not-do treatments happen?
All the do-not-do treatments we measure happen when a patient has a specific condition, such as knee osteoarthritis, and also gets a specific treatment, such as an arthroscopy, to remove tissue.20
But some patients have a second health problem that could be a good reason for the treatment. As well as knee osteoarthritis, they could have a tear in their knee cartilage. An arthroscopy to treat osteoarthritis is a do-not-do treatment, but an arthroscopy to repair torn cartilage is considered appropriate.21
In such cases we assumed that the arthroscopy was used to treat the tear – in other words, that it was legitimate. We applied many similar exclusions across most of our do-not-do treatments, ruling out more than 12,000 individual treatments. All the exclusions are listed in the methodological supplement.22
18 By NICE and/or MSAC prior to the period we analysed. 19 Buchbinder, et al. (2009); Kallmes, et al. Ibid.; MSAC (2011). 20 Arthroscopic debridement, from this point we will simply use ‘arthroscopy’ as shorthand. 21 Later evidence calls knee arthroscopy for meniscal tears into question, Khan, et al. (2014). All of our analysis is of clinical evidence available for the year we analysed, 2010-11, not the most recent available evidence. 22 These exclusions and other coding were reviewed by an expert from the Victorian Department of Health.

Questionable care
Grattan Institute 2015 9
Even looking at only five examples revealed a lot of potentially ineffective care. Nearly 6000 people a year, an average of 16 people a day, get these treatments.23 Some do-not-do treatments happen more often. More than 4500 people a year get hyberbaric oxygen therapy when they do not need it. Others are rare: do-not-do nerve ablation for pelvic pain happens just 35 times a year.
These numbers alone do not describe the full extent of the problem. First, we only measured a tiny fraction of all do-not-do treatments. Much more do-not-do guidance is available. With the data they hold, Australian governments can measure many more of them than we can, as Chapter 7 explains in detail.24
Second, among all the people getting hospital care, 6000 is a very small group. But among the people getting the five procedures we look at, it is a much bigger group. Four and a half per cent of patients getting these procedures should not have got them.25
About one out of every 100 knee arthroscopies with debridement should not happen. A key element of specialist training is about choosing the right treatment. If even one per cent of treatment decisions are wrong, that is a big problem.
For some other do-not-do treatments, the results are much worse. More than half of ovary removals during hysterectomy should not happen. One in four hyperbaric oxygen treatments should not happen, nor should one in every 20 vertebroplasties (Figure 3). 23 5888 hospital visits (assumes individuals do not get multiple do-not-dos). 24 We had access to only one data set – hospital inpatients – and could not link patients over time or admissions. 25 As we only investigated selected do-not-do guidance, this is a lower bound; other guidance may classify more treatments as ‘do-not-do’.
Figure 2: Do-not-do treatments in 2010-11
Source: Grattan Institute analysis of NHMD
Figure 3: A large share of some procedures happen to patients that should not get them
Note: Guidance on ovary removal is about the procedure done with hysterectomy. Both the numerator and denominator here are for patients receiving both procedures.
Source: Grattan Institute analysis of NHMD
35
79
302
813
4659
0 1000 2000 3000 4000 5000
Nerve ablation
Ovary removal
Vertebroplasty
Knee arthroscopy
Hyperbaric oxygen
0% 10% 20% 30% 40% 50% 60%
Ovary removal
Hyperbaric oxygen
Vertebroplasty
Knee arthroscopy
Nerve ablation

Questionable care
Grattan Institute 2015 10
Do-not-do treatments can hurt patients. Almost 150 patients who had a do-not-do treatment developed a new problem, such as an infection or a complication from surgical wounds, during their hospital stay. The overall rate is low (2.5 per cent) because knee arthroscopy and hyperbaric oxygen therapy are relatively safe and account for 93 per cent of the do-not-do treatments. Almost 14 per cent of patients getting the other treatments developed a new problem during their hospital stay.26
The various do-not-do treatments also cost from $1300 to $4400.27 This money could be better spent on treatments that work and on reducing waiting lists. More than 1300 people had orthopaedic do-not-do procedures. At the same time, 7300 people on waiting lists were overdue for orthopaedic treatments.28
2.1.2 Do-not-dos are in all states and both sectors
We only look at a few do-not-do treatments, so we cannot make a general comparison among states. But it is clear that all states do too many do-not-do treatments and that different states have different problems (Figure 5). Comparing public and private hospitals is also inconclusive, but there are large differences for some treatments. Three of the do-not-do treatments – hyperbaric oxygen, vertebroplasty and nerve ablation – are more frequent in private hospitals by a large margin (Figure 4).
26 These problems were not necessarily caused by the do-not-do treatment. 27 Average public hospital costs for the highest- and lowest-cost do-not-do treatments. Estimates are for admissions that include a minimal number of other procedures. See the methodological supplement for further explanation. 28 Extended wait orthopaedic patients at the time of the 2011 Census, Steering Committee for the Review of Government Service Provision (2014). Note that do-not-do and waiting list procedures may not be directly substitutable.
The difference for vertebroplasty is mostly due to private hospitals in NSW and WA. NSW private hospitals give the treatment to around one in five compression fracture patients. In WA private hospitals, it is given to one in every four (Figure 6). These rates are 10 and 12 times higher than in other hospitals.29 Private hospitals in these two states account for nearly two-thirds (63 per cent) of all do-not-do vertebroplasties. On the other hand, public hospitals are 2.5 times more likely to do knee arthroscopies for osteoarthritis.
Figure 4: Do-not-do rates vary by sector Public and private sector rates relative to national average (100%)
Note: Categories are short-hand defined in text. Comparisons refer to rates among
relevant patients. National avgs: 0.29%, 0.77%, 4.85%, 0.35% and 0.34%. Source: Grattan Institute analysis of NHMD
29 21% and 25% of patients in NSW and WA private hospitals respectively. Comparison is with all other state-sectors: 2%. Sectoral comparisons only include states where we have private data: NSW, Victoria, Queensland, WA, SA.
0%
50%
100%
150%
200%
Aust.
Public
Private

Questionable care
Grattan Institute 2015 11
Figure 5: Rates of do-not-do treatments vary by type and state, but all states have room to improve
Note: Private hospital treatments are excluded for Tasmania and NT. ‘DND’ patients are patients for whom treatment is a do-not-do, e.g. for vertebroplasty, patients with compression fractures and no other condition for which vertebroplasty should be given.
Source: Grattan Institute analysis of NHMD
0
20
40
60
80
100
120
NSW VIC QLD WA SA TAS NT
0
1
2
3
4
5
NSW VIC QLD WA SA TAS NT0
5
10
15
20
NSW VIC QLD WA SA TAS NT
Hyperbaric oxygen chamber for various conditions
Vertebroplasty for compression fractures
Knee arthroscopy for osteoarthritis
Removal of healthy ovaries during hysterectomy
Nerve ablation for pelvic pain
Rat
e pe
r 100
0 ‘D
ND
’ pat
ient
sR
ate
per 1
000
‘DN
D’ p
atie
nts
0
10
20
30
40
50
60
NSW VIC QLD WA SA TAS NT0
20
40
60
80
100
120
NSW VIC QLD WA SA TAS NT

Questionable care
Grattan Institute 2015 12
Figure 6: Most vertebroplasties are in NSW & WA private hospitals Share of vertebroplasties
Source: Grattan Institute analysis of NHMD
Figure 7: In almost all states, do-not-do treatments are concentrated in a minority of hospitals Proportion of public hospitals providing do-not-do treatments
Source: Grattan Institute analysis of NHMD
2.1.3 Do-not-do treatments happen in a minority of hospitals
For public hospitals, we have separate data for each individual hospital (private hospital data were aggregated). While do-not-do treatments happen in all states, and in both cities and regional areas, they are highly concentrated in a minority of hospitals.
Less than one fifth of public hospitals perform the do-not-do treatments we measure (Figure 7).30 The exception is the Northern Territory, which may simply reflect the fact that it has fewer hospitals than the other states we have data for.
Strikingly, among the minority of hospitals that give these do-not-do treatments, some give them far more often than others (Figure 8).
For all the do-not-do treatments, the hospitals that perform the worst are a long way from the average. The do-not-do treatment with the lowest variation (compared to the average) is hyperbaric oxygen therapy. Even in this case, the worst hospital gives the do-not-do treatment five times more often than average.
For other do-not-do treatments, some hospitals are even further away from normal clinical patterns. Some hospitals provide the treatment at five or 10 times the national rate. One hospital gives arthroscopies for osteoarthritis 22 times more often than the national average.
30 Hospital-level data was only available for public hospitals.
0%
5%
10%
15%
20%
25%
NSW VIC QLD WA SA
PublicPrivate
0%
10%
20%
30%
40%
NSW VIC QLD WA SA TAS NT
FourThreeTwoOne
Types of do-not-do:

Questionable care
Grattan Institute 2015 13
Figure 8: Some public hospitals give do-not-do treatments far more often than average Proportion of relevant patients that get a do-not-do treatment
Note: Categories refer to specific procedure and patient-group pairs, see text or methodological supplement.
Source: Grattan Institute analysis of NHMD
2.2 Do-not-do routinely
Few types of treatment are always wrong, even for patients with a specific health problem. We also analysed some treatments that should not be given routinely. They are:
x fundoplication, in which the upper part of the stomach is wrapped around the bottom of the oesophagus (food pipe) to treat gastro-oesophageal reflux disease (stomach contents rising into the oesophagus)
x episiotomy, a surgical cut made between the vagina and anus during labour for spontaneous vaginal births without complications and
x amniotomy, an artificial rupture of membranes to augment labour during a normal delivery.31
These treatments should not be given automatically, although they may be the best choice for some patients, such as those with unusual problems or conditions, or where other options have failed. Yet very high variation in how often these procedures are given suggests that some hospitals choose them much too often. Strikingly, women with spontaneous vaginal deliveries are almost three times more likely to have an episiotomy in the private sector. Patients with gastro-oesophageal reflux in South Australia are almost three times as likely to get fundoplication as people in other states. As with do-not-do procedures, some hospitals have very unusual patterns of care. The individual hospitals with the highest rates for 31 NICE (2004); NICE (2007b).
0%
20%
40%
60%
80%HospitalAverage
Hyp
erba
ric
Arth
rosc
opy
Verte
brop
last
y
Ova
ry re
mov
al
Ner
ve a
blat
ion

Questionable care
Grattan Institute 2015 14
the three do-not-do-routinely treatments offer them at twice, six times and nine times the average rate (Figure 9). Extremely unusual treatment choices can’t be blamed on the type of hospital or its location. Outlier hospitals come in many shapes, sizes and places.32 Just as with do-not-do procedures, they are in cities and in regional and remote areas (Figure 22). They are in most categories of hospital size and specialisation.33 In all these categories, outliers make up a small minority of hospitals.34
Treatments that should not happen – and high rates of treatments that should not happen routinely – are in all states, in regional areas and cities, and in big and small hospitals. The good news is that for each do-not-do treatment, only a minority of hospitals have troubling patterns of care. The rest of this report shows what to do about these hospitals.
The first step is providing better information about ineffective care and where it happens. This will help clinicians and hospitals interrogate their own patterns of care and act to improve them. When that does not solve the problem, we explain how to identify the most unusual patterns of care and subject them to an in-depth, expert clinical review.
32 As discussed below, for do-not-do treatments we label hospitals with above-average rates outliers. For do-not-do routinely treatments we label hospitals that are in the top 10% in their comparator group outliers. Obviously, no statistical test would identify all hospitals above the average as outliers, but those hospitals do have concerning patterns of care. 33 Outliers are in the largest three size quintiles and four scope (service diversity) quintiles. There is a skew towards bigger hospitals with diverse services, probably because we only look at three treatments (almost any small selection of treatments would be more prevalent in larger, less specialised hospitals). 34 Less than 20% of any size or scope quintile.
Figure 9: Outlier public hospitals provide do-not-do-routinely treatments far more often than their peers Proportion of relevant patients getting do-not-do-routinely procedure
Note: Categories refer to procedure and patient-group pairs, see text. Outliers are the 10%
of hospitals with the highest rates of do-not-do-routinely treatments, see text. Source: Grattan Institute analysis of NHMD
0%
10%
20%
30%
40%
50%
Amniotomy Episiotomy Fundoplication
Outlier hospitalsOther hospitals
Average rate

Questionable care
Grattan Institute 2015 15
Figure 10: Do-not-do routinely treatments vary by state and sector Proportion of relevant patient group getting do-not-do routinely treatment
Source: Grattan Institute analysis of NHMD
0%
10%
20%
30%
NSW VIC QLD WA SA TAS NT
0%
5%
10%
15%
NSW VIC QLD WA SA TAS NT
0.0%
0.5%
1.0%
1.5%
NSW VIC QLD WA SA TAS NT
0%
10%
20%
30%
Public Private
0%
5%
10%
15%
20%
Public Private
0.0%
0.2%
0.4%
0.6%
0.8%
Public Private
Amniotomy
Episiotomy
Fundoplication

Questionable care
Grattan Institute 2015 16
3. Stopping the wrong choices
New efforts to cut the use of ineffective treatments – sometimes known as disinvestment – are starting to appear. Yet good evidence is lacking about which approaches work best.35 This is partly because formal disinvestment policies are still in their infancy in Australia and around the world. It is also because attempts to stem ineffective care have met many challenges.
Perhaps the greatest of these is the health system’s focus on adding new treatments and doing more. The system pays little attention to removing old treatments and doing less. There are also many other barriers, ranging from technical problems to cultural issues (Box 3).
This wide range of barriers reflects the many influences on the treatment choices that clinicians make. Health care workers are driven by their training, professional culture and beliefs, and their desire to help patients.36 They are also influenced by organisational practices and culture, by financial incentives and by government policy (Figure 11).37 These factors will be more or less important in different hospitals and clinics, and for different individuals.
35 Gallego, et al. (2010) 36 A US study measured determinants of regional Medicare spending and found that physician beliefs (not supported by evidence) were the most important factor, Cutler, et al. (2013). Doust and Del Mar (2004) point to a range of reasons that an individual clinician may choose an ineffective treatment including: a need to do something, real or perceived patient expectations, and over-reliance on surrogate outcomes. 37 Zezza, et al. (2014)
Because of this complexity, many experts in health care improvement recommend tailoring responses to specific barriers in different organisations.38 There is no conclusive evidence that tailored solutions are better, yet it seems safe to assume that a single set of operational solutions won’t work everywhere.39
Box 3: Some obstacles to current disinvestment efforts
x Inertia and failure to acknowledge that current practices aren’t working
x Unclear objectives of disinvestment efforts
x Lack of clear processes or incentives to sustain change
x Limited resources and commitment from policy-makers, funders and clinicians
x Difficulty identifying when disinvestment is happening because guidance is vague or cannot be measured with existing data
x Political resistance due to patient and clinician opposition and media interest
Sources: Elshaug, A.G. et al. (2009); Haas et al. (2012); Schmidt (2012); Queensland Health (2013).
38 Grol and Grimshaw (2003); Grol and Wensing (2004). 39 A Cochrane review found no conclusive evidence that tailored strategies are superior, Baker, et al. (2010). Evidence is mixed on efforts to improve the appropriateness of care in general, Shojania and Grimshaw (2005); Scott (2009).
Questionable care
Grattan Institute 2015 17
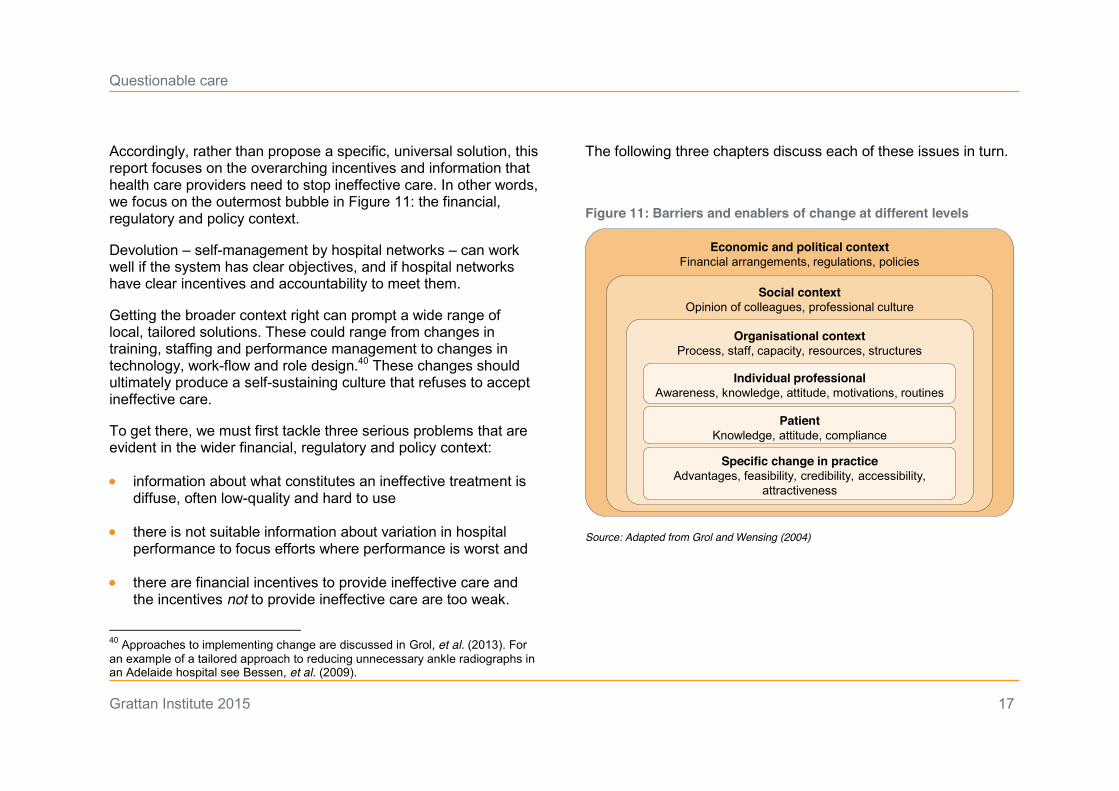
Accordingly, rather than propose a specific, universal solution, this report focuses on the overarching incentives and information that health care providers need to stop ineffective care. In other words, we focus on the outermost bubble in Figure 11: the financial, regulatory and policy context.
Devolution – self-management by hospital networks – can work well if the system has clear objectives, and if hospital networks have clear incentives and accountability to meet them.
Getting the broader context right can prompt a wide range of local, tailored solutions. These could range from changes in training, staffing and performance management to changes in technology, work-flow and role design.40 These changes should ultimately produce a self-sustaining culture that refuses to accept ineffective care.
To get there, we must first tackle three serious problems that are evident in the wider financial, regulatory and policy context:
x information about what constitutes an ineffective treatment is diffuse, often low-quality and hard to use
x there is not suitable information about variation in hospital performance to focus efforts where performance is worst and
x there are financial incentives to provide ineffective care and the incentives not to provide ineffective care are too weak.
40 Approaches to implementing change are discussed in Grol, et al. (2013). For an example of a tailored approach to reducing unnecessary ankle radiographs in an Adelaide hospital see Bessen, et al. (2009).
The following three chapters discuss each of these issues in turn.
Figure 11: Barriers and enablers of change at different levels
Source: Adapted from Grol and Wensing (2004)
Economic and political context Financial arrangements, regulations, policies
Social contextOpinion of colleagues, professional culture
Organisational contextProcess, staff, capacity, resources, structures
Individual professionalAwareness, knowledge, attitude, motivations, routines
PatientKnowledge, attitude, compliance
Specific change in practiceAdvantages, feasibility, credibility, accessibility,
attractiveness
Questionable care
Grattan Institute 2015 18
4. Identifying ineffective treatments
Many hospitals, states and national bodies in Australia and overseas have started some kind of disinvestment effort. But current approaches aren’t working well enough. They are fragmented and inconsistent, some fail to draw on sufficient clinical expertise, and recommendations often sit on the shelf instead of improving clinical choices.
The many organisations working on disinvestment in Australia include ministerial advisory councils, government health departments, statutory authorities, hospital networks, private hospitals and specialist medical colleges.41
These efforts aren’t just diffuse, they are uncoordinated. At present multiple organisations might assess the effectiveness of the same treatment. This wastes time, effort and resources and could lead to conflicting guidance to clinicians.
In addition, these evaluations are typically ad hoc and opportunistic. There are many approaches, but no clear standard of how to define and identify disinvestment.42 In particular, it is not clear how treatments are chosen for assessment.43
41 For example, the Commonwealth Government’s Safety, Quality and Sustainability Forum, the Health Policy Advisory Committee on Technology (part of an Advisory Council for Australian health ministers), clinical senates in Queensland and South Australia, projects in state health departments and Monash Health in Victoria. 42 Although some systems have attempted to establish a standard approach e.g. NICE in the UK and the Basque health system, Ibargoyen-Roteta, et al. (2010). 43 Gallego, et al. (2010)
Getting the right approach is both important and difficult. It requires assessing evidence on safety, clinical effectiveness and feasibility. It requires overcoming limited expertise about disinvestment and dealing with gaps in evidence and data.
Clinical expertise is crucial to get the analysis right and make it credible. Yet clinician involvement in identifying ineffective care varies. The fragmented system risks spreading medical colleges and other expert bodies very thin, or not including them at all.44
The government has recently announced a comprehensive review of services funded by Medicare. This is welcome and could address many of the problems outlined above. But because evidence keeps changing, and new treatments keep emerging, we also need an ongoing system to evaluate which treatments do not work, and to let people know about it.
4.1 Streamlined governance
The Australian Commission on Safety and Quality in Health Care (the Commission) should do two things to combat ineffective care.45 First, it should streamline the process by which do-not-do
44 In broader efforts that go beyond clinically ineffective care (targeting over or under-servicing) consumer involvement is also critical, discussed below. 45 If it is established, the Health Productivity and Performance Commission, a new body proposed in the 2014 Commonwealth Budget, would be in a good position to take on this role instead. Subject to consultation the HPPC was intended to absorb several agencies including the Australian Commission on Safety and Quality in Health Care, Dutton and Cormann (2014).

Questionable care
Grattan Institute 2015 19
treatments are identified and communicated to health professionals. Second, wherever possible, it should monitor and reveal where do-not-dos are still happening. In these roles, the Commission will be most effective if both the Commonwealth and states can guide its work.
4.2 Picking or choosing?
When it comes to finding out which care is ineffective, the Commission has three possible roles. It could coordinate the work of other bodies, it could actively evaluate work done elsewhere, or it could be responsible for the entire analysis (Figure 12).
These options range from bottom-up (influencing and coordinating other efforts) to top-down (deciding where to look, how to look, and finding the answers). The top-down approach is closer to the UK’s National Institute for Health and Clinical Excellence (NICE).
The bottom-up approach is closer to the Choosing Wisely campaign, which is run by the American Board of Internal Medicine. The campaign provides information on treatments that “clinicians and consumers should question”. In 2015, Australia began its own Choosing Wisely campaign, with five medical colleges recommending that a total of 27 interventions be questioned.46 These two approaches are discussed in Box 4.
Each approach has benefits and drawbacks (Figure 13). A top-down model would provide the most consistent, objective, transparent and relevant evaluation. Yet it would also need the biggest funding commitment and may be resisted by
46 See http://www.choosingwisely.org.au/.
organisations that do disinvestment evaluations now. As a starting point, we recommend a coordination and evaluation role. The Commission would guide, validate and promote guidance developed elsewhere.
Figure 12: Identification of do-not-dos can be bottom-up or top-down Diagram of possible do-not-do identification roles
Source: Grattan Institute
Coordinate Evaluate Initiate
• Collate and publish disinvestment findings and research plans of other organisations
• Promote best practices in identification of disinvestment opportunities
• Propose priorities for evaluation
• Evaluate disinvestment identification done by other organisations, publishing only the findings that the HPPC supports
• Execute / commission research to identify disinvestment, with topics chosen by the HPPC
Bottom-up Top-down

Questionable care
Grattan Institute 2015 20
Box 4: Examples of top-down and bottom-up approaches: NICE do-not-dos and Choosing Wisely
England’s National Institute for Health and Care Excellence (NICE) provides national guidance and advice to improve health and social care. That includes assessing health technology and recommending whether it should be funded in the National Health Service. NICE has been an independent public body since 2013.
As a spin-off from its guidance development, NICE has developed a list of more than 1000 do-not-do recommendations.47 These are based on expert NICE reviews of evidence, with input from clinicians and the community.
The American Board of Internal Medicine, which certifies a quarter of US physicians, launched Choosing Wisely in 2012. The campaign, since repeated in Canada, Italy and here, promotes conversations between providers and patients about ineffective or unnecessary care. They publish “things providers and patients should question” and aim to influence clinician and patient attitudes rather than immediately changing funding or behaviour.48
Fifty-nine US national organisations representing medical specialists, plus consumer groups, have partnered with ABIM to identify more than 300 ineffective or unnecessary practices.
The do-not-do recommendations of both NICE and Choosing Wisely depend on robust evidence and input from specialist medical and surgical colleges. The analysis in this report drew on both.
47 Probably the most developed disinvestment model, Gallego, et al. (2010). 48 ABIM Foundation (2013); Wolfson, et al. (2014).
Box 5: Disinvestment evaluation should be:
x accountable – stakeholders are responsible for meeting defined standards and improving outcomes (quality of care and patient outcomes, for example) within their realm of responsibility and influence
x consistent – standardised processes apply to all stakeholders, including clinicians, consumers, medical societies, hospitals, funders, policy-makers
x efficient – waste and unnecessary duplication are avoided
x objective – the process is evidence-based and without bias, for example it minimises conflicts of interest and other biases
x responsive – it addresses the information needs of decision makers, including clinicians, consumers and funders;
x rigorous – it minimises bias and creates reproducible results;
x transparent – it contains ongoing assessment and reporting against goals, strategies, outcomes and budgets so observers can easily link judgments, decisions or actions to relevant data and
x feasible – it is likely to work in the real world (recognises social, fiscal, political and economic constraints).

Questionable care
Grattan Institute 2015 21
Figure 13: Different roles have different benefits and drawbacks Commission roles measured against principles of evaluation (see Box 5)
Status quo Coordinate Coordinate
& evaluate Initiate Accountability Low Low Mid-high Mid-high
Consistency Low Low Mid-high High Efficiency Low Mid Mid-high Mid-high
Objectivity Low Mid Mid-high High Responsiveness Low Mid Mid-high High
Rigour Low Low Mid-high Mid-high Transparency Low Low Mid-High High
Feasibility High High Mid Low Sources: Grattan Institute, adapting a framework and findings from Sox et al. (2008).
In order to identify ineffective care, the Australian Commission on Safety and Quality in Health Care should:
x Publish a do-not-do list after checking that the underlying quality of studies and evidence is adequate, and following input from clinicians and experts
x Set do-not-do research priorities in consultation with clinicians,
funders and consumers and encourage work in these areas
x Reduce duplication by publishing a list of ongoing disinvestment research by other bodies
x Codify and promote best practices in identification of ineffective care
x Coordinate an Australian Choosing Wisely campaign, where medical colleges identify low-value treatments for disinvestment.
This approach will still allow other organisations to identify ineffective treatments. However, the Commission will test the quality of that work, promote research where it is most needed and reduce duplication across the system.
Identification of ineffective care leads to the second part of the Commission’s role: letting people know which care is ineffective and where it is happening. This is discussed in the next chapter.

Questionable care
Grattan Institute 2015 22
5. Providing better information
The complexity of modern medicine exceeds the inherent limitations of the unaided human mind David M. Eddy, MD, Ph.D
To stop ineffective care, it’s crucial to know which treatments don’t work, where they happen, and where levels of treatments seem too high. But that information is hard to come by. Guidance for clinicians is scattered and hard to use, and no one systematically tracks and reports on care that is likely to be ineffective.
5.1 Clear guidelines on what not to do
Clinicians find out about which treatments work – and which don’t – from many different places. These include their training and ongoing education, academic journals, colleagues, and clinical guidelines. No single system should try to replace all these sources of knowledge. Yet the persistence of ineffective care suggests that they are not working well enough.
It is hard to keep up with the vast volume of medical evidence. Reading all the journal articles relevant to primary care would take more than 20 hours a day, according to one estimate from 2002.49 Another study found that half the evidence published about nephrology (kidneys) was spread across 20 journals, with the rest published in 1428 other publications.50 And the volume of evidence keeps growing (Figure 14).
49 Alper, et al. (2004) 50 Garg, et al. (2006)
It isn’t possible to read all the relevant material, let alone critically evaluate its quality. Instead, clinicians must often rely on systematic reviews (which are themselves growing exponentially) and particularly on clinical guidance – expert interpretations of the evidence and what it means for clinical practice.
Unfortunately, clinical guidance is often a poor way to find out which treatments don’t work. It tends to focus on what should be done, not what should be avoided. Clinical guidance can also be very hard to keep track of. It is produced by a dizzying array of organisations: at least 41 government entities plus medical colleges, groups for specific health conditions and specialty societies.51
Guidelines can be difficult to use, often running to hundreds of pages.52 Their quality is also uneven. In an evaluation of Australian guidelines from 2005 to 2013, fewer than half met basic standards such as having a clear intended audience, a clear setting (such as GP clinic or hospital) and a clear process for how a guideline was developed (Figure 15).
51 National Health and Medical Research Council (2014). There are also other forms of guidance, such as factsheets, developed and distributed by yet more organisations. 52 For example, the NHMRC Type 2 diabetes guideline developed by the Diabetes Australia Guideline Development Consortium has 935 pages, Bayram, et al. (2009).

Questionable care
Grattan Institute 2015 23
Figure 14: The volume of medical evidence is huge and growing Articles indexed in Medline (PubMed), total and with selected terms in the title, 1994-2013
Source: Grattan Institute analysis of Corlan (2004)
Figure 15: Clinical guidelines often fail measures of quality
Note: Assessed guidelines published from 2005-2013 (n = 1,046). Source: National Health and Medical Research Council (2014)
There is also little evidence on how guidelines are used or their impact. Given all these problems it is worth making them much easier to use.53 A clear, concise list of ineffective treatments would be a good start.
We recommend that the Australian Commission on Safety and Quality in Health Care publishes up-to-date do-not-do lists. They should be organised by disease, specialty and site of care. Importantly, the Commission should review them at least every two or three years.54 Much of the guidance we looked at had not
53 National Health and Medical Research Council (2014). 54 García, et al. (2014) found that almost one in five recommendations in clinical guidelines are out-of-date after three years (18.7%).
0
50
100
150
1994 1996 1998 2000 2002 2004 2006 2008 2010 2012
0
0.2
0.4
0.6
0.8
1
1.2
1994 1999 2004 20090
2
4
6
8
10
1994 1999 2004 2009
Articles (million) Articles (thousand)
Knee arthroscopy
Vertebroplasty
Fundoplication
Systematic reviewsAll articles
Articles
0% 10% 20% 30% 40%
Consumer involvement documentedSetting identifiedUsers identified
Endorsed by other agenciesReplicable description of review
Recommendations linked to evidenceProfessionals involved identifiedDevelopment process described

Questionable care
Grattan Institute 2015 24
been revised in many years, even though the evidence has changed substantially.55
A clear list, from an authoritative source, would be a one-stop-shop for information about ineffective care. The lists would assist everyone who provides health care, particularly GPs and other people who treat many different kinds of health problem.56
Clinicians, hospitals, clinics, training organisations and professional bodies could use these central lists to help improve the quality of health care. The Australian Commission on Safety and Quality in Health Care could encourage organisations that develop guidelines to include the do-not-do recommendations, preferably in a separate section for easy reference.
5.2 Reporting on performance
Yet even when information is readily available in one place, it won’t always be used. When ineffective care keeps happening despite clear guidance, clinicians, hospitals, policy-makers and funders need to know so that they can take action. Not all types of ineffective care can be easily measured. Yet the Commission can start by building on the approach we have used.
Using our approach, the Commission should report on rates of do-not-do and do-not-do-routinely procedures to all organisations that fund care (the Commonwealth, States and private insurers) and to accreditation bodies.
55 As discussed in the methodological supplement, this resulted in our abandoning analysis of several ‘do-not-do’ procedures. 56 Much do-not-do guidance is for primary care, so not analysed in this report.
More importantly, reports should go to each hospital network. Without objective performance measures, over-confidence can stop poor quality care from being acknowledged. Some hospital boards clearly suffer from over-confidence. A large majority of Victorian board members think the care in their hospital is above the average of other Victorian hospitals, which is simply impossible (Figure 16).57
Figure 16: Most Victorian hospital network boards think they are better than average Proportion of board members
Notes: Victorian 2012 survey, n = 233, 70% response rate, 96% of boards represented. Source: Bismark et al. (2013)
57 The “above average effect”, or “illusory superiority”, is a well-known cognitive bias, Dunning, et al. (2003), popularised through by Garrison Keilor (1985) as the ‘Lake Wobegon’ effect Keillor, G. (1985) Lake Wobegon days, Viking.
0%
20%
40%
60%
80%
Worse About the same Better or much better
Overall quality of health careSafe and skilled workforceResponding to health care incidents

Questionable care
Grattan Institute 2015 25
Medical colleges should also be told about the questionable care that their members provide in different hospitals. The colleges can use this to inform accreditation of hospital training programs and in their training and quality improvement programs.
The Commission might also choose a slightly less conservative way to measure questionable care than the one we use. Using expert clinical guidance, we exclude all patients with a problem that could possibly be effectively treated by the do-not-do procedure.58 This cuts the risk of false positives: mistakenly calling effective care a do-not-do.
At the same time, it raises the risk of false negatives: not picking up some ineffective care. But we have chosen this approach because it is more generous to clinicians and less likely to give hospitals an unfair, negative evaluation. Our goal is to make any change more widely-accepted and effective. The risk is that it could let some ineffective care slip through undetected. It would also be easier to game by changing how patient health problems are recorded.59 There is no single right answer. Either approach would be an improvement, bringing more ineffective care to light.
Other ways to make information about ineffective care easy to use include summarising it in checklists and electronic decision support systems, which are a promising way to improve care (see Box 7).60
58 In Chapter 2, we give the example (a patient with a meniscal tear and knee osteoarthritis). Our screen also looked for procedures that could legitimate the do-not-do treatment. See the methodological supplement for more information. 59 See the discussion of funding cuts for the knee arthroscopy do-not-do below. 60 Gawande (2010)
This report doesn’t present or evaluate all the options. We focus on the first step: the Australian Commission on Safety and Quality in Health Care should clarify which treatments are ineffective, how much they happen, and where they happen. Health care organisations and professionals can then use this information to eliminate treatments that don’t work.
Box 6: Information for patients
In this chapter we recommend giving information on ineffective care to hospitals, clinics, health care professionals and medical colleges. We don’t suggest informing patients directly, although a list of ineffective care could be publicly available on the Australian Commission for Safety and Quality in Health Care’s website.
Providing information to patients can be beneficial.61 Yet this report focuses on treatments that should never be chosen. We believe that health care providers, not patients, should be responsible for avoiding this kind of ineffective care. Do-not-do advice may also be difficult for patients to interpret.
By contrast, it may be worthwhile informing patients about variation in patterns of care. This is discussed in the next chapter.
Patients and their advocates should be involved in the Commission’s work identifying ineffective care.
61 Evaluating the impact of providing information to patients is beyond the scope of this report. However, there is evidence that clinician decision support systems (discussed in Box 7) work best when patients as well as clinicians are given support.

Questionable care
Grattan Institute 2015 26
Box 7: Clinical decision support systems might also reduce questionable care Figure 17: Most studies show the systems improve treatment choice
Notes: OR of recommended treatments, by study age (1976 at top, 2010 at bottom). Source: Lobach et al. (2012)
Clinical decision support systems give tailored assessments or recommendations to help diagnose or treat a patient. By doing this, they can make clinical evidence and guidance relevant and easy to access.
There are many types of clinical decision support systems. A computer program could summarise evidence and recommend treatments. An alert might tell a doctor that a test for a patient with diabetes is due. A warning could say that a test or drug isn’t recommended for a patient, perhaps because of other drugs he or she takes or particular health problems.62 These systems can help ensure that the vast, constantly evolving evidence that underpins good care isn’t overlooked. Most studies (52 to 68 per cent) have found that decision support systems improve clinician performance.63 In particular, across a range of health care settings there is good evidence that these systems lead to the recommended treatment being ordered or prescribed more often.64
The systems don’t always work, but they are developing quickly and evidence is emerging about how to make them work better. They perform best when they are integrated into workflow at the point of care, when they provide active recommendations (not just assessments),65 when clinicians must enter a reason for overriding advice, and when they also give advice to patients.66
Clinical decision support systems show great promise and can improve further, but there is not yet clear evidence they will be cost-effective.67 It is worth local hospital networks and Primary Health Networks testing these systems. Once we have more local evidence about making them work well, the case for rolling them out more widely is likely to be strong.
62 Other forms include care summary dashboards, which bring together important information about a patient in one place so that it is not overlooked. 63 These figures are from a series of meta-reviews: Garg, et al. (2005); Kawamoto, et al. (2005); Main, et al. (2010); Lobach, et al. (2012); Roshanov, et al. (2013). There are few findings of improved patient outcomes, but these may take time to emerge after improved adherence to guidelines. 64 A meta-analysis evaluating both electronic clinician decision support and knowledge management systems (the latter selectively retrieves information relevant to a specific patient), found recommended orders/treatments were more likely to be ordered with these systems (OR 1.57; CI 1.35-1.82). The review found that the quality of the evidence was strong, Lobach, et al. (2012). 65 Kawamoto, et al. (2005) 66 Based on a meta-regression of randomised trials, Roshanov, et al. (2013). Advice being automatic may also be beneficial (OR 1.48; CI 0.62-3.52). 67 Black, et al. (2011)
0.1 100101
Odds ratioConfidence Interval (95%)

Questionable care
Grattan Institute 2015 27
6. Tackling poor performance
Even with clear definitions and better information about variation, pockets of poor performance will persist. The response should be to find out where the wrong treatments are being chosen and put a stop to them.
There are currently many attempts to evaluate the quality of care but they rarely focus on the choice of treatment and few impose consequences on hospitals or individual doctors (see Box 8 for some examples).
The information outlined in the previous chapter can be used to improve many mechanisms such as those in Box 8. In particular, it can be used in accreditation of hospitals and their training programs, in state oversight of hospitals, and in day-to-day hospital management.
We found that questionable care is highly concentrated, not just in individual hospitals but in individual departments. Many standard approaches to improving quality, such as accreditation of an entire hospital, are too broad to pick up these problems. Others, while useful, might be too narrow and not linked to meaningful consequences. Clinical registries and Clinical Care Standards (see footnote for definitions) fall into this group.68
Few existing approaches combine rigorous measurement of variation in clinical choices with explicit consequences for health 68 Clinical registries are detailed datasets about patients receiving a specific type, or types of treatment. Clinical Care Standards will set out best practices for treating a small number of specific conditions (such as acute coronary syndrome). Consultation is under way for four, Australian Commission on Safety and Quality in Health Care (2014).
care providers.69 To fill the gap, we recommend using data to manage outliers much more clearly and actively. But this should only happen following expert clinical evaluation to verify that a hospital is choosing inappropriate treatments. The process should proceed as described below.
6.1 Clinical reviews and clear consequences Outlier health providers should be identified using Australian Commission on Safety and Quality in Health Care data. They should be told that their patterns of care are unusual, and given a chance to change.
If they remain outliers, an external clinical review should check whether there is a good reason and why. A review might find that a hospital treats extremely rare cases from across Australia, or that the treatments were part of a clinical trial, for example. It might then conclude that the hospital had good reasons for its unusual treatment choices.
The reviews should target the parts of a hospital (they might be specific specialties, such as obstetrics or oncology) that choose the relevant procedure. The review should be done by a team with relevant clinical expertise. It could use patient records, other hospital data, interviews and observation to understand the needs of the hospital’s patients and how they are treated.
69 Some types of Medicare Benefits Scheme and Pharmaceutical Benefits Scheme audits are an exception, see Box 8 and Department of Human Services (2014) for more information.

Questionable care
Grattan Institute 2015 28
Box 8: Some ways that quality is evaluated at present:
Hospital accreditation – Hospitals must be accredited using agreed national standards that focus on safety and governance.70
Training accreditation – Medical colleges accredit hospitals to train doctors in a specialty (such as surgery).
Notifications about doctors – The Medical Board of Australia investigates notifications and complains about doctors, which can result in medical registration being revoked.
Hospital management – Hospitals have internal processes to monitor and review performance. States also monitor various quality measures and may intervene to manage poor performers.71
Registries – For specific procedures (such as hip replacements), or patient groups, clinical registries collect detailed information about patients, treatments and outcomes.
Medicare and PBS audits – The Department of Human Services identifies suspicious practices through Medicare and pharmaceutical billing data. Due to the limited information about patients’ health needs, it focuses mostly on consultation type and frequency rather than treatment choice.
70 The Australian Commission on Safety and Quality in Health Care developed the standards, but accreditation is done by internationally recognised bodies. 71 One measure of quality is the rate of adverse events (preventable conditions developed in hospital). For further discussion of public hospital governance see Duckett, et al. (2014).
State health departments should organise the reviews, perhaps inviting medical colleges to help design and staff them. The reviews should extend to private as well as public hospitals, since states license the former and fund the latter.
When external reviews find that a hospital is choosing the wrong treatments, it should be given concrete targets for improvement. A target could be to no longer provide do-not-do treatments, or to provide do-not-do-routinely procedures at a lower rate.
A hospital that fails to meet these targets should face serious consequences. Public hospitals should have their funding cut for ineffective treatments, or face other monitoring and sanctions in the state’s graded governance system.72
Private insurers should also have the option to withhold funding from these persistent outliers. This will require the Commonwealth to amend its legislation.73 Insurers could also notify their members about the risks of going to hospitals that have not improved after negative clinical review findings.
Figure 18 shows our proposed approach.
72 For a broader discussion of graded governance management, see ibid. 73 Legislation (Commonwealth of Australia (2007)) should allow insurers not to pay for care in hospitals that the HPPC identifies as outliers, provided that external clinical reviews do not support the relevant clinical practices.

Questionable care
Grattan Institute 2015 29
Figure 18: How to evaluate and manage outliers
Source: Grattan Institute
For outlier hospitals that do not improve, clinical evaluation must precede any funding or management change. Immediately cutting funding or other sanctions would be simpler, but is risky, for two reasons.
First, cuts could penalise variation that is legitimate. A hospital might specialise in rare and complex patients, resulting in unusual treatment patterns. Without a clinical review, the legitimate reason for variation would not come to light.
Second, cuts could lead to gaming. If there is a simple formula for funding cuts, clinicians might just change their reporting to get around it.74 Finally, cuts are likely to alienate clinicians. Health care professionals are more likely to respond to evaluations of quality by their peers than a financial sanction based on data alone.75
74 This may have happened in the US after Medicare de-funded knee arthroscopy for osteoarthritis (one of our do-not-dos). While the number of reported knee arthroscopies for osteoarthritis went down, the overall number of knee arthroscopies increased. It is not clear if this was due to changes in treatment choice, or merely changes in coding. See Katz, et al. (2014). 75 For a discussion of ‘policy alienation’ (where professionals who regularly interact with clients resist policy change due to disconnection from its development, implementation and/or objectives) see Tummers (2011); Tummers (2013). Our recommendations also reflect the view that health care regulation should be flexible and should seek to enhance, not replace, social cohesiveness, Chinitz (2002).
Identify outliers using HPPC data
Inform outliers that they are being closely monitored
No further action External clinical review
Are they still outliers the next
year?
YesNo
Does clinical review support
practices?
No further action Set clear targets for improvement
NoYes
Are targets met?
No further action
NoYes
Stop funding ineffective care and/or other sanctions

Questionable care
Grattan Institute 2015 30
Figure 19: Types of quality assurance - where the proposed clinical reviews fit in
Source: Adapted from Scrivens (2002)
6.2 Identifying outliers
Here we suggest some simple rules to identify outlier hospitals with troubling treatment patterns.
Do-not-do treatments happen in about a fifth of public hospitals.76 It makes sense to start with hospitals that provide them to a larger proportion of relevant patients – hospitals where there are most likely to be serious problems. Such an approach will also make 76 Our data release agreement precludes our identifying the names of public hospitals. We also cannot identify the proportion of private hospitals where do-not-do treatments occur because of the way the data were provided to us.
sure that only a manageable number of hospitals are being monitored.
All hospitals with an above-average rate of a do-not-do treatment should be considered outliers. Rates above zero but below the average are still a concern, but they could be due to data errors, or to using a do-not-do treatment as a last resort in very rare cases.
For treatments that should not be done routinely, more variation is legitimate. For these treatments, only hospitals that deviate greatly from normal patterns of care should be considered outliers. We suggest that only the 10 per cent of hospitals that are most likely to provide do-not-do routinely treatments be considered outliers.77
Based on these benchmarks, 126 hospital departments would be identified as outliers (Figure 20). The most in any one state is 33 in Victoria, followed by 25 in NSW (Figure 21). The figure would rise when more treatments were monitored (see Chapter 7). However, many hospitals would adopt more normal patterns of care once they were told they were outliers. The remainder might need a clinical review to look into the quality of care.
77 As explained above, these rates are only compared among hospitals that provide the relevant procedure and treat the relevant type of patient. Any outlier measure should be used with caution. For example, in the unlikely case of a do-not-do-routinely treatment with almost no variation in hospital treatment rates, outliers should not be selected using this rule (they would be very close to normal treatment patterns).
Expert assessmentAccreditation
Institutionalself-
assessment
Helpful commentary
External
Internal
Standards-based
Judgement-based
HPPC information supports existing efforts
Add new clinical reviews

Questionable care
Grattan Institute 2015 31
Figure 20: Do-not-do treatments (top) should have a different benchmark for do-not-do routinely treatments (bottom) Hospital departments that are above the benchmark
Do-not-do benchmark options: multiples of the average rate Hospital departments that are above the benchmark
Source: Grattan Institute analysis of NHMD
Figure 21: There are at most 35 outlier hospitals in any one state Outlier hospitals
Source: Grattan Institute analysis of NHMD
Figure 22: Outliers are in regional Australia as well as cities Outlier hospitals
Source: Grattan Institute analysis of NHMD
0
50
100
150
200
250
300
0 1 2 3 4 5 6 7 8 9 10
Proposed benchmark: 1 times the national average72 hospitals are above this level
All do-not-dos
0
200
400
600Proposed benchmark: top 10% 54 hospitals are above this level
Hospitals ranked by rate of do-not-do routinelyLowest Highest
Amniotomy
Episiotomy
Fundoplication
0
5
10
15
20
25
30
35
NSW VIC QLD WA SA TAS NT
Do-not do treatmentsDo-not-do routinely treatmentsBoth
Reason for being an outlier:
0
10
20
30
40
50
Cities Innerregional
Outerregional
Remote Very remote
Do-not do treatmentsDo-not-do routinely treatmentsBoth
Reason for being an outlier

Questionable care
Grattan Institute 2015 32
States are unlikely to launch clinical reviews for all do-not-do treatments, at least initially. Therefore they should put a priority on treatments and hospitals where more patients are affected, or where the procedure carries the greatest risk.
Initially, the focus should be on the handful of hospitals that do the bulk of do-not-do treatments (Figure 23). Of the treatments we measure, 72 per cent happen in just three hospitals in Tasmania, Queensland and Western Australia.78
Figure 23: Most do-not-do treatments we measured are concentrated in a small number of hospitals Cumulative share of do-not-do treatments
Source: Grattan Institute analysis of NHMD
78 Share of public hospital do-no-do procedures (hospital-level data were not available for private hospitals).
Looking into these hospitals first will target the bulk of the questionable care we measured. In these hospitals where more patients are affected we can also be more confident that high rates of do-not-do treatments reflect problems in treatment choices. In these cases, a one-off mistake, or a few errors in data entry, cannot have a big impact on the results.
Once hospitals with a high share of do-not-do treatments are reviewed, states should move on to other persistent outliers. This will be worthwhile even if they only do one or two such treatments a year. Failure to review these hospitals would leave people who visit smaller hospitals, especially in rural areas, with too little protection from inappropriate care.
Clinical reviews would only happen after hospitals are given information on how they compare, outliers are warned and given opportunities to improve. This means there are likely to be far fewer than 126 clinical reviews a year for the eight treatments that we examined. If there were only 40 across the country, the cost would be low – perhaps $430,000 a year.79
This figure may increase after more do-not-do treatments are identified and measured (see below). Yet some of the expenditure would probably be offset by reduced use of ineffective care. The rest would be a worthwhile investment in making sure that patients get the right treatment.
79 Assumes no use of existing resources to carry out the reviews. See the methodological supplement for more information on this explanation of this cost estimate.
0%
20%
40%
60%
80%
100%
0 10 20 30 40 50 60 70 80 90 100Hospitals (ranked from highest to lowest share of treatments)
Questionable care
Grattan Institute 2015 33
7. Measuring more and measuring better
This report has discussed eight examples of do-not-do and do-not-do-routinely treatments. But the problem of ineffective treatments is far larger. By using more data and drawing on more sources of guidance, the Australian Commission on Safety and Quality in Health Care can analyse more questionable care.
7.1 Using more data
We used a list of more than 1000 treatments, but could not measure most of them with the data we had. This shouldn’t stop the Commission, which should get all the major data sets on Medicare, medicines and hospital services.80 Using more data, the Commission will be able to measure more forms of questionable care. In the future, government can also collect new data, creating yet more opportunities to understand and improve health care.
7.1.1 Linking patient records
The Commission will be able to link patient records over time.81 It can also link patient records across different parts of the health system: hospitals, the Pharmaceutical Benefits Scheme and the Medicare Benefits Scheme.
Linking will let the Commission understand what happens to a patient over time. This is critical, because few treatments are 80 MBS and PBS data, the National Hospital Morbidity dataset and potentially clinical registry data. 81 We could not do this, due to restrictions in our data access agreement.
always inappropriate. Instead, appropriateness often depends on the patient’s medical and treatment history. An example is grommet surgeries in young children, which are inappropriate if antibiotics haven’t already been tried (see Box 9).
As a bonus, understanding patient histories will mean the Commission can measure readmissions, letting them track questionable care more accurately.82
In the 2015-16 Budget, the Government announced trials of opt-out personal electronic health records. Currently people have to sign up and only a small minority of Australians have.83 If the trials find ways to increase uptake by clinicians as well as patients, and to promote complete and reliable electronic records, these records could be an invaluable way to identify questionable care.
7.1.2 Including test results
To allow more types of questionable care to be measured, the next step is to add the results of blood tests and imaging (such as x-rays or MRI scans) to hospital, Medicare and PBS data. These results are already communicated electronically to health care providers.
82 We could not control for readmissions, so do-not-do rates are a percentage of hospital visits rather than the number of individual patients treated. 83 Rollins (2014)

Questionable care
Grattan Institute 2015 34
Box 9: Ineffective surgery for middle ear effusion in children
Fluid in the middle ear is a common health condition, especially among children. Delayed treatment was once thought to harm child development. Persistent cases were promptly treated with surgery that put a fluid-draining tube (a grommet) in the eardrum. But in 2001, new evidence showed that prompt surgical treatment had no developmental benefit for young children. Based on this evidence, surgery is considered inappropriate unless treatment with antibiotics has failed.84
As Figure 27 shows, the rate of grommet surgeries in Australia did not change much after this evidence was released. The national average stayed about the same, and huge variation persisted between the state with the highest rate (South Australia) and the jurisdiction with the lowest rate (Northern Territory).
We can’t know for sure whether those surgeries were inappropriate. Ear infections may have increased, or antibiotics may have proven ineffective more often, meaning the number of necessary surgeries was unchanged.
But by linking hospital and PBS records, the Commission could check how often children had the surgery without trying an antibiotic first – a do-not-do treatment.85
Using the approach in this report, the Commission could then find out if this happens more in some hospitals than in others, and which hospitals are outliers. By following the other recommendations in this report, the information could reduce expensive, risky and unnecessary surgeries on children.
Figure 24: New evidence may not have affected grommet surgeries Grommet surgeries per 1000 children aged 0-4
Source: Grattan Institute analysis of MBS data
84 Paradise, et al. (2001) 85 This would work best if the patient’s disease and treatment were also recorded as part of PBS dispensing, as discussed above.

Questionable care
Grattan Institute 2015 35
7.1.3 Tracking illnesses and treatments with Medicare and the PBS
Even once data are linked and test results are added, a big blind-spot will remain: health problems being treated outside hospitals. At present, when treatments are charged to the MBS or PBS, information about the patient’s gender and age are transmitted, but not his or her health conditions.
Providing this information would do more than allow the Commission to identify questionable procedures, testing and prescribing. Governments would know more about health problems and how they are being treated. It would be easier to identify and respond to health trends and health disparities.
Sending the information could be easy. About 95 per cent of primary care doctors already use electronic health records.86 Information on patient diseases could be transmitted just as easily as making online claims for Medicare benefits.
Despite this, gathering data about health problems outside hospitals is harder and more costly than the other two changes we propose. Health care providers will need to have an efficient, intuitive way to enter the data and may need training or financial incentives.87 As a longer-term and more complex change, we recommend a trial in two or three Primary Health Networks to make sure it is cost-effective.
86 Commonwealth Fund (2012) 87 As far as possible, this should standardise how illnesses and reasons for visits are recorded.
By using and linking more data, the Commission will be able to investigate many more do-not-do treatments. With the data we used for this report, an eighth of recent do-not-do guidelines from the UK’s NICE can be measured.88 With all the other data sources we recommend in this chapter, the Commission could measure nearly half (Figure 25).
Figure 25: The Australian Commission on Quality and Safety in Health Care can measure much more Do-not-do guidance that can be measured with different data sources
Source: National Institute for Health and Care Excellence
7.2 Using more sources of guidance
We only looked at a few sources of do-not-do advice. The Commission can use many more. It should start with the low
88 The National Centre for Health and Care Excellence. Our estimate is only based on the guidance released at the time of writing from January to October 2014.
00%
10%
20%
30%
40%
50%
Linked imaging and pathology results
MBS and PBS diagnosis data
Linked records from MBS, PBS, hospitals
Hospital records (used in this report)
Measurable with:

Questionable care
Grattan Institute 2015 36
hanging fruit: do-not-do treatments identified in comparable countries. Bodies such as the UK’s NICE have developed large lists of ineffective care in consultation with clinical experts. The Commission can also go further by exploring other sources of evidence, such as the thousands of systematic reviews produced by the Cochrane Collaboration.89
89 The Cochrane Collaboration has produced 6094 published reviews and 2357 protocols to date, although some of these are reviews of clinical practises rather than specific treatments.
Questionable care
Grattan Institute 2015 37
8. Conclusion
Each year, thousands of patients get treatments that cannot help them. The consequences are serious. Their original health problem remains and the intended cure might make them sicker.
This report presents a plan to stop ineffective treatments. The first step is to provide clear, consistent and up-to-date guidance about which treatments do not work. The second step is to track these treatments and report on where they happen.
National guidelines and reporting will not replace existing efforts to improve the quality of care. Instead, it will super-charge them, giving powerful new information to clinicians, managers, hospitals, medical colleges, insurers and state governments.
Information will help, but will not be enough on its own. This report confirms that a minority of hospitals have serious problems. Some of them will need a strong impetus to improve.
Expert clinical reviews should be targeted where they are most needed: at hospitals that provide questionable care more often than their peers do. If a clinical review finds that the wrong treatments are being chosen, and the hospital still fails to improve, funding for ineffective care should be withdrawn and the hospital’s management should be replaced.
Questionable care can be measured. This report only looked at a few procedures, but still found very troubling results. With more
resources, expertise and data, the Australian Commission on Quality and Safety in Health Care can extend the approach set out in this report much further. It can measure many more treatments that should not be done at all, or should not be done routinely. It can champion better measurement of care outside hospitals, so that our approach can spread to primary care.
The Commission can bring together expert clinical guidance and sophisticated measurement of patterns of care across the system. Linking guidance and measurement will provide a far richer picture of what is happening to patients in Australia.
In the future, the benefits will go far beyond finding treatments that should not be given. Marrying clinical expertise and evaluation of care can help improve the quality of care in other ways. It can illuminate gaps in access to care, show which treatments work best, and measure how good practices spread throughout the system.
Today, patients turning up to some hospitals face an unacceptable risk of getting the wrong treatment. We cannot hope to stop this unless we clearly define, measure and investigate questionable care. If we do not, we will be failing patients, who deserve to get the care they need.

Questionable care
Grattan Institute 2015 38
References
ABIM Foundation (2013) 'About', accessed 27 August 2013, from http://www.choosingwisely.org/about-us/
Alper, B. S., Hand, J. A., Elliott, S. G., Kinkade, S., Hauan, M. J., Onion, D. K. and Sklar, B. M. (2004) 'How much effort is needed to keep up with the literature relevant for primary care?', Journal of the Medical Library Association, 92(4), p 429
Australian Commission on Safety and Quality in Health Care (2013) Medical Practice Variation: Background Paper, Australian Commission on Safety and Quality in Health Care, accessed 7 Feb 2014, from http://www.safetyandquality.gov.au/wp-content/uploads/2013/10/SAQ110_Medical_Practice_variation_V10_WEB.pdf
Australian Commission on Safety and Quality in Health Care (2014) 'Clinical Care Standards', accessed 23 September 2014, from http://www.safetyandquality.gov.au/our-work/clinical-care-standards/
Baker, R., Camosso-Stefinovic, J., Gillies, C., Shaw, E. J., Cheater, F., Flottorp, S. and Robertson, N. (2010) 'Tailored interventions to overcome identified barriers to change: effects on professional practice and health care outcomes', 3(3),
Barton, M. B., Gabriel, G. S., Frommer, M. S., Holt, P. E. and Thompson, J. F. (2006) 'Surgical procedures for melanoma in public and private New South Wales hospitals, 2001–2002', ANZ journal of surgery, 76(5), p 318-324
Bayram, C., Britt, H., Miller, G. and Valenti, L. (2009) Evidence-practice gap in GP pathology test ordering: a comparison of BEACH pathology data and recommended testing, The University of Sydney (BEACH)
Bessen, T., Clark, R., Shakib, S. and Hughes, G. (2009) 'Quality improvement report: A multifaceted strategy for implementation of the Ottawa ankle rules in two emergency departments', BMJ: British Medical Journal, 339,
Birkmeyer, J. D., Reames, B. N., McCulloch, P., Carr, A. J., Campbell, W. B. and Wennberg, J. E. (2013) 'Understanding of regional variation in the use of surgery', The Lancet, 382(9898), p 1121-1129
Bismark, M. M., Walter, S. J. and Studdert, D. M. (2013) 'The role of boards in clinical governance: activities and attitudes among members of public
health service boards in Victoria', Australian Health Review, 37(5), p 682-687
Black, A. D., Car, J., Pagliari, C., Anandan, C., Cresswell, K., Bokun, T., McKinstry, B., Procter, R., Majeed, A. and A., S. (2011) 'The impact of eHealth on the quality and safety of health care: a systematic overview', PLoS Med, 8(1), p e1000387
Buchbinder, R., Osborne, R. H., Ebeling, P. R., Wark, J. D., Mitchell, P., Wriedt, C., Graves, S., Staples, M. P. and Murphy, B. (2009) 'A randomized trial of vertebroplasty for painful osteoporotic vertebral fractures', New England Journal of Medicine, 361(6), p 557-568
Burge, F., Kephart, G., Flowerdew, G., Putnam, W., Comeau, D., Whelan, A., Sketris, I. and Sclar, D. (2000) 'Physician characteristics in relation to cardiovascular drugs commonly prescribed for hypertension in Nova Scotia', The Canadian journal of clinical pharmacology= Journal canadien de pharmacologie clinique, 8(3), p 139-145
Byles, J. E., Mishra, G. and Schofield, M. (2000) 'Factors associated with hysterectomy among women in Australia', Health & Place, 6(4), p 301-308
Cassel, C. K. and Guest, J. A. (2012) 'Choosing wisely: helping physicians and patients make smart decisions about their care', JAMA, 307(17), p 1801-1802
Chinitz, D. (2002) 'Good and bad health sector regulation', in Regulating entrepreneurial behaviour in European health care systems, R. B. Saltman, R. Busse and E. Mossialos, Eds., Open University Press, p 56-72
Commonwealth Fund (2012) Commonwealth Fund International Health Policy Survey of Primary Care Physicians,
Commonwealth of Australia (2007) Private Health Insurance Act 2007, C2014C00383, accessed http://www.comlaw.gov.au/Details/C2014C00383,
Corlan, A. D. (2004) 'Medline trend: automated yearly statistics of PubMed results for any query', accessed 18 September 2014, from http://dan.corlan.net/medline-trend.html
Cutler, D., Skinner, J., Stern, A. D. and Wennberg, D. (2013) Physician beliefs and patient preferences: a new look at regional variation in health care

Questionable care
Grattan Institute 2015 39
spending, w19320), National Bureau of Economic Research Department of Human Services (2014) 'Auditing health and aged care services
and benefits', accessed 25 September 2014, from http://www.humanservices.gov.au/corporate/publications-and-resources/annual-report/resources/1213/chapter-07/auditing-health-and-aged-care-services-and-benefits
Doust, J. and Del Mar, C. (2004) 'Why do doctors use treatments that do not work?', BMJ, 328(7438), p 474-475
Duckett, S., Breadon, P., Weidmann, B. and Nicola, I. (2014) Controlling costly care: a billion-dollar hospital opportunity, Grattan Institute from http://grattan.edu.au/publications/reports/post/access-all-areas-new-solutions-for-gp-shortages-in-rural-australia/
Dunning, D., Johnson, K., Ehrlinger, J. and Kruger, J. (2003) 'Why people fail to recognize their own incompetence', Current Directions in Psychological Science, 12(3), p 83-87
Dutton, P. and Cormann, M. (2014) Improving Productivity And Performance In The Health Care Sector, accessed 28 August 2014, from http://www.financeminister.gov.au/media/2014/mr_2014-40.html
Elshaug, A. G., Moss, J. R., Littlejohns, P., Karnon, J., Merlin, T. L. and Hiller, J. E. (2009) 'Identifying existing health care services that do not provide value for money', Medical Journal of Australia, 190(5), p 269-273
Elshaug, A. G., Watt, A. M., Mundy, L. and Willis, C. D. (2012) 'Over 150 potentially low-value health care practices: an Australian study', Med J Aust, 197(10), p 556-560
Evans, R. G. (1990) 'The Dog in the Night-time: Medical Practise Variations and Health Policy', in The Challenges of Medical Practise Variations, T. F. Andersen and G. Mooney, Eds., MacMillan Press, p 117-152
Filan, P. M., Inder, T. E., Anderson, P. J., Doyle, L. W. and Hunt, R. W. (2007) 'Monitoring the neonatal brain: a survey of current practice among Australian and New Zealand neonatologists', Journal of paediatrics and child health, 43(7‐8), p 557-559
Forte, M. L., Virnig, B. A., Kane, R. L., Durham, S., Bhandari, M., Feldman, R. and Swiontkowski, M. F. (2008) 'Geographic variation in device use for intertrochanteric hip fractures', The Journal of Bone & Joint Surgery, 90(4), p 691-699
Gallego, G., Haas, M., Hall, J. and Viney, R. (2010) Reducing the use of ineffective health care interventions, Centre for Health Economics Research and Evaluation, University of Technology Sydney
García, L. M., Sanabria, A. J., Álvarez, E. G., Trujillo-Martín, M. M., Etxeandia-Ikobaltzeta, I., Kotzeva, A., Rigau, D. and Alonso-Coello, P. (2014) 'The validity of recommendations from clinical guidelines: a survival analysis', Canadian Medical Association Journal, 140547,
Garg, A. X., Adhikari, N. K., McDonald, H., Rosas-Arellano, M. P., Devereaux, P. J., Beyene, J., Sam, J. and R.B., H. (2005) 'Effects of computerized clinical decision support systems on practitioner performance and patient outcomes: a systematic review', Jama, 293(10), p 1223-1238
Garg, A. X., Iansavichus, A. V., Kastner, M., Walters, L. A., Wilczynski, N., McKibbon, K. A., Yang, R. C., Rehman, F. and R.B., H. (2006) 'Lost in publication: Half of all renal practice evidence is published in non-renal journals', Kidney International, 70(11),
Gawande, A. (2010) The checklist manifesto: how to get things right, New York: Metropolitan Books.
Grol, R. and Grimshaw, J. (2003) 'From best evidence to best practice: effective implementation of change in patients' care', The Lancet, 362(9391), p 1225-1230
Grol, R. and Wensing, M. (2004) 'What drives change? Barriers to and incentives for achieving evidence-based practice', The Medical Journal of Australia, 180(6 Suppl ), p S57-60
Grol, R., Wensing, M., Eccles, M. and Davis, D. (2013) Improving patient care: the implementation of change in health care, John Wiley & Sons
Haas, M., Hall, J., Viney, R. and Gallego, G. (2012) 'Breaking up is hard to do: why disinvestment in medical technology is harder than investment', Australian Health Review, 36(2), p 148-152
Hickie, I. B., Scott, E. M. and Davenport, T. A. (1999) 'Are Antidepressants All the Same? Surveying the Opinions of Australian Psychiatrists', Australian and New Zealand Journal of Psychiatry, 33(5), p 642-649
Ibargoyen-Roteta, N., Gutiérrez-Ibarluzea, I. and Asua, J. (2010) 'Guiding the process of health technology disinvestment', Health Policy, 98(2), p 218-226
Ilett, P. A., Brock, K. A., Graven, C. J. and Cotton, S. M. (2010) 'Selecting patients for rehabilitation after acute stroke: are there variations in practice?', Archives of physical medicine and rehabilitation, 91(5), p 788-793
Janus, E. D., Tideman, P. A., Dunbar, J. A., Kilkkinen, A., Bunker, S. J., Philpot, B., Tirimacco, R., Mc Namara, K., Heistaro, S. and Laatikainen, T. (2010) 'Dyslipidaemia in rural Australia: prevalence, awareness, and

Questionable care
Grattan Institute 2015 40
adherence to treatment guidelines in the Greater Green Triangle Risk Factor Study', Medical Journal of Australia, 192(3), p 127
Kallmes, D. F., Comstock, B. A., Heagerty, P. J., Turner, J. A., Wilson, D. J., Diamond, T. H., Edwards, R., Gray, L. A., Stout, L. and Owen, S. (2009) 'A randomized trial of vertebroplasty for osteoporotic spinal fractures', New England Journal of Medicine, 361(6), p 569-579
Katz, J. N., Brownlee, S. A. and Jones, M. H. (2014) 'The role of arthroscopy in the management of knee osteoarthritis', Best Practice & Research Clinical Rheumatology, 28(1), p 143-156
Kawamoto, K., Houlihan, C. A., Balas, E. A. and Lobach, D. F. (2005) 'Improving clinical practice using clinical decision support systems: a systematic review of trials to identify features critical to success', BMJ: British Medical Journal, 330(7494), p 765
Khan, M., Evaniew, N., Bedi, A., Ayeni, O. R. and Bhandari, M. (2014) 'Arthroscopic surgery for degenerative tears of the meniscus: a systematic review and meta-analysis', Canadian Medical Association Journal, 186(14), p 1057-1064
Kirkley, A., Birmingham, T. B., Litchfield, R. B., Giffin, J. R., Willits, K. R., Wong, C. J., Feagan, B. G., Donner, A., Griffin, S. H. and D'Ascanio, L. M. (2008) 'A randomized trial of arthroscopic surgery for osteoarthritis of the knee', New England Journal of Medicine, 359(11), p 1097-1107
Lobach, D., Sanders, G. D., Bright, T. J., Wong, A., Dhurjati, R., Bristow, E. and Bastian, L. (2012) Enabling health care decisionmaking through clinical decision support and knowledge management, Agency for Healthcare Research and Quality (US)
Main, C., Moxham, T., Wyatt, J. C., Kay, J., Anderson, R. and Stein, K. (2010) 'Computerised decision support systems in order communication for diagnostic, screening or monitoring test ordering: systematic reviews of the effects and cost-effectiveness of systems', Health Technology Assessment, 14(48), p 1-227
Maxwell, D. J., McIntosh, K. A., Pulver, L. K. and Easton, K. L. (2005) 'Empiric management of community-acquired pneumonia in Australian emergency departments', The Medical Journal of Australia, 183(10), p 520-524
Morden, N. E., Chang, C.-H., Jacobson, J. O., Berke, E. M., Bynum, J. P., Murray, K. M. and Goodman, D. C. (2012) 'End-of-life care for Medicare beneficiaries with cancer is highly intensive overall and varies widely', Health Affairs, 31(4), p 786-796
Moseley, J. B., O'Malley, K., Petersen, N. J., Menke, T. J., Brody, B. A., Kuykendall, D. H., Hollingsworth, J. C., Ashton, C. M. and Wray, N. P. (2002) 'A controlled trial of arthroscopic surgery for osteoarthritis of the knee', New England Journal of Medicine, 347(2), p 81-88
MSAC (1999a) Photodynamic therapy for skin and mucosal cancer, MSAC application 1008: assessment report, Commonwealth Department of Health and Aged Care from http://www.msac.gov.au/internet/msac/publishing.nsf/Content/481C1934BF7C8722CA2575AD0082FDB5/$File/1008-One-page-summary.pdf
MSAC (1999b) Placement of artificial bowel sphincters in the management of faecal incontinence, MSAC application 1023: final assessment report, Commonwealth Department of Health and Aged Care from http://www.msac.gov.au/internet/msac/publishing.nsf/Content/65FDE5432999601BCA2575AD0082FDBC/$File/1023-Placement-of-artificial-bowel-sphincters-Assessment-Report.pdf
MSAC (1999c) Samarium153-lexidronam for pain due to skeletal metastases, MSAC application 1016: final assessment report, Commonwealth Department of Health and Aged Care from http://www.msac.gov.au/internet/msac/publishing.nsf/Content/00A19AF1970CCC68CA2575AD0082FDAC/$File/1016%20-%20Samarium153-lexidronam%20for%20bone%20pain%20due%20to%20skeletal%20metastases%20Report.pdf
MSAC (1999d) Transmyocardial laser revascularisation, MSAC application 1004: final assessment report, Commonwealth Department of Health and Aged Care from http://www.msac.gov.au/internet/msac/publishing.nsf/Content/3760A79DC27ACE2ECA2575AD0082FDB2/$File/1004%20-%20Transmyocardial%20laser%20Revascularisation%20Report.pdf
MSAC (2000a) Gamma knife radiosurgery, MSAC application 1028: assessment report, Commonwealth Department of Health and Aged Care from http://www.msac.gov.au/internet/msac/publishing.nsf/Content/12C5978F6F65151CCA2575AD0082FDA9/$File/1028-Gamma-knife-radiosurgery-Assessment-Report.pdf
MSAC (2000b) Hyperbaric Oxygen Therapy, Medical Services Advisory Committee, accessed 19th November 2014, from http://www.msac.gov.au/internet/msac/publishing.nsf/Content/7FAEE14EE6716C86CA2575AD0082FDBB/$File/1018%20-%201020%20-%20Hyperbaric%20Oxygen%20Therapy%20Report.pdf

Questionable care
Grattan Institute 2015 41
MSAC (2000c) Hyperbaric oxygen therapy, MSAC applications 1018 – 1020: assessment report, Commonwealth Department of Health and Aged Care from http://www.msac.gov.au/internet/msac/publishing.nsf/Content/7FAEE14EE6716C86CA2575AD0082FDBB/$File/1018%20-%201020%20-%20Hyperbaric%20Oxygen%20Therapy%20Report.pdf
MSAC (2001) Lung volume reduction surgery, MSAC application 1011: assessment report, Commonwealth Department of Health and Ageing from http://www.msac.gov.au/internet/msac/publishing.nsf/Content/30B2431500241D03CA2575AD0082FDB8/$File/1011%20-%20Lung%20Volume%20Reduction%20Surgery%20Report.pdf
MSAC (2002a) Intravascular Brachytherapy for Coronary Artery Restenoses, MSAC application 1041: assessment report, Commonwealth Department of Health and Ageing from http://www.msac.gov.au/internet/msac/publishing.nsf/Content/D823A65D3D66D9B5CA2575AD0082FDC5/$File/1041-Assessment-Report.pdf
MSAC (2002b) Photodynamic therapy for Verteporfin (Visudyne) for Subfoveal choroidal neovascularisations, Commonwealth Department of Health and Ageing from http://www.msac.gov.au/internet/msac/publishing.nsf/Content/app1063-1
MSAC (2003) Radiofrequency ablation of liver tumours, MSAC application 1052: assessment report, Commonwealth Department of Health and Ageing from http://www.msac.gov.au/internet/msac/publishing.nsf/Content/F63A2CA546D443FDCA2575AD0082FCB1/$File/1052-Assessment-Report.pdf
MSAC (2004) Multifocal multi-channel objective perimetry for the diagnosis of visual field defects, MSAC application 1078: assesment report, Commonwealth Department of Health and Ageing from http://www.msac.gov.au/internet/msac/publishing.nsf/Content/2DDA3BDF96EDC1EBCA2575AD0082FD1A/$File/1078-Assessment-Report.pdf
MSAC (2005) SIR-Spheres for the treatment of non-resectable liver tumours, MSAC application 1082: assessment report, Commonwealth Department of Health and Ageing from http://www.msac.gov.au/internet/msac/publishing.nsf/Content/A15BECAA85C884E9CA2575AD0082FD4C/$File/1082-Assessment-Report.pdf
MSAC (2006a) Artificial Intervertebral Disc Replacement, MSAC application 1090: assessment report, Commonwealth Department of Health and Ageing from http://www.msac.gov.au/internet/msac/publishing.nsf/Content/916085423E76BD9ACA2575AD0082FD05/$File/1090-Assessment-Report.pdf
MSAC (2006b) Endovascular neurointerventional procedures, MSAC Assessment 1093: assessment report, Commonwealth Department of Health and Ageing from http://www.msac.gov.au/internet/msac/publishing.nsf/Content/98138C87DCF64D9FCA2575AD0082FD4A/$File/1093-Assessment-Report.pdf
MSAC (2007) Cryotherapy for Recurrent Prostate Cancer and Renal Cancer, Commonwealth Department of Health and Ageing from http://www.msac.gov.au/internet/msac/publishing.nsf/Content/app1124-1
MSAC (2008a) Intragastric balloons for the temporary management of morbid obesity, MSAC application 1112: assessment report, Commonwealth Department of Health and Ageing from http://www.msac.gov.au/internet/msac/publishing.nsf/Content/9A81A1758938DD5ACA2575AD0082FD0E/$File/1112-Assessment-Report.pdf
MSAC (2008b) Sacral Nerve Stimulation for Urinary Indications, MSAC application 1115: assessment report, Commonwealth Department of Health and Ageing from http://www.msac.gov.au/internet/msac/publishing.nsf/Content/13DCF10444FC50CECA2575AD0082FDD2/$File/1115-Assessment-Report.pdf
MSAC (2008c) Vagus nerve stimulation for epilepsy, MSAC application 1118: assessment report, Commonwealth Department of Health and Ageing from http://www.msac.gov.au/internet/msac/publishing.nsf/Content/82446F032F4B0530CA2575AD0082FD51/$File/1118-Assessment-Report.pdf
MSAC (2011) Review of interim funded service: Vertebroplasty and New review of Kyphoplasty, MSAC reference no 27.1, Commonwealth Department of Health and Ageingfrom http://www.msac.gov.au/internet/msac/publishing.nsf/content/0A8B7AF67EA9D41FCA25766A000DBBEA/$File/27.1%20Assessment%20report%20for%20public%20release%2019-11-11.pdf =
National Health and Medical Research Council (2014) Annual Report on Australian Clinical Practice Guidelines, National Health and Medical Research Council from

Questionable care
Grattan Institute 2015 42
www.nhmrc.gov.au/guidelines/publciations/nh165 National Institute for Health and Care Excellence (2007a) Heavy Menstrual
Bleeding, accessed 19th November 2014, from http://www.nice.org.uk/guidance/cg44/resources/guidance-heavy-menstrual-bleeding-pdf
National Institute for Health and Care Excellence (2007b) Laparoscopic uterine nerve ablation (LUNA) for chronic pelvic pain, National Institute for Health and Care Excellence,, accessed 19th November 2014, from http://www.nice.org.uk/guidance/ipg234/resources/guidance-laparoscopic-uterine-nerve-ablation-luna-for-chronic-pelvic-pain-pdf
National Institute for Health and Care Excellence (2010) Lower urinary tract symptoms, National Institute for Health and Care Excellence, accessed 19th November 2014, from http://pathways.nice.org.uk/pathways/lower-urinary-tract-symptoms-in-men
NICE (2004) NICE Clinical Guideline 17: Dyspepsia: Management of dyspepsia in adults in primary care, National Institute for Health and Care Excellence from https://www.nice.org.uk/guidance/cg17/resources/guidance-dyspepsia-management-of-dyspepsia-in-adults-in-primary-care-pdf
NICE (2007a) NICE Clinical Guideline 44: Heavy menstrual bleeding, National Institute for Health and Care Excellence from http://www.nice.org.uk/guidance/cg44/resources/guidance-heavy-menstrual-bleeding-pdf
NICE (2007b) NICE Clinical Guideline 55: Care of healthy women and their babies during childbirth, National Institute for Health and Care Excellence from http://www.nice.org.uk/guidance/cg55/resources/guidance-intrapartum-care-pdf
NICE (2007c) NICE interventional procedure guidance 234: Laparoscopic uterine nerve ablation for chronic pelvic pain, National Institute for Health and Clinical Excellence from http://www.nice.org.uk/guidance/ipg234/resources/guidance-laparoscopic-uterine-nerve-ablation-luna-for-chronic-pelvic-pain-pdf
NICE (2010) NICE Clinical Guideline 97: The management of lower urinary tract symptoms in men, National Institute for Health and Care Excellence from http://www.nice.org.uk/guidance/cg97/resources/guidance-lower-urinary-tract-symptoms-pdf
OECD (2014) Geographic Variations in Health Care: What Do We Know and
What Can Be Done to Improve Health System Performance?, OECD from http://www.oecd.org/els/health-systems/medical-practice-variations.htm
Paradise, J. L., Feldman, H. M., Campbell, T. F., Dollaghan, C. A., Colborn, D. K., Bernard, B. S., Rockette, H. E., Janosky, J. E., Pitcairn, D. L. and Sabo, D. L. (2001) 'Effect of early or delayed insertion of tympanostomy tubes for persistent otitis media on developmental outcomes at the age of three years', New England Journal of Medicine, 344(16), p 1179-1187
Pham, C., Caffrey, O., Ben-Tovim, D., Hakendorf, P., Crotty, M. and Karnon, J. (2012) 'Evaluating the effects of variation in clinical practice: a risk adjusted cost-effectiveness (RAC-E) analysis of acute stroke services', BMC health services research, 12(1), p 266
Phelps, C. E. (1992) 'Diffusion of Information in Medical Care', Journal of Economic Perspectives, 6(3), p 23-42
Prasad, V., Vandross, A., Toomey, C., Cheung, M., Rho, J., Quinn, S., Chacko, S. J., Borkar, D., Gall, V. and Selvaraj, S. (2013) A decade of reversal: an analysis of 146 contradicted medical practices, Mayo Clinic Proceedings
Queensland Health (2013) Disinvestment in Australia and New Zealand, Health Policy Advisory Committee on Technology from http://www.health.qld.gov.au/healthpact/docs/papers/workshop/disinvestment-report.pdf
Richardson, J. R. J. (2001) A GODS Analysis of Medicare: Goals, Obstacles, Deficiencies, Solutions; Or, In what Form Should We Adopt Managed Care?, National Centre for Health Program Evaluation
Rollins, A. (2014) Govt considers opt-out clause in e-health overhaul, accessed 19th November 2014, from https://ama.com.au/ausmed/govt-considers-opt-out-clause-e-health-overhaul
Roshanov, P. S., Fernandes, N., Wilczynski, J. M., Hemens, B. J., You, J. J., Handler, S. M. and Nieuwlaat, R. (2013) 'Features of effective computerised clinical decision support systems: meta-regression of 162 randomised trials', BMJ: British Medical Journal, 346,
Runciman, W. B., Hunt, T. D., Hannaford, N. A., Hibbert, P. D., Westbrook, J. I., Coiera, E. W., Day, R. O., Hindmarsh, D. M., McGlynn, E. A. and Braithwaite, J. (2012) 'CareTrack: assessing the appropriateness of health care delivery in Australia', Medical Journal of Australia, 197(10), p 549

Questionable care
Grattan Institute 2015 43
Schmidt, D. E. (2012) 'The development of a disinvestment framework to guide resource allocation decisions in health service delivery organizations', Master of Science, Health Care and Epidemiology, University of British Colombia
Scott, I. (2009) 'What are the most effective strategies for improving quality and safety of health care?', Internal medicine journal, 39(6), p 389-400
Scrivens, E. (2002) 'Accreditation and the regulation of quality in health services', in Regulating entrepreneurial behaviour in European health care systems, R. B. Saltman, R. Busse and E. Mossialos, Eds., Open University Press, p 91-105
Sepucha, K., Ozanne, E. and Mulley, A. G. (2006) 'Doing the right thing: systems support for decision quality in cancer care', Annals of behavioral medicine : a publication of the Society of Behavioral Medicine, 32(3), p 172-178
Sheiner, L. (2014) Why the geographic variation in health care spending can't tell us much about the efficiency or quality of our health care system, Brookings Institution, accessed 19 September 2014, from http://www.brookings.edu/~/media/projects/bpea/fall%202014/fall2014bpea_sheiner.pdf
Shojania, K. G. and Grimshaw, J. M. (2005) 'Evidence-based quality improvement: the state of the science', Health Affairs, 24(1), p 138-150
Sox, H., McNeil, B., Eden, J. and Wheatley, B. (2008) Knowing What Works in Health Care: A Roadmap for the Nation, National Academies Press
Steering Committee for the Review of Government Service Provision (2014) Report on Government Services Volume E: Health, Productivity Commission, accessed 15 July 2014, from http://www.pc.gov.au/__data/assets/pdf_file/0019/132346/rogs-2014-volumee-health.pdf
Tummers, L. (2011) 'Explaining the willingness of public professionals to implement new policies: A policy alienation framework. International Review of Administrative Sciences', International Review of Administrative Sciences, 77(3), p 555-581
Tummers, L. (2013) Policy alienation and the power of professionals: Confronting new policies, Edward Elgar Publishing
Wennberg, J., Freeman, J. and Culp, W. (1987) 'Are hospital services rationed in New Haven or over-utilised in Boston?', The Lancet, 329(8543), p 1185-1189
Williams, C. M., Maher, C. G., Hancock, M. J., McAuley, J. H., McLachlan, A. J., Britt, H., Fahridin, S., Harrison, C. and Latimer, J. (2010) 'Low back pain and best practice care: a survey of general practice physicians', Archives of Internal Medicine, 170(3), p 271-277
Wolfson, D., Santa, J. and Slass, L. (2014) 'Engaging Physicians and Consumers in Conversations About Treatment Overuse and Waste: A Short History of the Choosing Wisely Campaign', Academic Medicine,
Zezza, M. A., Audet, A.-M. J. and Hall, D. (2014) 'Incentives 2.0: A Synergistic Approach to Provider Incentives', from http://www.commonwealthfund.org/publications/blog/2014/jul/synergistic-approach-provider-incentives