Quester: A Speech Based Question Answering Support System for … · 2020-04-21 · Quester: A...
11
Quester: A Speech-Based Question Answering Support System for Oral Presentations Reza Asadi, Ha Trinh, Harriet J. Fell, Timothy W. Bickmore Northeastern University Boston, USA asadi, hatrinh, fell, [email protected] ABSTRACT Current slideware, such as PowerPoint, reinforces the delivery of linear oral presentations. In settings such as question answering sessions or review lectures, more extemporaneous and dynamic presentations are required. An intelligent system that can automatically identify and display the slides most related to the presenter’s speech, allows for more speaker flexibility in sequencing their presentation. We present Quester, a system that enables fast access to relevant presentation content during a question answering session and supports nonlinear presentations led by the speaker. Given the slides’ contents and notes, the system ranks presentation slides based on semantic closeness to spoken utterances, displays the most related slides, and highlights the corresponding content keywords in slide notes. The design of our system was informed by findings from interviews with expert presenters and analysis of recordings of lectures and conference presentations. In a within-subjects study comparing our dynamic support system with a static slide navigation system during a question answering session, presenters expressed a strong preference for our system and answered the questions more efficiently using our system. Author Keywords Presentation assistance; question answering support systems; natural language and speech processing. ACM Classification Keywords H.5.2. Information Interfaces and Presentation (e.g. HCI): User Interfaces. INTRODUCTION Conventional presentation tools, such as PowerPoint and Keynote, are designed to support presenters in doing what they do best, deliver standard, scripted, linear, and rehearsed presentations in a polished, but fixed and invariant manner. Unfortunately, these tools do not provide good support for speakers who want to deliver more extemporaneous talks in which they dynamically adapt their presentation to input or questions from the audience, evolving audience needs, or other contextual factors such as varying or indeterminate presentation time, real-time information, or more improvisational or experimental formats. At best, current slideware only provides simple indexing mechanisms to let speakers hunt through their slides for material to support their dynamically evolving speech, and speakers must perform this frantic search while the audience is watching and waiting. Perhaps the most common situations in which speakers must provide such dynamic presentations are in Question and Answer (QA) sessions at the end of their prepared presentations. Speakers' remarks are entirely driven by the questions from the audience, which arrive in an unscripted order, and the questions themselves are often entirely unanticipated. A significant portion of these QA sessions is often taken up by the speaker searching through their slides for material to support their responses. Several solutions have been developed to support non- linear, dynamic presentations [6, 12, 17]. However, they require authoring of pre-planned paths and multiple branches in presentation scripts. An alternative approach is to dynamically offer branching options in real time based on tracking of the presenter’s speech content, thereby eliminating the need for prior preparation. However, incorporating speech input is challenging as it depends on the accuracy of automatic speech recognition (ASR) and the speech during QA sessions is generally spontaneous. In this effort, our aim is to develop slideware technology to support these dynamic speaker-led presentations, by having a system track the presenter's speech and automatically index supporting slides in real time. Our system, called Quester, matches a presenter's speech to slides based on slide contents and notes, and presents the top-ranked slides along with content keywords to the presenter so he or she only has to skim a handful of the most relevant slides and click on the one they want to show. We evaluated Quester in simulated post-presentation QA sessions, but it can be used to support any kind of speaker-led dynamically- structured presentation, such as a lecture on a subset of topics in a slide deck based on student or audience requests. Our contributions include: Permission to make digital or hard copies of all or part of this work for personal or classroom use is granted without fee provided that copies are not made or distributed for profit or commercial advantage and that copies bear this notice and the full citation on the first page. Copyrights for components of this work owned by others than ACM must be honored. Abstracting with credit is permitted. To copy otherwise, or republish, to post on servers or to redistribute to lists, requires prior specific permission and/or a fee. Request permissions from [email protected]. IUI'18, March 7–11, 2018, Tokyo, Japan © 2018 Association for Computing Machinery. ACM ISBN 978-1-4503-4945-1/18/03…$15.00 https://doi.org/10.1145/3172944.3172974
Transcript of Quester: A Speech Based Question Answering Support System for … · 2020-04-21 · Quester: A...

Quester: A Speech-Based Question Answering Support System for Oral Presentations
Reza Asadi, Ha Trinh, Harriet J. Fell, Timothy W. Bickmore
Northeastern University
Boston, USA
asadi, hatrinh, fell, [email protected]
ABSTRACT
Current slideware, such as PowerPoint, reinforces the
delivery of linear oral presentations. In settings such as
question answering sessions or review lectures, more
extemporaneous and dynamic presentations are required.
An intelligent system that can automatically identify and
display the slides most related to the presenter’s speech,
allows for more speaker flexibility in sequencing their
presentation. We present Quester, a system that enables fast
access to relevant presentation content during a question
answering session and supports nonlinear presentations led
by the speaker. Given the slides’ contents and notes, the
system ranks presentation slides based on semantic
closeness to spoken utterances, displays the most related
slides, and highlights the corresponding content keywords
in slide notes. The design of our system was informed by
findings from interviews with expert presenters and
analysis of recordings of lectures and conference
presentations. In a within-subjects study comparing our
dynamic support system with a static slide navigation
system during a question answering session, presenters
expressed a strong preference for our system and answered
the questions more efficiently using our system.
Author Keywords
Presentation assistance; question answering support
systems; natural language and speech processing.
ACM Classification Keywords
H.5.2. Information Interfaces and Presentation (e.g. HCI):
User Interfaces.
INTRODUCTION Conventional presentation tools, such as PowerPoint and
Keynote, are designed to support presenters in doing what
they do best, deliver standard, scripted, linear, and
rehearsed presentations in a polished, but fixed and
invariant manner. Unfortunately, these tools do not provide
good support for speakers who want to deliver more
extemporaneous talks in which they dynamically adapt their
presentation to input or questions from the audience,
evolving audience needs, or other contextual factors such as
varying or indeterminate presentation time, real-time
information, or more improvisational or experimental
formats. At best, current slideware only provides simple
indexing mechanisms to let speakers hunt through their
slides for material to support their dynamically evolving
speech, and speakers must perform this frantic search while
the audience is watching and waiting.
Perhaps the most common situations in which speakers
must provide such dynamic presentations are in Question
and Answer (QA) sessions at the end of their prepared
presentations. Speakers' remarks are entirely driven by the
questions from the audience, which arrive in an unscripted
order, and the questions themselves are often entirely
unanticipated. A significant portion of these QA sessions is
often taken up by the speaker searching through their slides
for material to support their responses.
Several solutions have been developed to support non-
linear, dynamic presentations [6, 12, 17]. However, they
require authoring of pre-planned paths and multiple
branches in presentation scripts. An alternative approach is
to dynamically offer branching options in real time based
on tracking of the presenter’s speech content, thereby
eliminating the need for prior preparation. However,
incorporating speech input is challenging as it depends on
the accuracy of automatic speech recognition (ASR) and the
speech during QA sessions is generally spontaneous.
In this effort, our aim is to develop slideware technology to
support these dynamic speaker-led presentations, by having
a system track the presenter's speech and automatically
index supporting slides in real time. Our system, called
Quester, matches a presenter's speech to slides based on
slide contents and notes, and presents the top-ranked slides
along with content keywords to the presenter so he or she
only has to skim a handful of the most relevant slides and
click on the one they want to show. We evaluated Quester
in simulated post-presentation QA sessions, but it can be
used to support any kind of speaker-led dynamically-
structured presentation, such as a lecture on a subset of
topics in a slide deck based on student or audience requests.
Our contributions include:
Permission to make digital or hard copies of all or part of this work for personal or classroom use is granted without fee provided that copies are
not made or distributed for profit or commercial advantage and that copies
bear this notice and the full citation on the first page. Copyrights for components of this work owned by others than ACM must be honored.
Abstracting with credit is permitted. To copy otherwise, or republish, to
post on servers or to redistribute to lists, requires prior specific permission and/or a fee. Request permissions from [email protected].
IUI'18, March 7–11, 2018, Tokyo, Japan © 2018 Association for Computing Machinery.
ACM ISBN 978-1-4503-4945-1/18/03…$15.00
https://doi.org/10.1145/3172944.3172974

1. Identification of current practices and requirements for
dynamic presentations, through analysis of interviews
with expert presenters and recordings of existing QA
sessions;
2. Development of the Quester system to automatically
suggest and display presentation content based on
speech;
3. Validation of Quester in a comparative study that
demonstrates its potential to improve the presenter’s
experience and performance during QA sessions,
compared to standard slideware practice.
RELATED WORK
We review previous work regarding slideware support for
non-linear and dynamic presentation, and current advances
in QA support systems.
Non-Linear Presentations
Experts such as Tufte [18], criticize the linear structure of
PowerPoint presentations and argue that although it helps
the presenter, it is not “audience-oriented” and can reduce
the overall quality of the presentations. The “sequentiality”
of slides makes it difficult to display them in arbitrary
orders, and thus may discourage presenters from navigating
to related slides in order to respond to the audience
questions during the presentation [22]. In contrast, free-
form presentations can encourage discussions, creative
thinking, and communication of new ideas [8].
QA sessions are a common setting for dynamic
presentations. Anthony et al. [1] reported their observations
of presenter performance during QA sessions in conference
talks, which can inform the design of QA support systems.
They observed the tendency of question askers to refer to
something that was mentioned in the presentation before
asking their question, and that presenters often repeat or
rephrase questions before answering, as recommended in
self-help presentation books.
Presentation Support Systems
Previous research has developed novel presentation systems
to support a more dynamic approach to presenting. One of
the challenges in designing these systems is to avoid
distraction and excessive cognitive load that dynamic
interfaces may cause [7]. Moskovich et al. [12] developed
an interface for authoring and delivering customizable
presentations using a hierarchical presentation structure and
predefined paths. During delivery, the presenter can change
the presentation path based on audience feedback or time
constraints. The NextSlidePlease system [17] provides a
graph-based authoring system and a presentation path
suggestion algorithm to support interactive presentations. It
helps users prioritize presentation content based on
remaining time during presentation delivery. Using the
HyperSlides system [6], presenters can author hierarchical
hyperlinked non-linear presentation slides. Finally, the
Palette [13] and PaperPoint [16] systems use paper-based
slide cards to provide random access to single digital slides.
One of the main challenges in providing automated support
for non-linear presentations is capturing speakers’ dynamic
and evolving communicative intent during delivery.
Inferring intent from the presenters’ speech content is an
ideal approach, since it requires no additional effort by the
speaker. There have been limited studies on taking
advantage of the presenter’s speech content to support
presentations. Rogina et al. [15] matched speech transcripts
with slide content to automatically advance slides and
display additional related documents. IntelliPrompter [3] is
a speech-based note display system that tracks a presenter’s
coverage of slide notes and cues them about their next
speaking point.
Related Information Retrieval Methods
Studies in audio lecture indexing and retrieval have
explored methods for matching voice data with text
sources, which can be used in non-linear presentation
support systems. Yamamoto et al. [20] compared the results
of ASR with the textbook used in the lecture to segment
lecture recordings into topics. They calculated the similarity
between word vectors from the speech transcript and the
textbook. Yang et al. [21] extracted keywords from video
lectures using the ASR output and text information
extracted from videos. Cao et al. [5] associated the text
extracted from PowerPoint slides with lecture videos to
support video-based QA on videotaped lectures.
Several related studies have used information retrieval
techniques for automatic question answering. Yen et al.
[23] evaluated a context-ranking model used for QA. The
ranking was performed by predicting the relevancy of the
input passage to a given question using features such as part
of speech, named-entity class, and the degree of match
between the passage words and question terms. Yih et al.
[24] measured the semantic similarity of entities and
relations extracted from questions with the content of the
knowledge base to perform open domain QA. Semantic
parsing was performed using a neural network-based
semantic model.
To our knowledge, there have been no studies to date that
investigate the application of speech-based content
suggestions to support dynamic presentations in real time.
FORMATIVE STUDIES
To enrich our understanding of dynamic presentations, we
conducted interviews exploring current practices of
preparing and delivering extemporaneous talks. We
supplemented our qualitative research with a quantitative
analysis of post-presentation QA sessions from videotaped
conference presentations and lectures.
Interviews of Expert Presenters
We recruited 8 university professors (4 female, 4 male, P1-
8) from computer science and history departments. All
participants had extensive experience giving presentations
in various settings, from conference presentations to
classroom lectures, seminars, workshops and panel

discussions. We conducted semi-structured interviews with
open-ended questions about general presentation
preparation and delivery practices, potential issues of linear
presentations, and strategies for dynamic presentation
support. Each interview lasted between 30-45 minutes.
The interviews were recorded, transcribed and coded using
thematic analysis techniques [4]. Our initial open coding
process resulted in 96 active codes capturing actions in
data. Using affinity diagraming, we categorized these codes
into the following three themes.
Need for Dynamic Presentations
Participants identified a variety of situations that require a
more dynamic approach to presenting. The most cited
scenario is post-presentation QA sessions. In these sessions,
it is a common practice for presenters to navigate back to
previously presented slides, or spontaneously show
additional backup slides to support their responses:
“We will definitely build in backups and we encourage students to incorporate backups… During the question period, you feel like a
million bucks if someone is like, ‘well what about this?’, and then you say, ‘well look at this!’” [P4]
Similar to QA sessions, unscripted presentations are also
required for discussion-based settings such as “flipped
classrooms” [P1] or “review classes” [P4]. In these
scenarios, “inevitably it involves a lot of shuffling. Someone
just says, ‘I have a question about TCP’, and then OK, I
have to go find that deck, and find that specific thing that
you are talking about. So that’s two hours of jumping
around in random places” [P4].
In flexible and interactive settings such as classrooms or
seminars, presenters also dynamically tailor their delivery
based on their real-time evaluation of the audience’s level
of understanding: “I’ll have a series of topics or modules
that I want to cover in a class time, and some expand and
some may contract depending on where the students are
and their understanding and interest level” [P1]. In some
cases, presenters also spontaneously select a subset of
topics to present based on audience interest: “A lot of my
presentations are play on adventure type things, where at
some point I ask, ‘hey what do you guys want to talk
about?’” [P8]. Most participants also mentioned the need
for dynamically adapting their delivery due to time limit.
Preparing for Unscripted Interactions
Presenters often include backup slides at the end of their
slide deck to prepare for QA sessions:
“If I am less familiar with a topic then I’m more likely to have
some more backup slides… I think the act of creating the slide is
very important… at least it will put you at ease” [P2]
These backups can be new slides containing supporting
material for anticipated audience questions, or existing
slides that are “copied and pasted from other slide decks”
[P8]. They can also be results of a timed rehearsal process,
in which some slides are moved from the main slide deck to
the backup section due to time constraints.
Presenters often write speaking notes for new presentations
or when highly visual slides are used. Short, bullet point-
style notes are generally preferred, although more verbose
notes and specific wordings may also be used for important
points when presenters really want to “get it across” [P3].
In certain settings such as history conferences, it is also
common to recite full scripts during presentations. Another
approach is to make “those slides your notes” [P5], but this
often results in text-heavy slides that are not desirable.
In addition to key speaking points, presenters also add
“supplemental material” [P1] in their notes, such as more
detailed explanations of a concept or additional information
taken from an existing paper, which may be used when
audiences ask related questions.
Nonlinear Slide Navigation
Most dynamic presentations require nonlinear access to
relevant slides. The inability to quickly navigate to needed
slides could cause significant disruption in the talk flow:
“It is disruptive if you can’t get there quickly, and anytime you muck with the computer you are risking messing yourself up… The
last thing you want to do is wasting your time trying to find your
slide” [P2]
This disruption and delay time in searching for slides could
lead to negative audience experience: “I have seen people
go through 30 slides and finally go, ‘is this the slide you
meant? or this slide?... it is a disaster” [P1]. Instead of
skipping through slides in sequence, a more recommended
method is to exit the presenter view and then directly select
a slide thumbnail from the slide navigation pane. However,
this can still lead to a long delay time, especially for big
Presentation
Venue
Num. of
Pres.
Analyzed
Avg. Length
of Pres.
(MM: SS)
Avg. Num.
of Slides
Avg. Length
of QA
(MM: SS)
Avg. Num.
of Questions
Percentage of Questions
Refer (%) Extra (%)
CHI 10 14:24 33.1 3:30 3.2 9 3
NEAB-PD 5 20:36 28.2 5:37 4.4 0 9
FECE 5 19:24 15.4 7:57 5 8 0
Lectures 5 60:20 51.8 - 12.8 8 0
Table 1. Statistical analysis of conference presentations and lectures

slide decks. Another tactic is to add slide numbers on slides
and use them for direct keyboard navigation. However, this
can still be problematic if slide numbers are
misremembered. Due to these difficulties, presenters may
opt to not show supporting slides during QA sessions, even
though they might have spent time preparing them, unless
they are confident that they know “where the slide is and
it’s very easy to quickly go to slide” [P1].
To facilitate slide navigation, participants suggested having
a dedicated “question mode that you could have flags for
particular slides that you anticipated you needed” [P3], or
indexing slides by key phrases, so that “you know that a
certain word would be phrase to a slide” [P4]. One
participant envisioned a speech-based technology that could
automatically display relevant slides based on the
presenter’s speech:
“If there was a technology where the screen would go black and within 5 seconds the slide I wanted would come up that would be
great… If I could speak into my clicker and say, you know, ‘show me the slides that have this on it’ and maybe a few slides would
pop up and I would click on the one” [P6]
In summary, findings from our interview analysis highlights
the need for more intelligent support for seamless nonlinear
slide navigation during dynamic presentation delivery.
Analysis of Question Answering Sessions
To better understand the quantitative characteristics of QA
sessions, we analyzed video recordings of 20 conference
presentations and 5 lectures. Conference presentation
samples were chosen from 3 different venues: CHI
Conference, National Education Alliance for Borderline
Personality Disorder (NEAB-PD), and Fostering
Entrepreneurship in the Creative Economy (FECE).
Lectures were chosen from the Simons Institute interactive
learning series about different topics in computer science.
We annotated the duration of presentations, number of
slides, length of QA sessions, and the number of questions
asked. For lectures, we examined all questions asked during
and after the presentation.
Based on our analysis, a typical 20-minute conference
presentation had 32 slides on average, while a typical 60-
minute lecture had 51. Navigating through such a large
slide deck to search for a specific slide would potentially be
difficult and time consuming.
In total, 145 questions were asked. We categorized the
presenters’ strategies for responding to questions into two
groups: 1) going back to a slide presented before (Refer);
and 2) showing an extra slide (Extra) (Table 1).
On average, each QA interaction took 59 seconds, including
the question, optionally repeating the question by speaker,
optionally searching for and displaying a slide, and
answering the question. For 10% of questions, presenters
navigated to a slide (either previously presented or extra) to
answer the questions. In 70% of these cases, the speakers
moved though slides linearly. In the remaining 30%, they
exited the presenter view to search for a slide. Navigating to
a slide on average took 13.1 seconds, which comprises 22%
of each QA interaction duration.
DESIGN OF QUESTER
Informed by our literature review and formative studies, we
developed Quester, a question answering support system as
an add-in for Microsoft PowerPoint.
Quester supports fast, nonlinear access to relevant
presentation content by listening to speech input and
dynamically suggesting the most related slides and note
sections. Speech input can be received directly from the
audience asking a question or from the presenter repeating
or rephrasing the question. The system ranks presentation
slides based on their textual content, slide notes, and
metadata of slides’ visual elements. To further assist
presenters in identifying target content, it also highlights the
section of the slide notes that is most related to the uttered
question. Quester also provides an interface for presenters
to privately preview and search for relevant content without
exposing the search process to the audience.
Note Authoring Environment
Our system provides a note authoring interface integrated
within PowerPoint 2016 (Figure 1). The presenters can
Figure 1. Note Authoring Environment (Left) and Presenter View (Right): (a) notes pane with an extra note topic in red, (b) slide
navigation pane showing the most related slides, c) green bars showing the degree of slide relatedness to speech input

divide the notes for each slide into sections called topics.
This segmentation allows for highlighting specific sections
of notes that are related to a question. This also makes it
possible to separate extra notes from the main presentation
notes. Extra notes may contain supplemental material that
are not presented during the main delivery, but the presenter
can refer to them during QA. They are distinguished from
main notes with a different font color (Figure 1).
Presentation Mode
During the presentation, Quester displays the slide, notes,
and timing information, similar to PowerPoint’s Presenter
View. It also provides a slide navigation pane (Figure 1).
Slide Navigation Pane
Located at the bottom of the Presenter View, the slide
navigation pane displays 5 slide thumbnails at each
moment, but the presenter can scroll to see the rest of
slides. The number of visible slide thumbnails was chosen
empirically based on trade-offs between quick accessibility
and visual and cognitive load. Corresponding slide numbers
are shown above each slide thumbnail. The slide navigation
pane is hidden by default to avoid distraction during the
presentation, but it is automatically shown when the
presenter navigates to the last slide that he/she has planned
to present (which can be set in the authoring environment).
Users can also manually toggle the visibility of the
navigation pane during the presentation.
The order of the slides displayed in the navigation pane is
based on their semantic closeness to the speech input. It
changes dynamically as new speech input is received and
processed (with a 500 ms delay). To minimize potential
distraction caused by rapid changes in the order of slide
thumbnails, Quester does not change the slide orders once
they appear in the visible portion of the Navigation pane.
To indicate the degree of semantic match of each slide to
recent speech, the system displays green bars with varying
sizes above each slide thumbnail.
Presenters can hover over each slide thumbnail to privately
see a preview of its content. This preview appears as a
modal window over the presenter view and contains the
slide and notes in smaller size (Figure 2). If the presenter
wants to show a slide from the navigation pane to the
audience, he/she can click on a thumbnail and the
presentation will jump to that slide.
Note Highlighting
When the speaker displays a slide using the navigation
pane, the note topic most related to the speech content is
detected and the keywords in that topic are highlighted.
Highlighting is done by changing the color of keywords and
increasing the font size. Also, the notes pane is scrolled to
display that topic at the top (Figure 2).
In the next section, we describe our technical approach to
estimating the semantic closeness between the slide content
and speech content.
Semantic Match Scoring
Before presentation, slide contents are automatically
processed to extract their keywords, and weights are
assigned to the keywords based on their importance in the
slide. During the presentation, the system scans the
presenter’s speech content for these keywords, and based
on the weights of detected keywords, slides and note topics
are scored. The detailed description of the scoring system is
available in [2]. In following subsections, we briefly
explain the steps in this process.
Content Processing
The content used for semantic matching includes slide title
and text content, slide notes, and metadata about the visual
elements in each slide. The metadata is generated by
extracting the type of each element in the slide and adding
corresponding descriptive words for the element to slide
content. For example, if a slide contains a chart, the system
adds the words “plot”, “graph”, and “chart” to the slide
content. This metadata allows the system to handle
questions that refer to specific visual elements of a slide
(e.g. “Can you go back to the slide with the graph on it?”).
The system segments the slide content into sentences, and
performs part of speech tagging using the Stanford
CoreNLP tools [9]. It removes stop words, adverbs, and
symbols from the content and stores the remaining words as
Figure 2. (Left) Slide Preview displayed when the presenter hovers the mouse over a slide thumbnail; (Right) Note pane is
scrolled to display the most relevant note topic at the top with highlighted keywords

content keywords. It then lemmatizes the keywords and
extracts their synonyms using WordNet [11].
Keyword Weighting
The system assigns slide-level and topic-level weights to
each keyword based on its importance in the slide content
and the note topic containing it, respectively.
Slide-level keyword weights are the result of a
multiplication of values calculated using two methods:
Term frequency - inverse document frequency: This is a
common measure in information retrieval, which is
calculated by multiplying the frequency of keyword k in
slide by its inverse document frequency:
𝑖𝑑𝑓𝑘 = log (|𝑃|
|{∀𝑆𝜖𝑃|𝑘𝜖𝑆}|) (1)
P is the set of slides and the denominator is the number of
slides containing keyword k.
Word similarity: This method assigns a higher weight to
keywords that are semantically closer to other keywords in
the same slide compared to the keywords in other slides.
The similarity between keywords is calculated as follows:
𝑠𝑖𝑚(𝑘𝑖 , 𝑘𝑗) = √∑(𝑣(𝑘𝑖)𝑙 − 𝑣(𝑘𝑗)𝑙)2
𝑛
𝑙=0
(2)
𝑣(𝑘) is the word vector representation of keyword k. We
used a pre-trained GloVe [14] vector representation with
1.9 million uncased words and vectors with 300 elements,
trained using 42 billion tokens of web data from Common
Crawl.
We also assigned a topic-level weight for each keyword
using the same process, but instead of analyzing each slide
in the slide deck we analyze each topic in the notes of the
slide containing that keyword.
Content Scoring
During a presentation, the system uses the IBM Watson
cloud-based ASR1 to transcribe the speech. This ASR
system provides a list of hypotheses for each time frame,
called word alternatives. Our system matches the lemmas of
these word alternatives against each slide keyword lemma
and its synonyms.
The score for each slide is the sum of the weights of its
keywords that were spotted in speech. Similarly, the score
for each topic will be the sum of the weights of its detected
keywords.
Recency Model
The recency of keywords is important, so the keywords
detected during a previous question do not affect the scores
related to the current question being answered. To eliminate
1 https://www.ibm.com/watson/services/speech-to-text/
the effects of outdated keywords, the simplest solution is to
require the presenter to manually reset slide scores before
each new question. However, this imposes an extra burden
on the presenters and they might forget to do so. Therefore,
we developed and evaluated two models that take into
account the recency effect.
Our system stores detected keywords in a stack and if a
keyword that is already put in the stack is detected again, it
is moved to the top. Therefore, the most recent keywords
will always be at the top of the stack. We examined 2
recency models:
Window model: Similar to previous work in word
completion [19], we calculated slide scores based on only
the top n keywords in the stack. For example, if n=2 then
the model only considers the last 2 detected keywords.
Decay model: The model calculates slide scores after
modifying the keyword weights based on the keyword
positions in the stack. Keyword weights are modified using
the following equation:
𝑤 = 𝑤0𝑏𝑡 0 < 𝑏 ≤ 1 0 ≤ 𝑡 (3)
in which, 𝑤0 is the original weight of keyword, b is the
decay base, and t is the distance of keyword from the top of
the stack. For b=1 the weights are the same as the original
weights (i.e., no recency model). As b gets smaller, the
decaying effect will be stronger and keywords detected
further in the past will have a smaller effect on slide scores.
We performed theoretical evaluations of these two models
using a corpus of presentations and questions collected
from a user study that we describe in the next section.
Corpus of Evaluation Presentations and Questions
To support both theoretical and user evaluations of different
aspects of Quester, we developed a standardized corpus
consisting of two short (7-slide) presentations on the topics
Figure 3. Performance of the decay recency model with
different base values
0
0.1
0.2
0.3
0.4
0.5
0.6
0.7
0.8
0 0.2 0.4 0.6 0.8 1
MR
R (M
ean
Rec
ipro
cal A
nsw
er R
ank)
Base Values (b)
Figure 3. Performance of the decay recency model with
different base values
0
0.1
0.2
0.3
0.4
0.5
0.6
0.7
0.8
0 0.2 0.4 0.6 0.8 1
MR
R (M
ean
Rec
ipro
cal A
nsw
er R
ank)
Base Values (b)

of Exercise and Nutrition, along with a set of audience
questions and extra QA slides for each.
To generate a corpus of audience questions for each
presentation, we recruited 8 participants (college educated
with presentation experience) to view videotaped
presentations of a researcher giving each of the short
presentations, then generating 10 questions each, resulting
in an initial set of 80 questions per presentation. After
removing redundant, unclear, and rhetorical questions, we
further curated the questions, resulting in 40 audience
questions per presentation. 4 of these 40 questions required
display of slides previously presented in the main
presentation (e.g. ‘Can you explain more about the graph
on sleep?’), and 2 required display of extra slides (e.g. ‘Can
you show me a sample weekly menu?’) (reflecting the Refer
and Extra percentages in Table 1). The remaining questions
could be answered using additional content, with or without
displaying supporting slides.
To generate the extra / backup slides to provide support for
the audience questions, we categorized the 36 questions for
each presentation into 15 topics per presentation, and had
two writers create an additional 15 slides with
accompanying speaker notes for each presentation. The
writers also created additional notes for the original 7 slides
to help answer the 4 Refer questions for each presentation.
The resulting slide notes for the Nutrition presentation
contained 1562 words segmented into 55 topics. The slide
notes for the Exercise presentation contained 1371 words in
58 topics. Our corpus roughly matched a corpus of
presentation slides and notes gathered in a previous study
[2] on several metrics: the notes for each slide contained
73.3 words and 2.82 topics on average.
Model Evaluation
We used our presentation corpus to evaluate the accuracy of
the matching algorithm using both recency models with
different parameter values.
To ensure that the system performance does not depend on
specific order of questions, we evaluated the system with 10
different randomized permutations of questions and
calculated the average performance for all permutations.
For each permutation of questions, we passed each question
to the system as input to assign scores to the slides using
different models and parameter values. The system then
ranked the slides based on their scores.
Measures
A common measure for evaluating the performance of QA
systems is the mean reciprocal answer rank (MRR):
𝑀𝑅𝑅𝑚 =1
|𝑄|∑
1
𝑅𝑎𝑛𝑘𝑚 (𝑞)𝑞∈𝑄
(4)
In which, 𝑅𝑎𝑛𝑘𝑚 (𝑞) is the rank of the slide containing the
answer to question q using model m, and Q is the set of all
questions.
We also measured the performance of our system using an
accuracy measure more tailored to our application. We
calculated the proportion of questions for which the slide
containing the answer was included in the top p% of slides
with the highest match scores:
𝑎𝑐𝑐𝑢𝑟𝑎𝑐𝑦𝑚,𝑝 =|{∀𝑞 ∈ 𝑄|𝑅𝑎𝑛𝑘𝑚 (𝑞) < 𝑝}|
|𝑄| (5)
Results
Window Model: We evaluated this model for different
values of n. We found that n = 4 resulted in the best MRR
value of 0.70.
Decay Model: We evaluated this model for different values
of b. Based on the evaluation, b = 0.6 resulted in the best
MRR value of 0.73. Figure 3 displays the MRR values of
decay model for different base (b) values.
Using these optimized parameters (b=0.6 for decay model
and n=4 for window model), we compared the accuracy of
decay and window models against a system in which the
scores are manually reset before each new question (Reset
model). In our interface, we display the top 5 slides at any
moment which corresponds to a p value of 22%. As shown
in Figure 4, the accuracy of the Decay model for p=22% is
90.2% compared to 87.1% for the Window model and 95%
for the Reset model. The actual accuracy of the system is
expected to be lower than these values due to ASR errors.
Based on these evaluations we decided to use the decay
recency model with b=0.6 in our system.
USER EVALUATION OF QUESTER
To examine the effectiveness of dynamic speech-based
slide matching in Quester in improving presenters’
experience and performance during a QA session, we
conducted a user study comparing Quester against the static
slide navigation supported in most conventional slideware.
For our Control condition (the Static Navigation), we
extended PowerPoint with a Navigation pane similar to the
Figure 4. Comparison of different recency models
50
55
60
65
70
75
80
85
90
95
100
5 1 0 1 5 2 0 2 5 3 0 3 5 4 0 4 5 5 0 5 5 6 0 6 5 7 0 7 5 8 0 8 5 9 0 9 51 0 0
ACC
UR
ACY
(%)
TOP P% OF SLIDES
Decay Model Window Model Reset Model

one in Quester, but which always displays slides in the
same linear order that they appear in the slide deck. As in
Quester, the presenter can hover the mouse over each slide
thumbnail to preview the slide and notes. Once the
presenter clicks on a slide thumbnail to show the slide to
the audience, the system displays the corresponding notes
without highlighting the most related note topic.
Participants
We recruited 16 students and professionals (10 female, 6
male, ages 19-32, mean 23), with backgrounds in science,
technology, business and arts. Of these participants, 2 were
categorized as low competence public speakers, 5 were
categorized as high competence public speakers, and 9 had
moderate competence, according to the Self-Perceived
Communication Competence Scale [10]. Participants were
compensated for their participation.
Procedure
We asked each participant to rehearse and deliver two 3-
minute presentations on the topics of Exercise and
Nutrition, using the PowerPoint slide decks and notes
prepared in our QA corpus. After each presentation,
presenters engaged in a brief QA session during which they
were asked to answer a set of 8 questions randomly selected
from our 40-question corpus for each presentation, using a
different QA support system. For each 3-minute talk, the
participants were asked to only present the first 7 slides in
the slide deck. The remaining 15 slides were extra material
that could be used during the QA session.
During the delivery and QA session, the experimentation
room was set up with a 42-inch display monitor for slide
projection, a tripod-mounted microphone for recording the
presenter’s speech, and a secondary 15-inch computer
screen displaying the Presenter View.
The study was a within-subject, single-session design in
which each participant tested both conditions: Quester vs.
Static Navigation. Each session lasted approximately 90
minutes. The ordering of the conditions and the slide decks
were randomly assigned and counterbalanced.
At the beginning of the session, we introduced participants
to the task of delivering two short presentations followed by
QA sessions. For each condition, we gave participants 20
minutes to review the presentation content and rehearse
their talk. We instructed them to review all 22 slides and
notes, to prepare for both the presentation and the QA
session. All participants confirmed that 20 minutes was
sufficient for them to prepare.
Following each rehearsal, we gave participants brief
instructions on how to use one of the two QA support
systems and asked them to practice answering a sample
question using the system. We asked participants to repeat
the question aloud using their own words, before answering
the question.
Following each practice round, we asked participants to
give their final, videotaped presentation in front of the
experimenter. After each presentation, the experimenter
read aloud the randomly generated set of 8 questions, one at
a time, for the presenter to answer. The presenter could ask
the experimenter to repeat a question if they did not hear it
clearly, and could skip any questions if they did not know
the answer. Each QA session lasted approximately 5
minutes and was videotaped, with self-report measures
gathered after each session. After the participant completed
both conditions, we conducted a semi-structured interview,
prompting for comparisons of the two QA support systems
and suggestions for improvement. Self-report Measures of
Presenter Experience
We assessed the presenters’ experience with the QA
support systems using the following self-report measures.
Figure 5. Presenters’ absolute usability ratings of two QA support systems (* indicates statistical significances)

Absolute Usability Rating of QA Support System
We asked presenters to rate the usability of each QA
support system after each QA session, using a 7-item, 7-
point composite scale, as shown in Figure 5.
Figure 5 shows the results of the presenters’ absolute
usability ratings of the two QA support systems. Results of
a repeated-measures ANOVA test on the composite
usability rating (Cronbach’s α=0.93) showed that Quester
was rated significantly higher than the Static Navigation
condition (F1,15=10.337, p=.006, partial η2=.408).
Results of Wilcoxon signed-rank tests on individual scale
items showed that Quester was rated significantly better
than the Static Navigation condition on helpfulness (Z=-
2.55, p=.011), satisfaction (Z=-2.81, p=.005), desire to
continue using the system in future presentations (Z=-2.50,
p=.013), and how obvious it was to see what the answer is
(Z=-2.97, p=.003). There were also trending effects of the
condition on ease of use (Z=-1.95, p=.051) and reliability
(Z=-1.80, p=.072), in favor of Quester. No significant
difference was found between the two conditions in the
rating of distraction (p=.258).
Relative Usability Rating of QA Support Systems
After presenters completed both conditions, we asked them
to directly compare and indicate which of the two QA
support systems performed better on the same 7 criteria
included in the Absolute Usability Rating.
Results of Chi-square tests revealed significant preferences
of presenters towards Quester on all 7 criteria. Compared to
the Static Navigation condition, Quester was rated to be
significantly better in terms of ease of use (χ2(1)=9.0,
p=.003), reliability (χ2(1)=6.25, p=.012), distraction
(χ2(1)=4.0, p=.046), helpfulness (χ2(1)=12.25, p<.001),
satisfaction (χ2(1)=12.25, p<.001), desire to continue using
the system in future presentations (χ2(1)=12.25, p<.001),
and how obvious it was to see what the answer is
(χ2(1)=12.25, p<.001).
In summary, results of both absolute and relative usability
ratings demonstrated a strong preference of the presenters
for Quester.
Rating on scale 1-7
1 - not at all
7 - very much
Static Quester
p
How nervous were you…? 3.44 (1.55)
2.94 (1.34)
.143
How competent were you…?
4.63 (1.46)
5.25 (1.24)
.249
How would you rate the
overall quality…?
5.06
(1.12)
5.31
(1.19)
.434
Table 2. Presenters’ self-perceived ratings of their QA
performances (Mean (SD) and p-value of Wilcoxon tests
Self-perceived Rating of QA Performance
After each QA session, we asked presenters to assess their
own QA performance using a 3-item, 7-point scale,
evaluating their self-perception of their nervousness,
competency, and overall quality of their performance.
As shown in Table 2, results of the ratings showed
improvements in all measures with Quester. However,
results of Wilcoxon signed rank tests showed no significant
differences between the two conditions in any measures.
Objective Measures of Presenter Performance
We analyzed video recordings of all QA sessions and
calculated the following objective measures of the
presenter’s system usage and performance:
Utilization Rate: measured as the percentage of times that
the presenter used the QA support system to answer a
question, either by navigating through slides and notes to
search for the correct answer and/or clicking on a slide to
show to the audience. In both conditions, we asked
participants to use the QA support systems in any way they
wanted, and they could always choose to answer a question
without using the systems.
Correctness of Answers: measured as the percentage of
questions that were correctly answered, either with or
without using the QA systems.
Efficiency: For each correct answer found, we measured the
delay time (in seconds) taken from the moment the
presenter finished repeating the question until the moment
he/she started answering the question.
Number of Incorrect Slides Shown: measured as the number
of incorrect slides shown to the audience before reaching a
correct slide. This metric was calculated each time the
presenter showed a correct slide to the audience. In 19% of
cases, presenters did not show the correct slides.
A research assistant annotated the QA session recordings
to check for the correctness of the presenter’s answers and
the delay time for each correct answer. For each question,
the annotator compared the presenter’s answer to the target
answer included in the speaking notes. An answer was
considered correct if it covered the main points in the target
answer in sufficient details (but not necessarily word-for-
word). 12.5% of the recordings (4 out of 32 recordings, 2
from each condition) were randomly chosen and annotated
by another annotator to assess the reliability of our coding.
The inter-rater reliability was adequate, with Cohen’s
Kappa of 0.73 for correctness, and intraclass-correlation of
0.96 for efficiency.
We performed Shapiro-Wilk tests to check the normality of
our data. Our data for all measures were not normally
distributed, thus we analyzed our data using non-parametric
tests (Wilcoxon signed rank tests). Results of the objective
measures are shown in Table 3. There was a significant
difference in utilization rate between the two conditions
(Z=-1.97, p=.048), in favor of Quester. There was also a
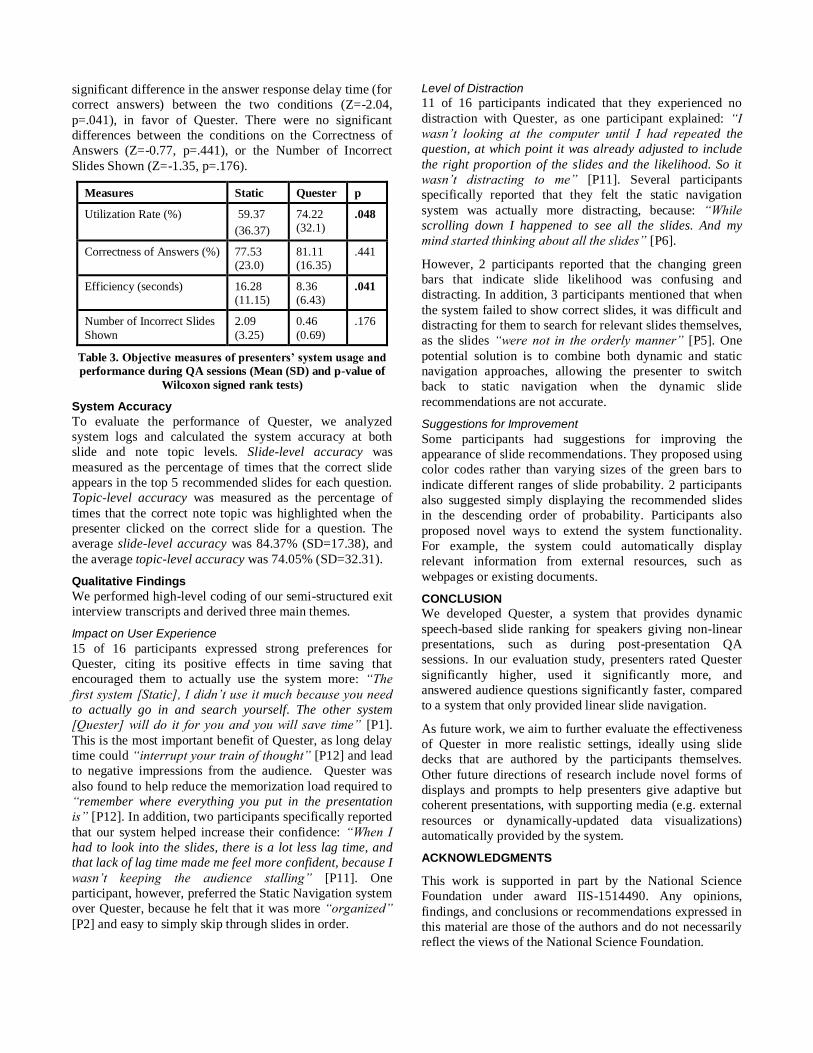
significant difference in the answer response delay time (for
correct answers) between the two conditions (Z=-2.04,
p=.041), in favor of Quester. There were no significant
differences between the conditions on the Correctness of
Answers (Z=-0.77, p=.441), or the Number of Incorrect
Slides Shown (Z=-1.35, p=.176).
Measures Static Quester p
Utilization Rate (%) 59.37
(36.37)
74.22 (32.1)
.048
Correctness of Answers (%) 77.53 (23.0)
81.11 (16.35)
.441
Efficiency (seconds) 16.28
(11.15)
8.36
(6.43)
.041
Number of Incorrect Slides
Shown
2.09
(3.25)
0.46
(0.69)
.176
Table 3. Objective measures of presenters’ system usage and
performance during QA sessions (Mean (SD) and p-value of
Wilcoxon signed rank tests)
System Accuracy
To evaluate the performance of Quester, we analyzed
system logs and calculated the system accuracy at both
slide and note topic levels. Slide-level accuracy was
measured as the percentage of times that the correct slide
appears in the top 5 recommended slides for each question.
Topic-level accuracy was measured as the percentage of
times that the correct note topic was highlighted when the
presenter clicked on the correct slide for a question. The
average slide-level accuracy was 84.37% (SD=17.38), and
the average topic-level accuracy was 74.05% (SD=32.31).
Qualitative Findings
We performed high-level coding of our semi-structured exit
interview transcripts and derived three main themes.
Impact on User Experience
15 of 16 participants expressed strong preferences for
Quester, citing its positive effects in time saving that
encouraged them to actually use the system more: “The
first system [Static], I didn’t use it much because you need
to actually go in and search yourself. The other system
[Quester] will do it for you and you will save time” [P1].
This is the most important benefit of Quester, as long delay
time could “interrupt your train of thought” [P12] and lead
to negative impressions from the audience. Quester was
also found to help reduce the memorization load required to
“remember where everything you put in the presentation
is” [P12]. In addition, two participants specifically reported
that our system helped increase their confidence: “When I
had to look into the slides, there is a lot less lag time, and
that lack of lag time made me feel more confident, because I
wasn’t keeping the audience stalling” [P11]. One
participant, however, preferred the Static Navigation system
over Quester, because he felt that it was more “organized”
[P2] and easy to simply skip through slides in order.
Level of Distraction
11 of 16 participants indicated that they experienced no
distraction with Quester, as one participant explained: “I
wasn’t looking at the computer until I had repeated the
question, at which point it was already adjusted to include
the right proportion of the slides and the likelihood. So it
wasn’t distracting to me” [P11]. Several participants
specifically reported that they felt the static navigation
system was actually more distracting, because: “While
scrolling down I happened to see all the slides. And my
mind started thinking about all the slides” [P6].
However, 2 participants reported that the changing green
bars that indicate slide likelihood was confusing and
distracting. In addition, 3 participants mentioned that when
the system failed to show correct slides, it was difficult and
distracting for them to search for relevant slides themselves,
as the slides “were not in the orderly manner” [P5]. One
potential solution is to combine both dynamic and static
navigation approaches, allowing the presenter to switch
back to static navigation when the dynamic slide
recommendations are not accurate.
Suggestions for Improvement
Some participants had suggestions for improving the
appearance of slide recommendations. They proposed using
color codes rather than varying sizes of the green bars to
indicate different ranges of slide probability. 2 participants
also suggested simply displaying the recommended slides
in the descending order of probability. Participants also
proposed novel ways to extend the system functionality.
For example, the system could automatically display
relevant information from external resources, such as
webpages or existing documents.
CONCLUSION
We developed Quester, a system that provides dynamic
speech-based slide ranking for speakers giving non-linear
presentations, such as during post-presentation QA
sessions. In our evaluation study, presenters rated Quester
significantly higher, used it significantly more, and
answered audience questions significantly faster, compared
to a system that only provided linear slide navigation.
As future work, we aim to further evaluate the effectiveness
of Quester in more realistic settings, ideally using slide
decks that are authored by the participants themselves.
Other future directions of research include novel forms of
displays and prompts to help presenters give adaptive but
coherent presentations, with supporting media (e.g. external
resources or dynamically-updated data visualizations)
automatically provided by the system.
ACKNOWLEDGMENTS
This work is supported in part by the National Science
Foundation under award IIS-1514490. Any opinions,
findings, and conclusions or recommendations expressed in
this material are those of the authors and do not necessarily
reflect the views of the National Science Foundation.

REFERENCES
1. Laurence Anthony, Deborah C Turk, Atsuko K
Yamazaki and Thomas Orr. 2006. Q&A: Published
advice vs. real-world difficulties. in International
Professional Communication Conference, 2006 IEEE,
IEEE, 11-21.
2. Reza Asadi, Harriet J Fell, Timothy W Bickmore and
Ha Trinh. 2016. Real-Time Presentation Tracking
Using Semantic Keyword Spotting. in Interspeech.
3. Reza Asadi, Ha Trinh, Harriet J. Fell and Timothy W.
Bickmore. 2017. IntelliPrompter: speech-based
dynamic note display interface for oral presentations
Proceedings of the 19th ACM International Conference
on Multimodal Interaction, ACM, Glasgow, UK, 172-
180.
4. Virginia Braun and Victoria Clarke. 2006. Using
thematic analysis in psychology. Qualitative research
in psychology, 3 (2). 77-101.
5. Jinwei Cao and Jay F Nunamaker. 2004. Question
answering on lecture videos: a multifaceted approach.
in Proceedings of the 4th ACM/IEEE-CS joint
conference on Digital libraries, ACM, 214-215.
6. Darren Edge, Joan Savage and Koji Yatani. 2013.
HyperSlides: dynamic presentation prototyping. in
Proceedings of the SIGCHI Conference on Human
Factors in Computing Systems, ACM, 671-680.
7. Wilbert O Galitz. 2007. The essential guide to user
interface design: an introduction to GUI design
principles and techniques. John Wiley & Sons.
8. Rhema Linder, Nic Lupfer, Andruid Kerne, Andrew M
Webb, Cameron Hill, Yin Qu, Kade Keith, Matthew
Carrasco and Elizabeth Kellogg. 2015. Beyond
slideware: How a free-form presentation medium
stimulates free-form thinking in the classroom. in
Proceedings of the 2015 ACM SIGCHI Conference on
Creativity and Cognition, ACM, 285-294.
9. Christopher D Manning, Mihai Surdeanu, John Bauer,
Jenny Rose Finkel, Steven Bethard and David
McClosky. 2014. The stanford corenlp natural
language processing toolkit. in ACL (System
Demonstrations).
10. James C. McCroskey and Linda L. McCroskey. 1988.
Self-report as an approach to measuring
communication competence. Communication Research
Reports, 5. 108-113.
11. George A Miller. 1995. WordNet: a lexical database
for English. Communications of the ACM, 38 (11). 39-
41.
12. Tomer Moscovich, Karin Scholz, John F Hughes and D
Salesin. 2004. Customizable presentations, Technical
Report CS-04-16, Computer Science Department,
Brown University.
13. Les Nelson, Satoshi Ichimura, Elin Rønby Pedersen
and Lia Adams. 1999. Palette: a paper interface for
giving presentations. in Proceedings of the SIGCHI
conference on Human Factors in Computing Systems,
ACM, 354-361.
14. Jeffrey Pennington, Richard Socher and Christopher
Manning. 2014. Glove: Global vectors for word
representation. in Proceedings of the 2014 conference
on empirical methods in natural language processing
(EMNLP), 1532-1543.
15. Ivica Rogina. 2002. Lecture and presentation tracking
in an intelligent meeting room. in Proceedings of the
4th IEEE International Conference on Multimodal
Interfaces, IEEE Computer Society, 47.
16. Beat Signer and Moira C Norrie. 2007. PaperPoint: a
paper-based presentation and interactive paper
prototyping tool. in Proceedings of the 1st
international conference on Tangible and embedded
interaction, ACM, 57-64.
17. Ryan Spicer, Yu-Ru Lin, Aisling Kelliher and Hari
Sundaram. 2012. NextSlidePlease: Authoring and
delivering agile multimedia presentations. ACM
Transactions on Multimedia Computing,
Communications, and Applications (TOMM), 8 (4). 53.
18. Edward R Tufte. 2003. The cognitive style of
PowerPoint. Graphics Press Cheshire, CT.
19. APJ van den Bosch. 2011. Effects of context and
recency in scaled word completion. Computational
Linguistics in The Netherlands journal.
20. Natsuo Yamamoto, Jun Ogata and Yasuo Ariki. 2003.
Topic segmentation and retrieval system for lecture
videos based on spontaneous speech recognition. in
Interspeech.
21. Haojin Yang and Christoph Meinel. 2014. Content
based lecture video retrieval using speech and video
text information. IEEE Transactions on Learning
Technologies, 7 (2). 142-154.
22. Joann Yates and Wanda Orlikowski. The PowerPoint
presentation and its corollaries: How genres shape
communicative action in organizations. Communicative
practices in workplaces and the professions: Cultural
perspectives on the regulation of discourse and
organizations. 67-91.
23. Show-Jane Yen, Yu-Chieh Wu, Jie-Chi Yang, Yue-Shi
Lee, Chung-Jung Lee and Jui-Jung Liu. 2013. A
support vector machine-based context-ranking model
for question answering. Information Sciences, 224. 77-
87.
24. Scott Wen-tau Yih, Xiaodong He and Chris Meek.
2014. Semantic parsing for single-relation question
answering.