Queensland Government Population Projections to … projections to 2031: local government areas,...
67
Transcript of Queensland Government Population Projections to … projections to 2031: local government areas,...


Population projections to 2031: local government areas, 2011 edition
Prepared by: Queensland Treasury For technical inquiries or further information contact: Queensland Treasury Office of Economic and Statistical Research Demography and Planning PO Box 15037, City East QLD 4002 Australia Telephone: 07 3224 5326 [email protected] www.oesr.qld.gov.au/dap Version 1.4 © The State of Queensland (Queensland Treasury) 2011
You are free to copy, communicate and adapt the work, as long as you attribute the authors. This document is licensed under a Creative Commons Attribution 2.5 Australia licence. To view a copy of this licence, visit http://creativecommons.org/licenses/by/2.5/au. To attribute this work, cite Queensland Government population projections to 2031: local government areas, 2011 edition, Office of Economic and Statistical Research, Queensland Treasury. This report is based on information available to the Office of Economic and Statistical Research at the time of preparation. It does not necessarily reflect the opinions or views of Queensland Treasury or the Queensland Government. Any statement, opinion or advice expressed or implied in this report is made in good faith but on the basis that the State of Queensland, its agents and employees are not liable for any damage or loss whatsoever which may occur in relation to its use by the client or any third party.
ii

Foreword
This report is a window into the demographic and economic future of Queensland. The Queensland Population Projections to 2031 report, prepared by Queensland Treasury's Office of Economic and Statistical Research, is released twice within a five yearly cycle. It monitors the dynamic and ever-changing nature of demography and growth patterns in this State. For a generation, Queensland has been at the front of the pack when it comes to population growth. Formerly based around the 'magnet' that is the south-east, this report demonstrates that our traditional strengths remain strong, while regional Queensland continues its transformation through consistent growth. Decentralisation of industry and of course mining boom mark II are both significant factors in Queensland's 'rise of the regions'. It is one trend that is unlikely to be reversed. However, this report does see a departure from some other long-standing demographic trends. The main contributor to a recent slowing in population growth is a slow down in overseas migration. Net interstate migration has also slowed, a trend seen nationally. In fact, according to ABS figures, Queensland remains the number one destination for net interstate migration, far ahead of Western Australia and Victoria. It is now natural increase that is the single biggest contributor to Queensland's population growth. Population projections such as these encourage us to take a long term view. From this perspective, this edition of population projections indicates higher population growth than the previous edition (released in 2008). As economic recovery builds, the migration flow is expected to rebound. In reading this report it is important to note that it contains neither targets nor predictions; rather these projections represent our best understanding of how current demographic, social and economic forces will influence population growth in the future. For policy makers, the challenge now is to continue the long-term planning needed to foster that growth. Queensland investment in infrastructure in recent years - around $50 billion over the last three years - has been the State Government's main policy driver in supporting jobs and building local economies. We will continue to approach planning for population growth with a view to the horizon, not just to tomorrow. The Honourable Andrew Fraser MP Treasurer Minister for State Development and Trade
iii

Population projections to 2031: local government areas, 2011 edition
Contents
Foreword ................................................................................................................................. iii
Executive summary............................................................................................................... vii
1. Introduction.................................................................................................................... 1
2. Projected population for Queensland ......................................................................... 3
2.1 Population growth to continue......................................................................................... 3
2.2 Past and future change ................................................................................................... 4
2.3 Drivers of change ............................................................................................................ 4
2.4 Growth rates to decline ................................................................................................... 6
2.5 Population age structure ................................................................................................. 6
3. Population projections for local government areas .................................................. 9
3.1 Overview.......................................................................................................................... 9
3.2 Top 10 largest growing local government areas ........................................................... 11
3.3 Top 10 fastest growing local government areas ........................................................... 12
3.4 South East Queensland local government areas.......................................................... 13
3.5 Eastern Regional Queensland local government areas................................................ 17
3.6 Western Regional Queensland local government areas............................................... 22
4. Indigenous local government areas.......................................................................... 26
4.1 Population growth.......................................................................................................... 28
4.2 Population age structure ............................................................................................... 29
Technical notes...................................................................................................................... 31
Glossary ................................................................................................................................. 32
Appendixes ............................................................................................................................ 35
Appendix A. Historical estimated resident population, local government areas................ 35
Appendix B. Projected resident population (medium series), local government areas ..... 39
Appendix C. Projected resident population (high series), local government areas ........... 43
Appendix D. Projected resident population (low series), local government areas............. 47
Appendix E. Projected resident population by broad age groups (medium series), local
government areas.......................................................................................... 51
Appendix F. Concordance: regional planning project areas and local government areas 55
Appendix G. Concordance: regionalisation strategy areas and local government areas .. 56
Appendix H. Regional planning project areas map............................................................ 57
Appendix I. Regionalisation strategy areas map .............................................................. 58
iv

List of figures
Figure 2.1 Actual and projected population (millions), Queensland, June 1976 to 2056 ..................3 Figure 2.2 Population change, Queensland, 10 years to June 1916 to 2056 ...................................4 Figure 2.3 Components of change, Queensland, year to June 1981 to 2031...................................5 Figure 2.4 Annual population change (rates), Queensland, year to June 1926 to 2056 ...................6 Figure 2.5 Population change by broad age groups, Queensland,
25 years to June 2006 and 2031 .....................................................................................7 Figure 2.6 Population by age and sex, Queensland, June 1981, 2006 and 2031 ............................8 Figure 3.1 Projected average annual population change (rates), local government areas,
25 years to June 2031 ...................................................................................................10 Figure 3.2 Top 10 largest growing local government areas in Queensland, population growth in the
10 years to June 2006 and 2021 ...................................................................................12 Figure 3.3 Top 10 fastest growing local government areas in Queensland, average annual change
(rate) in the 10 years to June 2006 and 2021................................................................13 Figure 3.4 Population by broad age group, South East Queensland Region,
June 2006, 2021 and 2031............................................................................................16 Figure 3.5 Population by broad age group, Eastern Regional Queensland,
June 2006, 2021 and 2031............................................................................................20 Figure 3.6 Proportion of projected population by broad age group, Hinchinbrook (S) and Isaac (R),
June 2021......................................................................................................................21 Figure 3.7 Projected population change by broad age group, Cairns (R), Mackay (R),
Toowoomba (R) and Townsville (C), 10 years to June 2021.........................................22 Figure 3.8 Population by broad age groups, Western Regional Queensland,
June 2006, 2021 and 2031............................................................................................25 Figure 4.1 Population and projected average annual population change (rates), Indigenous local
government areas, June 2006 and 2031 .......................................................................27 Figure 4.2 Population by broad age groups, Indigenous local government areas,
June 2006, 2021 and 2031............................................................................................30
v

Population projections to 2031: local government areas, 2011 edition
List of tables
Table 2.1 Population (millions), Queensland, June 2006 to 2056 ...................................................3 Table 3.1 Top 10 largest growing local government areas in Queensland,
10 years to June 2006 and 2021 ...................................................................................11 Table 3.2 Top 10 fastest growing local government areas in Queensland,
10 years to June 2006 and 2021 ...................................................................................13 Table 3.3 Population and share of region, local government areas in South East Queensland
Region, June 2006, 2021 and 2031 ..............................................................................14 Table 3.4 Population change, local government areas in South East Queensland Region,
10 years to June 2006, 2021 and 2031 .........................................................................15 Table 3.5 Population and share of region, local government areas in Eastern Regional
Queensland, June 2006, 2021 and 2031.......................................................................18 Table 3.6 Population change, local government areas in Eastern Regional Queensland,
10 years to June 2006, 2021 and 2031 .........................................................................19 Table 3.7 Population and share of region, local government areas in Western Regional
Queensland, June 2006, 2021 and 2031.......................................................................23 Table 3.8 Population change, local government areas in Western Regional Queensland,
10 years to June 2006, 2021 and 2031 .........................................................................24 Table 4.1 Population, Indigenous local government areas, June 2006, 2021 and 2031 ...............26 Table 4.2 Population change, Indigenous local government areas,
10 years to June 2006, 2021 and 2031 .........................................................................28
vi

Executive summary
Population growth to continue By 2056 Queensland’s population is projected to double to approximately 9.1 million under the medium series projections. If the relatively lower levels of fertility and migration reflected in the low series eventuate, a population of 7.3 million would result, while the higher fertility and migration assumptions in the high series would deliver approximately 11.1 million people. Growth rates to moderate Queensland’s annual population growth rates are projected to slow over the 2011 to 2056 projection period, even under high growth rate assumptions. Projected annual growth rates for the next ten years to 2021 average 1.9 per cent in the medium series (1.4 per cent in the low series and 2.3 per cent in the high series), falling to 1.2 per cent in the decade to 2056 (0.7 per cent and 1.6 per cent for the low and high series respectively). Eastern seaboard spread The current trend of population concentration in South East Queensland is projected to continue, albeit at a slower pace than is currently occurring. The larger regional cities of Cairns, Townsville and Toowoomba will continue to grow and regional centres such as Rockhampton, Hervey Bay, Mackay and Gladstone are also projected to attract population, as a result of the lifestyle and employment opportunities they offer. Resource boom expands further west and south The expansion of resource extraction industries is expected to benefit specific areas within the Darling Downs, North West and South West statistical divisions. In the 10 years to 2021, the population of Western Downs Regional Council (R) is projected to grow by 4,300, Mount Isa City (C) by 2,500 and Maranoa (R) by 2,000 people. Ipswich to have fastest growth but Gold Coast to have most growth In the decade to 2021, Ipswich (C) is projected to grow rapidly at a very high 5.0 per cent per annum (a total of 111,000 people), while Gold Coast (C) is projected to have the largest amount of growth (133,800 people) of any local government area (LGA) in Queensland.
Fast growth to occur in Scenic Rim, Gladstone and Isaac local government areas Scenic Rim (R) is projected to have the second fastest growth rate, with an average annual population change over the 10 years to 2021 of 3.5 per cent. Gladstone (R) and Isaac (R) (ranked third and fourth) are also expected to experience relatively fast population growth rates, as a result of expansion in resource activity. Ageing of coastal populations Local government areas such as Redland (C) and Hinchinbrook (S) are projected to experience large increases in the proportion of older people. Redland (C) is projected to have the largest increase in median age in the 10 years to 2021 (from 39 to 43 years), while Hinchinbrook (S) can expect to have the highest proportion (31 per cent) of people aged 65 years and older in 2021. Improvements in health and life expectancy In the 10 years to 2021, one third (36 per cent) of the projected increase in Queensland’s population is projected to be in the age group 65 years or more. The large increase in elderly
vii

Population projections to 2031: local government areas, 2011 edition
viii
people is partly due to projected improvements in health and life expectancies and partly due to the large baby-boom cohort reaching this age group. Population ageing Queensland’s population is projected to age under all three projection series. Under the medium series projections, the median age of the population is expected to increase from the current 36 years to 38 years by 2021, reaching 43 years by 2056. All LGAs in Queensland can expect an increase in their population’s median age, except Scenic Rim (R). Largest increases in younger and older people Ipswich is projected to record the largest increase of any local government area in Queensland of people aged less than 35 years (nearly 159,000), while Brisbane is the area with the largest increase by 2031 of people aged 65 years or more (99,000). Gold Coast ranked number two in terms of projected growth for both age groups.

1. Introduction
Queensland has a history of strong population growth. While we can expect the future population will be larger, how much growth should be catered for? How many people will eventually use the infrastructure we are currently planning and building? How much land is required for housing in 10–20 years’ time? For planning purposes it is vital to be able to anticipate the size of the future population. In response to this need, every 2–3 years the Office of Economic and Statistical Research (OESR) conducts a modelling process to project the future size of the population in the state, its regions and local government areas (LGAs), based on the latest available information. The size of future increases in Queensland’s population will depend largely on fertility and mortality rates and future migration patterns into and out of the state. It is uncertain how these aspects of human behaviour will change in future years. However, by looking at past and current trends, reasonable assumptions can be made concerning the number of babies women will bear, the life expectancy of the population and the number and age of people leaving or arriving in the state. These assumed rates of change are applied to the current age/sex composition and geographic distribution of the Queensland resident population to derive projected populations for future years. The 2011 edition of the Queensland Government population projections are prepared using the best methodology, expert advice and much care; nevertheless, actual outcomes cannot be predicted with precise accuracy. Projected population figures are not forecasts. If migration patterns, life expectancy or fertility differ from what has been assumed, the future population will vary from these projected figures. Projections should be used with caution, but are an essential input when planning for infrastructure and services at a range of geographical levels. The possible future impacts of the recent natural disasters in Queensland were not taken into account when the 2011 edition of population projections were produced, during 2010. Therefore, in the short term the low series projections may be more relevant for some areas directly impacted by these events, although it is not expected that the projections will be affected over the longer term. This is consistent with recent experience regarding the effects of cyclone Larry in 2006 on population figures in Johnstone (S), where the resident population rebounded during the 1-2 year period following the disaster. This publication begins with an overview of the projected Queensland population figures. It then provides a regional perspective of future population change by looking at projected populations for LGAs. The top 10 LGAs with the fastest and largest projected growth receive special mention. This is followed by an examination of the projections for all LGAs in the state grouped into three regions – South East Queensland, Eastern Regional Queensland and Western Regional Queensland. Local government areas with predominantly Indigenous populations receive particular attention in Section 4. The appendixes provide detailed projections data for LGAs, Statistical Divisions, Regional Planning Project Areas and Queensland’s Regionalisation Strategy Areas. In this publication, emphasis has been put on population change projected for the next 10 years to 2021, although data are provided in the appendixes for longer periods. While Queensland’s total population has been projected forward to 2056, populations of LGAs have only been projected to 2031.
1
Population projections to 2031: local government areas, 2011 edition
The results of three projection series are provided in detailed tables in this publication – a low series (resulting from assuming low rates of natural increase and migration), a medium series and a high series (resulting from higher growth assumptions). The low and high series projections form upper and lower limits of likely population futures. All projection figures quoted in the text are medium series data unless stated otherwise. Serious consideration should be given to the range provided by the low and high series projections, particularly in the light of emerging trends and new data that will become available prior to the next update of these projections.
2

2. Projected population for Queensland
2.1 Population growth to continue Queensland’s population has been growing quickly and this growth is projected to continue. The medium series projection puts the state’s population at approximately 6.6 million people by 2031. By 2056 Queensland’s population is projected to be 9.1 million people, double the size of the 2010 estimated resident population (ERP). Even assuming low migration and low natural increase, the population will rise beyond seven million by 2056 (Table 2.1 and Figure 2.1). Table 2.1 Population (millions), Queensland, June 2006 to 2056
Actual
2006 2011 2016 2021 2026 2031 2036 2041 2046 2051 2056Low 4.09 4.59 4.94 5.29 5.63 5.96 6.26 6.55 6.82 7.07 7.32
Medium 4.09 4.61 5.09 5.59 6.09 6.59 7.10 7.60 8.11 8.62 9.14
High 4.09 4.65 5.26 5.91 6.58 7.27 7.98 8.72 9.50 10.31 11.15
— Projected —
Source: ABS 3101.0; and 2011 edition Queensland Government population projections
Figure 2.1 Actual and projected population (millions), Queensland, June 1976 to
2056
0
2
4
6
8
10
12
1976
1986
1996
2006
2016
2026
2036
2046
2056
Years
Per
sons
(m
illion
s)
Actual Low Medium High
ProjectedActual
Source: ABS 3101.0; and 2011 edition Queensland Government population projections
Record levels of population growth have occurred in Queensland recently, averaging 106,400 extra people each year from 2006 to 2010. The medium series projection to 2056 indicates the state’s population growth will continue with similar increases each year, of approximately 100,000. In the low series projection, the average annual growth is projected to gradually decrease to almost 50,000 persons per annum by 2056. When high growth assumptions are applied the projected population increases by an extra 170,000 people per annum by 2056.
3

Population projections to 2031: local government areas, 2011 edition
2.2 Past and future change The 2011 edition of the Queensland Government population projections are higher than the previous projections released in 2008. In part, this is a result of the high growth experienced since the previous edition. Much of this growth has resulted from high overseas migration and has been concentrated in the South East Queensland (SEQ) Region. Another influence on long-term projections has been the recent increase in fertility rates. Figure 2.2 provides a historical perspective to Queensland’s growth, showing population increases over 10 year periods from 1906 to 2056. In the first four decades of the period, to 1946, Queensland grew by around 100,000–200,000 people each decade. The long economic boom of the post-war years saw escalating levels of population growth occurring in Queensland with increases of almost 300,000 in the decades to 1956 and 1966 and over 400,000 in the decade to 1976. From the mid 1970s Queensland gained many people from NSW and Victoria, so that growth in the decade to 1986 was over 500,000 people and in the decade to 1996 it reached 700,000. The population then grew by another 752,200 people in the decade to 2006, the last year for which finalised population figures are available. This is equivalent to an average annual increase of 75,200 people. The current decade, from 2006 to 2016, began with an increase in annual population growth compared with previous years. From 2006 to 2010, growth averaged 106,400 annually. The medium series projections anticipate the average growth for the 10 years to 2016 to be around 100,000 annually or one million extra people for the decade. Future growth is projected to be similar, that is, around one million extra people each decade to 2056. Figure 2.2 Population change, Queensland, 10 years to June 1916 to 2056
0
100,000
200,000
300,000
400,000
500,000
600,000
700,000
800,000
900,000
1,000,000
1,100,000
1916
1926
1936
1946
1956
1966
1976
1986
1996
2006
2016
2026
2036
2046
2056
10 years to
Per
sons
Actual
Projected
Source: ABS 3105.0.65.001 and 3102.0; and 2011 edition Queensland Government population projections (medium series)
2.3 Drivers of change State population growth is derived from three components – natural increase, net interstate migration and net overseas migration. To project population change, particular assumptions
4

are made about possible changes to these components. Figure 2.3 illustrates the size of each component since 1981 and the projected size of each to 2031.
Figure 2.3 Components of change, Queensland, year to June 1981 to 2031
0
20,000
40,000
60,000
80,000
100,000
120,000
140,000
1981
1986
1991
1996
2001
2006
2011
2016
2021
2026
2031
Year to
Per
sons
Natural increase Net overseas migration Net interstate migration
ProjectedActual
Source: ABS 3101.0; and 2011 edition Queensland Government population projections (medium series)
Natural increase, the difference between the number of births and the number of deaths, is the most stable and predictable component of population increase. It currently accounts for nearly 40,000 additional residents annually (in the year to June 2010) and is projected to drop slightly as fertility rates ease and then stabilise into the foreseeable future. After 2014, the number of births is projected to increase but they are expected to be balanced by increased numbers of deaths as more people join the older age groups. The medium series projections assume a long-term fertility rate of 1.9 and life expectancy to increase by approximately 10 years to 89.4 years for males and 92.2 years for females by 2056.
Net interstate migration is the difference between the number of arrivals from elsewhere in Australia and number of departures to other states and territories. The flow of people across state boundaries can vary with changing economic conditions such as housing costs and employment growth throughout the country. The numbers moving in either direction can change and the resulting net interstate migration figure is very volatile. It has fluctuated between 49,200 (in 1993) and 16,700 (in 1999). Net interstate migration had dropped to 18,400 in the year to 30 June 2009, the latest data available when the projections were being developed. The medium growth projections include assumed net interstate migration of 25,000 after 2013.
The flows of people from overseas to live in Queensland, and from Queensland to overseas, can change quickly. The resulting net overseas migration figure is volatile in response to changing economic situations and immigration programs. It is very difficult to predict with accuracy the short, medium or longer term global economic conditions. Net overseas migration to Queensland was at record levels in 2009, although showing signs of decreasing as the Australian economic situation tightened and changes were implemented to temporary entrant requirements. In the longer term it has been assumed that average net increases due to overseas migration will remain at 180,000 per annum for Australia (similar to the 2006 figure). This accords with the Federal Treasury assumption used in the 2010 Intergenerational Report.
5

Population projections to 2031: local government areas, 2011 edition
2.4 Growth rates to decline Queensland’s population growth rates are projected to slow over the 2011 to 2056 projection period – even with high growth assumptions. The medium series projects the number of new residents each year to remain around 100,000 per annum, but this growth will represent a deceasing proportion of the population each year as the base population expands. Figure 2.4 illustrates the volatility of historical growth rates when viewed on an annual basis – a level of volatility that creates uncertainty around population projections. This uncertainty in population growth is the reason for creating low growth and high growth population projection series, in addition to medium growth projections. Figure 2.4 Annual population change (rates), Queensland, year to June 1926 to 2056
0.0
0.5
1.0
1.5
2.0
2.5
3.0
3.5
4.0
1926
1936
1946
1956
1966
1976
1986
1996
2006
2016
2026
2036
2046
2056
Year to
Cha
nge
(per
cen
t)
Projected Actual
High
Low
Medium
Source: ABS 3105.0.65.001; and 2011 edition Queensland Government population projections
Queensland’s population has grown by over 2.5 per cent per annum in recent years. This rate is high but has been exceeded in the past – growth rates of over three per cent a year were recorded in 1981, 1982 and 1989. However rates of less than 2.5 per cent per annum have been more common, as shown in the graph. The average annual growth rate for the 30 years from 1976 to 2006 was 2.3 per cent, and 2.0 per cent for the 80 years since 1926. The current and medium series projected rates of population growth are similar to or smaller than the average since 1926. The annual population growth rate is currently 2.0 per cent and is projected to slow over the 45 year projection period to 1.2 per cent per annum in 2056 (medium series). The projected annual growth rate averaged over the 45 year period 2011 to 2056 is 1.5 per cent.
2.5 Population age structure One of the most significant changes to Queensland’s future population is the projected change in the population’s age structure. One measure of this change is the projected increase in the median age – the age at which half the population is younger and half is older. The median age of the population is projected to rise under each of the low, medium and high growth projection series.
6

At the time of the last census (2006), the median age of the Queensland population was 36 years – that is, half of the population was aged younger than 36 years. By 2031 the median age is projected to rise to 40 years and by 2056 to almost 43 years (under the medium series projections). Figure 2.5 compares population growth by broad age groups over the last 25 years with the medium series projection for the 25 years to 2031. Over the quarter century to 2031 the projected increase in numbers of young people aged less than 19 years (487,200) will be larger than the growth in the previous 25 years (299,400). In the main working ages of 20–64 years, the future growth is expected to be similar to the past. However, the big difference is the much larger increase projected in the number of people aged 65 years or older – the projected increase in the 25 years to 2031 of 796,000 is almost three times that recorded in the 25 years to 2006 (267,900). Figure 2.5 Population change by broad age groups, Queensland, 25 years to June
2006 and 2031
0
100,000
200,000
300,000
400,000
500,000
600,000
700,000
800,000
900,000
0–19 20–34 35–49 50–64 65+
Age groups (years)
Per
sons
25 years to 2006 25 years to 2031
Source: ABS 3201.0; and 2011 edition Queensland Government population projections (medium series)
As the population ages, people in the older age groups will represent a much larger share of the total population. In 2006, people aged 65 and older represented 12 per cent of the population (or one in eight). By 2031, it is projected that approximately one in every five Queenslanders (20 per cent) will be aged 65 years or older. The population pyramid in Figure 2.6 illustrates the changes that have occurred in Queensland’s population structure since 1981 and the change projected to 2031. In addition to showing the projected increase in absolute numbers, the changing shape of the graph indicates the relatively larger numbers of older people projected in 2031. Almost one-third (32 per cent) of the projected increase in population from 2006 to 2031 will be in the age group 65 years or more. Part of this increase in numbers in the older ages is a result of the large baby boomer generation moving into the retirement ages. In 1981 the baby boom generation were young adults aged 16–35 years; in 2006 they were aged 41–60 years and in 2031 they will be aged 66-85 years.
7

Population projections to 2031: local government areas, 2011 edition
8
Figure 2.6 Population by age and sex, Queensland, June 1981, 2006 and 2031
010,00020,00030,00040,00050,000
2031 2006 1981
0 10,000 20,000 30,000 40,000 50,000
0
5
10
15
20
25
30
35
40
45
50
55
60
65
70
75
80
85
90
95
100+
Males Females
Source: ABS 3101.0; and 2011 edition Queensland Government population projections (medium series)
The group aged 85 years or older is projected to more than treble, from 57,100 in 2006 to 202,100 in 2031. Their proportion of the population is expected to increase from 1.4 per cent in 2006 to 3.1 per cent in 2031. Within this older age group are those aged 100 years or more, an age group projected to increase from 430 in 2006 to 6,500 in 2031.

3. Population projections for local government areas
3.1 Overview The following sections look in more detail at future growth in resident population projected for the various Queensland local government areas (LGAs). While the focus is on the medium series projections, consideration should also be given to the range provided by the low and high series (reported in Appendixes C and D). LGAs with the fastest and largest growth in the coming decade to 2021 are highlighted in Sections 3.2 and 3.3. In the remaining sections, Queensland’s LGAs are grouped into three broad regions (Figure 3.1) to more clearly identify the distinctive geographic dimension of changes to population distribution projected in the 10 years to 2021 and beyond to 2031. The three regions are defined by statistical division (SD) and statistical district boundaries to correspond where possible with planning regions.
There is one area that has been included in two regions – the city of Toowoomba, which straddles Queensland’s urban/rural divide. The urban area of Toowoomba is close to Ipswich and Brisbane and is considered an integral part of the growing population and consumer demand of the expanding SEQ population. In particular, the Toowoomba statistical district is included in the SEQ statutory regional planning area, and thus is included in the discussion on SEQ. On the other hand, Toowoomba is the headquarters of the Toowoomba Regional Council and will remain a large service centre for the rich agricultural area of the Darling Downs and the developing Surat Basin gas industry. In this sense, Toowoomba (R) rightly belongs in Eastern Regional Queensland.
Two out of three Queenslanders now live in SEQ with much of the recent increase in Queensland’s population occurring in this more densely populated south-east corner of the state. The 2011 edition of the population projections indicate that the majority of Queensland’s future population growth is expected to continue to occur in SEQ albeit with considerable differences in projected growth among LGAs within SEQ (see Section 3.4).
In regional Queensland, population growth tends to diminish with distance from the major service centres and from the coast. Figure 3.1 indicates a number of fast-growing LGAs along the east coast, from Gympie (R) to Cairns (R), plus Central Highlands (R) and Toowoomba (R). Included among these growth areas are towns that are developing rapidly to service the construction, mining, processing and transport industries associated with the coal and gas industries being developed in the hinterland (see Section 3.5).
The coal extraction industry is now expanding beyond the Bowen Basin, further west into the Galilee Basin in the Central West Statistical Division (SD). In addition, new gas fields are being developed in the Surat Basin, extending into the South West SD. Towns in these areas, such as Roma, Dalby, Chinchilla and Alpha, are expected to benefit from these industries and their populations are projected to increase in the coming years, despite the growing practice of mining companies and contractors employing non-resident labour.
Agriculture, supplemented by tourism, continues to support the majority of rural communities and in only a few areas will these industries support an expansion in population. In the large, more remote western region of Queensland, infrastructure is limited and the sparse population is located in small towns and on pastoral stations. Total population figures in the western region are projected to remain stable (see Section 3.6).
9

Population projections to 2031: local government areas, 2011 edition
Figure 3.1 Projected average annual population change (rates), local government areas, 25 years to June 2031
(C) City (R) Regional Council (S) Shire (T) Town Source: ABS 3218.0; and 2011 edition Queensland Government population projections (medium series)
10

3.2 Top 10 largest growing local government areas Larger populations have the potential to record large absolute growth, even if their growth rates are low. It is no surprise then, to see that Queensland’s two largest LGAs, Brisbane (C) and Gold Coast (C), are projected to record the largest amounts of population growth in Queensland over the decade to 2021 (Table 3.1 and Figure 3.2).
Table 3.1 Top 10 largest growing local government areas in Queensland(a), 10 years to June 2006 and 2021
2006 2021 2006 2021 2006 2021Local government areaGold Coast (C) 466,433 677,929 143,844 133,764 3.8 2.2Brisbane (C) 991,260 1,210,093 166,771 124,479 1.9 1.1Ipswich (C) 142,477 286,430 19,643 110,961 1.5 5.0Sunshine Coast (R) 295,084 420,439 84,613 82,010 3.4 2.2Moreton Bay (R) 332,862 467,860 76,217 77,656 2.6 1.8Logan (C) 260,021 365,443 34,649 76,433 1.4 2.4Townsville (C) 165,278 241,684 33,153 50,565 2.3 2.4Cairns (R) 147,538 207,756 26,710 34,866 2.0 1.9Mackay (R) 107,332 156,117 21,511 34,720 2.3 2.5Toowoomba (R) 151,297 198,591 22,095 34,090 1.6 1.9
— number — — number — — % —
Population (b) Total population change
Average annual population change
30 June 10 years to 30 June 10 years to 30 June
(a) Ranked by projected population change over the 10 years to 2021 (b) 2006 (estimated resident population) and 2021 (projected resident population) Source: ABS 3218.0; and 2011 edition Queensland Government population projections (medium series)
Of the two LGAs, Gold Coast (C) has the smaller population (466,400 in 2006), but is projected to have larger growth over the 10 year period to 2021. It is projected to grow by 133,800 people in the decade, an average annual rate of 2.2 per cent. With a population twice the size, Brisbane (C) (population of 991,300 in 2006) is projected to grow by a total of 124,500 people over the 10 years to 2021. As a proportion of its large population, this growth represents a small average annual growth rate of 1.1 per cent. Ipswich (C) is ranked third in projected growth, with a projected increase of 111,000 people in the decade to 2021. Its population is much smaller than Brisbane (C) or Gold Coast (C) so this large increase translates into Ipswich (C) having a much higher annual growth rate, averaging a remarkably high 5.0 per cent per annum for the decade. Large and fast population growth will have significant consequences on local infrastructure and lifestyle in the Ipswich area.
In 2006 Ipswich (C) had a population of 142,500, just one-seventh the size of Brisbane (C). By 2021 it is projected to double its population to 286,400 and be one-quarter the size of Brisbane (C). By 2031 it is expected to grow by another 175,600 residents. In 2031 the population of Ipswich (C) (462,000) is projected to be one-third the size of Brisbane (C) and similar in size to the population of Gold Coast (C) in 2006. It should be noted that three of the top 10 largest growing LGAs over the 10 years to 2021 can be found outside SEQ. These include the major cities to the north, Townsville and Cairns, plus Mackay; the latter emerging as an attractive lifestyle destination with strong employment opportunities resulting from the expansion of the coal industry to its west and south.
11

Population projections to 2031: local government areas, 2011 edition
Figure 3.2 Top 10 largest growing local government areas in Queensland(a), population growth in the 10 years to June 2006 and 2021
0
20,000
40,000
60,000
80,000
100,000
120,000
140,000
160,000
180,000
Gold
Coa
st (C
)
Brisba
ne (C
)
Ipsw
ich (C
)
Sunsh
ine
Coast
(R)
Mor
eton
Bay
(R)
Loga
n (C
)
Towns
ville
(C)
Cairn
s (R
)
Mac
kay
(R)
Toowoo
mba
(R)
Per
sons
10 years to 2006 10 years to 2021
(a) Ranked by projected population change over the 10 years to 2021 Source: ABS 3218.0; and 2011 edition Queensland Government population projections (medium series)
Most of the top 10 largest growing LGAs are projected to have higher growth in the decade to 2021 than they did in the decade 1996 to 2006. The outstanding example is Ipswich (C), where future growth is projected to be five times greater than the past. Logan (C) has projected growth of 76,400 in 2011–2021, which is double its recorded growth in 1996–2006. At the other end of the scale, Moreton Bay (R) and Sunshine Coast (R) are projected to experience future growth similar to the past while the two largest LGAs of Gold Coast (C) and Brisbane (C) are projected to experience lower growth in the future.
3.3 Top 10 fastest growing local government areas Fast growth, measured as high percentage growth rate, is not necessarily related to large population size. Small populations can record high growth rates with the addition of only a relatively small number of people. Ipswich (C) is prominent as number one in the top 10 fastest growing LGAs over the decade to 2021 (Table 3.2 and Figure 3.3). Its average growth rate of 5.0 per cent per annum is much higher than the other LGAs and higher than its recorded average growth rate of 1.5 per cent from 1996 to 2006. This remarkably high projected rate of growth is based on the large number of housing lots currently being developed or flagged to commence in the coming 10 years. Scenic Rim (R) is another LGA projected to gain population from the growth of communities surrounding Brisbane. Ranked at number two for projected growth rate from 2011 to 2021, Scenic Rim (R) is projected to grow by an average of 3.5 per cent per annum with an increase of 15,900 people over the decade. Gladstone (R) and Isaac (R) are ranked third and fourth, with average annual growth rates of 3.1 per cent and 3.0 per cent. They are projected to experience relatively fast increases in resident population due to the growth in resource activity. This will be a particularly significant change for Isaac (R), which experienced little growth from 1996 to 2006.
12

Table 3.2 Top 10 fastest growing local government areas in Queensland(a), 10 years
to June 2006 and 2021
2006 2021 2006 2021 2006 2021Local government areaIpswich (C) 142,477 286,430 19,643 110,961 1.5 5.0Scenic Rim (R) 34,750 55,002 6,608 15,853 2.1 3.5Gladstone (R) 53,941 85,655 9,817 22,673 2.0 3.1Isaac (R) 21,113 31,418 545 8,141 0.3 3.0Lockyer Valley (R) 31,932 49,000 4,400 11,290 1.5 2.7Whitsunday (R) 31,355 46,008 4,278 10,265 1.5 2.6Mackay (R) 107,332 156,117 21,511 34,720 2.3 2.5Central Highlands (R) 28,256 40,880 2,249 9,019 0.8 2.5Townsville (C) 165,278 241,684 33,153 50,565 2.3 2.4Logan (C) 260,021 365,443 34,649 76,433 1.4 2.4
— number — — number — — % —
Population (b) Total population change
Average annual population change
30 June 10 years to 30 June 10 years to 30 June
(a) Ranked by projected average annual change (rate) over the 10 years to 2021 (b) 2006 (estimated resident population) and 2021 (projected resident population) Source: ABS 3218.0; and 2011 edition Queensland Government population projections (medium series)
Figure 3.3 Top 10 fastest growing local government areas in Queensland(a), average
annual change (rate) in the 10 years to June 2006 and 2021
0
1
2
3
4
5
6
Ipsw
ich (C
)
Sceni
c Rim
(R)
Glad
ston
e (R
)
Isaa
c (R)
Lock
yer V
alley
(R)
Whits
unda
y (R
)
Mac
kay
(R)
Centra
l High
land
s (R
)
Towns
ville
(C)
Loga
n (C
)
Cha
nge
(per
cen
t)
10 years to 2006 10 years to 2021
(a) Ranked by projected average annual change (rate) over the 10 years to 2021 Source: ABS 3218.0; and 2011 edition Queensland Government population projections (medium series)
3.4 South East Queensland local government areas South East Queensland (SEQ) Region is comprised of the statistical divisions (SDs) of Brisbane, Gold Coast, Sunshine Coast and West Moreton, and the Toowoomba statistical district (which is basically the urban area of Toowoomba). SEQ contains 10 local government areas (LGAs) plus part of Toowoomba (R). This definition has been used to ensure the region corresponds to the South East Queensland statutory regional planning area.
13

Population projections to 2031: local government areas, 2011 edition
3.4.1 High population growth SEQ is expected to continue to dominate the state’s future growth figures because of its large population. The region’s population is projected to grow from 2.8 million people in 2006 to 4.6 million in 2031, a figure greater than the current Queensland population. The population of SEQ Region is projected to grow by almost 1.8 million extra people from 2006 to 2031, approximately 70,600 people each year. This represents an average annual growth rate of approximately 2.0 per cent in the decade to 2021, declining to 1.7 per cent average annual growth for the decade to 2031. It is projected the region will continue to gain people faster than the state average, and therefore will increase its proportion of the state’s population. The medium series projections indicate SEQ Region will be home to 70 per cent of all Queenslanders by 2031, an increase from 69 per cent in 2006. The coastal LGAs of Brisbane (C), Gold Coast (C), Moreton Bay (R) and Sunshine Coast (R) are the four largest LGAs in Australia by population. Together they account for almost three-quarters of SEQ Region’s population in 2006 and they are expected to absorb much of the region’s future population growth. But growth rates are projected to decline in each of these large LGAs over the projection period. Brisbane (C) alone contained 35 per cent of the region’s people in 2006 but this is projected to drop to 31 per cent by 2021 and to 28 per cent by 2031 (Table 3.3). While the population of Brisbane (C) increased by 166,800 in the 10 years to 2006, its future population increases are projected to be smaller – an extra 124,500 people in the 10 years to 2021 and an extra 62,200 in the 10 years to 2031 (Table 3.4). Its average annual rate of growth, which was 1.9 per cent from 1996 to 2006, is expected to fall to 1.1 per cent from 2011 to 2021 and fall further to 0.5 per cent from 2021 to 2031. It is anticipated that much of the population growth in Brisbane (C) will be accommodated by way of infill and redevelopment, rather than new greenfield developments. Table 3.3 Population and share of region, local government areas in South East
Queensland Region, June 2006, 2021 and 2031
Local government area number % of region number % of region number % of regionBrisbane (C) 991,260 35.1 1,210,093 31.1 1,272,272 27.7Gold Coast (C) 466,433 16.5 677,929 17.4 798,417 17.4
Ipswich (C) 142,477 5.0 286,430 7.4 461,990 10.1
Lockyer Valley (R) 31,932 1.1 49,000 1.3 63,551 1.4Logan (C) 260,021 9.2 365,443 9.4 452,184 9.8
Moreton Bay (R) 332,862 11.8 467,860 12.0 533,170 11.6
Redland (C) 131,210 4.6 169,607 4.4 188,471 4.1Scenic Rim (R) 34,750 1.2 55,002 1.4 80,364 1.7
Somerset (R) 19,676 0.7 28,131 0.7 35,245 0.8Sunshine Coast (R) 295,084 10.4 420,439 10.8 508,177 11.1
Toowoomba Statistical District 121,861 4.3 161,005 4.1 199,247 4.3
Total 2,827,566 100.0 3,890,939 100.0 4,593,088 100.0
Projected resident populationEstimated resident population
2006
30 June
2021 2031
30 June
Source: ABS 3218.0; and 2011 edition Queensland Government population projections (medium series)
14

Table 3.4 Population change, local government areas in South East Queensland Region, 10 years to June 2006, 2021 and 2031
2006 2021 2031 2006 2021 2031Local government areaBrisbane (C) 166,771 124,479 62,179 1.9 1.1 0.5Gold Coast (C) 143,844 133,764 120,488 3.8 2.2 1.6Ipswich (C) 19,643 110,961 175,560 1.5 5.0 4.9Lockyer Valley (R) 4,400 11,290 14,551 1.5 2.7 2.6Logan (C) 34,649 76,433 86,741 1.4 2.4 2.1Moreton Bay (R) 76,217 77,656 65,310 2.6 1.8 1.3Redland (C) 28,128 23,733 18,864 2.4 1.5 1.1Scenic Rim (R) 6,608 15,853 25,362 2.1 3.5 3.9Somerset (R) 2,618 5,629 7,114 1.4 2.3 2.3Sunshine Coast (R) 84,613 82,010 87,738 3.4 2.2 1.9Toowoomba Statistical District 19,839 27,842 38,242 1.8 1.9 2.2Total 587,329 689,602 702,125 0.5 2.0 1.7
— number — — % —
Total population change Average annual population change
10 years to 30 June 10 years to 30 June
Source: ABS 3218.0; 2011 edition Queensland Government population projections (medium series)
Population growth in Gold Coast (C) is also projected to decline from current levels. From 2011 to 2021 Gold Coast (C) is expected to gain 133,800 people, fewer than the 143,800 increase from 1996 to 2006, when its average annual growth rate of 3.8 per cent was the highest in the state. Percentage growth rates are projected to fall in the large LGAs of Moreton Bay (R) and Sunshine Coast (R). Nevertheless the numbers of new residents in the decade to 2021 (77,700 and 82,000 respectively) are expected to be similar to the numbers absorbed from 1996 to 2006. Logan (C) is projected to increase its current rate of population growth – in the 10 years to 2021 its population is expected to increase by 76,400 or 2.4 per cent. The projections anticipate the fastest growth in SEQ Region’s western ‘growth corridor’, with the development of large new residential areas. Much of this growth is expected in Ipswich (C) – its population in 2021 is projected to be 286,400, double its 2006 population. Population growth rates are also projected to increase in the smaller regional councils of Scenic Rim (R), Lockyer Valley (R) and Somerset (R). Scenic Rim (R) is expected to have particularly high growth rates above three per cent per annum and be home to 55,000 people by 2021, a 58 per cent increase on its 2006 population of 34,800. Similarly, Lockyer Valley (R), with the third fastest growth, can expect a 53 per cent increase in population.
3.4.2 Population age structure The SEQ population is projected to age significantly in coming years. The median age, which was 36 years in 2006, is projected to be 38 in 2021 and 40 in 2031. This increase results from the larger projected growth in numbers of older people compared with younger people, as can be seen in Figure 3.4. By virtue of its large population share, the SEQ age profile is similar to that of the state in total, which was discussed in Section 2.5.
15

Population projections to 2031: local government areas, 2011 edition
Figure 3.4 Population by broad age group, South East Queensland Region, June 2006, 2021 and 2031
0
200,000
400,000
600,000
800,000
1,000,000
1,200,000
0–19 20–34 35–49 50–64 65+
Age group (years)
Per
sons
2006 2021 2031
Source: ABS 3218.0; and 2011 edition Queensland Government population projections (medium series)
In 2021 there is projected to be 644,600 people aged 65 years or older in SEQ, an increase of 54 per cent or 224,900 people in the 10 years from 2011 to 2021. It is projected that 13 out of every 100 people will be aged 65 years or older in 2011 and this will increase to 17 out of every 100 by 2021. The other broad age groups shown in Figure 3.4 are projected to record smaller increases in numbers from 2011 to 2021, of less than 140,000. Young workers aged 20–34 years are projected to record the smallest growth. The numbers in this age group are expected to grow gradually, by 14 per cent (95,200 people). In the projection data, the differential between growth in younger and older people varies across the region due to different drivers of change. In areas with smaller population movement, many of the current residents will remain and as they age the population’s median age will slowly rise. Some coastal areas are particularly attractive to older people for retirement and the numbers of older residents in these areas are projected to increase substantially. By contrast, the development of new housing estates in the south-west of the region is expected to attract many young families, and these people will keep the average age in the area low. Brisbane (C) is projected to record a relatively small (11 per cent) increase in total population in the 10 years to 2021. It is expected that people aged 65 or older will increase more quickly (by 35 per cent) whereas the number aged 0–19 will increase by just 7.1 per cent and the number of young workers aged 20–34 will be practically stable. As a result, the median age in Brisbane (C) is projected to increase from 35 to 37 years. Due to its current age structure and relative attractiveness for older people, Redland (C) is projected to have the largest increase in median age in the 10 years to 2021, from 39 to 43 years. There is projected to be a 72 per cent increase in the number of people aged 65 years or older, despite the total population increasing only 16 per cent. Scenic Rim (R) is the only LGA in the region projected to have a decrease in median age in the decade to 2021, from 40 to 38 years. This is a result of a projected increase of 8,300 younger people up to 34 years, compared with 5,500 older people aged 50 years or more.
16

Ipswich (C) had the youngest median age (33 years) of any LGA in the region in 2006 and throughout the projection period. In the 10 years to 2021, Ipswich (C) is projected to have a larger increase in the number of young people than any other LGA in Queensland. The number aged less than 35 years is expected to increase by 56,700 in Ipswich (C), one-quarter of the increase throughout SEQ (despite starting with just 6.1 per cent of the region’s population under 35 years). The younger age profiles projected for the Scenic Rim (R) and Ipswich (C) are consistent with an expected influx of young families, including children, to the new residential developments in both areas.
3.5 Eastern Regional Queensland local government areas
3.5.1 Population change Eastern Regional Queensland is made up of the statistical divisions (SD) adjacent to South East Queensland (including Darling Downs SD) and those on the eastern seaboard. It contains 42 LGAs, as shown in Figure 3.1. There are many attractive lifestyle destinations and relatively good housing affordability in many parts of Eastern Regional Queensland. The larger regional centres have strong industrial, educational and tourism sectors, which create jobs and encourage people to reside in the region, leading to ongoing population growth. Population growth in the region is concentrated in and around the larger cities and towns. The continuing demand for resources is expected to drive population growth throughout much of the region, despite the increasing use of non-resident workers, who fly or drive in and out to mining sites. Many of these mine and construction workers are resident in the larger towns and cities within Eastern Regional Queensland. Additionally, a number of related businesses have emerged in the regional cities to service resource communities. Overall growth in Eastern Regional Queensland is projected to remain strong, averaging more than 30,000 new people a year over the projection period. The resident population of this region was 1.3 million people in 2006 (Table 3.5). By 2031 the population is projected to grow to 2.1 million people, an increase of 0.8 million people over the 25 year period. This is substantially higher than the growth of almost 0.5 million recorded over the previous 25 years. The region is projected to consistently account for around one third of Queensland’s population. The three most populous LGAs of Townsville (C), Toowoomba (R) and Cairns (R) made up 35 per cent of the region’s population in 2006 and this share is projected to grow. However, population growth is expected to be more widespread in the future. These three LGAs accounted for 44 per cent of the region’s population growth from 1996 to 2006, but this is projected to fall to 39 per cent in the decade to 2021.
17

Population projections to 2031: local government areas, 2011 edition
Table 3.5 Population and share of region, local government areas in Eastern Regional Queensland, June 2006, 2021 and 2031
Local government area number % of region number % of region number % of region
Aurukun (S) 1,129 0.1 1,338 0.1 1,407 0.1
Banana (S) 15,572 1.2 17,310 1.0 18,277 0.9
Bundaberg (R) 87,898 6.7 117,585 6.6 139,350 6.6
Burdekin (S) 18,085 1.4 19,207 1.1 19,488 0.9Cairns (R) 147,538 11.2 207,756 11.7 241,494 11.4
Cassowary Coast (R) 29,642 2.3 33,198 1.9 34,841 1.6
Central Highlands (R) 28,256 2.2 40,880 2.3 50,742 2.4
Charters Towers (R) 12,155 0.9 14,063 0.8 14,963 0.7
Cherbourg (S) 1,225 0.1 1,451 0.1 1,781 0.1
Cook (S) 3,695 0.3 4,544 0.3 5,157 0.2
Croydon (S) 274 0.0 288 0.0 295 0.0Etheridge (S) 900 0.1 992 0.1 1,026 0.0
Fraser Coast (R) 89,247 6.8 130,005 7.3 164,143 7.8
Gladstone (R) 53,941 4.1 85,655 4.8 111,690 5.3
Goondiwindi (R) 10,741 0.8 12,352 0.7 13,140 0.6
Gympie (R) 44,177 3.4 57,669 3.2 67,373 3.2
Hinchinbrook (S) 12,239 0.9 12,815 0.7 13,231 0.6Hope Vale (S) 842 0.1 914 0.1 939 0.0
Isaac (R) 21,113 1.6 31,418 1.8 37,000 1.8
Kowanyama (S) 1,101 0.1 1,367 0.1 1,526 0.1
Lockhart River (S) 599 0.0 705 0.0 761 0.0
Mackay (R) 107,332 8.2 156,117 8.8 187,367 8.9
Mapoon (S) 256 0.0 344 0.0 404 0.0Napranum (S) 908 0.1 1,189 0.1 1,372 0.1
North Burnett (R) 10,756 0.8 11,342 0.6 11,899 0.6
Northern Peninsula Area (R) 2,138 0.2 2,583 0.1 2,861 0.1
Palm Island (S) 2,145 0.2 2,632 0.1 3,002 0.1
Pormpuraaw (S) 644 0.0 778 0.0 855 0.0
Rockhampton (R) 107,517 8.2 138,933 7.8 162,873 7.7South Burnett (R) 30,778 2.3 36,765 2.1 40,592 1.9
Southern Downs (R) 33,589 2.6 41,824 2.4 47,402 2.2
Tablelands (R) 43,507 3.3 53,464 3.0 59,873 2.8
Toowoomba (R) 151,297 11.5 198,591 11.2 244,340 11.6
Torres (S) 3,496 0.3 4,034 0.2 4,359 0.2
Torres Strait Island (R) 4,713 0.4 5,693 0.3 6,308 0.3
Townsville (C) 165,278 12.6 241,684 13.6 295,578 14.0
Weipa (T) 3,007 0.2 4,471 0.3 4,940 0.2
Western Downs (R) 30,180 2.3 36,503 2.1 40,397 1.9
Whitsunday (R) 31,355 2.4 46,008 2.6 55,451 2.6
Woorabinda (S) 918 0.1 1,152 0.1 1,357 0.1
Wujal Wujal (S) 348 0.0 405 0.0 436 0.0
Yarrabah (S) 2,558 0.2 3,252 0.2 3,707 0.2
Total 1,313,089 100.0 1,779,276 100.0 2,113,997 100.0
Estimated resident population
Projected resident population
2006 2021 2031
Projected resident population
30 June 30 June 30 June
Source: ABS 3218.0; and 2011 edition Queensland Government population projections (medium series)
It is anticipated that the flow-on economic activity associated with developing mineral and energy resources will lead to higher population growth rates in other centres in the region. Mackay (R) in particular is projected to increase its population growth, from 21,500 people in the decade to 2006 to 34,700 in the decade to 2021, equivalent to an average annual growth rate of 2.6 per cent from 2011 to 2021 (Table 3.6).
18

Table 3.6 Population change, local government areas in Eastern Regional Queensland, 10 years to June 2006, 2021 and 2031
2006 2021 2031 2006 2021 2031
Local government areaAurukun (S) 293 101 69 3.1 0.8 0.5Banana (S) 149 1,568 967 0.1 0.7 0.8
Bundaberg (R) 13,245 19,052 21,765 1.6 1.8 1.7Burdekin (S) -870 540 281 -0.5 0.3 0.1
Cairns (R) 26,710 34,866 33,738 2.0 1.8 1.5Cassowary Coast (R) 748 1,827 1,643 0.3 0.6 0.5
Central Highlands (R) 2,249 9,019 9,862 0.8 2.5 2.2Charters Towers (R) -307 1,084 900 -0.2 0.8 0.6
Cherbourg (S) 90 188 330 0.8 1.4 2.1
Cook (S) 500 526 613 1.5 1.1 1.1Croydon (S) -13 7 7 -0.5 0.3 0.2
Etheridge (S) -57 30 34 -0.6 0.3 0.3Fraser Coast (R) 19,963 25,150 34,138 2.6 2.2 2.4
Gladstone (R) 9,817 22,673 26,035 2.0 3.1 2.7Goondiwindi (R) 848 960 788 0.8 0.8 0.6
Gympie (R) 7,274 8,382 9,704 1.8 1.6 1.6Hinchinbrook (S) -1,123 406 416 -0.9 0.3 0.3
Hope Vale (S) 19 44 25 0.2 0.5 0.3
Isaac (R) 545 8,141 5,582 0.3 2.8 2.1Kowanyama (S) 80 175 159 0.8 1.4 1.1
Lockhart River (S) 26 68 56 0.4 1.0 0.8Mackay (R) 21,511 34,720 31,250 2.3 2.6 1.8
Mapoon (S) 72 59 60 3.4 1.9 1.6Napranum (S) 154 187 183 1.9 1.7 1.4
North Burnett (R) -448 538 557 -0.4 0.5 0.5Northern Peninsula Area (R) 270 295 278 1.4 1.2 1.0
Palm Island (S) 12 344 370 0.1 1.4 1.3
Pormpuraaw (S) 91 87 77 1.5 1.2 0.9Rockhampton (R) 11,720 21,321 23,940 1.2 1.7 1.6
South Burnett (R) 3,647 3,627 3,827 1.3 1.0 0.9
Southern Downs (R) 3,063 5,409 5,578 1.0 1.4 1.2
Tablelands (R) 3,613 5,892 6,409 0.9 1.2 1.1
Toowoomba (R) 22,095 34,090 45,749 1.6 1.9 2.1
Torres (S) 349 251 325 1.1 0.6 0.8
Torres Strait Island (R) 1,049 649 615 2.5 1.2 1.0
Townsville (C) 33,153 50,565 53,894 2.3 2.4 2.0
Weipa (T) 522 798 469 1.9 1.9 1.0
Western Downs (R) 1,416 4,339 3,894 0.5 1.2 0.9
Whitsunday (R) 4,278 10,265 9,443 1.5 2.7 1.8
Woorabinda (S) -236 176 205 -2.3 1.7 1.6
Wujal Wujal (S) 9 37 31 0.3 1.0 0.7
Yarrabah (S) 520 464 455 2.3 1.5 1.3
Total 187,046 308,920 334,721 1.5 1.9 1.7
— number — — % —
Total population change Average annual population change
10 years to 30 June 10 years to 30 June
Source: ABS 3218.0; and 2011 edition Queensland Government population projections (medium series)
Population growth in Gladstone (R) is projected to increase to 3.1 per cent per annum or an additional 22,700 people in the 10 years to 2021. Its population is projected to reach the milestone of 100,000 people in 2027. Rockhampton (R) and Fraser Coast (R) are also projected to increase by more than 20,000 people in the decade to 2021, and Bundaberg (R) by 19,100 people. Among the smaller LGAs in the region are three that can anticipate high growth rates associated with the mining and tourism industries – Isaac (R) (average 2.8 per cent per
19

Population projections to 2031: local government areas, 2011 edition
annum in the decade to 2021), Whitsunday (R) (2.7 per cent) and Central Highlands (R) (2.5 per cent). Together, these three adjacent LGAs are projected to become home to another 27,400 people in the 10 years to 2021. None of the LGAs in the region are projected to experience population loss in the decade to 2021, but a number of those with smaller populations are projected to have average annual growth rates of less than one per cent. These range in size from Cassowary Coast (R) (population of 33,200 expected in 2021) and Burdekin (S) (19,200), to Hope Vale (S) (910) and Croydon (S) (290).
3.5.2 Population age structure There are a number of longstanding trends apparent in the age structure of Eastern Regional Queensland’s communities. Many of these trends have been projected to continue, resulting in the future projected population structure shown in Figure 3.5. Figure 3.5 Population by broad age group, Eastern Regional Queensland, June
2006, 2021 and 2031
0
100,000
200,000
300,000
400,000
500,000
600,000
0–19 20–34 35–49 50–64 65+
Age group (years)
Per
sons
2006 2021 2031
Source: ABS 3218.0; and 2011 edition Queensland Government population projections (medium series)
One significant trend that has been factored into the projected age structure is the ageing of the current population and the movement through the age profile of the large baby boomer cohort. This group, aged 41–60 years in 2006, will be aged 56–75 in 2021 (and in the two older age groups in Figure 3.5). The baby boomers will all be in the oldest age group by 2031. Although each broad age group shown in Figure 3.5 is projected to increase in size, the largest increases, both numerical and percentage, are projected for the oldest age group (65 years or more). Eastern Regional Queensland is projected to record an increase of 102,000 people aged 65 years or more over the 10 years to 2021. This represents a 52 per cent increase. Growth in people aged 65 years or older is projected to account for one-third of all growth in the region over the 10 year period. The median age of the population in Eastern Regional Queensland is projected to rise from 36 years in 2006 to 39 in 2021. Another trend projected to continue is the movement of young people aged 15–24 years away from the more remote areas and from smaller towns to larger urban centres either within the region or further afield in South East Queensland, interstate or overseas. After a few years of education or work, some return to their home communities, but others remain in the city for
20

21
many years and may never return. This loss of young adults results in many of the smaller communities having a relatively older population. The rationalisation of the agricultural workforce over past decades has also resulted in the loss of farming families from many rural areas. While some of these families settled in nearby towns, many sought employment and other opportunities in the region’s cities or in more distant areas. This also has contributed to an older population profile being found in some rural communities. Many communities in Eastern Regional Queensland have proved attractive to older people looking for retirement destinations, often in a coastal location. There has been an influx of older people to such centres, typically from rural areas and smaller towns within Eastern Regional Queensland and from areas further west. One example is Bundaberg (R) where the number of people aged 65 and over in 2006 represented 17 per cent of the population (compared with the state average of 12 per cent). The age profile of the projected population varies considerably across the region. As an example, Figure 3.6 contrasts the 2021 projected population age structures of two LGAs in the region – the slowly growing Hinchinbrook (S), known for its scenic coastline, and Isaac (R) with a coal mining industry that is expanding rapidly. By combining the two oldest age groups, it can be seen that more than half (54 per cent) of the population of Hinchinbrook (S) is projected to be aged 50 years or older in 2021, in contrast to 16 per cent of Isaac’s (R) population. Figure 3.6 Proportion of projected population by broad age group, Hinchinbrook (S)
and Isaac (R), June 2021 Isaac (R)
30%
25%
28%
12%
5%
Hinchinbrook (S)
20%
13%
12%23%
32%
0–19 20–34 35–49 50–64 65+
Source: 2011 edition Queensland Government population projections (medium series)
Of all the LGAs in Eastern Regional Queensland, Hinchinbrook (S) has the highest proportion (31 per cent) of people aged 65 years or older in their projected population in 2021. This older age group is also projected to be a large proportion in Burdekin (S) (27 per cent in 2021), North Burnett (R) (24 per cent) and Southern Downs (R) (24 per cent).

Population projections to 2031: local government areas, 2011 edition
At the other end of the scale, Yarrabah (S), Palm Island (R), Woorabinda (S), Cherbourg (S) and Isaac (R) are projected to have only 4.5 per cent or less of their population in this older age group by 2021. Young people aged less than 20 years are projected to make up just 30 per cent of the population of Isaac (R) but the other four LGAs are expected to have high proportions (43–45 per cent) of young people. Half of the total projected increase in population for Eastern Regional Queensland in the 10 years to 2021 is expected to occur in the four LGAs of Cairns (R), Mackay (R) Toowoomba (R) and Townsville (C) (Figure 3.7). Together they account for 28,400 or 53 per cent of the region’s projected growth in young people under age 20 years and 45,600 or 45 per cent of the projected growth of older people aged 65 years or more. It is interesting to contrast Cairns (R) and Mackay (R), which are each projected to gain almost 35,000 extra people, but of different ages. The majority (58 per cent) of the increase in population in Cairns (R) is expected to be people aged 50 years or more, but only 39 per cent of the increase in Mackay (R). Figure 3.7 Projected population change by broad age group, Cairns (R), Mackay (R),
Toowoomba (R) and Townsville (C), 10 years to June 2021
0
10,000
20,000
30,000
40,000
50,000
60,000
Cairns (R) Mackay (R) Toow oomba (R) Tow nsville (C)
Per
sons
0–19 20–34 35–49 50–64 65+
Source: 2011 edition Queensland Government population projections (medium series)
3.6 Western Regional Queensland local government areas
3.6.1 Population change Western Queensland, defined as the statistical divisions of South West, Central West and North West, is made up of 22 LGAs. In 2006 the region had a population of 72,100 people, approximately 10,400 less than a quarter of a century earlier in 1981, when the population was 82,600 people. Projections are for modest growth to occur in the region over the coming quarter of a century (Table 3.7). The projected growth from 2011 to 2021 (around 6,400 people) is a result of assumed net positive migration to the region, based on assumptions of further development of mineral and energy resources.
22

Table 3.7 Population and share of region, local government areas in Western Regional Queensland, June 2006, 2021 and 2031
Local government area number % of region number % of region number % of region
Balonne (S) 4,927 6.8 5,183 6.5 5,663 6.7Barcaldine (R) 3,462 4.8 3,934 5.0 4,185 4.9Barcoo (S) 383 0.5 340 0.4 346 0.4Blackall Tambo (R) 2,138 3.0 2,043 2.6 2,091 2.5Boulia (S) 450 0.6 479 0.6 551 0.6Bulloo (S) 394 0.5 363 0.5 368 0.4Burke (S) 531 0.7 643 0.8 707 0.8Carpentaria (S) 2,076 2.9 2,089 2.6 2,065 2.4Cloncurry (S) 3,366 4.7 3,779 4.8 3,844 4.5Diamantina (S) 302 0.4 362 0.5 404 0.5Doomadgee (S) 1,170 1.6 1,422 1.8 1,526 1.8Flinders (S) 1,911 2.6 1,759 2.2 1,752 2.1Longreach (R) 4,326 6.0 4,525 5.7 4,889 5.8Maranoa (R) 13,070 18.1 15,301 19.3 17,172 20.2McKinlay (S) 955 1.3 908 1.1 902 1.1Mornington (S) 1,121 1.6 1,479 1.9 1,694 2.0Mount Isa (C) 21,114 29.3 24,858 31.3 26,927 31.7Murweh (S) 4,863 6.7 4,819 6.1 4,804 5.7Paroo (S) 2,063 2.9 1,848 2.3 1,829 2.2Quilpie (S) 1,049 1.5 990 1.2 979 1.2Richmond (S) 969 1.3 950 1.2 971 1.1Winton (S) 1,474 2.0 1,330 1.7 1,348 1.6
Total 72,114 100.0 79,404 100.0 85,017 100.0
2006 2021 2031
Estimated resident population
Projected resident population
Projected resident population
30 June 30 June 30 June
Source: ABS 3218.0; and 2011 edition Queensland Government population projections (medium series)
Just as patterns of past population change were varied in the different communities throughout the western areas of Queensland, growth is projected in the future in some areas and population loss is projected to continue in others. In some cases growth will result from localised activity, for example, in communities where a mine is opened or additional land is developed for a new crop. In other cases, projected population loss represents a continuation of the slow, long-term trend of the depopulation of inland areas of Australia. Agricultural practices have changed in response to economic and technological developments and workforces rationalised with temporary or contract positions replacing previously permanent jobs. In addition, small towns have struggled to maintain a level of services sufficient for their local communities, who increasingly gain services from more distant cities, either by travel or use of the internet. Population growth is projected to average 640 people each year, or 0.8 per cent per annum, for Western Regional Queensland in the 10 years to 2021 (Table 3.8). Many LGAs in the region are projected to have a relatively stable population size over coming decades. The majority of growth (71 per cent) in the 10 years to 2021 is projected to occur in the two largest LGAs of Mount Isa (C) and Maranoa (R). Both areas are expected to be impacted by further resource development. Due to its large size, population change in Mount Isa has a significant impact on the Western Regional Queensland’s total population. It has a history of more volatile population numbers compared with its pastoral surrounds, as its economy reacts to the changing fortunes of the mining industry in the North West. In 2006 Mount Isa (C) had a population of 21,100, accounting for 29 per cent of the population of the region. The current and likely future
23

Population projections to 2031: local government areas, 2011 edition
demand for resources is strong, encouraging the expansion of existing mines and the opening of new mines. As a result, the population of Mount Isa (C) is projected to grow by 2,500 people in the 10 years to 2021. With population decline continuing in many of the smaller communities in the region, Mount Isa (C) is projected to increase its share of the region’s population to 31 per cent in 2021. Table 3.8 Population change, local government areas in Western Regional
Queensland, 10 years to June 2006, 2021 and 2031
2006 2021 2031 2006 2021 2031
Local government areaBalonne (S) 102 378 480 0.2 0.1 0.4
Barcaldine (R) -230 522 251 -0.6 1.1 0.5Barcoo (S) -87 -3 6 -2.0 -0.1 0.2
Blackall Tambo (R) -327 26 48 -1.4 0.1 0.2
Boulia (S) -80 45 72 -1.6 1.0 1.4
Bulloo (S) -126 4 5 -2.7 -1.4 1.0Burke (S) 252 56 64 6.6 1.1 0.9
Carpentaria (S) 100 -26 -24 0.5 -0.1 -0.1
Cloncurry (S) 173 345 65 0.5 0.3 0.2Diamantina (S) -22 34 42 -0.7 1.0 1.1
Doomadgee (S) 279 133 104 2.8 1.1 0.7
Flinders (S) -323 -62 -7 -1.5 -0.3 0.0
Longreach (R) -152 262 364 -0.3 0.6 0.8Maranoa (R) 547 2,005 1,871 0.4 1.5 1.2
McKinlay (S) -202 -10 -6 -1.9 -0.1 -0.1
Mornington (S) -7 246 215 -0.1 2.0 1.4
Mount Isa (C) -1,272 2,520 2,069 -0.6 1.1 0.8Murweh (S) -123 -19 -15 -0.2 0.4 0.2
Paroo (S) -247 -44 -19 -1.1 -0.2 -0.1
Quilpie (S) -236 -8 -11 -2.0 1.0 0.9
Richmond (S) -160 12 21 -1.5 0.1 0.2Winton (S) -177 -22 18 -1.1 -0.2 0.1
Total -2,318 6,394 5,613 -0.3 0.8 0.7
Total population change Average annual population change
10 years to 30 June 10 years to 30 June
— number — — % —
Source: ABS 3218.0; and 2011 edition Queensland Government population projections (medium series)
Maranoa (R) contains much of the Surat Basin coal seam gas fields which are being developed. Further exploration and development of this resource, including the construction of pipelines, is expected to add impetus to the local economy. The resident population of Maranoa (R) is projected to grow by 2,000 people in the 10 years to 2021, to just over 15,300 people. There are eight LGAs with a projected population decline in the 10 years to 2021. Although the amount of population decline is very small – each is projected to lose fewer than 70 people – the loss can be significant for areas with a small population. In each of these areas where continuing population losses have been projected, the projected population decline in the 10 years to 2021 is smaller than that recorded for the 10 years to 2006.
3.6.2 Population age structure Many of the current population trends in Western Regional Queensland are projected to continue in the coming 20 years. Young people leave the region seeking education and employment options; some return but many do not. Residents who come to the region from
24
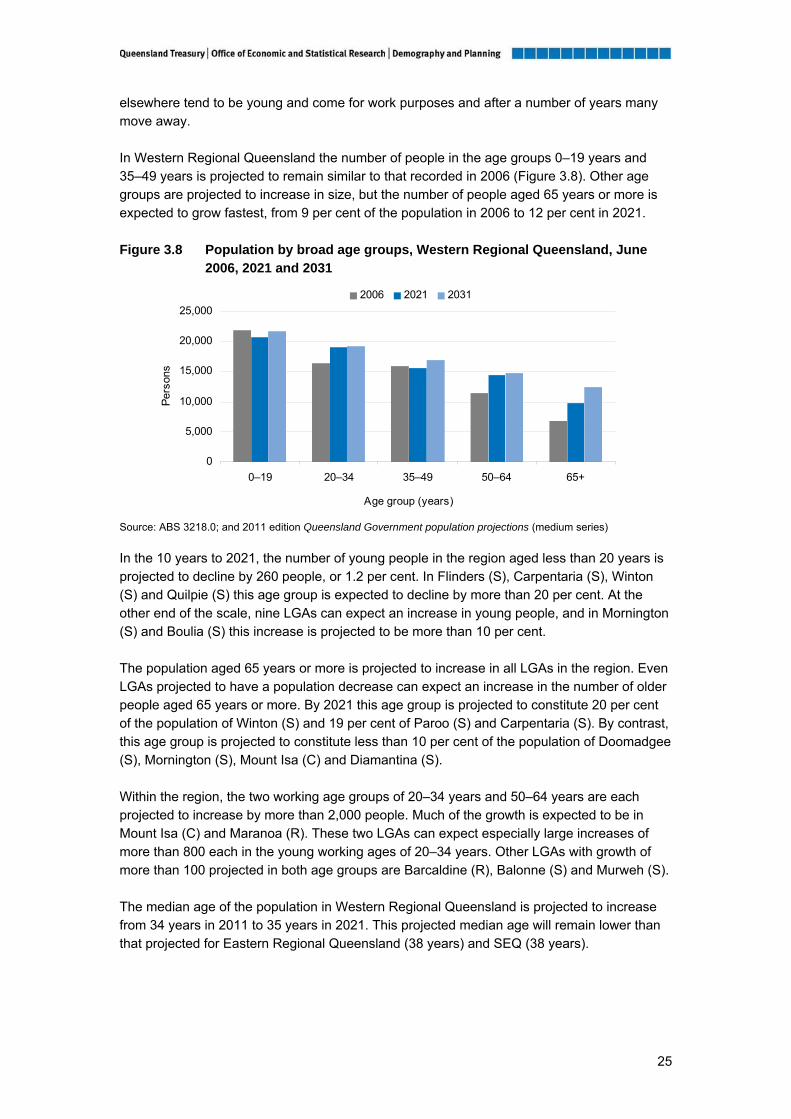
elsewhere tend to be young and come for work purposes and after a number of years many move away. In Western Regional Queensland the number of people in the age groups 0–19 years and 35–49 years is projected to remain similar to that recorded in 2006 (Figure 3.8). Other age groups are projected to increase in size, but the number of people aged 65 years or more is expected to grow fastest, from 9 per cent of the population in 2006 to 12 per cent in 2021. Figure 3.8 Population by broad age groups, Western Regional Queensland, June
2006, 2021 and 2031
0
5,000
10,000
15,000
20,000
25,000
0–19 20–34 35–49 50–64 65+
Age group (years)
Per
sons
2006 2021 2031
Source: ABS 3218.0; and 2011 edition Queensland Government population projections (medium series)
In the 10 years to 2021, the number of young people in the region aged less than 20 years is projected to decline by 260 people, or 1.2 per cent. In Flinders (S), Carpentaria (S), Winton (S) and Quilpie (S) this age group is expected to decline by more than 20 per cent. At the other end of the scale, nine LGAs can expect an increase in young people, and in Mornington (S) and Boulia (S) this increase is projected to be more than 10 per cent. The population aged 65 years or more is projected to increase in all LGAs in the region. Even LGAs projected to have a population decrease can expect an increase in the number of older people aged 65 years or more. By 2021 this age group is projected to constitute 20 per cent of the population of Winton (S) and 19 per cent of Paroo (S) and Carpentaria (S). By contrast, this age group is projected to constitute less than 10 per cent of the population of Doomadgee (S), Mornington (S), Mount Isa (C) and Diamantina (S). Within the region, the two working age groups of 20–34 years and 50–64 years are each projected to increase by more than 2,000 people. Much of the growth is expected to be in Mount Isa (C) and Maranoa (R). These two LGAs can expect especially large increases of more than 800 each in the young working ages of 20–34 years. Other LGAs with growth of more than 100 projected in both age groups are Barcaldine (R), Balonne (S) and Murweh (S). The median age of the population in Western Regional Queensland is projected to increase from 34 years in 2011 to 35 years in 2021. This projected median age will remain lower than that projected for Eastern Regional Queensland (38 years) and SEQ (38 years).
25

Population projections to 2031: local government areas, 2011 edition
4. Indigenous local government areas
This section analyses projections specifically for the 17 local government areas (LGAs) in Queensland where more than half of the residents identified as Aboriginal or Torres Strait Islander at the 2006 Census. They are referred to as ‘Indigenous LGAs’ in this report. In most of these 17 LGAs more than 85 per cent of the population identified as Indigenous but the proportion was as low as 74 per cent in one case. Many of these Indigenous LGAs are in remote locations. They have relatively small populations, ranging from 260 to 4,700 persons. In total, the populations of these Indigenous LGAs made up 0.6 per cent of the 2006 Queensland population. The population size of these communities is shown in Table 4.1. Their location and population size are indicated in Figure 4.1. Table 4.1 Population, Indigenous local government areas, June 2006, 2021 and
2031
Estimated resident
population
30 JuneLocal government area 2006 2021 2031Aurukun (S) 1,129 1,338 1,407Cherbourg (S) 1,225 1,451 1,781Doomadgee (S) 1,170 1,422 1,526Hope Vale (S) 842 914 939Kowanyama (S) 1,101 1,367 1,526Lockhart River (S) 599 705 761Mapoon (S) 256 344 404Mornington (S) 1,121 1,479 1,694Napranum (S) 908 1,189 1,372Northern Peninsula Area (R) 2,138 2,583 2,861Palm Island (S) 2,145 2,632 3,002Pormpuraaw (S) 644 778 855Torres (S) 3,496 4,034 4,359Torres Strait Island (R) 4,713 5,693 6,308Woorabinda (S) 918 1,152 1,357Wujal Wujal (S) 348 405 436Yarrabah (S) 2,558 3,252 3,707
Total 25,311 30,738 34,295
Projected resident
population
30 June
Source: ABS 3218.0; and 2011 edition Queensland Government population projections (medium series)
The Aboriginal and Torres Strait Islander people living in the Queensland Indigenous LGAs do not account for the majority of Indigenous people in the state. In total, these 17 LGAs accounted for less than 20 per cent of the Aboriginal or Torres Strait Islander population resident in Queensland at June 2006. The 2006 Census data indicate that most Indigenous people lived in urban areas and three out of 10 in South East Queensland.
26
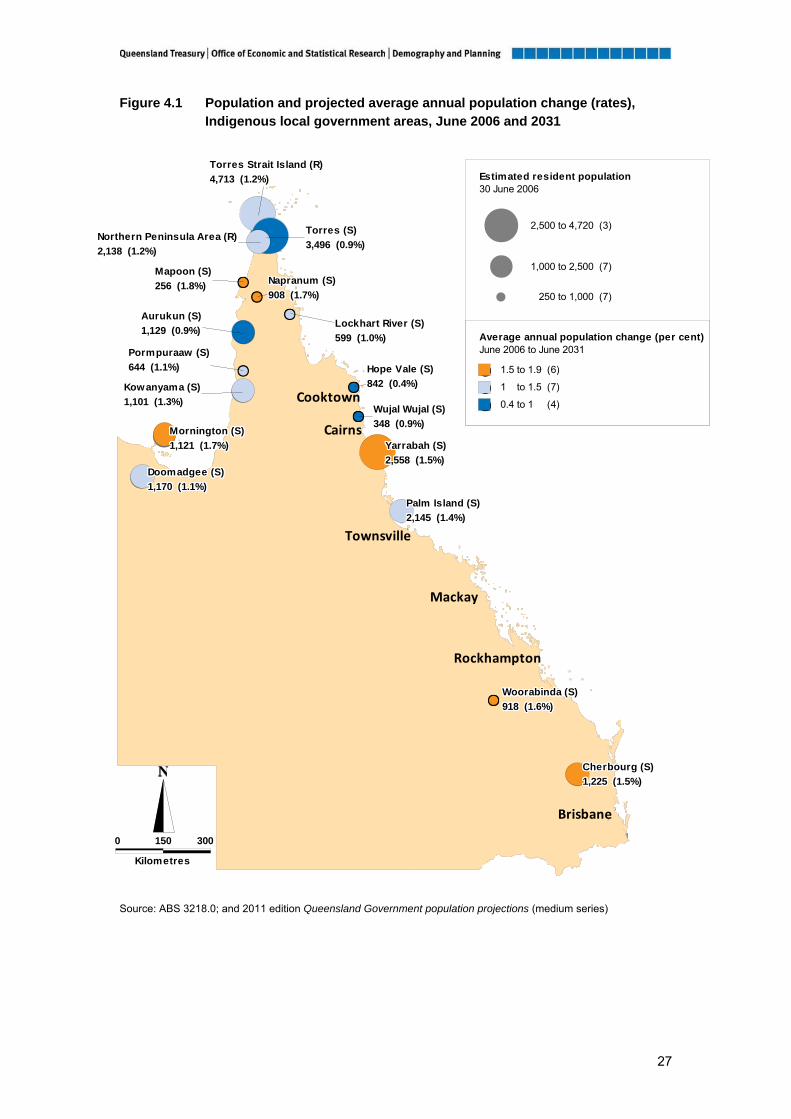
27
Lockhart River (S)Lockhart River (S)Lockhart River (S)Lockhart River (S)Lockhart River (S)Lockhart River (S)Lockhart River (S)Lockhart River (S)Lockhart River (S)599 (1.0%)599 (1.0%)599 (1.0%)599 (1.0%)599 (1.0%)599 (1.0%)599 (1.0%)599 (1.0%)599 (1.0%)
Palm Island (S)Palm Island (S)Palm Island (S)Palm Island (S)Palm Island (S)Palm Island (S)Palm Island (S)Palm Island (S)Palm Island (S)2,145 (1.4%)2,145 (1.4%)2,145 (1.4%)2,145 (1.4%)2,145 (1.4%)2,145 (1.4%)2,145 (1.4%)2,145 (1.4%)2,145 (1.4%)
Doomadgee (S)Doomadgee (S)Doomadgee (S)Doomadgee (S)Doomadgee (S)Doomadgee (S)Doomadgee (S)Doomadgee (S)Doomadgee (S)1,170 (1.1%)1,170 (1.1%)1,170 (1.1%)1,170 (1.1%)1,170 (1.1%)1,170 (1.1%)1,170 (1.1%)1,170 (1.1%)1,170 (1.1%)
Mornington (S)Mornington (S)Mornington (S)Mornington (S)Mornington (S)Mornington (S)Mornington (S)Mornington (S)Mornington (S)1,121 (1.7%)1,121 (1.7%)1,121 (1.7%)1,121 (1.7%)1,121 (1.7%)1,121 (1.7%)1,121 (1.7%)1,121 (1.7%)1,121 (1.7%)
Kowanyama (S)Kowanyama (S)Kowanyama (S)Kowanyama (S)Kowanyama (S)Kowanyama (S)Kowanyama (S)Kowanyama (S)Kowanyama (S)1,101 (1.3%)1,101 (1.3%)1,101 (1.3%)1,101 (1.3%)1,101 (1.3%)1,101 (1.3%)1,101 (1.3%)1,101 (1.3%)1,101 (1.3%)
Aurukun (S)Aurukun (S)Aurukun (S)Aurukun (S)Aurukun (S)Aurukun (S)Aurukun (S)Aurukun (S)Aurukun (S)1,129 (0.9%)1,129 (0.9%)1,129 (0.9%)1,129 (0.9%)1,129 (0.9%)1,129 (0.9%)1,129 (0.9%)1,129 (0.9%)1,129 (0.9%)
Nort
Figure 4.1 Population and projected average annual population change (rates), Indigenous local government areas, June 2006 and 2031
hehehethetheththththern Peninsula Area (R)Nort rn Peninsula Area (R)Nort rn Peninsula Area (R)Nor rn Peninsula Area (R)Nor rn Peninsula Area (R)Nor ern Peninsula Area (R)Nor ern Peninsula Area (R)Nor ern Peninsula Area (R)Nor rn Peninsula Area (R)2,13 (1.2%)2,13 (1.2%)2,13 (1.2%)2,13 (1.2%)2,13 (1.2%)2,13 (1.2%)2,13 (1.2%)2,13 (1.2%)2,13 (1.2%)8 8 8 8 8 8 8 8 8
Torres (S)Torres (S)Torres (S)Torres (S)Torres (S)Torres (S)Torres (S)Torres (S)Torres (S)3,496 (0.9%)3,496 (0.9%)3,496 (0.9%)3,496 (0.9%)3,496 (0.9%)3,496 (0.9%)3,496 (0.9%)3,496 (0.9%)3,496 (0.9%)
Torres Strait Island (R)Torres Strait Island (R)Torres Strait Island (R)Torres Strait Island (R)Torres Strait Island (R)Torres Strait Island (R)Torres Strait Island (R)Torres Strait Island (R)Torres Strait Island (R)4,713 (1.2%)4,713 (1.2%)4,713 (1.2%)4,713 (1.2%)4,713 (1.2%)4,713 (1.2%)4,713 (1.2%)4,713 (1.2%)4,713 (1.2%)
Cherbourg (S)Cherbourg (S)Cherbourg (S)Cherbourg (S)Cherbourg (S)Cherbourg (S)Cherbourg (S)Cherbourg (S)Cherbourg (S)1,225 (1.5%)1,225 (1.5%)1,225 (1.5%)1,225 (1.5%)1,225 (1.5%)1,225 (1.5%)1,225 (1.5%)1,225 (1.5%)1,225 (1.5%)
Woorabinda (S)Woorabinda (S)Woorabinda (S)Woorabinda (S)Woorabinda (S)Woorabinda (S)Woorabinda (S)Woorabinda (S)Woorabinda (S)918 (1.6%)918 (1.6%)918 (1.6%)918 (1.6%)918 (1.6%)918 (1.6%)918 (1.6%)918 (1.6%)918 (1.6%)
Yarrabah (S)Yarrabah (S)Yarrabah (S)Yarrabah (S)Yarrabah (S)Yarrabah (S)Yarrabah (S)Yarrabah (S)Yarrabah (S)2,558 (1.5%)2,558 (1.5%)2,558 (1.5%)2,558 (1.5%)2,558 (1.5%)2,558 (1.5%)2,558 (1.5%)2,558 (1.5%)2,558 (1.5%)
Pormpuraaw (S)Pormpuraaw (S)Pormpuraaw (S)Pormpuraaw (S)Pormpuraaw (S)Pormpuraaw (S)Pormpuraaw (S)Pormpuraaw (S)Pormpuraaw (S)644 (1.1%)644 (1.1%)644 (1.1%)644 (1.1%)644 (1.1%)644 (1.1%)644 (1.1%)644 (1.1%)644 (1.1%)
Napranum (S)Napranum (S)Napranum (S)Napranum (S)Napranum (S)Napranum (S)Napranum (S)Napranum (S)Napranum (S)908 (1.7%)908 (1.7%)908 (1.7%)908 (1.7%)908 (1.7%)908 (1.7%)908 (1.7%)908 (1.7%)908 (1.7%)
Mapoon (S)Mapoon (S)Mapoon (S)Mapoon (S)Mapoon (S)Mapoon (S)Mapoon (S)Mapoon (S)Mapoon (S)256 (1.8%)256 (1.8%)256 (1.8%)256 (1.8%)256 (1.8%)256 (1.8%)256 (1.8%)256 (1.8%)256 (1.8%)
Wujal Wujal (S)Wujal Wujal (S)Wujal Wujal (S)Wujal Wujal (S)Wujal Wujal (S)Wujal Wujal (S)Wujal Wujal (S)Wujal Wujal (S)Wujal Wujal (S)348 (0.9%)348 (0.9%)348 (0.9%)348 (0.9%)348 (0.9%)348 (0.9%)348 (0.9%)348 (0.9%)348 (0.9%)
Hope Vale (S)Hope Vale (S)Hope Vale (S)Hope Vale (S)Hope Vale (S)Hope Vale (S)Hope Vale (S)Hope Vale (S)Hope Vale (S)842 (0.4%)842 (0.4%)842 (0.4%)842 (0.4%)842 (0.4%)842 (0.4%)842 (0.4%)842 (0.4%)842 (0.4%)
Lockhart River (S)Lockhart River (S)Lockhart River (S)Lockhart River (S)Lockhart River (S)Lockhart River (S)Lockhart River (S)Lockhart River (S)Lockhart River (S)599 (1.0%)599 (1.0%)599 (1.0%)599 (1.0%)599 (1.0%)599 (1.0%)599 (1.0%)599 (1.0%)599 (1.0%)
Palm Island (S)Palm Island (S)Palm Island (S)Palm Island (S)Palm Island (S)Palm Island (S)Palm Island (S)Palm Island (S)Palm Island (S)2,145 (1.4%)2,145 (1.4%)2,145 (1.4%)2,145 (1.4%)2,145 (1.4%)2,145 (1.4%)2,145 (1.4%)2,145 (1.4%)2,145 (1.4%)
Doomadgee (S)Doomadgee (S)Doomadgee (S)Doomadgee (S)Doomadgee (S)Doomadgee (S)Doomadgee (S)Doomadgee (S)Doomadgee (S)1,170 (1.1%)1,170 (1.1%)1,170 (1.1%)1,170 (1.1%)1,170 (1.1%)1,170 (1.1%)1,170 (1.1%)1,170 (1.1%)1,170 (1.1%)
Mornington (S)Mornington (S)Mornington (S)Mornington (S)Mornington (S)Mornington (S)Mornington (S)Mornington (S)Mornington (S)1,121 (1.7%)1,121 (1.7%)1,121 (1.7%)1,121 (1.7%)1,121 (1.7%)1,121 (1.7%)1,121 (1.7%)1,121 (1.7%)1,121 (1.7%)
KoKoKoKKKoKoKoK1,101 (1,101 (1,101 (1,101,101,1011,1011,1011,10
wanyama (S)wanyama (S)wanyama (S)owanyama (S)owanyama (S)wanyama (S)wanyama (S)wanyama (S)owanyama (S)1.3%)1.3%)1.3%)1 (1.3%)1 (1.3%) (1.3%) (1.3%) (1.3%)1 (1.3%)
Aurukun (S)Aurukun (S)Aurukun (S)Aurukun (S)Aurukun (S)Aurukun (S)Aurukun (S)Aurukun (S)Aurukun (S)1,129 (0.9%)1,129 (0.9%)1,129 (0.9%)1,129 (0.9%)1,129 (0.9%)1,129 (0.9%)1,129 (0.9%)1,129 (0.9%)1,129 (0.9%)
Nort rn Peninsula Area (R)Nort rn Peninsula Area (R)Nort rn Peninsula Area (R)Nor rn Peninsula Area (R)Nor rn Peninsula Area (R)Nor ern Peninsula Area (R)Nor ern Peninsula Area (R)Nor ern Peninsula Area (R)Nor rn Peninsula Area (R)2,13 (1.2%)2,13 (1.2%)2,13 (1.2%)2,13 (1.2%)2,13 (1.2%)2,13 (1.2%)2,13 (1.2%)2,13 (1.2%)2,13 (1.2%)
hehehethetheththththe8 8 8 8 8 8 8 8 8
Torres (S)Torres (S)Torres (S)Torres (S)Torres (S)Torres (S)Torres (S)Torres (S)Torres (S)3,496 (0.9%)3,496 (0.9%)3,496 (0.9%)3,496 (0.9%)3,496 (0.9%)3,496 (0.9%)3,496 (0.9%)3,496 (0.9%)3,496 (0.9%)
Torres Strait Island (R)Torres Strait Island (R)Torres Strait Island (R)Torres Strait Island (R)Torres Strait Island (R)Torres Strait Island (R)Torres Strait Island (R)Torres Strait Island (R)Torres Strait Island (R)4,713 (1.2%)4,713 (1.2%)4,713 (1.2%)4,713 (1.2%)4,713 (1.2%)4,713 (1.2%)4,713 (1.2%)4,713 (1.2%)4,713 (1.2%)
Cherbourg (S)Cherbourg (S)Cherbourg (S)Cherbourg (S)Cherbourg (S)Cherbourg (S)Cherbourg (S)Cherbourg (S)Cherbourg (S)1,225 (1.5%)1,225 (1.5%)1,225 (1.5%)1,225 (1.5%)1,225 (1.5%)1,225 (1.5%)1,225 (1.5%)1,225 (1.5%)1,225 (1.5%)
Woorabinda (S)Woorabinda (S)Woorabinda (S)Woorabinda (S)Woorabinda (S)Woorabinda (S)Woorabinda (S)Woorabinda (S)Woorabinda (S)918 (1.6%)918 (1.6%)918 (1.6%)918 (1.6%)918 (1.6%)918 (1.6%)918 (1.6%)918 (1.6%)918 (1.6%)
Yarrabah (S)Yarrabah (S)Yarrabah (S)Yarrabah (S)Yarrabah (S)Yarrabah (S)Yarrabah (S)Yarrabah (S)Yarrabah (S)2,558 (1.5%)2,558 (1.5%)2,558 (1.5%)2,558 (1.5%)2,558 (1.5%)2,558 (1.5%)2,558 (1.5%)2,558 (1.5%)2,558 (1.5%)
Pormpuraaw (S)Pormpuraaw (S)Pormpuraaw (S)Pormpuraaw (S)Pormpuraaw (S)Pormpuraaw (S)Pormpuraaw (S)Pormpuraaw (S)Pormpuraaw (S)644 (1.1%)644 (1.1%)644 (1.1%)644 (1.1%)644 (1.1%)644 (1.1%)644 (1.1%)644 (1.1%)644 (1.1%)
Napranum (S)Napranum (S)Napranum (S)Napranum (S)Napranum (S)Napranum (S)Napranum (S)Napranum (S)Napranum (S)908 (1.7%)908 (1.7%)908 (1.7%)908 (1.7%)908 (1.7%)908 (1.7%)908 (1.7%)908 (1.7%)908 (1.7%)
Mapoon (S)Mapoon (S)Mapoon (S)Mapoon (S)Mapoon (S)Mapoon (S)Mapoon (S)Mapoon (S)Mapoon (S)256 (1.8%)256 (1.8%)256 (1.8%)256 (1.8%)256 (1.8%)256 (1.8%)256 (1.8%)256 (1.8%)256 (1.8%)
Wujal Wujal (S)Wujal Wujal (S)Wujal Wujal (S)Wujal Wujal (S)Wujal Wujal (S)Wujal Wujal (S)Wujal Wujal (S)Wujal Wujal (S)Wujal Wujal (S)348 (0.9%)348 (0.9%)348 (0.9%)348 (0.9%)348 (0.9%)348 (0.9%)348 (0.9%)348 (0.9%)348 (0.9%)
Hope Vale (S)Hope Vale (S)Hope Vale (S)Hope Vale (S)Hope Vale (S)Hope Vale (S)Hope Vale (S)Hope Vale (S)Hope Vale (S)842 (0.4%)842 (0.4%)842 (0.4%)842 (0.4%)842 (0.4%)842 (0.4%)842 (0.4%)842 (0.4%)842 (0.4%)
Estimated resident population30 June 2006
2,500 to 4,720 (3)
1,000 to 2,500 (7)
250 to 1,000 (7)
Average annual population change (per cent)June 2006 to June 2031
1.5 to 1.9 (6)
1 to 1.5 (7)
0.4 to 1 (4)
Cairns
Brisbane
Townsville
Rockhampton
Cooktown
Mackay
0 150 300
Kilometres Source: ABS 3218.0; and 2011 edition Queensland Government population projections (medium series)

Population projections to 2031: local government areas, 2011 edition
The 2011 edition of the Queensland Government population projections include specific figures for these communities, whereas previous editions did not. Many demographic characteristics of Indigenous populations differ from non-Indigenous populations. In addition, projecting the population in the Indigenous LGAs combines the challenges of doing projections for small areas (excessive volatility in data) with the lack of reliable data for Indigenous populations generally (for example, the undercount of Aboriginal and Torres Strait Islander people in the census and the low quality of identification on births and deaths records). The method used to project the populations of the Indigenous LGAs is different to that used for the other non-Indigenous LGAs. Projections of the Indigenous LGAs are experimental in nature and should not be accorded the same degree of reliability as those for other LGAs. The uncertainty of the projections is reflected in the wide difference between the high series and low series. Further information regarding the research undertaken and methodology used to project the populations of the Indigenous LGAs is available in Queensland Government population projections: methodology for local government areas, 2011 edition.
4.1 Population growth Total population in Queensland’s Indigenous LGAs was estimated at 25,300 in 2006. The medium series projections estimate their total population to grow to 30,700 in 2021 and to 34,300 by 2031. Their population is projected to increase by 3,500 people from 2011 to 2021, and a similar number again in the following 10 years. This is larger than the increase recorded in the decade from 1996 to 2006, of 2,800 people (Table 4.2). Table 4.2 Population change, Indigenous local government areas, 10 years to June
2006, 2021 and 2031
2006 2021 2031 2006 2021 2031
Local government area Aurukun (S) 293 101 69 3.1 0.8 0.5Cherbourg (S) 90 188 330 0.8 1.4 2.1
Doomadgee (S) 279 133 104 2.8 1.0 0.7Hope Vale (S) 19 44 25 0.2 0.5 0.3
Kowanyama (S) 80 175 159 0.8 1.4 1.1Lockhart River (S) 26 68 56 0.4 1.0 0.8
Mapoon (S) 72 59 60 3.4 1.9 1.6Mornington (S) -7 246 215 -0.1 1.8 1.4
Napranum (S) 154 187 183 1.9 1.7 1.4Northern Peninsula Area (R) 270 295 278 1.4 1.2 1.0
Palm Island (S) 12 344 370 0.1 1.4 1.3
Pormpuraaw (S) 91 87 77 1.5 1.2 0.9Torres (S) 349 251 325 1.1 0.6 0.8
Torres Strait Island (R) 1,049 649 615 2.5 1.2 1.0Woorabinda (S) -236 176 205 -2.3 1.7 1.7
Wujal Wujal (S) 9 37 31 0.3 1.0 0.7Yarrabah (S) 520 464 455 2.3 1.6 1.3
Total 2,777 3,403 3,488 1.2 1.2 1.1
Total population change
10 years to 30 June
Average annual population change
10 years to 30 June
— number — — % —
Source: ABS 3218.0; and 2011 edition Queensland Government population projections (medium series)
28

The two most populous LGAs in the group, Torres Strait Island (R) and Torres (S), cover the islands north of Cape York and are home to a predominantly Torres Strait Islander population. Together, these two LGAs had a population of 8,200 in 2006. In the 10 years to 2021, they are projected to increase their population by 900 in total. Growth in the larger Torres Strait Island (R) is projected to average 1.2 per cent a year, a gain of 650 people over the decade. Growth in Torres (S) is expected to be slower, at 0.6 per cent per annum or 250 people for the decade. Yarrabah (S), south-east of Cairns, is the third most populous LGA in the group and 97 per cent of its population is Indigenous, predominantly Aboriginal. Its population growth is projected to slow to an average annual rate of 1.6 per cent in the 10 years to 2021. The projected population increase of 460 people during the decade to 2021 is fewer than the 520 increase recorded in the 10 years to 2006. Five of the Indigenous LGAs are projected to experience population increases of less than 100 people over the 10 years to 2021. These five Aboriginal communities are the smallest of the group, with populations from 260 to 840 in 2006 – Hope Vale (S) (north of Cooktown), Wujal Wujal (S) (south of Cooktown), Lockhart River (S) (Eastern Cape York), Mapoon (S) (Western Cape York) and Pormpuraaw (S) (also on Western Cape York). The Indigenous LGAs in total are projected to have an average growth rate of 1.2 per cent per annum in the 10 years to 2021. While this is faster than growth projected for many remote LGAs (for example, 1.1 per cent per annum in Cook (S) and -0.1 per cent in Carpentaria (S)) it is slower than the 1.9 per cent per annum projected for the total Queensland population. The average annual growth rates of the Indigenous LGAs for the decade to 2021 are projected to range from 0.5 per cent in Hope Vale (S) to as high as 1.9 per cent in Mapoon (S).
4.2 Population age structure The Indigenous LGAs have young age profiles, with a high proportion of children and low proportion of elderly compared with the Queensland average. This age structure reflects the higher fertility and lower life expectancy of the Indigenous population. In total, the median age of these Indigenous LGAs was 24 years in 2006 (12 years younger than the total Queensland population median age of 36 years). The median age of the population in the Indigenous LGAs is projected to increase slightly to 25 years in 2031. The projected increases in younger age groups are expected to be somewhat offset by increases in older age groups. The number of young people aged 0–19 years is projected to increase by 3,100 (29 per cent) from 2006 to 2031 (Figure 4.2). On the other hand, the number of people aged 50 years or more in these Indigenous LGAs is also projected to increase substantially, by 2,900 or 86 per cent. During the 10 years to 2021, all age groups are projected to grow, but 38 per cent of the increase in total population in the Indigenous LGAs is projected to be people aged less than 20 years of age. While their number is projected to rise from 11,600 in 2011 to 12,900 in 2021, it is expected this young age group will continue to represent 42 per cent of the population.
29

Population projections to 2031: local government areas, 2011 edition
In 12 of these 17 Indigenous LGAs, those aged less than 20 years are projected to make up more than 40 per cent of the population in 2021 – a higher proportion than any other Queensland LGA. Of the Indigenous LGAs, Wujal Wujal is projected to have the smallest proportion (31 per cent) of people aged 0–19 years in 2021 – a proportion similar to that projected for Ipswich (C). Figure 4.2 Population by broad age groups, Indigenous local government areas,
June 2006, 2021 and 2031
0
2,000
4,000
6,000
8,000
10,000
12,000
14,000
16,000
0–19 20–34 35–49 50–64 65+
Age group (years)
Per
sons
2006 2021 2031
Source: ABS 3218.0; and 2011 edition Queensland Government population projections (medium series)
The number of people aged 65 years or more in the Indigenous LGAs is projected to increase from 1,000 people to 1,600 people over the 10 years from 2011 to 2021. This represents an increase from 3.8 to 5.3 per cent of their total population. By 2021, this older age group is projected to range from 3.0 per cent of the population in Doomadgee (S) to 8.4 per cent in Pormpuraaw (S). For people aged 65 years or more, Torres Strait Island (R) is projected to have the largest increases of more than 100 people each 10 years, from 220 in 2011 to 330 in 2021 and 440 in 2031.
30

Technical notes
The Queensland Government population projections are revised twice every five years in line with the five yearly cycle of the Census of Population and Housing, conducted by the Australian Bureau of Statistics (ABS). Using information concerning population characteristics from the 2006 Census, the Office of Economic and Statistical Research (OESR) produced the 2011 edition Queensland Government population projections during 2010 and early 2011. As the key census data were available for 2006 Australian Standard Geographical Classification (ASGC) boundaries, these projections were developed and processed on ASGC 2006 boundaries and finally concorded to ASGC 2008 to take account of the extensive changes to local government boundaries that have occurred since the census. Geographic areas in this publication are therefore based on the ABS’s 2008 ASGC. Two recent name changes to local government areas (LGAs) have been incorporated. These are Western Downs Regional Council (previously known as Dalby Regional Council) and Maranoa Regional Council (previously named Roma Regional Council).
In addition to Census data, the 2011 edition projections are based on population, fertility, mortality and migration data available at June 2010, with estimated resident population (ERP) figures for June 2008 forming the base year. Local governments provided information detailing major commercial, industrial and residential projects in their areas. The projections reported here represent the outcome from modelling certain assumptions concerning the main components of population change (fertility, mortality and migration) and how they will change in the future. As such they reflect one possible set of outcomes, which will not eventuate if changes occur in fertility, mortality and migration other than those assumed. Other factors not able to be modelled (for example, the establishment of an industrial project or mine that is not yet announced) may also influence the actual change in population that occurs over the coming years. Three projection series (high, medium and low) have been prepared, reflecting more optimistic or less optimistic assumptions about the future. In general, only the medium series results have been discussed; however, all three series can be found in the report’s appendixes. Users need to appreciate the variability associated with anticipating the future and consider the range provided by the three series of projections rather than focusing on a single set of figures. Projections of the Queensland population have been produced for each year to 2056 and statistical division (SD) and LGA projections to 2031, including the Indigenous LGAs. These population projections are made available by five year age cohort and LGA, but a high degree of accuracy at this level of disaggregation should not be assumed. Aggregating the smaller cells in a table will not necessarily agree with the total provided in that table, as a consequence of rounding decimal figures before presenting the data.
31

Population projections to 2031: local government areas, 2011 edition
Glossary
This glossary provides a guide to terms used in this publication. It is in alphabetical order. Further details about Census data definitions can be obtained from the Australian Bureau of Statistics (ABS) publication Census Dictionary, Australia, 2006 (cat. no. 2901.0). Assumptions Assumptions concerning future fertility, mortality and migration patterns for each age group are the basis for projecting populations. Assuming low levels of growth (low rates of fertility, low life expectancy, low levels of in-migration and high levels of out-migration) will result in low populations being projected. The high series of population projections result from assuming high levels of growth. Australian Standard Geographical Classification (ASGC) A geographical framework covering all spatial areas of Australia and the external territories. The ASGC was developed by the Australian Bureau of Statistics to allow statistics from different collections to be spatially comparable. The ASGC has been revised annually since its inception in 1984. Following the major reform to Queensland local government area (LGA) boundaries effective from March 2008, the Australian Bureau of Statistics revised the geographical classification to reflect this change with a new standard effective from 1 July 2008 (ASGC 2008). These 2008 boundaries have been used for the data in this publication, although two recent name changes have been incorporated: Dalby (R) is referred to as Western Downs (R) and Roma (R) is now called Maranoa (R). Average annual rate of population change Also known as the average annual growth rate. It is calculated as a percentage using the formula below, where P0 is the population at the start of the period, Pn is the population at the end of the period and n is the length of the period between Pn and P0 in years. For example, to calculate the average annual rate of population change from 2011 to 2021, n is 10, P0 is the population in 2011 and Pn is the population in 2021. Baby boom The sharp increase in the birth rate that occurred in the years (1946–1965) following World War II. Estimated resident population (ERP) The number of people estimated to be residents of an area. During population census years, estimates of the resident population (ERP) are based on Census counts by place of usual residence, to which are added the estimated net undercount and the number of Australian residents estimated to have been temporarily overseas at the time of the Census. Overseas visitors in Australia are excluded from this calculation. These census year estimates of population become the base on which estimates of natural increase and migration are added (or subtracted) over the following years.
32
33
People are deemed usual residents of the address at which they have lived (or intend to live) for six months or more during the census year. Using this criterion, boarding school students, for example, are considered usual residents at the school address rather than their home address. The June 2008 estimated resident population figures were the latest age-sex population estimates available at the time of calculating the projected populations and so were the starting point for calculating these population projections. Fertility Relates to the average number of children women bear and the age at which women give birth. To produce these population projections, assumptions have been made regarding age-specific fertility rates, that is, the likelihood that a woman of a particular age will have children. See also ‘Total fertility rate’. Indigenous LGAs Local government areas in which 50 per cent or more residents identified as Aboriginal or Torres Strait Islander in the 2006 Census. See also ‘Predominantly Indigenous local government area’. Local government area (LGA) As defined under the Local Government Act 1993, local government areas are spatial units that represent the geographic areas of incorporated local government councils, such as cities (C), regional councils (R) and shires (S). LGAs aggregate directly to form the incorporated area of Queensland. Median age The age at which half the population is younger and half is older. Median age is displayed to one decimal point in Appendix E but has been rounded to a whole number in the text. Mortality Refers to deaths within the population. To produce these population projections, mortality assumptions have been set using the measure of life expectancy (the number of further years a person can expect to live). Natural increase The excess of births over deaths. Although usually positive, natural increase can be negative if the population has an older age structure such that more deaths than births are experienced over a period of time. Net interstate migration Refers to the net result of population movement into the region from interstate minus population movement out of the region to other states or territories. During intercensal years, the Australian Bureau of Statistics prepares state level quarterly estimates of net interstate migration using indicators of population change. Net migration Within the context of a given geographic region, such as a statistical local area, net migration refers to the net result of population movement into and out of the region. It is the resulting

Population projections to 2031: local government areas, 2011 edition
34
change in population from the combination of overseas migration, interstate migration and internal migration within the state. Net overseas migration Calculated by deducting outward overseas migration from inward overseas migration. It is an estimated figure based on net permanent and long-term (over 12 months) overseas movements; short-term (less than 12 months) overseas movements are excluded. Predominantly Indigenous local government area A local government area in which 50 per cent or more residents identified as Aboriginal or Torres Strait Islander in the 2006 Census. Also referred to as an ‘Indigenous LGA’. Projected population Population projections are estimates of the number of residents (ERP) of an area at a future date, if the assumed rates of natural increase and migration occur. Regional planning project areas There are currently 10 regional planning project areas in Queensland (Sustainable Planning Act 2009), supported by the Department of Local Government and Planning (DLGP). Regional planning project areas do not cover the whole of the state. They generally encompass one or more city areas, plus surrounding rural shires. Regionalisation strategy areas Administrative areas for the Queensland Regionalisation Strategy and Queensland Infrastructure Plan are based on individual or clustered statutory regional planning areas. They have been developed around the concept of economic zones. South East Queensland Region (SEQ Region) Comprises the statistical divisions of Brisbane, Gold Coast, Sunshine Coast and West Moreton, plus the Toowoomba statistical district. It contains 10 local government areas plus part of Toowoomba (R). The area has been defined this way to be identical to the South East Queensland regional planning project area. Statistical district The Australian Standard Geographical Classification defines statistical districts as selected, significant, predominantly urban areas which are not located within a capital city statistical division. Statistical division (SD) The largest sub-state spatial units in the main structure of the Australian Standard Geographical Classification. In aggregate, Queensland’s 13 statistical divisions cover all of the state without gaps or overlaps. Total fertility rate Calculated as the sum of age-specific fertility rates. It represents the number of children a woman is likely to have in her life-time if she experienced the prevailing age-specific fertility rates.

Produced by the Office of Economic and Statistical Research, Queensland Treasury © The State of Queensland (Queensland Treasury) 2011 Queensland Government population projections to 2031: local government areas 2011 edition
35
Appendixes
Appendix A. Historical estimated resident population, local government areas
STATISTICAL DIVISION (SD) Estimated resident population (ERP
Local government area (LGA) 1981 1986 1991 1996 2001 2006 2007(r) 2008(r) 2009(r) 2010(p) 1991 1996 2001 2006
no. no. no. no. no. no. no. no. no. no. no. no. no. no. no. %
2010(p)
Average annual population change
5 years to 30 June4 years to 30
June) at 30 June BRISBANE SD 1,124,828 1,229,679 1,369,071 1,532,425 1,663,120 1,857,830 1,902,235 1,952,158 2,004,225 2,043,185 27,879 32,671 26,139 38,942 46,339 2.4
GOLD COAST SD 145,727 194,535 255,516 322,589 387,102 466,433 484,638 499,514 514,885 527,828 12,196 13,415 12,903 15,866 15,349 3.1
SUNSHINE COAST SD 92,796 116,535 161,302 210,471 247,167 295,084 304,070 313,851 323,419 330,934 8,953 9,834 7,339 9,583 8,963 2.9
WEST MORETON SD 40,663 52,149 61,719 72,730 77,217 86,358 88,587 91,043 94,659 97,414 1,914 2,202 897 1,828 2,764 3.1
South East Queensland(a) 1,404,013 1,592,897 1,847,608 2,138,215 2,374,606 2,705,705 2,779,530 2,856,566 2,937,188 2,999,361 50,942 58,121 47,278 66,220 73,414 2.6
Brisbane (C) 733,482 737,418 769,087 824,489 896,649 991,260 1,010,479 1,031,297 1,052,438 1,067,279 6,334 11,080 14,432 18,922 19,005 1.9
Gold Coast (C) 145,727 194,535 255,516 322,589 387,102 466,433 484,638 499,514 514,885 527,828 12,196 13,415 12,903 15,866 15,349 3.1
Ipswich (C) 94,901 102,988 113,209 122,745 125,451 142,477 148,049 154,669 162,381 168,131 2,044 1,907 541 3,405 6,414 4.2
Lockyer Valley (R) 16,346 19,831 22,904 27,532 28,668 31,932 32,873 34,060 35,632 36,591 615 926 227 653 1,165 3.5
Logan (C) 113,245 157,734 194,151 225,464 237,236 260,021 264,761 270,888 277,560 282,673 7,284 6,262 2,354 4,557 5,663 2.1
Moreton Bay (R) 139,520 171,308 209,806 256,645 286,532 332,862 344,878 357,902 371,155 382,280 7,700 9,368 5,977 9,266 12,355 3.5
Redland (C) 43,680 60,231 82,818 103,082 117,252 131,210 134,068 137,402 140,691 142,822 4,517 4,053 2,834 2,792 2,903 2.1
Scenic Rim (R) 14,918 18,850 23,288 28,140 30,464 34,750 35,629 36,300 37,419 38,304 888 970 465 857 889 2.5
Somerset (R) 9,399 13,468 15,527 17,058 18,085 19,676 20,085 20,683 21,608 22,519 412 306 205 318 711 3.4
Sunshine Coast (R) 92,796 116,535 161,302 210,471 247,167 295,084 304,070 313,851 323,419 330,934 8,953 9,834 7,339 9,583 8,963 2.9
WIDE BAY-BURNETT SD 154,050 168,955 192,705 220,310 232,008 264,081 271,314 278,896 287,422 293,455 4,750 5,521 2,340 6,415 7,344 2.7
Bundaberg (R) 54,847 57,366 65,237 74,653 78,943 87,898 90,302 92,651 95,131 96,936 1,574 1,883 858 1,791 2,260 2.5
Cherbourg (S)(b) n.a. n.a. n.a. 1,135 1,209 1,225 1,189 1,213 1,215 1,260 n.a. n.a. 15 3 9 0.7
Fraser Coast (R) 40,290 46,442 56,838 69,284 74,204 89,247 92,565 96,010 99,513 102,080 2,079 2,489 984 3,009 3,208 3.4
Gympie (R) 25,428 29,005 32,506 36,903 38,807 44,177 45,287 46,526 48,281 49,334 700 879 381 1,074 1,289 2.8
North Burnett (R) 12,131 11,726 11,487 11,204 10,654 10,756 10,685 10,684 10,787 10,805 -48 -57 -110 20 12 0.1
South Burnett (R) 20,198 23,257 25,494 27,131 28,191 30,778 31,286 31,812 32,495 33,040 447 327 212 517 566 1.8
DARLING DOWNS SD 168,829 181,289 192,357 198,385 208,961 225,807 228,837 232,378 237,209 241,537 2,214 1,206 2,115 3,369 3,933 1.7
Goondiwindi (R) 9,777 9,913 10,224 9,893 10,419 10,741 10,822 11,023 11,188 11,413 62 -66 105 64 168 1.5
Southern Downs (R) 26,255 27,776 29,813 30,526 31,672 33,589 34,123 34,738 35,456 35,996 407 143 229 383 602 1.7
Toowoomba (R) 103,642 113,772 122,767 129,202 137,593 151,297 153,467 155,644 159,097 162,057 1,799 1,287 1,678 2,741 2,690 1.7
Western Downs (R)(c) 29,155 29,828 29,553 28,764 29,277 30,180 30,425 30,973 31,468 32,071 -55 -158 103 181 473 1.5

Produced by the Office of Economic and Statistical Research, Queensland Treasury © The State of Queensland (Queensland Treasury) 2011 Queensland Government population projections to 2031: local government areas 2011 edition
36
STATISTICAL DIVISION (SD)
Local government area (LGA) 1981 1986 1991 1996 2001 2006 2007(r) 2008(r) 2009(r) 2010(p) 1991 1996 2001 2006
no. no. no. no. no. no. no. no. no. no. no. no. no. no. no. %
2010(p)
5 years to 30 June JuneEstimated resident population (ERP) at 30 June
Average annual population change
4 years to 30
SOUTH WEST SD 28,386 28,791 29,130 26,449 27,002 26,366 26,211 26,239 26,276 26,489 68 -536 111 -127 31 0.1
Balonne (S) 4,921 5,111 5,346 4,825 5,580 4,927 4,890 4,852 4,847 4,847 47 -104 151 -131 -20 -0.4
Bulloo (S) 493 586 599 520 459 394 377 377 374 377 3 -16 -12 -13 -4 -1.1
Maranoa (R)(d) 13,194 13,578 13,318 12,523 12,610 13,070 13,120 13,189 13,222 13,369 -52 -159 17 92 75 0.6
Murweh (S) 5,703 5,451 5,803 4,986 5,032 4,863 4,796 4,838 4,871 4,910 70 -163 9 -34 12 0.2
Paroo (S) 2,708 2,717 2,667 2,310 2,214 2,063 2,016 1,962 1,946 1,951 -10 -71 -19 -30 -28 -1.4
Quilpie (S) 1,367 1,348 1,397 1,285 1,107 1,049 1,012 1,021 1,016 1,035 10 -22 -36 -12 -4 -0.3
FITZROY SD 148,744 162,700 171,898 182,505 186,527 206,204 210,933 215,471 220,711 223,516 1,840 2,121 804 3,935 4,328 2.0
Banana (S) 17,188 18,823 16,776 15,423 15,838 15,572 15,382 15,481 15,597 15,595 -409 -271 83 -53 6 0.0
Central Highlands (R) 20,511 24,337 25,161 26,007 25,061 28,256 28,772 29,343 30,402 31,078 165 169 -189 639 706 2.4
Gladstone (R) 33,871 35,170 38,974 44,124 46,369 53,941 55,716 57,780 59,643 60,316 761 1,030 449 1,514 1,594 2.8
Rockhampton (R) 76,021 83,036 89,668 95,797 98,225 107,517 110,116 111,902 114,104 115,526 1,326 1,226 486 1,858 2,002 1.8
Woorabinda (S)(b) n.a. n.a. n.a. 1,154 1,034 918 947 965 965 1,001 n.a. n.a. -24 -23 21 2.2
CENTRAL WEST SD 15,499 14,742 14,492 13,610 13,591 12,535 12,400 12,299 12,270 12,387 -50 -176 -4 -211 -37 -0.3
Barcaldine (R) 4,184 4,043 3,814 3,692 3,551 3,462 3,437 3,406 3,376 3,406 -46 -24 -28 -18 -14 -0.4
Barcoo (S) 641 511 501 470 463 383 374 370 353 346 -2 -6 -1 -16 -9 -2.5
Blackall Tambo (R) 2,916 2,924 2,843 2,465 2,432 2,138 2,089 2,074 2,069 2,086 -16 -76 -7 -59 -13 -0.6
Boulia (S) 614 564 557 530 577 450 440 442 448 469 -1 -5 9 -25 5 1.0
Diamantina (S) 298 269 246 324 326 302 308 315 319 322 -5 16 0 -5 5 1.6
Longreach (R) 4,934 4,670 4,773 4,478 4,626 4,326 4,289 4,283 4,298 4,344 21 -59 30 -60 5 0.1
Winton (S) 1,913 1,761 1,758 1,651 1,616 1,474 1,463 1,409 1,407 1,414 -1 -21 -7 -28 -15 -1.0
MACKAY SD 100,375 117,511 123,793 133,466 137,539 159,800 163,629 168,228 172,732 176,236 1,256 1,935 815 4,452 4,109 2.5
Isaac (R) 16,552 22,428 22,400 20,568 18,524 21,113 21,543 22,007 22,417 22,629 -6 -366 -409 518 379 1.7
Mackay (R) 63,294 71,395 76,472 85,821 91,084 107,332 109,957 112,984 116,121 118,842 1,015 1,870 1,053 3,250 2,878 2.6
Whitsunday (R) 20,529 23,688 24,921 27,077 27,931 31,355 32,129 33,237 34,194 34,765 247 431 171 685 853 2.6
NORTHERN SD 144,891 157,732 169,089 179,037 190,266 209,902 215,366 221,395 227,336 231,628 2,271 1,990 2,246 3,927 5,432 2.5
Burdekin (S) 19,643 19,403 19,248 18,955 18,512 18,085 18,296 18,268 18,430 18,531 -31 -59 -89 -85 112 0.6
Charters Towers (R) 10,991 12,314 12,764 12,462 12,242 12,155 12,267 12,548 12,696 12,837 90 -60 -44 -17 171 1.4
Hinchinbrook (S) 13,643 13,397 13,367 13,362 12,410 12,239 12,231 12,249 12,283 12,271 -6 -1 -190 -34 8 0.1
Palm Island (S)(b) n.a. n.a. n.a. 2,133 2,313 2,145 2,164 2,193 2,187 2,221 n.a. n.a. 36 -34 19 0.9
Townsville (C) 98,437 110,479 121,576 132,125 144,789 165,278 170,408 176,137 181,740 185,768 2,219 2,110 2,533 4,098 5,123 3.0

Produced by the Office of Economic and Statistical Research, Queensland Treasury © The State of Queensland (Queensland Treasury) 2011 Queensland Government population projections to 2031: local government areas 2011 edition
37
STATISTICAL DIVISION (SD)
Local government area (LGA) 1981 1986 1991 1996 2001 2006 2007(r) 2008(r) 2009(r) 2010(p) 1991 1996 2001 2006
no. no. no. no. no. no. no. no. no. no. no. no. no. no. no. %
2010(p)
Average annual population change
5 years to 30 June4 years to 30
JuneEstimated resident population (ERP) at 30 June
FAR NORTH SD 141,752 162,981 183,155 212,340 224,163 247,295 254,309 262,896 269,645 275,058 4,035 5,837 2,365 4,626 6,941 2.7
Aurukun (S) 723 844 800 836 1,095 1,129 1,156 1,196 1,209 1,216 -9 7 52 7 22 1.9
Cairns (R) 69,411 84,172 98,413 120,828 128,095 147,538 152,668 159,184 164,354 168,251 2,848 4,483 1,453 3,889 5,178 3.3
Cassowary Coast (R) 23,940 25,179 26,548 28,894 30,113 29,642 30,005 30,458 30,991 31,291 274 469 244 -94 412 1.4
Cook (S) 2,670 2,757 2,848 3,195 3,707 3,695 3,748 3,825 3,899 3,976 18 69 102 -2 70 1.8
Croydon (S) 246 297 236 287 288 274 267 277 273 273 -12 10 0 -3 0 -0.1
Etheridge (S) 893 1,065 1,037 957 1,016 900 937 935 939 925 -6 -16 12 -23 6 0.7
Hope Vale (S)(b) n.a. n.a. n.a. 823 892 842 833 832 832 847 n.a. n.a. 14 -10 1 0.1
Kowanyama (S)(b) n.a. n.a. n.a. 1,021 1,019 1,101 1,130 1,141 1,156 1,198 n.a. n.a. 0 16 24 2.1
Lockhart River (S)(b) n.a. n.a. n.a. 573 650 599 604 608 619 641 n.a. n.a. 15 -10 11 1.7
Mapoon (S)(b) n.a. n.a. n.a. 184 209 256 260 263 266 267 n.a. n.a. 5 9 3 1.1
Napranum (S)(b) n.a. n.a. n.a. 754 800 908 915 928 930 951 n.a. n.a. 9 22 11 1.2
Northern Peninsula Area (R)(b) n.a. n.a. n.a. 1,868 2,095 2,138 2,222 2,264 2,282 2,389 n.a. n.a. 45 9 63 2.8
Pormpuraaw (S)(b) n.a. n.a. n.a. 553 630 644 667 673 676 698 n.a. n.a. 15 3 14 2.0
Tablelands (R) 29,927 34,036 36,840 39,894 40,801 43,507 44,382 45,448 46,364 46,937 561 611 181 541 858 1.9
Torres (S) 2,620 2,706 3,032 3,147 3,600 3,496 3,568 3,690 3,642 3,700 65 23 91 -21 51 1.4
Torres Strait Island (R)(b) n.a. n.a. n.a. 3,664 4,327 4,713 4,796 4,895 4,913 5,082 n.a. n.a. 133 77 92 1.9
Weipa (T) 2,069 2,136 2,394 2,485 2,173 3,007 3,210 3,291 3,320 3,340 51 18 -62 167 83 2.7
Wujal Wujal (S)(b) n.a. n.a. n.a. 339 373 348 344 352 352 354 n.a. n.a. 7 -5 2 0.4
Yarrabah (S)(b) n.a. n.a. n.a. 2,038 2,280 2,558 2,597 2,636 2,628 2,722 n.a. n.a. 48 56 41 1.6
NORTH WEST SD 38,668 36,997 36,724 34,373 34,283 33,213 33,452 34,202 33,978 34,183 -55 -470 -18 -214 243 0.7
Burke (S) 395 324 330 279 500 531 544 564 555 554 1 -10 44 6 6 1.1
Carpentaria (S) 1,699 1,732 1,879 1,976 2,290 2,076 2,106 2,124 2,123 2,149 29 19 63 -43 18 0.9
Cloncurry (S) 3,806 3,160 3,135 3,193 3,827 3,366 3,359 3,406 3,380 3,384 -5 12 127 -92 5 0.1
Doomadgee (S)(b) n.a. n.a. n.a. 891 1,201 1,170 1,237 1,240 1,240 1,285 n.a. n.a. 62 -6 29 2.4
Flinders (S) 2,711 2,877 2,666 2,234 2,090 1,911 1,882 1,870 1,834 1,821 -42 -86 -29 -36 -23 -1.2
McKinlay (S) 1,476 1,372 1,219 1,157 1,066 955 961 964 944 944 -31 -12 -18 -22 -3 -0.3
Mornington (S) 827 905 729 1,128 1,010 1,121 1,131 1,088 1,103 1,101 -35 80 -24 22 -5 -0.4
Mount Isa (C) 25,448 24,322 24,507 22,386 21,149 21,114 21,283 21,993 21,837 21,994 37 -424 -247 -7 220 1.0
Richmond (S) 1,350 1,225 1,204 1,129 1,150 969 949 953 962 951 -4 -15 4 -36 -5 -0.5
QUEENSLAND 2,345,208 2,624,595 2,960,951 3,338,690 3,628,946 4,090,908 4,195,981 4,308,570 4,424,767 4,513,850 67,271 75,548 58,051 92,392 105,736 2.5
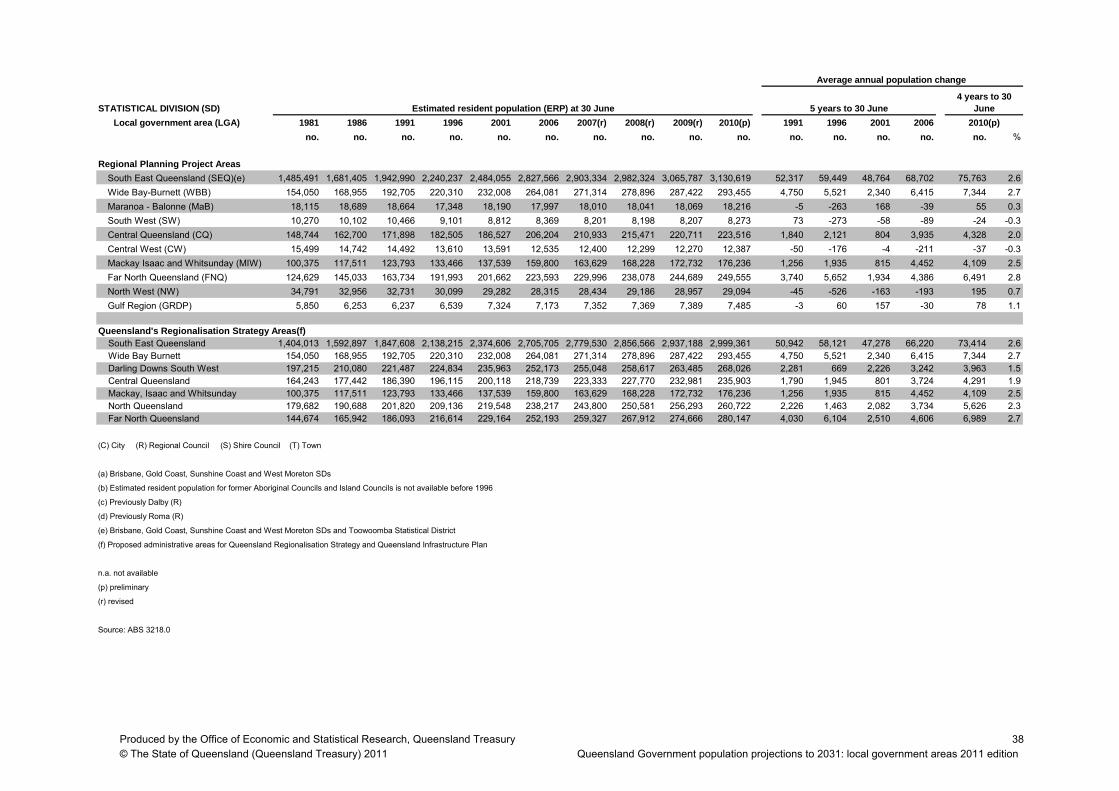
Produced by the Office of Economic and Statistical Research, Queensland Treasury © The State of Queensland (Queensland Treasury) 2011 Queensland Government population projections to 2031: local government areas 2011 edition
38
STATISTICAL DIVISION (SD)
Average annual population change
5 years to 30 June4 years to 30
JuneEstimated resident population (ERP) at 30 June
Local government area (LGA) 1981 1986 1991 1996 2001 2006 2007(r) 2008(r) 2009(r) 2010(p) 1991 1996 2001 2006
no. no. no. no. no. no. no. no. no. no. no. no. no. no. no. %
2010(p) Regional Planning Project Areas
South East Queensland (SEQ)(e) 1,485,491 1,681,405 1,942,990 2,240,237 2,484,055 2,827,566 2,903,334 2,982,324 3,065,787 3,130,619 52,317 59,449 48,764 68,702 75,763 2.6
Wide Bay-Burnett (WBB) 154,050 168,955 192,705 220,310 232,008 264,081 271,314 278,896 287,422 293,455 4,750 5,521 2,340 6,415 7,344 2.7
Maranoa - Balonne (MaB) 18,115 18,689 18,664 17,348 18,190 17,997 18,010 18,041 18,069 18,216 -5 -263 168 -39 55 0.3
South West (SW) 10,270 10,102 10,466 9,101 8,812 8,369 8,201 8,198 8,207 8,273 73 -273 -58 -89 -24 -0.3
Central Queensland (CQ) 148,744 162,700 171,898 182,505 186,527 206,204 210,933 215,471 220,711 223,516 1,840 2,121 804 3,935 4,328 2.0
Central West (CW) 15,499 14,742 14,492 13,610 13,591 12,535 12,400 12,299 12,270 12,387 -50 -176 -4 -211 -37 -0.3
Mackay Isaac and Whitsunday (MIW) 100,375 117,511 123,793 133,466 137,539 159,800 163,629 168,228 172,732 176,236 1,256 1,935 815 4,452 4,109 2.5
Far North Queensland (FNQ) 124,629 145,033 163,734 191,993 201,662 223,593 229,996 238,078 244,689 249,555 3,740 5,652 1,934 4,386 6,491 2.8
North West (NW) 34,791 32,956 32,731 30,099 29,282 28,315 28,434 29,186 28,957 29,094 -45 -526 -163 -193 195 0.7
Gulf Region (GRDP) 5,850 6,253 6,237 6,539 7,324 7,173 7,352 7,369 7,389 7,485 -3 60 157 -30 78 1.1
Queensland's Regionalisation Strategy Areas(f)South East Queensland 1,404,013 1,592,897 1,847,608 2,138,215 2,374,606 2,705,705 2,779,530 2,856,566 2,937,188 2,999,361 50,942 58,121 47,278 66,220 73,414 2.6Wide Bay Burnett 154,050 168,955 192,705 220,310 232,008 264,081 271,314 278,896 287,422 293,455 4,750 5,521 2,340 6,415 7,344 2.7Darling Downs South West 197,215 210,080 221,487 224,834 235,963 252,173 255,048 258,617 263,485 268,026 2,281 669 2,226 3,242 3,963 1.5Central Queensland 164,243 177,442 186,390 196,115 200,118 218,739 223,333 227,770 232,981 235,903 1,790 1,945 801 3,724 4,291 1.9Mackay, Isaac and Whitsunday 100,375 117,511 123,793 133,466 137,539 159,800 163,629 168,228 172,732 176,236 1,256 1,935 815 4,452 4,109 2.5North Queensland 179,682 190,688 201,820 209,136 219,548 238,217 243,800 250,581 256,293 260,722 2,226 1,463 2,082 3,734 5,626 2.3Far North Queensland 144,674 165,942 186,093 216,614 229,164 252,193 259,327 267,912 274,666 280,147 4,030 6,104 2,510 4,606 6,989 2.7
( C) City (R) Regional Council (S) Shire Council (T) Town
a) Brisbane, Gold Coast, Sunshine Coast and West Moreton SDs
b) Estimated resident population for former Aboriginal Councils and Island Councils is not available before 1996
c) Previously Dalby (R)
d) Previously Roma (R)
e) Brisbane, Gold Coast, Sunshine Coast and West Moreton SDs and Toowoomba Statistical District
) Proposed administrative areas for Queensland Regionalisation Strategy and Queensland Infrastructure Plan
a. not available
p) preliminary
r) revised
Source: ABS 3218.0
(
(
(
( ( (f
n. ( (
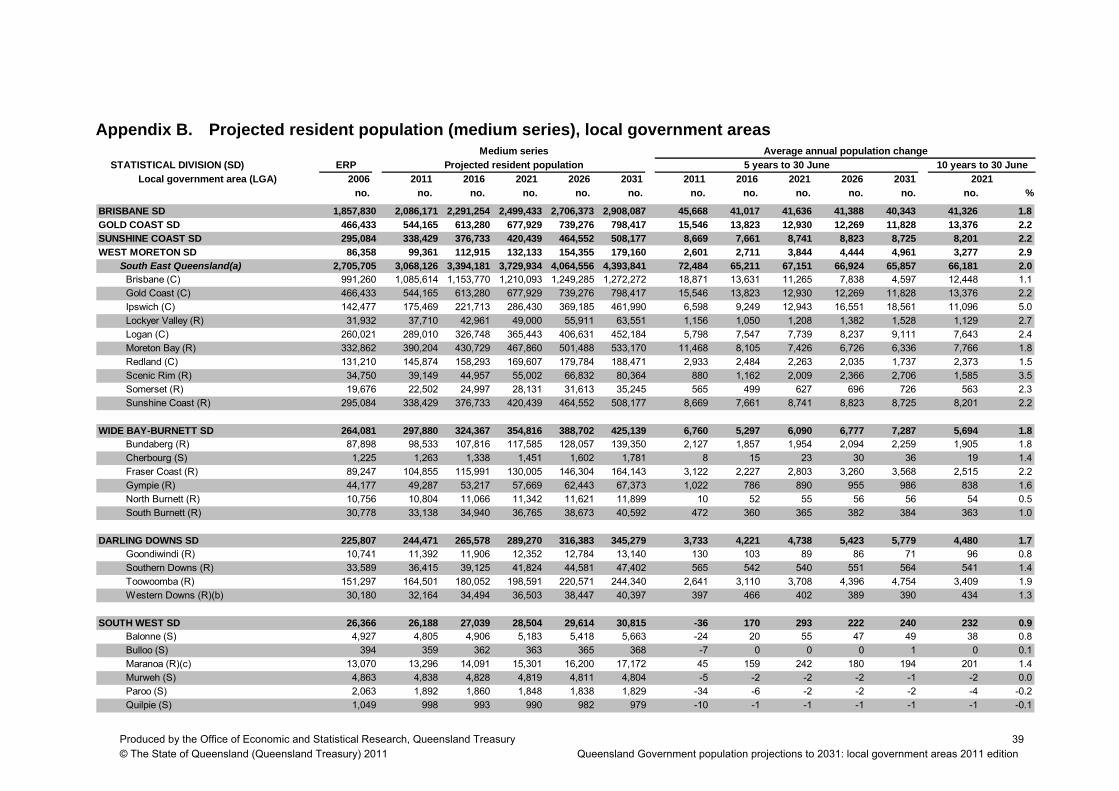
Produced by the Office of Economic and Statistical Research, Queensland Treasury © The State of Queensland (Queensland Treasury) 2011 Queensland Government population projections to 2031: local government areas 2011 edition
39
Appendix B. Projected resident population (medium series), local government areas
STATISTICAL DIVISION (SD) ERP
Local government area (LGA) 2006 2011 2016 2021 2026 2031 2011 2016 2021 2026 2031no. no. no. no. no. no. no. no. no. no. no. no. %
Medium series Average annual population changeProjected resident population 5 years to 30 June 10 years to 30 June
2021
BRISBANE SD 1,857,830 2,086,171 2,291,254 2,499,433 2,706,373 2,908,087 45,668 41,017 41,636 41,388 40,343 41,326 1.8GOLD COAST SD 466,433 544,165 613,280 677,929 739,276 798,417 15,546 13,823 12,930 12,269 11,828 13,376 2.2SUNSHINE COAST SD 295,084 338,429 376,733 420,439 464,552 508,177 8,669 7,661 8,741 8,823 8,725 8,201 2.2WEST MORETON SD 86,358 99,361 112,915 132,133 154,355 179,160 2,601 2,711 3,844 4,444 4,961 3,277 2.9
South East Queensland(a) 2,705,705 3,068,126 3,394,181 3,729,934 4,064,556 4,393,841 72,484 65,211 67,151 66,924 65,857 66,181 2.0Brisbane (C) 991,260 1,085,614 1,153,770 1,210,093 1,249,285 1,272,272 18,871 13,631 11,265 7,838 4,597 12,448 1.1Gold Coast (C) 466,433 544,165 613,280 677,929 739,276 798,417 15,546 13,823 12,930 12,269 11,828 13,376 2.2Ipswich (C) 142,477 175,469 221,713 286,430 369,185 461,990 6,598 9,249 12,943 16,551 18,561 11,096 5.0Lockyer Valley (R) 31,932 37,710 42,961 49,000 55,911 63,551 1,156 1,050 1,208 1,382 1,528 1,129 2.7Logan (C) 260,021 289,010 326,748 365,443 406,631 452,184 5,798 7,547 7,739 8,237 9,111 7,643 2.4Moreton Bay (R) 332,862 390,204 430,729 467,860 501,488 533,170 11,468 8,105 7,426 6,726 6,336 7,766 1.8Redland (C) 131,210 145,874 158,293 169,607 179,784 188,471 2,933 2,484 2,263 2,035 1,737 2,373 1.5Scenic Rim (R) 34,750 39,149 44,957 55,002 66,832 80,364 880 1,162 2,009 2,366 2,706 1,585 3.5Somerset (R) 19,676 22,502 24,997 28,131 31,613 35,245 565 499 627 696 726 563 2.3Sunshine Coast (R) 295,084 338,429 376,733 420,439 464,552 508,177 8,669 7,661 8,741 8,823 8,725 8,201 2.2
WIDE BAY-BURNETT SD 264,081 297,880 324,367 354,816 388,702 425,139 6,760 5,297 6,090 6,777 7,287 5,694 1.8Bundaberg (R) 87,898 98,533 107,816 117,585 128,057 139,350 2,127 1,857 1,954 2,094 2,259 1,905 1.8Cherbourg (S) 1,225 1,263 1,338 1,451 1,602 1,781 8 15 23 30 36 19 1.4Fraser Coast (R) 89,247 104,855 115,991 130,005 146,304 164,143 3,122 2,227 2,803 3,260 3,568 2,515 2.2Gympie (R) 44,177 49,287 53,217 57,669 62,443 67,373 1,022 786 890 955 986 838 1.6North Burnett (R) 10,756 10,804 11,066 11,342 11,621 11,899 10 52 55 56 56 54 0.5South Burnett (R) 30,778 33,138 34,940 36,765 38,673 40,592 472 360 365 382 384 363 1.0
DARLING DOWNS SD 225,807 244,471 265,578 289,270 316,383 345,279 3,733 4,221 4,738 5,423 5,779 4,480 1.7Goondiwindi (R) 10,741 11,392 11,906 12,352 12,784 13,140 130 103 89 86 71 96 0.8Southern Downs (R) 33,589 36,415 39,125 41,824 44,581 47,402 565 542 540 551 564 541 1.4Toowoomba (R) 151,297 164,501 180,052 198,591 220,571 244,340 2,641 3,110 3,708 4,396 4,754 3,409 1.9Western Downs (R)(b) 30,180 32,164 34,494 36,503 38,447 40,397 397 466 402 389 390 434 1.3
SOUTH WEST SD 26,366 26,188 27,039 28,504 29,614 30,815 -36 170 293 222 240 232 0.9Balonne (S) 4,927 4,805 4,906 5,183 5,418 5,663 -24 20 55 47 49 38 0.8Bulloo (S) 394 359 362 363 365 368 -7 0 0 0 1 0 0.1Maranoa (R)(c) 13,070 13,296 14,091 15,301 16,200 17,172 45 159 242 180 194 201 1.4
Murweh (S) 4,863 4,838 4,828 4,819 4,811 4,804 -5 -2 -2 -2 -1 -2 0.0Paroo (S) 2,063 1,892 1,860 1,848 1,838 1,829 -34 -6 -2 -2 -2 -4 -0.2Quilpie (S) 1,049 998 993 990 982 979 -10 -1 -1 -1 -1 -1 -0.1

Produced by the Office of Economic and Statistical Research, Queensland Treasury © The State of Queensland (Queensland Treasury) 2011 Queensland Government population projections to 2031: local government areas 2011 edition
40
STATISTICAL DIVISION (SD) ERP
Local government area (LGA) 2006 2011 2016 2021 2026 2031 2011 2016 2021 2026 2031no. no. no. no. no. no. no. no. no. no. no. no. %
Medium series Average annual population changeProjected resident population 5 years to 30 June 10 years to 30 June
2021
FITZROY SD 206,204 229,173 256,644 283,931 313,314 344,938 4,594 5,494 5,457 5,877 6,325 5,476 2.2
Pormpuraaw (S) 644 691 737 778 817 855 9 9 8 8 8 9 1.2Tablelands (R) 43,507 47,572 50,622 53,464 56,500 59,873 813 610 568 607 675 589 1.2
Banana (S) 15,572 15,742 16,948 17,310 17,759 18,277 34 241 72 90 104 157 1.0Central Highlands (R) 28,256 31,861 36,256 40,880 45,685 50,742 721 879 925 961 1,011 902 2.5
Gladstone (R) 53,941 62,982 74,459 85,655 98,174 111,690 1,808 2,295 2,239 2,504 2,703 2,267 3.1Rockhampton (R) 107,517 117,612 127,915 138,933 150,450 162,873 2,019 2,061 2,204 2,303 2,485 2,132 1.7Woorabinda (S) 918 976 1,065 1,152 1,246 1,357 12 18 17 19 22 18 1.7
CENTRAL WEST SD 12,535 12,150 12,597 13,013 13,376 13,814 -77 89 83 72 88 86 0.7Barcaldine (R) 3,462 3,412 3,772 3,934 4,050 4,185 -10 72 32 23 27 52 1.4Barcoo (S) 383 343 337 340 343 346 -8 -1 1 1 1 0 -0.1
Blackall Tambo (R) 2,138 2,017 2,021 2,043 2,063 2,091 -24 1 4 4 6 3 0.1Boulia (S) 450 434 451 479 512 551 -3 3 6 6 8 5 1.0Diamantina (S) 302 328 345 362 382 404 5 3 3 4 4 3 1.0
Longreach (R) 4,326 4,263 4,350 4,525 4,694 4,889 -13 17 35 34 39 26 0.6Winton (S) 1,474 1,352 1,321 1,330 1,333 1,348 -24 -6 2 1 3 -2 -0.2
MACKAY SD 159,800 180,417 207,232 233,544 257,802 279,819 4,123 5,363 5,262 4,852 4,403 5,313 2.6Isaac (R) 21,113 23,277 28,266 31,418 34,270 37,000 433 998 631 570 546 814 3.0Mackay (R) 107,332 121,397 138,348 156,117 172,604 187,367 2,813 3,390 3,554 3,297 2,953 3,472 2.5Whitsunday (R) 31,355 35,743 40,618 46,008 50,928 55,451 878 975 1,078 984 905 1,027 2.6
NORTHERN SD 209,902 237,461 264,189 290,402 318,094 346,263 5,512 5,346 5,243 5,538 5,634 5,294 2.0Burdekin (S) 18,085 18,667 18,974 19,207 19,404 19,488 116 61 47 39 17 54 0.3
Charters Towers (R) 12,155 12,979 13,627 14,063 14,521 14,963 165 130 87 92 88 108 0.8Hinchinbrook (S) 12,239 12,409 12,608 12,815 13,028 13,231 34 40 42 43 41 41 0.3Palm Island (S) 2,145 2,288 2,456 2,632 2,812 3,002 29 34 35 36 38 34 1.4
Townsville (C) 165,278 191,119 216,524 241,684 268,330 295,578 5,168 5,081 5,032 5,329 5,450 5,057 2.4
FAR NORTH SD 247,295 280,952 304,713 327,315 349,607 372,559 6,731 4,752 4,520 4,458 4,590 4,636 1.5Aurukun (S) 1,129 1,237 1,296 1,338 1,374 1,407 22 12 8 7 7 10 0.8
Cairns (R) 147,538 172,890 190,657 207,756 224,426 241,494 5,070 3,553 3,420 3,334 3,414 3,487 1.9Cassowary Coast (R) 29,642 31,371 32,307 33,198 34,046 34,841 346 187 178 170 159 183 0.6Cook (S) 3,695 4,018 4,287 4,544 4,831 5,157 65 54 51 57 65 53 1.2
Croydon (S) 274 281 286 288 292 295 1 1 1 1 1 1 0.3Etheridge (S) 900 962 970 992 1,010 1,026 12 2 4 4 3 3 0.3Hope Vale (S) 842 870 895 914 929 939 6 5 4 3 2 4 0.5
Kowanyama (S) 1,101 1,192 1,284 1,367 1,447 1,526 18 18 17 16 16 18 1.4Lockhart River (S) 599 637 673 705 734 761 8 7 6 6 5 7 1.0Mapoon (S) 256 285 316 344 374 404 6 6 6 6 6 6 1.9Napranum (S) 908 1,002 1,099 1,189 1,280 1,372 19 19 18 18 18 19 1.7
Northern Peninsula Area (R) 2,138 2,288 2,435 2,583 2,724 2,861 30 29 30 28 27 30 1.2
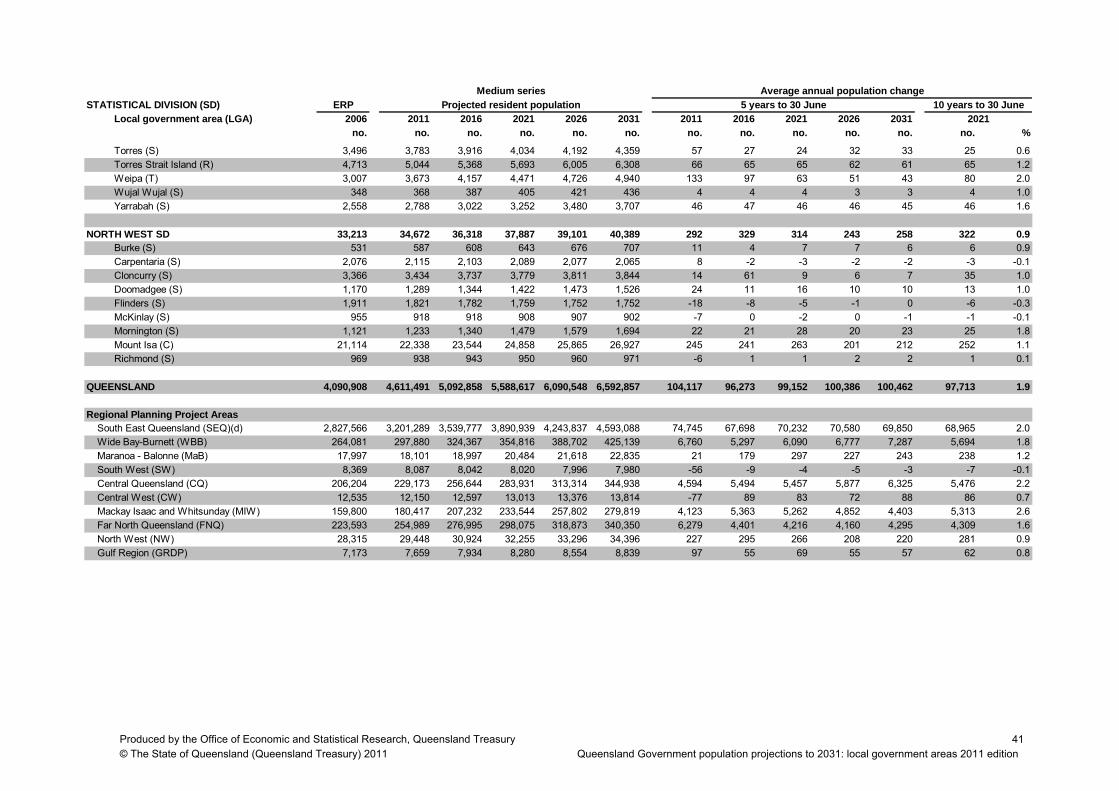
Produced by the Office of Economic and Statistical Research, Queensland Treasury © The State of Queensland (Queensland Treasury) 2011 Queensland Government population projections to 2031: local government areas 2011 edition
41
STATISTICAL DIVISION (SD) ERPLocal government area (LGA) 2006 2011 2016 2021 2026 2031 2011 2016 2021 2026 2031
Medium series Average annual population change
Projected resident population 5 years to 30 June 10 years to 30 June2021
no. no. no. no. no. no. no. no. no. no. no. no. %
Torres (S) 3,496 3,783 3,916 4,034 4,192 4,359 57 27 24 32 33 25 0.6Torres Strait Island (R) 4,713 5,044 5,368 5,693 6,005 6,308 66 65 65 62 61 65 1.2Weipa (T) 3,007 3,673 4,157 4,471 4,726 4,940 133 97 63 51 43 80 2.0Wujal Wujal (S) 348 368 387 405 421 436 4 4 4 3 3 4 1.0Yarrabah (S) 2,558 2,788 3,022 3,252 3,480 3,707 46 47 46 46 45 46 1.6
N
O RTH WEST SD 33,213 34,672 36,318 37,887 39,101 40,389 292 329 314 243 258 322 0.9Burke (S) 531 587 608 643 676 707 11 4 7 7 6 6 0.9Carpentaria (S) 2,076 2,115 2,103 2,089 2,077 2,065 8 -2 -3 -2 -2 -3 -0.1Cloncurry (S) 3,366 3,434 3,737 3,779 3,811 3,844 14 61 9 6 7 35 1.0Doomadgee (S) 1,170 1,289 1,344 1,422 1,473 1,526 24 11 16 10 10 13 1.0Flinders (S) 1,911 1,821 1,782 1,759 1,752 1,752 -18 -8 -5 -1 0 -6 -0.3McKinlay (S) 955 918 918 908 907 902 -7 0 -2 0 -1 -1 -0.1Mornington (S) 1,121 1,233 1,340 1,479 1,579 1,694 22 21 28 20 23 25 1.8Mount Isa (C) 21,114 22,338 23,544 24,858 25,865 26,927 245 241 263 201 212 252 1.1Richmond (S) 969 938 943 950 960 971 -6 1 1 2 2 1 0.1
Q EENSLAND 4,090,908 4,611,491 5,092,858 5,588,617 6,090,548 6,592,857 104,117 96,273 99,152 100,386 100,462 97,713 1.9
R gional Planning Project Areasouth East Queensland (SEQ)(d) 2,827,566 3,201,289 3,539,777 3,890,939 4,243,837 4,593,088 74,745 67,698 70,232 70,580 69,850 68,965 2.0ide Bay-Burnett (WBB) 264,081 297,880 324,367 354,816 388,702 425,139 6,760 5,297 6,090 6,777 7,287 5,694 1.8
Maranoa - Balonne (MaB) 17,997 18,101 18,997 20,484 21,618 22,835 21 179 297 227 243 238 1.2outh West (SW) 8,369 8,087 8,042 8,020 7,996 7,980 -56 -9 -4 -5 -3 -7 -0.1entral Queensland (CQ) 206,204 229,173 256,644 283,931 313,314 344,938 4,594 5,494 5,457 5,877 6,325 5,476 2.2entral West (CW) 12,535 12,150 12,597 13,013 13,376 13,814 -77 89 83 72 88 86 0.7
Mackay Isaac and Whitsunday (MIW) 159,800 180,417 207,232 233,544 257,802 279,819 4,123 5,363 5,262 4,852 4,403 5,313 2.6ar North Queensland (FNQ) 223,593 254,989 276,995 298,075 318,873 340,350 6,279 4,401 4,216 4,160 4,295 4,309 1.6orth West (NW) 28,315 29,448 30,924 32,255 33,296 34,396 227 295 266 208 220 281 0.9ulf Region (GRDP) 7,173 7,659 7,934 8,280 8,554 8,839 97 55 69 55 57 62 0.8
U
e
S
W
S
C
C
F
N
G

Produced by the Office of Economic and Statistical Research, Queensland Treasury © The State of Queensland (Queensland Treasury) 2011 Queensland Government population projections to 2031: local government areas 2011 edition
42
STATISTICAL DIVISION (SD) ERP
Local government area (LGA) 2006 2011 2016 2021 2026 2031 2011 2016 2021 2026 2031
Medium series Average annual population changeProjected resident population 5 years to 30 June 10 years to 30 June
2021no. no. no. no. no. no. no. no. no. no. no. no. %
Queensland's Regionalisation Strategy Areas(e)South East Queensland 2,705,705 3,068,127 3,394,181 3,729,934 4,064,556 4,393,841 72,484 65,211 67,151 66,924 65,857 66,181 2.0Wide Bay Burnett 264,081 297,880 324,367 354,816 388,702 425,139 6,760 5,297 6,090 6,777 7,287 5,694 1.8Darling Downs South West 252,173 270,659 292,617 317,774 345,997 376,094 3,697 4,391 5,031 5,645 6,019 4,711 1.6Central Queensland 218,739 241,323 269,241 296,945 326,690 358,752 4,517 5,584 5,541 5,949 6,412 5,562 2.1Mackay, Isaac and Whitsunday 159,800 180,417 207,232 233,544 257,802 279,819 4,123 5,363 5,262 4,852 4,403 5,313 2.6North Queensland 238,217 266,909 295,113 322,657 351,390 380,659 5,738 5,641 5,509 5,747 5,854 5,575 1.9Far North Queensland 252,193 286,176 310,108 332,948 355,412 378,552 6,797 4,786 4,568 4,493 4,628 4,677 1.5
These population projections have been prepared using the latest available information. For more information please contact OESR on (07) 3224 5326 or visit our website www.oesr.qld.gov.au/dap.
Disclaimer: While every care has been taken in preparing these population projections, neither the State of Queensland nor Demographics Australia accepts responsibility for decisions or actions taken as a result of the data in this report.
A high degree of accuracy for small cells, including zero, should not be assumed.
(C) City (R) Regional Council (S) Shire Council (T) Town
(a) Brisbane, Gold Coast, Sunshine Coast and West Moreton SDs
(b) Previously Dalby (R)
(c) Previously Roma (R)
(d) Brisbane, Gold Coast, Sunshine Coast and West Moreton SDs and Toowoomba Statistical District
(e) Proposed administrative areas for Queensland Regionalisation Strategy and Queensland Infrastructure Plan
Source: ABS 3218.0 (for 2006 ERP) and 2011 edition Queensland Government population projections

Produced by the Office of Economic and Statistical Research, Queensland Treasury © The State of Queensland (Queensland Treasury) 2011 Queensland Government population projections to 2031: local government areas 2011 edition
43
Appendix C. Projected resident population (high series), local government areas
STATISTICAL DIVISION (SD) ERP
STATISTICAL DIVISION (SD) ERP
Local government area (LGA) 2006 2011 2016 2021 2026 2031 2011 2016 2021 2026 2031
no. no. no. no. no. no. no. no. no. no. no. no. %
Projected resident population 5 years to 30 June 10 years to 30 June
2021
High series Average annual population change
Local government area (LGA) 2006 2011 2016 2021 2026 2031 2011 2016 2021 2026 2031Projected resident population 5 years to 30 June
no. no. no. no. no. no. no. no. no. no. no. no. %
Average annual population change10 years to 30 June
2021
High series
BRISBANE SD 1,857,830 2,105,063 2,369,326 2,647,447 2,938,198 3,238,959 49,447 52,853 55,624 58,150 60,152 54,238 2.3
GOLD COAST SD 466,433 549,879 635,791 718,173 797,677 875,457 16,689 17,182 16,476 15,901 15,556 16,829 2.7SUNSHINE COAST SD 295,084 341,017 388,539 443,349 499,465 555,616 9,187 9,504 10,962 11,223 11,230 10,233 2.7WEST MORETON SD 86,358 100,079 116,307 140,024
167,402,
060 197,133 2,744 3,246 4,743 5,407 6,015 3,995 3.4South East Queensland(a) 2,705,705 3,096,038 3,509,963 3,948,993 4, 400 4,867,165 78,067 82,785 87,806 90,681 92,953 85,296 2.5
Brisbane (C) 991,260 1,092,158 1,175,864 1,247,364 1,299,262 1,331,088 20,180 16,741 14,300 10,379 6,365 15,521 1.3Gold Coast (C) 466,433 549,879 635,791 718,173 797,677 875,457 16,689 17,182 16,476 15,901 15,556 16,829 2.7
Ipswich (C) 142,477 178,550 238,277 324,992 441,690 580,682 7,215 11,945 17,343 23,340 27,798 14,644 6.2Lockyer Valley (R) 31,932 37,993 44,209 51,357 59,239 67,676 1,212 1,243 1,429 1,576 1,687 1,336 3.1Logan (C) 260,021 291,664 342,376 395,846 454,977 523,508 6,329 10,142 10,694 11,826 13,706 10,418 3.1Moreton Bay (R) 332,862 395,401 448,668 499,213 547,253 595,142 12,508 10,653 10,109 9,608 9,578 10,381 2.4Redland (C) 131,210 147,291 164,142 180,032 195,016 208,539 3,216 3,370 3,178 2,997 2,705 3,274 2.0Scenic Rim (R) 34,750 39,398 46,374 59,170 74,293 91,860 930 1,395 2,559 3,025 3,513 1,977 4.2
Somerset (R) 19,676 22,688 25,724 29,498 33,527 37,598 602 607 755 806 814 681 2.7Sunshine Coast (R) 295,084 341,017 388,539 443,349 499,465 555,616 9,187 9,504 10,962 11,223 11,230 10,233 2.7
WIDE BAY-BURNETT SD 264,081 299,395 332,403 371,162 414,187 460,116 7,063 6,602 7,752 8,605 9,186 7,177 2.2Bundaberg (R) 87,898 98,961 110,454 122,820 136,043 150,203 2,213 2,299 2,473 2,645 2,832 2,386 2.2
Cherbourg (S) 1,225 1,284 1,380 1,527 1,723 1,951 12 19 30 39 46 24 1.8Fraser Coast (R) 89,247 105,463 118,847 136,212 156,454 178,503 3,243 2,677 3,473 4,048 4,410 3,075 2.6Gympie (R) 44,177 49,506 54,568 60,391 66,608 72,974 1,066 1,012 1,165 1,243 1,273 1,088 2.0North Burnett (R) 10,756 10,934 11,402 11,881 12,356 12,823 36 94 96 95 93 95 0.8South Burnett (R) 30,778 33,247 35,753 38,331 41,002 43,663 494 501 516 534 532 508 1.4
ARLING DOWNS SD 225,807 246,220 273,159 303,967 338,884 376,061 4,083 5,388 6,162 6,983 7,435 5,775 2.1Goondiwindi (R) 10,741 11,452 12,281 13,017 13,729 14,317 142 166 147 143 118 156 1.3Southern Downs (R) 33,589 36,641 40,307 44,010 47,742 51,547 610 733 741 746 761 737 1.8Toowoomba (R) 151,297 165,749 185,039 208,599 236,385 266,496 2,890 3,858 4,712 5,557 6,022 4,285 2.3Western Downs (R)(b) 30,180 32,378 35,532 38,342 41,027 43,701 440 631 562 537 535 596 1.7
OUTH WEST SD 26,366 26,440 27,865 29,992 31,705 33,494 15 285 425 343 358 355 1.3Balonne (S) 4,927 4,843 5,060 5,435 5,759 6,090 -17 43 75 65 66 59 1.2Bulloo (S) 394 371 395 417 438 460 -5 5 4 4 4 5 1.2Maranoa (R)(c) 13,070 13,423 14,502 16,077 17,315 18,624 71 216 315 248 262 265 1.8Murweh (S) 4,863 4,876 4,948 5,038 5,115 5,187 3 14 18 16 14 16 0.3Paroo (S) 2,063 1,913 1,924 1,963 1,998 2,032 -30 2 8 7 7 5 0.3
Quilpie (S) 1,049 1,014 1,036 1,061 1,080 1,101 -7 4 5 4 4 5 0.5
D S

Produced by the Office of Economic and Statistical Research, Queensland Treasury © The State of Queensland (Queensland Treasury) 2011 Queensland Government population projections to 2031: local government areas 2011 edition
44
STATISTICAL DIVISION (SD) ERPLocal government area (LGA) 2006 2011 2016 2021 2026 2031 2011 2016 2021 2026 2031
High series Average annual population changeProjected resident population 5 years to 30 June 10 years to 30 June
2021no. no. no. no. no. no. no. no. no. no. no. no. %
FITZROY SD 206,204 230,714 263,891 298,312 335,604 375,701 4,902 6,635 6,884 7,458 8,019 6,760 2.6Banana (S) 15,572 15,828 17,506 18,411 19,427 20,533 51 336 181 203 221 258 1.5Central Highlands (R) 28,256 32,118 37,208 42,850 48,758 54,981 772 1,018 1,128 1,182 1,245 1,073 2.9
Gladstone (R) 53,941 63,510 77,629 91,302 106,738 123,420 1,914 2,824 2,735 3,087 3,336 2,779 3.7Rockhampton (R) 107,517 118,269 130,448 144,537 159,348 175,293 2,150 2,
436 2,818 2,962 3,189 2,627 2.0Woorabinda (S) 918 990 1,100 1,212 1,332 1,474 14 22 22 24 28 22 2.0
ENTRAL WEST SD 12,535 12,276 13,075 13,906 14,569 15,282 -52 160 166 133 143 163 1.3Barcaldine (R) 3,462 3,443 3,933 4,284 4,516 4,752 -4 98 70 46 47 84 2.2Barcoo (S) 383 353 362 381 398 415 -6 2 4 3 3 3 0.8Blackall Tambo (R) 2,138 2,039 2,095 2,170 2,235 2,305 -20 11 15 13 14 13 0.6
Boulia (S) 450 444 487 541 597 659 -1 9 11 11 12 10 2.0Diamantina (S) 302 338 376 414 452 492 7 8 8 8 8 8 2.0
Longreach (R) 4,326 4,296 4,463 4,721 4,953 5,205 -6 33 51 46 50 42 0.9Winton (S) 1,474 1,363 1,358 1,394 1,419 1,454 -22 -1 7 5 7 3 0.2
ACKAY SD 159,800 181,932 214,017 246,816 277,836 306,562 4,426 6,417 6,560 6,204 5,745 6,488 3.1Isaac (R) 21,113 23,469 29,461 34,135 38,525 42,832 471 1,198 935 878 861 1,067 3.8
Mackay (R) 107,332 122,401 142,715 164,230 184,676 203,302 3,014 4,063 4,303 4,089 3,725 4,183 3.0Whitsunday (R) 31,355 36,062 41,841 48,451 54,635 60,428 941 1,156 1,322 1,237 1,159 1,239 3.0
ORTHERN SD 209,902 239,183 272,553 306,618 342,849 380,319 5,856 6,674 6,813 7,246 7,494 6,744 2.5Burdekin (S) 18,085 18,682 19,347 19,831 20,355 20,614 119 133 97 105 52 115 0.6
Charters Towers (R) 12,155 13,006 13,992 14,900 15,684 16,408 170 197 182 157 145 189 1.4Hinchinbrook (S) 12,239 12,467 12,859 13,251 13,641 14,017 46 79 78 78 75 78 0.6Palm Island (S) 2,145 2,305 2,546 2,802 3,066 3,350 32 48 51 53 57 50 2.0
Townsville (C) 165,278 192,723 223,808 255,834 290,104 3 5,929 5,489 6,217 6,405 6,854 7,165 6,311 2.9
AR NORTH SD 247,295 282,619 313,743 344,920 376,205 408,399 7,065 6,225 6,235 6,257 6,439 6,230 2.0Aurukun (S) 1,129 1,259 1,349 1,421 1,484 1,543 26 18 14 13 12 16 1.2Cairns (R) 147,538 173,980 196,094 218,740 241,195 264,208 5,288 4,423 4,529 4,491 4,603 4,476 2.3
Cassowary Coast (R) 29,642 31,678 33,556 35,148 36,693 38,154 407 376 318 309 292 347 1.0Cook (S) 3,695 4,031 4,361 4,692 5,066 5,489 67 66 66 75 85 66 1.5
Croydon (S) 274 291 308 322 338 352 3 3 3 3 3 3 1.0Etheridge (S) 900 974 998 1,040 1,078 1,112 15 5 9 7 7 7 0.7Hope Vale (S) 842 877 923 968 1,012 1,054 7 9 9 9 8 9 1.0
Kowanyama (S) 1,101 1,198 1,329 1,449 1,568 1,684 19 26 24 24 23 25 1.9Lockhart River (S) 599 644 708 773 840 903 9 13 13 13 13 13 1.8
Mapoon (S) 256 290 340 390 442 495 7 10 10 10 11 10 3.0Napranum (S) 908 1,007 1,146 1,278 1,409 1,541 20 28 26 26 26 27 2.4Northern Peninsula Area (R) 2,138 2,293 2,506 2,728 2,945 3,155 31 43 44 43 42 44 1.8
Pormpuraaw (S) 644 697 770 840 908 972 11 15 14 13 13 14 1.9Tablelands (R) 43,507 47,686 51,876 56,040 60,537 65,506 836 838 833 899 994 835 1.6
C M
N
2 F

Produced by the Office of Economic and Statistical Research, Queensland Treasury © The State of Queensland (Queensland Treasury) 2011 Queensland Government population projections to 2031: local government areas 2011 edition
45
STATISTICAL DIVISION (SD) ERP
Local government area (LGA) 2006 2011 2016 2021 2026 2031 2011 2016 2021 2026 2031no. no. no. no. no. no. no. no. no. no. no. no. %
Projected resident population 5 years to 30 June 10 years to 30 June
2021
High series Average annual population change
Torres (S) 3,496 3,795 4,079 4,353 4,711 5,080 60 57 55 71 74 56 1.4 Torres Strait Island (R) 4,713 5,053 5,518 6,015 6,496 6,957 68 93 99Weipa (T) 3,007 3,696 4,338 4,784 5,152 5,464 138 128 89
96 92 96 1.874 62 109 2.6
Wujal Wujal (S) 348 374 412 455 496 535 5 8 9 8 8 8 2.047 67 70 71 71 69 2.2
N RTH WEST SD 33,213 35,036 37,725 40,341 42,438 44,536 365 538 523 419 420 531 1.4Burke (S) 531 602 647 707 763 816 14 9 12 11 11 11 1.6Carpentaria (S) 2,076 2,142 2,203 2,258 2,304 2,344 13 12 11 9 8 12 0.5Cloncurry (S) 3,366 3,471 3,886 4,034 4,152 4,262 21 83 30 24 22 56 1.5Doomadgee (S) 1,170 1,309 1,421 1,557 1,661 1,763 28 22 27 21 20 25 1.7Flinders (S) 1,911 1,845 1,872 1,911 1,958 2,007 -13 5 8 9 10 7 0.4McKinlay (S) 955 936 981 1,017 1,057 1,091 -4 9 7 8 7 8 0.8Mornington (S) 1,121 1,253 1,416 1,616 1,773 1,945 26 33 40 31 34 36 2.6Mount Isa (C) 21,114 22,523 24,292 26,180 27,656 29,142 282 354 378 295 297 366 1.5Richmond (S) 969 955 1,007 1,061 1,114 1,165 -3 10 11 11 10 11 1.1
Q EENSLAND 4,090,908 4,649,852 5,258,395 5,905,027 6,576,674 7,267,636 111,789 121,709 129,326 134,329 138,192 125,518 2.4
R gional Planning Project Areasouth East Queensland (SEQ)(d) 2,827,566 3,230,316 3,659,686 4,118,332 4,594,957 5,085,128 80,550 85,874 91,729 95,325 98,034 88,802 2.5ide Bay-Burnett (WBB) 264,081 299,395 332,403 371,162 414,187 460,116 7,063 6,602 7,752 8,605 9,186 7,177 2.2aranoa - Balonne (MaB) 17,997 18,266 19,562 21,513 23,074 24,714 54 259 390 312 328 325 1.6outh West (SW) 8,369 8,174 8,303 8,479 8,631 8,780 -39 26 35 30 30 31 0.4entral Queensland (CQ) 206,204 230,714 263,891 298,312 335,604 375,701 4,902 6,635 6,884 7,458 8,019 6,760 2.6entral West (CW) 12,535 12,276 13,075 13,906 14,569 15,282 -52 160 166 133 143 163 1.3ackay Isaac and Whitsunday (MIW) 159,800 181,932 214,017 246,816 277,836 306,562 4,426 6,417 6,560 6,204 5,745 6,488 3.1ar North Queensland (FNQ) 223,593 256,513 285,071 313,866 342,758 372,596 6,584 5,712 5,759 5,778 5,968 5,735 2.0orth West (NW) 28,315 29,730 32,039 34,203 35,937 37,667 283 462 433 347 346 447 1.4ulf Region (GRDP) 7,173 7,769 8,320 8,949 9,484 10,017 119 110 126 107 107 118 1.4
Yarrabah (S) 2,558 2,795 3,132 3,483 3,838 4,194
O U
e
S WM
S
C CM
F
N G

Produced by the Office of Economic and Statistical Research, Queensland Treasury © The State of Queensland (Queensland Treasury) 2011 Queensland Government population projections to 2031: local government areas 2011 edition
46
STATISTICAL DIVISION (SD) ERPLocal government area (LGA) 2006 2011 2016 2021 2026 2031 2011 2016 2021 2026 2031
no. no. no. no. no. no. no. no. no. no. no. no. %
High series Average annual population changeProjected resident population 5 years to 30 June 10 years to 30 June
2021
Queensland's Regionalisation Strategy Areas(e)South East Queensland 2,705,705 3,096,038 3,509,963 3,948,993 4,402,400 4,867,165 78,067 82,785 87,806 90,681 92,953 85,296 2.5Wide Bay Burnett 264,081 299,395 332,403 371,162 414,187 460,116 7,063 6,602 7,752 8,605 9,186 7,177 2.2Darling Downs South West 252,173 272,660 301,024 333,959 370,589 409,555 4,097 5,673 6,587 7,326 7,793 6,130 2.0Central Queensland 218,739 242,990 276,965 312,218 350,173 390,983 4,850 6,795 7,050 7,591 8,162 6,923 2.5Mackay, Isaac and Whitsunday 159,800 181,932 214,017 246,816 277,836 306,562 4,426 6,417 6,560 6,204 5,745 6,488 3.1North Queensland 238,217 268,913 304,592 340,821 378,786 417,986 6,139 7,136 7,246 7,593 7,840 7,191 2.4Far North Queensland 252,193 287,925 319,429 351,058 382,706 415,268 7,146 6,301 6,326 6,330 6,512 6,313 2.0
These population projections have been prepared using the latest available information. For more information please contact OESR on (07) 3224 5326 or visit our website www.oesr.qld.gov.au/dap.
Disclaimer: While every care has been taken in preparing these population projections, neither the State of Queensland nor Demographics Australia accepts responsibility for decisions or actions taken as a result of the data in this report.
A high degree of accuracy for small cells, including zero, should not be assumed
(C) City (R) Regional Council (S) Shire Council (T) Town
(a) Brisbane, Gold Coast, Sunshine Coast and West Moreton SDs
(b) Previously Dalby (R)
(c) Previously Roma (R)
(d) Brisbane, Gold Coast, Sunshine Coast and West Moreton SDs and Toowoomba Statistical District
(e) Proposed administrative areas for Queensland Regionalisation Strategy and Queensland Infrastructure Plan
Source: ABS 3218.0 (for 2006 ERP) and 2011 edition Queensland Government population projections

Produced by the Office of Economic and Statistical Research, Queensland Treasury © The State of Queensland (Queensland Treasury) 2011 Queensland Government population projections to 2031: local government areas 2011 edition
47
Appendix D. Projected resident population (low series), local government areas
STATISTICAL DIVISION (SD) ERPLocal government area (LGA) 2006 2011 2016 2021 2026 2031 2011 2016 2021 2026 2031
no. no. no. no. no. no. no. no. no. no. no. no. %
Low series Average annual population changeProjected resident population 5 years to 30 June 10 years to 30 June
2021
BRISBANE SD 1,857,830 2,076,817 2,223,290 2,367,300 2,503,906 2,627,511 43,797 29,295 28,802 27,321 24,721 29,048 1.3GOLD COAST SD 466,433 540,579 593,016 640,508 684,072 724,492 14,829 10,487 9,498 8,713 8,084 9,993 1.7SUNSHINE COAST SD 295,084 336,404 367,345 401,591 434,678 466,187 8,264 6,188 6,849 6,617 6,302 6,519 1.8WEST MORETON SD 86,358 98,239 108,783 122,719 138,462 155,260 2,376 2,109 2,787 3,149 3,360 2,448 2.2
South East Queensland(a) 2,705,705 3,052,039 3,292,434 3,532,118 3,761,118 3,973,450 69,267 48,079 47,937 45,800 42,466 48,008 1.5Brisbane (C) 991,260 1,081,633 1,127,905 1,163,976 1,186,831 1,198,115 18,075 9,254 7,214 4,571 2,257 8,234 0.7
Gold Coast (C) 466,433 540,579 593,016 640,508 684,072 724,492 14,829 10,487 9,498 8,713 8,084 9,993 1.7Ipswich (C) 142,477 174,558 210,805 259,728 319,087 380,487 6,416 7,249 9,785 11,872 12,280 8,517 4.1Lockyer Valley (R) 31,932 37,247 41,672 46,517 51,904 57,633 1,063 885 969 1,077 1,146 927 2.2Logan (C) 260,021 287,514 313,760 339,765 366,214 393,594 5,499 5,249 5,201 5,290 5,476 5,225 1.7Moreton Bay (R) 332,862 387,920 417,210 442,923 464,745 483,553 11,012 5,858 5,143 4,364 3,762 5,500 1.3Redland (C) 131,210 145,192 153,611 160,907 167,029 171,761 2,796 1,684 1,459 1,224 946 1,572 1.0
Scenic Rim (R) 34,750 38,719 42,662 49,140 56,538 64,629 794 789 1,296 1,480 1,618 1,042 2.4Somerset (R) 19,676 22,272 24,449 27,062 30,020 32,998 519 435 523 592 596 479 2.0Sunshine Coast (R) 295,084 336,404 367,345 401,591 434,678 466,187 8,264 6,188 6,849 6,617 6,302 6,519 1.8
WIDE BAY-BURNETT SD 264,081 295,957 316,234 338,320 362,417 388,054 6,375 4,055 4,417 4,819 5,127 4,236 1.3Bundaberg (R) 87,898 98,017 105,340 112,647 120,353 128,588 2,024 1,465 1,461 1,541 1,647 1,463 1.4
Cherbourg (S) 1,225 1,243 1,286 1,350 1,429 1,513 4 9 13 16 17 11 0.8Fraser Coast (R) 89,247 103,979 112,764 123,172 134,942 147,619 2,946 1,757 2,082 2,354 2,535 1,919 1.7Gympie (R) 44,177 49,036 51,901 54,992 58,269 61,636 972 573 618 655 673 596 1.2North Burnett (R) 10,756 10,664 10,768 10,876 10,986 11,098 -18 21 22 22 22 21 0.2South Burnett (R) 30,778 33,017 34,175 35,283 36,439 37,599 448 232 222 231 232 227 0.7
DARLING DOWNS SD 225,807 243,401 258,762 275,440 294,413 314,157 3,519 3,072 3,336 3,795 3,949 3,204 1.2Goondiwindi (R) 10,741 11,337 11,620 11,844 12,058 12,217 119 57 45 43 32 51 0.4Southern Downs (R) 33,589 36,247 38,088 39,856 41,658 43,463 532 368 354 360 361 361 1.0Toowoomba (R) 151,297 163,817 175,503 188,901 204,615 221,184 2,504 2,337 2,680 3,143 3,314 2,508 1.4Western Downs (R)(b) 30,180 32,000 33,551 34,839 36,081 37,292 364 310 258 248 242 284 0.9
SOUTH WEST SD 26,366 26,083 26,230 26,723 27,051 27,398 -57 29 99 66 69 64 0.2Balonne (S) 4,927 4,798 4,791 4,910 5,019 5,123 -26 -1 24 22 21 11 0.2Bulloo (S) 394 349 321 294 286 278 -9 -6 -5 -2 -2 -6 -1.7Maranoa (R)(c) 13,070 13,236 13,621 14,255 14,638 15,045 33 77 127 77 81 102 0.7
Murweh (S) 4,863 4,825 4,728 4,596 4,515 4,429 -8 -19 -26 -16 -17 -23 -0.5Paroo (S) 2,063 1,884 1,805 1,735 1,685 1,634 -36 -16 -14 -10 -10 -15 -0.8
Quilpie (S) 1,049 991 965 933 909 888 -12 -5 -6 -5 -4 -6 -0.6

Produced by the Office of Economic and Statistical Research, Queensland Treasury © The State of Queensland (Queensland Treasury) 2011 Queensland Government population projections to 2031: local government areas 2011 edition
48
STATISTICAL DIVISION (SD) ERPLocal government area (LGA) 2006 2011 2016 2021 2026 2031 2011 2016 2021 2026 2031
Low series Average annual population changeProjected resident population 5 years to 30 June 10 years to 30 June
2021no. no. no. no. no. no. no. no. no. no. no. no. %
FITZROY SD 206,204 228,145 249,908 268,924 288,001 308,440 4,388 4,353 3,803 3,815 4,088 4,078 1.7Banana (S) 15,572 15,698 16,428 16,594 16,822 17,105 25 146 33 46 57 90 0.6Central Highlands (R) 28,256 31,667 35,398 38,837 42,200 45,751 682 746 688 673 710 717 2.1Gladstone (R) 53,941 62,587 70,959 78,004 85,455 93,565 1,729 1,674 1,409 1,490 1,622 1,542 2.2
Rockhampton (R) 107,517 117,231 126,095 134,405 142,384 150,810 1,943 1,773 1,662 1,596 1,685 1,717 1.4Woorabinda (S) 918 962 1,028 1,084 1,141 1,209 9 13 11 11 14 12 1.2
CENTRAL WEST SD 12,535 12,029 12,030 12,101 12,135 12,213 -101 0 14 7 16 7 0.1Barcaldine (R) 3,462 3,382 3,509 3,555 3,568 3,595 -16 25 9 3 5 17 0.5Barcoo (S) 383 333 312 299 286 274 -10 -4 -3 -3 -2 -3 -1.1Blackall-Tambo (R) 2,138 1,997 1,950 1,918 1,884 1,854 -28 -9 -6 -7 -6 -8 -0.4
Boulia (S) 450 424 416 418 425 437 -5 -2 0 1 2 -1 -0.1Diamantina (S) 302 318 315 312 310 311 3 -1 -1 0 0 -1 -0.2Longreach (R) 4,326 4,233 4,243 4,334 4,419 4,516 -19 2 18 17 19 10 0.2Winton (S) 1,474 1,342 1,285 1,266 1,242 1,227 -26 -11 -4 -5 -3 -8 -0.6
MACKAY SD 159,800 179,957 200,672 219,844 236,400 250,417 4,031 4,143 3,834 3,311 2,803 3,989 2.0Isaac (R) 21,113 23,196 27,048 29,335 31,272 33,001 417 770 457 387 346 614 2.4
Mackay (R) 107,332 121,154 134,336 147,383 158,736 168,236 2,764 2,636 2,609 2,271 1,900 2,623 2.0Whitsunday (R) 31,355 35,608 39,289 43,126 46,392 49,180 851 736 767 653 558 752 1.9
NORTHERN SD 209,902 236,063 256,332 274,906 293,805 311,910 5,232 4,054 3,715 3,780 3,621 3,884 1.5Burdekin (S) 18,085 18,630 18,618 18,647 18,651 18,567 109 -2 6 1 -17 2 0.0Charters Towers (R) 12,155 12,956 13,404 13,670 13,855 14,100 160 90 53 37 49 71 0.5Hinchinbrook (S) 12,239 12,364 12,437 12,496 12,554 12,594 25 15 12 12 8 13 0.1
Palm Island (S) 2,145 2,270 2,401 2,528 2,654 2,779 25 26 25 25 25 26 1.1Townsville (C) 165,278 189,843 209,472 227,566 246,091 263,870 4,913 3,926 3,619 3,705 3,556 3,772 1.8
FAR NORTH SD 247,295 277,953 294,898 309,431 322,780 336,037 6,132 3,389 2,907 2,670 2,651 3,148 1.1Aurukun (S) 1,129 1,212 1,244 1,261 1,271 1,280 17 6 3 2 2 5 0.4Cairns (R) 147,538 170,595 183,814 195,195 205,563 215,805 4,611 2,644 2,276 2,074 2,048 2,460 1.4Cassowary Coast (R) 29,642 31,076 31,432 31,914 32,328 32,695 287 71 96 83 73 84 0.3
Cook (S) 3,695 3,997 4,236 4,448 4,667 4,902 60 48 42 44 47 45 1.1Croydon (S) 274 271 274 276 278 279 -1 1 0 0 0 1 0.2Etheridge (S) 900 946 942 945 945 944 9 -1 1 0 0 0 0.0Hope Vale (S) 842 864 861 850 835 819 4 -1 -2 -3 -3 -1 -0.2
Kowanyama (S) 1,101 1,189 1,242 1,283 1,319 1,352 18 11 8 7 7 9 0.8Lockhart River (S) 599 630 649 657 664 669 6 4 2 1 1 3 0.4Mapoon (S) 256 278 284 287 288 289 4 1 1 0 0 1 0.3Napranum (S) 908 998 1,059 1,109 1,154 1,197 18 12 10 9 9 11 1.1
Northern Peninsula Area (R) 2,138 2,279 2,356 2,421 2,475 2,525 28 15 13 11 10 14 0.6Pormpuraaw (S) 644 688 713 730 746 759 9 5 3 3 3 4 0.6Tablelands (R) 43,507 47,362 49,522 51,292 53,056 54,949 771 432 354 353 379 393 0.8

Produced by the Office of Economic and Statistical Research, Queensland Treasury © The State of Queensland (Queensland Treasury) 2011 Queensland Government population projections to 2031: local government areas 2011 edition
49
STATISTICAL DIVISION (SD) ERPLow series Average annual population change
Projected resident population 5 years to 30 June 10 years to 30 JuneLocal government area (LGA) 2006 2011 2016 2021 2026 2031 2011 2016 2021 2026 2031
no. no. no. no. no. no. no. no. no. no. no. no. %2021
Torres (S) 3,496 3,766 3,859 3,933 4,025 4,119 54 19 15 18 19 17 0.4Torres Strait Island (R) 4,713 5,034 5,214 5,371 5,507 5,630 64 36 31 27 25 34 0.7Weipa (T) 3,007 3,625 3,921 4,071 4,172 4,244 124 59 30 20 14 45 1.2Wujal Wujal (S) 348 362 362 359 356 351 3 0 -1 -1 -1 0 -0.1Yarrabah (S) 2,558 2,781 2,914 3,029 3,131 3,228 45 27 23 20 19 25 0.9
0NORTH WEST SD 33,213 34,429 34,985 35,309 35,290 35,331 243 111 65 -4 8 88 0.3
Burke (S) 531 575 557 551 548 544 9 -4 -1 -1 -1 -2 -0.4Carpentaria (S) 2,076 2,096 2,022 1,941 1,864 1,791 4 -15 -16 -15 -15 -16 -0.8Cloncurry (S) 3,366 3,409 3,543 3,428 3,342 3,261 9 27 -23 -17 -16 2 0.1Doomadgee (S) 1,170 1,273 1,274 1,290 1,280 1,271 21 0 3 -2 -2 2 0.1Flinders (S) 1,911 1,803 1,710 1,628 1,565 1,510 -22 -19 -16 -13 -11 -18 -1.0McKinlay (S) 955 904 868 822 785 747 -10 -7 -9 -7 -8 -8 -0.9Mornington (S) 1,121 1,218 1,255 1,315 1,336 1,368 19 7 12 4 6 10 0.8Mount Isa (C) 21,114 22,228 22,873 23,490 23,764 24,067 223 129 123 55 61 126 0.6
Richmond (S) 9
69 924 883 843 807 773 -9 -8 -8 -7 -7 -8 -0.9
ENSLAND 4,090,908 4,586,054 4,942,485 5,293,118 5,633,411 5,957,410 99,029 71,286 70,127 68,059 64,800 70,706 1.4
R gional Planning Project Areasouth East Queensland (SEQ)(d) 2,827,564 3,184,500 3,434,393 3,685,356 3,927,498 4,153,793 71,387 49,979 50,192 48,429 45,259 50,086 1.5ide Bay-Burnett (WBB) 264,081 295,956 316,234 338,320 362,418 388,053 6,375 4,056 4,417 4,820 5,127 4,236 1.3aranoa - Balonne (MaB) 17,997 18,034 18,412 19,165 19,657 20,168 7 76 151 98 102 113 0.6outh West (SW) 8,369 8,049 7,819 7,558 7,395 7,229 -64 -46 -52 -33 -33 -49 -0.6entral Queensland (CQ) 206,204 228,145 249,908 268,924 288,002 308,440 4,388 4,353 3,803 3,816 4,088 4,078 1.7entral West (CW) 12,535 12,029 12,030 12,102 12,134 12,214 -101 0 14 6 16 7 0.1ackay Isaac and Whitsunday (MIW) 159,800 179,958 200,673 219,844 236,400 250,417 4,032 4,143 3,834 3,311 2,803 3,989 2.0ar North Queensland (FNQ) 223,593 252,176 268,044 281,789 294,434 307,028 5,717 3,174 2,749 2,529 2,519 2,961 1.1orth West (NW) 28,315 29,268 29,877 30,211 30,263 30,358 191 122 67 10 19 94 0.3ulf Region (GRDP) 7,173 7,568 7,566 7,601 7,570 7,549 79 0 7 -6 -4 3 0.0
QUE
e S WM
S C CM
F NG

STATISTICAL DIVISION (SD) ERPLocal government area (LGA) 2006 2011 2016 2021 2026 2031 2011 2016 2021 2026 2031
no. no. no. no. no. no. no. no. no. no. no. no. %
Projected resident population 5 years to 30 June 10 years to 30 June2021
Low series Average annual population change
Queensland's Regionalisation Strategy Areas(e)South East Queensland 2,705,705 3,052,039 3,292,434 3,532,118 3,761,118 3,973,450 69,267 48,079 47,936 45,800 42,466 48,008 1.5Wide Bay Burnett 264,081 295,956 316,234 338,320 362,418 388,053 6,375 4,056 4,417 4,820 5,127 4,236 1.3Darling Downs South West 252,173 269,484 284,993 302,163 321,464 341,553 3,462 3,102 3,434 3,860 4,018 3,268 1.2Central Queensland 218,739 240,174 261,938 281,026 300,136 320,654 4,287 4,353 3,818 3,822 4,104 4,085 1.6Mackay, Isaac and Whitsunday 159,800 179,958 200,673 219,844 236,400 250,417 4,032 4,143 3,834 3,311 2,803 3,989 2.0North Queensland 238,217 265,331 286,209 305,118 324,068 342,268 5,423 4,176 3,782 3,790 3,640 3,979 1.4Far North Queensland 252,193 283,115 300,006 314,528 327,808 341,010 6,184 3,378 2,904 2,656 2,640 3,141 1.1
These population projections have been prepared using the latest available information. For more information please contact OESR on (07) 3224 5326 or visit our website www.oesr.qld.gov.au/dap.
Disclaimer: While every care has been taken in preparing these population projections, neither the State of Queensland nor Demographics Australia accepts responsibility for decisions or actions taken as a result of the data in this report.
A high degree of accuracy for small cells, including zero, should not be assumed
(C) City (R) Regional Council (S) Shire Council (T) Town
(a) Brisbane, Gold Coast, Sunshine Coast and West Moreton SDs
Source: ABS 3218.0 (for 2006 ERP) and 2011 edition Queensland Government population projections
(e) Proposed administrative areas for Queensland Regionalisation Strategy and Queensland Infrastructure Plan
(b) Previously Dalby (R)
(c) Previously Roma (R)(d) Brisbane, Gold Coast, Sunshine Coast and West Moreton SDs and Toowoomba Statistical District
Produced by the Office of Economic and Statistical Research, Queensland Treasury © The State of Queensland (Queensland Treasury) 2011 Queensland Government population projections to 2031: local government areas 2011 edition
50

Produced by the Office of Economic and Statistical Research, Queensland Treasury © The State of Queensland (Queensland Treasury) 2011 Queensland Government population projections to 2031: local government areas 2011 edition
51
Appendix E. Projected resident population by broad age groups (medium series), local government areas STATIS TICAL DIVISION (SD)
cal government area (LGA) 0-19 20-34 35-49 50-64 65 and over TOTAL(a)Median
Age 0-19 20-34 35-49 50-64 65 and over TOTAL(a)Median
Age
Age group (years) Age group (years)
2006 2031
Lo
BRISBANE SD 504,763 430,382 408,250 311,801 202,631 1,857,830 34.8 715,086 577,046 577,620 488,745 549,583 2,908,087 39.2
GOLD
C
HI OAST SD 114,614 100,940 100,587 85,508 64,784 466,433 37.6 180,097 152,606 161,314 143,256 161,141 798,417 41.3
SUNS NE COAST SD 76,153 48,134 64,302 58,683 47,812 295,084 40.8 118,257 82,482 9 ,495 91,206 116,730 508,177 43.1
WEST ORETON SD 24,681 12,940 19,264 17,772 11,702 86,358 39.7 47,364 29,334 989 32,164 32,304 179,160 40.1
Sou East Queensland(b) 720,211 592,396 592,403 473,764 326,929 2,705,705 36.0 1,060,804 841,468 876,418 755,371 859,758 4,393,841 40.1
isbane (C) 242,967 258,301 216,782 159,789 113,421 991,260 34.7 275,808 283,141 275,376 225,460 212,486 1,272,272 39.4
old Coast (C) 114,614 100,940 100,587 85,508 64,784 466,433 37.6 180,097 152,607 161,315 143,256 161,141 798,417 41.3
swich (C) 44,383 31,056 31,120 22,143 13,773 142,477 33.0 140,611 93,507 88,841 65,771 73,260 461,990 34.5
ckyer Valley (R) 9,627 5,142 7,087 6,214 3,862 31,932 37.7 15,852 10,399 14,817 11,221 11,261 63,551 40.6
gan (C) 82,470 56,416 57,168 44,148 19,818 260,021 32.7 123,106 84,477 85,835 75,738 83,029 452,184 38.1
oreton Bay (R) 97,785 61,828 73,730 60,559 38,960 332,862 36.4 133,213 88,037 94,029 89,831 128,061 533,170 41.9
dland (C) 37,158 22,781 29,450 25,162 16,659 131,210 38.1 42,348 27,885 33,540 31,946 52,748 188,471 45.7
enic Rim (R) 9,663 5,030 7,755 7,189 5,114 34,750 40.5 23,637 14,510 16,141 12,843 13,231 80,364 36.8
merset (R) 5,391 2,768 4,422 4,369 2,726 19,676 41.2 7,876 4,425 7,031 8,100 7,814 35,245 46.8
91,206 116,730 508,177 43.1
WIDE AY-BURNETT SD 70,742 39,002 53,472 55,648 45,217 264,081 41.6 100,673 64,215 77,678 81,050 101,533 425,139 44.3
ndaberg (R) 23,818 13,222 18,012 17,898 14,948 87,898 41.1 32,832 20,587 25,174 26,372 34,384 139,350 44.8
erbourg (S) 610 277 204 101 33 1,225 20.2 792 415 295 182 97 1,781 23.6
aser Coast (R) 22,776 12,852 17,480 19,191 16,949 89,247 43.1 37,949 25,357 31,436 31,025 38,383 164,143 44.0
ympie (R) 12,164 6,294 9,500 9,580 6,638 44,177 41.2 16,619 9,700 12,017 13,658 15,377 67,373 44.4
rth Burnett (R) 2,733 1,662 2,195 2,340 1,826 10,756 41.8 2,441 1,802 1,970 2,416 3,275 11,899 48.3
uth Burnett (R) 8,641 4,695 6,081 6,538 4,823 30,778 40.3 10,040 6,354 6,786 7,397 10,017 40,592 43.8
DARL G DOWNS SD 65,912 42,002 46,321 40,081 31,492 225,807 36.7 86,181 59,133 65,315 60,208 74,452 345,279 41.4
oondiwindi (R) 3,043 2,050 2,323 1,850 1,475 10,741 36.7 2,828 2,451 2,156 2,556 3,149 13,140 43.7
uthern Downs (R) 9,454 5,146 6,685 6,777 5,527 33,589 40.4 10,559 6,470 8,288 8,819 13,271 47,402 47.2
owoomba (R) 44,533 29,516 30,938 25,915 20,395 151,297 35.8 62,976 42,876 46,722 41,602 50,161 244,340 40.3
estern Downs (R)(c) 8,882 5,290 6,375 5,539 4,095 30,180 37.2 9,817 7,336 8,150 7,229 7,870 40,397 40.6
SOUT WEST SD 7,695 5,293 5,957 4,344 3,077 26,366 35.5 7,900 6,600 6,078 5,332 4,906 30,815 37.2
Balonne (S) 1,518 1,035 1,130 757 487 4,927 33.9 1,600 1,231 966 958 906 5,663 35.0
Bulloo (S) 88 105 107 66 28 394 35.8 49 64 67 91 97 368 50.8
Maranoa (R)(d) 3,841 2,661 2,876 2,152 1,540 13,070 35.2 4,647 3,799 3,612 2,789 2,324 17,172 35.5
9
M 37,
th
Br G
Ip
Lo
Lo
M Re
Sc
So
Sunshine Coast (R) 76,153 48,134 64,302 58,683 47,812 295,084 40.8 118,257 82,482 99,495
B
Bu
Ch
Fr G
No
So
IN G
So
To
W
H
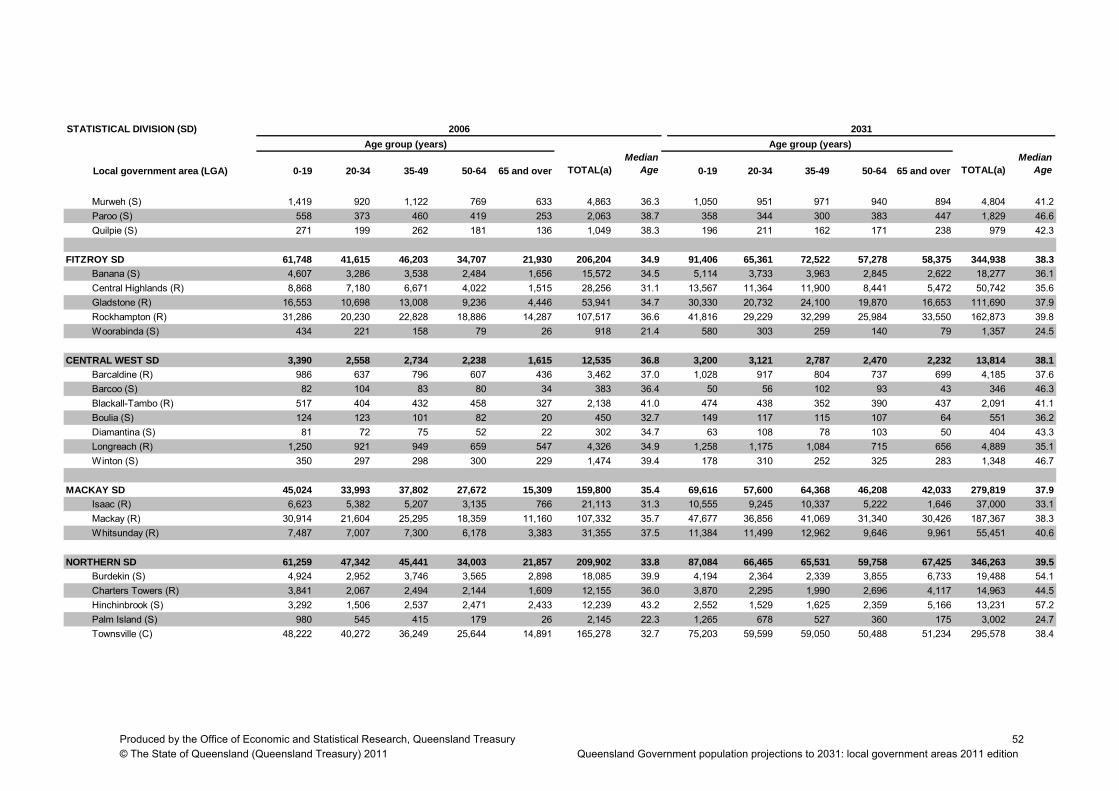
Produced by the Office of Economic and Statistical Research, Queensland Treasury © The State of Queensland (Queensland Treasury) 2011 Queensland Government population projections to 2031: local government areas 2011 edition
52
STATIS TICAL DIVISION (SD)
cal government area (LGA) 0-19 20-34 35-49 50-64 65 and over TOTAL(a)Median
Age 0-19 20-34 35-49 50-64 65 and over TOTAL(a)Median
Age
Age group (years) Age group (years)
2006 2031
Lo
M urweh (S) 1,419 920 1,122 769 633 4,863 36.3 1,050 951 971 940 894 4,804 41.2
roo (S) 558 373 460 419 253 2,063 38.7 358 344 300 383 447 1,829 46.6
ilpie (S) 271 199 262 181 136 1,049 38.3 196 211 162 171 238 979 42.3
FITZR Y SD 61,748 41,615 46,203 34,707 21,930 206,204 34.9 91,406 65,361 72,522 57,278 58,375 344,938 38.3
nana (S) 4,607 3,286 3,538 2,484 1,656 15,572 34.5 5,114 3,733 3,963 2,845 2,622 18,277 36.1
ntral Highlands (R) 8,868 7,180 6,671 4,022 1,515 28,256 31.1 13,567 11,364 11,900 8,441 5,472 50,742 35.6
adstone (R) 16,553 10,698 13,008 9,236 4,446 53,941 34.7 30,330 20,732 24,100 19,870 16,653 111,690 37.9
ckhampton (R) 31,286 20,230 22,828 18,886 14,287 107,517 36.6 41,816 29,229 32,299 25,984 33,550 162,873 39.8
oorabinda (S) 434 221 158 79 26 918 21.4 580 303 259 140 79 1,357 24.5
CENT AL WEST SD 3,390 2,558 2,734 2,238 1,615 12,535 36.8 3,200 3,121 2,787 2,470 2,232 13,814 38.1
rcaldine (R) 986 637 796 607 436 3,462 37.0 1,028 917 804 737 699 4,185 37.6
rcoo (S) 82 104 83 80 34 383 36.4 50 56 102 93 43 346 46.3
ackall-Tambo (R) 517 404 432 458 327 2,138 41.0 474 438 352 390 437 2,091 41.1
ulia (S) 124 123 101 82 20 450 32.7 149 117 115 107 64 551 36.2
amantina (S) 81 72 75 52 22 302 34.7 63 108 78 103 50 404 43.3
ngreach (R) 1,250 921 949 659 547 4,326 34.9 1,258 1,175 1,084 715 656 4,889 35.1
inton (S) 350 297 298 300 229 1,474 39.4 178 310 252 325 283 1,348 46.7
MACK Y SD 45,024 33,993 37,802 27,672 15,309 159,800 35.4 69,616 57,600 64,368 46,208 42,033 279,819 37.9
ac (R) 6,623 5,382 5,207 3,135 766 21,113 31.3 10,555 9,245 10,337 5,222 1,646 37,000 33.1
ackay (R) 30,914 21,604 25,295 18,359 11,160 107,332 35.7 47,677 36,856 41,069 31,340 30,426 187,367 38.3
hitsunday (R) 7,487 7,007 7,300 6,178 3,383 31,355 37.5 11,384 11,499 12,962 9,646 9,961 55,451 40.6
NORT ERN SD 61,259 47,342 45,441 34,003 21,857 209,902 33.8 87,084 66,465 65,531 59,758 67,425 346,263 39.5
rdekin (S) 4,924 2,952 3,746 3,565 2,898 18,085 39.9 4,194 2,364 2,339 3,855 6,733 19,488 54.1
arters Towers (R) 3,841 2,067 2,494 2,144 1,609 12,155 36.0 3,870 2,295 1,990 2,696 4,117 14,963 44.5
nchinbrook (S) 3,292 1,506 2,537 2,471 2,433 12,239 43.2 2,552 1,529 1,625 2,359 5,166 13,231 57.2
lm Island (S) 980 545 415 179 26 2,145 22.3 1,265 678 527 360 175 3,002 24.7
wnsville (C) 48,222 40,272 36,249 25,644 14,891 165,278 32.7 75,203 59,599 59,050 50,488 51,234 295,578 38.4
Pa
Qu
O Ba
Ce
Gl
Ro
W
R
Ba
Ba Bl Bo
Di
Lo
W
A
Isa
M
W
H
Bu
Ch Hi Pa
To

Produced by the Office of Economic and Statistical Research, Queensland Treasury © The State of Queensland (Queensland Treasury) 2011 Queensland Government population projections to 2031: local government areas 2011 edition
53
STATIS TICAL DIVISION (SD)
cal government area (LGA) 0-19 20-34 35-49 50-64 65 and over TOTAL(a)Median
Age 0-19 20-34 35-49 50-64 65 and over TOTAL(a)Median
Age
Age group (years) Age group (years)
2006 2031
Lo
FAR NO
Au RTH SD 71,490 49,616 57,492 43,825 24,872 247,295 35.7 88,000 68,281 73,742 68,233 74,301 372,559 41.1
rukun (S) 458 284 222 124 41 1,129 26.2 611 309 205 203 80 1,407 24.0
irns (R) 41,239 32,565 35,657 25,184 12,893 147,538 35.0 54,925 47,494 51,247 44,838 42,988 241,494 40.4
79 5,549 6,800 10,538 34,841 49.8
674 692 1,321 1,489 5,157 53.2
44 59 57 24 295 32.3
heridge (S) 202 174 214 199 111 900 39.4 183 145 140 317 243 1,026 53.0
pe Vale (S) 320 216 170 92 44 842 27.0 324 210 178 145 84 939 30.3
wanyama (S) 407 267 248 140 39 1,101 28.1 496 335 305 251 137 1,526 31.5
ckhart River (S) 250 145 108 81 15 599 25.0 314 170 130 86 61 761 25.5
apoon (S) 102 55 50 35 14 256 27.6 168 92 62 47 34 404 25.2
pranum (S) 395 227 176 86 24 908 24.0 547 319 245 172 89 1,372 26.1
rthern Peninsula Area (R) 1,029 486 367 190 66 2,138 21.0 1,239 632 559 273 159 2,861 24.1
rmpuraaw (S) 215 163 146 101 19 644 31.1 331 196 118 134 74 855 26.5
blelands (R) 11,841 6,294 9,467 9,377 6,528 43,507 41.2 13,035 8,251 10,561 11,061 16,963 59,873 47.2
rres (S) 1,400 849 655 407 185 3,496 26.3 1,936 922 676 561 263 4,359 23.2
rres Strait Island (R) 2,035 1,159 819 486 214 4,713 23.4 2,488 1,575 1,118 684 443 6,308 26.2
eipa (T) 1,011 756 830 373 37 3,007 31.0 1,407 1,195 1,129 832 378 4,940 33.7
ujal Wujal (S) 138 74 83 46 7 348 27.3 137 93 93 69 45 436 33.1
rrabah (S) 1,227 587 503 176 65 2,558 21.1 1,593 848 676 378 214 3,707 24.3
NORT WEST SD 10,733 8,509 7,176 4,701 2,094 33,213 30.4 10,542 9,426 8,070 7,007 5,335 40,389 35.4
rke (S) 111 149 145 93 33 531 35.5 129 116 165 182 116 707 46.1
rpentaria (S) 603 459 436 390 188 2,076 34.3 332 352 369 480 531 2,065 49.2
oncurry (S) 1,058 908 691 485 224 3,366 29.9 827 722 756 793 744 3,844 43.0
omadgee (S) 553 313 196 79 29 1,170 21.6 679 357 231 188 69 1,526 23.3
nders (S) 576 349 429 358 199 1,911 36.1 332 221 290 474 433 1,752 51.4
cKinlay (S) 220 240 216 181 98 955 36.2 192 127 150 251 184 902 49.1
ornington (S) 409 293 235 123 61 1,121 27.4 608 435 251 260 141 1,694 27.7
ount Isa (C) 6,920 5,566 4,612 2,848 1,168 21,114 29.8 7,210 6,935 5,717 4,181 2,887 26,927 33.5
chmond (S) 283 232 216 144 94 969 33.1 233 158 144 205 231 971 45.6
QUEE SLAND(a) 1,118,204 862,326 895,001 720,983 494,392 4,090,908 36.1 1,605,406 1,241,670 1,312,509 1,142,915 1,290,350 6,592,857 40.2
Ca
Cassowary Coast (R) 8,210 4,622 6,783 5,813 4,214 29,642 40.0 7,177 4,7 Cook (S) 916 622 937 874 346 3,695 40.0 979
roydon (S) 95 71 57 41 10 274 29.5 112
C
Et
Ho
Ko Lo M
Na
No
Po Ta
To
To
W W Ya
H
Bu Ca Cl
Do
Fli
M M
M
Ri N

Produced by the Office of Economic and Statistical Research, Queensland Treasury © The State of Queensland (Queensland Treasury) 2011 Queensland Government population projections to 2031: local government areas 2011 edition
54
STATISTICAL DIVISION (SD)
Local government area (LGA) 0-19 20-34 35-49 50-64 65 and over TOTAL(a)Median
Age 0-19 20-34 35-49 50-64 65 and over TOTAL(a)Median
Age
Age group (years) Age group (years)
2006 2031
Regiona l Planning Project Areas
South East Queensland (SEQ)(e) 756,187 617,575 617,020 493,680 343,102 2,827,566 36.0 1,111,925 877,632 915,146 788,317 900,042 4,593,088 40.0
Wide Bay-Burnett (WBB) 70,742 39,002 53,472 55,648 45,217 264,081 41.6 100,673 64,215 77,678 81,050 101,533 425,139 44.3
Maranoa - Balonne (MaB) 5,359 3,696 4,006 2,909 2,027 17,997 34.8 6,247 5,030 4,578 3,747 3,230 22,835 35.4
South West (SW) 2,336 1,597 1,951 1,435 1,050 8,369 37.0 1,653 1,570 1,500 1,585 1,676 7,980 43.0
Central Queensland (CQ) 61,748 41,615 46,203 34,707 21,930 206,204 34.9 91,406 65,361 72,522 57,278 58,375 344,938 38.3
Central West (CW) 3,390 2,558 2,734 2,238 1,615 12,535 36.8 3,200 3,121 2,787 2,470 2,232 13,814 38.1
Mackay Isaac and Whitsunday (MIW) 45,024 33,993 37,802 27,672 15,309 159,800 35.4 69,616 57,600 64,368 46,208 42,033 279,819 37.9
Far North Queensland (FNQ) 62,655 44,142 52,493 40,596 23,707 223,593 36.4 76,867 61,465 68,126 63,146 70,748 340,351 42.0
North West (NW) 9,057 7,295 6,164 4,016 1,783 28,315 30.5 8,794 8,163 7,057 5,904 4,479 34,396 35.5
Gulf Region (GRDP) 2,380 1,726 1,531 1,065 471 7,173 30.3 2,539 1,784 1,520 1,735 1,261 8,839 36.0
Queensland's Regionalisation Strategy Areas(f)
South East Queensland 720,211 592,396 592,403 473,764 326,929 2,705,705 36.0 1,060,804 841,468 876,418 755,371 859,758 4,393,841 40.1
Wide Bay Burnett 70,742 39,002 53,472 55,648 45,217 264,081 41.6 100,673 64,215 77,678 81,050 101,533 425,139 44.3
Darling Downs South West 73,607 47,295 52,278 44,425 34,569 252,173 36.5 94,081 65,733 71,394 65,538 79,357 376,094 41.0
Central Queensland 65,138 44,173 48,937 36,945 23,545 218,739 35.0 94,607 68,482 75,308 59,750 60,608 358,753 38.2
Mackay, Isaac and Whitsunday 45,024 33,993 37,802 27,672 15,309 159,800 35.4 69,616 57,600 64,368 46,208 42,033 279,819 37.9
North Queensland 70,316 54,637 51,605 38,019 23,640 238,217 33.4 95,878 74,628 72,588 65,662 71,904 380,658 39.1
Far North Queensland 73,166 50,830 58,504 44,510 25,183 252,193 35.5 89,750 69,543 74,758 69,339 75,163 378,553 41.0
These population projections have been prepared using the latest available information. For more information please contact OESR on (07) 3224 5326 or visit our website www.oesr.qld.gov.au/dap.
Disclaimer: While every care has been taken in preparing these population projections, neither the State of Queensland nor Demographics Australia accepts responsibility for decisions or actions taken as a result of the data in this report.
A high degree of accuracy for small cells, including zero, should not be assumed.
(C) City (R) Regional Council (S) Shire Council (T) Town
(b) Brisbane, Gold Coast, Sunshine Coast and West Moreton SDs
(c) Previously Dalby (R)
(d) Previously Roma (R)
(f) Proposed administrative areas for Queensland Regionalisation Strategy and Queensland Infrastructure Plan
Source: ABS 3235.0 various editions (data concorded by OESR) and 2011 edition Queensland Government population projections
(e) Brisbane, Gold Coast, Sunshine Coast and West Moreton SDs and Toowoomba Statistical District
(a) Totals may not equal the sum of components because of rounding and inclusion of unincorporated areas

55
Appendix F. Concordance: regional planning project areas and local government areas
SEQB
South East Queensland Regional Plan CW Central West Regional Planrisbane (C) Barcaldine (R)
Gold Coast (C) Barcoo (S)pswich (C) Blackall Tambo (R)
ckyer Valley (R) Boulia (S)gan (C) Diamantina (S)oreton Bay (R) Longreach (R)edland (C) Winton(S)enic Rim (R)
omerset (R) MIW Mackay Isaac and Whitsunday Regional Planunshine Coast (R) Whitsunday (R)oowoomba Statistical District Isaac (R)
Mackay (R)BB Wide Bay - Burnett Regional Planundaberg (R) FNQ Far North Queensland Regional Planherbourg (S) Cairns (R)raser Coast (R) Cassowary Coast (R)ympie (R) Tablelands (R)orth Burnett (R) Wujal Wujal (S)outh Burnett (R) Yarrabah (S)
aB Maranoa - Balonne Regional Plan NW North West Regional Planlonne (S) Cloncurry (S)
aranoa (R) Flinders (S)McKinlay (S)
South West Regional Plan Mount Isa (C)ulloo (S) Richmond (S)urweh (S)aroo (S) GRDP Gulf Regional Development Planuilpie (S) Burke (S)
Carpentaria (S)Q Central Queensland Regional Plan Croydon (S)anana (S) Doomadgee (S)entral Highlands (R) Etheridge (S)ladstone (R) Kowanyama (S)ockhampton (R) Mornington (S)oorabinda (S)
ity (R) Regional Council (S) Shire
I LoLo M RSc
S S T W BC
F G NS
M
BaM
SWB
M P Q
C B CG R W (C) C

56
Appendix G. Concordance: regionalisation strategy areas(a) and local government areas
South East Queensland Mackay, Isaac and Whitsunday
Brisbane (C) Isaac (R)
Gold Coast (C) Mackay (R)
Ipswich (C) Whitsunday (R)
Lockyer Valley (R)
Logan (C) North Queensland
Moreton Bay (R) Burdekin (S)
Redland (C) Charters Towers (R)
Scenic Rim (R) Cloncurry (S)
Somerset (R) Flinders (S)
Sunshine Coast (R) Hinchinbrook (S)
McKinlay (S)
Wide Bay Burnett Mount Isa (C)
Bundaberg (R) Palm Island (S)
Cherbourg (S) Richmond (S)
Fraser Coast (R) Townsville (C)
Gympie (R)
North Burnett (R) Far North Queensland
South Burnett (R) Aurukun (S)
Burke (S)
Darling Downs South West Cairns (R)
Balonne (S) Carpentaria (S)
Bulloo (S) Cassowary Coast (R)
Goondiwindi (R) Cook (S)
Maranoa (R) Croydon (S)
Murweh (S) Doomadgee (S)
Paroo (S) Etheridge (S)
Quilpie (S) Hope Vale (S)
Southern Downs (R) Kowanyama (S)
Toowoomba (R) Lockhart River (S)
Western Downs (R) Mapoon (S)
Mornington (S)
Central Queensland Napranum (S)
Banana (S) Northern Peninsula Area (R)
Barcaldine (R) Pormpuraaw (S)
Barcoo (S) Tablelands (R)
Blackall Tambo (R) Torres (S)
Boulia (S) Torres Strait Island (R)
Central Highlands (R) Weipa (T)
Diamantina (S) Wujal Wujal (S)
Gladstone (R) Yarrabah (S)
Longreach (R)
Rockhampton (R)
Winton (S)
Woorabinda (S)
(C) City (R) Regional Council (S) Shire (T) Town
(a) Regionalisation Strategy Areas are proposed administrative areas for the Queensland Regionalisation Strategy and Queensland Infrastructure Plan.

McKinlay (S)McKinlay (S)McKinlay (S)McKinlay (S)McKinlay (S)McKinlay (S)McKinlay (S)McKinlay (S)McKinlay (S)
Tablelands (R)Tablelands (R)Tablelands (R)Tablelands (R)Tablelands (R)Tablelands (R)Tablelands (R)Tablelands (R)Tablelands (R)
Hinchinbrook (S)Hinchinbrook (S)Hinchinbrook (S)Hinchinbrook (S)Hinchinbrook (S)Hinchinbrook (S)Hinchinbrook (S)Hinchinbrook (S)Hinchinbrook (S)
Palm Island (S)Palm Island (S)Palm Island (S)Palm Island (S)Palm Island (S)Palm Island (S)Palm Island (S)Palm Island (S)Palm Island (S)
Townsv ille (C)Townsv ille (C)Townsv ille (C)Townsv ille (C)Townsv ille (C)Townsv ille (C)Townsv ille (C)Townsv ille (C)Townsv ille (C)
Cassowary Coast (R)Cassowary Coast (R)Cassowary Coast (R)Cassowary Coast (R)Cassowary Coast (R)Cassowary Coast (R)Cassowary Coast (R)Cassowary Coast (R)Cassowary Coast (R)
Burdekin (S)Burdekin (S)Burdekin (S)Burdekin (S)Burdekin (S)Burdekin (S)Burdekin (S)Burdekin (S)Burdekin (S)
Whitsunday (R)Whitsunday (R)Whitsunday (R)Whitsunday (R)Whitsunday (R)Whitsunday (R)Whitsunday (R)Whitsunday (R)Whitsunday (R)Charters Towers (R)Charters Towers (R)Charters Towers (R)Charters Towers (R)Charters Towers (R)Charters Towers (R)Charters Towers (R)Charters Towers (R)Charters Towers (R)
Mackay (R)Mackay (R)Mackay (R)Mackay (R)Mackay (R)Mackay (R)Mackay (R)Mackay (R)Mackay (R)
Woorabinda (S)Woorabinda (S)Woorabinda (S)Woorabinda (S)Woorabinda (S)Woorabinda (S)Woorabinda (S)Woorabinda (S)Woorabinda (S)
Isaac (R)Isaac (R)Isaac (R)Isaac (R)Isaac (R)Isaac (R)Isaac (R)Isaac (R)Isaac (R)
Barcaldine (R)Barcaldine (R)Barcaldine (R)Barcaldine (R)Barcaldine (R)Barcaldine (R)Barcaldine (R)Barcaldine (R)Barcaldine (R)
Longreach (R)Longreach (R)Longreach (R)Longreach (R)Longreach (R)Longreach (R)Longreach (R)Longreach (R)Longreach (R)
Winton (S)Winton (S)Winton (S)Winton (S)Winton (S)Winton (S)Winton (S)Winton (S)Winton (S)
Flinders (S)Flinders (S)Flinders (S)Flinders (S)Flinders (S)Flinders (S)Flinders (S)Flinders (S)Flinders (S)
Richmond (S)Richmond (S)Richmond (S)Richmond (S)Richmond (S)Richmond (S)Richmond (S)Richmond (S)Richmond (S)
Croy don (S)Croy don (S)Croy don (S)Croy don (S)Croy don (S)Croy don (S)Croy don (S)Croy don (S)Croy don (S)
Etheridge (S)Etheridge (S)Etheridge (S)Etheridge (S)Etheridge (S)Etheridge (S)Etheridge (S)Etheridge (S)Etheridge (S)
Yarrabah (S)Yarrabah (S)Yarrabah (S)Yarrabah (S)Yarrabah (S)Yarrabah (S)Yarrabah (S)Yarrabah (S)Yarrabah (S)Carpentaria (S)Carpentaria (S)Carpentaria (S)Carpentaria (S)Carpentaria (S)Carpentaria (S)Carpentaria (S)Carpentaria (S)Carpentaria (S)
Central Highlands (R)Central Highlands (R)Central Highlands (R)Central Highlands (R)Central Highlands (R)Central Highlands (R)Central Highlands (R)Central Highlands (R)Central Highlands (R)
Blackall Tambo (R)Blackall Tambo (R)Blackall Tambo (R)Blackall Tambo (R)Blackall Tambo (R)Blackall Tambo (R)Blackall Tambo (R)Blackall Tambo (R)Blackall Tambo (R)
Maranoa (R)Maranoa (R)Maranoa (R)Maranoa (R)Maranoa (R)Maranoa (R)Maranoa (R)Maranoa (R)Maranoa (R)
Murweh (S)Murweh (S)Murweh (S)Murweh (S)Murweh (S)Murweh (S)Murweh (S)Murweh (S)Murweh (S)Quilpie (S)Quilpie (S)Quilpie (S)Quilpie (S)Quilpie (S)Quilpie (S)Quilpie (S)Quilpie (S)Quilpie (S)
Barcoo (S)Barcoo (S)Barcoo (S)Barcoo (S)Barcoo (S)Barcoo (S)Barcoo (S)Barcoo (S)Barcoo (S)
Diamantina (S)Diamantina (S)Diamantina (S)Diamantina (S)Diamantina (S)Diamantina (S)Diamantina (S)Diamantina (S)Diamantina (S)
Cloncurry (S)Cloncurry (S)Cloncurry (S)Cloncurry (S)Cloncurry (S)Cloncurry (S)Cloncurry (S)Cloncurry (S)Cloncurry (S)
Cairns (R)Cairns (R)Cairns (R)Cairns (R)Cairns (R)Cairns (R)Cairns (R)Cairns (R)Cairns (R)
Rockhampton (R)Rockhampton (R)Rockhampton (R)Rockhampton (R)Rockhampton (R)Rockhampton (R)Rockhampton (R)Rockhampton (R)Rockhampton (R)
Wujal Wujal (S)Wujal Wujal (S)Wujal Wujal (S)Wujal Wujal (S)Wujal Wujal (S)Wujal Wujal (S)Wujal Wujal (S)Wujal Wujal (S)Wujal Wujal (S)
Hope Vale (S)Hope Vale (S)Hope Vale (S)Hope Vale (S)Hope Vale (S)Hope Vale (S)Hope Vale (S)Hope Vale (S)Hope Vale (S)Cook (S)Cook (S)Cook (S)Cook (S)Cook (S)Cook (S)Cook (S)Cook (S)Cook (S)
Kowany ama (S)Kowany ama (S)Kowany ama (S)Kowany ama (S)Kowany ama (S)Kowany ama (S)Kowany ama (S)Kowany ama (S)Kowany ama (S)
Pormpuraaw (S)Pormpuraaw (S)Pormpuraaw (S)Pormpuraaw (S)Pormpuraaw (S)Pormpuraaw (S)Pormpuraaw (S)Pormpuraaw (S)Pormpuraaw (S)
Western Downs (R)Western Downs (R)Western Downs (R)Western Downs (R)Western Downs (R)Western Downs (R)Western Downs (R)Western Downs (R)Western Downs (R)
Goondiwindi (R)Goondiwindi (R)Goondiwindi (R)Goondiwindi (R)Goondiwindi (R)Goondiwindi (R)Goondiwindi (R)Goondiwindi (R)Goondiwindi (R)
North North North North North North North North North
Burnett (R)Burnett (R)Burnett (R)Burnett (R)Burnett (R)Burnett (R)Burnett (R)Burnett (R)Burnett (R) Fraser Coast (R)Fraser Coast (R)Fraser Coast (R)Fraser Coast (R)Fraser Coast (R)Fraser Coast (R)Fraser Coast (R)Fraser Coast (R)Fraser Coast (R)
Bundaberg (R)Bundaberg (R)Bundaberg (R)Bundaberg (R)Bundaberg (R)Bundaberg (R)Bundaberg (R)Bundaberg (R)Bundaberg (R)
Banana (S)Banana (S)Banana (S)Banana (S)Banana (S)Banana (S)Banana (S)Banana (S)Banana (S)
Gladstone (R)Gladstone (R)Gladstone (R)Gladstone (R)Gladstone (R)Gladstone (R)Gladstone (R)Gladstone (R)Gladstone (R)
Balonne (S)Balonne (S)Balonne (S)Balonne (S)Balonne (S)Balonne (S)Balonne (S)Balonne (S)Balonne (S)
Paroo (S)Paroo (S)Paroo (S)Paroo (S)Paroo (S)Paroo (S)Paroo (S)Paroo (S)Paroo (S)Bulloo (S)Bulloo (S)Bulloo (S)Bulloo (S)Bulloo (S)Bulloo (S)Bulloo (S)Bulloo (S)Bulloo (S)
Boulia (S)Boulia (S)Boulia (S)Boulia (S)Boulia (S)Boulia (S)Boulia (S)Boulia (S)Boulia (S)
Mount Isa (C)Mount Isa (C)Mount Isa (C)Mount Isa (C)Mount Isa (C)Mount Isa (C)Mount Isa (C)Mount Isa (C)Mount Isa (C)
Doomomomadgee (S)Do adgee (S)Do adgee (S)Doomadgee (S)Doomadgee (S)Doomadgee (S)Doomadgee (S)Doomadgee (S)Doomadgee (S)
ke (S)ke (S)ke (S)ke (S)ke (S)rke (S)rke (S)rke (S)ke (S)
Aurukun (S)Aurukun (S)Aurukun (S)Aurukun (S)Aurukun (S)Aurukun (S)Aurukun (S)Aurukun (S)Aurukun (S)
Northern Peninsula Area (R)Northern Peninsula Area (R)Northern Peninsula Area (R)Northern Peninsula Area (R)Northern Peninsula Area (R)Northern Peninsula Area (R)Northern Peninsula Area (R)Northern Peninsula Area (R)Northern Peninsula Area (R)
BurBurBurBurBurBuBuBuBur
Mapoon (S)Mapoon (S)Mapoon (S)Mapoon (S)Mapoon (S)Mapoon (S)Mapoon (S)Mapoon (S)Mapoon (S)
Lockhart Riv er (S)Lockhart Riv er (S)Lockhart Riv er (S)Lockhart Riv er (S)Lockhart Riv er (S)Lockhart Riv er (S)Lockhart Riv er (S)Lockhart Riv er (S)Lockhart Riv er (S)Napranum (S)Napranum (S)Napranum (S)Napranum (S)Napranum (S)Napranum (S)Napranum (S)Napranum (S)Napranum (S)
Torres Strait Island (R)Torres Strait Island (R)Torres Strait Island (R)Torres Strait Island (R)Torres Strait Island (R)Torres Strait Island (R)Torres Strait Island (R)Torres Strait Island (R)Torres Strait Island (R)
McKinlay (S)McKinlay (S)McKinlay (S)McKinlay (S)McKinlay (S)McKinlay (S)McKinlay (S)McKinlay (S)McKinlay (S)
Tablelands (R)Tablelands (R)Tablelands (R)Tablelands (R)Tablelands (R)Tablelands (R)Tablelands (R)Tablelands (R)Tablelands (R)
Hinchinbrook (S)Hinchinbrook (S)Hinchinbrook (S)Hinchinbrook (S)Hinchinbrook (S)Hinchinbrook (S)Hinchinbrook (S)Hinchinbrook (S)Hinchinbrook (S)
Palm Island (S)Palm Island (S)Palm Island (S)Palm Island (S)Palm Island (S)Palm Island (S)Palm Island (S)Palm Island (S)Palm Island (S)
Townsv ille (C)Townsv ille (C)Townsv ille (C)Townsv ille (C)Townsv ille (C)Townsv ille (C)Townsv ille (C)Townsv ille (C)Townsv ille (C)
Cassowary Coast (R)Cassowary Coast (R)Cassowary Coast (R)Cassowary Coast (R)Cassowary Coast (R)Cassowary Coast (R)Cassowary Coast (R)Cassowary Coast (R)Cassowary Coast (R)
Burdekin (S)Burdekin (S)Burdekin (S)Burdekin (S)Burdekin (S)Burdekin (S)Burdekin (S)Burdekin (S)Burdekin (S)
Whitsunday (R)Whitsunday (R)Whitsunday (R)Whitsunday (R)Whitsunday (R)Whitsunday (R)Whitsunday (R)Whitsunday (R)Whitsunday (R)Charters Towers (R)Charters Towers (R)Charters Towers (R)Charters Towers (R)Charters Towers (R)Charters Towers (R)Charters Towers (R)Charters Towers (R)Charters Towers (R)
Mackay (R)Mackay (R)Mackay (R)Mackay (R)Mackay (R)Mackay (R)Mackay (R)Mackay (R)Mackay (R)
Woorabinda (S)Woorabinda (S)Woorabinda (S)Woorabinda (S)Woorabinda (S)Woorabinda (S)Woorabinda (S)Woorabinda (S)Woorabinda (S)
Isaac (R)Isaac (R)Isaac (R)Isaac (R)Isaac (R)Isaac (R)Isaac (R)Isaac (R)Isaac (R)
Barcaldine (R)Barcaldine (R)Barcaldine (R)Barcaldine (R)Barcaldine (R)Barcaldine (R)Barcaldine (R)Barcaldine (R)Barcaldine (R)
Longreach (R)Longreach (R)Longreach (R)Longreach (R)Longreach (R)Longreach (R)Longreach (R)Longreach (R)Longreach (R)
Winton (S)Winton (S)Winton (S)Winton (S)Winton (S)Winton (S)Winton (S)Winton (S)Winton (S)
Flinders (S)Flinders (S)Flinders (S)Flinders (S)Flinders (S)Flinders (S)Flinders (S)Flinders (S)Flinders (S)
Richmond (S)Richmond (S)Richmond (S)Richmond (S)Richmond (S)Richmond (S)Richmond (S)Richmond (S)Richmond (S)
Croy don (S)Croy don (S)Croy don (S)Croy don (S)Croy don (S)Croy don (S)Croy don (S)Croy don (S)Croy don (S)
Etheridge (S)Etheridge (S)Etheridge (S)Etheridge (S)Etheridge (S)Etheridge (S)Etheridge (S)Etheridge (S)Etheridge (S)
Yarrabah (S)Yarrabah (S)Yarrabah (S)Yarrabah (S)Yarrabah (S)Yarrabah (S)Yarrabah (S)Yarrabah (S)Yarrabah (S)Carpentaria (S)Carpentaria (S)Carpentaria (S)Carpentaria (S)Carpentaria (S)Carpentaria (S)Carpentaria (S)Carpentaria (S)Carpentaria (S)
Central Highlands (R)Central Highlands (R)Central Highlands (R)Central Highlands (R)Central Highlands (R)Central Highlands (R)Central Highlands (R)Central Highlands (R)Central Highlands (R)
Blackall Tambo (R)Blackall Tambo (R)Blackall Tambo (R)Blackall Tambo (R)Blackall Tambo (R)Blackall Tambo (R)Blackall Tambo (R)Blackall Tambo (R)Blackall Tambo (R)
Maranoa (R)Maranoa (R)Maranoa (R)Maranoa (R)Maranoa (R)Maranoa (R)Maranoa (R)Maranoa (R)Maranoa (R)
Murweh (S)Murweh (S)Murweh (S)Murweh (S)Murweh (S)Murweh (S)Murweh (S)Murweh (S)Murweh (S)Quilpie (S)Quilpie (S)Quilpie (S)Quilpie (S)Quilpie (S)Quilpie (S)Quilpie (S)Quilpie (S)Quilpie (S)
Barcoo (S)Barcoo (S)Barcoo (S)Barcoo (S)Barcoo (S)Barcoo (S)Barcoo (S)Barcoo (S)Barcoo (S)
Diamantina (S)Diamantina (S)Diamantina (S)Diamantina (S)Diamantina (S)Diamantina (S)Diamantina (S)Diamantina (S)Diamantina (S)
Cloncurry (S)Cloncurry (S)Cloncurry (S)Cloncurry (S)Cloncurry (S)Cloncurry (S)Cloncurry (S)Cloncurry (S)Cloncurry (S)
Cairns (R)Cairns (R)Cairns (R)Cairns (R)Cairns (R)Cairns (R)Cairns (R)Cairns (R)Cairns (R)
Rockhampton (R)Rockhampton (R)Rockhampton (R)Rockhampton (R)Rockhampton (R)Rockhampton (R)Rockhampton (R)Rockhampton (R)Rockhampton (R)
Wujal Wujal (S)Wujal Wujal (S)Wujal Wujal (S)Wujal Wujal (S)Wujal Wujal (S)Wujal Wujal (S)Wujal Wujal (S)Wujal Wujal (S)Wujal Wujal (S)
Hope Vale (S)Hope Vale (S)Hope Vale (S)Hope Vale (S)Hope Vale (S)Hope Vale (S)Hope Vale (S)Hope Vale (S)Hope Vale (S)Cook (S)Cook (S)Cook (S)Cook (S)Cook (S)Cook (S)Cook (S)Cook (S)Cook (S)
Kowany ama (S)Kowany ama (S)Kowany ama (S)Kowany ama (S)Kowany ama (S)Kowany ama (S)Kowany ama (S)Kowany ama (S)Kowany ama (S)
Pormpuraaw (S)Pormpuraaw (S)Pormpuraaw (S)Pormpuraaw (S)Pormpuraaw (S)Pormpuraaw (S)Pormpuraaw (S)Pormpuraaw (S)Pormpuraaw (S)
Western Downs (R)Western Downs (R)Western Downs (R)Western Downs (R)Western Downs (R)Western Downs (R)Western Downs (R)Western Downs (R)Western Downs (R)
Goondiwindi (R)Goondiwindi (R)Goondiwindi (R)Goondiwindi (R)Goondiwindi (R)Goondiwindi (R)Goondiwindi (R)Goondiwindi (R)Goondiwindi (R)
North North North North North North North North North
Burnett (R)Burnett (R)Burnett (R)Burnett (R)Burnett (R)Burnett (R)Burnett (R)Burnett (R)Burnett (R) Fraser Coast (R)Fraser Coast (R)Fraser Coast (R)Fraser Coast (R)Fraser Coast (R)Fraser Coast (R)Fraser Coast (R)Fraser Coast (R)Fraser Coast (R)
Bundaberg (R)Bundaberg (R)Bundaberg (R)Bundaberg (R)Bundaberg (R)Bundaberg (R)Bundaberg (R)Bundaberg (R)Bundaberg (R)
Banana (S)Banana (S)Banana (S)Banana (S)Banana (S)Banana (S)Banana (S)Banana (S)Banana (S)
Gladstone (R)Gladstone (R)Gladstone (R)Gladstone (R)Gladstone (R)Gladstone (R)Gladstone (R)Gladstone (R)Gladstone (R)
Balonne (S)Balonne (S)Balonne (S)Balonne (S)Balonne (S)Balonne (S)Balonne (S)Balonne (S)Balonne (S)
Paroo (S)Paroo (S)Paroo (S)Paroo (S)Paroo (S)Paroo (S)Paroo (S)Paroo (S)Paroo (S)Bulloo (S)Bulloo (S)Bulloo (S)Bulloo (S)Bulloo (S)Bulloo (S)Bulloo (S)Bulloo (S)Bulloo (S)
Boulia (S)Boulia (S)Boulia (S)Boulia (S)Boulia (S)Boulia (S)Boulia (S)Boulia (S)Boulia (S)
Mount Isa (C)Mount Isa (C)Mount Isa (C)Mount Isa (C)Mount Isa (C)M Isa (C)M Isa (C)M Isa (C)Mount Isa (C)
Do adgee (S)Do adgee (S)Do adgee (S)Doomadgee (S)Doomadgee (S)Doomadgee (S)Doomadgee (S)Doomadgee (S)Doomadgee (S)
ke (S)ke (S)ke (S)ke (S)ke (S)rke (S)rke (S)rke (S)ke (S)
Aurukun (S)Aurukun (S)Aurukun (S)Aurukun (S)Aurukun (S)Aurukun (S)Aurukun (S)Aurukun (S)Aurukun (S)
Northern Peninsula Area (R)Northern Peninsula Area (R)Northern Peninsula Area (R)Northern Peninsula Area (R)Northern Peninsula Area (R)Northern Peninsula Area (R)Northern Peninsula Area (R)Northern Peninsula Area (R)Northern Peninsula Area (R)
ountountount
omomom
BurBurBurBurBurBuBuBuBur
Mapoon (S)Mapoon (S)Mapoon (S)Mapoon (S)Mapoon (S)Mapoon (S)Mapoon (S)Mapoon (S)Mapoon (S)
Lockhart Riv er (S)Lockhart Riv er (S)Lockhart Riv er (S)Lockhart Riv er (S)Lockhart Riv er (S)Lockhart Riv er (S)Lockhart Riv er (S)Lockhart Riv er (S)Lockhart Riv er (S)Napranum (S)Napranum (S)Napranum (S)Napranum (S)Napranum (S)Napranum (S)Napranum (S)Napranum (S)Napranum (S)
Torres Strait Island (R)Torres Strait Island (R)Torres Strait Island (R)Torres Strait Island (R)Torres Strait Island (R)Torres Strait Island (R)Torres Strait Island (R)Torres Strait Island (R)Torres Strait Island (R)
Mornington (S)Mornington (S)Mornington (S)Mornington (S)Mornington (S)Mornington (S)Mornington (S)Mornington (S)Mornington (S)
Weipa (T)Weipa (T)Weipa (T)Weipa (T)Weipa (T)Weipa (T)Weipa (T)Weipa (T)Weipa (T)
Appendix H. Regional planning project areas map
Gy mpie (R)Gy mpie (R)Gy mpie (R)Gy mpie (R)Gy mpie (R)Gy mpie (R)Gy mpie (R)Gy mpie (R)Gy mpie (R)
Toowoomba (R)Toowoomba (R)Toowoomba (R)Toowoomba (R)Toowoomba (R)Toowoomba (R)Toowoomba (R)Toowoomba (R)Toowoomba (R)
South Burnett (R)South Burnett (R)South Burnett (R)South Burnett (R)South Burnett (R)South Burnett (R)South Burnett (R)South Burnett (R)South Burnett (R)
Cherbourg (S)Cherbourg (S)Cherbourg (S)Cherbourg (S)Cherbourg (S)Cherbourg (S)Cherbourg (S)Cherbourg (S)Cherbourg (S)
Redland (C)Redland (C)Redland (C)Redland (C)Redland (C)Redland (C)Redland (C)Redland (C)Redland (C)
Brisbane (C)Brisbane (C)Brisbane (C)Brisbane (C)Brisbane (C)Brisbane (C)Brisbane (C)Brisbane (C)Brisbane (C)
Locky er Valley (R)Locky er Valley (R)Locky er Valley (R)Locky er Valley (R)Locky er Valley (R)Locky er Valley (R)Locky er Valley (R)Locky er Valley (R)Locky er Valley (R)
Southern Downs (R)Southern Downs (R)Southern Downs (R)Southern Downs (R)Southern Downs (R)Southern Downs (R)Southern Downs (R)Southern Downs (R)Southern Downs (R)
Gold Coast (C)Gold Coast (C)Gold Coast (C)Gold Coast (C)Gold Coast (C)Gold Coast (C)Gold Coast (C)Gold Coast (C)Gold Coast (C)
Moreton Bay (R)Moreton Bay (R)Moreton Bay (R)Moreton Bay (R)Moreton Bay (R)Moreton Bay (R)Moreton Bay (R)Moreton Bay (R)Moreton Bay (R)
Sunshine Coast (R)Sunshine Coast (R)Sunshine Coast (R)Sunshine Coast (R)Sunshine Coast (R)Sunshine Coast (R)Sunshine Coast (R)Sunshine Coast (R)Sunshine Coast (R)
Logan (C)Logan (C)Logan (C)Logan (C)Logan (C)Logan (C)Logan (C)Logan (C)Logan (C)
Scenic Rim (R)Scenic Rim (R)Scenic Rim (R)Scenic Rim (R)Scenic Rim (R)Scenic Rim (R)Scenic Rim (R)Scenic Rim (R)Scenic Rim (R)
Somerset (R)Somerset (R)Somerset (R)Somerset (R)Somerset (R)Somerset (R)Somerset (R)Somerset (R)Somerset (R)
Regional Planning Project Areas
Central Queensland Regional Plan
Central West Regional Plan
Far North Queensland Regional Plan
Gulf Regional Dev elopment Plan
Mackay Isaac and Whitsunday Regional Plan
Maranoa - Balonne Regional Plan
North West Regional Plan
South East Queensland Regional Plan
South West Regional Plan
Wide Bay -Burnett Regional Plan
N/A
0 25
See Inset
Inset
0 100 200
K ometresil
50
Kilometres (C) City (R) Regional Council (S) Shire (T) Town
57

58
Longreach (R)Longreach (R)Longreach (R)Longreach (R)Longreach (R)Longreach (R)Longreach (R)Longreach (R)Longreach (R)
Rockhampton (R)Rockhampton (R)Rockhampton (R)Rockhampton (R)Rockhampton (R)Rockhampton (R)Rockhampton (R)Rockhampton (R)Rockhampton (R)
Woorabinda (S)Woorabinda (S)Woorabinda (S)Woorabinda (S)Woorabinda (S)Woorabinda (S)Woorabinda (S)Woorabinda (S)Woorabinda (S)
Barcaldine (R)Barcaldine (R)Barcaldine (R)Barcaldine (R)Barcaldine (R)Barcaldine (R)Barcaldine (R)Barcaldine (R)Barcaldine (R)
Winton (S)Winton (S)Winton (S)Winton (S)Winton (S)Winton (S)Winton (S)Winton (S)Winton (S)Boulia (S)Boulia (S)Boulia (S)Boulia (S)Boulia (S)Boulia (S)Boulia (S)Boulia (S)Boulia (S)
Diamantina (S)Diamantina (S)Diamantina (S)Diamantina (S)Diamantina (S)Diamantina (S)Diamantina (S)Diamantina (S)Diamantina (S)
Gladstone (R)Gladstone (R)Gladstone (R)Gladstone (R)Gladstone (R)Gladstone (R)Gladstone (R)Gladstone (R)Gladstone (R)CentralCentralCentralCentralCentralCentralCentralCentralCentralHighlands (R)Highlands (R)Highlands (R)Highlands (R)Highlands (R)Highlands (R)Highlands (R)Highlands (R)Highlands (R)
Banana (S)Banana (S)Banana (S)Banana (S)Banana (S)Banana (S)Banana (S)Banana (S)Banana (S)
Blackall Tambo (R)Blackall Tambo (R)Blackall Tambo (R)Blackall Tambo (R)Blackall Tambo (R)Blackall Tambo (R)Blackall Tambo (R)Blackall Tambo (R)Blackall Tambo (R)
Cassow ary Coast (R)Cassow ary Coast (R)Cassow ary Coast (R)Cassow ary Coast (R)Cassow ary Coast (R)Cassow ary Coast (R)Cassow ary Coast (R)Cassow ary Coast (R)Cassow ary Coast (R)
Lockhart River (S)Lockhart River (S)Lockhart River (S)Lockhart River (S)Lockhart River (S)Lockhart River (S)Lockhart River (S)Lockhart River (S)Lockhart River (S)
Yarrabah (S)Yarrabah (S)Yarrabah (S)Yarrabah (S)Yarrabah (S)Yarrabah (S)Yarrabah (S)Yarrabah (S)Yarrabah (S)Tablelands (R)Tablelands (R)Tablelands (R)Tablelands (R)Tablelands (R)Tablelands (R)Tablelands (R)Tablelands (R)Tablelands (R)
Cairns (R)Cairns (R)Cairns (R)Cairns (R)Cairns (R)Cairns (R)Cairns (R)Cairns (R)Cairns (R)
Hope Vale (S)Hope Vale (S)Hope Vale (S)Hope Vale (S)Hope Vale (S)Hope Vale (S)Hope Vale (S)Hope Vale (S)Hope Vale (S)
Wujal Wujal (S)Wujal Wujal (S)Wujal Wujal (S)Wujal Wujal (S)Wujal Wujal (S)Wujal Wujal (S)Wujal Wujal (S)Wujal Wujal (S)Wujal Wujal (S)
Cook (S)Cook (S)Cook (S)Cook (S)Cook (S)Cook (S)Cook (S)Cook (S)Cook (S)
Aurukun (S)Aurukun (S)Aurukun (S)Aurukun (S)Aurukun (S)Aurukun (S)Aurukun (S)Aurukun (S)Aurukun (S)
Napranum (S)Napranum (S)Napranum (S)Napranum (S)Napranum (S)Napranum (S)Napranum (S)Napranum (S)Napranum (S)
Weipa (T)Weipa (T)Weipa (T)Weipa (T)Weipa (T)Weipa (T)Weipa (T)Weipa (T)Weipa (T)
Pormpuraaw (S)Pormpuraaw (S)Pormpuraaw (S)Pormpuraaw (S)Pormpuraaw (S)Pormpuraaw (S)Pormpuraaw (S)Pormpuraaw (S)Pormpuraaw (S)
Mapoon (S)Mapoon (S)Mapoon (S)Mapoon (S)Mapoon (S)Mapoon (S)Mapoon (S)Mapoon (S)Mapoon (S)
Etheridge (S)Etheridge (S)Etheridge (S)Etheridge (S)Etheridge (S)Etheridge (S)Etheridge (S)Etheridge (S)Etheridge (S)
Kow anyama (S)Kow anyama (S)Kow anyama (S)Kow anyama (S)Kow anyama (S)Kow anyama (S)Kow anyama (S)Kow anyama (S)Kow anyama (S)
Mornington (S)Mornington (S)Mornington (S)Mornington (S)Mornington (S)Mornington (S)Mornington (S)Mornington (S)Mornington (S)
Croydon (S)Croydon (S)Croydon (S)Croydon (S)Croydon (S)Croydon (S)Croydon (S)Croydon (S)Croydon (S)
Carpentaria (S)Carpentaria (S)Carpentaria (S)Carpentaria (S)Carpentaria (S)Carpentaria (S)Carpentaria (S)Carpentaria (S)Carpentaria (S)Doooooooooooooooooomadgee (S)D madgee (S)D madgee (S)D madgee (S)D madgee (S)D madgee (S)D madgee (S)D madgee (S)D madgee (S)
urke (S)urke (S)urke (S)urke (S)urke (S)urke (S)urke (S)urke (S)urke (S)BBBBBBBBB
Northern Peninsula Area (R)Northern Peninsula Area (R)Northern Peninsula Area (R)Northern Peninsula Area (R)Northern Peninsula Area (R)Northern Peninsula Area (R)Northern Peninsula Area (R)Northern Peninsula Area (R)Northern Peninsula Area (R)
Torres (S)Torres (S)Torres (S)Torres (S)Torres (S)Torres (S)Torres (S)Torres (S)Torres (S)
Torres Strait Island (R)Torres Strait Island (R)Torres Strait Island (R)Torres Strait Island (R)Torres Strait Island (R)Torres Strait Island (R)Torres Strait Island (R)Torres Strait Island (R)Torres Strait Island (R)
Palm Island (S)Palm Island (S)Palm Island (S)Palm Island (S)Palm Island (S)Palm Island (S)Palm Island (S)Palm Island (S)Palm Island (S)
Hinchinbrook (S)Hinchinbrook (S)Hinchinbrook (S)Hinchinbrook (S)Hinchinbrook (S)Hinchinbrook (S)Hinchinbrook (S)Hinchinbrook (S)Hinchinbrook (S)
Tow nsville (C)Tow nsville (C)Tow nsville (C)Tow nsville (C)Tow nsville (C)Tow nsville (C)Tow nsville (C)Tow nsville (C)Tow nsville (C)Burdekin (S)Burdekin (S)Burdekin (S)Burdekin (S)Burdekin (S)Burdekin (S)Burdekin (S)Burdekin (S)Burdekin (S)
Flinders (S)Flinders (S)Flinders (S)Flinders (S)Flinders (S)Flinders (S)Flinders (S)Flinders (S)Flinders (S)
Charters Tow ers (R)Charters Tow ers (R)Charters Tow ers (R)Charters Tow ers (R)Charters Tow ers (R)Charters Tow ers (R)Charters Tow ers (R)Charters Tow ers (R)Charters Tow ers (R)Richmond (S)Richmond (S)Richmond (S)Richmond (S)Richmond (S)Richmond (S)Richmond (S)Richmond (S)Richmond (S)
McKinlay (S)McKinlay (S)McKinlay (S)McKinlay (S)McKinlay (S)McKinlay (S)McKinlay (S)McKinlay (S)McKinlay (S)M sa (C)M sa (C)M sa (C)M nt Isa (C)M nt Isa (C)M nt Isa (C)M nt Isa (C)M nt Isa (C)M nt Isa (C)
Isaac (R)Isaac (R)Isaac (R)Isaac (R)Isaac (R)Isaac (R)Isaac (R)Isaac (R)Isaac (R)
Whitsunday (R)Whitsunday (R)Whitsunday (R)Whitsunday (R)Whitsunday (R)Whitsunday (R)Whitsunday (R)Whitsunday (R)Whitsunday (R)
Mackay (R)Mackay (R)Mackay (R)Mackay (R)Mackay (R)Mackay (R)Mackay (R)Mackay (R)Mackay (R)
Quilpie (S)Quilpie (S)Quilpie (S)Quilpie (S)Quilpie (S)Quilpie (S)Quilpie (S)Quilpie (S)Quilpie (S)WesternWesternWesternWesternWesternWesternWesternWesternWestern
Dow ns (R)Dow ns (R)Dow ns (R)Dow ns (R)Dow ns (R)Dow ns (R)Dow ns (R)Dow ns (R)Dow ns (R)Maranoa (R)Maranoa (R)Maranoa (R)Maranoa (R)Maranoa (R)Maranoa (R)Maranoa (R)Maranoa (R)Maranoa (R)
Murw eh (S)Murw eh (S)Murw eh (S)Murw eh (S)Murw eh (S)Murw eh (S)Murw eh (S)Murw eh (S)Murw eh (S)
Bulloo (S)Bulloo (S)Bulloo (S)Bulloo (S)Bulloo (S)Bulloo (S)Bulloo (S)Bulloo (S)Bulloo (S)Paroo (S)Paroo (S)Paroo (S)Paroo (S)Paroo (S)Paroo (S)Paroo (S)Paroo (S)Paroo (S) Goondiw indi (R)Goondiw indi (R)Goondiw indi (R)Goondiw indi (R)Goondiw indi (R)Goondiw indi (R)Goondiw indi (R)Goondiw indi (R)Goondiw indi (R)
NorthNorthNorthNorthNorthNorthNorthNorthNorthBurnett (R)Burnett (R)Burnett (R)Burnett (R)Burnett (R)Burnett (R)Burnett (R)Burnett (R)Burnett (R)
Bundaberg (R)Bundaberg (R)Bundaberg (R)Bundaberg (R)Bundaberg (R)Bundaberg (R)Bundaberg (R)Bundaberg (R)Bundaberg (R)
Fraser Coast (R)Fraser Coast (R)Fraser Coast (R)Fraser Coast (R)Fraser Coast (R)Fraser Coast (R)Fraser Coast (R)Fraser Coast (R)Fraser Coast (R)
Longreach (R)Longreach (R)Longreach (R)Longreach (R)Longreach (R)Longreach (R)Longreach (R)Longreach (R)Longreach (R)
Rockhampton (R)Rockhampton (R)Rockhampton (R)Rockhampton (R)Rockhampton (R)Rockhampton (R)Rockhampton (R)Rockhampton (R)Rockhampton (R)
Woorabinda (S)Woorabinda (S)Woorabinda (S)Woorabinda (S)Woorabinda (S)Woorabinda (S)Woorabinda (S)Woorabinda (S)Woorabinda (S)
Barcaldine (R)Barcaldine (R)Barcaldine (R)Barcaldine (R)Barcaldine (R)Barcaldine (R)Barcaldine (R)Barcaldine (R)Barcaldine (R)
Winton (S)Winton (S)Winton (S)Winton (S)Winton (S)Winton (S)Winton (S)Winton (S)Winton (S)Boulia (S)Boulia (S)Boulia (S)Boulia (S)Boulia (S)Boulia (S)Boulia (S)Boulia (S)Boulia (S)
iamantina (S)iamantina (S)iamantina (S)iamantina (S)iamantina (S)iamantina (S)iamantina (S)iamantina (S)iamantina (S)
Gladstone (R)Gladstone (R)Gladstone (R)Gladstone (R)Gladstone (R)Gladstone (R)Gladstone (R)Gladstone (R)Gladstone (R)CentralCentralCentralCentralCentralCentralCentralCentralCentralHighlands (R)Highlands (R)Highlands (R)Highlands (R)Highlands (R)Highlands (R)Highlands (R)Highlands (R)Highlands (R)
Banana (S)Banana (S)Banana (S)Banana (S)Banana (S)Banana (S)Banana (S)Banana (S)Banana (S)
Blackall Tambo (R)Blackall Tambo (R)Blackall Tambo (R)Blackall Tambo (R)Blackall Tambo (R)Blackall Tambo (R)Blackall Tambo (R)Blackall Tambo (R)Blackall Tambo (R)
Barcoo (S)Barcoo (S)Barcoo (S)Barcoo (S)Barcoo (S)Barcoo (S)Barcoo (S)Barcoo (S)Barcoo (S)
Cassow ary Coast (R)Cassow ary Coast (R)Cassow ary Coast (R)Cassow ary Coast (R)Cassow ary Coast (R)Cassow ary Coast (R)Cassow ary Coast (R)Cassow ary Coast (R)Cassow ary Coast (R)
Lockhart River (S)Lockhart River (S)Lockhart River (S)Lockhart River (S)Lockhart River (S)Lockhart River (S)Lockhart River (S)Lockhart River (S)Lockhart River (S)
ount Iount Iount Iouououououou
DDDDDDDDD
Yarrabah (S)Yarrabah (S)Yarrabah (S)Yarrabah (S)Yarrabah (S)Yarrabah (S)Yarrabah (S)Yarrabah (S)Yarrabah (S)Tablelands (R)Tablelands (R)Tablelands (R)Tablelands (R)Tablelands (R)Tablelands (R)Tablelands (R)Tablelands (R)Tablelands (R)
Cairns (R)Cairns (R)Cairns (R)Cairns (R)Cairns (R)Cairns (R)Cairns (R)Cairns (R)Cairns (R)
Hope Vale (S)Hope Vale (S)Hope Vale (S)Hope Vale (S)Hope Vale (S)Hope Vale (S)Hope Vale (S)Hope Vale (S)Hope Vale (S)
Wujal Wujal (S)Wujal Wujal (S)Wujal Wujal (S)Wujal Wujal (S)Wujal Wujal (S)Wujal Wujal (S)Wujal Wujal (S)Wujal Wujal (S)Wujal Wujal (S)
Cook (S)Cook (S)Cook (S)Cook (S)Cook (S)Cook (S)Cook (S)Cook (S)Cook (S)
Aurukun (S)Aurukun (S)Aurukun (S)Aurukun (S)Aurukun (S)Aurukun (S)Aurukun (S)Aurukun (S)Aurukun (S)
Napranum (S)Napranum (S)Napranum (S)Napranum (S)Napranum (S)Napranum (S)Napranum (S)Napranum (S)Napranum (S)
Weipa (T)Weipa (T)Weipa (T)Weipa (T)Weipa (T)Weipa (T)Weipa (T)Weipa (T)Weipa (T)
Pormpuraaw (S)Pormpuraaw (S)Pormpuraaw (S)Pormpuraaw (S)Pormpuraaw (S)Pormpuraaw (S)Pormpuraaw (S)Pormpuraaw (S)Pormpuraaw (S)
Mapoon (S)Mapoon (S)Mapoon (S)Mapoon (S)Mapoon (S)Mapoon (S)Mapoon (S)Mapoon (S)Mapoon (S)
Etheridge (S)Etheridge (S)Etheridge (S)Etheridge (S)Etheridge (S)Etheridge (S)Etheridge (S)Etheridge (S)Etheridge (S)
Kow anyama (S)Kow anyama (S)Kow anyama (S)Kow anyama (S)Kow anyama (S)Kow anyama (S)Kow anyama (S)Kow anyama (S)Kow anyama (S)
Mornington (S)Mornington (S)Mornington (S)Mornington (S)Mornington (S)Mornington (S)Mornington (S)Mornington (S)Mornington (S)
Croydon (S)Croydon (S)Croydon (S)Croydon (S)Croydon (S)Croydon (S)Croydon (S)Croydon (S)Croydon (S)
Carpentaria (S)Carpentaria (S)Carpentaria (S)Carpentaria (S)Carpentaria (S)Carpentaria (S)Carpentaria (S)Carpentaria (S)Carpentaria (S)D madgee (S)D madgee (S)D madgee (S)D madgee (S)D madgee (S)D madgee (S)D madgee (S)D madgee (S)D madgee (S)
urke (S)urke (S)urke (S)urke (S)urke (S)urke (S)urke (S)urke (S)urke (S)
oooooooooooooooooo
BBBBBBBBB
Northern Peninsula Area (R)Northern Peninsula Area (R)Northern Peninsula Area (R)Northern Peninsula Area (R)Northern Peninsula Area (R)Northern Peninsula Area (R)Northern Peninsula Area (R)Northern Peninsula Area (R)Northern Peninsula Area (R)
Torres (S)Torres (S)Torres (S)Torres (S)Torres (S)Torres (S)Torres (S)Torres (S)Torres (S)
Torres Strait Island (R)Torres Strait Island (R)Torres Strait Island (R)Torres Strait Island (R)Torres Strait Island (R)Torres Strait Island (R)Torres Strait Island (R)Torres Strait Island (R)Torres Strait Island (R)
Palm Island (S)Palm Island (S)Palm Island (S)Palm Island (S)Palm Island (S)Palm Island (S)Palm Island (S)Palm Island (S)Palm Island (S)
Hinchinbrook (S)Hinchinbrook (S)Hinchinbrook (S)Hinchinbrook (S)Hinchinbrook (S)Hinchinbrook (S)Hinchinbrook (S)Hinchinbrook (S)Hinchinbrook (S)
Tow nsville (C)Tow nsville (C)Tow nsville (C)Tow nsville (C)Tow nsville (C)Tow nsville (C)Tow nsville (C)Tow nsville (C)Tow nsville (C)Burdekin (S)Burdekin (S)Burdekin (S)Burdekin (S)Burdekin (S)Burdekin (S)Burdekin (S)Burdekin (S)Burdekin (S)
Flinders (S)Flinders (S)Flinders (S)Flinders (S)Flinders (S)Flinders (S)Flinders (S)Flinders (S)Flinders (S)
Charters Tow ers (R)Charters Tow ers (R)Charters Tow ers (R)Charters Tow ers (R)Charters Tow ers (R)Charters Tow ers (R)Charters Tow ers (R)Charters Tow ers (R)Charters Tow ers (R)Richmond (S)Richmond (S)Richmond (S)Richmond (S)Richmond (S)Richmond (S)Richmond (S)Richmond (S)Richmond (S)
McKinlay (S)McKinlay (S)McKinlay (S)McKinlay (S)McKinlay (S)McKinlay (S)McKinlay (S)McKinlay (S)McKinlay (S)M sa (C)M sa (C)M sa (C)M nt Isa (C)M nt Isa (C)M nt Isa (C)M nt Isa (C)M nt Isa (C)M nt Isa (C)
Cloncurry (S)Cloncurry (S)Cloncurry (S)Cloncurry (S)Cloncurry (S)Cloncurry (S)Cloncurry (S)Cloncurry (S)Cloncurry (S)
Isaac (R)Isaac (R)Isaac (R)Isaac (R)Isaac (R)Isaac (R)Isaac (R)Isaac (R)Isaac (R)
Whitsunday (R)Whitsunday (R)Whitsunday (R)Whitsunday (R)Whitsunday (R)Whitsunday (R)Whitsunday (R)Whitsunday (R)Whitsunday (R)
Mackay (R)Mackay (R)Mackay (R)Mackay (R)Mackay (R)Mackay (R)Mackay (R)Mackay (R)Mackay (R)
Quilpie (S)Quilpie (S)Quilpie (S)Quilpie (S)Quilpie (S)Quilpie (S)Quilpie (S)Quilpie (S)Quilpie (S)WesternWesternWesternWesternWesternWesternWesternWesternWestern
Dow ns (R)Dow ns (R)Dow ns (R)Dow ns (R)Dow ns (R)Dow ns (R)Dow ns (R)Dow ns (R)Dow ns (R)Maranoa (R)Maranoa (R)Maranoa (R)Maranoa (R)Maranoa (R)Maranoa (R)Maranoa (R)Maranoa (R)Maranoa (R)
Murw eh (S)Murw eh (S)Murw eh (S)Murw eh (S)Murw eh (S)Murw eh (S)Murw eh (S)Murw eh (S)Murw eh (S)
Bulloo (S)Bulloo (S)Bulloo (S)Bulloo (S)Bulloo (S)Bulloo (S)Bulloo (S)Bulloo (S)Bulloo (S)Paroo (S)Paroo (S)Paroo (S)Paroo (S)Paroo (S)Paroo (S)Paroo (S)Paroo (S)Paroo (S) Goondiw indi (R)Goondiw indi (R)Goondiw indi (R)Goondiw indi (R)Goondiw indi (R)Goondiw indi (R)Goondiw indi (R)Goondiw indi (R)Goondiw indi (R)
Balonne (S)Balonne (S)Balonne (S)Balonne (S)Balonne (S)Balonne (S)Balonne (S)Balonne (S)Balonne (S)
NorthNorthNorthNorthNorthNorthNorthNorthNorthBurnett (R)Burnett (R)Burnett (R)Burnett (R)Burnett (R)Burnett (R)Burnett (R)Burnett (R)Burnett (R)
Bundaberg (R)Bundaberg (R)Bundaberg (R)Bundaberg (R)Bundaberg (R)Bundaberg (R)Bundaberg (R)Bundaberg (R)Bundaberg (R)
Fraser Coast (R)Fraser Coast (R)Fraser Coast (R)Fraser Coast (R)Fraser Coast (R)Fraser Coast (R)Fraser Coast (R)Fraser Coast (R)Fraser Coast (R)
Appendix I. Regionalisation strategy areas(a) map
ount Iount Iount Iouououououou
Somerset (R)Somerset (R)Somerset (R)Somerset (R)Somerset (R)Somerset (R)Somerset (R)Somerset (R)Somerset (R)
Redland (C)Redland (C)Redland (C)Redland (C)Redland (C)Redland (C)Redland (C)Redland (C)Redland (C)Brisbane (C)Brisbane (C)Brisbane (C)Brisbane (C)Brisbane (C)Brisbane (C)Brisbane (C)Brisbane (C)Brisbane (C)
Sunshine Coast (R)Sunshine Coast (R)Sunshine Coast (R)Sunshine Coast (R)Sunshine Coast (R)Sunshine Coast (R)Sunshine Coast (R)Sunshine Coast (R)Sunshine Coast (R)
Moreton Bay (R)Moreton Bay (R)Moreton Bay (R)Moreton Bay (R)Moreton Bay (R)Moreton Bay (R)Moreton Bay (R)Moreton Bay (R)Moreton Bay (R)
Ipsw ich (C)Ipsw ich (C)Ipsw ich (C)Ipsw ich (C)Ipsw ich (C)Ipsw ich (C)Ipsw ich (C)Ipsw ich (C)Ipsw ich (C)
Gold Coast (C)Gold Coast (C)Gold Coast (C)Gold Coast (C)Gold Coast (C)Gold Coast (C)Gold Coast (C)Gold Coast (C)Gold Coast (C)Scenic Rim (R)Scenic Rim (R)Scenic Rim (R)Scenic Rim (R)Scenic Rim (R)Scenic Rim (R)Scenic Rim (R)Scenic Rim (R)Scenic Rim (R)
LockyerLockyerLockyerLockyerLockyerLockyerLockyerLockyerLockyerValley (R)Valley (R)Valley (R)Valley (R)Valley (R)Valley (R)Valley (R)Valley (R)Valley (R)
Cherbourg (S)Cherbourg (S)Cherbourg (S)Cherbourg (S)Cherbourg (S)Cherbourg (S)Cherbourg (S)Cherbourg (S)Cherbourg (S) Gympie (R)Gympie (R)Gympie (R)Gympie (R)Gympie (R)Gympie (R)Gympie (R)Gympie (R)Gympie (R)
South South South South South South South South South Burnett (R)Burnett (R)Burnett (R)Burnett (R)Burnett (R)Burnett (R)Burnett (R)Burnett (R)Burnett (R)
Southern Dow ns (R)Southern Dow ns (R)Southern Dow ns (R)Southern Dow ns (R)Southern Dow ns (R)Southern Dow ns (R)Southern Dow ns (R)Southern Dow ns (R)Southern Dow ns (R)
Toow oomba (R)Toow oomba (R)Toow oomba (R)Toow oomba (R)Toow oomba (R)Toow oomba (R)Toow oomba (R)Toow oomba (R)Toow oomba (R)
Logan (C)Logan (C)Logan (C)Logan (C)Logan (C)Logan (C)Logan (C)Logan (C)Logan (C)
0 25
0 100 200
Kilometres
50
Kilometres
Central Queensland
Wide Bay Burnett
Far North Queensland
South East Queensland
Darling Dow ns South West
Mackay, Isaac and Whitsunday
North Queensland
Regionalisation Strategy Areas
See Inset
Inset (C) City (R) Regional Council (S) Shire (T) Town (a) Proposed administrative areas for the Queensland Regionalisation Strategy and Queensland Infrastructure Plan

Queensland Government Population Projections, 2011 edition Projection results ● Queensland Government population projections to 2056: Queensland and statistical
divisions, 2011 edition ● Queensland Government population projections to 2031: local government areas, 2011
edition Background papers ● Queensland Government population projections: methodology, assumptions and
scenarios for Queensland, 2011 edition ● Queensland Government population projections: methodology for local government
areas, 2011 edition ● Queensland Government population projections: background research, 2011 edition The population projections reports and data tables can be found at the Office of Economic and Statistical Research website: www.oesr.qld.gov.au/population-projections.
59