QUEENS BOULEVARD FOREST HILLS
13
QUEENS BOULEVARD FOREST HILLS This property is offered subject to availability, errors, omissions, or changes in price or terms without notice. ID #285 LOCATION: 111-01 Queens Blvd Forest Hills, NY 11375 SIZE: First Floor 3,252 SF can divide Basement 1,940 SF DESCRIPTION: Corner 73 Avenue 65’ Frontage At Subway Stop Mix use building CO-OP Building ZONING: R7-1 OTHER TENANTS: Medex Diagnostic & Treatment Center, MHN Hair Restoration, Darthmouth Cleaners, B&S Stationary, 2nd Floor Offices and 119 residential condominiums. NEIGHBORHOOD: Densely populated middle to upper middle income neighborhood. 75th Avenue Subway Stop at the corner (E and F lines). Bus Lines Q60 and QM18 stop in front of the building. RENT: To Be Determined TAXES: Approximately $9 per square foot. NOTE: Excellent Queens Blvd location at the 75th Avenue Subway Stop. Great for all Retail, Medical, Office, etc. 2018 1/2 mi radius 1 mi radius 3 mi radius Estimated Population 22,344 84,236 936,474 Estimated Median HH Income $85,070 $81,010 $63,476 For more information and inspection, contact Metro Commercial & Business Brokers, Inc. 425 Linda Drive, East Meadow, NY 11554 www.metrocbb.com John R. Wilmarth Gerry Dantone (516) 640-5440 [email protected] (631) 623-6914 [email protected] 2017 Ridership Annual: 994,127 Avg Weekday: 3,365 Avg Weekend: 2,554
Transcript of QUEENS BOULEVARD FOREST HILLS
QUEENS BOULEVARD FOREST HILLS
This property is offered subject to availability, errors, omissions, or changes in price or terms without notice. ID #285
LOCATION: 111-01 Queens BlvdForest Hills, NY 11375
SIZE: First Floor 3,252 SF can divide Basement 1,940 SF DESCRIPTION:
Corner 73 Avenue65’ FrontageAt Subway StopMix use buildingCO-OP Building
ZONING: R7-1
OTHER TENANTS: Medex Diagnostic & Treatment Center, MHN Hair Restoration, Darthmouth Cleaners, B&S Stationary, 2nd Floor Offices and 119 residential condominiums.
NEIGHBORHOOD: Densely populated middle to upper middle income neighborhood. 75th Avenue Subway Stop at the corner (E and F lines). Bus Lines Q60 and QM18 stop in front of the building.
RENT: To Be Determined
TAXES: Approximately $9 per square foot.
NOTE: Excellent Queens Blvd location at the 75th Avenue Subway Stop. Great for all Retail, Medical, Office, etc.
2018 1/2 mi radius 1 mi radius 3 mi radius
Estimated Population 22,344 84,236 936,474
Estimated Median HH Income $85,070 $81,010 $63,476
For more information and inspection, contact Metro Commercial & Business Brokers, Inc.
425 Linda Drive, East Meadow, NY 11554 www.metrocbb.com
John R. Wilmarth Gerry Dantone (516) 640-5440 [email protected] (631) 623-6914 [email protected]
2017 Ridership Annual: 994,127 Avg Weekday: 3,365 Avg Weekend: 2,554

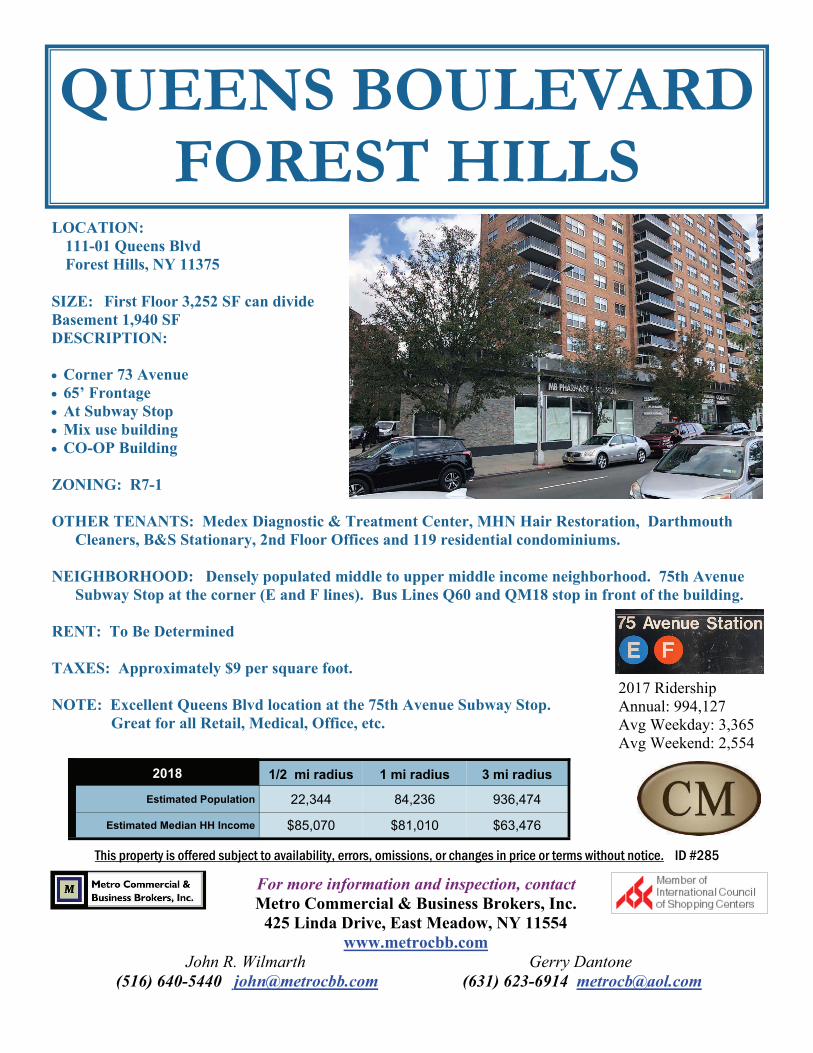
111-01 Queens Boulevard, Forest Hills, NY 11375
Queens Blvd
73rd Ave
75th Ave
112th St
2017 Ridership Annual: 994,127 Avg Weekday: 3,365 Avg Weekend: 2,554
For more information and inspection, contact Metro Commercial & Business Brokers, Inc.
425 Linda Drive, East Meadow, NY 11554 www.metrocbb.com
John R. Wilmarth Gerry Dantone (516) 640-5440 [email protected] (631) 623-6914 [email protected]

For more information and inspection, contact Metro Commercial & Business Brokers, Inc.
425 Linda Drive, East Meadow, NY 11554 www.metrocbb.com
John R. Wilmarth Gerry Dantone (516) 640-5440 [email protected] (631) 623-6914 [email protected]
111-01 Queens Boulevard, Forest Hills, NY 11375
2017 Ridership Annual: 994,127 Avg Weekday: 3,365 Avg Weekend: 2,554
Demographic Source: Applied Geographic Solutions 04/2018, TIGER Geography page 1 of 9©2018, Sites USA, Chandler, Arizona, 480-491-1112
Th
is r
ep
ort
wa
s p
rod
uce
d u
sin
g d
ata
fro
m p
riva
te a
nd
go
vern
me
nt
sou
rce
s d
ee
me
d t
o b
e r
elia
ble
. T
he
info
rma
tio
n h
ere
in is
pro
vid
ed
with
ou
t re
pre
sen
tatio
n o
r w
arr
an
ty.
COMPLETE PROFILE2000-2010 Census, 2018 Estimates with 2023 Projections
Calculated using Weighted Block Centroid from Block Groups
Metro Commercial & Business Brokers, Inc.
Lat/Lon: 40.7193/-73.8383RFULL9
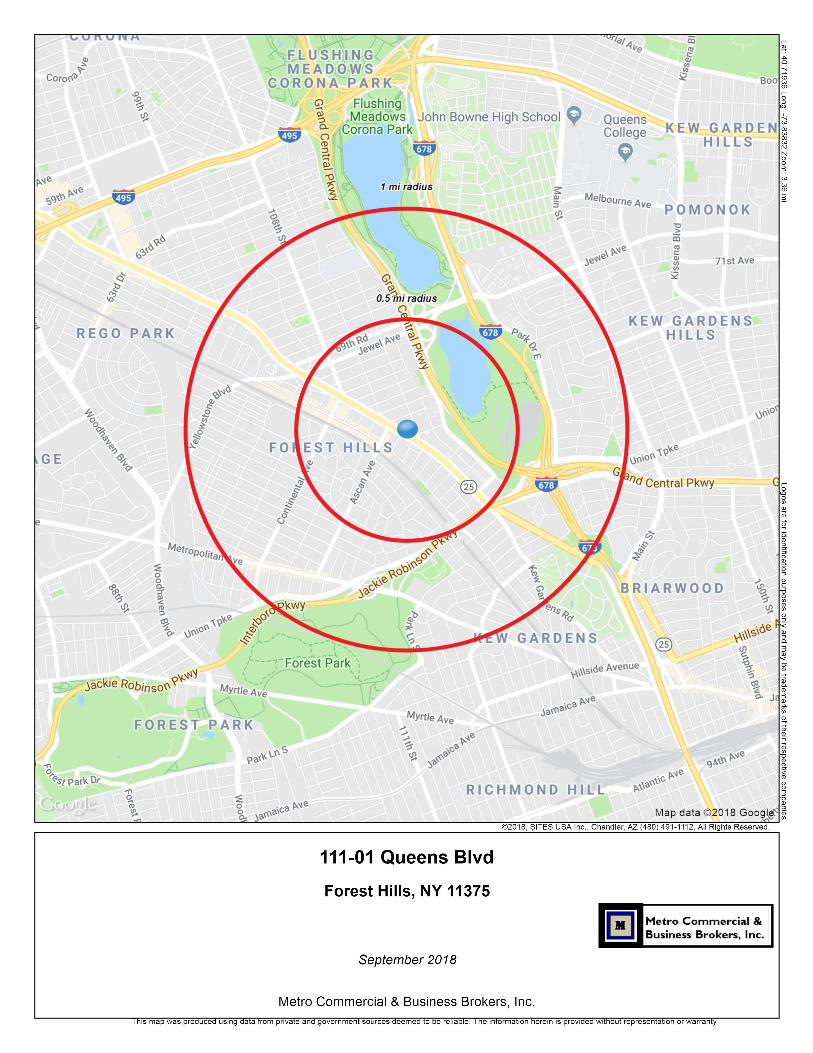
111-01 Queens Blvd0.5 mi radius 1 mi radius 3 mi radius 5 mi radius
Forest Hills, NY 11375
Population
Estimated Population (2018) 22,344 84,236 936,474 2,140,546
Projected Population (2023) 22,443 84,701 946,182 2,161,644
Census Population (2010) 21,109 80,342 884,516 2,029,316
Census Population (2000) 21,121 82,107 863,529 2,004,235
Projected Annual Growth (2018-2023) 99 0.1% 465 0.1% 9,708 0.2% 21,098 0.2%
Historical Annual Growth (2010-2018) 1,235 0.7% 3,894 0.6% 51,958 0.7% 111,230 0.7%
Historical Annual Growth (2000-2010) -11 - -1,765 -0.2% 20,987 0.2% 25,081 0.1%
Estimated Population Density (2018) 28,493 psm 26,826 psm 33,135 psm 27,265 psm
Trade Area Size 0.8 sq mi 3.1 sq mi 28.3 sq mi 78.5 sq mi
Households
Estimated Households (2018) 11,530 39,443 310,988 722,383
Projected Households (2023) 11,886 40,709 322,224 749,809
Census Households (2010) 10,990 37,984 296,729 690,414
Census Households (2000) 11,360 38,393 296,189 685,786
Projected Annual Growth (2018-2023) 356 0.6% 1,266 0.6% 11,236 0.7% 27,426 0.8%
Historical Annual Change (2000-2018) 170 0.1% 1,050 0.2% 14,799 0.3% 36,596 0.3%
Average Household Income
Estimated Average Household Income (2018) $126,989 $109,244 $82,178 $81,239
Projected Average Household Income (2023) $157,524 $133,086 $97,811 $96,487
Census Average Household Income (2010) $98,048 $86,419 $65,691 $63,410
Census Average Household Income (2000) $74,128 $67,049 $52,857 $51,131
Projected Annual Change (2018-2023) $30,536 4.8% $23,842 4.4% $15,633 3.8% $15,248 3.8%
Historical Annual Change (2000-2018) $52,861 4.0% $42,194 3.5% $29,321 3.1% $30,108 3.3%
Median Household Income
Estimated Median Household Income (2018) $85,070 $81,010 $63,476 $62,152
Projected Median Household Income (2023) $98,150 $93,488 $72,582 $71,041
Census Median Household Income (2010) $73,464 $67,593 $53,088 $52,480
Census Median Household Income (2000) $57,551 $53,813 $43,088 $41,504
Projected Annual Change (2018-2023) $13,079 3.1% $12,479 3.1% $9,106 2.9% $8,889 2.9%
Historical Annual Change (2000-2018) $27,519 2.7% $27,197 2.8% $20,388 2.6% $20,648 2.8%
Per Capita Income
Estimated Per Capita Income (2018) $65,595 $51,222 $27,360 $27,492
Projected Per Capita Income (2023) $83,490 $64,033 $33,379 $33,543
Census Per Capita Income (2010) $51,046 $40,857 $22,038 $21,573
Census Per Capita Income (2000) $39,268 $31,130 $18,043 $17,393
Projected Annual Change (2018-2023) $17,895 5.5% $12,811 5.0% $6,019 4.4% $6,051 4.4%
Historical Annual Change (2000-2018) $26,327 3.7% $20,092 3.6% $9,317 2.9% $10,099 3.2%
Estimated Average Household Net Worth (2018) $1,250,320 $1,107,023 $781,647 $754,783

Demographic Source: Applied Geographic Solutions 04/2018, TIGER Geography page 2 of 9©2018, Sites USA, Chandler, Arizona, 480-491-1112
Th
is r
ep
ort
wa
s p
rod
uce
d u
sin
g d
ata
fro
m p
riva
te a
nd
go
vern
me
nt
sou
rce
s d
ee
me
d t
o b
e r
elia
ble
. T
he
info
rma
tio
n h
ere
in is
pro
vid
ed
with
ou
t re
pre
sen
tatio
n o
r w
arr
an
ty.
COMPLETE PROFILE2000-2010 Census, 2018 Estimates with 2023 Projections
Calculated using Weighted Block Centroid from Block Groups
Metro Commercial & Business Brokers, Inc.
Lat/Lon: 40.7193/-73.8383RFULL9
111-01 Queens Blvd0.5 mi radius 1 mi radius 3 mi radius 5 mi radius
Forest Hills, NY 11375
Race and Ethnicity
Total Population (2018) 22,344 84,236 936,474 2,140,546
White (2018) 13,467 60.3% 49,749 59.1% 334,090 35.7% 726,740 34.0%
Black or African American (2018) 1,223 5.5% 5,816 6.9% 114,174 12.2% 453,157 21.2%
American Indian or Alaska Native (2018) 18 0.1% 138 0.2% 6,511 0.7% 13,802 0.6%
Asian (2018) 6,486 29.0% 23,003 27.3% 305,601 32.6% 571,536 26.7%
Hawaiian or Pacific Islander (2018) 3 - 24 - 609 0.1% 1,273 0.1%
Other Race (2018) 506 2.3% 3,024 3.6% 133,087 14.2% 286,709 13.4%
Two or More Races (2018) 642 2.9% 2,481 2.9% 42,402 4.5% 87,330 4.1%
Population < 18 (2018) 3,282 14.7% 14,283 17.0% 195,789 20.9% 455,706 21.3%
White Not Hispanic 1,463 44.6% 6,719 47.0% 35,781 18.3% 74,545 16.4%
Black or African American 146 4.5% 856 6.0% 23,306 11.9% 101,494 22.3%
Asian 1,017 31.0% 3,739 26.2% 57,072 29.1% 107,619 23.6%
Other Race Not Hispanic 166 5.1% 583 4.1% 9,525 4.9% 19,001 4.2%
Hispanic 490 14.9% 2,386 16.7% 70,104 35.8% 153,047 33.6%
Not Hispanic or Latino Population (2018) 19,420 86.9% 70,854 84.1% 637,195 68.0% 1,482,499 69.3%
Not Hispanic White 11,575 59.6% 41,685 58.8% 201,416 31.6% 437,051 29.5%
Not Hispanic Black or African American 1,100 5.7% 4,963 7.0% 96,389 15.1% 404,153 27.3%
Not Hispanic American Indian or Alaska Native 7 - 56 0.1% 2,506 0.4% 5,360 0.4%
Not Hispanic Asian 6,294 32.4% 22,363 31.6% 298,674 46.9% 558,654 37.7%
Not Hispanic Hawaiian or Pacific Islander 3 - 18 - 407 0.1% 794 0.1%
Not Hispanic Other Race 33 0.2% 207 0.3% 15,404 2.4% 32,589 2.2%
Not Hispanic Two or More Races 408 2.1% 1,563 2.2% 22,399 3.5% 43,898 3.0%
Hispanic or Latino Population (2018) 2,924 13.1% 13,382 15.9% 299,279 32.0% 658,047 30.7%
Hispanic White 1,892 64.7% 8,064 60.3% 132,674 44.3% 289,688 44.0%
Hispanic Black or African American 123 4.2% 853 6.4% 17,785 5.9% 49,004 7.4%
Hispanic American Indian or Alaska Native 11 0.4% 82 0.6% 4,005 1.3% 8,442 1.3%
Hispanic Asian 192 6.6% 640 4.8% 6,926 2.3% 12,882 2.0%
Hispanic Hawaiian or Pacific Islander - - 7 0.1% 202 0.1% 479 0.1%
Hispanic Other Race 473 16.2% 2,817 21.1% 117,683 39.3% 254,121 38.6%
Hispanic Two or More Races 233 8.0% 918 6.9% 20,003 6.7% 43,432 6.6%
Not Hispanic or Latino Population (2010) 18,785 89.0% 68,991 85.9% 586,801 66.3% 1,365,417 67.3%
Hispanic or Latino Population (2010) 2,324 11.0% 11,351 14.1% 297,715 33.7% 663,899 32.7%
Not Hispanic or Latino Population (2000) 19,178 90.8% 72,260 88.0% 598,222 69.3% 1,398,862 69.8%
Hispanic or Latino Population (2000) 1,942 9.2% 9,847 12.0% 265,307 30.7% 605,373 30.2%
Not Hispanic or Latino Population (2023) 19,126 85.2% 69,875 82.5% 638,949 67.5% 1,481,888 68.6%
Hispanic or Latino Population (2023) 3,317 14.8% 14,826 17.5% 307,233 32.5% 679,755 31.4%
Projected Annual Growth (2018-2023) 393 2.7% 1,444 2.2% 7,954 0.5% 21,708 0.7%
Historical Annual Growth (2000-2010) 382 2.0% 1,505 1.5% 32,408 1.2% 58,526 1.0%

Demographic Source: Applied Geographic Solutions 04/2018, TIGER Geography page 3 of 9©2018, Sites USA, Chandler, Arizona, 480-491-1112
Th
is r
ep
ort
wa
s p
rod
uce
d u
sin
g d
ata
fro
m p
riva
te a
nd
go
vern
me
nt
sou
rce
s d
ee
me
d t
o b
e r
elia
ble
. T
he
info
rma
tio
n h
ere
in is
pro
vid
ed
with
ou
t re
pre
sen
tatio
n o
r w
arr
an
ty.
COMPLETE PROFILE2000-2010 Census, 2018 Estimates with 2023 Projections
Calculated using Weighted Block Centroid from Block Groups
Metro Commercial & Business Brokers, Inc.
Lat/Lon: 40.7193/-73.8383RFULL9
111-01 Queens Blvd0.5 mi radius 1 mi radius 3 mi radius 5 mi radius
Forest Hills, NY 11375
Total Age Distribution (2018)Total Population 22,344 84,236 936,474 2,140,546
Age Under 5 Years 1,305 5.8% 5,184 6.2% 61,164 6.5% 138,792 6.5%
Age 5 to 9 Years 943 4.2% 3,987 4.7% 55,402 5.9% 128,328 6.0%
Age 10 to 14 Years 695 3.1% 3,383 4.0% 51,133 5.5% 121,059 5.7%
Age 15 to 19 Years 550 2.5% 2,803 3.3% 50,108 5.4% 116,696 5.5%
Age 20 to 24 Years 769 3.4% 3,485 4.1% 59,371 6.3% 136,030 6.4%
Age 25 to 29 Years 1,727 7.7% 6,614 7.9% 76,435 8.2% 176,071 8.2%
Age 30 to 34 Years 2,231 10.0% 7,840 9.3% 74,224 7.9% 168,898 7.9%
Age 35 to 39 Years 2,186 9.8% 7,409 8.8% 70,848 7.6% 160,021 7.5%
Age 40 to 44 Years 1,585 7.1% 5,702 6.8% 63,306 6.8% 143,794 6.7%
Age 45 to 49 Years 1,454 6.5% 5,594 6.6% 64,234 6.9% 146,012 6.8%
Age 50 to 54 Years 1,431 6.4% 5,462 6.5% 61,920 6.6% 141,925 6.6%
Age 55 to 59 Years 1,576 7.1% 5,826 6.9% 61,768 6.6% 139,737 6.5%
Age 60 to 64 Years 1,537 6.9% 5,819 6.9% 55,000 5.9% 124,281 5.8%
Age 65 to 69 Years 1,250 5.6% 4,707 5.6% 43,874 4.7% 99,943 4.7%
Age 70 to 74 Years 994 4.4% 3,512 4.2% 31,538 3.4% 71,794 3.4%
Age 75 to 79 Years 721 3.2% 2,474 2.9% 22,303 2.4% 51,074 2.4%
Age 80 to 84 Years 547 2.4% 1,849 2.2% 15,636 1.7% 35,325 1.7%
Age 85 Years or Over 843 3.8% 2,585 3.1% 18,210 1.9% 40,768 1.9%
Median Age 41.8 40.5 37.2 37.0
Age 19 Years or Less 3,493 15.6% 15,358 18.2% 217,806 23.3% 504,874 23.6%
Age 20 to 64 Years 14,497 64.9% 53,752 63.8% 587,106 62.7% 1,336,768 62.4%
Age 65 Years or Over 4,354 19.5% 15,126 18.0% 131,562 14.0% 298,904 14.0%
Female Age Distribution (2018)Female Population 12,267 54.9% 45,109 53.6% 475,917 50.8% 1,099,241 51.4%
Age Under 5 Years 618 5.0% 2,500 5.5% 29,465 6.2% 67,168 6.1%
Age 5 to 9 Years 464 3.8% 1,914 4.2% 26,670 5.6% 62,015 5.6%
Age 10 to 14 Years 341 2.8% 1,660 3.7% 24,684 5.2% 58,534 5.3%
Age 15 to 19 Years 249 2.0% 1,308 2.9% 23,886 5.0% 56,009 5.1%
Age 20 to 24 Years 453 3.7% 1,883 4.2% 28,397 6.0% 66,095 6.0%
Age 25 to 29 Years 984 8.0% 3,609 8.0% 38,189 8.0% 88,740 8.1%
Age 30 to 34 Years 1,202 9.8% 4,073 9.0% 36,596 7.7% 84,780 7.7%
Age 35 to 39 Years 1,092 8.9% 3,813 8.5% 34,835 7.3% 79,927 7.3%
Age 40 to 44 Years 860 7.0% 2,936 6.5% 31,160 6.5% 72,039 6.6%
Age 45 to 49 Years 780 6.4% 2,959 6.6% 32,339 6.8% 74,353 6.8%
Age 50 to 54 Years 796 6.5% 2,936 6.5% 31,504 6.6% 73,522 6.7%
Age 55 to 59 Years 895 7.3% 3,214 7.1% 32,485 6.8% 73,819 6.7%
Age 60 to 64 Years 855 7.0% 3,232 7.2% 29,382 6.2% 66,731 6.1%
Age 65 to 69 Years 719 5.9% 2,725 6.0% 23,993 5.0% 55,149 5.0%
Age 70 to 74 Years 570 4.6% 1,965 4.4% 17,673 3.7% 40,682 3.7%
Age 75 to 79 Years 422 3.4% 1,451 3.2% 12,967 2.7% 30,032 2.7%
Age 80 to 84 Years 375 3.1% 1,209 2.7% 9,563 2.0% 22,120 2.0%
Age 85 Years or Over 593 4.8% 1,723 3.8% 12,128 2.5% 27,524 2.5%
Female Median Age 43.6 42.2 38.7 38.6
Age 19 Years or Less 1,672 13.6% 7,382 16.4% 104,705 22.0% 243,727 22.2%
Age 20 to 64 Years 7,916 64.5% 28,653 63.5% 294,887 62.0% 680,008 61.9%
Age 65 Years or Over 2,679 21.8% 9,074 20.1% 76,325 16.0% 175,507 16.0%
Demographic Source: Applied Geographic Solutions 04/2018, TIGER Geography page 4 of 9©2018, Sites USA, Chandler, Arizona, 480-491-1112
Th
is r
ep
ort
wa
s p
rod
uce
d u
sin
g d
ata
fro
m p
riva
te a
nd
go
vern
me
nt
sou
rce
s d
ee
me
d t
o b
e r
elia
ble
. T
he
info
rma
tio
n h
ere
in is
pro
vid
ed
with
ou
t re
pre
sen
tatio
n o
r w
arr
an
ty.
COMPLETE PROFILE2000-2010 Census, 2018 Estimates with 2023 Projections
Calculated using Weighted Block Centroid from Block Groups
Metro Commercial & Business Brokers, Inc.
Lat/Lon: 40.7193/-73.8383RFULL9
111-01 Queens Blvd0.5 mi radius 1 mi radius 3 mi radius 5 mi radius
Forest Hills, NY 11375
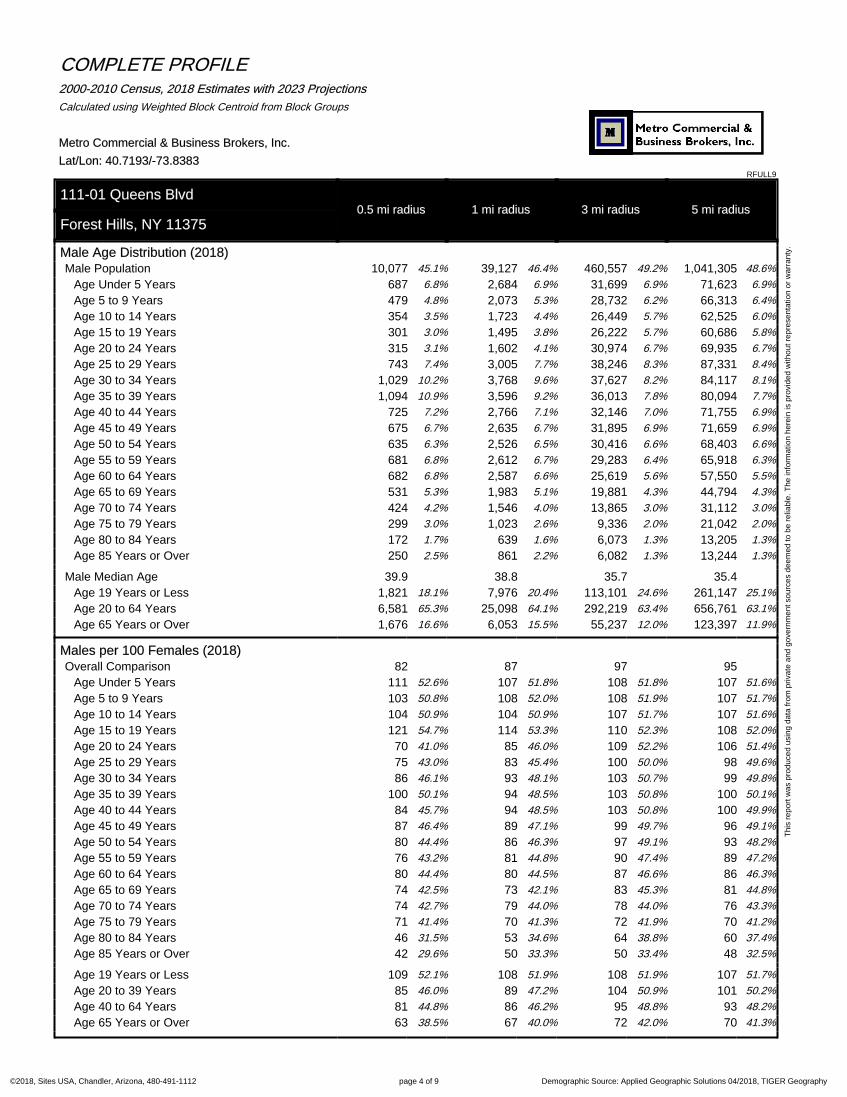
Male Age Distribution (2018)Male Population 10,077 45.1% 39,127 46.4% 460,557 49.2% 1,041,305 48.6%
Age Under 5 Years 687 6.8% 2,684 6.9% 31,699 6.9% 71,623 6.9%
Age 5 to 9 Years 479 4.8% 2,073 5.3% 28,732 6.2% 66,313 6.4%
Age 10 to 14 Years 354 3.5% 1,723 4.4% 26,449 5.7% 62,525 6.0%
Age 15 to 19 Years 301 3.0% 1,495 3.8% 26,222 5.7% 60,686 5.8%
Age 20 to 24 Years 315 3.1% 1,602 4.1% 30,974 6.7% 69,935 6.7%
Age 25 to 29 Years 743 7.4% 3,005 7.7% 38,246 8.3% 87,331 8.4%
Age 30 to 34 Years 1,029 10.2% 3,768 9.6% 37,627 8.2% 84,117 8.1%
Age 35 to 39 Years 1,094 10.9% 3,596 9.2% 36,013 7.8% 80,094 7.7%
Age 40 to 44 Years 725 7.2% 2,766 7.1% 32,146 7.0% 71,755 6.9%
Age 45 to 49 Years 675 6.7% 2,635 6.7% 31,895 6.9% 71,659 6.9%
Age 50 to 54 Years 635 6.3% 2,526 6.5% 30,416 6.6% 68,403 6.6%
Age 55 to 59 Years 681 6.8% 2,612 6.7% 29,283 6.4% 65,918 6.3%
Age 60 to 64 Years 682 6.8% 2,587 6.6% 25,619 5.6% 57,550 5.5%
Age 65 to 69 Years 531 5.3% 1,983 5.1% 19,881 4.3% 44,794 4.3%
Age 70 to 74 Years 424 4.2% 1,546 4.0% 13,865 3.0% 31,112 3.0%
Age 75 to 79 Years 299 3.0% 1,023 2.6% 9,336 2.0% 21,042 2.0%
Age 80 to 84 Years 172 1.7% 639 1.6% 6,073 1.3% 13,205 1.3%
Age 85 Years or Over 250 2.5% 861 2.2% 6,082 1.3% 13,244 1.3%
Male Median Age 39.9 38.8 35.7 35.4
Age 19 Years or Less 1,821 18.1% 7,976 20.4% 113,101 24.6% 261,147 25.1%
Age 20 to 64 Years 6,581 65.3% 25,098 64.1% 292,219 63.4% 656,761 63.1%
Age 65 Years or Over 1,676 16.6% 6,053 15.5% 55,237 12.0% 123,397 11.9%
Males per 100 Females (2018)Overall Comparison 82 87 97 95
Age Under 5 Years 111 52.6% 107 51.8% 108 51.8% 107 51.6%
Age 5 to 9 Years 103 50.8% 108 52.0% 108 51.9% 107 51.7%
Age 10 to 14 Years 104 50.9% 104 50.9% 107 51.7% 107 51.6%
Age 15 to 19 Years 121 54.7% 114 53.3% 110 52.3% 108 52.0%
Age 20 to 24 Years 70 41.0% 85 46.0% 109 52.2% 106 51.4%
Age 25 to 29 Years 75 43.0% 83 45.4% 100 50.0% 98 49.6%
Age 30 to 34 Years 86 46.1% 93 48.1% 103 50.7% 99 49.8%
Age 35 to 39 Years 100 50.1% 94 48.5% 103 50.8% 100 50.1%
Age 40 to 44 Years 84 45.7% 94 48.5% 103 50.8% 100 49.9%
Age 45 to 49 Years 87 46.4% 89 47.1% 99 49.7% 96 49.1%
Age 50 to 54 Years 80 44.4% 86 46.3% 97 49.1% 93 48.2%
Age 55 to 59 Years 76 43.2% 81 44.8% 90 47.4% 89 47.2%
Age 60 to 64 Years 80 44.4% 80 44.5% 87 46.6% 86 46.3%
Age 65 to 69 Years 74 42.5% 73 42.1% 83 45.3% 81 44.8%
Age 70 to 74 Years 74 42.7% 79 44.0% 78 44.0% 76 43.3%
Age 75 to 79 Years 71 41.4% 70 41.3% 72 41.9% 70 41.2%
Age 80 to 84 Years 46 31.5% 53 34.6% 64 38.8% 60 37.4%
Age 85 Years or Over 42 29.6% 50 33.3% 50 33.4% 48 32.5%
Age 19 Years or Less 109 52.1% 108 51.9% 108 51.9% 107 51.7%
Age 20 to 39 Years 85 46.0% 89 47.2% 104 50.9% 101 50.2%
Age 40 to 64 Years 81 44.8% 86 46.2% 95 48.8% 93 48.2%
Age 65 Years or Over 63 38.5% 67 40.0% 72 42.0% 70 41.3%

Demographic Source: Applied Geographic Solutions 04/2018, TIGER Geography page 5 of 9©2018, Sites USA, Chandler, Arizona, 480-491-1112
Th
is r
ep
ort
wa
s p
rod
uce
d u
sin
g d
ata
fro
m p
riva
te a
nd
go
vern
me
nt
sou
rce
s d
ee
me
d t
o b
e r
elia
ble
. T
he
info
rma
tio
n h
ere
in is
pro
vid
ed
with
ou
t re
pre
sen
tatio
n o
r w
arr
an
ty.
COMPLETE PROFILE2000-2010 Census, 2018 Estimates with 2023 Projections
Calculated using Weighted Block Centroid from Block Groups
Metro Commercial & Business Brokers, Inc.
Lat/Lon: 40.7193/-73.8383RFULL9
111-01 Queens Blvd0.5 mi radius 1 mi radius 3 mi radius 5 mi radius
Forest Hills, NY 11375
Household Type (2018)Total Households 11,530 39,443 310,988 722,383
Households with Children 2,001 17.4% 8,225 20.9% 106,448 34.2% 251,922 34.9%
Average Household Size 1.9 2.1 3.0 2.9
Household Density per Square Mile 14,703 12,561 11,003 9,201
Population Family 14,850 66.5% 61,809 73.4% 804,659 85.9% 1,829,182 85.5%
Population Non-Family 7,193 32.2% 21,640 25.7% 122,015 13.0% 289,116 13.5%
Population Group Quarters 301 1.3% 787 0.9% 9,800 1.0% 22,247 1.0%
Family Households 5,350 46.4% 21,055 53.4% 219,211 70.5% 505,266 69.9%
Married Couple Households 4,365 81.6% 16,386 77.8% 147,814 67.4% 317,558 62.8%
Other Family Households 985 18.4% 4,669 22.2% 71,397 32.6% 187,709 37.2%
Family Households with Children 1,992 37.2% 8,190 38.9% 105,632 48.2% 250,123 49.5%
Married Couple with Children 1,615 81.1% 6,415 78.3% 71,476 67.7% 153,511 61.4%
Other Family Households with Children 376 18.9% 1,775 21.7% 34,156 32.3% 96,613 38.6%
Family Households No Children 3,358 62.8% 12,865 61.1% 113,579 51.8% 255,143 50.5%
Married Couple No Children 2,749 81.9% 9,971 77.5% 76,338 67.2% 164,047 64.3%
Other Family Households No Children 609 18.1% 2,894 22.5% 37,241 32.8% 91,096 35.7%
Non-Family Households 6,180 53.6% 18,387 46.6% 91,777 29.5% 217,116 30.1%
Non-Family Households with Children 9 0.1% 35 0.2% 816 0.9% 1,799 0.8%
Non-Family Households No Children 6,171 99.9% 18,352 99.8% 90,961 99.1% 215,317 99.2%
Average Family Household Size 2.8 2.9 3.7 3.6
Average Family Income $175,652 $139,091 $91,756 $89,500
Median Family Income $144,198 $115,143 $74,548 $72,517
Average Non-Family Household Size 1.2 1.2 1.3 1.3
Marital Status (2018)Population Age 15 Years or Over 19,401 71,681 768,775 1,752,368
Never Married 6,162 31.8% 23,906 33.4% 293,243 38.1% 722,946 41.3%
Currently Married 8,750 45.1% 33,474 46.7% 309,002 40.2% 650,999 37.1%
Previously Married 4,489 23.1% 14,301 20.0% 166,530 21.7% 378,422 21.6%
Separated 1,001 22.3% 3,784 26.5% 70,353 42.2% 153,115 40.5%
Widowed 1,671 37.2% 4,848 33.9% 44,505 26.7% 100,405 26.5%
Divorced 1,817 40.5% 5,668 39.6% 51,672 31.0% 124,902 33.0%
Educational Attainment (2018)Adult Population Age 25 Years or Over 18,083 65,393 659,297 1,499,642
Elementary (Grade Level 0 to 8) 453 2.5% 2,518 3.9% 82,919 12.6% 172,907 11.5%
Some High School (Grade Level 9 to 11) 293 1.6% 2,021 3.1% 59,698 9.1% 140,769 9.4%
High School Graduate 2,175 12.0% 10,865 16.6% 183,589 27.8% 437,944 29.2%
Some College 1,759 9.7% 7,752 11.9% 86,331 13.1% 213,120 14.2%
Associate Degree Only 971 5.4% 4,648 7.1% 50,801 7.7% 117,738 7.9%
Bachelor Degree Only 6,096 33.7% 19,448 29.7% 122,683 18.6% 267,851 17.9%
Graduate Degree 6,335 35.0% 18,140 27.7% 73,278 11.1% 149,314 10.0%
Any College (Some College or Higher) 15,162 83.8% 49,989 76.4% 333,092 50.5% 748,022 49.9%
College Degree + (Bachelor Degree or Higher) 12,431 68.7% 37,588 57.5% 195,961 29.7% 417,165 27.8%
Demographic Source: Applied Geographic Solutions 04/2018, TIGER Geography page 6 of 9©2018, Sites USA, Chandler, Arizona, 480-491-1112
Th
is r
ep
ort
wa
s p
rod
uce
d u
sin
g d
ata
fro
m p
riva
te a
nd
go
vern
me
nt
sou
rce
s d
ee
me
d t
o b
e r
elia
ble
. T
he
info
rma
tio
n h
ere
in is
pro
vid
ed
with
ou
t re
pre
sen
tatio
n o
r w
arr
an
ty.
COMPLETE PROFILE2000-2010 Census, 2018 Estimates with 2023 Projections
Calculated using Weighted Block Centroid from Block Groups
Metro Commercial & Business Brokers, Inc.
Lat/Lon: 40.7193/-73.8383RFULL9
111-01 Queens Blvd0.5 mi radius 1 mi radius 3 mi radius 5 mi radius
Forest Hills, NY 11375
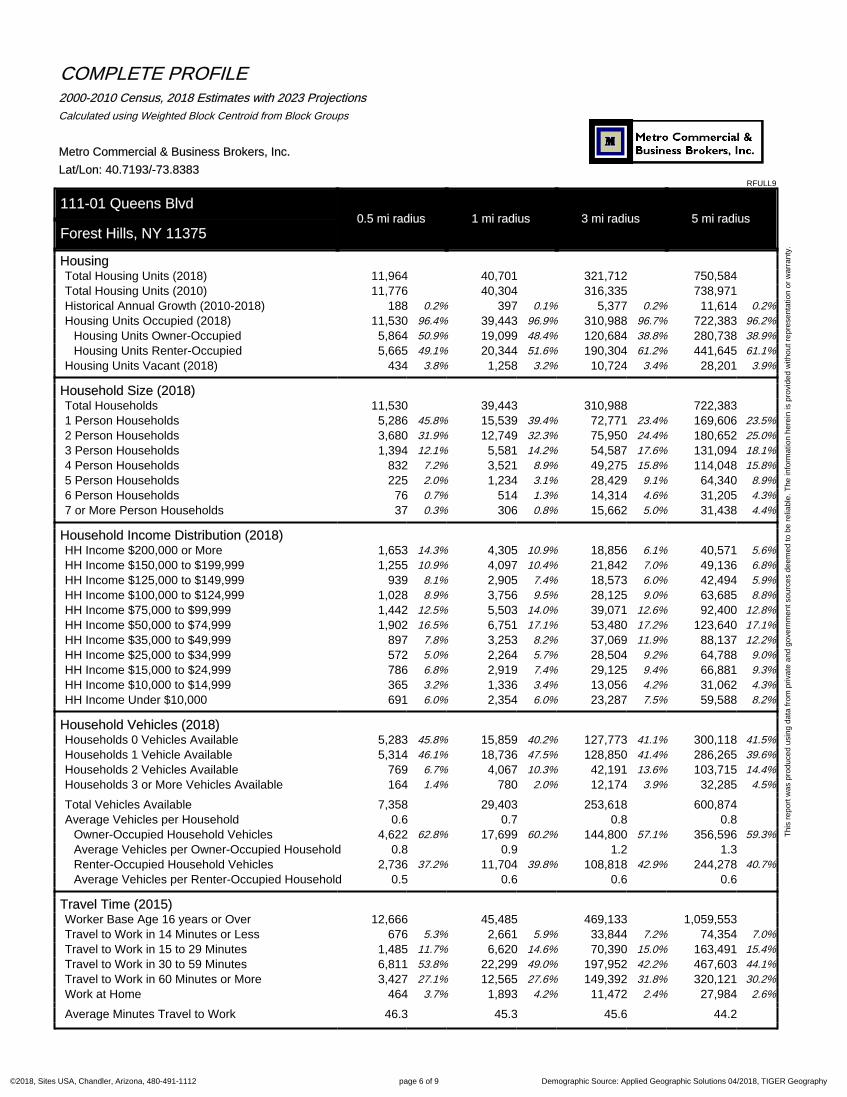
HousingTotal Housing Units (2018) 11,964 40,701 321,712 750,584Total Housing Units (2010) 11,776 40,304 316,335 738,971Historical Annual Growth (2010-2018) 188 0.2% 397 0.1% 5,377 0.2% 11,614 0.2%
Housing Units Occupied (2018) 11,530 96.4% 39,443 96.9% 310,988 96.7% 722,383 96.2%
Housing Units Owner-Occupied 5,864 50.9% 19,099 48.4% 120,684 38.8% 280,738 38.9%
Housing Units Renter-Occupied 5,665 49.1% 20,344 51.6% 190,304 61.2% 441,645 61.1%
Housing Units Vacant (2018) 434 3.8% 1,258 3.2% 10,724 3.4% 28,201 3.9%
Household Size (2018)Total Households 11,530 39,443 310,988 722,3831 Person Households 5,286 45.8% 15,539 39.4% 72,771 23.4% 169,606 23.5%
2 Person Households 3,680 31.9% 12,749 32.3% 75,950 24.4% 180,652 25.0%
3 Person Households 1,394 12.1% 5,581 14.2% 54,587 17.6% 131,094 18.1%
4 Person Households 832 7.2% 3,521 8.9% 49,275 15.8% 114,048 15.8%
5 Person Households 225 2.0% 1,234 3.1% 28,429 9.1% 64,340 8.9%
6 Person Households 76 0.7% 514 1.3% 14,314 4.6% 31,205 4.3%
7 or More Person Households 37 0.3% 306 0.8% 15,662 5.0% 31,438 4.4%
Household Income Distribution (2018)HH Income $200,000 or More 1,653 14.3% 4,305 10.9% 18,856 6.1% 40,571 5.6%
HH Income $150,000 to $199,999 1,255 10.9% 4,097 10.4% 21,842 7.0% 49,136 6.8%
HH Income $125,000 to $149,999 939 8.1% 2,905 7.4% 18,573 6.0% 42,494 5.9%
HH Income $100,000 to $124,999 1,028 8.9% 3,756 9.5% 28,125 9.0% 63,685 8.8%
HH Income $75,000 to $99,999 1,442 12.5% 5,503 14.0% 39,071 12.6% 92,400 12.8%
HH Income $50,000 to $74,999 1,902 16.5% 6,751 17.1% 53,480 17.2% 123,640 17.1%
HH Income $35,000 to $49,999 897 7.8% 3,253 8.2% 37,069 11.9% 88,137 12.2%
HH Income $25,000 to $34,999 572 5.0% 2,264 5.7% 28,504 9.2% 64,788 9.0%
HH Income $15,000 to $24,999 786 6.8% 2,919 7.4% 29,125 9.4% 66,881 9.3%
HH Income $10,000 to $14,999 365 3.2% 1,336 3.4% 13,056 4.2% 31,062 4.3%
HH Income Under $10,000 691 6.0% 2,354 6.0% 23,287 7.5% 59,588 8.2%
Household Vehicles (2018)Households 0 Vehicles Available 5,283 45.8% 15,859 40.2% 127,773 41.1% 300,118 41.5%
Households 1 Vehicle Available 5,314 46.1% 18,736 47.5% 128,850 41.4% 286,265 39.6%
Households 2 Vehicles Available 769 6.7% 4,067 10.3% 42,191 13.6% 103,715 14.4%
Households 3 or More Vehicles Available 164 1.4% 780 2.0% 12,174 3.9% 32,285 4.5%
Total Vehicles Available 7,358 29,403 253,618 600,874Average Vehicles per Household 0.6 0.7 0.8 0.8
Owner-Occupied Household Vehicles 4,622 62.8% 17,699 60.2% 144,800 57.1% 356,596 59.3%
Average Vehicles per Owner-Occupied Household 0.8 0.9 1.2 1.3Renter-Occupied Household Vehicles 2,736 37.2% 11,704 39.8% 108,818 42.9% 244,278 40.7%
Average Vehicles per Renter-Occupied Household 0.5 0.6 0.6 0.6
Travel Time (2015)Worker Base Age 16 years or Over 12,666 45,485 469,133 1,059,553Travel to Work in 14 Minutes or Less 676 5.3% 2,661 5.9% 33,844 7.2% 74,354 7.0%
Travel to Work in 15 to 29 Minutes 1,485 11.7% 6,620 14.6% 70,390 15.0% 163,491 15.4%
Travel to Work in 30 to 59 Minutes 6,811 53.8% 22,299 49.0% 197,952 42.2% 467,603 44.1%
Travel to Work in 60 Minutes or More 3,427 27.1% 12,565 27.6% 149,392 31.8% 320,121 30.2%
Work at Home 464 3.7% 1,893 4.2% 11,472 2.4% 27,984 2.6%
Average Minutes Travel to Work 46.3 45.3 45.6 44.2

Demographic Source: Applied Geographic Solutions 04/2018, TIGER Geography page 7 of 9©2018, Sites USA, Chandler, Arizona, 480-491-1112
Th
is r
ep
ort
wa
s p
rod
uce
d u
sin
g d
ata
fro
m p
riva
te a
nd
go
vern
me
nt
sou
rce
s d
ee
me
d t
o b
e r
elia
ble
. T
he
info
rma
tio
n h
ere
in is
pro
vid
ed
with
ou
t re
pre
sen
tatio
n o
r w
arr
an
ty.
COMPLETE PROFILE2000-2010 Census, 2018 Estimates with 2023 Projections
Calculated using Weighted Block Centroid from Block Groups
Metro Commercial & Business Brokers, Inc.
Lat/Lon: 40.7193/-73.8383RFULL9
111-01 Queens Blvd0.5 mi radius 1 mi radius 3 mi radius 5 mi radius
Forest Hills, NY 11375
Transportation To Work (2015)Worker Base Age 16 years or Over 12,666 45,485 469,133 1,059,553
Drive to Work Alone 2,564 20.2% 11,983 26.3% 133,923 28.5% 310,259 29.3%
Drive to Work in Carpool 505 4.0% 2,135 4.7% 33,136 7.1% 68,595 6.5%
Travel to Work by Public Transportation 8,452 66.7% 26,744 58.8% 253,274 54.0% 575,652 54.3%
Drive to Work on Motorcycle 6 - 32 0.1% 324 0.1% 846 0.1%
Bicycle to Work 14 0.1% 101 0.2% 1,916 0.4% 5,948 0.6%
Walk to Work 642 5.1% 2,400 5.3% 32,724 7.0% 65,650 6.2%
Other Means 19 0.2% 197 0.4% 2,366 0.5% 4,618 0.4%
Work at Home 464 3.7% 1,893 4.2% 11,472 2.4% 27,984 2.6%
Daytime Demographics (2018)Total Businesses 1,484 3,363 23,341 50,847
Total Employees 9,208 22,422 196,828 432,029
Company Headquarter Businesses 2 0.1% 5 0.2% 43 0.2% 92 0.2%
Company Headquarter Employees 75 0.8% 1,391 6.2% 21,143 10.7% 31,935 7.4%
Employee Population per Business 6.2 to 1 6.7 to 1 8.4 to 1 8.5 to 1
Residential Population per Business 15.1 to 1 25.0 to 1 40.1 to 1 42.1 to 1
Adj. Daytime Demographics Age 16 Years or Over 15,573 47,379 493,613 1,109,276
Labor ForceLabor Population Age 16 Years or Over (2018) 19,281 71,110 759,691 1,730,343
Labor Force Total Males (2018) 8,490 44.0% 32,335 45.5% 368,897 48.6% 829,431 47.9%
Male Civilian Employed 6,431 75.7% 23,217 71.8% 253,982 68.8% 564,181 68.0%
Male Civilian Unemployed 79 0.9% 700 2.2% 10,853 2.9% 26,126 3.1%
Males in Armed Forces 6 0.1% 11 - 132 - 332 -
Males Not in Labor Force 1,974 23.3% 8,406 26.0% 103,931 28.2% 238,793 28.8%
Labor Force Total Females (2018) 10,791 56.0% 38,775 54.5% 390,793 51.4% 900,912 52.1%
Female Civilian Employed 6,479 60.0% 22,924 59.1% 208,741 53.4% 488,490 54.2%
Female Civilian Unemployed 227 2.1% 722 1.9% 10,091 2.6% 24,617 2.7%
Females in Armed Forces - - - - 51 - 93 -
Females Not in Labor Force 4,085 37.9% 15,128 39.0% 171,911 44.0% 387,711 43.0%
Unemployment Rate 8,490 1.6% 32,335 2.0% 368,897 2.8% 829,431 2.9%
Labor Force Growth (2010-2018) 9 0.1% 33 0.1% 130 - 167 -
Male Labor Force Growth (2010-2018) 5 0.1% 18 0.1% 72 - 90 -
Female Labor Force Growth (2010-2018) 5 0.1% 15 0.1% 58 - 77 -
Occupation (2015)Occupation Population Age 16 Years or Over 12,901 46,109 462,593 1,052,504
Occupation Total Males 6,426 49.8% 23,199 50.3% 253,910 54.9% 564,091 53.6%
Occupation Total Females 6,475 50.2% 22,910 49.7% 208,683 45.1% 488,413 46.4%
Management, Business, Financial Operations 2,959 22.9% 9,527 20.7% 56,649 12.2% 127,178 12.1%
Professional, Related 4,709 36.5% 15,393 33.4% 87,619 18.9% 204,698 19.4%
Service 1,336 10.4% 6,189 13.4% 119,100 25.7% 269,502 25.6%
Sales, Office 3,002 23.3% 10,349 22.4% 106,330 23.0% 244,265 23.2%
Farming, Fishing, Forestry 9 0.1% 45 0.1% 536 0.1% 1,163 0.1%
Construction, Extraction, Maintenance 441 3.4% 1,876 4.1% 39,689 8.6% 89,079 8.5%
Production, Transport, Material Moving 444 3.4% 2,730 5.9% 52,670 11.4% 116,620 11.1%
White Collar Workers 10,671 82.7% 35,269 76.5% 250,598 54.2% 576,140 54.7%
Blue Collar Workers 2,230 17.3% 10,840 23.5% 211,995 45.8% 476,364 45.3%
Demographic Source: Applied Geographic Solutions 04/2018, TIGER Geography page 8 of 9©2018, Sites USA, Chandler, Arizona, 480-491-1112
Th
is r
ep
ort
wa
s p
rod
uce
d u
sin
g d
ata
fro
m p
riva
te a
nd
go
vern
me
nt
sou
rce
s d
ee
me
d t
o b
e r
elia
ble
. T
he
info
rma
tio
n h
ere
in is
pro
vid
ed
with
ou
t re
pre
sen
tatio
n o
r w
arr
an
ty.
COMPLETE PROFILE2000-2010 Census, 2018 Estimates with 2023 Projections
Calculated using Weighted Block Centroid from Block Groups
Metro Commercial & Business Brokers, Inc.
Lat/Lon: 40.7193/-73.8383RFULL9
111-01 Queens Blvd0.5 mi radius 1 mi radius 3 mi radius 5 mi radius
Forest Hills, NY 11375
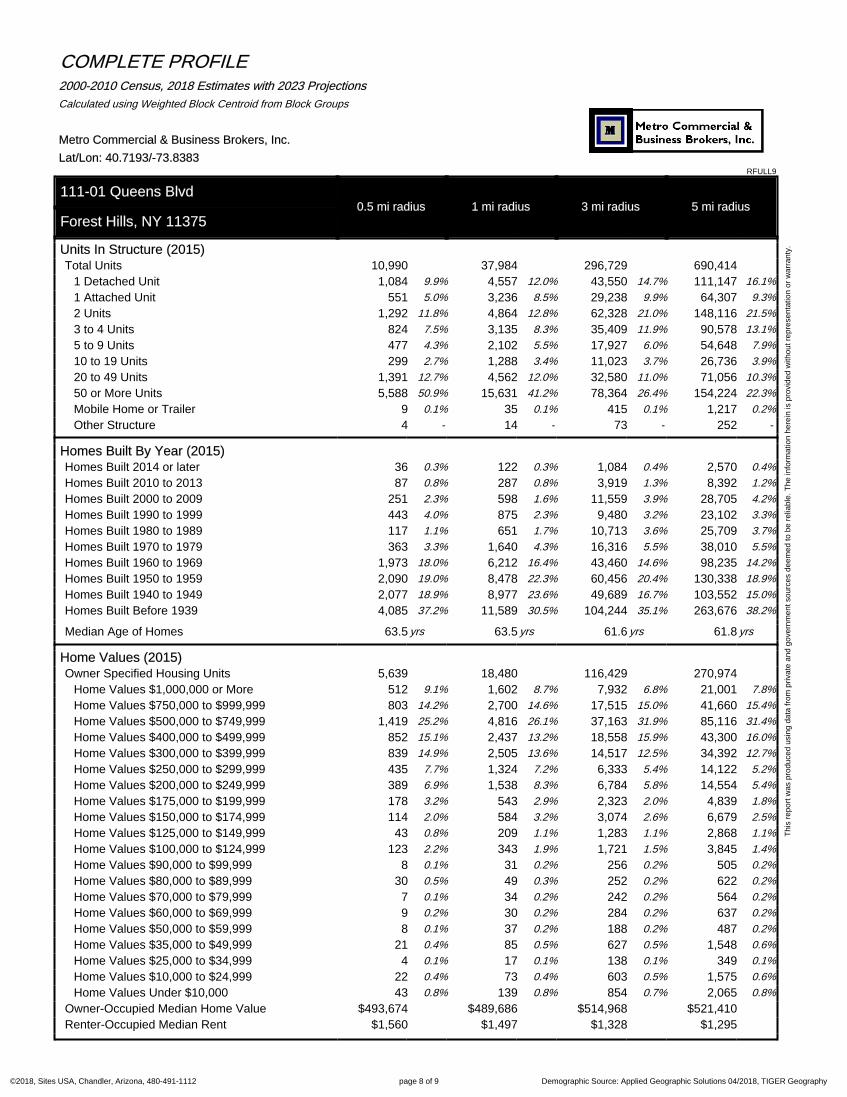
Units In Structure (2015)Total Units 10,990 37,984 296,729 690,414
1 Detached Unit 1,084 9.9% 4,557 12.0% 43,550 14.7% 111,147 16.1%
1 Attached Unit 551 5.0% 3,236 8.5% 29,238 9.9% 64,307 9.3%
2 Units 1,292 11.8% 4,864 12.8% 62,328 21.0% 148,116 21.5%
3 to 4 Units 824 7.5% 3,135 8.3% 35,409 11.9% 90,578 13.1%
5 to 9 Units 477 4.3% 2,102 5.5% 17,927 6.0% 54,648 7.9%
10 to 19 Units 299 2.7% 1,288 3.4% 11,023 3.7% 26,736 3.9%
20 to 49 Units 1,391 12.7% 4,562 12.0% 32,580 11.0% 71,056 10.3%
50 or More Units 5,588 50.9% 15,631 41.2% 78,364 26.4% 154,224 22.3%
Mobile Home or Trailer 9 0.1% 35 0.1% 415 0.1% 1,217 0.2%
Other Structure 4 - 14 - 73 - 252 -
Homes Built By Year (2015)Homes Built 2014 or later 36 0.3% 122 0.3% 1,084 0.4% 2,570 0.4%
Homes Built 2010 to 2013 87 0.8% 287 0.8% 3,919 1.3% 8,392 1.2%
Homes Built 2000 to 2009 251 2.3% 598 1.6% 11,559 3.9% 28,705 4.2%
Homes Built 1990 to 1999 443 4.0% 875 2.3% 9,480 3.2% 23,102 3.3%
Homes Built 1980 to 1989 117 1.1% 651 1.7% 10,713 3.6% 25,709 3.7%
Homes Built 1970 to 1979 363 3.3% 1,640 4.3% 16,316 5.5% 38,010 5.5%
Homes Built 1960 to 1969 1,973 18.0% 6,212 16.4% 43,460 14.6% 98,235 14.2%
Homes Built 1950 to 1959 2,090 19.0% 8,478 22.3% 60,456 20.4% 130,338 18.9%
Homes Built 1940 to 1949 2,077 18.9% 8,977 23.6% 49,689 16.7% 103,552 15.0%
Homes Built Before 1939 4,085 37.2% 11,589 30.5% 104,244 35.1% 263,676 38.2%
Median Age of Homes 63.5 yrs 63.5 yrs 61.6 yrs 61.8 yrs
Home Values (2015)Owner Specified Housing Units 5,639 18,480 116,429 270,974
Home Values $1,000,000 or More 512 9.1% 1,602 8.7% 7,932 6.8% 21,001 7.8%
Home Values $750,000 to $999,999 803 14.2% 2,700 14.6% 17,515 15.0% 41,660 15.4%
Home Values $500,000 to $749,999 1,419 25.2% 4,816 26.1% 37,163 31.9% 85,116 31.4%
Home Values $400,000 to $499,999 852 15.1% 2,437 13.2% 18,558 15.9% 43,300 16.0%
Home Values $300,000 to $399,999 839 14.9% 2,505 13.6% 14,517 12.5% 34,392 12.7%
Home Values $250,000 to $299,999 435 7.7% 1,324 7.2% 6,333 5.4% 14,122 5.2%
Home Values $200,000 to $249,999 389 6.9% 1,538 8.3% 6,784 5.8% 14,554 5.4%
Home Values $175,000 to $199,999 178 3.2% 543 2.9% 2,323 2.0% 4,839 1.8%
Home Values $150,000 to $174,999 114 2.0% 584 3.2% 3,074 2.6% 6,679 2.5%
Home Values $125,000 to $149,999 43 0.8% 209 1.1% 1,283 1.1% 2,868 1.1%
Home Values $100,000 to $124,999 123 2.2% 343 1.9% 1,721 1.5% 3,845 1.4%
Home Values $90,000 to $99,999 8 0.1% 31 0.2% 256 0.2% 505 0.2%
Home Values $80,000 to $89,999 30 0.5% 49 0.3% 252 0.2% 622 0.2%
Home Values $70,000 to $79,999 7 0.1% 34 0.2% 242 0.2% 564 0.2%
Home Values $60,000 to $69,999 9 0.2% 30 0.2% 284 0.2% 637 0.2%
Home Values $50,000 to $59,999 8 0.1% 37 0.2% 188 0.2% 487 0.2%
Home Values $35,000 to $49,999 21 0.4% 85 0.5% 627 0.5% 1,548 0.6%
Home Values $25,000 to $34,999 4 0.1% 17 0.1% 138 0.1% 349 0.1%
Home Values $10,000 to $24,999 22 0.4% 73 0.4% 603 0.5% 1,575 0.6%
Home Values Under $10,000 43 0.8% 139 0.8% 854 0.7% 2,065 0.8%
Owner-Occupied Median Home Value $493,674 $489,686 $514,968 $521,410
Renter-Occupied Median Rent $1,560 $1,497 $1,328 $1,295

Demographic Source: Applied Geographic Solutions 04/2018, TIGER Geography page 9 of 9©2018, Sites USA, Chandler, Arizona, 480-491-1112
Th
is r
ep
ort
wa
s p
rod
uce
d u
sin
g d
ata
fro
m p
riva
te a
nd
go
vern
me
nt
sou
rce
s d
ee
me
d t
o b
e r
elia
ble
. T
he
info
rma
tio
n h
ere
in is
pro
vid
ed
with
ou
t re
pre
sen
tatio
n o
r w
arr
an
ty.
COMPLETE PROFILE2000-2010 Census, 2018 Estimates with 2023 Projections
Calculated using Weighted Block Centroid from Block Groups
Metro Commercial & Business Brokers, Inc.
Lat/Lon: 40.7193/-73.8383RFULL9
111-01 Queens Blvd0.5 mi radius 1 mi radius 3 mi radius 5 mi radius
Forest Hills, NY 11375
Total Annual Consumer Expenditure (2018)
Total Household Expenditure $973 M $2.97 B $19.1 B $43.9 B
Total Non-Retail Expenditure $519 M $1.58 B $9.97 B $22.9 B
Total Retail Expenditure $454 M $1.40 B $9.09 B $21.0 B
Apparel $34.6 M $106 M $679 M $1.56 B
Contributions $49.4 M $146 M $838 M $1.91 B
Education $42.5 M $126 M $751 M $1.72 B
Entertainment $55.1 M $168 M $1.07 B $2.46 B
Food and Beverages $138 M $425 M $2.80 B $6.47 B
Furnishings and Equipment $34.8 M $106 M $659 M $1.52 B
Gifts $27.1 M $80.9 M $480 M $1.10 B
Health Care $74.1 M $229 M $1.50 B $3.47 B
Household Operations $30.3 M $91.1 M $557 M $1.28 B
Miscellaneous Expenses $14.1 M $43.2 M $280 M $647 M
Personal Care $12.6 M $38.6 M $249 M $574 M
Personal Insurance $8.00 M $23.9 M $144 M $330 M
Reading $2.22 M $6.74 M $42.4 M $97.5 M
Shelter $203 M $617 M $3.93 B $9.05 B
Tobacco $5.06 M $16.0 M $114 M $264 M
Transportation $174 M $538 M $3.54 B $8.16 B
Utilities $69.1 M $214 M $1.43 B $3.31 B
Monthly Household Consumer Expenditure (2018)
Total Household Expenditure $7,035 $6,281 $5,109 $5,065
Total Non-Retail Expenditure $3,752 53.3% $3,330 53.0% $2,672 52.3% $2,647 52.3%
Total Retail Expenditures $3,284 46.7% $2,951 47.0% $2,437 47.7% $2,418 47.7%
Apparel $250 3.6% $223 3.5% $182 3.6% $180 3.6%
Contributions $357 5.1% $308 4.9% $225 4.4% $221 4.4%
Education $307 4.4% $267 4.2% $201 3.9% $198 3.9%
Entertainment $398 5.7% $355 5.6% $287 5.6% $284 5.6%
Food and Beverages $997 14.2% $898 14.3% $752 14.7% $746 14.7%
Furnishings and Equipment $252 3.6% $224 3.6% $177 3.5% $175 3.5%
Gifts $196 2.8% $171 2.7% $129 2.5% $127 2.5%
Health Care $536 7.6% $483 7.7% $402 7.9% $400 7.9%
Household Operations $219 3.1% $192 3.1% $149 2.9% $147 2.9%
Miscellaneous Expenses $102 1.4% $91 1.5% $75 1.5% $75 1.5%
Personal Care $91 1.3% $82 1.3% $67 1.3% $66 1.3%
Personal Insurance $58 0.8% $51 0.8% $39 0.8% $38 0.8%
Reading $16 0.2% $14 0.2% $11 0.2% $11 0.2%
Shelter $1,465 20.8% $1,303 20.7% $1,053 20.6% $1,044 20.6%
Tobacco $37 0.5% $34 0.5% $30 0.6% $30 0.6%
Transportation $1,256 17.9% $1,136 18.1% $948 18.5% $941 18.6%
Utilities $500 7.1% $452 7.2% $384 7.5% $381 7.5%