Queen Creek TMDL Modeling Report - azdeq.govstatic.azdeq.gov/pn/tmdl_modeling_queen_arnett.pdf2.1.4...
62
Arizona Department of Environmental Quality Queen Creek TMDL Modeling Report Prepared by January 2013 1250 23 rd Street, NW Washington, DC 20037
Transcript of Queen Creek TMDL Modeling Report - azdeq.govstatic.azdeq.gov/pn/tmdl_modeling_queen_arnett.pdf2.1.4...

Arizona Department of Environmental Quality
Queen Creek TMDL Modeling Report
Prepared by
January 2013
1250 23 r d S t reet , N W Wash ington , DC 20037

Queen Creek TMDL Modeling Report
January 2013 Page i
Table of Contents 1.0 Introduction ...................................................................................................................... 1
1.1 Applicable Water Quality Standards ........................................................................... 4
1.2 Point Sources ............................................................................................................... 4
1.3 Abandoned, Inactive, and Semi-active Mines ............................................................ 4
1.4 Landuse and Geologic Data ........................................................................................ 5
2.0 Data Summary ............................................................................................................................... 6
2.1. Water Quality Data ................................................................................................................... 6
2.1.1 Dissolved Copper Instream Data ................................................................................. 7
2.1.2 Hardness Instream Data ................................................................................................. 7
2.1.3 Total Lead Instream Data ............................................................................................... 7
2.1.4 Hard Rock Data ............................................................................................................................. 7
3.0 Model Implementation .............................................................................................................. 15
3.1 Hydrology Calibration ........................................................................................................... 16
3.2 Dissolved Copper Recalibration ........................................................................................ 19
3.2.1 Existing Conditions Scenarios ................................................................................... 21
3.2.2 Dissolved Copper Mining-Background Scenario .................................................. 26
3.2.3 Oak Flat Dissolved Copper Scenario ........................................................................ 28
3.3 Total Lead Model Implementation ..................................................................................... 31
3.3.1 Total Lead Existing Conditions and Mining-Background Scenarios ............... 33
4.0 References ................................................................................................................................... 35
Appendices APPENDIX A Queen Creek Hydrology Calibration ............................................................... A‐1
APPENDIX B Queen Creek Dissolved Copper Calibration ................................................... B‐1
APPENDIX C Queen Creek Total Lead Calibration ............................................................... C‐1

Queen Creek TMDL Modeling Report
January 2013 Page ii
List of Figures
Figure 1-1: Queen Creek Watershed ............................................................................................................................. 3 Figure 2-1: Average Dissolved Copper Concentrations by Segment in the Queen Creek Watershed ........................... 8 Figure 2-2: Average Dissolved Hardness Concentrations by Segment in the Queen Creek Watershed ..................... 10 Figure 2-3: Average Total Lead Concentrations by Segment in the Queen Creek Watershed .................................... 11 Figure 2-4: Soil Copper Data in the Queen Creek Watershed ..................................................................................... 13 Figure 2-5: Soil Lead Data in the Queen Creek Watershed ......................................................................................... 14 Figure 3-1: Observed and Simulated Flows at Model-Segment 22 – Oak Flat ............................................................ 18 Figure 3-2: Observed and Simulated Flows at Model-Segment 30 – Potts Canyon..................................................... 18 Figure 3-3: Observed and Simulated Dissolved Copper at Model-Segment 22 – Oak Flat .......................................... 22 Figure 3-4: Observed and Simulated Dissolved Copper at Model-Segment 92 – Queen Creek .................................. 22 Figure 3-5: Observed and Simulated Total Lead at Model-Segment 22 – Oak Flat ..................................................... 32 Figure 3-6: Observed and Simulated Total Lead at Model-Segment 45 – Silver King Wash ....................................... 33 List of Tables
Table 1-1: Applicable Water Quality Standards in Queen Creek ................................................................................... 4 Table 1-2: Landuse Distribution in the Queen Creek Watershed ................................................................................... 5 Table 2-1: Summary of Data ......................................................................................................................................... 6 Table 2-2: Summary of Dissolved Copper Instream Observations by Sub-Basin and Subwatershed ........................... 9 Table 2-3: Summary of Total Lead Instream Observations by Sub-Basin and Segment ............................................ 13 Table 3-1: Queen Creek Watershed HSPF Calibration Parameters - Final Parameter Values .................................... 17 Table 3-2: Copper HSPF PQUAL Parameters Summary by Sub-Basin and Soil-Landuse Type ................................. 20 Table 3-3: Characteristics of the Synthetic Storms ...................................................................................................... 23 Table 3-4: Existing Conditions 24-Hour Average Dissolved Copper Concentrations (µg/L) ......................................... 23 Table 3-5: Existing Conditions 24-Hour Average Dissolved Copper Loads (kg) .......................................................... 24 Table 3-6: Existing Conditions Scenario Dissolved Copper Allocation Analysis .......................................................... 25 Table 3-7: Mining Areas in Queen Creek Watershed Model ........................................................................................ 26 Table 3-8: Existing Conditions and Mining-Background Scenarios - 24-Hour Average Dissolved Concentrations (µg/L) ..................................................................................................................................................................................... 27 Table 3-9: Existing Conditions and No-Mining Background Scenarios - 24-Hour Dissolved Copper Loads (kg) ......... 27 Table 3-10 Subbasin Dissolved Load Percent Contribution from Mining Areas ........................................................... 28 Table 3-11: Existing Conditions and Oak Flat Scenarios - 24-Hour Average Dissolved Concentrations (µg/L) ........... 29 Table 3-12: Existing Conditions and Oak Flat Scenarios 24-Hour Dissolved Copper Loads (kg) ............................... 29 Table 3-13: Oak Flat Scenario – Smelter Fallout Dissolved Copper Load Contribution ............................................... 30 Table 3-14: Total Lead HSPF PQUAL Parameters Summary by Sub-Basin and Soil-Landuse Type .......................... 31 Table 3-15: Simulated 24-Hour Average Total Lead Concentrations by Scenario and Storm Event (µg/L) ............... 34 Table 3-16: Simulated 24-Hour Total Lead Loads by Scenario and Storm Event (kg) ................................................ 34

Queen Creek TMDL Modeling Report
January 2013 Page 1
1.0 Introduction
Queen Creek begins in the Tonto National Forest below Fortuna Peek as a high gradient, intermittent, arid mountain stream. Queen Creek's flows begin at its headwaters located at the foot of Fortuna Peak in Pinal County, Arizona within the larger Middle Gila Watershed. Queen Creek descends southwesterly towards and through the town of Superior and continues into the Roosevelt Irrigation Canal. The upper watershed is dominated by bedrock outcrops and shallow soils. A second high elevation tributary originates on the easterly side of a prominent ridge known as Apache Leap and joins Queen Creek in the area known as Oak Flat. From here Queen Creek flows steeply approximately 2.5 miles along US Highway 60 toward the Town of Superior. From Superior to the Whitlow flood control dam, the stream takes on the characteristics of a low gradient, desert foothill stream dominated by thick piedmont sediments and infrequent undulating bedrock. Climate in the Queen Creek watershed varies substantially from the mountains, being much cooler and wetter, to the lower deserts, being hotter and much drier. The region has two wet seasons: one during the summer monsoon season with increased and intense precipitation characterized by spotty and short duration convective thunderstorms, and the second in the winter as longer duration events associated with passing low-pressure cold fronts characterized by evenly distributed precipitation. Snow does occur in the higher elevations but typically any accumulated snow melts off within a few days. The portion of the Queen Creek study reach begins at the headwaters and flows approximately 13 miles to Queens Station, below the confluence of Potts Canyon (Figure 1-1). The Queen Creek watershed has a long history of mining with numerous abandoned/inactive mines, historic smelter operations, and mineral prospects. Queen Creek has been included on Arizona's 303(d) List as impaired for exceedances of the dissolved copper surface water quality standards since 2002. Recent water quality results have also indicated that total lead is an additional pollutant of concern which will require completion of a Total Maximum Daily Load (TMDL). As part of the TMDL planning process, the Arizona Department of Environmental Quality (ADEQ) implemented various monitoring programs and modeling studies to identify and quantify the diverse sources of copper and lead in the watershed causing these impairments. In February 2010, ADEQ staff completed the calibration and validation of the Hydrological Simulation FORTRAN (HSPF 12) for dissolved copper in the Queen Creek watershed (Arizona DEQ, 2010). In support to this initial modeling effort, ADEQ implemented a comprehensive and extensive sampling and analysis plan, using automated instrumentation, geared towards developing the needed parameters to populate the HSPF model. ADEQ collected numerous water quality grab samples across the watershed to characterize water quality from various sources, landuse types and bedrock lithologies. The HSPF model was calibrated for streamflow at numerous stations within the watershed. The water quality monitoring data was used to develop the HSPF copper loading factors along with the calibration of the water quality component of the model. This initial HSPF application exhibited an acceptable hydraulic and pollutant calibration for dissolved copper and indicated that natural background in bedrock and soils, semi-active and abandoned mines, and historic smelter fallout, constitute the main source of copper and lead in the Queen Creek watershed. The modeling study also concluded that the degree to which these disturbances have affected water quality is
Queen Creek TMDL Modeling Report
January 2013 Page 2
generally unknown, and may not be able to be discerned from the natural geologic sources with the current set of data. In order to address these issues and to further understand and discern between natural and anthropogenic sources of dissolved copper and total lead in the Queen Creek watershed, ADEQ implemented a supplemental and extensive monitoring program and collected additional copper and lead water quality and lithologic data. The main objective of this study is to incorporate the additional data in the existing model representation and refine the existing ADEQ dissolved copper model calibrations in the Queen Creek watershed. The goal is to fill the spatial water quality data gaps within the watershed to fine-tune the HSPF model spatial representation of dissolved copper, implement various modeling scenarios, and attempt to discern/separate the natural and anthropogenic sources of copper causing the impairment in the Queen Creek watershed. This new additional data; along with the existing data, will also serve for the implementation of the total lead model and the representation of the source-loadings in the Queen Creek watershed.
Subsequent to this introduction, the remainder of this section presents the applicable water quality standards and the point source in the watershed, discusses the identification of the mining areas, and presents the overall landuse and geologic distribution in the Queen Creek watershed. Section 2 presents a detailed summary of the types and sources of data developed by ADEQ in support of the Queen Creek TMDL modeling. Section 3 details the implementation of the HSPF model including the hydrologic and pollutant calibrations. Section 3 also presents the various modeling scenarios implemented for dissolved copper and total lead.
Queen Creek TMDL Modeling Report
January 2013 Page 3
Figure 1-1: Queen Creek Watershed
Queen Creek TMDL Modeling Report
January 2013 Page 4
1.1 Applicable Water Quality Standards Designated uses of Queen Creek include Aquatic and Wildlife Warm water (A&Ww) and Full Body Contact (FBC). Historically, the flow regime in the upper stream reach has been classified as ephemeral. Ephemeral streams flow only in direct response to precipitation. Recent ADEQ biological and hydrological investigations have led to an intermittent flow regime reclassification (Arizona DEQ, 2011, Fact Sheet for Queen Creek Total Maximum Daily Load). Intermittent streams flow continuously only at certain times of the year, as when it receives water from a spring or from another surface source, such as melting snow. This shift changed the designated use of the stream reach from Aquatic and Wildlife ephemeral to A&Ww. The reclassification of the designated uses lowers the dissolved copper standards designed to protect the aquatic life and wildlife that use these streams as habitat and sources of drinking water. The water quality standards for dissolved copper are hardness-based with the more stringent standard designed to protecting A&Ww from chronic exposure. The most stringent surface water quality standard for total lead is based upon the FBC standard of 15 micrograms per liter (μg/L) (Table 1-1).
Table 1-1: Applicable Water Quality Standards in Queen Creek Pollutant A&Ww Acute
(μg/L) A&Ww Chronic
(μg/L) FBC
(μg/L)
Dissolved Copper
(e(0.9422[ln(hardness]-1.7))*0.96
(e(0.8545[ln(hardness]-1.702))*0.96
No Numerical
Standard
Total Lead
No Numerical Standard No Numerical Standard 15
1.2 Point Sources
The Superior Waste Water Treatment Plant (SWWTP) (AZ0021199) is the one of two known point-sources in the watershed. The Resolution Copper Company – West Plant Facilities, adjacent to the Town of Superior, have also been issued an AZPDES permit. A draft renewal permit dated 3/19/2008 (AZ0020389) was reviewed for this project. According to the file and ADEQ Permits Staff, the facility is reportedly designed to contain all runoff up to and including the 100-year, 24-hour event. Thus, the RCC discharge point 001 is non-discharging in the range of storm magnitudes being simulated for the estimation of the copper and lead loads (Chapter 3). RCC has proposed, and then withdrawn, an AZPDES permit application to discharge treated mine dewatering water to Queen Creek adjacent to their existing 001 outfall. At this point there is no information that a future request to discharge this water is pending. Currently, water is transported approximately 30 miles westerly of Superior via pipeline to an irrigation district. The water transfer currently occurs during the growing season only, reportedly forcing RCC to halt mine dewatering during the winter months. 1.3 Abandoned, Inactive, and Semi-active Mines
The Queen Creek watershed has long history of mining, with numerous abandoned/inactive mines and mineral prospects. ADEQ collected water quality samples around three semi-active metals mines; Resolution Copper Co., Silver King Mine, and the Reymert Mine. Fourteen individual small

Queen Creek TMDL Modeling Report
January 2013 Page 5
inactive/abandoned mines were identified in the mines GIS cover, and then confirmed by inspecting the aerial photography for evidence of site disturbance. Those sites identified as having copper, lead, or other metals in the database and exhibiting some disturbance, were provided a land use category in the model. The footprint size, shape and location are based on the actual land disturbance as can be observed from the aerial images. In 2010 ADEQ collected additional copper and lead samples at several abandoned mines in the watershed focusing on waste piles in abandoned mines, mine shafts, mine openings, and excavation walls.
1.4 Landuse and Geologic Data
ADEQ developed the landuse distribution using the geology and landuse GIS cover. The landuse data is based primarily on the geologic units exposed at the surface as well as anthropogenic uses. ADEQ acquired geologic information from the Arizona Geologic Survey and manually edited by visual reference to features observed on aerial photographs. Landuse edits included overlaying several types of human altered lands including: urban/industrial areas, mines/mills, and other disturbed lands. The resulting landuse distribution in the queen Creek watershed is presented in Table 1-2.
Table 1-2: Landuse and Geologic Distribution in the Queen Creek Watershed
Landuse Type Description Number of Areas Acres Percent of
watershed
Pinal Schist schist, phyllite, amphibolite, calc-silicate, and gneiss 51 13,520 21.9%
Apache Group quartzite, diabase, paleozoic’s and naco formation 43 13,148 21.3%
Granite/ Crystalline granite, diorite, granodiorite, porphyrys 26 5,178 8.4%
Volcanics basalt, lavas, intrusions and other volcanics 43 7,078 11.5%
Alluvium surfical, river, fan and terrace deposits, talus 56 4,558 7.4%
Metal Mining and Milling
known mines with copper and/or lead ores 18 772 1.3%
Sedimentary sandstone, siltstones, conglomerates 39 6,982 11.3% Tuff Apache Leap and Picketpost tuffs 46 9,467 15.4%
Urban Industrial Town of Superior and other developed areas 12 415 0.7%
Impervious urban Industrial
Town of Superior and other developed areas 12 506 0.8%
Total 346 61,624 100.0%
Queen Creek TMDL Modeling Report
January 2013 Page 6
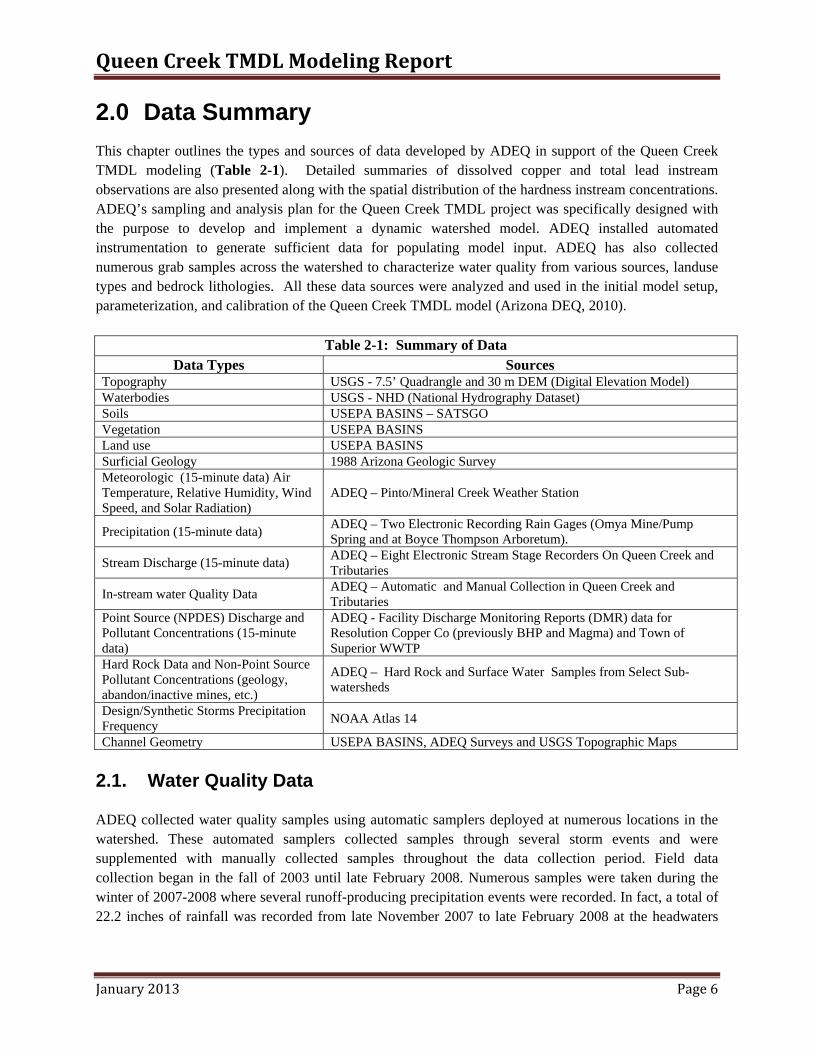
2.0 Data Summary This chapter outlines the types and sources of data developed by ADEQ in support of the Queen Creek TMDL modeling (Table 2-1). Detailed summaries of dissolved copper and total lead instream observations are also presented along with the spatial distribution of the hardness instream concentrations. ADEQ’s sampling and analysis plan for the Queen Creek TMDL project was specifically designed with the purpose to develop and implement a dynamic watershed model. ADEQ installed automated instrumentation to generate sufficient data for populating model input. ADEQ has also collected numerous grab samples across the watershed to characterize water quality from various sources, landuse types and bedrock lithologies. All these data sources were analyzed and used in the initial model setup, parameterization, and calibration of the Queen Creek TMDL model (Arizona DEQ, 2010).
Table 2-1: Summary of Data Data Types Sources
Topography USGS - 7.5’ Quadrangle and 30 m DEM (Digital Elevation Model) Waterbodies USGS - NHD (National Hydrography Dataset) Soils USEPA BASINS – SATSGO Vegetation USEPA BASINS Land use USEPA BASINS Surficial Geology 1988 Arizona Geologic Survey Meteorologic (15-minute data) Air Temperature, Relative Humidity, Wind Speed, and Solar Radiation)
ADEQ – Pinto/Mineral Creek Weather Station
Precipitation (15-minute data) ADEQ – Two Electronic Recording Rain Gages (Omya Mine/Pump Spring and at Boyce Thompson Arboretum).
Stream Discharge (15-minute data) ADEQ – Eight Electronic Stream Stage Recorders On Queen Creek and Tributaries
In-stream water Quality Data ADEQ – Automatic and Manual Collection in Queen Creek and Tributaries
Point Source (NPDES) Discharge and Pollutant Concentrations (15-minute data)
ADEQ - Facility Discharge Monitoring Reports (DMR) data for Resolution Copper Co (previously BHP and Magma) and Town of Superior WWTP
Hard Rock Data and Non-Point Source Pollutant Concentrations (geology, abandon/inactive mines, etc.)
ADEQ – Hard Rock and Surface Water Samples from Select Sub-watersheds
Design/Synthetic Storms Precipitation Frequency NOAA Atlas 14
Channel Geometry USEPA BASINS, ADEQ Surveys and USGS Topographic Maps 2.1. Water Quality Data ADEQ collected water quality samples using automatic samplers deployed at numerous locations in the watershed. These automated samplers collected samples through several storm events and were supplemented with manually collected samples throughout the data collection period. Field data collection began in the fall of 2003 until late February 2008. Numerous samples were taken during the winter of 2007-2008 where several runoff-producing precipitation events were recorded. In fact, a total of 22.2 inches of rainfall was recorded from late November 2007 to late February 2008 at the headwaters

Queen Creek TMDL Modeling Report
January 2013 Page 7
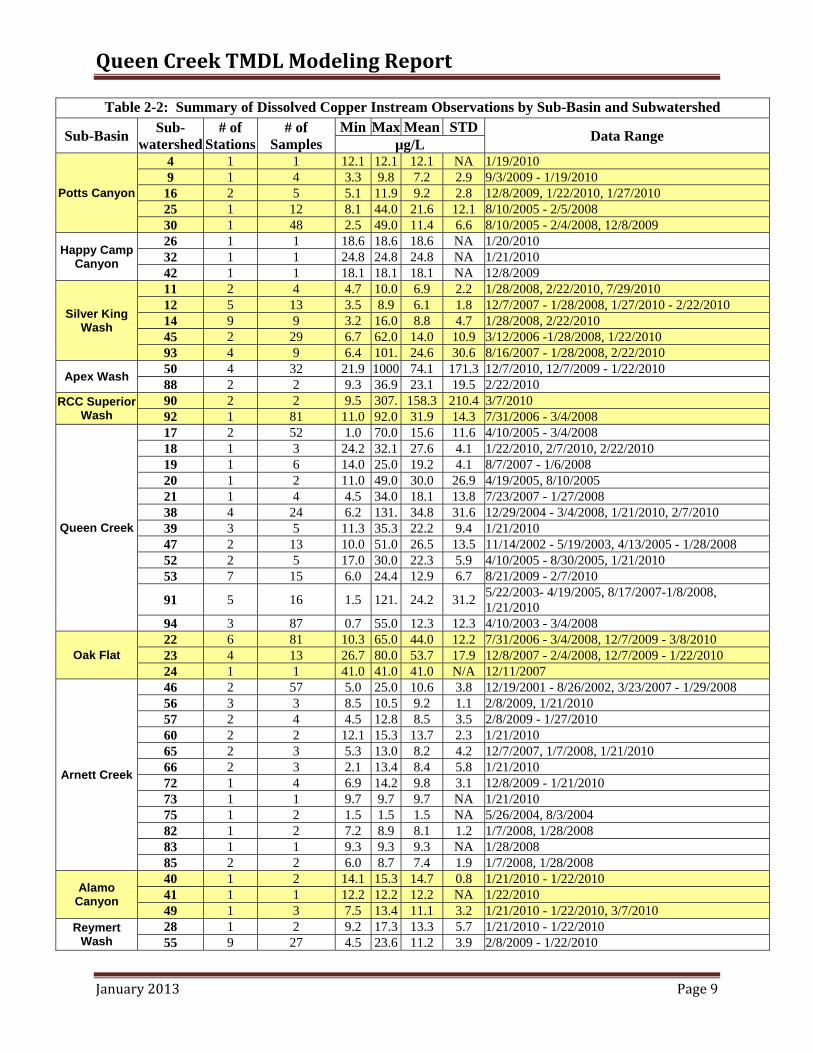
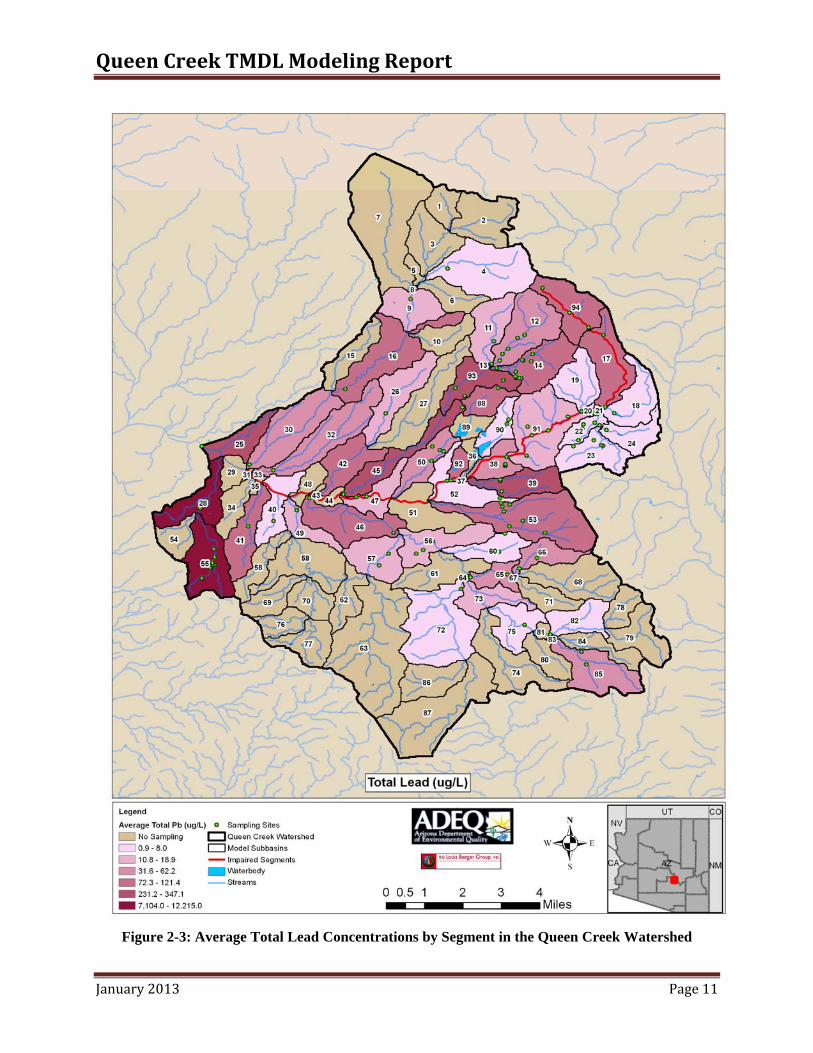
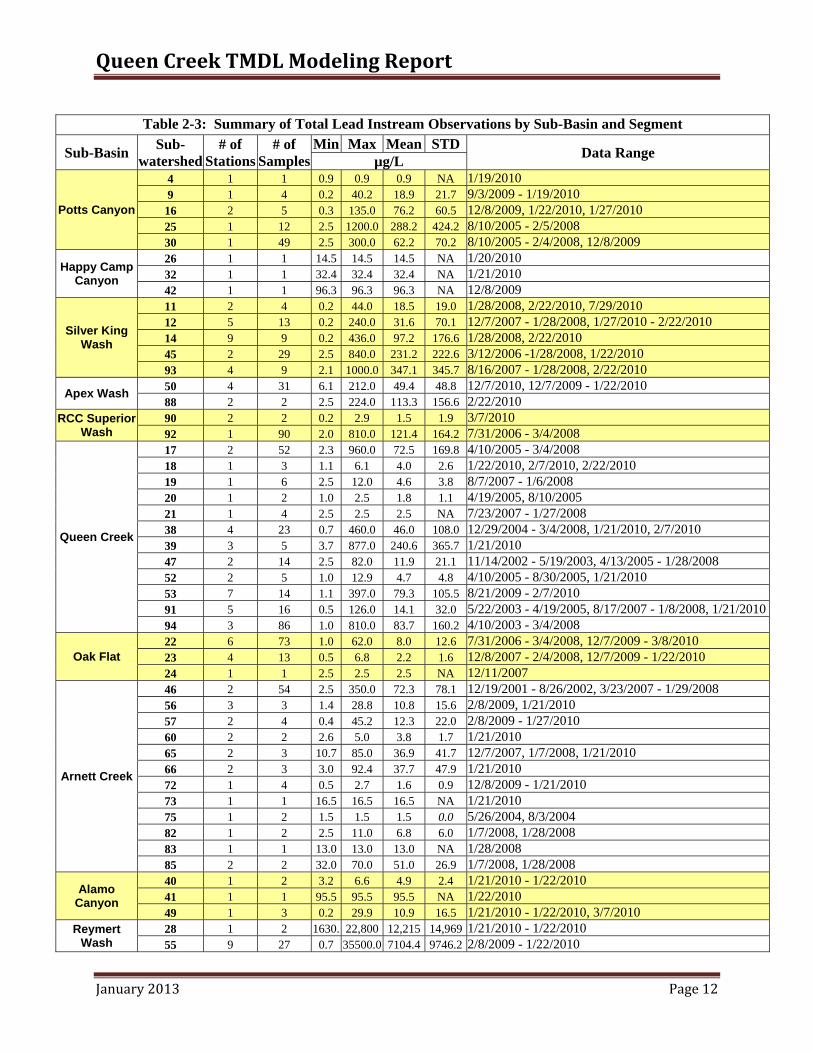
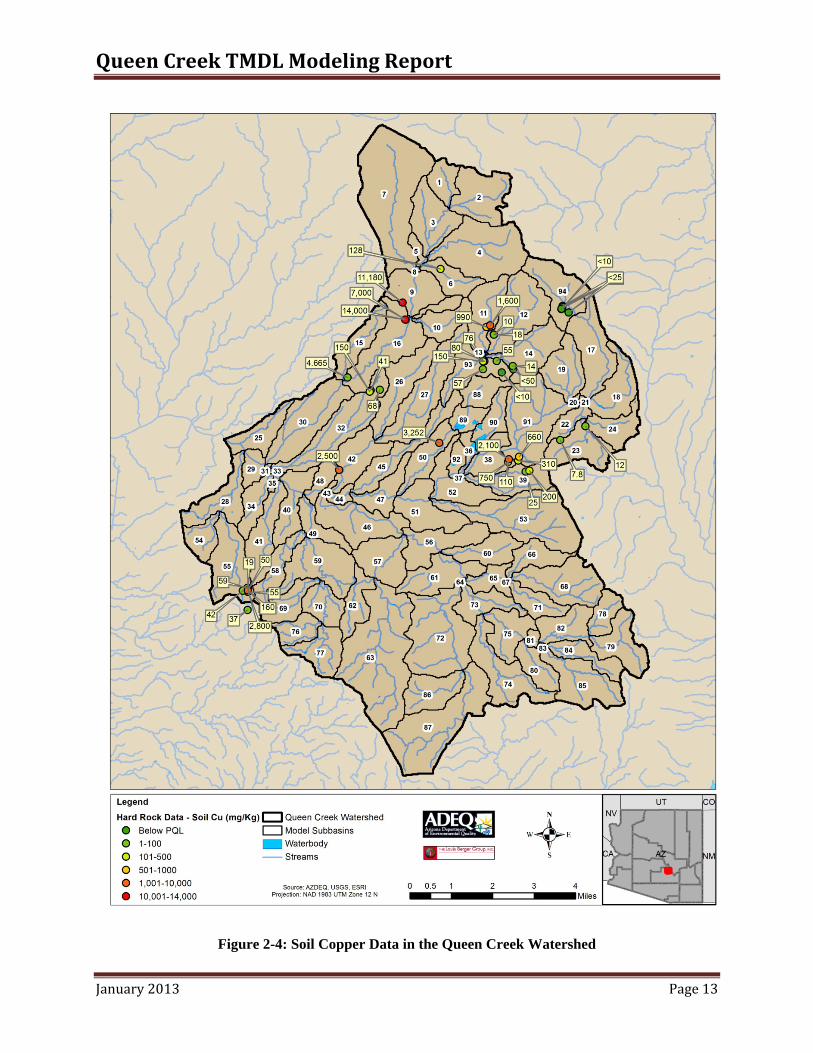
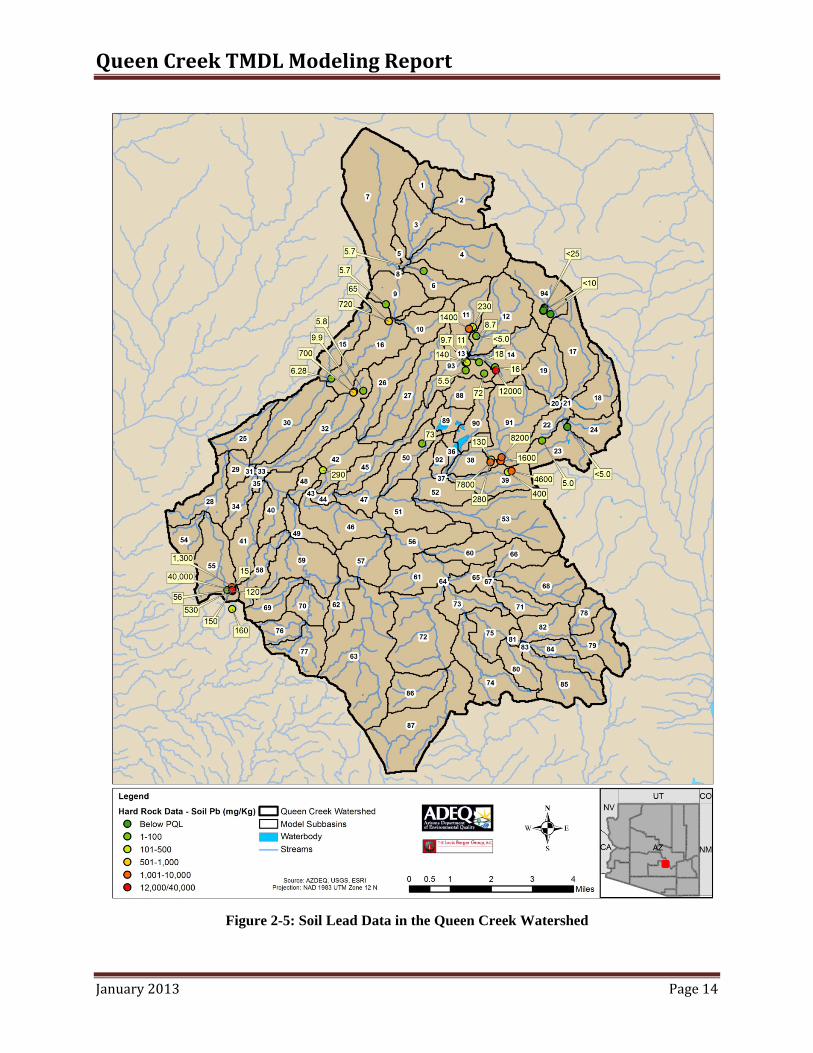
(Omya) rain gage. Water quality data were also collected at numerous other sites across the watershed and were used to assign pollutant concentrations for sub-watersheds and other individual sources. In 2010, ADEQ initiated an additional monitoring program and collected water quality and lithologic data in the Queen Creek watershed. The intent was to fill a few spatial water quality data gaps identified during the initial modeling phase. This additional data will allow a fine-tuning of the watershed model spatial representation and distribution of dissolved copper and total lead loadings. The following sections present a summary of the dissolved copper, total lead, hardness, and hard rock data. 2.1.1 Dissolved Copper Instream Data Figure 2-1 presents the average observed dissolved copper concentrations for each segment with water quality station(s) in the Queen Creek watershed. Table 2-2 presents similar results in a tabular format. These summaries clearly indicate that all the sub-basins in the Queen Creek watershed have been covered through an extensive collection of water quality measurements totaling 700 data points. Figure 2-1 indicates that the highest observed concentrations were observed in the Oak Flat sub-basin (segments 22, 23, and 24), the Apex Wash sub-basin (segment 50), and the RCC Superior Wash (segment 90). 2.1.2 Hardness Instream Data Since the dissolved copper criteria are hardness-dependent, knowledge of the hardness (mg/L as CaCO3) instream levels are important for assessing compliance with water quality standards. Figure 2-2 depicts the spatial distribution of observed hardness instream concentrations and reveals that the lowest hardness levels were recorded in the Oak Flat sub-basin. 2.1.3 Total Lead Instream Data Figure 2-3 presents the average observed total copper concentrations for each segment with water quality station(s) in the Queen Creek watershed. Table 2-3 presents similar results in a tabular format. These summaries clearly indicate that all the sub-basins in the Queen Creek watershed have been covered through an extensive collection of water quality measurements totaling 700 data points. Figure 2-3 and Table 2-3 indicates that the highest observed total lead concentrations were observed in the Reymert Wash sub-basin (segment 28) where the average total concentration was recorded at 1.63 mg/L. Even though just two observations were made at this segment, the excessively high instream copper concentration is confirmed and consistent with the hard rock data collected in Reymert Wash (Section 2.1.4) 2.1.4 Hard Rock Data In 2010 ADEQ collected additional copper and lead samples at specific locations in the Queen Creek watershed. This sampling focused on specific locations in the watershed such as waste piles in abandoned mines, mineralized rocks, and single lithology areas. Dissolved copper and lead data as well as soil data copper and lead (hard rock) were collected at these locations. The soil copper and lead data are depicted in Figures 2-4 and 2-5, respectively. The highest soil copper concentration of 14,000 mg/kg was recorded at segment 16 (Potts Canyon). The highest soil lead concentration was recorded a segment 55 (Reymert Wash) at a concentration of 40,000 m/kg exceeding by one order of magnitude all the other soil lead data in the watershed.

Queen Creek TMDL Modeling Report
January 2013 Page 8
Figure 2-1: Average Dissolved Copper Concentrations by Segment in the Queen Creek Watershed
Queen Creek TMDL Modeling Report
January 2013 Page 9
Table 2-2: Summary of Dissolved Copper Instream Observations by Sub-Basin and Subwatershed
Sub-Basin Sub- watershed
# of Stations
# of Samples
Min Max Mean STD Data Range µg/L
Potts Canyon
4 1 1 12.1 12.1 12.1 NA 1/19/2010 9 1 4 3.3 9.8 7.2 2.9 9/3/2009 - 1/19/2010
16 2 5 5.1 11.9 9.2 2.8 12/8/2009, 1/22/2010, 1/27/2010 25 1 12 8.1 44.0 21.6 12.1 8/10/2005 - 2/5/2008 30 1 48 2.5 49.0 11.4 6.6 8/10/2005 - 2/4/2008, 12/8/2009
Happy Camp Canyon
26 1 1 18.6 18.6 18.6 NA 1/20/2010 32 1 1 24.8 24.8 24.8 NA 1/21/2010 42 1 1 18.1 18.1 18.1 NA 12/8/2009
Silver King Wash
11 2 4 4.7 10.0 6.9 2.2 1/28/2008, 2/22/2010, 7/29/2010 12 5 13 3.5 8.9 6.1 1.8 12/7/2007 - 1/28/2008, 1/27/2010 - 2/22/2010 14 9 9 3.2 16.0 8.8 4.7 1/28/2008, 2/22/2010 45 2 29 6.7 62.0 14.0 10.9 3/12/2006 -1/28/2008, 1/22/2010 93 4 9 6.4 101. 24.6 30.6 8/16/2007 - 1/28/2008, 2/22/2010
Apex Wash 50 4 32 21.9 1000 74.1 171.3 12/7/2010, 12/7/2009 - 1/22/2010 88 2 2 9.3 36.9 23.1 19.5 2/22/2010
RCC Superior Wash
90 2 2 9.5 307. 158.3 210.4 3/7/2010 92 1 81 11.0 92.0 31.9 14.3 7/31/2006 - 3/4/2008
Queen Creek
17 2 52 1.0 70.0 15.6 11.6 4/10/2005 - 3/4/2008 18 1 3 24.2 32.1 27.6 4.1 1/22/2010, 2/7/2010, 2/22/2010 19 1 6 14.0 25.0 19.2 4.1 8/7/2007 - 1/6/2008 20 1 2 11.0 49.0 30.0 26.9 4/19/2005, 8/10/2005 21 1 4 4.5 34.0 18.1 13.8 7/23/2007 - 1/27/2008 38 4 24 6.2 131. 34.8 31.6 12/29/2004 - 3/4/2008, 1/21/2010, 2/7/2010 39 3 5 11.3 35.3 22.2 9.4 1/21/2010 47 2 13 10.0 51.0 26.5 13.5 11/14/2002 - 5/19/2003, 4/13/2005 - 1/28/2008 52 2 5 17.0 30.0 22.3 5.9 4/10/2005 - 8/30/2005, 1/21/2010 53 7 15 6.0 24.4 12.9 6.7 8/21/2009 - 2/7/2010
91 5 16 1.5 121. 24.2 31.2 5/22/2003- 4/19/2005, 8/17/2007-1/8/2008, 1/21/2010
94 3 87 0.7 55.0 12.3 12.3 4/10/2003 - 3/4/2008
Oak Flat 22 6 81 10.3 65.0 44.0 12.2 7/31/2006 - 3/4/2008, 12/7/2009 - 3/8/2010 23 4 13 26.7 80.0 53.7 17.9 12/8/2007 - 2/4/2008, 12/7/2009 - 1/22/2010 24 1 1 41.0 41.0 41.0 N/A 12/11/2007
Arnett Creek
46 2 57 5.0 25.0 10.6 3.8 12/19/2001 - 8/26/2002, 3/23/2007 - 1/29/2008 56 3 3 8.5 10.5 9.2 1.1 2/8/2009, 1/21/2010 57 2 4 4.5 12.8 8.5 3.5 2/8/2009 - 1/27/2010 60 2 2 12.1 15.3 13.7 2.3 1/21/2010 65 2 3 5.3 13.0 8.2 4.2 12/7/2007, 1/7/2008, 1/21/2010 66 2 3 2.1 13.4 8.4 5.8 1/21/2010 72 1 4 6.9 14.2 9.8 3.1 12/8/2009 - 1/21/2010 73 1 1 9.7 9.7 9.7 NA 1/21/2010 75 1 2 1.5 1.5 1.5 NA 5/26/2004, 8/3/2004 82 1 2 7.2 8.9 8.1 1.2 1/7/2008, 1/28/2008 83 1 1 9.3 9.3 9.3 NA 1/28/2008 85 2 2 6.0 8.7 7.4 1.9 1/7/2008, 1/28/2008
Alamo Canyon
40 1 2 14.1 15.3 14.7 0.8 1/21/2010 - 1/22/2010 41 1 1 12.2 12.2 12.2 NA 1/22/2010 49 1 3 7.5 13.4 11.1 3.2 1/21/2010 - 1/22/2010, 3/7/2010
Reymert Wash
28 1 2 9.2 17.3 13.3 5.7 1/21/2010 - 1/22/2010 55 9 27 4.5 23.6 11.2 3.9 2/8/2009 - 1/22/2010

Queen Creek TMDL Modeling Report
January 2013 Page 10
Figure 2-2: Average Dissolved Hardness Concentrations by Segment in the Queen Creek
Watershed
Queen Creek TMDL Modeling Report
January 2013 Page 11
Figure 2-3: Average Total Lead Concentrations by Segment in the Queen Creek Watershed
Queen Creek TMDL Modeling Report
January 2013 Page 12
Table 2-3: Summary of Total Lead Instream Observations by Sub-Basin and Segment
Sub-Basin Sub-watershed
# of Stations
# of Samples
Min Max Mean STD Data Range µg/L
Potts Canyon
4 1 1 0.9 0.9 0.9 NA 1/19/2010 9 1 4 0.2 40.2 18.9 21.7 9/3/2009 - 1/19/2010 16 2 5 0.3 135.0 76.2 60.5 12/8/2009, 1/22/2010, 1/27/2010 25 1 12 2.5 1200.0 288.2 424.2 8/10/2005 - 2/5/2008 30 1 49 2.5 300.0 62.2 70.2 8/10/2005 - 2/4/2008, 12/8/2009
Happy Camp Canyon
26 1 1 14.5 14.5 14.5 NA 1/20/2010 32 1 1 32.4 32.4 32.4 NA 1/21/2010 42 1 1 96.3 96.3 96.3 NA 12/8/2009
Silver King Wash
11 2 4 0.2 44.0 18.5 19.0 1/28/2008, 2/22/2010, 7/29/2010 12 5 13 0.2 240.0 31.6 70.1 12/7/2007 - 1/28/2008, 1/27/2010 - 2/22/2010 14 9 9 0.2 436.0 97.2 176.6 1/28/2008, 2/22/2010 45 2 29 2.5 840.0 231.2 222.6 3/12/2006 -1/28/2008, 1/22/2010 93 4 9 2.1 1000.0 347.1 345.7 8/16/2007 - 1/28/2008, 2/22/2010
Apex Wash 50 4 31 6.1 212.0 49.4 48.8 12/7/2010, 12/7/2009 - 1/22/2010 88 2 2 2.5 224.0 113.3 156.6 2/22/2010
RCC Superior Wash
90 2 2 0.2 2.9 1.5 1.9 3/7/2010 92 1 90 2.0 810.0 121.4 164.2 7/31/2006 - 3/4/2008
Queen Creek
17 2 52 2.3 960.0 72.5 169.8 4/10/2005 - 3/4/2008 18 1 3 1.1 6.1 4.0 2.6 1/22/2010, 2/7/2010, 2/22/2010 19 1 6 2.5 12.0 4.6 3.8 8/7/2007 - 1/6/2008 20 1 2 1.0 2.5 1.8 1.1 4/19/2005, 8/10/2005 21 1 4 2.5 2.5 2.5 NA 7/23/2007 - 1/27/2008 38 4 23 0.7 460.0 46.0 108.0 12/29/2004 - 3/4/2008, 1/21/2010, 2/7/2010 39 3 5 3.7 877.0 240.6 365.7 1/21/2010 47 2 14 2.5 82.0 11.9 21.1 11/14/2002 - 5/19/2003, 4/13/2005 - 1/28/2008 52 2 5 1.0 12.9 4.7 4.8 4/10/2005 - 8/30/2005, 1/21/2010 53 7 14 1.1 397.0 79.3 105.5 8/21/2009 - 2/7/2010 91 5 16 0.5 126.0 14.1 32.0 5/22/2003 - 4/19/2005, 8/17/2007 - 1/8/2008, 1/21/201094 3 86 1.0 810.0 83.7 160.2 4/10/2003 - 3/4/2008
Oak Flat 22 6 73 1.0 62.0 8.0 12.6 7/31/2006 - 3/4/2008, 12/7/2009 - 3/8/2010 23 4 13 0.5 6.8 2.2 1.6 12/8/2007 - 2/4/2008, 12/7/2009 - 1/22/2010 24 1 1 2.5 2.5 2.5 NA 12/11/2007
Arnett Creek
46 2 54 2.5 350.0 72.3 78.1 12/19/2001 - 8/26/2002, 3/23/2007 - 1/29/2008 56 3 3 1.4 28.8 10.8 15.6 2/8/2009, 1/21/2010 57 2 4 0.4 45.2 12.3 22.0 2/8/2009 - 1/27/2010 60 2 2 2.6 5.0 3.8 1.7 1/21/2010 65 2 3 10.7 85.0 36.9 41.7 12/7/2007, 1/7/2008, 1/21/2010 66 2 3 3.0 92.4 37.7 47.9 1/21/2010 72 1 4 0.5 2.7 1.6 0.9 12/8/2009 - 1/21/2010 73 1 1 16.5 16.5 16.5 NA 1/21/2010 75 1 2 1.5 1.5 1.5 0.0 5/26/2004, 8/3/2004 82 1 2 2.5 11.0 6.8 6.0 1/7/2008, 1/28/2008 83 1 1 13.0 13.0 13.0 NA 1/28/2008 85 2 2 32.0 70.0 51.0 26.9 1/7/2008, 1/28/2008
Alamo Canyon
40 1 2 3.2 6.6 4.9 2.4 1/21/2010 - 1/22/2010 41 1 1 95.5 95.5 95.5 NA 1/22/2010 49 1 3 0.2 29.9 10.9 16.5 1/21/2010 - 1/22/2010, 3/7/2010
Reymert Wash
28 1 2 1630. 22,800 12,215 14,969 1/21/2010 - 1/22/2010 55 9 27 0.7 35500.0 7104.4 9746.2 2/8/2009 - 1/22/2010
Queen Creek TMDL Modeling Report
January 2013 Page 13
Figure 2-4: Soil Copper Data in the Queen Creek Watershed
Queen Creek TMDL Modeling Report
January 2013 Page 14
Figure 2-5: Soil Lead Data in the Queen Creek Watershed
Queen Creek TMDL Modeling Report
January 2013 Page 15
3.0 Model Implementation The initial modeling phase implemented by ADEQ uses the Hydrologic Simulation Program FORTRAN (HSPF) to simulate the hydrology and dissolved copper transport in the various reaches of the Queen Creek watershed (ADEQ, 2010). HSPF is a component of the US EPA BASINS (USEPA, 2001) program which integrates Geographic information System (GIS), data analysis, and modeling to support watershed based analysis. HSPF is a hydrologic, watershed-based water quality model that explicitly accounts for the specific watershed physical conditions, the variations in rainfall and climate, and the sources of dissolved copper and total lead in the Queen Creek watershed. The HSPF model was selected because of its dynamic nature and is well suited for the hydrologic and water quality applications in the Queen Creek watershed.
The goals of the modeling approach are to develop a predictive tool for the Queen Creek watershed that can:
• represent the watershed characteristics • represent the point and non-point sources pollutant loads and their respective contribution • allow for direct comparisons between the in-stream conditions and the water quality standard • estimate the in-stream pollutant concentrations and loadings under various hydrologic
conditions The results from the developed model are subsequently used to develop the watershed-basis analyses using the estimated existing-conditions loads for dissolved copper and total lead. The modeling process in HSPF starts with the delineation of the watershed into smaller model-segments followed by the development of the physical and land use data that describe each model segment. ADEQ used the EPA BASINS platform to perform the watershed delineation where the Queen Creek watershed was delineated into 95 smaller subwatersheds (model-segments) to represent the watershed characteristics and to improve the accuracy of the HSPF model. This division of subbasins to segments delineation was based on topographic characteristics, and was created using a Digital Elevation Model (DEM), stream reaches obtained from the National Hydrography Dataset (NHD), and stream flow and in-stream water quality data. Figure 2-1 depicts the delineated subwatersheds. This division of the Queen Creek watershed into smaller model segments also determines the landuse and geology within each model-segment.
The HSPF model requires several standard and optional modules in order to adequately simulate the hydrology and pollutant fate and transport of the watershed. The following HSPF modules were invoked in the Queen Creek HSPF implementation: PERLND, IMPLND, RHCRES, HYDR, ADCALC, ATEMP, SNOW, PWATER, IWATER, SOLIDS, SEDMNT, SEDTRN, PQUAL, IQUAL, and GQUAL. The algorithms used in these modules are described in the HSPF Users Manual (EPA, 2001).
Given the flashy nature of Queen Creek and availability of high frequency stream stage and weather logger data, the time-step for the model was set at 15 minutes. The model’s simulation period spanned from the fall 2006 (when most of the stage loggers were initially deployed) to February 29, 2008.

Queen Creek TMDL Modeling Report
January 2013 Page 16
3.1 Hydrology Calibration
The HSPF model uses rainfall and other meteorological records to simulate the hydrologic cycle, which includes evapotranspiration, surface runoff, interflow, baseflow, soil moisture, snowpack depth and water content, snowmelt, and groundwater recharge. Calibrating the hydrology in HSPF involves developing a set of representative values for the parameters used in HSPF algorithms that best describe the watershed conditions. These parameters are based on the available watershed physiographic data (soil types, topography, and land use/geology) and hydrographic data (steam network and reaches). Model calibration is a repetitive process of running the HSPF model under varying parameter values, and comparing the results with the observed flow. Sensitivity analysis is always during the calibration process where input parameters are adjusted until the modeling results are acceptable, which includes agreement between the model output and the observed flow data. Simulating the hydrology in ephemeral and intermittent streams is quite challenging because of the water losses to groundwater in the alluvium. In fact, the hydrologic and associated pollutant transport processes are significantly affected spatially and temporally by the intermittent nature of Queen Creek. Stream flows and the corresponding pollutant loads in intermittent streams are generally influent, or subject to downstream volume decreases. These decreasing flow volumes principally are due to transmission losses resulting from infiltration of streamflow into the unconsolidated alluvium forming channel boundaries, losses resulting from overbank flooding, and evaporation of floodwaters (USEPA, 2008). Queen Creek transitions from a steep gradient bedrock streambed, to an alluvial bedded, low gradient stream below the Town of Superior. The initial HSPF model runs consistently over estimated discharge rate and volume at most monitoring stations in the Queen Creek watershed. To mimic these transmission losses, a second exit was added to the HSPF FTABLES at several reaches of the Queen Creek channel. FTABLES are tables of stream geometry with depth/discharge relationships. The addition of this second channel exit helped address the observed water losses and resulted in a robust hydrology calibration that and mimics quite well the observed data. During the recalibration of the model for dissolved copper the hydrology simulation was slightly adjusted to generate a better fit between the observed and simulated stream flows. Table 3-1 presents the final HSPF hydrology parameterization. The typical and possible parameter ranges in Table 3-1were adapted from EPA BASINS Technical Note 6 (EPA, 2000). Figures 3-1 and 3-2 present the hydrology calibration in the Oak Flat and Potts Canyon, respectively. The complete hydrology calibrations results, presented in Appendix A, indicate a very good agreement between observed and simulated flows.

Queen Creek TMDL Modeling Report
January 2013 Page 17
Table 3-1: Queen Creek Watershed HSPF Calibration Parameters - Final Parameter Values
Parameter Definition Units Typical Possible Final Calibration Value/ Ranges Min Max Min Max
LZSN Lower zone nominal soil moisture inch 3 8 2 15 2.5-5.0
INFILT Index to infiltration capacity Inch/hour 0.01 0.25 0.001 0.5 0.07-0.25 LSUR Length of overland flow Ft 200 500 100 700 150 - 250
SLSUR Slope of overland flow plane None 0.01 0.15 0.001 0.3 0.11 – 0.54
KVARY Groundwater recession variable 1/inch 0 3 0 5 0
AGWRC Basic groundwater recession None 0.92 0.99 0.85 0.999 0.98
PETMAX Air temp below which ET is reduced Deg F 35 45 32 48 40
PETMIN Air temp below which ET is set to zero Deg F 30 35 30 40 35
INFEXP Exponent in infiltration equation None 2 2 1 3 2
INFILD Ratio of max/mean infiltration capacities None 2 2 1 3 2
DEEPER Fraction of groundwater inflow to deep recharge None 0 0.2 0 0.5 0.4 – 0.75
BASETP Fraction of remaining ET from base flow None 0 0.05 0 0.2 0.10
AGWETP Fraction of remaining ET from active groundwater None 0 0.05 0 0.2 0.0
CEPSC Interception storage capacity Inch 0.03 0.2 0.01 0.4 0.01
UZSN Upper zone nominal soils moisture inch 0.10 1 0.05 2 0.3 - 0.4
NSUR Manning’s n None 0.15 0.35 0.1 0.5 0.05 – 0.2
INTFW Interflow/surface runoff partition parameter None 1 3 1 10 1.0 – 2.0
IRC Interflow recession parameter None 0.5 0.7 0.3 0.85 0.1 – 0.5
LZETP Lower zone ET parameter None 0.2 0.7 0.1 0.9 0.2 - 0.35
POTFW Constituent Potency Factor mg/ton - - - Varies with pollutant
and soil Tables 3-2 and 3-14
IOQC Constituent concentration in interflow mg/ft3 - - - -
Varies with pollutant and soil
Tables 3-2 and 3-14
AOQC Constituent concentration in active groundwater mg/ft3 - - - -
Varies with pollutant and soil
Tables 3-2 and 3-14

Queen Creek TMDL Modeling Report
January 2013 Page 18
Figure 3-1: Observed and Simulated Flows at Model-Segment 22 – Oak Flat
Figure 3-2: Observed and Simulated Flows at Model-Segment 30 – Potts Canyon
0.0001
0.001
0.01
0.1
1
10
100
1000
10000
11/29/2007 12/29/2007 1/28/2008 2/27/2008
Flow
(cfs
)Segment 22 - Oak Flat
Observed Flow Simulated Flow
0.00001
0.0001
0.001
0.01
0.1
1
10
100
1000
10000
11/29/2007 12/29/2007 1/28/2008 2/27/2008
Flow
(cfs
)
Segment 30 - Potts Canyon
Observed Flow Logger Observed Flow Measured Simulated Flow

Queen Creek TMDL Modeling Report
January 2013 Page 19
3.2 Dissolved Copper Recalibration Calibrating the water quality component involves developing the adequate model parameterization that best describe the dissolved copper sources and environmental conditions in the Queen Creek watershed. It is an iterative process in which the model results are compared to the available in-stream dissolved copper data, and the model parameters are adjusted until there is an acceptable agreement between the observed and simulated in-stream concentrations. The HSPF PQUAL subroutine of the PERLND module was used to simulate the washoff of copper from pervious land segments (Washoff Potency Factor: POTFW) as well as to specify dissolved copper concentrations in interflow (IOQC) and baseflow (AOQC).
As previously implemented with other similar HSPF models in Arizona (ADEQ, 2006), the Queen Creek model assumes that the land-based pollutants can be modeled during precipitation events as detached sediment particles. In fact, PQUAL offers two options for simulating the washoff of a pollutant: (1) by accumulation/deposition and washoff (QUALOF); or (2) by association with detached sediment erosion and washoff (QUALSD). Neither of these methods was specifically designed for the simulation of dissolved metals in runoff, which do not necessarily over time nor are directly attached to sediment. Since the QUALSD can be used to model constituents that are highly correlated with precipitation and runoff, it was selected to simulate the dissolved copper the Queen Creek watershed.
The parameters of the HSPF PQAL module were first estimated using as a starting point the estimated dissolved copper concentration for a single lithology (Table 3-3). This soil dissolved concentration was assigned to the dissolved copper concentrations in interflow (IOQC in lb/ft3) and in the baseflow (AOQC in lb/ft3). The Washoff Potency Factor (POTFW in mg of copper per ton of sediment) was developed using similar approach used in the interim modeling report (ADEQ, 2010) and also in previous TMDL developed in Arizona (ADEQ, 2006). Using this consistent approach allows simulation of a constant event mean concentration of dissolved copper from each pervious land segment using as a guide water quality concentrations that were representative of runoff from relatively undisturbed portions of the Queen Creek watershed, some of which represent a single lithology. This approach is consistent with ADEQ initial parameterization of the model where all three PQUAL parameters were first estimated for each single lithology-soil type and using exiting monitoring data. In fact and during the initial parameterization of the model, ADEQ collected water quality samples that were representative of runoff from relatively undisturbed portions of the Queen Creek watershed, some of which represent a single lithology. The mean dissolved copper concentrations observed and the initial PQUAL parameter values, estimated by ADEQ during the initial phase of the modeling, were used as a starting point to develop the water quality model parameterization. After several iterative approaches, it was judged more efficient to develop PQUAL parameters on a subbasin basis. In other words, all the PQUAL parameters are the same for each soil-landuse within each specific subbasin. The PQUAL parameters were estimated iteratively by varying the dissolved copper concentration for each land use type in the sub-basin until an acceptable fit is achieved between the simulated and observed dissolved copper concentrations.
Queen Creek TMDL Modeling Report
January 2013 Page 20
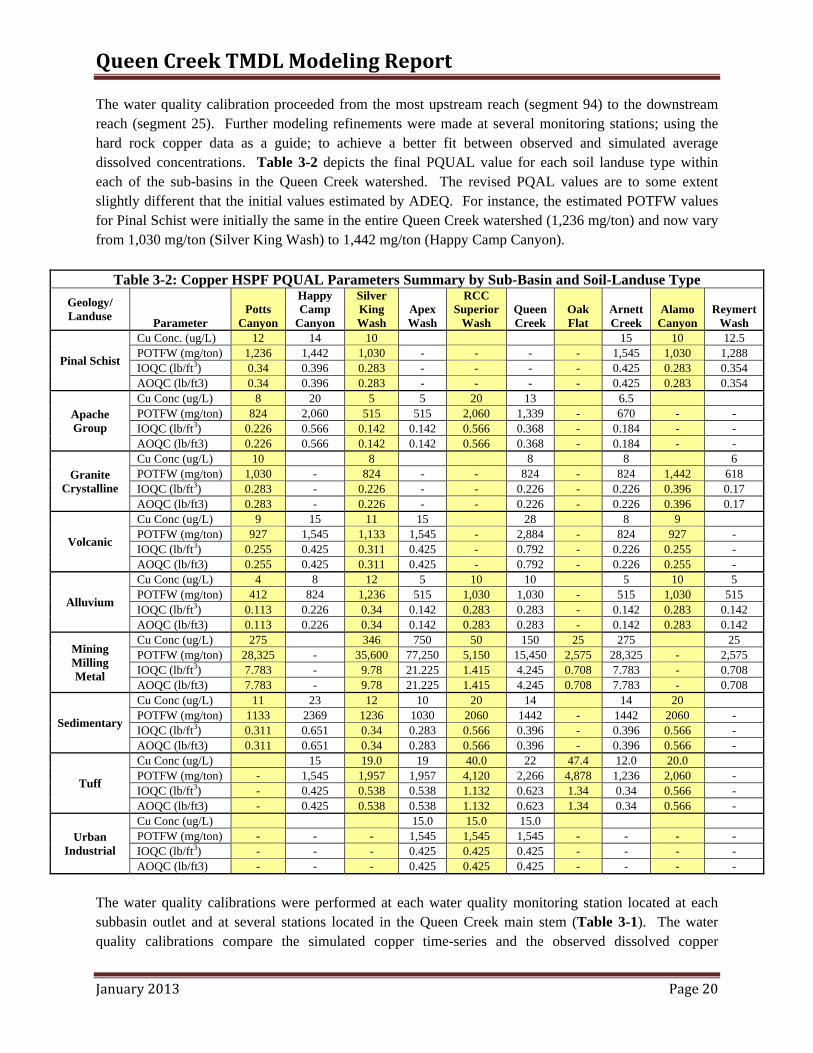
The water quality calibration proceeded from the most upstream reach (segment 94) to the downstream reach (segment 25). Further modeling refinements were made at several monitoring stations; using the hard rock copper data as a guide; to achieve a better fit between observed and simulated average dissolved concentrations. Table 3-2 depicts the final PQUAL value for each soil landuse type within each of the sub-basins in the Queen Creek watershed. The revised PQAL values are to some extent slightly different that the initial values estimated by ADEQ. For instance, the estimated POTFW values for Pinal Schist were initially the same in the entire Queen Creek watershed (1,236 mg/ton) and now vary from 1,030 mg/ton (Silver King Wash) to 1,442 mg/ton (Happy Camp Canyon).
Table 3-2: Copper HSPF PQUAL Parameters Summary by Sub-Basin and Soil-Landuse Type Geology/ Landuse Parameter
Potts Canyon
Happy Camp
Canyon
Silver King Wash
Apex Wash
RCC Superior
Wash Queen Creek
Oak Flat
Arnett Creek
Alamo Canyon
Reymert Wash
Pinal Schist
Cu Conc. (ug/L) 12 14 10 15 10 12.5 POTFW (mg/ton) 1,236 1,442 1,030 - - - - 1,545 1,030 1,288 IOQC (lb/ft3) 0.34 0.396 0.283 - - - - 0.425 0.283 0.354 AOQC (lb/ft3) 0.34 0.396 0.283 - - - - 0.425 0.283 0.354
Apache Group
Cu Conc (ug/L) 8 20 5 5 20 13 6.5 POTFW (mg/ton) 824 2,060 515 515 2,060 1,339 - 670 - - IOQC (lb/ft3) 0.226 0.566 0.142 0.142 0.566 0.368 - 0.184 - - AOQC (lb/ft3) 0.226 0.566 0.142 0.142 0.566 0.368 - 0.184 - -
Granite Crystalline
Cu Conc (ug/L) 10 8 8 8 6 POTFW (mg/ton) 1,030 - 824 - - 824 - 824 1,442 618 IOQC (lb/ft3) 0.283 - 0.226 - - 0.226 - 0.226 0.396 0.17 AOQC (lb/ft3) 0.283 - 0.226 - - 0.226 - 0.226 0.396 0.17
Volcanic
Cu Conc (ug/L) 9 15 11 15 28 8 9 POTFW (mg/ton) 927 1,545 1,133 1,545 - 2,884 - 824 927 - IOQC (lb/ft3) 0.255 0.425 0.311 0.425 - 0.792 - 0.226 0.255 - AOQC (lb/ft3) 0.255 0.425 0.311 0.425 - 0.792 - 0.226 0.255 -
Alluvium
Cu Conc (ug/L) 4 8 12 5 10 10 5 10 5 POTFW (mg/ton) 412 824 1,236 515 1,030 1,030 - 515 1,030 515 IOQC (lb/ft3) 0.113 0.226 0.34 0.142 0.283 0.283 - 0.142 0.283 0.142 AOQC (lb/ft3) 0.113 0.226 0.34 0.142 0.283 0.283 - 0.142 0.283 0.142
Mining Milling Metal
Cu Conc (ug/L) 275 346 750 50 150 25 275 25 POTFW (mg/ton) 28,325 - 35,600 77,250 5,150 15,450 2,575 28,325 - 2,575 IOQC (lb/ft3) 7.783 - 9.78 21.225 1.415 4.245 0.708 7.783 - 0.708 AOQC (lb/ft3) 7.783 - 9.78 21.225 1.415 4.245 0.708 7.783 - 0.708
Sedimentary
Cu Conc (ug/L) 11 23 12 10 20 14 14 20 POTFW (mg/ton) 1133 2369 1236 1030 2060 1442 - 1442 2060 - IOQC (lb/ft3) 0.311 0.651 0.34 0.283 0.566 0.396 - 0.396 0.566 - AOQC (lb/ft3) 0.311 0.651 0.34 0.283 0.566 0.396 - 0.396 0.566 -
Tuff
Cu Conc (ug/L) 15 19.0 19 40.0 22 47.4 12.0 20.0 POTFW (mg/ton) - 1,545 1,957 1,957 4,120 2,266 4,878 1,236 2,060 - IOQC (lb/ft3) - 0.425 0.538 0.538 1.132 0.623 1.34 0.34 0.566 - AOQC (lb/ft3) - 0.425 0.538 0.538 1.132 0.623 1.34 0.34 0.566 -
Urban Industrial
Cu Conc (ug/L) 15.0 15.0 15.0 POTFW (mg/ton) - - - 1,545 1,545 1,545 - - - - IOQC (lb/ft3) - - - 0.425 0.425 0.425 - - - - AOQC (lb/ft3) - - - 0.425 0.425 0.425 - - - -
The water quality calibrations were performed at each water quality monitoring station located at each subbasin outlet and at several stations located in the Queen Creek main stem (Table 3-1). The water quality calibrations compare the simulated copper time-series and the observed dissolved copper

Queen Creek TMDL Modeling Report
January 2013 Page 21
observations during the period spanning from November 29, 2007 to February 27, 2008. Figures 3-3 and 3-4 depict the dissolved copper calibration in Oak Flat (Segment 22) and Queen Creek (Segment 92), respectively. The complete dissolved copper calibration results are presented in Appendix B indicating a good agreement between observed and simulated concentrations. 3.2.1 Existing Conditions Scenarios The calibrated HSPF model for hydrology and dissolved copper is then used to estimate pollutant loads under various scenarios. One of the key challenges in the TMDL development process is how to define the critical conditions for a receiving waterbody impacted by nonpoint sources. Knowledge of the critical conditions could help identify the potential feasible allocation scenarios needed to be taken to meet water quality standards. The common approach used to define the critical conditions where nonpoint source pollution dictates the water quality is to use longer simulation period and average the resulting water quality loads. Using longer simulation periods assume that the most critical conditions will be captured during the selected representative hydrologic period. However, such an approach might not applicable in the Queen Creek watershed due the intermittent hydrology where the creek flows continuously only at certain times of the year. An event-based approach to address the critical conditions is deemed more adequate to use in the Queen Creek watershed. This event-based approach explicitly addresses the critical conditions as a combination of stream flow linked to various magnitudes of storm events using several frequencies of occurrences. The key advantage of the event-based approach over continuous simulation is its ability to examine impacts of management options under synthetic design storms; which can be used to assess the risk associated with a specific pollutant load reduction scenario. Thus, the resulting nonpoint source management plan could be linked with its corresponding return period to determine the reasonable assurance of any future TMDL implementation. In order to estimate the pollutant loads at various storm intensities and under varying critical conditions and frequencies, a series of synthetic storms was imposed over the calibrated Queen Creek watershed model. In all, five storms are modeled ranging from the 2-year 1-hour storm event to the 100-year 24-hour event. The 2-year, 1-hour event precipitation total was distributed using the SCS Type II curve. The four other 24-hour events were distributed by the SCS Type IA curve, which is judged to be more representative of the larger winter storms observed in Arizona (ADEQ, 2010). The synthetic storm scenarios modeling period begins on February 1st, 2008 and runs through August 30, 2008. The month of February is the model initializing and stabilization period, and is populated with actual weather data, and the synthetic storm begin on March 1st with the remainder of each month is dry (ADEQ, 2010. Therefore, each synthetic storm scenario was run separately and all begin on March 1st.

Queen Creek TMDL Modeling Report
January 2013 Page 22
Figure 3-3: Observed and Simulated Dissolved Copper at Model-Segment 22 – Oak Flat
Figure 3-4: Observed and Simulated Dissolved Copper at Model-Segment 92 – Queen Creek
0.001
0.01
0.1
1
11/29/2007 12/9/2007 12/19/2007 12/29/2007 1/8/2008 1/18/2008 1/28/2008 2/7/2008 2/17/2008 2/27/2008
Dis
solv
ed C
u (m
g/L
)Segment 22 - Oak Flat
Observed CuD Simulated CuD

Queen Creek TMDL Modeling Report
January 2013 Page 23
Data on precipitation depths and distributions for the synthetic storms were obtained from the National Oceanic and Atmospheric Administration (NOAA) Precipitation-Frequency Atlas of the United States, NOAA Atlas 14, Volume 1, Version 4. Table 3-3 presents the characteristics of the synthetic storms. In addition to rainfall data, the HSPF model requires additional data such potential evapotranspiration and air temperature; these additional meteorological data were extracted from similar time periods from the ADEQ 2007 weather data set used for the calibration. Similar to the HSPF model calibration, the synthetic storm weather data was distributed to each subbasin based on proximity to the rain gage and elevation. The synthetic storms conditions were then imposed on the calibrated HSPF model to implement the Existing Conditions Scenario.
Table 3-3: Characteristics of the Synthetic Storms
Storm Event Return Period and Duration
SCS Precipitation Distribution Type
Omya Rain Gage Precipitation Depth
(inches)
Boyce Rain Gage Precipitation Depth
(inches) 100-yr, 24-hr IA 6.20 4.64 25-yr, 24-hr IA 4.89 3.67 10-yr, 24-hr IA 4.08 3.06 2-yr, 24-hr IA 2.78 2.08 2-yr, 1-hr II 1.18 0.99
The resulting 24-hour average dissolved copper concentrations and the 24-hour loads are depicted for each subbasin and synthetic storm in Tables 3-4 and 3-5 respectively. Under each synthetic storm condition, the compliance with the A&Ww acute and chronic criteria was assessed at each representative model-segment using the average observed hardness and the 24-hour average predicted copper concentration (Table 3-4).
Table 3-4: Existing Conditions 24-Hour Average Dissolved Copper Concentrations (µg/L)
Subwatershed Average
Hardness (mg/L)
Acute Criterion
(ug/L)
Chronic Criterion
(ug/L)
Existing Conditions 2Yr 1H
2Yr 24H
10Yr 24H
25Yr 24H
100Yr24H
Oak Flat Seg 22 26.4 3.8 2.9 35.1 32.7 33.2 33.6 35.0 QC Hwy 60 Seg 17 103 13.8 9.2 20.6 18.6 18.8 18.8 19.2 QC Magma Avenue Seg 91 60 8.3 5.8 23.4 22.9 22.1 22.8 23.6 QC Mary Avenue Seg 38 90 12.2 8.2 22.3 13.5 16.9 17.3 18.6 QC below Mine Disch. Seg 92 96 12.9 8.6 12.5 0.8 12.3 14.1 15.4 Apex Wash Seg 50 182 23.6 14.9 13.1 3.9 11.4 13.0 14.5 QC Arboretum Seg 47 373 46.5 27.6 4.7 7.0 11.5 12.6 13.7 Silver King Wash Seg 45 257 32.7 20.1 14.3 9.1 10.1 10.3 10.5 Happy Camp Canyon Seg 42 400 49.6 29.3 10.2 10.6 13.0 14.5 15.3 Arnet Creek Seg 46 98 13.2 8.8 9.0 4.3 5.7 5.9 6.3 Alamo Canyon Seg 49 115 15.3 10.1 6.8 6.9 8.0 8.6 8.8 Potts Canyon Seg 30 120 16.0 10.5 10.6 6.0 7.3 7.3 7.4 Reymert Wash Seg 28 400 49.6 29.3 5.7 6.8 7.8 8.5 8.9 QC Outlet Seg 25 109 14.6 9.6 14.4 12.4 12.1 12.3 12.4
Average Concentration Exceeds Chronic Criterion Average Concentration

Queen Creek TMDL Modeling Report
January 2013 Page 24
The dissolved copper compliance analysis (Table 3-4) is performed at each subbasin outlet and along representative monitoring stations (model segments) along the Queen Creek main stem. In other words, the resulting water quality at each subbasin outlet is considered representative of the water quality conditions within the whole subbasin. For instance, the concentrations and loads at model-segment 22 (Oak Flat Subbasin) take into account all the hydrologic and water quality processes occurring in all the upstream segments including model-segments 23, and 24 that feed into model-segment 22. The reported loads at subbasin outlet cannot be considered as the cumulative loads from the upstream segments in the subbasin, since the nature of a watershed model is to transport subsequently all these loads and account for all the sources (addition/increase of a load; e.g., nonpoint source loads) and sinks (decrease of a load; e.g. transmission losses, and adsorption to suspended sediment, etc…) occurring in each of the upstream segments. This is the essence of a watershed-basis analysis when using a model such as HSPF that simulates hydrology and pollutant processes at each model segment and transport the flow and pollutant load to each subsequent segment and down to the outlet of the subbasin and ultimately to the outlet of the entire Queen Creek watershed. Presenting the modeling results at the outlet of a subbasin or a watershed is the recommended approach to use in watershed-based studies.
Table 3-5: Existing Conditions 24-Hour Average Dissolved Copper Loads (kg)
Subbasin/Modeling Segment Existing Conditions 2Y-1Hr 2Y-24Hr 10Y-24Hr 25Y-24Hr 100Y-24Hr
Oak Flat Seg 22 0.197 0.243 1.372 2.356 3.950 QC Hwy 60 Seg 17 0.040 0.080 0.704 1.318 2.306 QC Magma Avenue Seg 91 0.259 0.330 2.220 4.166 7.573 QC Mary Avenue Seg 38 0.255 0.300 2.151 4.070 7.472 QC below Mine Disch. Seg 92 0.079 0.003 1.118 2.906 6.230 Apex Wash Seg 50 0.023 0.004 0.086 0.236 0.569 QC Arboretum Seg 47 0.008 0.001 0.352 1.549 4.861 Silver King Wash Seg 45 0.021 0.004 0.060 0.148 0.524 Happy Camp Canyon Seg 42 0.028 0.004 0.031 0.161 0.673 Arnet Creek Seg 46 0.024 0.005 0.164 0.766 2.528 Alamo Canyon Seg 49 0.017 0.003 0.025 0.116 0.484 Potts Canyon Seg 30 0.097 0.006 0.370 0.723 1.745 Reymert Wash Seg 28 0.008 0.002 0.013 0.061 0.259 QC Outlet Seg 25 0.101 0.007 0.356 1.497 6.958
The dissolved copper concentrations and loads resulting from the five synthetic storms are presented at the outlet of each subbasin and at several representative model-segments in the main stem of Queen Creek including the watershed outlet (highlighted in green in Tables 3-5). The compliance analysis indicates that under all five synthetic storm conditions, the upper reaches (model-segments 22, 17, 91, and 38) of Queen Creek will exhibit exceedances of the acute and chronic dissolved copper criteria under all five synthetic storms conditions. Because of the significant transmission losses of flow and pollutant loads in the Queen Creek watershed, the intensity, duration, and return period of each synthetic storm affect differently the dissolved copper loads at downstream model-segments in the main stem of Queen Creek. This is indicated in Table 3-5 where under low intensity storm events, the copper loads decrease along the Queen Creek main stem,
Queen Creek TMDL Modeling Report
January 2013 Page 25
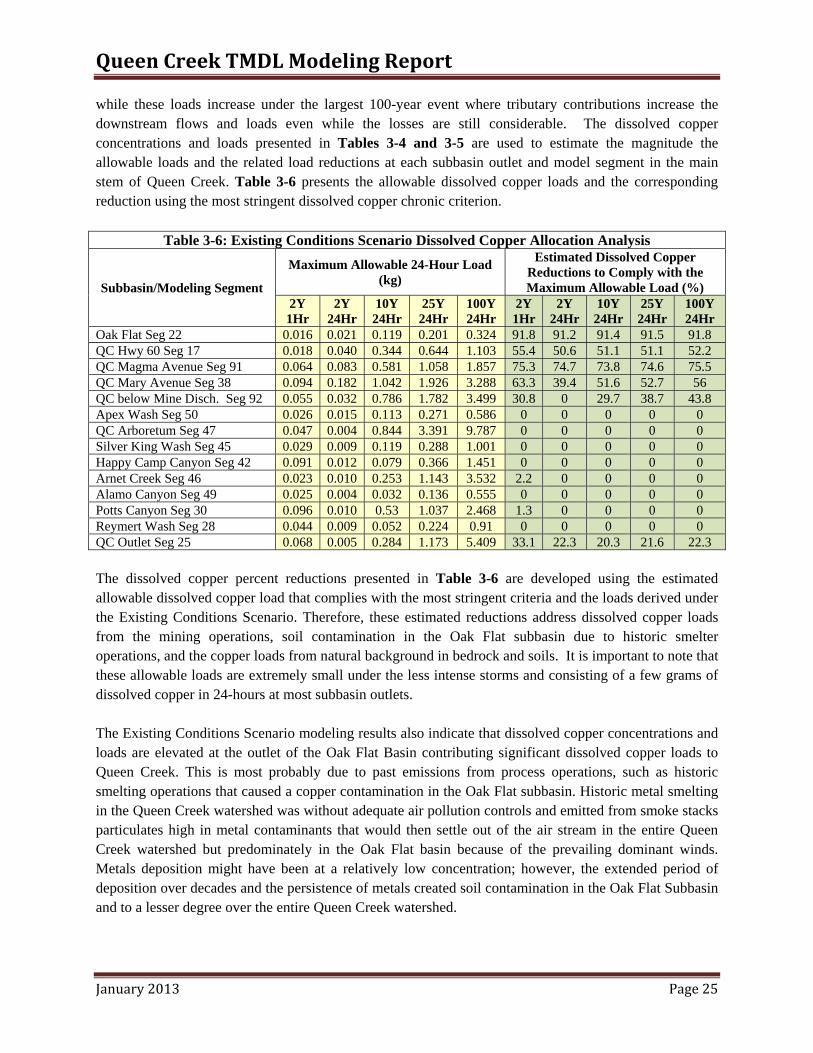
while these loads increase under the largest 100-year event where tributary contributions increase the downstream flows and loads even while the losses are still considerable. The dissolved copper concentrations and loads presented in Tables 3-4 and 3-5 are used to estimate the magnitude the allowable loads and the related load reductions at each subbasin outlet and model segment in the main stem of Queen Creek. Table 3-6 presents the allowable dissolved copper loads and the corresponding reduction using the most stringent dissolved copper chronic criterion.
Table 3-6: Existing Conditions Scenario Dissolved Copper Allocation Analysis
Subbasin/Modeling Segment
Maximum Allowable 24-Hour Load (kg)
Estimated Dissolved Copper Reductions to Comply with the Maximum Allowable Load (%)
2Y 1Hr
2Y 24Hr
10Y 24Hr
25Y 24Hr
100Y 24Hr
2Y 1Hr
2Y 24Hr
10Y 24Hr
25Y 24Hr
100Y 24Hr
Oak Flat Seg 22 0.016 0.021 0.119 0.201 0.324 91.8 91.2 91.4 91.5 91.8 QC Hwy 60 Seg 17 0.018 0.040 0.344 0.644 1.103 55.4 50.6 51.1 51.1 52.2 QC Magma Avenue Seg 91 0.064 0.083 0.581 1.058 1.857 75.3 74.7 73.8 74.6 75.5 QC Mary Avenue Seg 38 0.094 0.182 1.042 1.926 3.288 63.3 39.4 51.6 52.7 56 QC below Mine Disch. Seg 92 0.055 0.032 0.786 1.782 3.499 30.8 0 29.7 38.7 43.8 Apex Wash Seg 50 0.026 0.015 0.113 0.271 0.586 0 0 0 0 0 QC Arboretum Seg 47 0.047 0.004 0.844 3.391 9.787 0 0 0 0 0 Silver King Wash Seg 45 0.029 0.009 0.119 0.288 1.001 0 0 0 0 0 Happy Camp Canyon Seg 42 0.091 0.012 0.079 0.366 1.451 0 0 0 0 0 Arnet Creek Seg 46 0.023 0.010 0.253 1.143 3.532 2.2 0 0 0 0 Alamo Canyon Seg 49 0.025 0.004 0.032 0.136 0.555 0 0 0 0 0 Potts Canyon Seg 30 0.096 0.010 0.53 1.037 2.468 1.3 0 0 0 0 Reymert Wash Seg 28 0.044 0.009 0.052 0.224 0.91 0 0 0 0 0 QC Outlet Seg 25 0.068 0.005 0.284 1.173 5.409 33.1 22.3 20.3 21.6 22.3 The dissolved copper percent reductions presented in Table 3-6 are developed using the estimated allowable dissolved copper load that complies with the most stringent criteria and the loads derived under the Existing Conditions Scenario. Therefore, these estimated reductions address dissolved copper loads from the mining operations, soil contamination in the Oak Flat subbasin due to historic smelter operations, and the copper loads from natural background in bedrock and soils. It is important to note that these allowable loads are extremely small under the less intense storms and consisting of a few grams of dissolved copper in 24-hours at most subbasin outlets. The Existing Conditions Scenario modeling results also indicate that dissolved copper concentrations and loads are elevated at the outlet of the Oak Flat Basin contributing significant dissolved copper loads to Queen Creek. This is most probably due to past emissions from process operations, such as historic smelting operations that caused a copper contamination in the Oak Flat subbasin. Historic metal smelting in the Queen Creek watershed was without adequate air pollution controls and emitted from smoke stacks particulates high in metal contaminants that would then settle out of the air stream in the entire Queen Creek watershed but predominately in the Oak Flat basin because of the prevailing dominant winds. Metals deposition might have been at a relatively low concentration; however, the extended period of deposition over decades and the persistence of metals created soil contamination in the Oak Flat Subbasin and to a lesser degree over the entire Queen Creek watershed.
Queen Creek TMDL Modeling Report
January 2013 Page 26
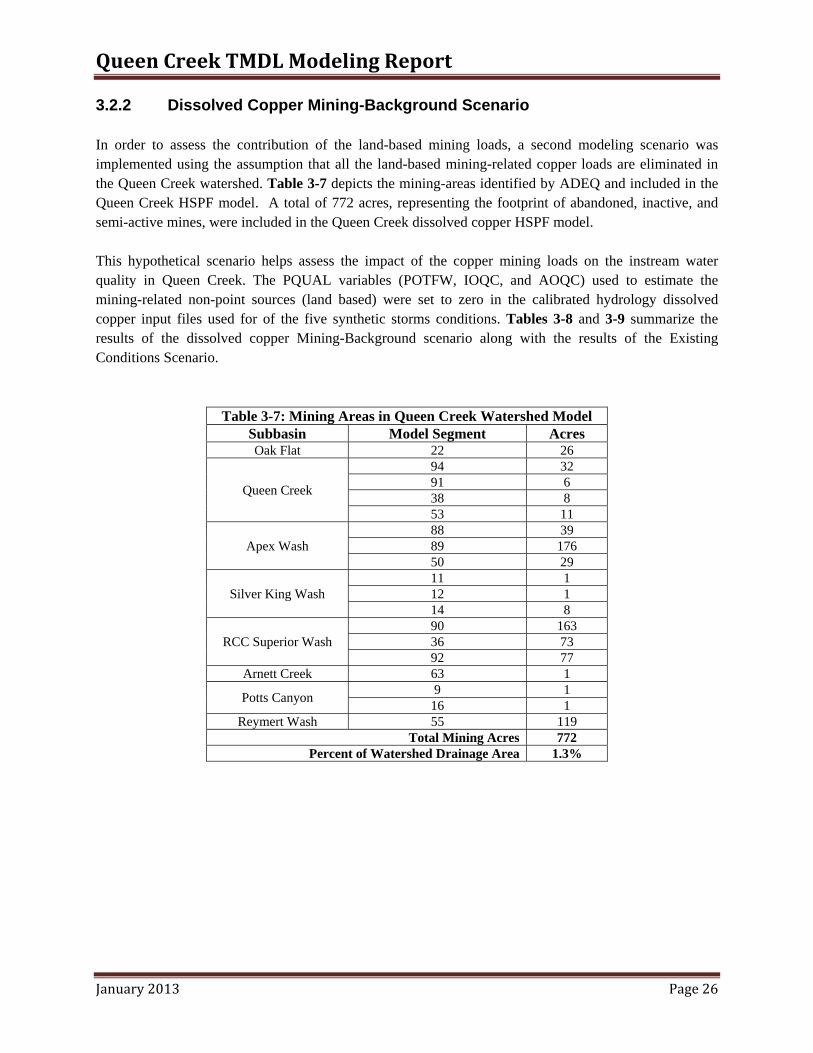
3.2.2 Dissolved Copper Mining-Background Scenario In order to assess the contribution of the land-based mining loads, a second modeling scenario was implemented using the assumption that all the land-based mining-related copper loads are eliminated in the Queen Creek watershed. Table 3-7 depicts the mining-areas identified by ADEQ and included in the Queen Creek HSPF model. A total of 772 acres, representing the footprint of abandoned, inactive, and semi-active mines, were included in the Queen Creek dissolved copper HSPF model. This hypothetical scenario helps assess the impact of the copper mining loads on the instream water quality in Queen Creek. The PQUAL variables (POTFW, IOQC, and AOQC) used to estimate the mining-related non-point sources (land based) were set to zero in the calibrated hydrology dissolved copper input files used for of the five synthetic storms conditions. Tables 3-8 and 3-9 summarize the results of the dissolved copper Mining-Background scenario along with the results of the Existing Conditions Scenario.
Table 3-7: Mining Areas in Queen Creek Watershed Model Subbasin Model Segment Acres Oak Flat 22 26
Queen Creek
94 32 91 6 38 8 53 11
Apex Wash 88 39 89 176 50 29
Silver King Wash 11 1 12 1 14 8
RCC Superior Wash 90 163 36 73 92 77
Arnett Creek 63 1
Potts Canyon 9 1 16 1
Reymert Wash 55 119 Total Mining Acres 772
Percent of Watershed Drainage Area 1.3%

Queen Creek TMDL Modeling Report
January 2013 Page 27
Table 3-8: Existing Conditions and Mining-Background Scenarios - 24-Hour Average Dissolved Concentrations (µg/L)
Subwatershed Existing Conditions Scenario Mining-Background Scenario
Without Land-Based Mining Loads 2Yr 1H
2Yr 24H
10Yr 24H
25Yr 24H
100Yr24H
2Yr 1H
2Yr 24H
10Yr24H
25Yr24H
100Yr 24H
Oak Flat Seg 22 35.1 32.7 33.2 33.6 35.0 29.3 26.3 25.9 25.7 26.2 QC Hwy 60 Seg 17 20.6 18.6 18.8 18.8 19.2 19.6 17.8 18.0 18.0 18.4 QC Magma Avenue Seg 91 23.4 22.9 22.1 22.8 23.6 21.7 19.7 19.2 19.5 20.0 QC Mary Avenue Seg 38 22.3 13.5 16.9 17.3 18.6 20.3 11.6 14.6 15.0 15.9 QC below Mine Disch. Seg 92 12.5 0.8 12.3 14.1 15.4 11.0 0.7 10.6 12.2 13.2 Apex Wash Seg 50 13.1 3.9 11.4 13.0 14.5 1.8 0.5 1.7 2.0 2.2 QC Arboretum Seg 47 4.7 7.0 11.5 12.6 13.7 4.5 7.0 9.9 11.1 12.1 Silver King Wash Seg 45 14.3 9.1 10.1 10.3 10.5 13.6 8.7 9.5 9.6 9.8 Happy Camp Canyon Seg 42 10.2 10.6 13.0 14.5 15.3 10.2 10.6 13.0 14.5 15.3 Arnet Creek Seg 46 9.0 4.3 5.7 5.9 6.3 9.0 4.3 5.7 5.9 6.2 Alamo Canyon Seg 49 6.8 6.9 8.0 8.6 8.8 6.8 6.9 8.0 8.6 8.8 Potts Canyon Seg 30 10.6 6.0 7.3 7.3 7.4 10.6 6.0 7.2 7.3 7.4 Reymert Wash Seg 28 5.7 6.8 7.8 8.5 8.9 5.1 6.0 7.1 7.7 7.9 QC Outlet Seg 25 14.4 12.4 12.1 12.3 12.4 14.2 12.2 12.0 12.0 12.1
Exceeds Chronic Criterion Exceeds Acute Criteria
Table 3-9: Existing Conditions and No-Mining Background Scenarios - 24-Hour Dissolved Copper Loads (kg)
Subwatershed Existing Conditions Scenario Mining-Background Scenario
Without Land-Based Mining Loads 2Yr 1H
2Yr 24H
10Yr 24H
25Yr 24H
100Yr 24H
2Yr 1H
2Yr 24H
10Yr 24H
25Yr 24H
100Yr 24H
Oak Flat Seg 22 0.197 0.243 1.372 2.356 3.950 0.195 0.240 1.356 2.328 3.904 QC Hwy 60 Seg 17 0.040 0.080 0.704 1.318 2.306 0.038 0.076 0.676 1.265 2.213 QC Magma Avenue Seg 91 0.259 0.330 2.220 4.166 7.573 0.255 0.324 2.175 4.083 7.428 QC Mary Avenue Seg 38 0.255 0.300 2.151 4.070 7.472 0.251 0.295 2.107 3.990 7.329 QC below Mine Disch. Seg 92 0.079 0.003 1.118 2.906 6.230 0.077 0.003 1.096 2.843 6.080 Apex Wash Seg 50 0.023 0.004 0.086 0.236 0.569 0.004 0.001 0.013 0.037 0.091 QC Arboretum Seg 47 0.008 0.001 0.352 1.549 4.861 0.008 0.001 0.346 1.518 4.668 Silver King Wash Seg 45 0.021 0.004 0.060 0.148 0.524 0.020 0.004 0.055 0.137 0.484 Happy Camp Canyon Seg 42 0.028 0.004 0.031 0.161 0.673 0.028 0.004 0.031 0.161 0.673 Arnet Creek Seg 46 0.024 0.005 0.164 0.766 2.528 0.024 0.005 0.164 0.766 2.526 Alamo Canyon Seg 49 0.017 0.003 0.025 0.116 0.484 0.017 0.003 0.025 0.116 0.484 Potts Canyon Seg 30 0.097 0.006 0.370 0.723 1.745 0.097 0.006 0.370 0.723 1.743 Reymert Wash Seg 28 0.008 0.002 0.013 0.061 0.259 0.007 0.001 0.011 0.054 0.229 QC Outlet Seg 25 0.101 0.007 0.356 1.497 6.958 0.101 0.007 0.355 1.485 6.813 Table 3-8 indicates that both the existing-conditions and Mining-Background Scenarios have a similar impairment pattern mainly situated in the upper reaches of the watershed. This scenario indicates that the dissolved copper load contributions from the mining areas are not a major contributor and their complete removal will not impact the impairments predicted under the Existing Conditions Scenario. In other words, the simulated dissolved copper mining loads are relatively small when compared to the other contributions such as the copper in natural rock and soils and the historic smelter copper fallout in the Oak Flat subbasin and to some extent also the smelter copper fallout in the entire Queen Creek watershed.

Queen Creek TMDL Modeling Report
January 2013 Page 28
Table 3-10 Subbasin Dissolved Load Percent Contribution from Mining Areas
Subbasin 2Y-1H 2Y-24H 10Y-24H 25Y-24H 100Y-24H Oak Flat Seg 22 1.3% 1.2% 1.2% 1.2% 1.2% QC Hwy 60 Seg 17 3.9% 4.0% 4.0% 4.0% 4.0% QC Magma Avenue Seg 91 1.6% 1.8% 2.0% 2.0% 1.9% QC Mary Avenue Seg 38 1.6% 1.8% 2.0% 2.0% 1.9% QC below Mine Disch. Seg 92 2.7% 9.6% 2.0% 2.2% 2.4% Apex Wash Seg 50 83.7% 85.6% 84.5% 84.2% 84.0% QC Arboretum Seg 47 1.6% 0.0% 1.7% 2.0% 4.0% Silver King Wash Seg 45 7.1% 7.4% 8.0% 7.7% 7.7% Happy Camp Canyon Seg 42 0.0% 0.0% 0.0% 0.0% 0.0% Arnet Creek Seg 46 0.1% 0.2% 0.1% 0.1% 0.1% Alamo Canyon Seg 49 0.0% 0.0% 0.0% 0.0% 0.0% Potts Canyon Seg 30 0.1% 0.1% 0.0% 0.1% 0.1% Reymert Wash Seg 28 8.4% 12.0% 10.4% 10.6% 11.3% QC Outlet Seg 25 0.3% 1.3% 0.1% 0.8% 2.1%
Table 3-10 presents the load contribution (%) of dissolved copper from the mining areas at each subbasin outlet and at each model segment along the Queen Creek main stem. Tables 3-9 and 3-10 indicate that the transported dissolved copper mining loads contributions at each subbasin outlet are extremely small at most subbasins in the Queen Creek watershed. 3.2.3 Oak Flat Dissolved Copper Scenario An additional modeling scenario was implemented using the assumption that the dissolved copper loads from the Oak Flat subbasin are low enough that the resulting dissolved copper concentration at the Oak Flat subwatershed outlet (model-segment 22) meets the applicable standards. Such scenario will help evaluate the impact of the Oak Flat subbasin loads on the dissolved copper compliance at Magma Avenue (model-segment 91) and Mary Avenue (model-segment 38) and at downstream model segments located on the main stem of Queen Creek. The PQUAL variables in the Oak Flat subwatershed were iteratively reduced until the resulting concentrations at the subbasin outlet (model-segment 22) comply with the applicable standards. Table 3-11 depicts the resulting simulated dissolved copper concentrations and compliance analysis under the Oak Flat Scenario and the Existing Conditions Scenario. Reductions of the copper loads from smelter fall out will only impact segments located on the Queen Creek main stem downstream of the Oak Flat subbasin (highlighted in red in the subsequent tables). Table 3-11 indicates that the reductions of copper smelter fallout loads in the Oak Flat subbasin will have a considerable impact on the downstream concentrations in segments located on the main stem of Queen Creek. However, these reductions in copper smelter fallout loads are not significant enough to be the sole cause of the impairment in the upper segments of the Queen Creek watershed. In fact and as shown in Table 3-11, significant decreases in the 24-hour average concentrations are predicted under the Oak flat scenario in the segment downstream of the Oak flat subbasin (model-segments 91, 38, and 92). However, the resulting concentrations in these segments are not in compliance with the acute and/or chronic criteria. This is also due to extremely low hardness of the water observed at these segments resulting in very stringent copper criteria.

Queen Creek TMDL Modeling Report
January 2013 Page 29
Table 3-11: Existing Conditions and Oak Flat Scenarios - 24-Hour Average Dissolved
Concentrations (µg/L)
Subwatershed Existing Conditions Scenario Oak Flat Scenario - Without Copper
Smelter Fallout Loads 2Yr 1H
2Yr 24H
10Yr 24H
25Yr 24H
100Yr24H
2Yr 1H
2Yr 24H
10Yr24H
25Yr24H
100Yr 24H
Oak Flat Seg 22 35.1 32.7 33.2 33.6 35.0 2.72 2.71 2.76 2.78 2.90 QC Hwy 60 Seg 17 20.6 18.6 18.8 18.8 19.2 20.6 18.6 18.8 18.8 19.2 QC Magma Avenue Seg 91 23.4 22.9 22.1 22.8 23.6 15.7 9.7 11.5 11.7 11.9 QC Mary Avenue Seg 38 22.3 13.5 16.9 17.3 18.6 14.3 5.8 8.9 9.4 10.0 QC below Mine Disch. Seg 92 12.5 0.8 12.3 14.1 15.4 11.0 0.8 6.6 8.0 8.9 Apex Wash Seg 50 13.1 3.9 11.4 13.0 14.5 13.1 3.9 11.4 13.0 14.5 QC Arboretum Seg 47 4.7 7.0 11.5 12.6 13.7 4.3 7.0 6.5 8.0 9.2 Silver King Wash Seg 45 14.3 9.1 10.1 10.3 10.5 14.3 9.1 10.1 10.3 10.5 Happy Camp Canyon Seg 42 10.2 10.6 13.0 14.5 15.3 10.2 10.6 13.0 14.5 15.3 Arnet Creek Seg 46 9.0 4.3 5.7 5.9 6.3 9.0 4.3 5.7 5.9 6.3 Alamo Canyon Seg 49 6.8 6.9 8.0 8.6 8.8 6.8 6.9 8.0 8.6 8.8 Potts Canyon Seg 30 10.6 6.0 7.3 7.3 7.4 10.6 6.0 7.3 7.3 7.4 Reymert Wash Seg 28 5.7 6.8 7.8 8.5 8.9 5.7 6.8 7.8 8.5 8.9 QC Outlet Seg 25 14.4 12.4 12.1 12.3 12.4 14.4 12.4 12.1 11.7 11.7
Exceeds Chronic Criterion Exceeds Acute Criteria
Table 3-12: Existing Conditions and Oak Flat Scenarios 24-Hour Dissolved Copper Loads (kg)
Subwatershed Existing Conditions Scenario Oak Flat Scenario
2Yr 1H
2Yr 24H
10Yr 24H
25Yr 24H
100Yr 24H
2Yr 1H
2Yr 24H
10Yr 24H
25Yr 24H
100Yr 24H
Oak Flat Seg 22 0.197 0.243 1.372 2.356 3.950 0.016 0.020 0.113 0.194 0.325 QC Hwy 60 Seg 17 0.040 0.080 0.704 1.318 2.306 0.040 0.080 0.704 1.318 2.306 QC Magma Avenue Seg 91 0.259 0.330 2.220 4.166 7.573 0.078 0.115 0.975 2.021 3.976 QC Mary Avenue Seg 38 0.255 0.300 2.151 4.070 7.472 0.077 0.102 0.936 1.966 3.922 QC below Mine Disch. Seg 92 0.079 0.003 1.118 2.906 6.230 0.031 0.003 0.477 1.460 3.489 Apex Wash Seg 50 0.023 0.004 0.086 0.236 0.569 0.023 0.004 0.086 0.236 0.569 QC Arboretum Seg 47 0.008 0.001 0.352 1.549 4.861 0.007 0.001 0.126 0.763 2.967 Silver King Wash Seg 45 0.021 0.004 0.060 0.148 0.524 0.021 0.004 0.060 0.148 0.524 Happy Camp Canyon Seg 42 0.028 0.004 0.031 0.161 0.673 0.028 0.004 0.031 0.161 0.673 Arnet Creek Seg 46 0.024 0.005 0.164 0.766 2.528 0.024 0.005 0.164 0.766 2.528 Alamo Canyon Seg 49 0.017 0.003 0.025 0.116 0.484 0.017 0.003 0.025 0.116 0.484 Potts Canyon Seg 30 0.097 0.006 0.370 0.723 1.745 0.097 0.006 0.370 0.723 1.745 Reymert Wash Seg 28 0.008 0.002 0.013 0.061 0.259 0.008 0.002 0.013 0.061 0.259 QC Outlet Seg 25 0.101 0.007 0.356 1.497 6.958 0.101 0.007 0.356 1.218 5.867 Table 3-12 presents the resulting 24-hour dissolved copper loads under the Existing Conditions and the Oak Flat scenarios. Table 3-13 uses the results presented in Table 3-13 and summarizes the percent contribution of dissolved copper smelter fallout loads in the model-segments downstream of the Oak Flat subbasin.
Queen Creek TMDL Modeling Report
January 2013 Page 30
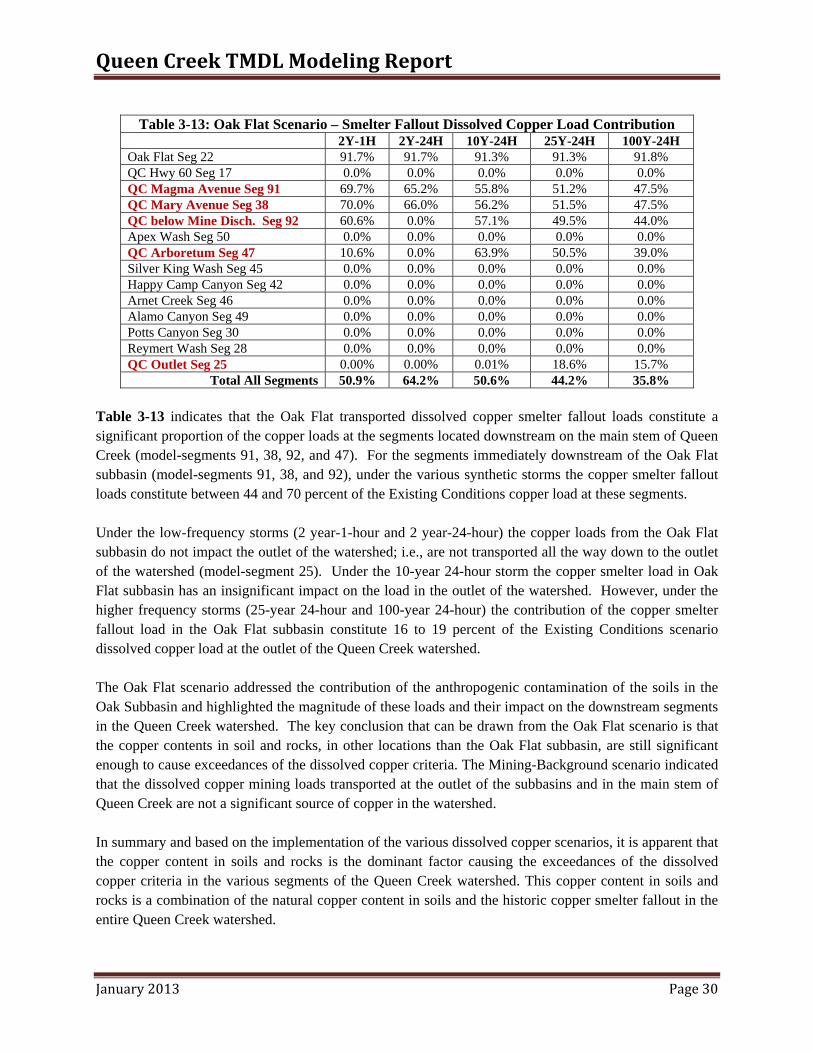
Table 3-13: Oak Flat Scenario – Smelter Fallout Dissolved Copper Load Contribution
2Y-1H 2Y-24H 10Y-24H 25Y-24H 100Y-24H Oak Flat Seg 22 91.7% 91.7% 91.3% 91.3% 91.8% QC Hwy 60 Seg 17 0.0% 0.0% 0.0% 0.0% 0.0% QC Magma Avenue Seg 91 69.7% 65.2% 55.8% 51.2% 47.5% QC Mary Avenue Seg 38 70.0% 66.0% 56.2% 51.5% 47.5% QC below Mine Disch. Seg 92 60.6% 0.0% 57.1% 49.5% 44.0% Apex Wash Seg 50 0.0% 0.0% 0.0% 0.0% 0.0% QC Arboretum Seg 47 10.6% 0.0% 63.9% 50.5% 39.0% Silver King Wash Seg 45 0.0% 0.0% 0.0% 0.0% 0.0% Happy Camp Canyon Seg 42 0.0% 0.0% 0.0% 0.0% 0.0% Arnet Creek Seg 46 0.0% 0.0% 0.0% 0.0% 0.0% Alamo Canyon Seg 49 0.0% 0.0% 0.0% 0.0% 0.0% Potts Canyon Seg 30 0.0% 0.0% 0.0% 0.0% 0.0% Reymert Wash Seg 28 0.0% 0.0% 0.0% 0.0% 0.0% QC Outlet Seg 25 0.00% 0.00% 0.01% 18.6% 15.7%
Total All Segments 50.9% 64.2% 50.6% 44.2% 35.8% Table 3-13 indicates that the Oak Flat transported dissolved copper smelter fallout loads constitute a significant proportion of the copper loads at the segments located downstream on the main stem of Queen Creek (model-segments 91, 38, 92, and 47). For the segments immediately downstream of the Oak Flat subbasin (model-segments 91, 38, and 92), under the various synthetic storms the copper smelter fallout loads constitute between 44 and 70 percent of the Existing Conditions copper load at these segments. Under the low-frequency storms (2 year-1-hour and 2 year-24-hour) the copper loads from the Oak Flat subbasin do not impact the outlet of the watershed; i.e., are not transported all the way down to the outlet of the watershed (model-segment 25). Under the 10-year 24-hour storm the copper smelter load in Oak Flat subbasin has an insignificant impact on the load in the outlet of the watershed. However, under the higher frequency storms (25-year 24-hour and 100-year 24-hour) the contribution of the copper smelter fallout load in the Oak Flat subbasin constitute 16 to 19 percent of the Existing Conditions scenario dissolved copper load at the outlet of the Queen Creek watershed. The Oak Flat scenario addressed the contribution of the anthropogenic contamination of the soils in the Oak Subbasin and highlighted the magnitude of these loads and their impact on the downstream segments in the Queen Creek watershed. The key conclusion that can be drawn from the Oak Flat scenario is that the copper contents in soil and rocks, in other locations than the Oak Flat subbasin, are still significant enough to cause exceedances of the dissolved copper criteria. The Mining-Background scenario indicated that the dissolved copper mining loads transported at the outlet of the subbasins and in the main stem of Queen Creek are not a significant source of copper in the watershed. In summary and based on the implementation of the various dissolved copper scenarios, it is apparent that the copper content in soils and rocks is the dominant factor causing the exceedances of the dissolved copper criteria in the various segments of the Queen Creek watershed. This copper content in soils and rocks is a combination of the natural copper content in soils and the historic copper smelter fallout in the entire Queen Creek watershed.

Queen Creek TMDL Modeling Report
January 2013 Page 31
3.3 Total Lead Model Implementation
The Queen Creek HSPF total lead calibration follows the same strategy as the one for dissolved copper. The QALSD option of the PQAL routine was also used to simulate the land-based washoff of total lead. Using the observed total lead instream observations as a guide (Table 2-3), the PQUAL parameters were estimated iteratively until an acceptable fit is reached between observed and simulated total lead concentrations. Using the hard rock lead data as a guide, the parameters were further refined to achieve comparable observed and simulated average dissolved concentrations. Table 3-14 depicts the final PQUAL value for each soil landuse type within each of the sub-basins in the Queen Creek watershed. The key observation is that the input concentrations of total lead in the interflow and base flow are much lower than the ones for dissolved copper. These concentrations were lowered to mimic the low observed base flow lead concentrations. The detached sediment POTFW values were also adjusted to match the peak total lead values observed during storm events. This is consistent with the observed data indicating that total lead is highly correlated with precipitation events where most of the load is associated with sediments. Figures 3-5 and 3-6 depict the dissolved copper calibration at Oak Flat (model-segment 22) and at Silver King Wash (model-segment 45), respectively. The complete total lead calibration results presented in Appendix C indicate a robust agreement between observed and simulated total lead concentrations. Table 3-14: Total Lead HSPF PQUAL Parameters Summary by Sub-Basin and Soil-Landuse Type
Geology Landuse Parameter Potts
Canyon
Happy Camp
Canyon
Silver King Wash
Apex Wash
RCC Superior
Wash
Queen Creek
Oak Flat
Arnett Creek
Alamo Canyon
Reymert Wash
Pinal Schist
Pb Conc. (ug/L) 2.8 5.0 6.2 2.2 1.0 2.1 POTFW 2,884 5,150 6,386 - - - - 2,266 1,030 2,163
IOQC 0.079 0.142 0.175 0.062 0.028 0.059 AOQC 0.079 0.142 0.175 0.062 0.028 0.059
Apache Group
Pb Conc. (ug/L) 4.0 1.0 2.5 1.0 2.0 2.0 2.4 POTFW 4,120 1,030 2,575 1,030 2,060 2,060 2,472 - -
IOQC 0.113 0.028 0.071 0.028 0.057 0.057 0.068 - - AOQC 0.113 0.028 0.071 0.028 0.057 0.057 0.068 - -
Granite Crystalline
Pb Conc. (ug/L) 1.0 1.5 2.3 2.2 1.4 2.5 POTFW 1,030 - 1,545 - - 2,369 - 2,266 1,442 2,575
IOQC 0.028 - 0.042 - - 0.065 - 0.062 0.040 0.071 AOQC 0.028 - 0.042 - - 0.065 - 0.062 0.040 0.071
Volcanic
Pb Conc. (ug/L) 7.0 1.5 1.0 3.0 7.0 3.6 0.9 POTFW 7,210 1,545 1,030 3,090 7,210 3,708 927 -
IOQC 0.198 0.042 0.028 0.085 0.198 0.102 0.025 - AOQC 0.198 0.042 0.028 0.085 - 0.198 0.102 0.025 -
Alluvium
Pb Conc. (ug/L) 2.0 5.0 3.0 4.9 4.7 4.7 2.0 1.0 1.0 POTFW 2,060 5,150 3,090 5,047 4,841 4,841 - 2,060 1,030 1,030
IOQC 0.057 0.142 0.085 0.139 0.133 0.133 - 0.057 0.028 0.028 AOQC 0.057 0.142 0.085 0.139 0.133 0.133 - 0.057 0.028 0.028
Mining Milling Metal
Pb Conc. (ug/L) 32 290 52.0 50 50 30 14 300 POTFW 32,960 - 2.99E+05 53,560 51500 51500 30900 13905 - 309000
IOQC 0.906 - 8.207 1.472 0.415 1.415 0.849 0.382 - 8.490 AOQC 0.906 - 8.207 1.472 1.415 1.415 0.849 0.382 - 8.490
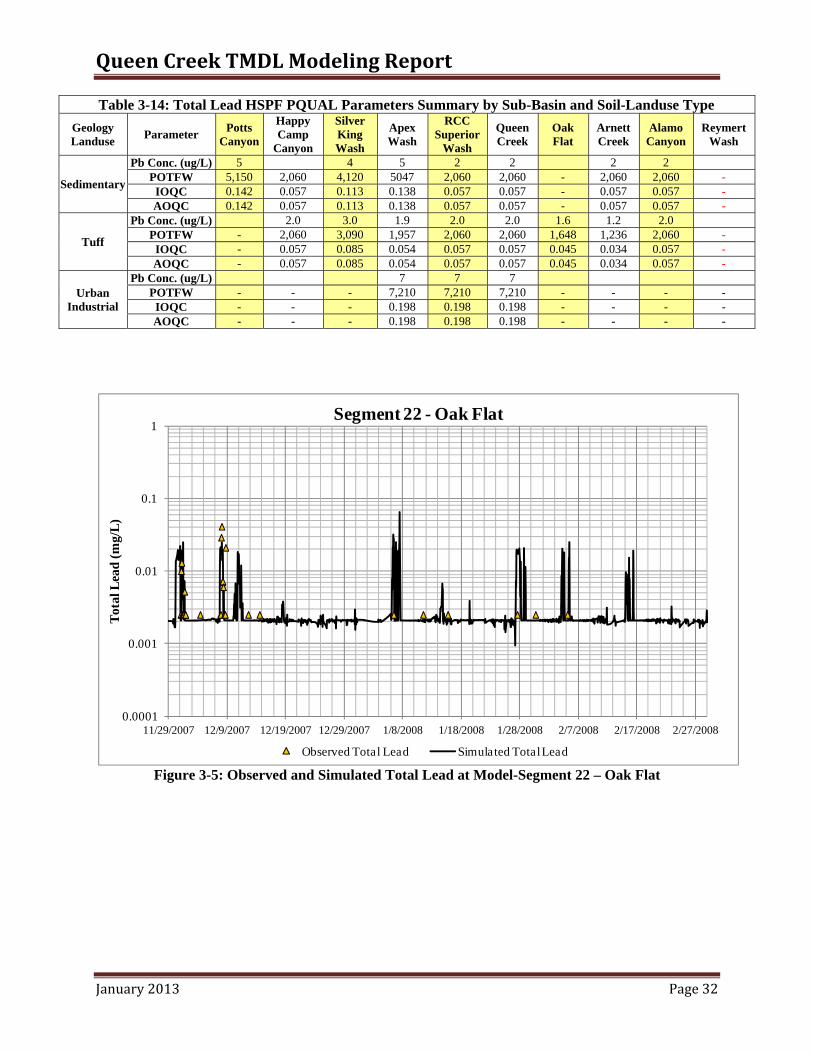
Queen Creek TMDL Modeling Report
January 2013 Page 32
Table 3-14: Total Lead HSPF PQUAL Parameters Summary by Sub-Basin and Soil-Landuse Type Geology Landuse Parameter Potts
Canyon
Happy Camp
Canyon
Silver King Wash
Apex Wash
RCC Superior
Wash
Queen Creek
Oak Flat
Arnett Creek
Alamo Canyon
Reymert Wash
Sedimentary
Pb Conc. (ug/L) 5 4 5 2 2 2 2 POTFW 5,150 2,060 4,120 5047 2,060 2,060 - 2,060 2,060 -
IOQC 0.142 0.057 0.113 0.138 0.057 0.057 - 0.057 0.057 - AOQC 0.142 0.057 0.113 0.138 0.057 0.057 - 0.057 0.057 -
Tuff
Pb Conc. (ug/L) 2.0 3.0 1.9 2.0 2.0 1.6 1.2 2.0 POTFW - 2,060 3,090 1,957 2,060 2,060 1,648 1,236 2,060 -
IOQC - 0.057 0.085 0.054 0.057 0.057 0.045 0.034 0.057 - AOQC - 0.057 0.085 0.054 0.057 0.057 0.045 0.034 0.057 -
Urban Industrial
Pb Conc. (ug/L) 7 7 7 POTFW - - - 7,210 7,210 7,210 - - - -
IOQC - - - 0.198 0.198 0.198 - - - - AOQC - - - 0.198 0.198 0.198 - - - -
Figure 3-5: Observed and Simulated Total Lead at Model-Segment 22 – Oak Flat
0.0001
0.001
0.01
0.1
1
11/29/2007 12/9/2007 12/19/2007 12/29/2007 1/8/2008 1/18/2008 1/28/2008 2/7/2008 2/17/2008 2/27/2008
Tota
l Lea
d (m
g/L)
Segment 22 - Oak Flat
Observed Total Lead Simulated Total Lead

Queen Creek TMDL Modeling Report
January 2013 Page 33
Figure 3-6: Observed and Simulated Total Lead at Model-Segment 45 – Silver King Wash
3.3.1 Total Lead Existing Conditions and Mining-Background Scenarios
Similar to the dissolved copper simulations, the Existing Conditions and the Mining-Background scenarios, described in sections 3.3.1 and 3.3.2, were also implemented for total lead to derive the concentrations and loads under the various synthetic storm conditions. The resulting 24-hour average total lead concentrations and the 24-hour loads are depicted for each subbasin and synthetic storm in Tables 3-15 and 3-16, respectively. Under each scenario and synthetic storm condition, the compliance with the FBC criteria was assessed at each segment using the 24-hour average predicted total lead concentration.
0.0001
0.001
0.01
0.1
1
11/29/2007 12/9/2007 12/19/2007 12/29/2007 1/8/2008 1/18/2008 1/28/2008 2/7/2008 2/17/2008 2/27/2008
Segment 45 - Silver King Wash
Observed Total Lead Simulated Total Lead

Queen Creek TMDL Modeling Report
January 2013 Page 34
Table 3-15: Simulated 24-Hour Average Total Lead Concentrations by Scenario and Storm Event (µg/L)
Subwatershed FBC
Criterion (ug/L)
Existing Conditions Scenario Mining-Background Scenario Without Land-Based Mining Loads
2Yr 1H
2Yr 24H
10Yr 24H
25Yr 24H
100Yr 24H
2Yr 1H
2Yr 24H
10Yr 24H
25Yr 24H
100Yr 24H
Oak Flat Seg 22 15 5.1 8.5 11.3 13.2 15.5 4.6 6.1 8.3 9.7 11.4 QC Hwy 60 Seg 17 15 13.5 10.1 13.5 15.7 19.1 10.3 7.9 10.6 12.3 14.9 QC Magma Avenue Seg 91 15 8.7 7.9 10.5 12.4 14.6 6.9 6.1 8.1 9.6 11.4 QC Mary Avenue Seg 38 15 9.1 4.7 8.4 9.8 11.9 7.2 3.6 6.6 7.7 9.4 QC below Mine Disch. Seg 92 15 3.3 0.6 7.1 9.1 11.2 2.7 0.3 5.6 7.1 8.7 Apex Wash Seg 50 15 13.4 4.0 15.5 18.4 21.5 8.4 2.5 9.7 11.5 13.5 QC Arboretum Seg 47 15 6.0 9.7 10.0 11.2 13.0 5.5 9.7 8.5 9.5 11.0 Silver King Wash Seg 45 15 42.5 34.7 34.6 48.9 76.9 12.8 9.6 10.7 13.2 19.4 Happy Camp Canyon Seg 42 15 7.2 8.1 7.5 9.5 10.1 7.2 8.1 7.5 9.5 10.1 Arnet Creek Seg 46 15 9.7 5.0 8.4 8.7 9.5 9.7 5.0 8.4 8.7 9.5 Alamo Canyon Seg 49 15 1.8 4.5 3.3 4.2 4.6 1.8 4.5 3.3 4.2 4.6 Potts Canyon Seg 30 15 9.3 5.2 7.9 8.1 9.2 9.3 5.2 7.9 8.1 9.2 Reymert Wash Seg 28 15 178.5 600.3 248.0 384.6 481.0 3.8 8.1 5.7 7.6 8.3 QC Outlet Seg 25 15 34.0 45.4 21.9 22.8 29.9 14.2 8.4 10.1 10.9 12.0 Average Concentration Exceeds FBC Criterion
Table 3-16: Simulated 24-Hour Total Lead Loads by Scenario and Storm Event (kg)
Subwatershed Existing Conditions Background Scenario - Without
Land-Based Mining Loads 2Yr 1H
2Yr 24H
10Yr 24H
25Yr 24H
100Yr 24H
2Yr 1H
2Yr 24H
10Yr 24H
25Yr 24H
100Yr 24H
Oak Flat Seg 22 0.108 0.072 0.610 1.124 1.986 0.079 0.052 0.454 0.841 1.490 QC Hwy 60 Seg 17 0.063 0.043 0.723 1.588 3.101 0.049 0.033 0.563 1.237 2.415
QC Magma Avenue Seg 91 0.191 0.127 1.412 3.059 6.209 0.147 0.097 1.094 2.410 4.980 QC Mary Avenue Seg 38 0.190 0.120 1.399 3.031 6.186 0.146 0.092 1.083 2.388 4.960
QC below Mine Disch. Seg 92 0.079 0.003 0.842 2.416 5.734 0.060 0.001 0.661 1.913 4.512 Apex Wash Seg 50 0.039 0.004 0.128 0.373 0.936 0.025 0.003 0.080 0.234 0.587
QC Arboretum Seg 47 0.014 0.001 0.301 1.507 5.245 0.013 0.001 0.238 1.219 4.258 Silver King Wash Seg 45 0.161 0.023 0.219 0.971 4.866 0.044 0.006 0.066 0.247 1.177
Happy Camp Canyon Seg 42 0.024 0.003 0.015 0.100 0.478 0.024 0.003 0.015 0.100 0.478 Arnet Creek Seg 46 0.047 0.005 0.246 1.309 4.573 0.047 0.005 0.246 1.309 4.573
Alamo Canyon Seg 49 0.011 0.002 0.008 0.053 0.286 0.011 0.002 0.008 0.053 0.286 Potts Canyon Seg 30 0.202 0.004 0.408 0.942 2.934 0.202 0.004 0.408 0.942 2.934
Reymert Wash Seg 28 0.391 0.156 0.293 2.439 17.448 0.009 0.002 0.007 0.047 0.267 QC Outlet Seg 25 0.323 0.040 0.489 2.460 21.598 0.206 0.006 0.403 1.890 9.675
Under the Existing Conditions Scenario (Table 3-15) the compliance with the FBC total lead criteria indicates that Silver King Wash (model-segment 45) Reymert Wash (model-segment 28) and the Queen Creek watershed outlet (model-segment 25) are the only three segments not in compliance under all five synthetic storm conditions. These 3 segments are not listed as impaired for total lead under the current 303(d) list. The Existing Conditions Scenario indicates that the simulated average total lead concentrations at the Apex Wash subbasin (model-segment 50) exceed the FBC criteria under the 10-year 24-hour, the 25-year 24-hour, and the 100-year 24-hour storm conditions. This segment is also not listed

Queen Creek TMDL Modeling Report
January 2013 Page 35
under the current 303(d) list and most of the observed total lead data collected recently in 2009 and 2010 shows elevated total lead concentrations (Table 2-3). Under the Existing Conditions Scenario the 100-year 24-hour storm event triggers a minor impairment at the Oak Flat subbasin (model-segment 22). The 25-year 24-hour and the 100-year 24-hour storm events also result in total lead exceedances of the FBC criteria at Queen Creek model-segment 17. The results of the Mining-Background scenario shown in Table 3-15, indicate that all model-segments are in compliance with the total lead criteria expect the Silver King Wash (model-segment 45) which shows an exceedance of the FBC criteria under the 100-year 24-hour storm. Table 3-15 suggests that the land-based mining loads are the main cause of the total lead impairment in Queen Creek. Table 3-16 depicts the estimated 24-hour average total lead loads under the Existing Conditions and the Mining-Background scenarios. The information presented in Table 3-17 can be used as a starting point for the development and implementation of allocations modeling-scenarios to derive the required percent reductions from the mining sources in the impaired subbasins in the Queen Creek watershed.
4.0 References Arizona Department of Environmental Quality, Surface Water Section. 2006. Pinto Creek Phase II TMDL
Modeling Report Arizona Department of Environmental Quality, Surface Water Section. 2010. Interim Queen Creek
TMDL Modeling Report. U.S. Environmental Protection Agency (EPA). 2000. Estimating Hydrology and Hydraulic Parameters for HSPF. EPA-823-R00-012
U.S. Environmental Protection Agency (EPA). 2001. Better Assessment Science Integrating Point and Nonpoint Sources (BASINS), Version 3 Washington, DC.
U.S. Environmental Protection Agency (EPA). November 2008. The Ecological and Hydrological Significance of Ephemeral and Intermittent Streams in the Arid and Semi-arid American Southwest. EPA/600/R-08/134 ARS/233046
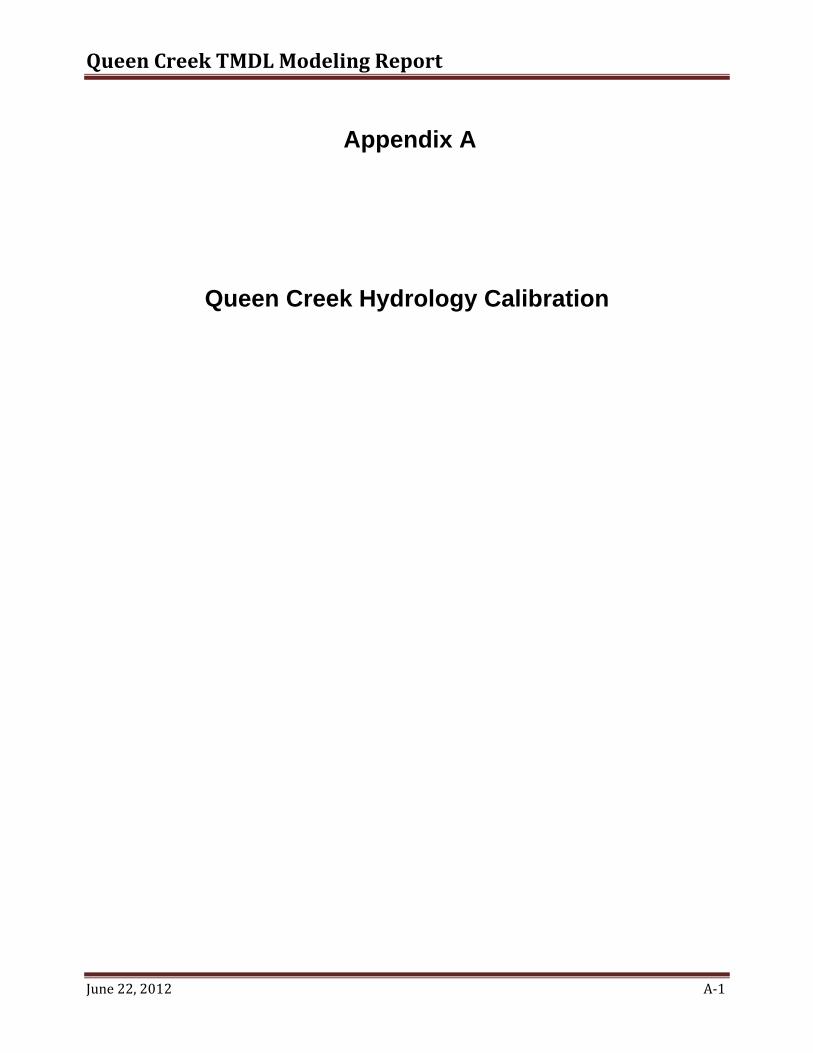
Queen Creek TMDL Modeling Report
June 22, 2012 A‐1
Appendix A
Queen Creek Hydrology Calibration
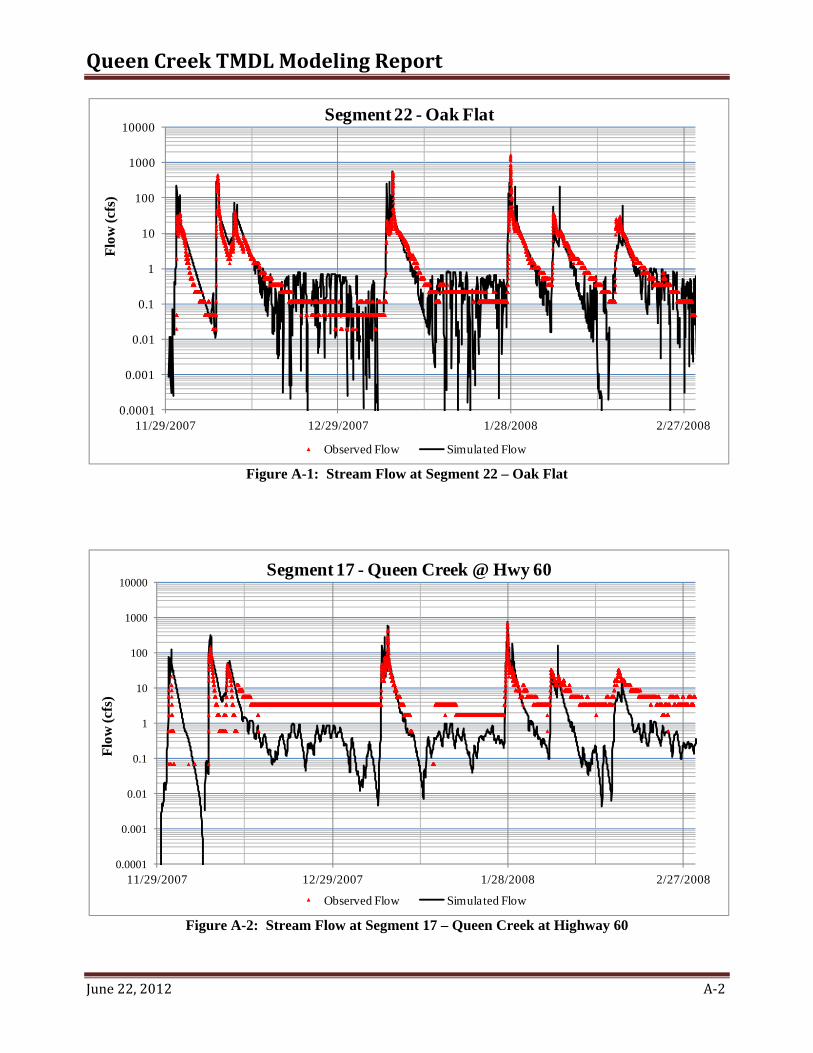
Queen Creek TMDL Modeling Report
June 22, 2012 A‐2
Figure A-1: Stream Flow at Segment 22 – Oak Flat
Figure A-2: Stream Flow at Segment 17 – Queen Creek at Highway 60
0.0001
0.001
0.01
0.1
1
10
100
1000
10000
11/29/2007 12/29/2007 1/28/2008 2/27/2008
Flow
(cfs
)Segment 22 - Oak Flat
Observed Flow Simulated Flow
0.0001
0.001
0.01
0.1
1
10
100
1000
10000
11/29/2007 12/29/2007 1/28/2008 2/27/2008
Flow
(cfs
)
Segment 17 - Queen Creek @ Hwy 60
Observed Flow Simulated Flow

Queen Creek TMDL Modeling Report
June 22, 2012 A‐3
Figure A-3: Stream Flow at Segment 91 – Queen Creek at Magma Avenue
Figure A-4: Stream Flow at Segment 38 – Queen Creek at Mary Drive
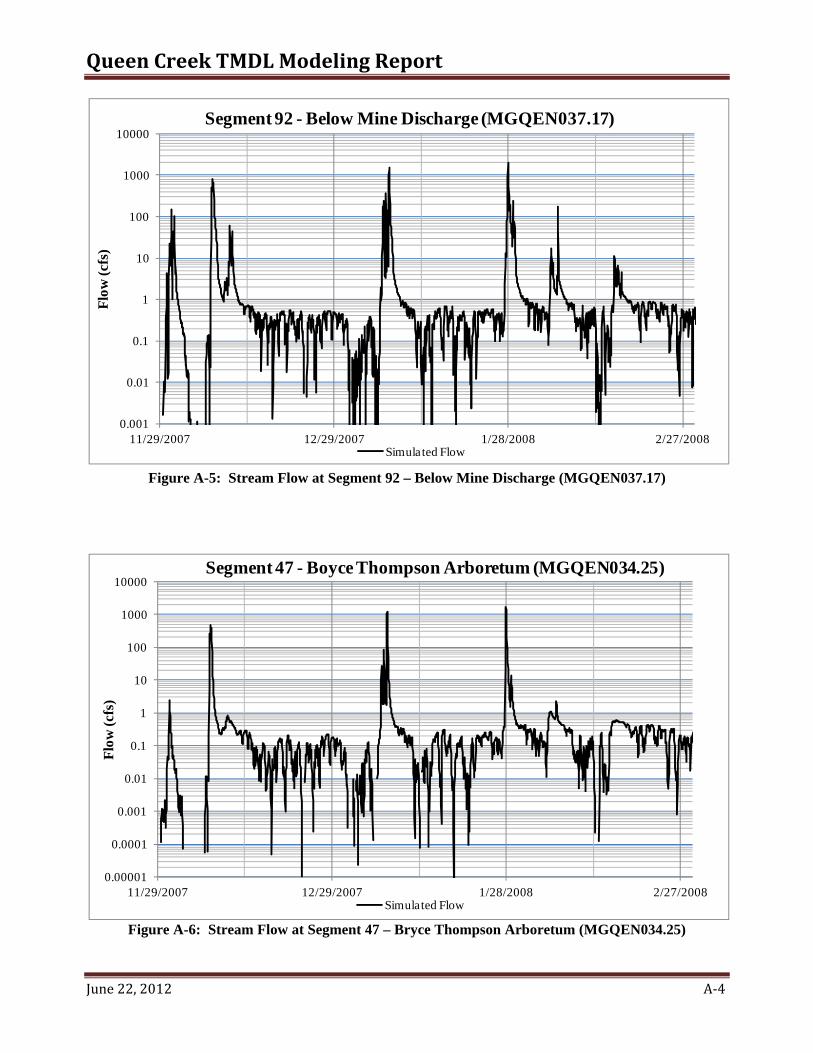
Queen Creek TMDL Modeling Report
June 22, 2012 A‐4
Figure A-5: Stream Flow at Segment 92 – Below Mine Discharge (MGQEN037.17)
Figure A-6: Stream Flow at Segment 47 – Bryce Thompson Arboretum (MGQEN034.25)
0.001
0.01
0.1
1
10
100
1000
10000
11/29/2007 12/29/2007 1/28/2008 2/27/2008
Flow
(cfs
)Segment 92 - Below Mine Discharge (MGQEN037.17)
Simulated Flow
0.00001
0.0001
0.001
0.01
0.1
1
10
100
1000
10000
11/29/2007 12/29/2007 1/28/2008 2/27/2008
Flow
(cfs
)
Segment 47 - Boyce Thompson Arboretum (MGQEN034.25)
Simulated Flow

Queen Creek TMDL Modeling Report
June 22, 2012 A‐5
Figure A-7: Stream Flow at Segment 50 – Apex Wash
Figure A-8: Stream Flow at Segment 46 – Arnett Creek
0.001
0.01
0.1
1
10
100
11/29/2007 12/29/2007 1/28/2008 2/27/2008
Flow
(cfs
)
Segment 50 - Apex Wash
Simulated Flow

Queen Creek TMDL Modeling Report
June 22, 2012 A‐6
Figure A-9: Stream Flow at Segment 45 – Silver King Wash
Figure A-10: Stream Flow at Segment 30 – Potts Canyon
0.001
0.01
0.1
1
10
100
1000
10000
11/29/2007 12/29/2007 1/28/2008 2/27/2008
Flow
(cfs
)Segment 45 - Silver King Wash
Observed Flow Logger Observed Flow Measured Simulated Flow
0.00001
0.0001
0.001
0.01
0.1
1
10
100
1000
10000
11/29/2007 12/29/2007 1/28/2008 2/27/2008
Flow
(cfs
)
Segment 30 - Potts Canyon
Observed Flow Logger Observed Flow Measured Simulated Flow
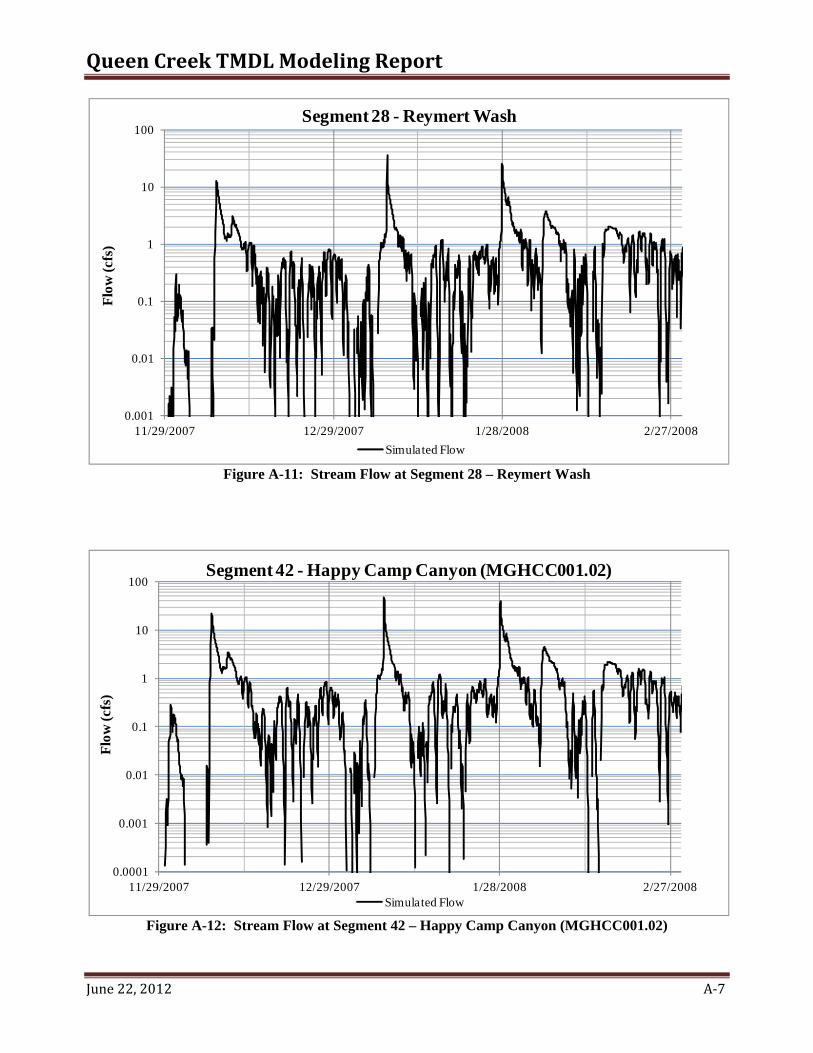
Queen Creek TMDL Modeling Report
June 22, 2012 A‐7
Figure A-11: Stream Flow at Segment 28 – Reymert Wash
Figure A-12: Stream Flow at Segment 42 – Happy Camp Canyon (MGHCC001.02)
0.001
0.01
0.1
1
10
100
11/29/2007 12/29/2007 1/28/2008 2/27/2008
Flow
(cfs
)Segment 28 - Reymert Wash
Simulated Flow
0.0001
0.001
0.01
0.1
1
10
100
11/29/2007 12/29/2007 1/28/2008 2/27/2008
Flow
(cfs
)
Segment 42 - Happy Camp Canyon (MGHCC001.02)
Simulated Flow

Queen Creek TMDL Modeling Report
June 22, 2012 A‐8
Figure A-13: Stream Flow at Segment 49 – Alamo Canyon (MGALC000.46)
Figure A-14: Stream Flow at Segment 25 – Outlet of Watershed (MGQEN030.06)
0.0001
0.001
0.01
0.1
1
10
100
1000
11/29/2007 12/29/2007 1/28/2008 2/27/2008
Flow
(cfs
)
Segment 49 - Alamo Canyon (MGALC000.46)
Simulated Flow
0.0001
0.001
0.01
0.1
1
10
100
1000
10000
11/29/2007 12/29/2007 1/28/2008 2/27/2008
Flow
(cfs
)
Segment 25 - Outlet of Watershed (MGQEN030.06)
Series2

Queen Creek TMDL Modeling Report
January 2013 B‐1
Appendix B
Queen Creek Dissolved Copper Calibration

Queen Creek TMDL Modeling Report
January 2013 B‐2
Figure B-1: Dissolved Copper at Segment 22 – Oak Flat
Figure B-2: Dissolved Copper at Segment 17 – Queen Creek at Highway 60
0.001
0.01
0.1
1
11/29/2007 12/9/2007 12/19/2007 12/29/2007 1/8/2008 1/18/2008 1/28/2008 2/7/2008 2/17/2008 2/27/2008
Dis
solv
ed C
u (m
g/L
)Segment 22 - Oak Flat
Observed CuD Simulated CuD
0.001
0.01
0.1
1
11/29/2007 12/9/2007 12/19/2007 12/29/2007 1/8/2008 1/18/2008 1/28/2008 2/7/2008 2/17/2008 2/27/2008
Dis
solv
ed C
u (m
g/L
)
Segment 17 - Queen Creek @ Hwy 60
Observed CuD Simulated CuD
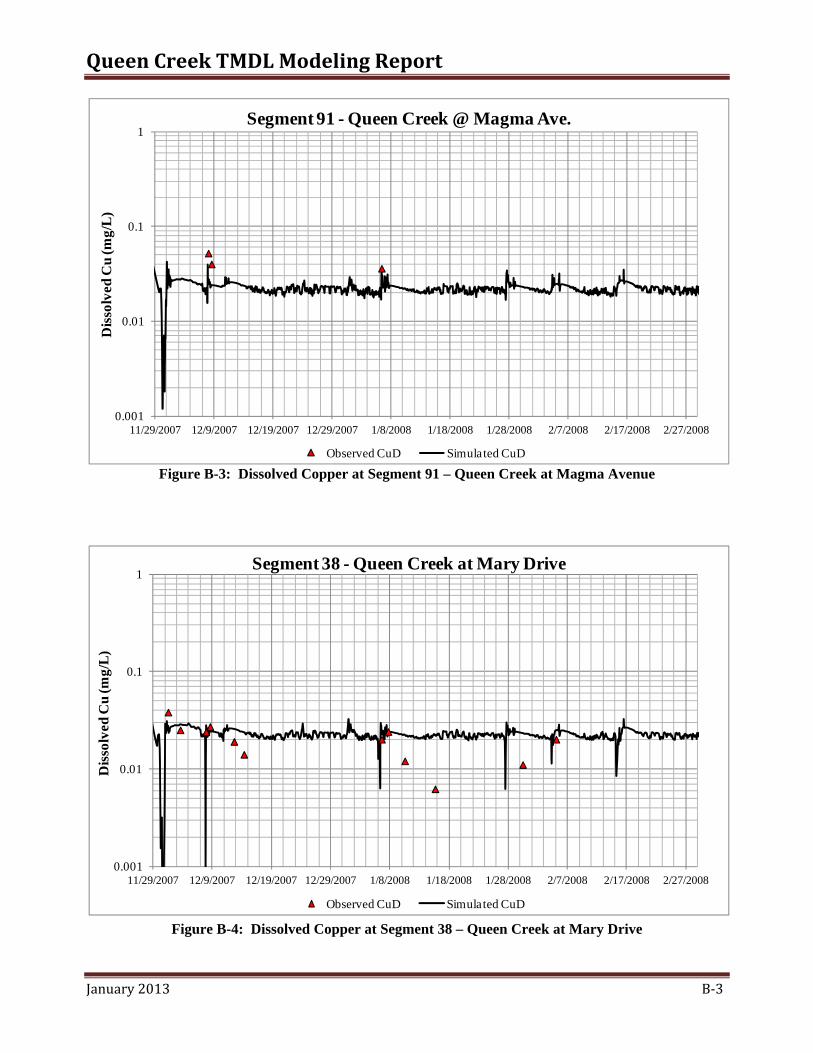
Queen Creek TMDL Modeling Report
January 2013 B‐3
Figure B-3: Dissolved Copper at Segment 91 – Queen Creek at Magma Avenue
Figure B-4: Dissolved Copper at Segment 38 – Queen Creek at Mary Drive
0.001
0.01
0.1
1
11/29/2007 12/9/2007 12/19/2007 12/29/2007 1/8/2008 1/18/2008 1/28/2008 2/7/2008 2/17/2008 2/27/2008
Dis
solv
ed C
u (m
g/L
)Segment 91 - Queen Creek @ Magma Ave.
Observed CuD Simulated CuD
0.001
0.01
0.1
1
11/29/2007 12/9/2007 12/19/2007 12/29/2007 1/8/2008 1/18/2008 1/28/2008 2/7/2008 2/17/2008 2/27/2008
Dis
solv
ed C
u (m
g/L
)
Segment 38 - Queen Creek at Mary Drive
Observed CuD Simulated CuD
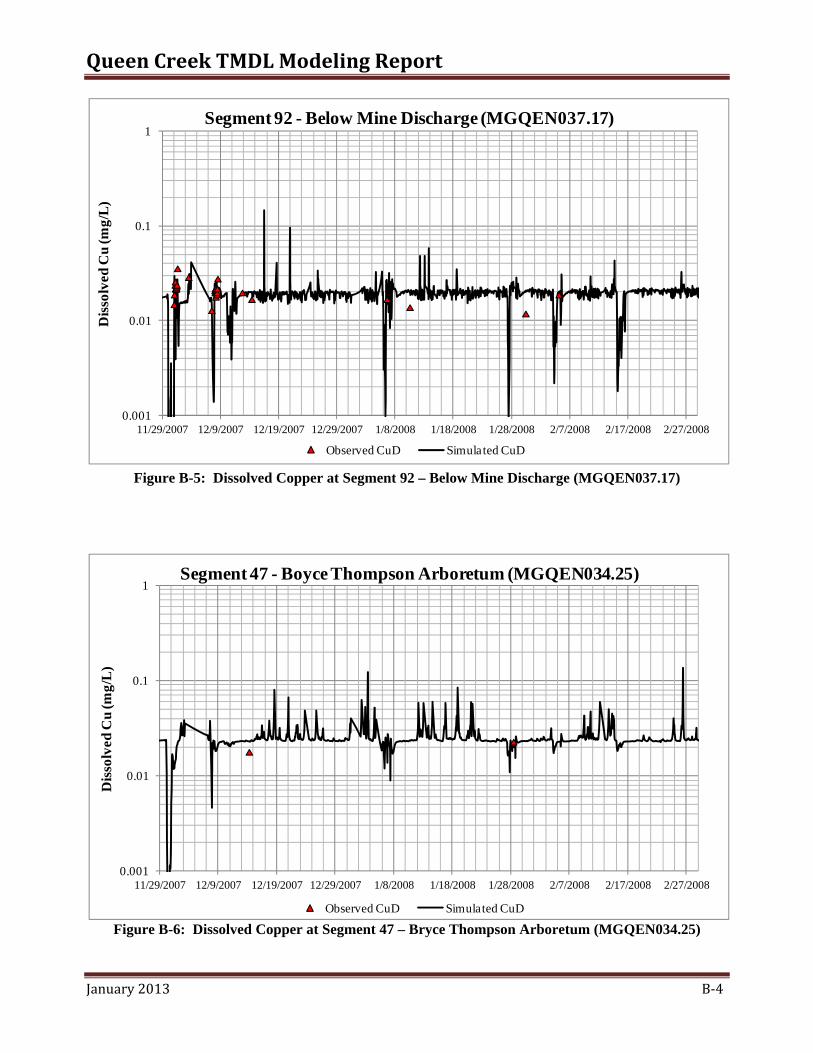
Queen Creek TMDL Modeling Report
January 2013 B‐4
Figure B-5: Dissolved Copper at Segment 92 – Below Mine Discharge (MGQEN037.17)
Figure B-6: Dissolved Copper at Segment 47 – Bryce Thompson Arboretum (MGQEN034.25)
0.001
0.01
0.1
1
11/29/2007 12/9/2007 12/19/2007 12/29/2007 1/8/2008 1/18/2008 1/28/2008 2/7/2008 2/17/2008 2/27/2008
Dis
solv
ed C
u (m
g/L
)Segment 92 - Below Mine Discharge (MGQEN037.17)
Observed CuD Simulated CuD
0.001
0.01
0.1
1
11/29/2007 12/9/2007 12/19/2007 12/29/2007 1/8/2008 1/18/2008 1/28/2008 2/7/2008 2/17/2008 2/27/2008
Dis
solv
ed C
u (m
g/L
)
Segment 47 - Boyce Thompson Arboretum (MGQEN034.25)
Observed CuD Simulated CuD

Queen Creek TMDL Modeling Report
January 2013 B‐5
Figure B-7: Dissolved Copper at Segment 50 – Apex Wash
Figure B-8: Dissolved Copper at Segment 46 – Arnett Creek
0.001
0.01
0.1
1
11/29/2007 12/9/2007 12/19/2007 12/29/2007 1/8/2008 1/18/2008 1/28/2008 2/7/2008 2/17/2008 2/27/2008
Dis
solv
ed C
u (m
g/L
)Segment 50 - Apex Wash
Observed CuD Simulated CuD
0.001
0.01
0.1
1
11/29/2007 12/9/2007 12/19/2007 12/29/2007 1/8/2008 1/18/2008 1/28/2008 2/7/2008 2/17/2008 2/27/2008
Dis
solv
ed C
u (m
g/L
)
Segment 46 - Arnett Creek
Observed CuD Simulated CuD
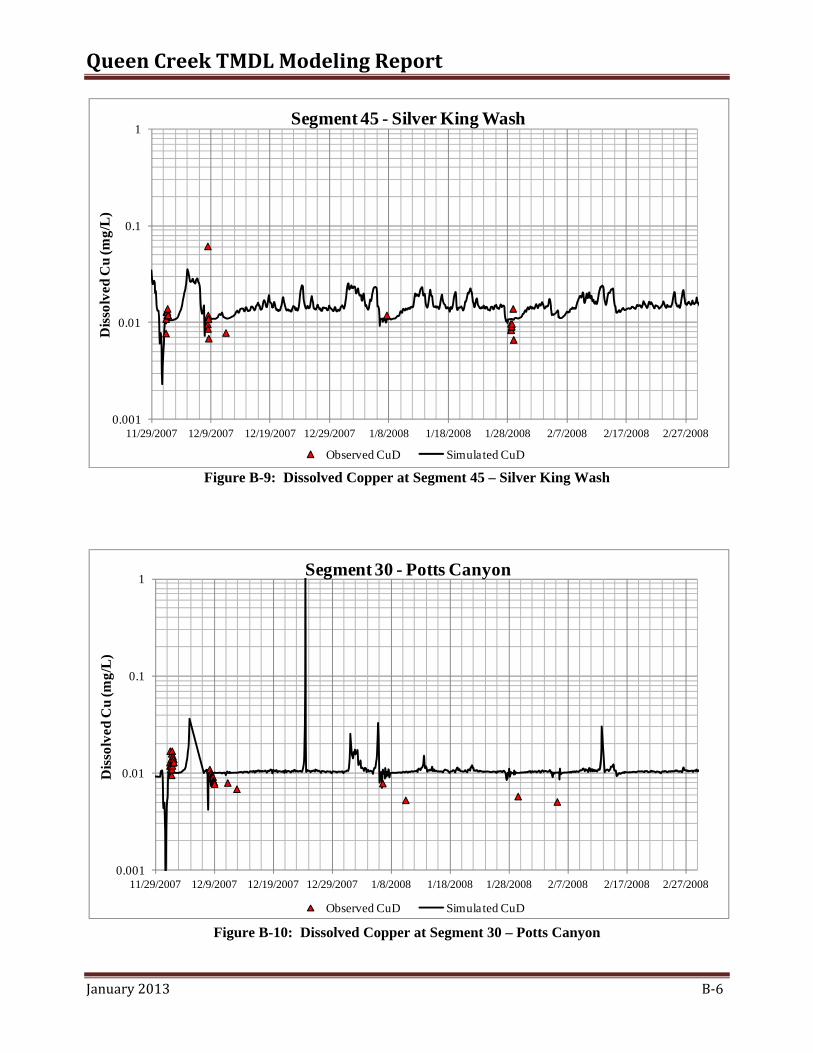
Queen Creek TMDL Modeling Report
January 2013 B‐6
Figure B-9: Dissolved Copper at Segment 45 – Silver King Wash
Figure B-10: Dissolved Copper at Segment 30 – Potts Canyon
0.001
0.01
0.1
1
11/29/2007 12/9/2007 12/19/2007 12/29/2007 1/8/2008 1/18/2008 1/28/2008 2/7/2008 2/17/2008 2/27/2008
Dis
solv
ed C
u (m
g/L
)Segment 45 - Silver King Wash
Observed CuD Simulated CuD
0.001
0.01
0.1
1
11/29/2007 12/9/2007 12/19/2007 12/29/2007 1/8/2008 1/18/2008 1/28/2008 2/7/2008 2/17/2008 2/27/2008
Dis
solv
ed C
u (m
g/L
)
Segment 30 - Potts Canyon
Observed CuD Simulated CuD
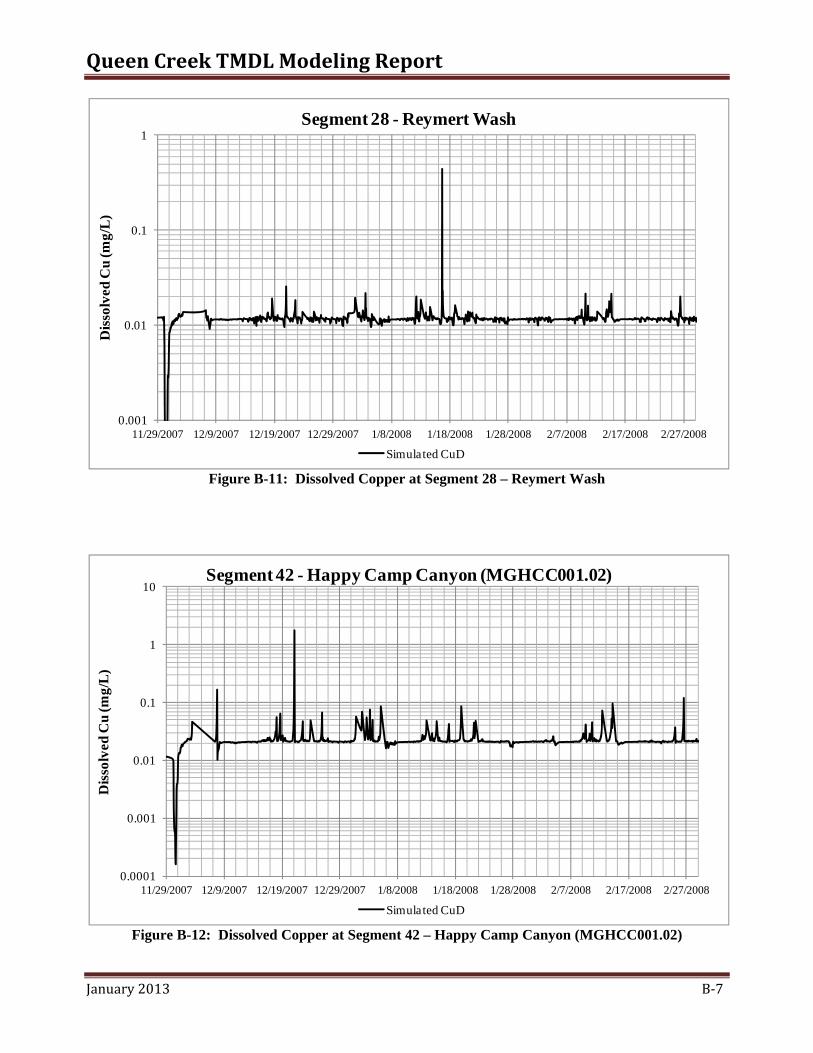
Queen Creek TMDL Modeling Report
January 2013 B‐7
Figure B-11: Dissolved Copper at Segment 28 – Reymert Wash
Figure B-12: Dissolved Copper at Segment 42 – Happy Camp Canyon (MGHCC001.02)
0.001
0.01
0.1
1
11/29/2007 12/9/2007 12/19/2007 12/29/2007 1/8/2008 1/18/2008 1/28/2008 2/7/2008 2/17/2008 2/27/2008
Dis
solv
ed C
u (m
g/L
)Segment 28 - Reymert Wash
Simulated CuD
0.0001
0.001
0.01
0.1
1
10
11/29/2007 12/9/2007 12/19/2007 12/29/2007 1/8/2008 1/18/2008 1/28/2008 2/7/2008 2/17/2008 2/27/2008
Dis
solv
ed C
u (m
g/L
)
Segment 42 - Happy Camp Canyon (MGHCC001.02)
Simulated CuD

Queen Creek TMDL Modeling Report
January 2013 B‐8
Figure B-13: Dissolved Copper at Segment 49 – Alamo Canyon (MGALC000.46)
Figure B-14: Dissolved Copper at Segment 25 – Outlet of Watershed (MGQEN030.06)
0.0001
0.001
0.01
0.1
1
11/29/2007 12/9/2007 12/19/2007 12/29/2007 1/8/2008 1/18/2008 1/28/2008 2/7/2008 2/17/2008 2/27/2008
Dis
solv
ed C
u (m
g/L
)
Segment 49 - Alamo Canyon (MGALC000.46)
Simulated CuD
0.001
0.01
0.1
11/29/2007 12/9/2007 12/19/2007 12/29/2007 1/8/2008 1/18/2008 1/28/2008 2/7/2008 2/17/2008 2/27/2008
Dis
solv
ed C
u (m
g/L
)
Segment 25 - Outlet of Watershed (MGQEN030.06)
Observed CuD Simulated CuD

Queen Creek TMDL Modeling Report
January 2013 C‐1
Appendix C
Queen Creek Total Lead Calibration

Queen Creek TMDL Modeling Report
January 2013 C‐2
Figure C-1: Total Lead at Segment 22 – Oak Flat
Figure C-2: Total Lead at Segment 17 – Queen Creek at Highway 60
0.0001
0.001
0.01
0.1
1
11/29/2007 12/9/2007 12/19/2007 12/29/2007 1/8/2008 1/18/2008 1/28/2008 2/7/2008 2/17/2008 2/27/2008
Tota
l Lea
d (m
g/L)
Segment 22 - Oak Flat
Observed Total Lead Simulated Total Lead
0.0001
0.001
0.01
0.1
1
11/29/2007 12/9/2007 12/19/2007 12/29/2007 1/8/2008 1/18/2008 1/28/2008 2/7/2008 2/17/2008 2/27/2008
Tota
l Lea
d (m
g/L)
Segment 17 - Queen Creek @ Hwy 60
Observed Total Lead Simulated Total Lead
Queen Creek TMDL Modeling Report
January 2013 C‐3
Figure C-3: Total Lead at Segment 91 – Queen Creek at Magma Avenue
Figure C-4: Total Lead at Segment 38 – Queen Creek at Mary Drive
0.0001
0.001
0.01
0.1
1
11/29/2007 12/9/2007 12/19/2007 12/29/2007 1/8/2008 1/18/2008 1/28/2008 2/7/2008 2/17/2008 2/27/2008
Tota
l Lea
d (m
g/L)
Segment 91 - Queen Creek @ Magma Ave.
Observed Total Lead Simulated Total Lead
0.0001
0.001
0.01
0.1
1
11/29/2007 12/9/2007 12/19/2007 12/29/2007 1/8/2008 1/18/2008 1/28/2008 2/7/2008 2/17/2008 2/27/2008
Tota
l Lea
d (m
g/L)
Segment 38 - Queen Creek at Mary Drive
Observed Total Lead Simulated Total Lead

Queen Creek TMDL Modeling Report
January 2013 C‐4
Figure C-5: Total Lead at Segment 92 – Below Mine Discharge (MGQEN037.17)
Figure C-6: Total Lead at Segment 47 – Bryce Thompson Arboretum (MGQEN034.25)
0.0001
0.001
0.01
0.1
1
11/29/2007 12/9/2007 12/19/2007 12/29/2007 1/8/2008 1/18/2008 1/28/2008 2/7/2008 2/17/2008 2/27/2008
Tota
l Lea
d (m
g/L)
Segment 92 - Below Mine Discharge (MGQEN037.17)
Observed Total Lead Simulated Total Lead
0.0001
0.001
0.01
0.1
1
11/29/2007 12/9/2007 12/19/2007 12/29/2007 1/8/2008 1/18/2008 1/28/2008 2/7/2008 2/17/2008 2/27/2008
Tota
l Lea
d (m
g/L)
Segment 47 - Boyce Thompson Arboretum (MGQEN034.25)
Observed Total Lead Simulated Total Lead
Queen Creek TMDL Modeling Report
January 2013 C‐5
Figure C-7: Total Lead at Segment 50 – Apex Wash
Figure C-8: Total Lead at Segment 46 – Arnett Creek
0.0001
0.001
0.01
0.1
1
11/29/2007 12/9/2007 12/19/2007 12/29/2007 1/8/2008 1/18/2008 1/28/2008 2/7/2008 2/17/2008 2/27/2008
Tot
al L
ead
(mg/
L)
Segment 50 - Apex Wash
Observed Total Lead Simulated Total Lead
0.0001
0.001
0.01
0.1
1
11/29/2007 12/9/2007 12/19/2007 12/29/2007 1/8/2008 1/18/2008 1/28/2008 2/7/2008 2/17/2008 2/27/2008
Tota
l Lea
d (m
g/L)
Segment 46 - Arnett Creek
Observed Total Lead Simulated Total Lead

Queen Creek TMDL Modeling Report
January 2013 C‐6
Figure C-9: Total Lead at Segment 45 – Silver King Wash
Figure C-10: Total Lead at Segment 30 – Potts Canyon
0.0001
0.001
0.01
0.1
1
11/29/2007 12/9/2007 12/19/2007 12/29/2007 1/8/2008 1/18/2008 1/28/2008 2/7/2008 2/17/2008 2/27/2008
Tota
l Lea
d (m
g/L)
Segment 30 - Potts Canyon
Observed Total Lead Simulated Total Lead

Queen Creek TMDL Modeling Report
January 2013 C‐7
Figure C-11: Total Lead at Segment 28 – Reymert Wash
Figure C-12: Total Lead at Segment 42 – Happy Camp Canyon (MGHCC001.02)
0.001
0.01
0.1
1
10
11/29/2007 12/9/2007 12/19/2007 12/29/2007 1/8/2008 1/18/2008 1/28/2008 2/7/2008 2/17/2008 2/27/2008
Tot
al L
ead
(mg/
L)
Segment 28 - Reymert Wash
Simulated Total Lead
0.0001
0.001
0.01
0.1
1
11/29/2007 12/9/2007 12/19/2007 12/29/2007 1/8/2008 1/18/2008 1/28/2008 2/7/2008 2/17/2008 2/27/2008
Tota
l Lea
d (m
g/L)
Segment 42 - Happy Camp Canyon (MGHCC001.02)
Simulated Total Lead

Queen Creek TMDL Modeling Report
January 2013 C‐8
Figure C-13: Total Lead at Segment 49 – Alamo Canyon (MGALC000.46)
Figure C-14: Total Lead at Segment 25 – Outlet of Watershed (MGQEN030.06)
0.0001
0.001
0.01
0.1
1
11/29/2007 12/9/2007 12/19/2007 12/29/2007 1/8/2008 1/18/2008 1/28/2008 2/7/2008 2/17/2008 2/27/2008
Tota
l Lea
d (m
g/L)
Segment 49 - Alamo Canyon (MGALC000.46)
Simulated Total Lead
0.0001
0.001
0.01
0.1
1
11/29/2007 12/9/2007 12/19/2007 12/29/2007 1/8/2008 1/18/2008 1/28/2008 2/7/2008 2/17/2008 2/27/2008
Tota
l Lea
d (m
g/L)
Segment 25 - Outlet of Watershed (MGQEN030.06)
Observed Total Lead Simulated Total Lead