Quarterly Review of the Software & Internet Sector - Q1 2016
Upload
mark-weismanCategory
view
128download
1
Quarterly
Review of the
Medical
Technology
Sector
(MedTech)
Q1 2016
Member: FINRA / SIPC
2
About Navidar
Navidar is an investment banking firm providing companies and investors in dynamic industries with strategic
M&A advice, capital raising solutions, vital insights and breakthrough opportunities.
■ Big Firm Experience Combined with Senior Banker Attention
■ Global Relationships With Top-Tier Investors and World-Leading Companies
■ Greater Creativity and Customized Solutions
■ Focused on the Middle Corridor of the United States
Past Transactions Executed by Navidar
Note: Transactions above only represent a sample of past transactions executed by Navidar.
Has acquired
Buyside AdvisorSellside Advisor
Has been acquired by
Sellside Advisor
Has been acquired byHas been acquired by
Sellside Advisor
Sellside Advisor
Has been acquired by
Private Equity PlacementSellside Advisor
Has been acquired byHas been acquired by
Sellside Advisor
Sellside Advisor
Has been acquired by
Sellside Advisor
Has been acquired by
Sellside Advisor
Has been acquired byHas acquired
Buyside Advisor
Capital Structure ReviewNOL Shareholder Rights
Plan
Has been acquired by
Sellside Advisor Sellside Advisor
Has been acquired by
Private Equity PlacementDebt Placement
Private Equity PlacementBuyside Advisor
Has acquired
World Golf Systems Group PLC

3
Navidar at a Glance
Experienced Strategic Advisors
Advising Dynamic Companies
Executed Over 300 Deals,
Nearly $70B of Transaction Volume
Creative Insights and Customized Solutions
International Expertise
$8.4B of Transaction Volume
Contact Us
Austin Office
400 West 15th Street,
Suite 325
Austin, TX 78701
T: (512) 765-6970
Stephen Day Managing Director
O: (512) 765-6973 | E: [email protected]
Tim Walsh Managing Director
O: (512) 765-6972 | E: [email protected]
Financing
$31.5B
47%
M&A
$35.9B
53%
M&A
Corporate
Finance
Advisory
Capital
Raising
Pu
blic C
om
pa
nies
Pri
va
te C
om
pa
nie
s
Asia
$4.9B
58%
Europe
$2.2B
26%
Canada
$1.3B
16%
Technology Internet/
E-Commerce
SaaS
SoftwareBusiness
Services
MedTech and
HCITSpecialty
Manufacturing
Technology Internet/
E-Commerce
SaaS
SoftwareBusiness
Services
MedTech and
HCITSpecialty
Manufacturing

4
Q1 2016 Medical Technology Sector Review
Relative Stock Price Performance – YTD
MedTech Sector Stock Price Performance
Top 5 Global M&A Deals in Q1 By Value
Sub-Sector Q1
Return
YTD Return
Supplies 4.4% 4.4%
Diversified 3.0% 3.0%
Orthopedics 3.2% 3.2%
S&P 500 0.8% 0.8%
Cardiothoracic (1.4%) (1.4%)
Equipment (1.9%) (1.9%)
HCIT(1) (12.5%) (12.5%)
Date Acquirer Target
Deal
Value
($M)
02/01/2016
$9,095
03/17/2016
5,981
02/18/2016
3,577
02/01/2016
2,775
02/16/2016
1,344
Key Takeaways from the Quarter:
Medical Technology sub-sectors delivered mixed
returns in Q1’16, with three sub-sectors (Supplies,
Diversified and Orthopedics) outperforming the S&P
500 Index, while three sub-sectors (Cardiothoracic,
Equipment and HCIT) underperformed the S&P 500
Index.
Supplies and Diversified emerged as the sub-sectors.
Global MedTech M&A deal volume slumped in
Q1’16 to 155 deals from the peak of 187 in Q3’15.
However, Global MedTech M&A deal value saw
robust growth of 293% to reach $27.2 billion in
Q1’16 from $6.9 billion in Q4’15.
U.S. MedTech M&A deal volume experienced an
upward trend in Q1’16 to reach 94 deals compared to
Q4’15. The total M&A disclosed deal value surged
295% quarter-over-quarter to $19.4 billion from $4.9
billion in the previous quarter.
Strategic acquisitions claimed 88% share of the
Global MedTech M&A deal volume.
In Q1’16, the majority of announced transactions
globally had disclosed deal values below $100.0
million.
Source: S&P Capital IQ, Industry Research, Online Publications and Navidar Research. (1) HCIT = Healthcare Information Technology.
80%
85%
90%
95%
100%
105%
110%
1-Jan-16 31-Jan-16 1-Mar-16 31-Mar-16
4.4%
(12.5% )
(1.4%)(1.9%)
3.2%
Supplies
HCIT (1)
Diversified
CardiothoracicEquipment
OrthopedicsS&P 5000.8%
3.0%

5
Medical Technology Sector M&A Review
Source: S&P Capital IQ, Navidar Research and Industry Research. (1) Defined as deal value of $500M EV and less.
Global MedTech M&A Deals — Since 2013 Commentary
Global MedTech M&A deal
volume continued its downward
trend in Q1’16 falling to 155
deals after reaching a high of 187
deals in Q3’15. M&A disclosed
deal value stood at $27.2 billion
compared to $6.9 billion in
Q4’15.
Global M&A deal volume
decreased 9% quarter-over-
quarter, while it increased 5%
year-over-year to reach 155
deals.
Global M&A deal value surged
by 293% to reach $27.2 billion
quarter-over-quarter from $6.9
billion, and by 254% year-
over-year from $7.7 billion.
U.S. MedTech M&A deal
volume in Q1’16 increased to 94
deals from 85 in Q4’15.
U.S. M&A deal volume
experienced an 11% gain
quarter-over-quarter to reach
94 deals from 85, while it rose
22% year-over-year from 77.
U.S. M&A deal value surged
by 295% quarter-over-quarter
to reach $19.4 billion from
$4.9 billion, and 281% year-
over-year from $5.1 billion.
U.S. Middle Market M&A deal
volume came down in Q1’16 to
20 deals from 24 in Q4’15.
U.S. middle market M&A
value in Q1’16 sank 59%
quarter-over-quarter and 3%
year-over-year to $0.89 billion
from $0.86 billion.
U.S. MedTech M&A Deals — Since 2013
U.S. MedTech Middle Market M&A Deals — Since 2013(1)
$6.0$12.5
$7.8 $8.5 $7.3
$67.0
$8.1
$23.4
$7.7 $6.5
$19.3
$6.9
$27.2
126
99108
141 137
153140
146 147156
187
171
155
0
30
60
90
120
150
180
210
$0
$20
$40
$60
$80
$100
$120
Q1 Q2 Q3 Q4 Q1 Q2 Q3 Q4 Q1 Q2 Q3 Q4 Q1
2013 2014 2015 2016
No.
of
Dea
ls
Val
ue
($bn)
$1.4
$11.1
$6.3 $5.7$6.9
$18.0
$4.2
$18.5
$5.1
$2.7
$16.4
$4.9
$19.470
61
68
76 76 76 7581
7782
8885
94
0
17
34
51
68
85
102
$0
$4
$8
$12
$16
$20
$24
$28
Q1 Q2 Q3 Q4 Q1 Q2 Q3 Q4 Q1 Q2 Q3 Q4 Q1
2013 2014 2015 2016
No
. o
f D
eals
Val
ue
($b
n)
$1.4$1.2
$2.3$2.5
$1.0
$2.9
$1.5$1.2
$0.9$0.7
$3.5
$2.1
$0.9
13
11
22
1819
21
19
11
18
9
28
24
20
0
5
10
15
20
25
30
$0
$1
$2
$3
$4
$5
$6
Q1 Q2 Q3 Q4 Q1 Q2 Q3 Q4 Q1 Q2 Q3 Q4 Q1
2013 2014 2015 2016
No.
of
Dea
ls
Val
ue
($bn)

6
Medical Technology Sector M&A Review (Cont.)
Top 10 Global MedTech M&A Transactions in Q1 2016
Valuation Metrics
Date Acquirer Target
Enterprise
Value
($USDmm)
EV / LTM
Revenue
EV / LTM
EBITDA
3/30/2016 DiaSorin (Italy) Focus Diagnostics (U.S.) $300 3.8x NA
3/23/2016 GI Partners (U.S.) Netsmart Technologies (U.S.) 950 NA NA
3/17/2016 Canon (Japan) Toshiba Medical Systems (Japan) 5,981 NA NA
3/1/2016 Investor Group (Europe) Medi Globe (Germany) 800 7.1x 18.6x
2/22/2016 Resmed (U.S.) Brightree (U.S.) 800 7.1x 18.6x
2/18/2016 IBM Watson Health (U.S.) Truven Holding (U.S.) 3,556 5.9x 35.8x
2/16/2016 Stryker (U.S.) Physio-Control (U.S.) NA NA NA
2/2/2016 TE Connectivity (Switzerland) Creganna Medical (Ireland) 895 3.6x NA
2/1/2016 Stryker (U.S.) Sage Products (U.S.) 2,775 6.5x NA
2/1/2016 Abbott Laboratories (U.S.) Alere (U.S.) 8,615 3.5x 15.2x
U.S. MedTech M&A Deal Volume by Size
Q1'2016
Q1'2015
Q4'2015
$ in millions
except # Number of
Deals
Total Deal
Value
Number of
Deals
Total Deal
Value
Number of
Deals
Total Deal
Value
< $50M 14 $153
13 $138
12 $171
$50M to $100M 4 293
3 229
5 365
$100M to $250M 1 140
1 190
4 775
$250M to $500M 1 300
1 300
3 828
$500M to $1000M 2 1,750
- -
- -
>1B 4 16,795
2 4,244
1 2,775
Undisclosed 68 -
57 0
60 -
Grand Total 94 $19,432
77 $5,102
85 $4,915
Source: S&P Capital IQ and Industry Research.
Note: EV = Enterprise Value (Equity Value + Debt + Minority Interest – Cash and Cash Equivalents).

7
Medical Technology Sector M&A Review (Cont.)
Review of Selected Healthcare Technology Transactions in Q1
Healthcare Technology
IBM Watson Health to acquire Truven Health Analytics for $3.6B EV, which implied 5.94x
of LTM Revenue and 35.8x of LTM EBITDA.
Acquisition empowers IBM Watson Health to deliver unique cognitive capabilities by
leveraging Truven Health Analytic’s large repository of health data from thousands of
hospitals, employers and state governments.
Acquisition will enable IBM’s health unit to double the Company’s size of employees, clinicians,
epidemiologists, statisticians, healthcare administrators, policy experts and healthcare
consultants.
Headquartered in Ann Arbor, MI, Truven provides analytic solutions and services for the healthcare
industry and offers population health and cost analysis solutions that enable clients to integrate and
analyze healthcare data on utilization, patient characteristics and costs for populations receiving
healthcare services; and provider performance management solutions, which help care delivery
organizations to track, measure and enhance performance across operational, financial, marketing and
planning, clinical and quality domains.
Allscripts Healthcare Solutions to acquire Netsmart Technologies for $950M EV. Valuation
was not disclosed.
Deal capitalizes on new incentives for hospitals and clinics to reduce costs and better coordinate
medical care.
Combination will diversify Netsmart's business into home care and also complement the
Company's existing business in behavioral health and social service information technology.
Headquartered in Overland Park, KS, Netsmart Technologies is a healthcare information technology
company providing software and technology solutions. The Company offers CareRecord, an electronic
health record for the health and human services community; CareManager, a care coordination software
solution for the health and human services industry; CareConnect, a health information exchange software
solution for integrated consumer healthcare; network and contract management software solutions for
payers in the health and human services industry and primary care integration software application for
iPad and iPhone users.
Source: S&P Capital IQ, Press Releases, Equity Research, Online Publications, Industry Research and Navidar Research.
Note: EV = Enterprise Value (Equity Value + Debt + Minority Interest – Cash and Cash Equivalents) and LTM = Last Twelve Months.

8
Medical Technology Sector M&A Review (Cont.)
Healthcare Technology (Cont.)
Resmend to acquire Brightree for $800M EV, which implied 7.08x of LTM Revenue and
18.6x of LTM EBITDA.
Acquisition will improve Resmend’s clinical and business performance in the post-acute care
industries of home / durable medical equipment (HME / DME), home health and hospice.
Acquisition will allow ResMed to treat sleep-disordered breathing, COPD and other chronic
respiratory conditions.
Headquartered in Lawrenceville, GA, Brightree offers cloud-based software solutions to the post-acute
care industry. The Company also offers a cloud-based business management platform for home medical
equipment clients featuring billing and accounts receivable management, inventory; a web-based software
that includes a set of interactive and customizable business intelligence solutions enabling clients to
constantly oversee various aspects of their business, such as DME billing, DSO, inventory and marketing
/ sales.
Decision Resources acquired Adaptive Software for $25M EV, which implied 7.66x of LTM
Revenue.
Acquisition will enable DRG to deliver cutting-edge insights and analytics, directly alongside
mission-critical business processes.
Combination will enable DRG to build unique products to manage critical market access
questions and ensure that the Fingertip Formulary dataset remains the source of truth in the
formulary data industry.
Headquartered in Shawnee, KS, Adaptive Software provides business process management software
solutions for the pharmacy benefits management industry. The Company’s products include an enterprise
workspace designed for creating, submitting and triaging form data; a value-based benefit design system
to control every aspect of benefit products; and a web-based formulary automation tool.
Red Tree acquired PreViser for $8M EV. Valuation was not disclosed.
Acquisition will result in leveraging of PreViser’s oral scoring system, which allows dental
workers to assess patients to help determine whether the insurance company should cover more
than the traditional two cleanings a year in a program dubbed HOW, for Health through Oral
Wellness.
Acquisition will strengthen Northeast Delta’s mission to advance the oral health and overall
wellness of the Company’s customers and remain a leader in innovative oral health care
solutions that utilize the best technology in the world.
Headquartered in Mount Vernon, WA, PreViser offers dental risk and periodontal disease analysis
software. The Company offers PreViser, an analytic software that enables dentists, hygienists,
periodontists and orthodontists to measure, understand and communicate their patients' risk and disease
level as numeric scores, and the Company’s solution also allows researchers to measure clinical
conditions and academic teaching institutions to show students how to quantifiably measure risk, disease
and employ disease management concepts in the real world of clinical dentistry.
Source: S&P Capital IQ, Press Releases, Equity Research, Online Publications, Industry Research and Navidar Research.
Note: EV = Enterprise Value (Equity Value + Debt + Minority Interest – Cash and Cash Equivalents) and LTM = Last Twelve Months.

9
Medical Technology Sector M&A Review (Cont.)
Healthcare Equipment
Stryker to acquire Physio-Control for $1.3B EV. Valuation was not disclosed.
Acquisition leads to the expansion of Stryker's emergency medical systems business in
European countries including North Ireland, Sweden and Denmark.
Acquisition will be complementary to Stryker’s medical EMS (Emergency Medical Services)
offering, and also offer an enhanced presence and infrastructure that will expand Stryker's
global footprint.
Headquartered in Redmond, WA, Physio-Control develops, manufactures, sells, and services automated
external defibrillators, monitors, and emergency medical response products and services. The Company’s
products include ECG devices, data solutions and cardiopulmonary resuscitation devices. The Company
serves emergency medical service providers and hospitals worldwide.
NuVasive acquired Ellipse Technologies for $410MEV, which implied 10.20x of LTM
Revenue.
Acquisition helps NuVasive to leverage Ellipse’s magnetic growing rod technology, which is
currently receiving rapid adoption in the pediatric deformity and orthopedic markets for new
growth opportunities.
Acquisition builds NuVasive’s reputation as the leading technology provider for spine
procedure solutions by adding a highly regarded, disruptive technology platform.
Headquartered in Aliso Viejo, CA, Ellipse Technologies is a medical technology company that develops
and markets magnetically adjustable implant systems used in orthopedic surgery processes based on the
Company’s proprietary MAGnetic External Control technology platform. The Company’s implants are
adjustable at the time of implantation and non-invasive over the course of treatment to accommodate the
changing clinical needs of patients as they heal, grow or age.
Merit Medical Systems acquired HeRO Graft for $19M EV, which implied 2.47x of LTM
Revenue.
Acquisition enhances Merit’s existing presence with vascular surgeons and interventional
radiologists, and also improves the Company product lines such as peritoneal dialysis catheters
and chronic dialysis catheters.
Acquisition enables Merit’s complementary portfolio of vascular access and dialysis related
products, with corresponding customer relationships, to broaden HeRO Graft access for
patients with end-stage renal disease.
Headquartered in Kennesaw, GA, HeRO Graft is a product line of CryoLife, which distributes
cryogenically-preserved human tissues for cardiac and vascular transplant applications and develops
medical devices. The product line is a hemodialysis access graft for patients who are catheter-dependent
or approaching catheter-dependency due to the blockage of veins leading to the heart.
Source: S&P Capital IQ, Press Releases, Equity Research, Online Publications, Industry Research and Navidar Research.
Note: EV = Enterprise Value (Equity Value + Debt + Minority Interest – Cash and Cash Equivalents) and LTM = Last Twelve Months.
10
Medical Technology Sector M&A Review (Cont.)
Healthcare Equipment (Cont.)
Avant Diagnostics to acquire Amarantus Bioscience for $19M EV. Valuation was not
disclosed.
Combined diagnostic assets of Avant and Amarantus Bioscience will create a truly unique
opportunity for early detection of disease in oncology and neurology.
Acquisition will help advance commercial development of diagnostic assets in the fields of
oncology and neurology, including those specifically designed to detect multiple sclerosis.
Headquartered in San Francisco, CA, Amarantus BioScience is a biotechnology company focused on
developing therapeutic products with the potential for orphan drug designation in the areas of neurology,
psychiatry, ophthalmology and regenerative medicine, and diagnostics in neurology.
SurModics acquired NorMedix for $14M EV. Valuation was not disclosed.
Acquisition strengthens SurModics’ vascular device expertise and R&D capabilities. Also,
SurModics will make significant progress on the Company’s strategy to offer whole-product
solutions to medical device customers, while continuing the Company’s commitment to
consistently deliver innovation in coating technologies and in vitro diagnostics.
Acquisition will complement SurModics’ leadership in coating technology by leveraging
NorMedix’s advanced braiding technologies, which allow for the design, development and
manufacture of highly differentiated catheters to support complex interventional procedures.
Headquartered in Plymouth, MN, NorMedix provides medical device design and development services.
The Company offers idea generation / product innovation services, product development services
verification / validation services and manufacturing services such as finished device and component
manufacturing, process development, supply chain management, and clinical and pilot manufacturing.
Source: S&P Capital IQ, Press Releases, Equity Research, Online Publications, Industry Research and Navidar Research.
Note: EV = Enterprise Value (Equity Value + Debt + Minority Interest – Cash and Cash Equivalents) and LTM = Last Twelve Months.
11
Medical Technology Sector M&A Review (Cont.)
Healthcare Supplies
Abbott to acquire Alere for $9.1B EV, which implied 3.45x LTM Revenue and 15.2x LTM
EBITDA.
Acquisition will enable Abbott to offer the broadest point of care menu of infectious disease,
molecular, cardiometabolic and toxicology testing and also expand the Company’s platforms to
include benchtop and rapid strip tests.
Acquisition of Alere’s complementary technologies will provide Abbott access to new product
applications, channels, and geographies including entry into fast-growing outlets like doctors'
offices, clinics, pharmacies and at-home testing.
Deal will boost Abbott’s point-of-care testing capabilities, which is the fastest-growing segment
in the diagnostic market.
Headquartered in Waltham, MA, Alere provides point-of-care diagnostics and services for infectious
disease, cardiometabolic disease, and toxicology in the United States and internationally. The Company
operates through Professional Diagnostics and Consumer Diagnostics segments and also delivers services
and solutions across various environments, including clinical immunology, women's health, and
oncology.
Stryker to acquire Sage for $2.7B EV, which implied 6.45x LTM Revenue.
Deal provides a consistent disposable revenue stream that will complement Stryker’s capital
equipment offerings.
Headquartered in Cary, IL, Sage manufactures disposable health and personal care products. The
Company offers products for safe patient handling, oral hygiene, prepackaged bathing, hair care,
incontinence care, sacrum protection, heel protection, preoperative care, and solving flushing problems,
products for incontinence skin care and under pads, rinse-free pre-packaged bathing, rinse-free shampoo
cap, oral care, pressure ulcer heel protection, turning and positioning, before surgery, and infant and baby.
Inovio Pharma to acquire Bioject Medical’s assets for $6M EV. Valuation was not
disclosed.
Acquisition will advance an integrated non-invasive delivery device combining Bioject’s jet
injection technology with Inovio’s new needle-free, skin-surface electroporation technology.
Acquisition of Bioject Medical’s needle-free injection can help Inovio to offer a compelling
solution to protect against RSV and emerging infectious diseases like Zika.
Headquartered in Tigard, OR, Bioject Medical develops and distributes needle-free injection therapy
systems for the pharmaceutical and biotech industries. The Company’s needle-free injection products
include the Biojector 2000 system that delivers intramuscular and intradermal injections; ZetaJet system,
which provides vaccines and injectable medications either subcutaneously or intramuscularly; and a
needle-free drug reconstitution system, which allows the transfer of diluents to reconstitute powdered
medications into liquid form.
Source: S&P Capital IQ, Press Releases, Equity Research, Online Publications, Industry Research and Navidar Research.
Note: EV = Enterprise Value (Equity Value + Debt + Minority Interest – Cash and Cash Equivalents) and LTM = Last Twelve Months.
12
Medical Technology Sector M&A Review (Cont.)
Healthcare Supplies (Cont.)
Thuasne Group acquired Quinn Medical. Valuation was not disclosed.
Acquisition increases Thuasne's investment in the US market and diversifies the portfolio of
orthopedic products available through the Company’s European subsidiaries and global
network of medical device distributors.
Headquartered in San Clemente, CA, Quinn Medical develops non-invasive orthopedic products and
programs that help to prevent injury, relieve pain and restore function. The Company’s products include
spinal compression braces and ice packs. The Company also provides reimbursement solutions, partner
programs and fitting certification programs.
Source: S&P Capital IQ, Press Releases, Equity Research, Online Publications, Industry Research and Navidar Research.
Note: EV = Enterprise Value (Equity Value + Debt + Minority Interest – Cash and Cash Equivalents) and LTM = Last Twelve Months.
13
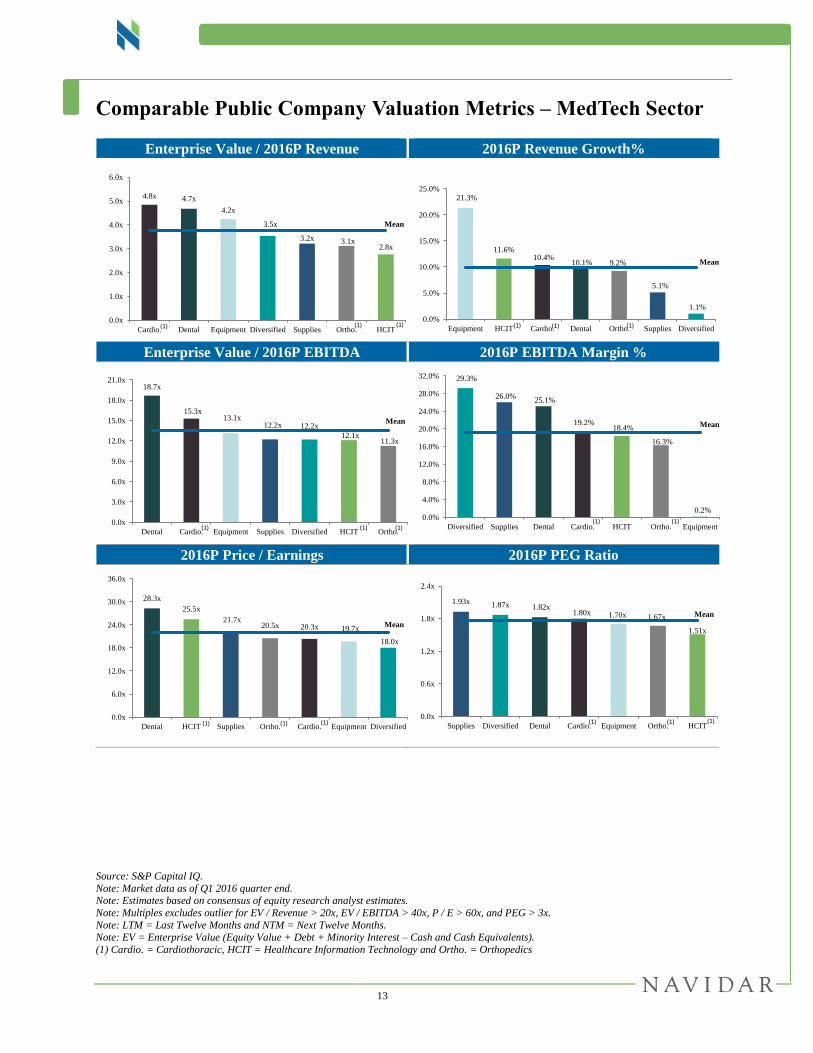
Comparable Public Company Valuation Metrics – MedTech Sector
Enterprise Value / 2016P Revenue 2016P Revenue Growth%
Enterprise Value / 2016P EBITDA 2016P EBITDA Margin %
2016P Price / Earnings 2016P PEG Ratio
Source: S&P Capital IQ.
Note: Market data as of Q1 2016 quarter end. Note: Estimates based on consensus of equity research analyst estimates.
Note: Multiples excludes outlier for EV / Revenue > 20x, EV / EBITDA > 40x, P / E > 60x, and PEG > 3x.
Note: LTM = Last Twelve Months and NTM = Next Twelve Months. Note: EV = Enterprise Value (Equity Value + Debt + Minority Interest – Cash and Cash Equivalents).
(1) Cardio. = Cardiothoracic, HCIT = Healthcare Information Technology and Ortho. = Orthopedics
4.8x 4.7x
4.2x
3.5x
3.2x 3.1x2.8x
0.0x
1.0x
2.0x
3.0x
4.0x
5.0x
6.0x
Cardio. Dental Equipment Diversified Supplies Ortho. HCIT
Mean
(1) (1)(1)
21.3%
11.6%10.4%
10.1% 9.2%
1.1%
0.0%
5.0%
10.0%
15.0%
20.0%
25.0%
Equipment HCIT Cardio. Dental Ortho. Supplies Diversified
5.1%
Mean
(1)(1)(1)
18.7x
15.3x13.1x
12.2x 12.2x
12.1x11.3x
0.0x
3.0x
6.0x
9.0x
12.0x
15.0x
18.0x
21.0x
Dental Cardio. Equipment Supplies Diversified HCIT Ortho.
Mean
(1)(1) (1)
29.3%
26.0%25.1%
19.2%18.4%
16.3%
0.2%0.0%
4.0%
8.0%
12.0%
16.0%
20.0%
24.0%
28.0%
32.0%
Diversified Supplies Dental Cardio. HCIT Ortho. Equipment
Mean
(1)(1)
28.3x
25.5x
21.7x20.5x 20.3x 19.7x
18.0x
0.0x
6.0x
12.0x
18.0x
24.0x
30.0x
36.0x
Dental HCIT Supplies Ortho. Cardio. Equipment Diversified
Mean
(1) (1)(1)
1.93x 1.87x 1.82x1.80x 1.70x 1.67x
1.51x
0.0x
0.6x
1.2x
1.8x
2.4x
Supplies Diversified Dental Cardio. Equipment Ortho. HCIT
Mean
(1) (1) (1)
14
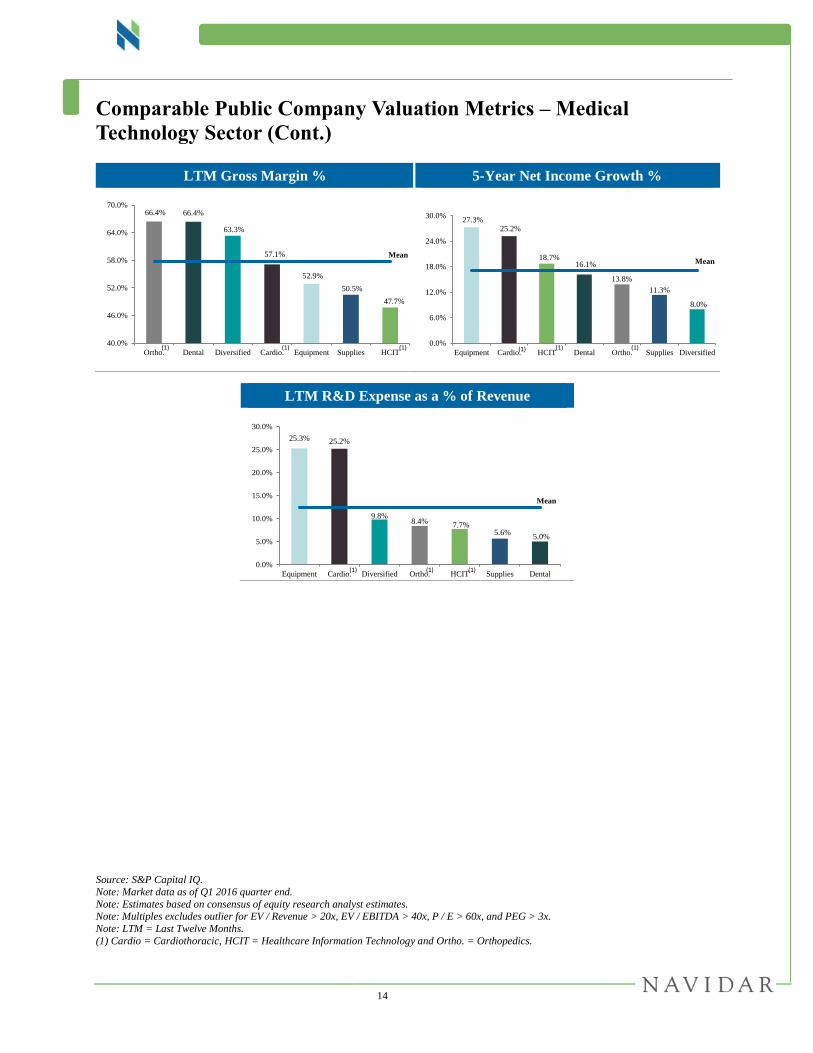
Comparable Public Company Valuation Metrics – Medical
Technology Sector (Cont.)
LTM Gross Margin % 5-Year Net Income Growth %
Source: S&P Capital IQ.
Note: Market data as of Q1 2016 quarter end.
Note: Estimates based on consensus of equity research analyst estimates. Note: Multiples excludes outlier for EV / Revenue > 20x, EV / EBITDA > 40x, P / E > 60x, and PEG > 3x.
Note: LTM = Last Twelve Months.
(1) Cardio = Cardiothoracic, HCIT = Healthcare Information Technology and Ortho. = Orthopedics.
66.4% 66.4%
63.3%
57.1%
52.9%
50.5%
47.7%
40.0%
46.0%
52.0%
58.0%
64.0%
70.0%
Ortho. Dental Diversified Cardio. Equipment Supplies HCIT
Mean
(1) (1) (1)
27.3%25.2%
18.7%16.1%
13.8%
11.3%
8.0%
0.0%
6.0%
12.0%
18.0%
24.0%
30.0%
Equipment Cardio. HCIT Dental Ortho. Supplies Diversified
Mean
(1) (1) (1)
LTM R&D Expense as a % of Revenue
25.3% 25.2%
9.8%8.4%
7.7%5.6%
5.0%
0.0%
5.0%
10.0%
15.0%
20.0%
25.0%
30.0%
Equipment Cardio. Diversified Ortho. HCIT Supplies Dental
Mean
(1) (1) (1)
15
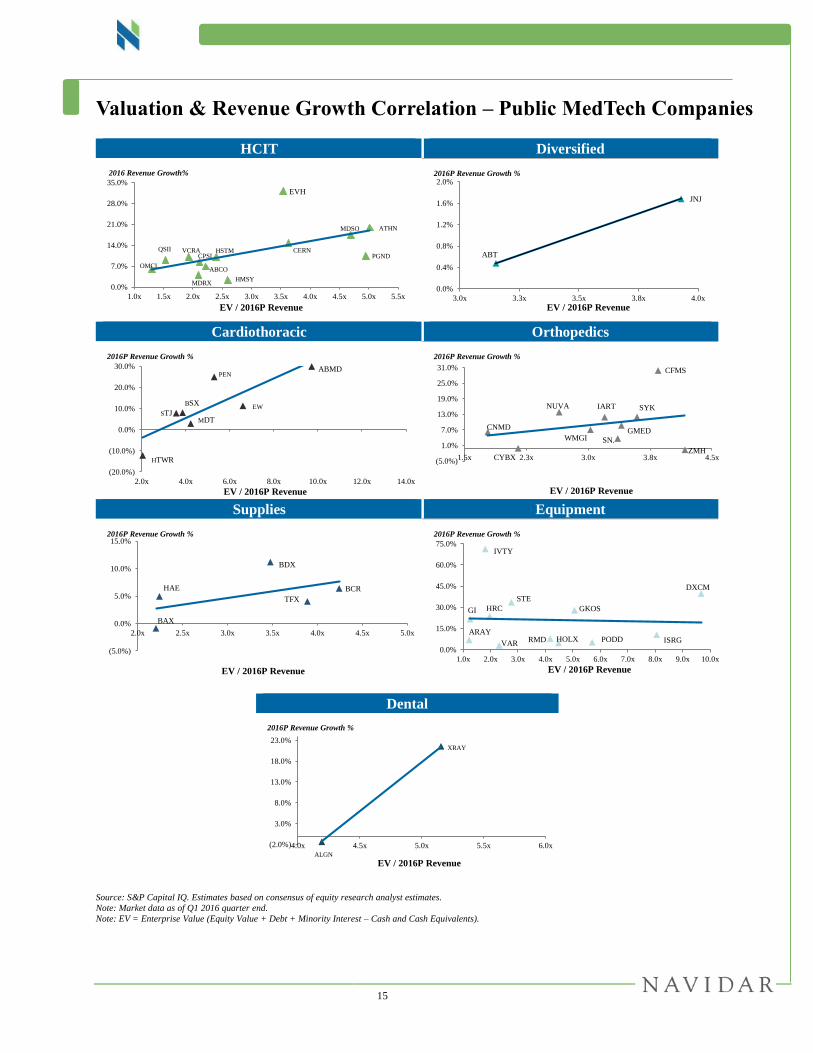
Valuation & Revenue Growth Correlation – Public MedTech Companies
HCIT Diversified
Cardiothoracic Orthopedics
Supplies Equipment
Dental
Source: S&P Capital IQ. Estimates based on consensus of equity research analyst estimates.
Note: Market data as of Q1 2016 quarter end.
Note: EV = Enterprise Value (Equity Value + Debt + Minority Interest – Cash and Cash Equivalents).
OMCL
ATHN
VCRA
MDRX
CPSI
ABCO
HSTM
HMSY
EVH
CERN
MDSO
PGNDQSII
0.0%
7.0%
14.0%
21.0%
28.0%
35.0%
1.0x 1.5x 2.0x 2.5x 3.0x 3.5x 4.0x 4.5x 5.0x 5.5x
EV / 2016P Revenue
2016 Revenue Growth%
ABT
JNJ
0.0%
0.4%
0.8%
1.2%
1.6%
2.0%
3.0x 3.3x 3.5x 3.8x 4.0x
EV / 2016P Revenue
2016P Revenue Growth %
EW
HTWR
BSX
STJMDT
PENABMD
(20.0%)
(10.0%)
0.0%
10.0%
20.0%
30.0%
2.0x 4.0x 6.0x 8.0x 10.0x 12.0x 14.0x
EV / 2016P Revenue
2016P Revenue Growth %
CNMD
IARTNUVA SYK
SN.
CYBX
WMGIGMED
ZMH
CFMS
(5.0%)
1.0%
7.0%
13.0%
19.0%
25.0%
31.0%
1.5x 2.3x 3.0x 3.8x 4.5x
EV / 2016P Revenue
2016P Revenue Growth %
TFX
BAX
HAE
BDX
BCR
(5.0%)
0.0%
5.0%
10.0%
15.0%
2.0x 2.5x 3.0x 3.5x 4.0x 4.5x 5.0x
EV / 2016P Revenue
2016P Revenue Growth %
GI
RMDARAY
VARHOLX
IVTY
HRC
PODD
STE
ISRG
GKOS
DXCM
0.0%
15.0%
30.0%
45.0%
60.0%
75.0%
1.0x 2.0x 3.0x 4.0x 5.0x 6.0x 7.0x 8.0x 9.0x 10.0x
EV / 2016P Revenue
2016P Revenue Growth %
XRAY
ALGN
(2.0%)
3.0%
8.0%
13.0%
18.0%
23.0%
4.0x 4.5x 5.0x 5.5x 6.0x
EV / 2016P Revenue
2016P Revenue Growth %
16
Appendix
17
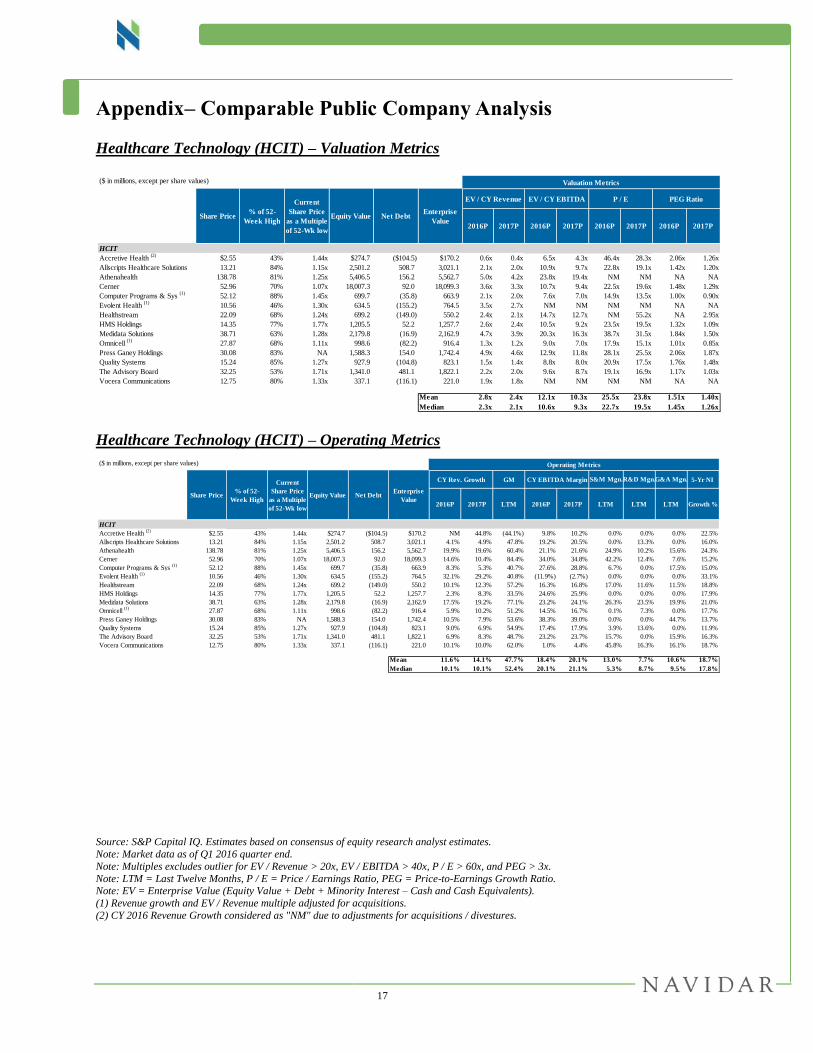
Appendix– Comparable Public Company Analysis
Healthcare Technology (HCIT) – Valuation Metrics
Healthcare Technology (HCIT) – Operating Metrics
Source: S&P Capital IQ. Estimates based on consensus of equity research analyst estimates.
Note: Market data as of Q1 2016 quarter end.
Note: Multiples excludes outlier for EV / Revenue > 20x, EV / EBITDA > 40x, P / E > 60x, and PEG > 3x.
Note: LTM = Last Twelve Months, P / E = Price / Earnings Ratio, PEG = Price-to-Earnings Growth Ratio. Note: EV = Enterprise Value (Equity Value + Debt + Minority Interest – Cash and Cash Equivalents).
(1) Revenue growth and EV / Revenue multiple adjusted for acquisitions.
(2) CY 2016 Revenue Growth considered as "NM" due to adjustments for acquisitions / divestures.
($ in millions, except per share values) Valuation Metrics Operating Metrics
EV / CY Revenue EV / CY EBITDA P / E PEG Ratio CY Rev. Growth
2016P 2017P 2016P 2017P 2016P 2017P 2016P 2017P
HCIT
Accretive Health (2)
$2.55 43% 1.44x $274.7 ($104.5) $170.2 0.6x 0.4x 6.5x 4.3x 46.4x 28.3x 2.06x 1.26x
Allscripts Healthcare Solutions 13.21 84% 1.15x 2,501.2 508.7 3,021.1 2.1x 2.0x 10.9x 9.7x 22.8x 19.1x 1.42x 1.20x
Athenahealth 138.78 81% 1.25x 5,406.5 156.2 5,562.7 5.0x 4.2x 23.8x 19.4x NM NM NA NA
Cerner 52.96 70% 1.07x 18,007.3 92.0 18,099.3 3.6x 3.3x 10.7x 9.4x 22.5x 19.6x 1.48x 1.29x
Computer Programs & Sys (1)
52.12 88% 1.45x 699.7 (35.8) 663.9 2.1x 2.0x 7.6x 7.0x 14.9x 13.5x 1.00x 0.90x
Evolent Health (1)
10.56 46% 1.30x 634.5 (155.2) 764.5 3.5x 2.7x NM NM NM NM NA NA
Healthstream 22.09 68% 1.24x 699.2 (149.0) 550.2 2.4x 2.1x 14.7x 12.7x NM 55.2x NA 2.95x
HMS Holdings 14.35 77% 1.77x 1,205.5 52.2 1,257.7 2.6x 2.4x 10.5x 9.2x 23.5x 19.5x 1.32x 1.09x
Medidata Solutions 38.71 63% 1.28x 2,179.8 (16.9) 2,162.9 4.7x 3.9x 20.3x 16.3x 38.7x 31.5x 1.84x 1.50x
Omnicell (1)
27.87 68% 1.11x 998.6 (82.2) 916.4 1.3x 1.2x 9.0x 7.0x 17.9x 15.1x 1.01x 0.85x
Press Ganey Holdings 30.08 83% NA 1,588.3 154.0 1,742.4 4.9x 4.6x 12.9x 11.8x 28.1x 25.5x 2.06x 1.87x
Quality Systems 15.24 85% 1.27x 927.9 (104.8) 823.1 1.5x 1.4x 8.8x 8.0x 20.9x 17.5x 1.76x 1.48x
The Advisory Board 32.25 53% 1.71x 1,341.0 481.1 1,822.1 2.2x 2.0x 9.6x 8.7x 19.1x 16.9x 1.17x 1.03x
Vocera Communications 12.75 80% 1.33x 337.1 (116.1) 221.0 1.9x 1.8x NM NM NM NM NA NA
Mean 2.8x 2.4x 12.1x 10.3x 25.5x 23.8x 1.51x 1.40x
Median 2.3x 2.1x 10.6x 9.3x 22.7x 19.5x 1.45x 1.26x
Share Price% of 52-
Week High
Current
Share Price
as a Multiple
of 52-Wk low
Equity Value Net DebtEnterprise
Value
($ in millions, except per share values) Operating Metrics
CY Rev. Growth GM CY EBITDA Margin 5-Yr NI
2016P 2017P LTM 2016P 2017P LTM LTM LTM Growth %
HCIT
Accretive Health (2)
$2.55 43% 1.44x $274.7 ($104.5) $170.2 NM 44.8% (44.1%) 9.8% 10.2% 0.0% 0.0% 0.0% 22.5%
Allscripts Healthcare Solutions 13.21 84% 1.15x 2,501.2 508.7 3,021.1 4.1% 4.9% 47.8% 19.2% 20.5% 0.0% 13.3% 0.0% 16.0%
Athenahealth 138.78 81% 1.25x 5,406.5 156.2 5,562.7 19.9% 19.6% 60.4% 21.1% 21.6% 24.9% 10.2% 15.6% 24.3%
Cerner 52.96 70% 1.07x 18,007.3 92.0 18,099.3 14.6% 10.4% 84.4% 34.0% 34.8% 42.2% 12.4% 7.6% 15.2%
Computer Programs & Sys (1)
52.12 88% 1.45x 699.7 (35.8) 663.9 8.3% 5.3% 40.7% 27.6% 28.8% 6.7% 0.0% 17.5% 15.0%
Evolent Health (1)
10.56 46% 1.30x 634.5 (155.2) 764.5 32.1% 29.2% 40.8% (11.9%) (2.7%) 0.0% 0.0% 0.0% 33.1%
Healthstream 22.09 68% 1.24x 699.2 (149.0) 550.2 10.1% 12.3% 57.2% 16.3% 16.8% 17.0% 11.6% 11.5% 18.8%
HMS Holdings 14.35 77% 1.77x 1,205.5 52.2 1,257.7 2.3% 8.3% 33.5% 24.6% 25.9% 0.0% 0.0% 0.0% 17.9%
Medidata Solutions 38.71 63% 1.28x 2,179.8 (16.9) 2,162.9 17.5% 19.2% 77.1% 23.2% 24.1% 26.3% 23.5% 19.9% 21.0%
Omnicell (1)
27.87 68% 1.11x 998.6 (82.2) 916.4 5.9% 10.2% 51.2% 14.5% 16.7% 0.1% 7.3% 0.0% 17.7%
Press Ganey Holdings 30.08 83% NA 1,588.3 154.0 1,742.4 10.5% 7.9% 53.6% 38.3% 39.0% 0.0% 0.0% 44.7% 13.7%
Quality Systems 15.24 85% 1.27x 927.9 (104.8) 823.1 9.0% 6.9% 54.9% 17.4% 17.9% 3.9% 13.6% 0.0% 11.9%
The Advisory Board 32.25 53% 1.71x 1,341.0 481.1 1,822.1 6.9% 8.3% 48.7% 23.2% 23.7% 15.7% 0.0% 15.9% 16.3%
Vocera Communications 12.75 80% 1.33x 337.1 (116.1) 221.0 10.1% 10.0% 62.0% 1.0% 4.4% 45.8% 16.3% 16.1% 18.7%
Mean 11.6% 14.1% 47.7% 18.4% 20.1% 13.0% 7.7% 10.6% 18.7%
Median 10.1% 10.1% 52.4% 20.1% 21.1% 5.3% 8.7% 9.5% 17.8%
Share Price% of 52-
Week High
Current
Share Price
as a Multiple
of 52-Wk low
Equity Value Net DebtEnterprise
Value
S&M Mgn.R&D Mgn.G&A Mgn.

18
Appendix– Comparable Public Company Analysis (Cont.)
Diversified – Valuation Metrics
Diversified – Operating Metrics
Cardiothoracic – Valuation Metrics
Cardiothoracic – Operating Metrics
Source: S&P Capital IQ. Estimates based on consensus of equity research analyst estimates.
Note: Market data as of Q1 2016 quarter end.
Note: Multiples excludes outlier for EV / Revenue > 20x, EV / EBITDA > 40x, P / E > 60x, and PEG > 3x.
Note: LTM = Last Twelve Months, P / E = Price / Earnings Ratio, PEG = Price-to-Earnings Growth Ratio. Note: EV = Enterprise Value (Equity Value + Debt + Minority Interest – Cash and Cash Equivalents).
($ in millions, except per share values) Valuation Metrics Operating Metrics
EV / CY Revenue EV / CY EBITDA P / E PEG Ratio CY Rev. Growth
2016P 2017P 2016P 2017P 2016P 2017P 2016P 2017P
Diversified
Abbott Laboratories $41.83 81% 1.16x $61,625.7 $2,876.0 $64,616.7 3.2x 3.0x 12.9x 11.9x 19.5x 17.4x 1.87x 1.67x
Johnson & Johnson 108.20 99% 1.32x 298,452.4 (18,515.0) 279,937.4 3.9x 3.8x 11.5x 10.8x 16.6x 15.6x NM 2.83x
Mean 3.5x 3.4x 12.2x 11.4x 18.0x 16.5x 1.87x 2.25x
Median 3.5x 3.4x 12.2x 11.4x 18.0x 16.5x 1.87x 2.25x
Share Price% of 52-
Week High
Current
Share Price
as a Multiple
of 52-Wk low
Equity Value Net DebtEnterprise
Value
($ in millions, except per share values) Operating Metrics
CY Rev. Growth GM CY EBITDA Margin 5-Yr NI
2016P 2017P LTM 2016P 2017P LTM LTM LTM Growth %
Diversified
Abbott Laboratories $41.83 81% 1.16x $61,625.7 $2,876.0 $64,616.7 0.5% 5.9% 57.3% 24.4% 24.9% 0.0% 6.7% 0.0% 10.4%
Johnson & Johnson 108.20 99% 1.32x 298,452.4 (18,515.0) 279,937.4 1.7% 4.7% 69.4% 34.1% 34.8% 3.6% 12.9% 0.0% 5.5%
Mean 1.1% 5.3% 63.3% 29.3% 29.9% 1.8% 9.8% 0.0% 8.0%
Median 1.1% 5.3% 63.3% 29.3% 29.9% 1.8% 9.8% 0.0% 8.0%
Share Price% of 52-
Week High
Current
Share Price
as a Multiple
of 52-Wk low
Equity Value Net DebtEnterprise
Value
S&M Mgn.R&D Mgn.G&A Mgn.
($ in millions, except per share values) Valuation Metrics Operating Metrics
EV / CY Revenue EV / CY EBITDA P / E PEG Ratio CY Rev. Growth
2016P 2017P 2016P 2017P 2016P 2017P 2016P 2017P
Cardiothoracic
ABIOMED $94.81 86% 1.61x $4,021.6 ($196.2) $3,825.4 9.7x 7.5x NM 26.2x NM 54.0x NA 1.36x
Bellerophon Therapeutics 2.46 23% 1.29x 33.2 (24.1) 9.1 NA NA NA NA NM NM NA NA
Boston Scientific 18.81 99% 1.33x 25,472.8 5,358.0 30,830.8 3.9x 3.7x 13.8x 12.7x 17.9x 15.8x 1.63x 1.44x
Penumbra 46.00 77% NA 1,379.0 (148.8) 1,230.2 5.3x 4.3x NM NM NM NM NA NA
Edwards Lifesciences 88.21 98% 1.44x 18,929.7 (624.8) 18,304.9 6.6x 6.0x 21.8x 19.2x 33.4x 29.0x 2.06x 1.79x
Hansen Medical 2.61 21% 2.04x 49.3 4.6 53.9 3.4x 2.1x NA NA NM NM NA NA
Heartware International 31.42 33% 1.26x 550.9 (52.5) 498.4 2.0x 1.9x NM NM NM NM NA NA
Medtronic 75.00 95% 1.35x 105,078.2 18,593.0 123,671.2 4.2x 4.0x 12.9x 12.1x 16.2x 15.2x 2.08x 1.95x
St. Jude Medical 55.00 68% 1.13x 15,601.8 5,715.0 21,316.8 3.6x 3.4x 12.7x 11.6x 13.8x 12.6x 1.41x 1.29x
Mean 4.8x 4.1x 15.3x 16.4x 20.3x 25.3x 1.80x 1.56x
Median 4.0x 3.9x 13.4x 12.7x 17.1x 15.8x 1.85x 1.44x
Share Price% of 52-
Week High
Current
Share Price
as a Multiple
of 52-Wk low
Equity Value Net DebtEnterprise
Value
($ in millions, except per share values) Operating Metrics
CY Rev. Growth GM CY EBITDA Margin 5-Yr NI
2016P 2017P LTM 2016P 2017P LTM LTM LTM Growth %
Cardiothoracic
ABIOMED $94.81 86% 1.61x $4,021.6 ($196.2) $3,825.4 29.8% 29.4% 84.6% 23.2% 28.6% 0.0% 14.6% 0.0% 39.7%
Bellerophon Therapeutics 2.46 23% 1.29x 33.2 (24.1) 9.1 NA NA 0.0% NA NA NA NA NA NM
Boston Scientific 18.81 99% 1.33x 25,472.8 5,358.0 30,830.8 8.0% 5.0% 71.6% 27.9% 29.0% 0.0% 11.8% 0.0% 11.0%
Penumbra 46.00 77% NA 1,379.0 (148.8) 1,230.2 25.0% 22.3% 66.7% 0.5% 2.3% 0.3% 9.7% 0.0% 45.0%
Edwards Lifesciences 88.21 98% 1.44x 18,929.7 (624.8) 18,304.9 11.3% 10.3% 75.2% 30.3% 31.2% 0.0% 15.4% 0.0% 16.2%
Hansen Medical 2.61 21% 2.04x 49.3 4.6 53.9 NA 62.7% 14.2% NA NA 4.1% 87.1% 0.0% NM
Heartware International 31.42 33% 1.26x 550.9 (52.5) 498.4 (12.2%) 10.4% 62.7% (8.8%) (4.3%) 0.0% 42.9% 0.0% 46.7%
Medtronic 75.00 95% 1.35x 105,078.2 18,593.0 123,671.2 2.9% 4.6% 69.4% 32.8% 33.3% 0.0% 7.7% 0.0% 7.8%
St. Jude Medical 55.00 68% 1.13x 15,601.8 5,715.0 21,316.8 7.8% 4.9% 69.2% 28.2% 29.4% 0.0% 12.2% 0.0% 9.8%
Mean 10.4% 18.7% 57.1% 19.2% 21.4% 0.5% 25.2% 0.0% 25.2%
Median 8.0% 10.4% 69.2% 27.9% 29.0% 0.0% 13.4% 0.0% 16.2%
Share Price% of 52-
Week High
Current
Share Price
as a Multiple
of 52-Wk low
Equity Value Net DebtEnterprise
Value
S&M Mgn.R&D Mgn.G&A Mgn.

19
Appendix – Comparable Public Company Analysis (Cont.)
Orthopedics – Valuation Metrics
Orthopedics – Operating Metrics
Source: S&P Capital IQ. Estimates based on consensus of equity research analyst estimates.
Note: Market data as of Q1 2016 quarter end. Note: Multiples excludes outliers for EV / Revenue > 20x, EV / EBITDA > 40x, P / E > 60x, and PEG > 3x.
Note: LTM = Last Twelve Months, P / E = Price / Earnings Ratio, PEG = Price-to-Earnings Growth Ratio.
Note: EV = Enterprise Value (Equity Value + Debt + Minority Interest – Cash and Cash Equivalents). (1) Revenue growth and EV / Revenue multiple adjusted for acquisitions.
($ in millions, except per share values) Valuation Metrics Operating Metrics
EV / CY Revenue EV / CY EBITDA P / E PEG Ratio
2016P 2017P 2016P 2017P 2016P 2017P 2016P 2017P
Orthopedics
ConforMIS $10.75 40% 1.42x $446.9 ($116.7) $330.2 3.8x 2.7x NM NM NM NM NA NA
CONMED 41.94 69% 1.18x 1,162.3 198.3 1,360.6 1.8x 1.7x 10.9x 9.8x 22.1x 21.4x 1.70x 1.65x
Globus Medical 23.75 82% 1.16x 2,265.1 (281.0) 1,984.1 3.4x 3.1x 9.4x 8.7x 19.8x 17.9x 1.60x 1.44x
Integra LifeSciences Holdings 67.36 96% 1.23x 2,492.4 666.8 3,159.2 3.2x 3.0x 13.4x 12.2x 19.6x 17.4x 1.64x 1.46x
LivaNova (1)
53.96 77% 1.05x 2,641.8 56.5 2,698.3 2.2x 2.0x 10.7x 9.0x 18.7x 16.7x 0.60x 0.54x
NuVasive 48.65 86% 1.32x 2,417.5 18.8 2,443.6 2.6x 2.4x 10.4x 9.1x 32.7x 25.9x 2.38x 1.89x
Smith & Nephew 16.53 94% 1.14x 14,799.2 1,360.0 16,127.5 3.4x 3.2x 11.3x 10.2x 18.8x 17.1x 1.72x 1.57x
Stryker Corp. 107.29 99% 1.24x 40,039.7 (53.0) 39,986.7 3.6x 3.3x 13.4x 13.1x 18.9x 17.0x 2.43x 2.17x
Wright Medical Group (1)
16.60 68% 1.11x 1,685.6 439.7 2,125.3 3.0x 2.7x NM 36.2x NM NM NA NA
Zimmer Biomet Holdings (1)
106.63 90% 1.21x 21,201.7 9,932.4 31,135.6 4.2x 4.1x 10.6x 10.0x 13.5x 12.3x 1.27x 1.15x
Mean 3.1x 2.8x 11.3x 13.1x 20.5x 18.2x 1.67x 1.48x
Median 3.3x 2.9x 10.8x 10.0x 19.3x 17.2x 1.67x 1.51x
Share Price% of 52-
Week High
Current
Share Price
as a Multiple
of 52-Wk low
Equity Value Net DebtEnterprise
Value
($ in millions, except per share values) Operating Metrics
CY Rev. Growth GM CY EBITDA Margin 5-Yr NI
2016P 2017P LTM 2016P 2017P LTM LTM LTM Growth %
Orthopedics
ConforMIS $10.75 40% 1.42x $446.9 ($116.7) $330.2 29.9% 40.5% 37.0% (58.3%) (32.7%) 60.9% 25.7% 35.1% NM
CONMED 41.94 69% 1.18x 1,162.3 198.3 1,360.6 6.2% 4.1% 54.2% 16.4% 17.4% 0.0% 3.8% 0.0% 13.0%
Globus Medical 23.75 82% 1.16x 2,265.1 (281.0) 1,984.1 8.7% 9.6% 76.8% 36.1% 35.5% 0.0% 6.9% 0.0% 12.4%
Integra LifeSciences Holdings 67.36 96% 1.23x 2,492.4 666.8 3,159.2 11.9% 7.4% 65.0% 23.9% 24.4% 0.0% 5.7% 0.0% 11.9%
LivaNova (1)
53.96 77% 1.05x 2,641.8 56.5 2,698.3 (0.1%) 5.2% 64.1% 20.2% 22.8% 0.0% 12.0% 0.0% 31.0%
NuVasive 48.65 86% 1.32x 2,417.5 18.8 2,443.6 13.8% 8.6% 76.0% 25.4% 26.8% 0.0% 4.4% 0.0% 13.7%
Smith & Nephew 16.53 94% 1.14x 14,799.2 1,360.0 16,127.5 3.7% 5.0% 75.3% 29.7% 31.2% 2.0% 4.8% 0.0% 10.9%
Stryker Corp. 107.29 99% 1.24x 40,039.7 (53.0) 39,986.7 11.9% 8.3% 66.5% 26.8% 25.4% 0.0% 6.3% 0.0% 7.8%
Wright Medical Group (1)
16.60 68% 1.11x 1,685.6 439.7 2,125.3 7.0% 11.6% 74.0% 3.6% 7.5% 0.0% 9.6% 0.0% 13.0%
Zimmer Biomet Holdings (1)
106.63 90% 1.21x 21,201.7 9,932.4 31,135.6 (0.7%) 2.9% 75.3% 39.2% 40.6% 0.0% 4.5% 0.0% 10.6%
Mean 9.2% 10.3% 66.4% 16.3% 19.9% 6.3% 8.4% 3.5% 13.8%
Median 7.9% 7.9% 70.3% 24.6% 24.9% 0.0% 6.0% 0.0% 12.4%
Share Price% of 52-
Week High
Current
Share Price
as a Multiple
of 52-Wk low
Equity Value Net DebtEnterprise
Value
S&M Mgn.R&D Mgn.G&A Mgn.

20
Appendix– Comparable Public Company Analysis (Cont.)
Supplies – Valuation Metrics
Supplies – Operating Metrics
Source: S&P Capital IQ. Estimates based on consensus of equity research analyst estimates.
Note: Market data as of Q1 2016 quarter end.
Note: Multiples excludes outlier for EV / Revenue > 20x, EV / EBITDA > 40x, P / E > 60x, and PEG > 3x.
Note: LTM = Last Twelve Months, P / E = Price / Earnings Ratio, PEG = Price-to-Earnings Growth Ratio. Note: EV = Enterprise Value (Equity Value + Debt + Minority Interest – Cash and Cash Equivalents).
($ in millions, except per share values) Valuation Metrics Operating Metrics
EV / CY Revenue EV / CY EBITDA P / E PEG Ratio CY Rev. Growth
2016P 2017P 2016P 2017P 2016P 2017P 2016P 2017P
Supplies
Baxter International $41.08 56% 1.28x $22,601.1 ($841.0) $21,779.1 2.2x 2.1x 12.6x 11.0x 27.4x 23.3x 2.49x 2.13x
Becton, Dickinson and Co. 151.82 96% 1.18x 32,158.0 11,203.0 43,361.0 3.5x 3.3x 12.9x 11.6x 17.6x 15.7x 1.55x 1.38x
CR Bard 202.67 99% 1.23x 14,839.9 455.3 15,295.2 4.2x 4.0x 13.3x 12.4x 21.4x 18.3x 1.98x 1.70x
Haemonetics 34.98 77% 1.20x 1,778.7 321.9 2,100.5 2.2x 2.2x 9.3x 9.0x 19.8x 17.4x 1.54x 1.36x
Teleflex 157.01 98% 1.32x 6,547.6 727.6 7,277.0 3.9x 3.7x 13.1x 11.9x 22.1x 19.9x 2.07x 1.87x
Mean 3.2x 3.1x 12.2x 11.2x 21.7x 18.9x 1.93x 1.69x
Median 3.5x 3.3x 12.9x 11.6x 21.4x 18.3x 1.98x 1.70x
Share Price% of 52-
Week High
Current
Share Price
as a Multiple
of 52-Wk low
Equity Value Net DebtEnterprise
Value
($ in millions, except per share values) Operating Metrics
CY Rev. Growth GM CY EBITDA Margin 5-Yr NI
2016P 2017P LTM 2016P 2017P LTM LTM LTM Growth %
Supplies
Baxter International $41.08 56% 1.28x $22,601.1 ($841.0) $21,779.1 (0.9%) 3.4% 41.7% 17.5% 19.3% 0.0% 5.9% 0.0% 11.0%
Becton, Dickinson and Co. 151.82 96% 1.18x 32,158.0 11,203.0 43,361.0 11.2% 4.2% 47.7% 27.0% 28.9% 0.0% 6.2% 0.0% 11.4%
CR Bard 202.67 99% 1.23x 14,839.9 455.3 15,295.2 6.4% 5.2% 62.4% 32.0% 32.6% 0.1% 7.5% 0.0% 10.8%
Haemonetics 34.98 77% 1.20x 1,778.7 321.9 2,100.5 4.9% 3.5% 47.6% 24.0% 24.0% 0.5% 5.7% 0.0% 12.8%
Teleflex 157.01 98% 1.32x 6,547.6 727.6 7,277.0 4.0% 5.4% 53.0% 29.6% 31.1% 0.0% 2.9% 0.0% 10.7%
Mean 5.1% 4.3% 50.5% 26.0% 27.2% 0.1% 5.6% 0.0% 11.3%
Median 4.9% 4.2% 47.7% 27.0% 28.9% 0.0% 5.9% 0.0% 11.0%
Share Price% of 52-
Week High
Current
Share Price
as a Multiple
of 52-Wk low
Equity Value Net DebtEnterprise
Value
S&M Mgn.R&D Mgn.G&A Mgn.

21
Appendix– Comparable Public Company Analysis (Cont.)
Equipment – Valuation Metrics
Equipment – Operating Metrics
Source: S&P Capital IQ. Estimates based on consensus of equity research analyst estimates.
Note: Market data as of Q1 2016 quarter end.
Note: Multiples excludes outlier for EV / Revenue > 20x, EV / EBITDA > 40x, P / E > 60x, and PEG > 3x.
Note: LTM = Last Twelve Months, P / E = Price / Earnings Ratio, PEG = Price-to-Earnings Growth Ratio. Note: EV = Enterprise Value (Equity Value + Debt + Minority Interest – Cash and Cash Equivalents).
( 2) CY 2016 Revenue Growth considered as "NM" due to adjustments for acquisitions / divestures.
($ in millions, except per share values) Valuation Metrics Operating Metrics
EV / CY Revenue EV / CY EBITDA P / E PEG Ratio CY Rev. Growth
2016P 2017P 2016P 2017P 2016P 2017P 2016P 2017P
Equipment
Accuray $5.78 58% 1.20x $467.3 $51.0 $518.2 1.2x 1.1x 13.5x 10.4x NM NM NA NA
AirXpanders (2)
0.87 84% 2.35x 183.5 (16.5) 166.1 NM 4.8x NM 17.7x NM 18.9x NA NA
NovoCure (2)
14.48 47% 1.43x 1,222.5 (246.1) 976.4 6.7x 3.5x NM NM NM NM NA NA
DexCom 67.91 66% 1.42x 5,551.0 (112.9) 5,438.1 9.7x 7.0x NM NM NM NM NA NA
EndoChoice Holdings 5.21 26% NA 135.5 (25.3) 110.2 1.3x 0.9x NM NM NM NM NA NA
Glaukos 16.86 50% 1.18x 545.3 (81.4) 463.9 5.1x 4.1x NM NM NM NM NA NA
Hill-Rom Holdings 50.30 86% 1.17x 3,285.4 2,026.2 5,321.1 2.0x 1.9x 10.1x 9.3x 14.6x 13.4x 0.89x 0.82x
Hologic 34.50 80% 1.08x 9,791.7 2,981.0 12,772.7 4.5x 4.3x 12.0x 11.5x 18.0x 16.5x 1.84x 1.69x
Insulet 33.16 82% 1.39x 1,890.6 54.8 1,945.4 5.7x 4.9x NM NM NM NM NA NA
Intuitive Surgical 601.05 99% 1.34x 22,646.2 (1,559.8) 21,086.4 8.1x 7.3x 18.7x 16.7x 29.1x 26.0x 2.49x 2.23x
Invuity 7.22 40% 1.19x 96.8 (31.8) 64.9 1.8x 1.1x NM NM NM NM NA NA
ResMed 57.82 77% 1.18x 8,097.2 (257.2) 7,839.9 4.2x 3.7x 13.5x 12.1x 20.5x 18.5x 1.76x 1.59x
Steris 71.05 90% 1.17x 6,101.7 1,408.1 7,524.3 2.8x 2.6x 13.1x 11.6x 18.7x 16.6x 1.52x 1.35x
Varian Medical Systems 80.02 83% 1.13x 7,642.1 (225.1) 7,431.2 2.3x 2.2x 11.0x 10.6x 17.2x 15.8x 1.72x 1.58x
Mean 4.2x 3.5x 13.1x 12.5x 19.7x 18.0x 1.70x 1.54x
Median 4.2x 3.6x 13.1x 11.6x 18.4x 16.6x 1.74x 1.59x
Share Price% of 52-
Week High
Current
Share Price
as a Multiple
of 52-Wk low
Equity Value Net DebtEnterprise
Value
($ in millions, except per share values) Operating Metrics
CY Rev. Growth GM CY EBITDA Margin 5-Yr NI
2016P 2017P LTM 2016P 2017P LTM LTM LTM Growth %
Equipment
Accuray $5.78 58% 1.20x $467.3 $51.0 $518.2 6.8% 8.7% 39.1% 9.0% 10.8% 14.4% 14.2% 12.4% 15.0%
AirXpanders (2)
0.87 84% 2.35x 183.5 (16.5) 166.1 NM NM NM NM 27.0% 0.0% NM 0.0% NM
NovoCure (2)
14.48 47% 1.43x 1,222.5 (246.1) 976.4 NM NM 37.8% (41.2%) (14.9%) 117.5% 132.2% 102.3% 60.0%
DexCom 67.91 66% 1.42x 5,551.0 (112.9) 5,438.1 39.8% 37.9% 69.3% (3.6%) 13.2% 0.0% 34.2% 0.0% 32.5%
EndoChoice Holdings 5.21 26% NA 135.5 (25.3) 110.2 21.6% 32.7% 32.2% (35.7%) (16.7%) 40.6% 23.9% 32.0% 102.9%
Glaukos 16.86 50% 1.18x 545.3 (81.4) 463.9 27.9% 24.5% 81.9% (9.6%) 1.7% 1.1% 34.9% 0.0% NM
Hill-Rom Holdings 50.30 86% 1.17x 3,285.4 2,026.2 5,321.1 23.7% 2.7% 45.9% 19.6% 20.7% 0.0% 4.7% 0.0% 16.4%
Hologic 34.50 80% 1.08x 9,791.7 2,981.0 12,772.7 4.8% 4.0% 65.1% 37.1% 37.3% 13.8% 7.9% 10.2% 9.8%
Insulet 33.16 82% 1.39x 1,890.6 54.8 1,945.4 5.2% 17.2% 45.7% (3.8%) 0.3% 27.3% 13.3% 21.0% 25.0%
Intuitive Surgical 601.05 99% 1.34x 22,646.2 (1,559.8) 21,086.4 10.6% 9.7% 66.7% 43.1% 43.8% 0.0% 8.3% 0.0% 11.7%
Invuity 7.22 40% 1.19x 96.8 (31.8) 64.9 71.3% 71.0% 63.2% (85.1%) (26.3%) 0.0% 37.4% 0.0% 20.0%
ResMed 57.82 77% 1.18x 8,097.2 (257.2) 7,839.9 7.8% 11.7% 58.3% 31.0% 30.8% 0.0% 6.4% 0.0% 11.6%
Steris 71.05 90% 1.17x 6,101.7 1,408.1 7,524.3 33.5% 6.0% 41.3% 21.1% 22.4% 0.5% 2.8% 0.0% 12.3%
Varian Medical Systems 80.02 83% 1.13x 7,642.1 (225.1) 7,431.2 3.1% 5.1% 40.6% 21.0% 20.8% 0.0% 8.0% 0.0% 10.0%
Mean 21.3% 19.3% 52.9% 0.2% 12.2% 15.4% 25.3% 12.7% 27.3%
Median 16.1% 10.7% 45.9% 9.0% 17.0% 0.2% 13.3% 0.0% 15.7%
Share Price% of 52-
Week High
Current
Share Price
as a Multiple
of 52-Wk low
Equity Value Net DebtEnterprise
Value
S&M Mgn.R&D Mgn.G&A Mgn.

22
Appendix– Comparable Public Company Analysis (Cont.)
Dental – Valuation Metrics
Dental – Operating Metrics
Source: S&P Capital IQ. Estimates based on consensus of equity research analyst estimates.
Note: Market data as of Q1 2016 quarter end. Note: Multiples excludes outlier for EV / Revenue > 20x, EV / EBITDA > 40x, P / E > 60x, and PEG > 3x.
Note: LTM = Last Twelve Months, P / E = Price / Earnings Ratio, PEG = Price-to-Earnings Growth Ratio.
Note: EV = Enterprise Value (Equity Value + Debt + Minority Interest – Cash and Cash Equivalents). (1) Revenue growth and EV / Revenue multiple adjusted for acquisitions.
($ in millions, except per share values) Valuation Metrics Operating Metrics
EV / CY Revenue EV / CY EBITDA P / E PEG Ratio CY Rev. Growth
2016P 2017P 2016P 2017P 2016P 2017P 2016P 2017P
Dental
Align Technology $72.69 99% 1.41x $5,827.3 ($527.3) $5,300.0 5.2x 4.4x 21.3x 17.4x 34.1x 26.4x 1.60x 1.24x
DENTSPLY International (1)
61.63 97% 1.25x 14,900.0 854.8 15,756.2 4.2x 3.8x 16.1x 13.7x 22.4x 19.8x 2.05x 1.81x
Mean 4.7x 4.1x 18.7x 15.5x 28.3x 23.1x 1.82x 1.53x
Median 4.7x 4.1x 18.7x 15.5x 28.3x 23.1x 1.82x 1.53x
Share Price% of 52-
Week High
Current
Share Price
as a Multiple
of 52-Wk low
Equity Value Net DebtEnterprise
Value
($ in millions, except per share values) Operating Metrics
CY Rev. Growth GM CY EBITDA Margin 5-Yr NI
2016P 2017P LTM 2016P 2017P LTM LTM LTM Growth %
Dental
Align Technology $72.69 99% 1.41x $5,827.3 ($527.3) $5,300.0 21.6% 17.1% 75.7% 24.2% 25.3% 2.8% 7.2% 0.0% 21.3%
DENTSPLY International (1)
61.63 97% 1.25x 14,900.0 854.8 15,756.2 (1.4%) 11.6% 57.0% 26.1% 27.5% 0.0% 2.8% 0.0% 10.9%
Mean 10.1% 14.3% 66.4% 25.1% 26.4% 1.4% 5.0% 0.0% 16.1%
Median 10.1% 14.3% 66.4% 25.1% 26.4% 1.4% 5.0% 0.0% 16.1%
Share Price% of 52-
Week High
Current
Share Price
as a Multiple
of 52-Wk low
Equity Value Net DebtEnterprise
Value
S&M Mgn.R&D Mgn.G&A Mgn.

23
Appendix – Q1 Selected MedTech M&A Transactions
Selected Global MedTech M&A Comparables (Deals > $ 10 million or Disclosed Multiples)
Source: S&P Capital IQ.
Note: EV = Enterprise Value (Equity Value + Debt + Minority Interest – Cash and Cash Equivalents). (1) Excludes outlier multiples for transactions with EV / Revenue > 20x and EV / EBITDA >40x.
Valuation Metrics
Date Acquirer Target
Enterprise
Value
($USDmm)
EV / LTM
Revenues
EV / LTM
EBITDA
3/31/2016 Gentherm Cincinnati Sub-Zero Products $65 1.0x NA
3/30/2016 DiaSorin Focus Diagnostics 300 3.8x NA
3/29/2016 Affinity Equity Partners Health Communication Network 117 NA NA
3/29/2016 Trinity Medical Devices CAS Medical Systems, Neonatal Business 4 1.7x NA
3/25/2016 Beijing Chieftain Control Engineering Guangzhou Longest Science & Tech. 79 NA NA
3/24/2016 Meridian Bioscience Magellan Diagnostics 66 4.1x NA
3/23/2016 GI Partners; Allscripts Healthcare Solutions Netsmart Technologies 950 NA NA
3/17/2016 Canon Toshiba Medical Systems 5,981 NA NA
3/15/2016 Heska Cuattro Veterinary, LLC 10 1.6x NA
3/11/2016 WNS (Holdings) Value Edge Research Services 18 NA NA
3/7/2016 Anhui Lucky Health Technology Shenzhen Forrest Electronic Tech. 38 2.2x NA
3/2/2016 Boditech Med ) Immunostics 14 NA NA
3/1/2016 Investor Group Medi-Globe 152 1.2x 8.4x
2/29/2016 Decision Resources Adaptive Software 25 7.7x NA
2/23/2016 Harbin Gloria Pharmaceuticals Proteus Digital Health 42 NA NA
2/22/2016 Resmed Brightree 800 7.1x 18.6x
2/18/2016 IBM Watson Health Truven Holding 3,556 5.9x 35.8x
2/18/2016 Judges Scientific CoolLED 6 1.8x NA
2/16/2016 Stryker Physio-Control NA NA NA
2/5/2016 Halma CenTrak 140 3.2x NA
2/4/2016 Merit Medical Systems CryoLife, HeRO Graft Product Line 19 2.5x NA
2/3/2016 Fullshare Holdings Shenzhen Anke High-tech 29 NA NA
2/2/2016 TE Connectivity Creganna Medical 895 3.6x NA
2/1/2016 Abbott Laboratories Alere 8,615 3.5x 15.2x
2/1/2016 Stryker Sage Products 2,775 6.5x NA
1/25/2016 Ningbo Xinhai Electric Unimed Medical Supplies 56 NA NA
1/22/2016 Shanghai Yi'an Investment Center Essen Technology (Beijing) 114 NA NA
1/22/2016 Shanghai Kinetic Medical Essen Technology (Beijing) 114 NA NA
1/19/2016 Avant Diagnostics Amarantus Diagnostics 19 NA NA
1/11/2016 SurModics NorMedix 14 NA NA
1/8/2016 Shandong Oriental Ocean Sci-Tech Avioq 68 NA NA
1/8/2016 Shanghai Kinetic Medical Jiangsu IDEAL Medical Science & Tech. 120 NA NA
1/5/2016 NuVasive Ellipse Technologies 410 10.2x NA
Mean (1) 4.0x 19.5x
Median (1) 3.5x 16.9x
24
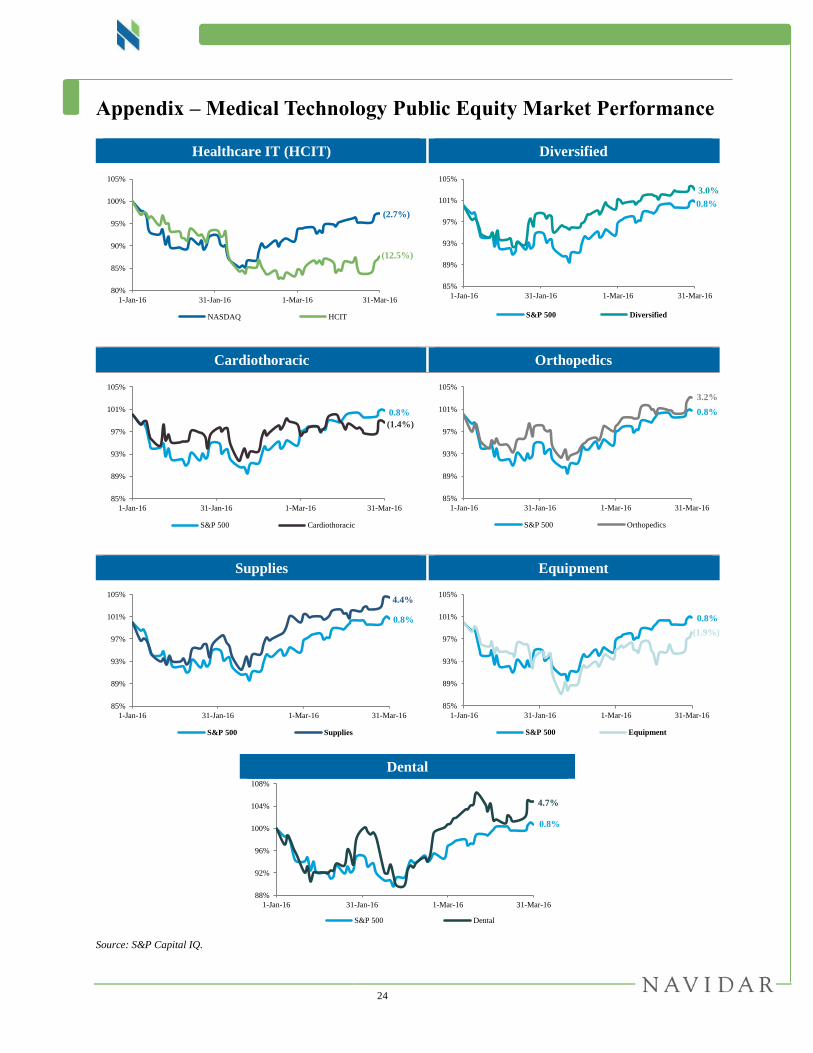
Appendix – Medical Technology Public Equity Market Performance
Healthcare IT (HCIT) Diversified
Cardiothoracic Orthopedics
Supplies Equipment
Source: S&P Capital IQ.
80%
85%
90%
95%
100%
105%
1-Jan-16 31-Jan-16 1-Mar-16 31-Mar-16
NASDAQ HCIT
(2.7%)
(12.5%)
85%
89%
93%
97%
101%
105%
1-Jan-16 31-Jan-16 1-Mar-16 31-Mar-16
S&P 500 Diversified
0.8%
3.0%
85%
89%
93%
97%
101%
105%
1-Jan-16 31-Jan-16 1-Mar-16 31-Mar-16
S&P 500 Cardiothoracic
0.8%
(1.4%)
85%
89%
93%
97%
101%
105%
1-Jan-16 31-Jan-16 1-Mar-16 31-Mar-16
S&P 500 Orthopedics
3.2%
0.8%
85%
89%
93%
97%
101%
105%
1-Jan-16 31-Jan-16 1-Mar-16 31-Mar-16
S&P 500 Supplies
4.4%
0.8%
85%
89%
93%
97%
101%
105%
1-Jan-16 31-Jan-16 1-Mar-16 31-Mar-16
S&P 500 Equipment
(1.9%)
0.8%
Dental
88%
92%
96%
100%
104%
108%
1-Jan-16 31-Jan-16 1-Mar-16 31-Mar-16
S&P 500 Dental
4.7%
0.8%
25
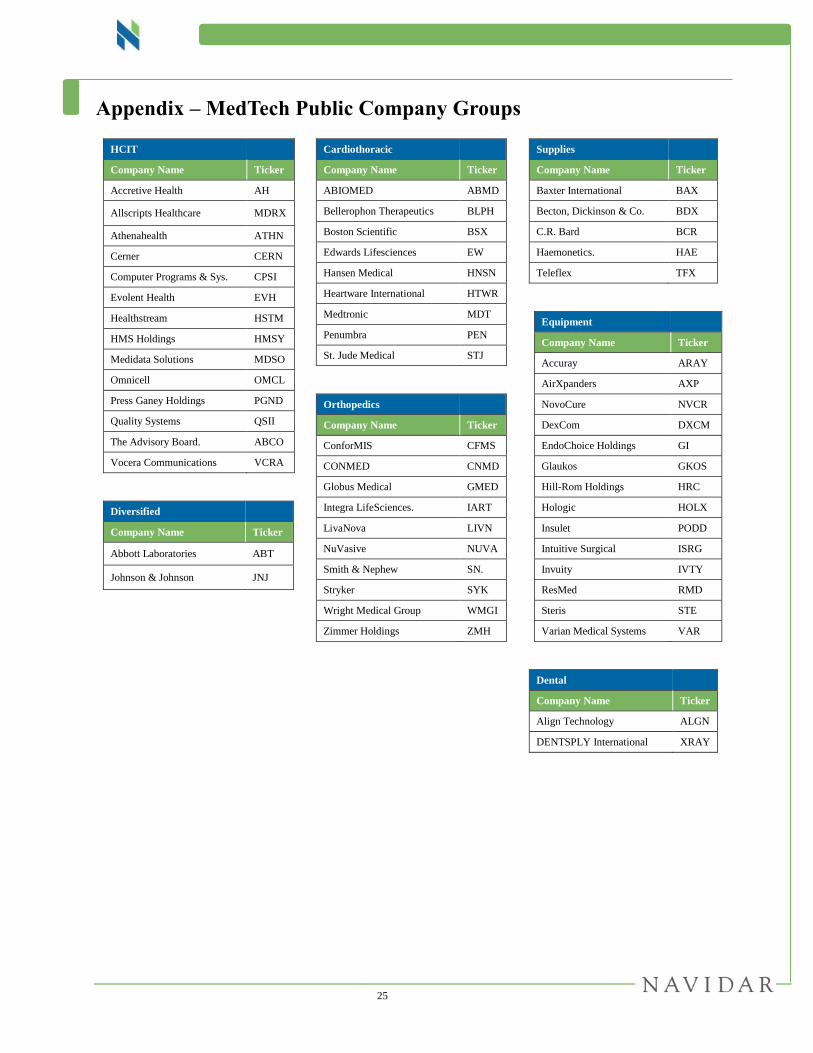
Appendix – MedTech Public Company Groups
HCIT
Company Name Ticker
Accretive Health AH
Allscripts Healthcare MDRX
Athenahealth ATHN
Cerner CERN
Computer Programs & Sys. CPSI
Evolent Health EVH
Healthstream HSTM
HMS Holdings HMSY
Medidata Solutions MDSO
Omnicell OMCL
Press Ganey Holdings PGND
Quality Systems QSII
The Advisory Board. ABCO
Vocera Communications VCRA
Diversified
Company Name Ticker
Abbott Laboratories ABT
Johnson & Johnson JNJ
Cardiothoracic
Company Name Ticker
ABIOMED ABMD
Bellerophon Therapeutics BLPH
Boston Scientific BSX
Edwards Lifesciences EW
Hansen Medical HNSN
Heartware International HTWR
Medtronic MDT
Penumbra PEN
St. Jude Medical STJ
Orthopedics
Company Name Ticker
ConforMIS CFMS
CONMED CNMD
Globus Medical GMED
Integra LifeSciences. IART
LivaNova LIVN
NuVasive NUVA
Smith & Nephew SN.
Stryker SYK
Wright Medical Group WMGI
Zimmer Holdings ZMH
Supplies
Company Name Ticker
Baxter International BAX
Becton, Dickinson & Co. BDX
C.R. Bard BCR
Haemonetics. HAE
Teleflex TFX
Equipment
Company Name Ticker
Accuray ARAY
AirXpanders AXP
NovoCure NVCR
DexCom DXCM
EndoChoice Holdings GI
Glaukos GKOS
Hill-Rom Holdings HRC
Hologic HOLX
Insulet PODD
Intuitive Surgical ISRG
Invuity IVTY
ResMed RMD
Steris STE
Varian Medical Systems VAR
Dental
Company Name Ticker
Align Technology ALGN
DENTSPLY International XRAY

26
Disclaimer
This Quarterly Report (the “Quarterly”) has been prepared solely for informational purposes and may not be used or
relied upon for any purpose other than as specifically contemplated by a written agreement with us.
This Quarterly is not intended to provide the sole basis for evaluating, and should not be considered a
recommendation with respect to, any transaction or other matter. This Quarterly does not constitute an offer, or the
solicitation of an offer, to buy or sell any securities or other financial product, to participate in any transaction or to
provide any investment banking or other services, and should not be deemed to be a commitment or undertaking of
any kind on the part of Navidar Holdco LLC (“Navidar”) or any of its affiliates to underwrite, place or purchase any
securities or to provide any debt or equity financing or to participate in any transaction, or a recommendation to buy
or sell any securities, to make any investment or to participate in any transaction or trading strategy.
Although the information contained in this Quarterly has been obtained or compiled from sources deemed reliable,
neither Navidar nor any of its affiliates make any representation or warranty, express or implied, as to the accuracy
or completeness of the information contained herein and nothing contained herein is, or shall be relied upon as, a
promise or representation whether as to the past, present or future performance. The information set forth herein may
include estimates and / or involve significant elements of subjective judgment and analysis. No representations are
made as to the accuracy of such estimates or that all assumptions relating to such estimates have been considered or
stated or that such estimates will be realized. The information contained herein does not purport to contain all of the
information that may be required to evaluate a participation in any transaction and any recipient hereof should
conduct its own independent analysis of the data referred to herein. We assume no obligation to update or otherwise
revise these materials.
Navidar and its affiliates do not provide legal, tax or accounting advice. Prior to making any investment or
participating in any transaction, you should consult, to the extent necessary, your own independent legal, tax,
accounting and other professional advisors to ensure that any transaction or investment is suitable for you in the light
of your financial capacity and objectives.