QUARTERLY REVIEW OF THE DYNAMICS OF … · financial stability department quarterly review of the...
79
FINANCIAL STABILITY DEPARTMENT QUARTERLY REVIEW OF THE DYNAMICS OF FINANCIAL STABILITY INDICATORS FOR THE REPUBLIC OF SERBIA First Quarter 2018 June 2018
Transcript of QUARTERLY REVIEW OF THE DYNAMICS OF … · financial stability department quarterly review of the...

FINANCIAL STABILITY DEPARTMENT
QUARTERLY REVIEW OF THE DYNAMICS OF
FINANCIAL STABILITY INDICATORS FOR THE
REPUBLIC OF SERBIA
First Quarter 2018
June 2018


Chart 1.1. Financial soundness of Serbian banks compared to regional average annually 3
Chart 1.2. Overview of key macroeconomic risks annually 4
Table 1.1. Key macroprudential indicators quarterly 5
Table 1.2. Financial sector structure quarterly 6
Chart 2.1. Capital adequacy ratio quarterly 9
Chart 2.2. Tier 1 regulatory capital to risk-weighted assets quarterly 9
Chart 2.3. Distribution of capital adequacy ratio (number of banks in each category) quarterly 9
Chart 2.4. Distribution of capital adequacy ratio (market share) quarterly 9
Chart 2.5. Distribution of Tier 1 to risk-weighted assets (number of banks in each category) quarterly 9
Chart 2.6. Distribution of Tier 1 to risk-weighted assets (market share) quarterly 9
Chart 2.7. Leverage indicators quarterly 9
Chart 2.8. FX-loans to total loans quarterly 13
Chart 2.9. FX-deposits to total deposits quarterly 13
Chart 2.10. New FX-loans to total new loans monthly 13
Chart 2.11. New FX-deposits to total new deposits monthly 13
Chart 2.12. Bank claims on corporate sector by sectoral structure at certain date 13
Chart 2.13. Non-performing loans quarterly 13
Chart 2.14. Non-performing loans to capital quarterly 13
Chart 2.15. Non-performing loans coverage quarterly 13
Chart 2.16. Categories D and E quarterly 14
Chart 2.17. Risk-weighted assets to total assets quarterly 14
Chart 2.18. Risk-weighted assets and total assets growth quarterly 14
Chart 2.19. Risk profile of balance sheet assets (prior to introduction of Basel II) quarterly 14
Chart 2.20. Risk profile of off-balance sheet assets (prior to introduction of Basel II) quarterly 14
Chart 2.21. Risk profile of assets (prior to introduction of Basel II) quarterly 14
Chart 2.22. Risk profile of credit risk-weighted assets (in accordance with Basel II) quarterly 14
Chart 2.23. Funding sources quarterly 14
Chart 2.24. Total assets structure quarterly 15
Chart 2.25. Liabilities structure quarterly 15
Chart 2.26. Off-balance sheet assets: contingent liabilities quarterly 15
Chart 2.27. Profitability indicators quarterly 19
Chart 2.28. Banks w/ ROE below 5% quarterly 19
Chart 2.29. Banks that have encountered losses quarterly 19
Chart 2.30. Net operating income structure quarterly 19
Chart 2.31. Contributions to net operating income growth quarterly 19
Chart 2.32. Gain/loss before taxes quarterly 19
Chart 2.33. Staff costs quarterly 19
Chart 2.34. Cost-to-income ratio quarterly 19
Chart 2.35. Banks w/ cost-to-income ratio above 80% quarterly 20
Chart 2.36. Selected elements of gain/loss to total assets quarterly 20
Chart 2.37. Interest claims (liabilities) to total assets (liabilities) quarterly 20
Chart 2.38. Interest rates on RSD loans monthly 20
Chart 2.39. Interest rates on EUR loans monthly 20
Chart 2.40. Interest rates on RSD saving deposits monthly 20
Chart 2.41. Interest rates on EUR saving deposits monthly 20
Chart 2.42. LTD ratio monthly 23
Chart 2.43. Average monthly liquidity ratio monthly 23
Chart 2.44. Average monthly narrow liquidity ratio monthly 23
Chart 2.45. Liquid assets monthly 23
Chart 2.46. Household and corporate deposits to monetary aggregates monthly 23
Chart 2.47. Banks` FX-reserves to household and corporate FX-deposits monthly 23
Chart 2.49. Quarterly breakdown of the sector's long and short FX position (in EUR) and foreign exchange
risk ratio
quarterly 27
2.1. Capital adequacy
2.5. Sensitivity to market risks
2.4. Liquidity
2.3. Profitability
2.2. Asset and funding quality
1. Financial Soundness Indicators
2. Banking sector
Content

Chart 3.1. Total premium per capita at certain date 31
Chart 3.2. Total premium to GDP at certain date 31
Chart 3.3. Total property insurance premium annually 31
Chart 3.4. Ownership structure of insurance companies at certain date 31
Chart 3.5. Coverage structure of technical reserves in life insurance at certain date 31
Chart 3.6. Coverage structure of technical reserves in non-life insurance at certain date 31
Chart 3.7. Profitability indicators for life insurance companies annually 31
Chart 3.8. Profitability indicators for non-life insurance companies annually 31
Chart 3.9. Combined insurance ratio quarterly 32
Chart 3.10. Total VPF net assets and index FONDex monthly 35
Chart 3.11. Net assets growth and net contributions to VPF quarterly 35
Chart 3.12. VPF asset structure at certain date 35
Chart 3.13. Investment structure by lessee at certain date 39
Chart 3.14. Investment structure by leasing object at certain date 39
Chart 4.1. Industrial production index quarterly 43
Chart 4.2. Real growth of corporate loans monthly 43
Chart 4.3. Currency structure of domestic corporate loans quarterly 43
Chart 4.4. Enforced collection quarterly 43
Chart 5.1. Consumer prices and net household earnings monthly 47
Chart 5.2. Household loans growth monthly 47
Chart 5.3. Currency structure of household loans monthly 47
Chart 5.4. Structure of household savings quarterly 47
Chart 5.5. Contributions to real growth of FX savings monthly 47
Chart 5.6. Contributions to real growth of RSD savings monthly 47
Table 5.1. Household sector performance indicators quarterly 48
Chart 6.1. Regional sovereign credit ratings dynamics monthly 51
Chart 6.2. Sovereign credit ratings dynamics of home countries of banks whose subsidiaries operate in
Serbia
monthly 51
Chart 6.3. CDS spreads on bonds of home countries of parent banks whose subsidiaries operate in Serbia monthly 51
Chart 6.4. CDS spread on Greek bonds daily 51
Chart 6.5. Sovereign bond yields: Serbia and CEE region daily 51
Chart 6.6. Sovereign bond yields: Serbia and home countries of parent banks whose subsidiaries operate in
Serbia
daily 51
Chart 6.7. Greek bond yield daily 51
Chart 6.8. Emerging Market Bond Index: Serbia and EMBI Global monthly 51
Chart 6.9. Emerging Market Bond Index: Serbia and CEE countries monthly 52
Chart 6.10. ECB interest rates and EONIA daily 52
Chart 6.11. Risk premium on the interbank money market monthly 52
Chart 6.12. Inflation in the eurozone monthly 52
Chart 6.13. CDS spreads on bonds issued by Greek parent banks whose subsidiaries operate in Serbia daily 52
Chart 6.14. CDS spreads on bonds issued by Italian parent banks whose subsidiaries operate in Serbia monthly 52
Chart 6.15. CDS spreads on bonds issued by Austrian parent banks whose subsidiaries operate in Serbia monthly 52
Chart 6.16. CDS spreads on bonds issued by French parent banks whose subsidiaries operate in Serbia monthly 52
Chart 6.17. Stock price dynamics of Greek parent banks whose subsidiaries operate in Serbia daily 53
Chart 6.18. Stock price dynamics of Italian parent banks whose subsidiaries operate in Serbia daily 53
Chart 6.19. Stock price dynamics of Austrian parent banks whose subsidiaries operate in Serbia daily 53
Chart 6.20. Stock price dynamics of French parent banks whose subsidiaries operate in Serbia daily 53
Chart 6.21. Ownership structure of banks in Serbia quarterly 53
Chart 6.22. BIS member banks` gross exposure towards emerging markets quarterly 53
6. Macroeconomic environment
6.1. International macroeconomic environment
3.3. Leasing sector
3.2. Voluntary pension funds sector
3.1. Insurance sector
3. Non-banking financial sector
4. Corporate sector
5. Household sector

Chart 6.23. Contributions to real GDP growth by production-side components quarterly 57
Chart 6.24. Contributions to real GDP growth by expenditure-side components quarterly 57
Chart 6.25. Industrial production index monthly 57
Chart 6.26. Unemployment rate quarterly 57
Chart 6.27. Consumer price index monthly 57
Chart 6.28. Contributions to CPI changes monthly 57
Chart 6.29. NBS key policy rate and BEONIA daily 57
Chart 6.30. 3M money-market interest rates monthly 57
Chart 6.31. BELIBOR interest rates monthly 58
Chart 6.32. Exchange rate dynamics of national currencies against the euro daily 58
Chart 6.33. Dynamics of the RSD exchange rate against EUR, CHF and USD monthly 58
Chart 6.34. Dynamics of the RSD exchange rate against EUR and NBS interventions on the interbank FX
market
monthly 58
Chart 6.35. Volatility of the exchange rate monthly 58
Chart 6.36. Bid-ask spread on the interbank FX market daily 58
Chart 6.37. Current account deficit quarterly 58
Chart 6.38. Net foreign direct investments quarterly 58
Chart 6.39. Coverage of imports by FX reserves quarterly 61
Chart 6.40. Coverage of short-term external debt at remaining maturity by FX reserves quarterly 61
Chart 6.41. Coverage of high-power (H) money by FX reserves quarterly 61
Chart 6.42. Coverage of M1 monetary aggregate by FX reserves quarterly 61
Chart 6.43. Fiscal result monthly 65
Chart 6.44. Public revenues and expenditures quarterly 65
Chart 6.45. Public debt dynamics quarterly 65
Chart 6.46. Public debt to GDP monthly 65
Chart 6.47. Public debt by currency quarterly 65
Chart 6.48. Public debt by original maturity monthly 65
Chart 6.49. Public debt by remaining maturity monthly 65
Chart 6.50. Internal and external component of public debt quarterly 65
Chart 6.51. Government securities sold on the primary market by buyers monthly 66
Chart 7.1. Primary market demand for RSD government bonds monthly 69
Chart 7.2. Realisation rate and foreign investors` share in auctions of RSD government bonds monthly 69
Chart 7.3. Interest rates on treasury bills, primary market monthly 69
Chart 7.4. Interest rates on zero coupon RSD government securities monthly 69
Chart 7.5. Foreign investors` share at RSD government bond auctions quarterly 69
Chart 7.6. RSD government securities, outstanding stock quarterly 69
Chart 7.7. RSD government bonds investors structure monthly 69
Chart 7.8. Euro-denominated government bonds, outstanding stock quarterly 69
Chart 7.9. RSD government bonds, annual turnover monthly 70
Chart 7.10. Maturity of RSD government securities monthly 70
Chart 7.11. Belgrade Stock Exchange market capitalisation quarterly 70
Chart 7.12. Belgrade Stock Exchange equity market turnover monthly 70
Chart 7.13. Stock markets' indices daily 70
Chart 7.14. Real estate index DOMex quarterly 70
Chart 7.15. Indices of the number of newly issued building permits monthly 70
Chart 7.16. Price-to-income quarterly 70
72
7. Financial markets and real estate market
6.3. FX reserves adequacy indicators
6.4. Indebtedness of the Republic of Serbia
Definitions
6.2. Domestic macroeconomic environment


1. Financial soundness indicators
1

2

Chart 1.1.
Source: GFSR and National Bank of Serbia.
Financial soundness of Serbian banking sector compared to
regional average
CAR
C/A
NPL
Provisions/NPL
ROA
ROE
Serbia, 2008 Region, 2008
CAR
C/A
NPL
Provisions/NPL
ROA
ROE
Serbia, 2016 Region, 2016
CAR
C/A
NPL
Provisions/NPL
ROA
ROE
Serbia, 2017 Region, 2017
3

Chart 1.2.
* Share of FX and FX-indexed loans in total loans of corporate
and households.
Source: National Bank of Serbia.
Overview of key macroeconomic risks
Currentaccount deficit
(% of GDP)
Level ofeuroisation*
Coverage ofimports by FX
reserves(inverse scale)
Public debt(% of GDP)
Privateexternal debt(% of GDP)
2008 2016
Currentaccount deficit
(% of GDP)
Level ofeuroisation*
Coverage ofimports by FX
reserves(inverse scale)
Public debt(% of GDP)
Privateexternal debt(% of GDP)
2008 2017
Currentaccount deficit
(% of GDP)
Level ofeuroisation*
Coverage ofimports by FX
reserves(inverse scale)
Public debt(% of GDP)
Privateexternal debt(% of GDP)
2016 2017
4

Table 1.1. Serbia: Key Macroprudential Indicators1)
(in % unless otherwise indicated)
2008 2009 2010 2011 2012 2013 2014 2015 2016 2017 I 2018
Capital Adequacy
Regulatory capital to risk weighted assets 21.9 21.4 19.9 19.1 19.9 20.9 20.0 20.9 21.8 22.6 22.7
Tier I capital to risk weighted assets1)
17.9 16.5 15.9 18.1 19.0 19.3 17.6 18.8 20.0 21.6 21.8
Balance sheet capital to balance sheet assets 23.6 20.7 19.7 20.2 20.5 20.9 20.7 20.3 19.5 19.8 19.9
Asset Composition and Quality
Agriculture loans to total loans 3.3 3.1 3.0 2.8 3.0 2.7 3.5 3.7 3.6 3.5 3.5
Industry loans to total loans 18.4 17.9 19.3 17.2 17.9 18.4 19.2 18.4 16.5 16.2 16.6
Trade loans to total loans 16.9 17.3 16.6 14.7 15.0 13.5 13.9 13.9 14.3 14.6 15.2
Construction loans to total loans 5.8 5.3 6.9 6.2 5.8 4.6 4.2 3.8 4.1 4.0 4.2
Other loans to enterprises to total loans 8.1 9.8 9.7 10.9 12.8 11.4 11.5 11.1 10.6 10.3 10.4
Loans to households to total loans 36.3 32.9 34.1 32.4 33.6 35.4 38.2 39.1 41.4 42.8 44.6
Of which: Mortgage loans 13.9 13.8 15.4 15.0 16.1 16.8 18.0 18.1 17.9 17.0 17.5
Loans to other economic sectors to total loans 11.3 13.8 10.5 15.7 12.0 14.0 9.6 10.0 9.6 8.6 5.6
Gross non-performing loans (NPL) to total gross loans 11.3 15.7 16.9 19.0 18.6 21.4 21.5 21.6 17.0 9.8 9.2
Net non-performing loans (NPL) to total net loans 5.3 8.5 9.8 10.5 10.4 11.9 11.1 9.5 6.3 4.4 3.9
Specific provisions of total loans to total gross loans 8.3 9.6 9.1 10.9 10.2 11.9 12.7 14.4 12.4 6.6 6.7
IFRS provisions of total loans to gross non-performing loans (NPL) 73.2 61.4 53.9 57.0 54.9 55.8 59.0 66.8 72.9 66.8 73.2
Specific provisions of NPL to gross NPL 56.9 50.9 47.2 51.0 50.0 50.9 54.9 62.3 67.8 58.1 60.8
Regulatory provisions to gross non-performing loans (NPL) 153.6 142.5 133.6 121.4 120.7 113.8 114.5 114.2 118.9 133.2 135.7
Large exposures to regulatory capital - - - 110.1 104.5 90.4 130.5 115.7 86.0 69.3 73.3
Profitability
ROA 2.1 1.0 1.1 0.0 0.4 -0.1 0.1 0.3 0.7 2.1 2.1
ROE 9.3 4.6 5.4 0.2 2.1 -0.4 0.6 1.6 3.4 10.6 10.5
Net interest margin to average balance sheet assets 5.7 5.1 4.6 4.6 4.3 4.2 4.3 4.3 3.9 3.7 3.7
Net interest margin to gross operating income 64.2 67.0 68.3 72.0 69.2 72.6 71.4 70.7 70.4 63.7 71.4
Operating expenses to gross operating income 59.0 62.6 63.5 61.8 66.1 65.3 64.5 62.2 64.8 59.9 60.8
Operating expenses to average balance sheet assets -5.2 4.8 4.3 3.9 4.1 3.8 3.9 3.8 3.6 3.4 3.1
Personnel expenses to operating expenses 41.2 41.9 41.1 41.9 38.3 39.4 36.7 36.7 37.7 37.4 40.0
Liquidity
Liquid assets to total balance sheet assets 47.8 49.0 43.7 42.3 38.9 41.0 42.2 40.5 38.9 35.1 35.9
Liquid assets to short-term liabilities 75.7 75.1 70.1 70.6 65.0 66.4 66.7 61.3 56.6 50.9 52.3
Liquid assets (core) to total balance sheet assets 47.8 48.2 41.8 40.3 35.2 36.1 35.7 32.5 30.5 27.5 26.5
Liquid assets (core) to short-term liabilities 75.7 73.8 67.1 67.3 58.9 58.3 56.3 49.3 44.3 39.9 38.6
FX-denominated and FX-indexed loans to total gross loans 68.8 70.2 71.0 69.0 73.1 70.9 70.0 71.9 69.3 67.5 68.8
FX-denominated and FX- indexed deposits to total deposits 71.8 75.4 79.1 75.7 77.6 73.3 72.1 70.2 69.3 68.0 69.0
Loans to non-financial sector to deposits of non-financial sector 125.3 124.8 125.9 127.0 119.9 113.8 102.7 99.0 92.0 93.2 94.5
Loans to non-financial and non-public sector to deposits of non-financial and non-
public sector127.1 125.3 122.8 124.1 117.8 112.5 102.4 100.0 93.3 94.8 95.1
FX denominated and FX-indexed loans to FX denominated and FX-indexed
deposits 109.8 99.8 99.1 109.7 106.7 105.3 95.9 97.6 89.1 88.2 86.3
Deposits to total balance sheet assets 57.7 60.2 59.4 57.9 59.0 60.7 63.7 65.9 69.5 70.1 70.1
FX denominated and FX-indexed liabilities to total liabilities 74.3 77.8 81.8 79.0 80.1 76.7 74.5 72.4 70.7 69.4 70.2
Sensitivity to Market Risk
Net open FX position (overall) to regulatory capital 4.2 1.1 1.6 4.2 4.6 3.3 2.6 2.8 2.3 2.4 3.0
Оff-balance sheet items to total balance sheet assets 121.4 106.7 97.7 111.0 103.5 111.0 207.1 234.1 219.6 209.4 234.2
Classified off-balance sheet items to total classified balance sheet assets 56.2 43.3 33.9 32.0 26.1 28.8 27.6 30.6 32.4 36.4 36.0
Market-based Indicators
Credit rating
S&P BB- BB- BB- BB BB- BB- BB- BB- BB- BB BB
Fitch BB- BB- BB- BB- BB- BB- B+ B+ BB- BB BB
Moody's - - - - - B1 B1 B1 B1 Ba3 Ba3
Country`s risk premium - EMBI (aop, in bp) 501.5 625.7 419.0 457.0 522.5 403.5 291.6 279.6 270.0 153.7 108.9
International Reserves Adequacy Indicators
International reserves to months of imports (in mos)
Gross international reserves 5.4 9.7 8.4 8.8 7.7 7.6 6.6 6.7 6.2 5.3 5.3
Net international reserves 3.9 5.9 4.3 4.9 4.7 5.3 5.1 5.4 5.1 4.4 4.4
International reserves to short-term liabilities at remaining maturity
Gross international reserves 162.6 220.6 191.2 299.8 237.3 268.6 294.0 256.4 239.7 234.1 n/a
Net international reserves 117.1 135.0 97.0 166.0 143.8 187.7 227.2 208.0 196.5 194.4 n/a
Source: National Bank of Serbia.
1) An adjustment is made in the deductables of Tier 1 capital.
Data download and use allowed. Due to technical reasons, NBS makes no warranties as to the accuracy or completeness of the information.
5

Table 1.2. Serbia: Financial sector structure
RSD billion % RSD billion % RSD billion % RSD billion % RSD billion % RSD billion % RSD billion % RSD billion %
Financial sector 87 2,868 100 85 3,108 100 80 3,081 100 76 3,226 100 77 3,329 100 76 3,556 100 73 3,714 100 73 3,743 100
(in % of GDP) 84.2% 86.7% 79.5% 82.6% 82.3% 83.4% 83.2% 82.6%
Banking system 33 2,650 92.4 32 2,880 92.6 30 2,846 92.4 29 2,969 92.0 30 3,048 91.6 30 3,242 91.2 29 3,369 90.7 29 3,387 90.5
State-owned banks 8 472 16.5 8 522 16.8 6 534 17.3 6 571 17.7 6 550 16.5 6 561 15.8 6 544 14.6 6 546 14.6
Local private banks 4 213 7.4 3 194 6.3 3 196 6.4 2 187 5.8 1 179 5.4 2 195 5.5 2 236 6.4 2 228 6.1
Foreign-owned banks 21 1,965 68.5 21 2,163 69.6 21 2,117 68.7 21 2,211 68.5 23 2,319 69.7 22 2,486 69.9 21 2,590 69.7 21 2,612 69.8
Greek 4 393 13.7 4 426 13.7 4 409 13.3 4 418 13.0 4 395 11.9 4 403 11.3 2 210 5.6 2 214 5.7
Italian 2 591 20.6 2 657 21.1 2 679 22.0 2 738 22.9 2 796 23.9 2 884 24.8 2 928 25.0 2 949 25.4
French 3 263 9.2 3 287 9.2 3 299 9.7 3 304 9.4 3 316 9.5 3 327 9.2 2 375 10.1 2 375 10.0
Austrian 4 493 17.2 3 449 14.4 3 429 13.9 3 441 13.7 3 453 13.6 3 494 13.9 2 427 11.5 2 433 11.6
Other 8 225 7.8 9 345 11.1 9 301 9.8 9 310 9.6 11 359 10.8 10 378 10.6 13 651 17.5 13 642 17.1
Nonbank financial institutions 54 218 7.6 53 228 7.4 50 235 7.6 47 257 8.0 47 281 8.4 46 315 8.8 44 344 9.3 44 357 9.5
Insurance companies 28 126 4.4 28 140 4.5 28 148 4.8 25 168 5.2 24 192 5.8 23 216 6.1 21 233 6.3 21 245 6.6
Pension funds 9 12 0.4 9 16 0.5 6 20 0.6 6 24 0.7 7 29 0.9 7 33 0.9 7 36 1.0 7 37 1.0
Leasing companies 17 80 2.8 16 72 2.3 16 67 2.2 16 65 2.0 16 60 1.8 16 66 1.9 16 75 2.0 16 74 2.0
Source: National Bank of Serbia.
2011 2012 2015
No.
AssetsAssets
2013
No.
Assets
No.
Assets
No.
2014 2016
No.
Assets
No.
Assets
No.
I 2018
Assets
2017
No.
Assets
6

2.1. Capital adequacy
2. Banking sector
7

8

Chart 2.1. Chart 2.2.
(%) (%)
* Up to Q4 2011 modified Tier 1 regulatory capital is shown.
Source: National Bank of Serbia. Source: National Bank of Serbia.
Chart 2.3. Chart 2.4.
(number of banks in each category) (market share*, %)
* Measured by the share in total net assets of the banking sector.
Source: National Bank of Serbia. Source: National Bank of Serbia.
Chart 2.5. Chart 2.6.
(number of banks in each category) (market share*, %)
* Measured by the share in total net assets of the banking sector.
Source: National Bank of Serbia. Source: National Bank of Serbia.
Chart 2.7.
(%)
Source: National Bank of Serbia.
Distribution of capital adequacy ratio Distribution of capital adequacy ratio
Distribution of Tier 1 to risk-weighted assets Distribution of Tier 1 to risk-weighted assets
Capital adequacy ratio Tier 1 regulatory capital to risk-weighted assets*
Leverage indicators
0
5
10
15
20
25
III I III I III I III I III I III I III I III I III I III I
20082009 2010 2011 2012 2013 2014 2015 2016 2017 '18
Capital adequacy ratio Regulatory minimum
0
5
10
15
20
25
III I III I III I III I III I III I III I III I III I III I
20082009 2010 2011 2012 2013 2014 2015 2016 2017 '18
0
5
10
15
20
25
30
35
III I III I III I III I III I III I III I III I III I III I
20082009 2010 2011 2012 2013 2014 2015 2016 2017 '18
Up to 15% From 15 to 20% From 20 to 25% Over 25%
0
20
40
60
80
100
III I III I III I III I III I III I III I III I III I III I
20082009 2010 2011 2012 2013 2014 2015 2016 2017 '18
Up to 15% From 15 to 20% From 20 to 25% Over 25%
0
5
10
15
20
25
30
35
III I III I III I III I III I III I III I III I III I III I
20082009 2010 2011 2012 2013 2014 2015 2016 2017 '18
Up to 10% From 10 to 15% From 15 to 20% Over 20%
0
20
40
60
80
100
III I III I III I III I III I III I III I III I III I III I
20082009 2010 2011 2012 2013 2014 2015 2016 2017 '18
Up to 10% From 10 to 15% From 15 to 20% Over 20%
0
5
10
15
20
25
30
l III I III I III I III I III I III I III I III I III I III I
2008 2009 2010 2011 2012 2013 2014 2015 2016 2017'18
Regulatory capital to total assets Capital to assets
9

10

2. Banking sector
2.2. Asset and funding quality
11

Transportatio
1,0001,2001,4001,6001,8002,000
100
120
140
160
12

Chart 2.8. Chart 2.9.
(RSD bn) (%) (RSD bn) (%)
Source: National Bank of Serbia. Source: National Bank of Serbia.
Chart 2.10. Chart 2.11.
(RSD bn) (%) (RSD bn) (%)
Source: National Bank of Serbia. Source: National Bank of Serbia.
Chart 2.12. Chart 2.13.
(March 2018, %)
Source: National Bank of Serbia. Source: National Bank of Serbia.
Chart 2.14. Chart 2.15.
(%)
* Balance sheet.
Source: National Bank of Serbia. Source: National Bank of Serbia.
FX-claims to total banking sector claims on corporate
sector and households
Bank claims on corporate sector by sectoral structure Non-performing loans
New FX-loans to total new loans
FX-deposits to total deposits
(%)
New FX-deposits to total new deposits
(share in total gross loans, %)
Non-performing loans to capital Non-performing loans coverage
Agriculture, forestry and
fishing:7%
Mining, manufacturin
g:30%
Electricity:2%
Construction:8%
Trade:29%
Transportation:
12%
Real estate:8%
Education, health and social care:
0%
Other:4%
6062646668707274767880
0200400600800
1,0001,2001,4001,6001,8002,000
III I III I III I III I III I III I III I III I III I III I
20082009 2010 2011 2012 2013 2014 2015 2016 2017 '18FX-claims on households (lhs)Dinar claims on households (lhs)FX- claims on enterprises (lhs)Dinar claims on enterprises (lhs)Total FX-claims to total claims (rhs)
626466687072747678808284
0200400600800
1,0001,2001,4001,6001,800
III I III I III I III I III I III I III I III I III I III I
20082009 2010 2011 2012 2013 2014 2015 2016 2017'18FX-deposits of households (lhs)Dinar deposits of households (lhs)FX-deposits of enterprises (lhs)Dinar deposits of enterprises (lhs)Total FX-deposits to total deposits(rhs)
-551525354555657585
0
20
40
60
80
100
120
140
160
1 4 7 10 1 4 7 10 1 4 7 10 1 4 7 10 1 4 7 10 1 4 7 10 1
2012 2013 2014 2015 2016 2017 '18
FX-loans to households (lhs)Dinar loans to households (lhs)FX-loans to enterprises (lhs)Dinar loans to enterprises (lhs)Total new FX-loans to total new loans (rhs)
0
20
40
60
80
100
0
100
200
300
400
500
1 4 7 10 1 4 7 10 1 4 7 10 1 4 7 10 1 4 7 10 1 4 7 10 1
2012 2013 2014 2015 2016 2017 '18FX-deposits of households (lhs)Dinar deposits of households (lhs)FX-deposits of enterprises (lhs)Dinar deposits of enterprises(lhs)Total new FX-deposits to total new deposits (rhs)
10
.2 11
.314
.2 16
.5 17
.71
5.7
16
.51
7.5
17
.81
6.9
17
.1 18
.618
.81
9.0 20
.41
9.5
19
.918
.6 19
.91
9.9 21
.12
1.4
22
.22
3.0
23
.02
1.5
22
.62
2.8
22
.02
1.6
20
.92
0.2
19
.517
.016
.81
5.6
12
.29.8
9.2
0
5
10
15
20
25
III I III I III I III I III I III I III I III I III I III I
20082009 2010 2011 2012 2013 2014 2015 2016 2017 '18
0
20
40
60
80
100
III I III I III I III I III I III I III I III I III I III I
20082009 2010 2011 2012 2013 2014 2015 2016 2017 '18
Net NPLs toTier 1Net NPLs to regulatory capitalNet NPLs to capital
0
50
100
150
200
250
III I III I III I III I III I III I III I III I III I III I
20082009 2010 2011 2012 2013 2014 2015 2016 2017 '18
Allowances for impairment of NPLs to NPLs
Calculated reserve for estimated BS* losses to NPLs
Calculated reserve for estimated losses to NPLs
10
15
20
25
13

Chart 2.16. Chart 2.17.
(%) (%) (%)
* Shareholders' equity, government and other capital.
Source: National Bank of Serbia. Source: National Bank of Serbia.
Chart 2.18. Chart 2.19.
(%)
* Changes in the classification of assets by risk weights.
Source: National Bank of Serbia. Source: National Bank of Serbia.
Chart 2.20. Chart 2.21.
(prior to introduction of Basel II) (total on and off-balance sheetassets, prior to introduction of Basel II)
(%) (%)
* Changes in the classification of assets by risk weights. * Changes in the classification of assets by risk weights.
Source: National Bank of Serbia. Source: National Bank of Serbia.
Chart 2.22. Chart 2.23.
(%) (RSD bn) (%)
Source: National Bank of Serbia. Source: National Bank of Serbia.
(index, September 2008 = 100)
Risk profile of balance sheet assets
(prior to introduction of Basel II)
Risk profile of off-balance sheet assets Risk profile of assets
Categories D and E Risk-weighted assets to total assets
Risk-weighted assets and total assets growth
Funding sourcesRisk profile of credit risk-weighted assets
20
40
60
80
100
40
60
80
100
120
140
0
5
10
15
20
25
III I III I III I III I III I III I III I III I III I III I
20082009 2010 2011 2012 2013 2014 2015 2016 2017 '18
Share in total classified assets (lhs)
Share in equity* (rhs)
86
.7 93
.59
4.2
89
.183
.47
9.6
79
.380
.48
0.7
80
.78
2.2
83
.381
.56
3.7
64
.16
2.7
63
.26
1.2
60
.65
9.8
58
.558
.256
.15
6.5
55
.257
.35
7.1
55
.456
.05
7.1
57
.45
7.6
58
.45
8.0
59
.260
.46
3.2
63
.663
.8
0
20
40
60
80
100
III I III I III I III I III I III I III I III I III I III I
20082009 2010 2011 2012 2013 2014 2015 2016 2017 '18
100
120
140
160
180
200
220
III I III I III I III I III I III I III I III I III I III I
20082009 2010 2011 2012 2013 2014 2015 2016 2017 '18
Risk-weighted assets Total assets
0
20
40
60
80
100
I III I III I III I III I III* I III I III I III
2004 2005 2006 2007 2008 2009 2010 2011
Weight 0% Weight 20% Weight 50%
Weight 75% Weight 100% Weight 125%
0
20
40
60
80
100
I III I III I III I III I III* I III I III I III
2004 2005 2006 2007 2008 2009 2010 2011
Weight 0% Weight 20% Weight 50%
Weight 75% Weight 100% Weight 125%
0
20
40
60
80
100
I III I III I III I III I III* I III I III I III
2004 2005 2006 2007 2008 2009 2010 2011
Weight 0% Weight 20% Weight 50%
Weight 75% Weight 100% Weight 125%
0
20
40
60
80
100
IV I II III IV I II III IV I II III IV I II III IV I II III IV I II III IV I
2011 2012 2013 2014 2015 2016 2017 '18Weight 0% Weight 10% Weight 20% Weight 35%
Weight 50% Weight 75% Weight 100% Weight 150%
70
80
90
100
0
400
800
1,200
1,600
2,000
2,400
2,800
3,200
I III I III I III I III I III I III I III I III I III I III I
2008 2009 2010 2011 2012 2013 2014 2015 2016 2017'18Liabilities (lhs)Equity (lhs)Liabilities to total sources (rhs)
14

Chart 2.24. Chart 2.25.
(%) (%)
Source: National Bank of Serbia. Source: National Bank of Serbia.
Chart 2.26.
(%)
Source: National Bank of Serbia.
Liabilities structureTotal assets structure
Off-balance sheet assets: contingent liabilities
100
0
20
40
60
80
100
III I III I III I III I III I III I III I III I III I III I
20082009 2010 2011 2012 2013 2014 2015 2016 2017 '18Foreign assets Claims on governmentClaims on NBS Claims on other sectorsOther assets
0
10
20
30
40
50
60
70
80
90
100
III I III I III I III I III I III I III I III I III I III I
20082009 2010 2011 2012 2013 2014 2015 2016 2017 '18
Foreign liabilities Total deposits Еquity and reserves Other
0
20
40
60
80
100
120
140
160
180
III I III I III I III I III I III I III I III I III I III I
20082009 2010 2011 2012 2013 2014 2015 2016 2017 '18
Contingent liabilities to total off-balance sheet assets
Capital to contingent liabilities
15

16

2.3. Profitability
2. Banking sector
17

12
16
18

Chart 2.27. Chart 2.28.
(%) (number of banks) (%)
* Measured by the share in total net assets of the banking sector.
Source: National Bank of Serbia. Source: National Bank of Serbia.
Chart 2.29. Chart 2.30.
(number of banks) (%) (%)
* Measured by the share in total net assets of the banking sector. * Net income from the trade in securities and dividend income.
Source: National Bank of Serbia Source: National Bank of Serbia.
Chart 2.31. Chart 2.32.
(y-o-y growth, pp) (annualized)
(RSD bn)
* Net income from the trade in securities and dividend income.
Source: National Bank of Serbia. Source: National Bank of Serbia.
Chart 2.33. Chart 2.34.
(share of operating expenses)
(%) (%)
* Excluding 5% of largest observations.
Source: National Bank of Serbia. Source: National Bank of Serbia.
Staff costs Ratio of operating expenses to total operating income
Contributions to net operating income growth
Profitability indicators Banks w/ ROE below 5%
Gain/loss before taxes
Banks that have encountered losses Net operating income structure
-2
0
2
4
6
8
10
12
IV II IV II IV II IV II IV II IV II IV II IV II IV II IV
2009 2010 2011 2012 2013 2014 '15 '16 '17 '18
ROA ROE
-8
-4
0
4
8
12
16
IV II IV II IV II IV II IV II IV II IV II IV II IV
2010 2011 2012 2013 2014 '15 '16 '17 '18Other*Net income from fees and commissionsNet interest marginNet operating income growth
Loss of Agrobanka:
29.7 RSD bn
-55
-35
-15
5
25
45
65
85
IV II IV II IV II IV II IV II IV II IV II IV II IV II IV
2009 2010 2011 2012 2013 2014 '15 '16 '17 '18Gain Loss Net gain
10
12
14
16
0
7
14
21
28
0
4
8
12
16
IV II IV II IV II IV II IV II IV II IV II IV II IV II IV
2009 2010 2011 2012 2013 2014 '15 '16 '17 '18
Number (lhs) Market share (rhs)*
0
20
40
60
80
100
IV II IV II IV II IV II IV II IV II IV II IV II IV II IV
2009 2010 2011 2012 2013 2014 '15 '16 '17 '18
Other*Net income from fees and commissionsNet interest margin
0.0
0.3
0.6
0.9
1.2
1.5
0
10
20
30
40
50
0
5
10
15
20
25
IV II IV II IV II IV II IV II IV II IV II IV II IV II IV
2009 2010 2011 2012 2013 2014 '15 '16 '17 '18
Number (lhs) Market share (rhs)*
0
5
10
15
20
25
30
35
40
45
IV II IV II IV II IV II IV II IV II IV II IV II IV II IV
2009 2010 2011 2012 2013 2014 '15 '16 '17 '18
0306090
120150180210240270300330
I II III IV I II III IV I II III IV I
'15 '16 '17 '18
Range by banks* Banking sector
19

Chart 2.35. Chart 2.36.
(number of banks) (%) (%)
* Measured by the share in total net assets of the banking sector.
Source: National Bank of Serbia. Source: National Bank of Serbia.
Chart 2.37. Chart 2.38.
(households and enterprises, new business)
(%) (%) (%)
Source: National Bank of Serbia. Source: National Bank of Serbia.
Chart 2.39. Chart 2.40.
(households and enterprises, new business) (households and enterprises, new business)
(%) (%)
* EUR-denominated and EUR-indexed loans.
Source: National Bank of Serbia. Source: National Bank of Serbia.
Chart 2.41.
(households and enterprises, new business)
(%)
* EUR-denominated and EUR-indexed deposits.
Source: National Bank of Serbia.
Interest rates on EUR saving deposits*
Selected elements of gain/loss to total assetsBanks w/ Ratio of operating expenses to total
operating income above 80%
Interest claims (liabilities) to total assets (liabillities) Interes rates on RSD loans
Interest rates on EUR loans* Interest rates on RSD saving deposits
6
12
18
24
30
36
42
0
2
4
6
8
10
12
14
16
I II III IV I II III IV I II III IV I
'15 '16 '17 '18
Number (lhs) Market share (rhs)*
0
5
10
15
20
25
12 4 8 12 4 8 12 4 8 12 4 8 12 4 8 12 4 8 12 4 8 12
2011 2012 2013 2014 '15 '16 '17 '18
Households Enterprises Total
0.00
0.01
0.02
0.03
0.04
0.05
0.06
0.0
0.3
0.6
0.9
1.2
1.5
IV II IV II IV II IV II IV II IV II IV II IV II IV II IV
2009 2010 2011 2012 2013 2014 '15 '16 '17 '18
Interest claims/total assets (lhs)Interest liabillities/total liabillities (rhs)
0
2
4
6
IV II IV II IV II IV II IV II IV II IV II IV II IV II IV
2009 2010 2011 2012 2013 2014 '15 '16 '17 '18Net interest marginNet income from fees and commissionsStaff costsOther operating expenses
10
20
30
40
50
0
2
4
6
8
10
12 4 8 12 4 8 12 4 8 12 4 8 12 4 8 12 4 8 12 4 8 12
2011 2012 2013 2014 '15 '16 '17 '18
Households Enterprises Total
0
2
4
6
8
10
12
14
12 4 8 12 4 8 12 4 8 12 4 8 12 4 8 12 4 8 12 4 8 12
2011 2012 2013 2014 '15 '16 '17 '18
Households Enterprises Total
0
1
2
3
4
5
6
12 4 8 12 4 8 12 4 8 12 4 8 12 4 8 12 4 8 12 4 8 12
2011 2012 2013 2014 '15 '16 '17 '18
Households Enterprises Total
20

2.4. Liquidity
2. Banking sector
21

0.80
0.85
0.90
0.95
1.00
1.05
1.10
1.15
1.20
1.25
1.30
22

Chart 2.42. Chart 2.43.
(loans to deposits)
* Excluding 10% largest observations.
Source: National Bank of Serbia. Source: National Bank of Serbia.
Chart 2.44. Chart 2.45.
(%)
* Excluding 10% largest observations.
Source: National Bank of Serbia. Source: National Bank of Serbia.
Chart 2.46. Chart 2.47.
(%) (%)
* High-power money.
Source: National Bank of Serbia. Source: National Bank of Serbia.
Household and corporate deposits to monetary
aggregates
Banks` FX-reserves to household and corporate FX-
deposits
LTD ratio Average monthly liquidity ratio
Average monthly narrow liquidity ratio Liquid assets
0
100
200
300
400
500
600
700
800
1 6 11 4 9 2 7 12 5 10 3 8 1 6 11 4 9 2 7 12 5 10 3
2009 2010 2011 2012 2013 2014 2015 2016 2017 '18
Deposits/H*Deposits/M1Deposits/M2Deposits/M3
0.80
0.85
0.90
0.95
1.00
1.05
1.10
1.15
1.20
1.25
1.30
1 5 9 1 5 9 1 5 9 1 5 9 1 5 9 1 5 9 1 5 9 1
2011 2012 2013 2014 2015 2016 2017 '18
0123456789
10
1 6 11 4 9 2 7 12 5 10 3 8 1 6 11 4 9 2 7 12 5 10 3 8 1
'08 2009 2010 2011 2012 2013 2014 2015 2016 2017 '18
Range by banks*
Banking sectorCritical boundary
0
10
20
30
40
50
60
70
80
1 2 3 4 5 6 7 8 91011121 2 3 4 5 6 7 8 91011121 2 3 4 5 6 7 8 91011121 2 3
2015 2016 2017 2018
Liquid assets/total assets
Liquid assets/short-term liabilities
Core liquid assets/total assets
Core liquid assets/short-term liabilities
0
1
2
3
4
5
6
7
8
1 6 11 4 9 2 7 12 5 10 3 8 1 6 11 4 9 2 7 12 5 10 3 8 1
'08 2009 2010 2011 2012 2013 2014 2015 2016 2017 '18Range by banks*
Banking sectorCritical boundary
0
2
4
6
8
10
12
14
16
18
20
1 6 11 4 9 2 7 12 5 10 3 8 1 6 11 4 9 2 7 12 5 10 3
2009 2010 2011 2012 2013 2014 2015 2016 2017 '18
23

24

2. Banking sector
2.5. Sensitivity to market risks
25

26

Chart 2.49.
(RSD bn) (%)
Source: National Bank of Serbia.
Quarterly breakdown of the sector's long and short FX
position (in EUR) and foreign exchange risk ratio
0
1
2
3
4
5
6
7
0
5
10
15
20
IV I II III IV I II III IV I II III IV I II III IV I II III IV I II III IV I
2011 2012 2013 2014 2015 2016 2017 '18
Long EUR Short EUR FX risk indicator
27

28

3.1. Insurance sector
3. Non-banking financial sector
29

1.000
2.000
3.000
4.000
5.000
6.000
7.000
Other1,2
30

Chart 3.1. Chart 3.2.
(USD) (%)
*Тhe Latest Available Data *Тhe Latest Available Data
Source: sigma world insurance database Source: sigma world insurance database
Chart 3.3. Chart 3.4.
(EUR m) (March 2018, %)
*Тhe Latest Available Data * Does not include reinsurance companies.
Source: CEA Statistics and National Bank of Serbia. Source: National Bank of Serbia.
Chart 3.5. Chart 3.6.
(March 2018, %) (March 2018, %)
Source: National Bank of Serbia. Source: National Bank of Serbia.
Chart 3.7. Chart 3.8.
(%) (%)
* annual data * annual data
Source: National Bank of Serbia. Source: National Bank of Serbia.
Total property insurance premium* Ownership structure of insurance companies*
Profitability indicators for life insurance companies*Profitability indicators for non-life insurance
companies*
Total premium per capita in 2016* Total premium to GDP in 2016*
Coverage structure of technical reserves in life
insurance
Coverage structure of technical reserves in non-life
insurance
0
1.000
2.000
3.000
4.000
5.000
6.000
7.000
Life Non-life
0
3
6
9
Life Non-life
0
200
400
600
800
2012 2013 2014 2015 2016
Serbia 24%
Slovenia 7%
Austria 30%
Italy 10%
Netherlands 25%
Other 4%
Republic of Serbia
Government securities
96,7%
Deposits with banks 2,4%
Real estate 0,2%
Other 1,2%
Republic of Serbia
Government securities
71,8%
Deposits with banks 12,2%
Real estate 6%
Other 10%
-4
-2
0
2
4
6
8
10
12
2008 2009 2010 2011 2012 2013 2014 2015 2016 2017
Return on equity Return on assets
-5
0
5
10
15
2008 2009 2010 2011 2012 2013 2014 2015 2016 2017
Return on equity Return on assets
31

Chart 3.9.
(%)
Source: National Bank of Serbia.
Combined insurance ratio
0102030405060708090
100110
I
08 09 10 11 12 13 14 15 16 17 2018
Loss ratio Expense ratio Limit
32

3.2. Voluntary pension funds sector
3. Non-banking financial sector
33

10
15
20
25
30
35
40
Republic of
34

Chart 3.10. Chart 3.11.
(RSD bn) (index, 15. 11. 2006 = 1000) (RSD m)
* Voluntary pension funds.
Source: National Bank of Serbia. Source: National Bank of Serbia.
Chart 3.12.
(March 2018, %)
Source: National Bank of Serbia.
Net assets growth and net contributions to VPF*Total VPF* net assets and index FONDex
VPF asset structure
1.000
1.300
1.600
1.900
2.200
2.500
2.800
0
5
10
15
20
25
30
35
40
6 10 2 6 10 2 6 10 2 6 10 2 6 10 2 6 10 2 6 10 2 6 10 2 6 10 2
2010 2011 2012 2013 2014 2015 2016 '17 '18
VPF net asset (lhs) FONDex (rhs)
-1.000
0
1.000
2.000
3.000
4.000
5.000
6.000
'07 '08 '09 '10 '11 '12 '13 '14 '15 '16 '17 I'18
Net contributionsIncrease from investmentIncrease in total VPF assets
Republic of Serbia Т-
bonds 84.4%
Deposits 6.5%
Shares 8.7%
Other 0.4%
35

36

3. Non-banking financial sector
3.3. Leasing sector
37

38
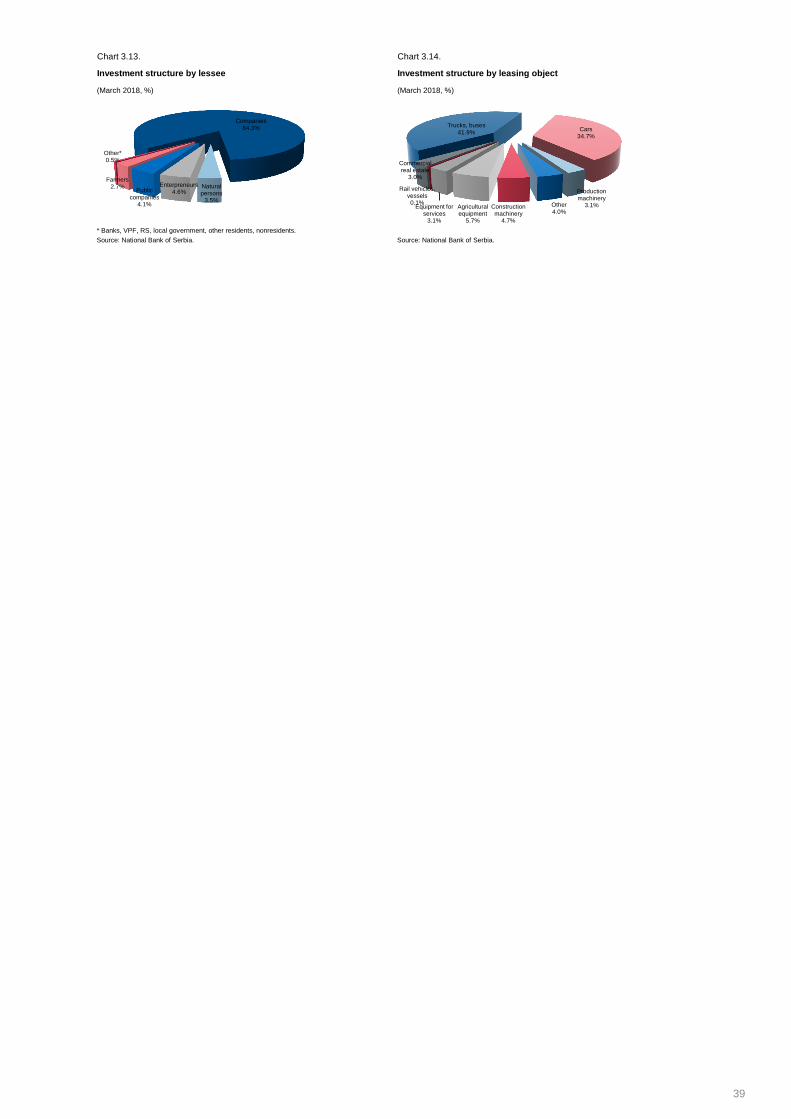
Chart 3.13. Chart 3.14.
(March 2018, %) (March 2018, %)
* Banks, VPF, RS, local government, other residents, nonresidents.
Source: National Bank of Serbia. Source: National Bank of Serbia.
Investment structure by lessee Investment structure by leasing object
Companies 84.3%
Natural persons
3.5%
Enterpreneurs 4.6% Public
companies 4.1%
Farmers 2.7%
Other* 0.5%
Trucks, buses 41.9%
Cars 34.7%
Production machinery
3.1% Other 4.0%
Construction machinery
4.7%
Agricultural equipment
5.7%
Equipment for services
3.1%
Rail vehicles, vessels 0.1%
Commercial real estate
3.0%
39

40

4. Corporate sector
41

1.000
1.200
1.400
42

Chart 4.1. Chart 4.2.
(index, 2017 = 100) (y-o-y growth rates, %)
* Seasonally adjusted data. * Adjusted for exchange rate movements.
Source: National Bank of Serbia. Source: National Bank of Serbia.
Chart 4.3. Chart 4.4.
(RSD bn) (%) (thousands) (RSD bn)
* FX loans to total loans. * End of period.
Source: National Bank of Serbia. Source: National Bank of Serbia.
Industrial production index* Real growth of corporate loans*
Currency structure of bank claims on corporates Enforced collection
60
80
100
120
140
5 10 3 8 1 6 11 4 9 2 7 12 5 10 3 8 1 6 11 4 9 2
2009 2010 2011 2012 2013 2014 2015 2016 2017 '18
Mining
Manufacturing
Electricity, gas, steam, air-conditioning
-20
-15
-10
-5
0
5
10
15
20
25
5 9 1 5 9 1 5 9 1 5 9 1 5 9 1 5 9 1 5 9 1 5 9 1 5 9 1
2009 2010 2011 2012 2013 2014 2015 2016 2017 '18
Domestic loans Cross-border loans
Total corporate loans
55
60
65
70
75
80
85
90
0
200
400
600
800
1.000
1.200
1.400
I III I III I III I III I III I III I III I III I III I
2009 2010 2011 2012 2013 2014 2015 2016 2017 '18
Other currencies (lhs) CHF (lhs)
USD (lhs) EUR (lhs)
59
,3
61,3
6
4,3
6
6,6
68,9
7
0,2
68,1
6
3,0
6
4,6
6
2,7
6
2,2
6
2,3
5
8,9
59,5
6
0,7
4
5,9
39,7
4
4,7
5
0,8
4
3,7
48,3
52,2
5
3,7
54,0
55,2
56,0
5
4,2
5
3,2
5
2,6
51,6
5
0,5
5
0,0
5
0,7
5
2,7
5
4,0
53,1
5
4,2
0
100
200
300
400
0
20
40
60
80
I III I III I III I III I III I III I III I III I III I
2009 2010 2011 2012 2013 2014 2015 2016 2017 '18
Number of blocked accounts (lhs)*
Amount of money in blocked accounts (rhs)
43

44

5. Household sector
45

1.000
46

Chart 5.1. Chart 5.2.
(index, 2016 = 100) (y-o-y growth rates, %)
* Seasonally adjusted data. * Adjusted for exchange rate movements.
Source: National Bank of Serbia. Source: National Bank of Serbia.
Chart 5.3. Chart 5.4.
(RSD bn) (%) (term and currency structure)
* Share of FX loans in total loans.
Source: National Bank of Serbia. Source: National Bank of Serbia.
Chart 5.5. Chart 5.6.
(y-o-y growth rates, pp) (y-o-y growth rates, pp)
Source: National Bank of Serbia. Source: National Bank of Serbia.
Contributions to real growth of FX savings Contributions to growth of RSD savings
Consumer prices and net household earnings Household loans growth
Currency structure of of bank claims on households Structure of household savings
(%)
70
75
80
85
90
95
100
105
110
115
2 6 10 2 6 10 2 6 10 2 6 10 2 6 10 2 6 10 2 6 10 2 6 10 2
2011 2012 2013 2014 2015 2016 2017 '18Nominal net wages*Real net wages*CPI
-10
0
10
20
30
40
50
1 6 11 4 9 2 7 12 5 10 3 8 1 6 11 4 9 2 7 12 5 10 3
2009 2010 2011 2012 2013 2014 2015 2016 2017 '18
Nominal loan growth rate Real loan growth rate*
40
50
60
70
80
90
100
0
200
400
600
800
1.000
1 6 11 4 9 2 7 12 5 10 3 8 1 6 11 4 9 2 7 12 5 10 3
2009 2010 2011 2012 2013 2014 2015 2016 2017 '18
Other currencies (lhs) CHF (lhs)
EUR (lhs) RSD (lhs)
Share of FX loans (rhs)*
0
20
40
60
80
100
IIIIV I IIIIIIV I IIIIIIV I IIIIIIV I IIIIIIV I IIIIIIV I IIIIIIV I IIIIIIV I IIIIIIV I IIIIIIV I
20082009 2010 2011 2012 2013 2014 2015 2016 2017 '18
Short-term FX savings Long-term FX savings
Short-term RSD savings Long-term RSD savings
-20
-10
0
10
20
30
40
3 7 11 3 7 11 3 7 11 3 7 11 3 7 11 3 7 11 3 7 11 3 7 11 3
2010 2011 2012 2013 2014 2015 2016 2017 '18Long-term FX savingsShort-term FX savingsTotal FX savings growth
-50
0
50
100
150
9 1 5 9 1 5 9 1 5 9 1 5 9 1 5 9 1 5 9 1 5 9 1 5 9 1
2010 2011 2012 2013 2014 2015 2016 2017 '18Long-term RSD savingsShort-term RSD savingsTotal RSD savings growth
Q4 Q4 Q4 Q4 Q4 Q4 Q4 Q4 Q1
2010 2011 2012 2013 2014 2015 2016 2017 2018
Total bank claims on households
RSD bn 571,2 601,7 652,7 673,7 724,6 759,1 838,7 904,2 924,1
EUR m 5.414,3 5.750,5 5.739,5 5.876,2 5.990,6 6.240,9 6.802,8 7.589,7 7.806,0
FX deposits to FX bank claims1)
72,4 67,4 65,0 62,1 59,0 57,2 52,8 48,3 48,1
FX to total deposits1)
92,4 90,7 92,1 89,4 88,7 87,1 85,1 84,2 84,6
FX deposits to FX loans1)
177,2 191,2 214,7 223,3 233,4 233,9 240,9 246,2 246,4
Short-term bank claims to total claims 13,2 12,3 14,3 15,3 9,1 6,2 6,8 5,9 5,8
LTV ratio2) 65,4 65,6 65,7 65,9 65,8 68,5 70,2 70,2 70,7
Av erage loan per resident
RSD thousand 76,0 81,0 88,2 91,4 100,4 105,9 118,5 128,4 130,0
EUR 720,6 773,9 775,7 797,3 830,3 870,4 959,9 1.078,0 1.098,1
Av erage loan amount
RSD thousand 427,6 439,6 460,4 489,9 511,1 472,2 488,7 486,7 466,5
EUR 4.052,8 4.201,4 4.049,0 4.273,1 4.225,3 3.882,5 3.957,6 4.085,1 3.940,6
Av erage loan per user
RSD thousand 509,0 530,9 570,1 612,0 644,7 614,6 641,0 650,8 641,6
EUR 4.824,9 5.073,9 5.012,9 5.338,8 5.329,8 5.053,1 5.191,4 5.462,3 5.419,5
1) FX loans and deposits include FX-indexed loans and deposits.
2) For loans insured with National Mortgage Insurance Corporation. (last data december 2017.)
Data download and use allowed. Due to technical reasons, NBS makes no warranties as to the accuracy or completeness of the
information.
Source: National Bank of Serbia, Association of Serbian Banks, National Mortgage Insurance Corporation and Statistical Office of the Republic of Serbia.
47

Table 5.1.
(%, unless indicated otherwise)
Household sector performance indicators
Q4 Q4 Q4 Q4 Q4 Q4 Q4 Q4 Q1
2010 2011 2012 2013 2014 2015 2016 2017 2018
Total bank claims on households
RSD bn 571,2 601,7 652,7 673,7 724,6 759,1 838,7 904,2 924,1
EUR m 5.414,3 5.750,5 5.739,5 5.876,2 5.990,6 6.240,9 6.802,8 7.589,7 7.806,0
FX deposits to FX bank claims1)
72,4 67,4 65,0 62,1 59,0 57,2 52,8 48,3 48,1
FX to total deposits1)
92,4 90,7 92,1 89,4 88,7 87,1 85,1 84,2 84,6
FX deposits to FX loans1)
177,2 191,2 214,7 223,3 233,4 233,9 240,9 246,2 246,4
Short-term bank claims to total claims 13,2 12,3 14,3 15,3 9,1 6,2 6,8 5,9 5,8
LTV ratio2) 65,4 65,6 65,7 65,9 65,8 68,5 70,2 70,2 70,7
Av erage loan per resident
RSD thousand 76,0 81,0 88,2 91,4 100,4 105,9 118,5 128,4 130,0
EUR 720,6 773,9 775,7 797,3 830,3 870,4 959,9 1.078,0 1.098,1
Av erage loan amount
RSD thousand 427,6 439,6 460,4 489,9 511,1 472,2 488,7 486,7 466,5
EUR 4.052,8 4.201,4 4.049,0 4.273,1 4.225,3 3.882,5 3.957,6 4.085,1 3.940,6
Av erage loan per user
RSD thousand 509,0 530,9 570,1 612,0 644,7 614,6 641,0 650,8 641,6
EUR 4.824,9 5.073,9 5.012,9 5.338,8 5.329,8 5.053,1 5.191,4 5.462,3 5.419,5
1) FX loans and deposits include FX-indexed loans and deposits.
2) For loans insured with National Mortgage Insurance Corporation. (last data december 2017.)
Data download and use allowed. Due to technical reasons, NBS makes no warranties as to the accuracy or completeness of the
information.
Source: National Bank of Serbia, Association of Serbian Banks, National Mortgage Insurance Corporation and Statistical Office of the Republic of Serbia.
48
6.1. International macroeconomic environment
6. Macroeconomic environment
49

50

Chart 6.1. Chart 6.2.
* Bosnia and Herzegovina.
Source: Standard & Poor's. Source: Standard & Poor's.
Chart 6.3. Chart 6.4.
(bp) (bp)
* CDS spreads on five-year dollar bonds. * CDS spreads on five-year dollar bonds.
Source: Bloomberg. Source: Bloomberg.
Chart 6.5. Chart 6.6.
(%) (%)
* USD-denominated. * 10 years maturity, EUR-denominated, except RS bonds.
Source: Bloomberg. Source: Bloomberg.
Chart 6.7. Chart 6.8.
(%) (bp)
* 10 years maturity, euro-denominated.
Source: Bloomberg. Source: J.P. Morgan.
CDS spread on Greek bonds*
Regional sovereign credit ratings dynamics Sovereign credit ratings dynamics of home countries
of banks whose subsidiaries operate in Serbia
CDS spreads on bonds of home countries of parent
banks whose subsidiaries operate in Serbia*
Emerging Market Bond Index: Serbia and EMBI Global
Sovereign bond yields: Serbia and CEE region*Sovereign bond yields: Serbia and home countries of
parent banks whose subsidiaries operate in Serbia*
Greek bond yield*
6
8
10
12
14
16
18
20
6 11 4 9 2 7 12 5 10 3 8 1 6 11 4 9 2 7 12 5 10 3
2009 2010 2011 2012 2013 2014 2015 2016 2017 '18Serbia Bulgaria Croatia
Hungary Romania Montenegro
FYROM Bosnia* Slovenia
0
2
4
6
8
10
12
14
16
18
20
6 11 4 9 2 7 12 5 10 3 8 1 6 11 4 9 2 7 12 5 10 3
2009 2010 2011 2012 2013 2014 2015 2016 2017 '18
Serbia Austria Italy
Greece France
0
100
200
300
400
500
600
Austria Italy France
0
5.000
10.000
15.000
20.000
25.000
30.000
0
2
4
6
8
10
Serbia Hungary Croatia
Turkey Poland
0
2
4
6
8
10
12
14
Serbia Italy France Austria
0
5
10
15
20
25
30
35
40
0
200
400
600
800
1.000
1.200
1.400
8 1 6 11 4 9 2 7 12 5 10 3 8 1 6 11 4 9 2 7 12 5 10 3
'08 2009 2010 2011 2012 2013 2014 2015 2016 2017 '18
EMBI Serbia EMBI Global
1.000
1.200
1.400
10.000
51

Chart 6.9. Chart 6.10.
(bp) (%)
Source: J.P. Morgan. Source: ECB, Bloomberg.
Chart 6.11. Chart 6.12.
(3M EURIBOR/EONIA spread, monthly averages, bp) (y-o-y rates)
Source: Bloomberg. Source: ECB.
Chart 6.13. Chart 6.14.
(bp) (bp)
* CDS spread on 5 year bonds. * CDS spread on 5 year bonds.
Source: Bloomberg. Source: Bloomberg.
Chart 6.15. Chart 6.16.
(bp) (bp)
* CDS spread on 5 year bonds. * CDS spread on 5 year bonds.
Source: Bloomberg. Source: Bloomberg.
Emerging Market Bond Index: Serbia and CEE
countriesECB interest rates and EONIA
Risk premium on the interbank money marketInflation in the eurozone
CDS spreads on bonds issued by Italian parent banks
whose subsidiaries operate in Serbia*
CDS spreads on bonds issued by Greek parent banks
whose subsidiaries operate in Serbia*
CDS spreads on bonds issued by Austrian parent
banks whose subsidiaries operate in Serbia*
CDS spreads on bonds issued by French parent
banks whose subsidiaries operate in Serbia*
0
200
400
600
800
1.000
1.200
1.400
8 1 6 11 4 9 2 7 12 5 10 3 8 1 6 11 4 9 2 7 12 5 10 3
'08 2009 2010 2011 2012 2013 2014 2015 2016 2017 '18
Serbia Poland Turkey
Croatia Hungary
-2
0
2
4
6
EONIA ECB key policy rate
Interest rate on lending facility Interest rate on deposit facility
0
20
40
60
80
100
120
140
3 9 3 9 3 9 3 9 3 9 3 9 3 9 3 9 3 9 3 9 3 9 3
2007 2008 2009 2010 2011 2012 2013 2014 2015 2016 2017'18
-1
-1
0
1
1
2
2
3
3
4
1 6 11 4 9 2 7 12 5 10 3 8 1 6 11 4 9 2 7 12 5 10 3
2009 2010 2011 2012 2013 2014 2015 2016 2017 '18
0
2.000
4.000
6.000
8.000
10.000
EFG Eurobank Ergasias
0
100
200
300
400
500
Erste Group Bank AG Raiffeisen Bank International AG
0
50
100
150
200
250
300
350
400
450
Credit Agricole S.A. Societe Generale
0
100
200
300
400
500
600
700
Intesa Sanpaolo S.p.A. UniCredit S.p.A.
52

Chart 6.17. Chart 6.18.
(index, 1. 6. 2007 = 100) (index, 1. 6. 2007 = 100)
Source: Bloomberg. Source: Bloomberg.
Chart 6.19. Chart 6.20.
(index, 1. 6. 2007 = 100) (index, 1. 6. 2007 = 100)
Source: Bloomberg. Source: Bloomberg.
Chart 6.21. Chart 6.22.
(%)
* Share in net assets of the banking sector. *Latest data available.
Source: National Bank of Serbia. Source: Bank for International Settlements.
(index, December 2006 = 100)
Stock price dynamics of Italian parent banks whose
subsidiaries operate in Serbia
Stock price dynamics of Austrian parent banks
whose subsidiaries operate in Serbia
Stock price dynamics of French parent banks whose
subsidiaries operate in Serbia
Ownership structure of banks in Serbia*
BIS member banks' gross exposure towards
emerging markets
Stock price dynamics of Greek parent banks whose
subsidiaries operate in Serbia
0
20
40
60
80
100
120
EFG Eurobank Ergasias
0
20
40
60
80
100
120
Intesa Sanpaolo S.p.A. UniCredit S.p.A.
0
20
40
60
80
100
120
Erste Group Bank AG Raiffeisen Bank International
0
20
40
60
80
100
120
Societe Generale Credit Agricole S.A.
0
20
40
60
80
100
IIIIV I IIIIIIV I IIIIIIV I IIIIIIV I IIIIIIV I IIIIIIV I IIIIIIV I IIIIIIV I IIIIIIV I IIIIIIV I
'08 2009 2010 2011 2012 2013 2014 2015 2016 2017"18
Greek banks Italian banksFrench banks Austrian banksDomestic privately owned Domestic publicly ownedOther banks
0
100
200
300
400
I II IIIIVI II IIIIVI II IIIIVI II IIIIVI II IIIIVI II IIIIVI II IIIIVI II IIIIVI II IIIIVI II IIIIVI II IIIIV*
2007 2008 2009 2010 2011 2012 2013 2014 2015 2016 2017
Serbia Hungary RomaniaBulgaria Croatia Czech Rep.Poland Turkey
53

54

6. Macroeconomic environment
6.2. Domestic macroeconomic environment
55

56

Chart 6.23. Chart 6.24.
(y-o-y growth rates, pp) (y-o-y growth rates, pp)
* NBS estimate. * NBS estimate.
Source: National Bank of Serbia. Source: National Bank of Serbia.
Chart 6.25. Chart 6.26.
(index, 2016 = 100) (%)
* According to the Labour Force Survey. **Latest available data.
Source: National Bank of Serbia. Source: Statistical Office of the Republic of Serbia.
Chart 6.27. Chart 6.28.
(y-o-y growth rate, %) (y-o-y growth rates, pp)
Source: National Bank of Serbia. Source: National Bank of Serbia.
Chart 6.29. Chart 6.30.
(%) (eop, %)
Source: National Bank of Serbia. Source: Bloomberg.
NBS key policy rate and BEONIA 3M money-market interest rates
Industrial production index
Contributions to real GDP growth by production-side
components
Contributions to real GDP growth by expenditure-side
components
Contributions to CPI changes
Unemployment rate*
Consumer price index
-6
-4
-2
0
2
4
6
8
10
I IIIIIIV I IIIIIIV I IIIIIIV I IIIIIIV I IIIIIIV I IIIIIIV I IIIIIIV I IIIIIIV I IIIIIIV I IIIIIIVI*
2008 2009 2010 2011 2012 2013 2014 2015 2016 2017'18
Contribution of nontradable sectorsContribution of tradable sectorsReal GDP growth
-20
-16
-12
-8
-4
0
4
8
12
16
20
I IIIIIIVI IIIIIIV I IIIIIIVI IIIIIIV I IIIIIIV I IIIIIIVI IIIIIIV I IIIIIIVI IIIIIIV I IIIIIIVI*
2008 2009 2010 2011 2012 2013 2014 2015 2016 2017'18
Consumption Investment
Government Net export
Real GDP growth
80
85
90
95
100
105
110
7 11 3 7 11 3 7 11 3 7 11 3 7 11 3 7 11 3 7 11 3 7 11 3
2011 2012 2013 2014 2015 2016 2017 '18
0
5
10
15
20
25
30
II IV2010
II IV2011
II IV2012
II IV2013
I2014
II III2014
IV I2015
II III2015
IV I2016
II III2016
IV I2017
II III2017
IV**
-1
1
3
5
7
9
11
13
15
17
7 11 3 7 11 3 7 11 3 7 11 3 7 11 3 7 11 3 7 11 3 7 11 3
2011 2012 2013 2014 2015 2016 2017 '18
CPI Inflation target Target bound
-4
-2
0
2
4
6
8
10
12
14
16
7 11 3 7 11 3 7 11 3 7 11 3 7 11 3 7 11 3 7 11 3 7 11 3
2011 2012 2013 2014 2015 2016 2017 '18
Food Other goods and services CPI
0
5
10
15
20
25
BEONIA Key policy rate
Interest rate on credit facility Interest rate on deposit facility
-2
-1
-1
0
1
1
2
2
3
1 6 11 4 9 2 7 12 5 10 3 8 1 6 11 4 9 2 7 12 5 10 3
2009 2010 2011 2012 2013 2014 2015 2016 2017 '18
3M LIBOR USD 3M LIBOR CHF 3M EURIBOR
57

Chart 6.31. Chart 6.32.
(monthly averages, %) (index, 31.12.2010 = 100)
Source: National Bank of Serbia. Source: National Bank of Serbia and other central banks.
Chart 6.33. Chart 6.34.
(index, December 2007 = 100) (EUR m) (EUR/RSD)
Source: National Bank of Serbia. Source: National Bank of Serbia.
Chart 6.35. Chart 6.36.
(standard deviation of daily % changes in RSD) (daily averages, in paras)
Source: National Bank of Serbia. Source: National Bank of Serbia.
Chart 6.37. Chart 6.38.
(EUR bn) (% of GDP) (EUR bn) (% of GDP)
** Ratio of 4Q moving sums. ** Ratio of 4Q moving sums.
Source: Statistical Office of the Republic of Serbia and NBS. Source: Statistical Office of the Republic of Serbia and NBS.
* Starting from 2007 data on exports and imports of goods and services are
shown in accordance with BPM6. Data for 2005 and 2006 are shown
according to BPM5.
Dynamics of the RSD exchange rate against EUR and
NBS interventions on the interbank FX market
Bid-ask spread on the interbank FX market
Current account deficit* Net foreign direct investments*
* Starting from 2007 data on exports and imports of goods and services are
shown in accordance with BPM6. Data for 2005 and 2006 are shown
according to BPM5.
Volatility of the exchange rate
Exchange rate dynamics of national currencies
against the euroBELIBOR interest rates
Dynamics of the RSD exchange rate against EUR, CHF
and USD
23456789
1011121314
7 11 3 7 11 3 7 11 3 7 11 3 7 11 3 7 11 3 7 11 3 7 11 3
2010 2011 2012 2013 2014 2015 2016 2017 '18
BELIBORTN BELIBORSN BELIBOR1W
BELIBOR2W BELIBOR1M Key policy rate
40
50
60
70
80
90
100
110
120
Serbia Romania Poland
Hungary Turkey
0
20
40
60
80
100
120
3 8 1 6 11 4 9 2 7 12 5 10 3 8 1 6 11 4 9 2 7 12 5 10 3
2008 2009 2010 2011 2012 2013 2014 2015 2016 2017'18
RSD/CHF RSD/USD RSD/EUR
85
90
95
100
105
110
115
120
125
-400
-300
-200
-100
0
100
200
300
400
500
11 3 7 11 3 7 11 3 7 11 3 7 11 3 7 11 3 7 11 3 7 11 3
20112011 2012 2013 2014 2015 2016 2017 '18
NBS interventions - sold (lhs)NBS interventions - bought (lhs)
Average exchange rate (rhs)
0,0
0,2
0,4
0,6
0,8
1,0
1,2
1,4
3 8 1 2 11 4 9 2 7 12 5 10 3 8 1 6 11 4 9 2 7 12 5 10 3
2008 2009 2010 2011 2012 2013 2014 2015 2016 2017'18
0
20
40
60
80
100
120
0
3
6
9
12
15
18
21
24
0
2
4
6
8EUR bn (lhs) % of GDP** (rhs)
0
5
10
15
20
0
1
2
3
4
5EUR bn (lhs) % of GDP** (rhs)
58

6.3. FX reserves adequacy indicators
6. Macroeconomic environment
59

60

Chart 6.39. Chart 6.40.
(mos of imports) (%)
* Latest data available
Source: National Bank of Serbia. Source: National Bank of Serbia.
Chart 6.41. Chart 6.42.
(%) (%)
Source: National Bank of Serbia. Source: National Bank of Serbia.
Coverage of high-power (H) money by FX reserves Coverage of M1 monetary aggregate by FX reserves
Coverage of imports by FX reserves Coverage of short-term external debt at remaining
maturity by FX reserves
0
2
4
6
8
10
12
IV IV IV IV IV IV IV IV IV IV I
´08 ´09 ´10 ´11 ´12 ´13 ´14 ´15 ´16 ´17 ´18
Gross FX reserves Net FX reserves
Critical boundary
0
100
200
300
400
IV IV IV IV IV IV IV IV IV IV*
´08 ´09 ´10 ´11 ´12 ´13 ´14 ´15 ´16 ´17
Gross FX reserves Net FX reserves
Critical boundary
0
50
100
150
200
250
IV IV IV IV IV IV IV IV IV IV I
´08 ´09 ´10 ´11 ´12 ´13 ´14 ´15 ´16 ´17 ´18
Gross FX reserves Net FX reserves
0
100
200
300
400
500
IV IV IV IV IV IV IV IV IV IV I
´08 ´09 ´10 ´11 ´12 ´13 ´14 ´15 ´16 ´17 ´18
Gross FX reserves Net FX reserves
61

62
6.4. Indebtedness of the Republic of Serbia
6. Macroeconomic environment
63

64

Chart 6.43. Chart 6.44.
(% of GDP) (% of GDP) (% of GDP)
*Ratio of 12m moving sums. *Ratio of 4Q moving sums.
Source: NBS according to MoF data. Source: NBS according to MoF data.
Chart 6.45. Chart 6.46.
(% of GDP) (EUR bn) (%)
Source: Ministry of Finance of the Republic of Serbia. Source: Ministry of Finance of the Republic of Serbia.
Chart 6.47. Chart 6.48.
(%) (%)
from Dec.2013 53w T-bills are included in Short-term debt
Source: Ministry of Finance of the Republic of Serbia. Source: Ministry of Finance of the Republic of Serbia.
Chart 6.49. Chart 6.50.
(%) (%)
Source: Ministry of Finance of the Republic of Serbia. Source: Ministry of Finance of the Republic of Serbia.
Public debt by remaining maturity Internal and external component of public debt
Public debt by currency Public debt by original maturity
Public debt dynamics Public debt to GDP
Fiscal result* Public revenues and expenditures*
-8
-7
-6
-5
-4
-3
-2
-1
0
1
2
1 5 9 1 5 9 1 5 9 1 5 9 1 5 9 1 5 9 1 5 9 1 5 9 1 5 9 1
2009 2010 2011 2012 2013 2014 2015 2016 2017 "18
-8
-7
-6
-5
-4
-3
-2
-1
0
1
2
0
10
20
30
40
50
I III I III I III I III I III I III I III I III I III I III I III I
2007 2008 2009 2010 2011 2012 2013 2014 2015 2016 2017"18
Public revenues (lhs) Public expenditures (lhs)
Fiscal result (rhs)
0
10
20
30
40
50
60
70
80
3 6 9 12 3 6 9 12 3 6 9 12 3 6 9 12 3 6 9 12 3 6 9 12 3
2012 2013 2014 2015 2016 2017 "18
0
20
40
60
80
100
I III I III I III I III I III I III I III I III I III I III I III I
2007 2008 2009 2010 2011 2012 2013 2014 2015 2016 2017"18
Public debt denominated in RSD
Public debt denominated in other currencies
0
20
40
60
80
100
3 6 9 12 3 6 12 3 6 9 12 3 6 9 12 3 6 9 12 3 6 9 12 3
2012 2013 2014 2015 2016 2017 "18
Long-term debt Short-term debt
0
10
20
30
40
50
60
70
80
90
100
3 6 9 12 3 6 12 3 6 9 12 3 6 9 12 3 6 9 12 3 6 9 12 3
2012 2013 2014 2015 2016 2017 "18
Long-term debt Short-term debt
0
10
20
30
40
50
60
70
80
90
100
I III I III I III I III I III I III I III I III I III I III I III I
2007 2008 2009 2010 2011 2012 2013 2014 2015 2016 2017"18
External debt Internal debt
100
0
5
10
15
20
25
30
0
10
20
30
40
50
60
70
80
I III I III I III I III I III I III I III I III I III I III I III I
2007 2008 2009 2010 2011 2012 2013 2014 2015 2016 2017 "18
Public debt to GDP ratio (lhs) Public debt level (rhs)
65
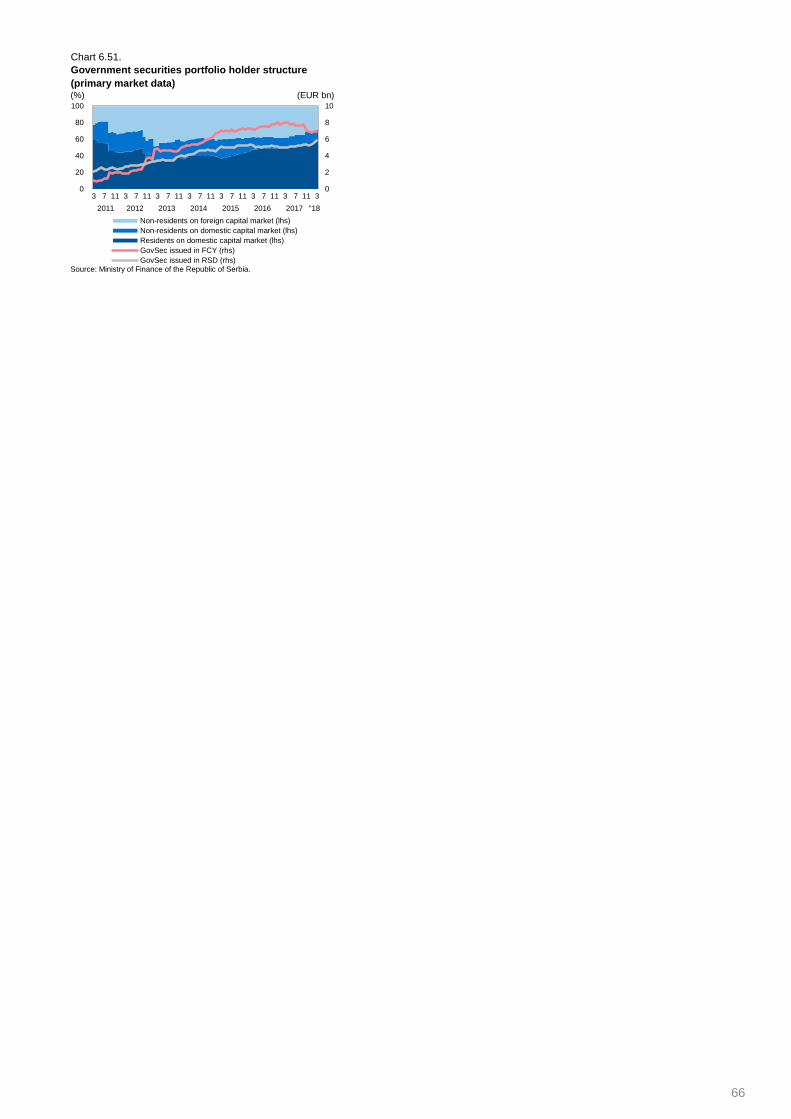
Chart 6.51.
(%) (EUR bn)
Source: Ministry of Finance of the Republic of Serbia.
Government securities portfolio holder structure
(primary market data)
0
2
4
6
8
10
0
20
40
60
80
100
3 7 11 3 7 11 3 7 11 3 7 11 3 7 11 3 7 11 3 7 11 3
2011 2012 2013 2014 2015 2016 2017 "18
Non-residents on foreign capital market (lhs)
Non-residents on domestic capital market (lhs)
Residents on domestic capital market (lhs)
GovSec issued in FCY (rhs)
GovSec issued in RSD (rhs)
66

7. Financial markets and real estate market
67

100
100
200
300
400
500
600
700
800
68

Chart 7.1. Chart 7.2.
(primary auction) (RSD bn) (%)
(RSD bn)
Source: Ministry of Finance of the Republic of Serbia. Source: Ministry of Finance of the Republic of Serbia.
Chart 7.3. Chart 7.4.
(monthly averages, %) (auctions, weighted monthly averages, %)
Source: Ministry of Finance of the Republic of Serbia. Source: Ministry of Finance of the Republic of Serbia.
Chart 7.5. Chart 7.6.
(nominal value)
(by maturity, averages) (RSD bn)
Source: Ministry of Finance of the Republic of Serbia. Source: Ministry of Finance of the Republic of Serbia.
Chart 7.7. Chart 7.8.
(RSD bn) (%) (nominal values)
(EUR mn)
* Custodian banks, insurance co, VPF, natural pers. and other legal ent.
Source: Ministry of Finance of the Republic of Serbia. Source: Ministry of Finance of the Republic of Serbia.
Interest rates on treasury bills, primary market
RSD government bonds investors structureEuro-denominated government bonds, outstanding
stock
Interest rates on zero coupon RSD government
securities
Foreign investors' share at RSD government bond
auctions
RSD government securities, outstanding stock
Primary market demand for RSD government bondsRealisation rate and foreign investors' share in
auctions of RSD government bonds
0,0
0,5
1,0
1,5
2,0
2,5
3,0
3,5
0
20
40
60
80
100
11 3 7 11 3 7 11 3 7 11 3 7 11 3 7 11 3 7 11 3 7 11 3
2011 2012 2013 2014 2015 2016 2017 '18
Market value of sold bonds (lhs) Bid-to-cover ratio (rhs)
0
25
50
75
100
0
40
80
120
160
200
240
280
320
360
400
440
11 3 7 11 3 7 11 3 7 11 3 7 11 3 7 11 3 7 11 3 7 11 3
2011 2012 2013 2014 2015 2016 2017 '18
Total nominal value for sale (lhs)
Realization rate (rhs)
Foreign investors' share (rhs)
0
2
4
6
8
10
12
14
16
7 11 3 7 11 3 7 11 3 7 11 3 7 11 3 7 11 3 7 11 3 7 11 3
2010 2011 2012 2013 2014 2015 2016 2017 '18
3M treasury bills 6M treasury bills
Key policy rate BELIBOR 3M
BELIBOR 6M
0
2
4
6
8
10
12
14
16
7 11 3 7 11 3 7 11 3 7 11 3 7 11 3 7 11 3 7 11 3 7 11 3
2010 2011 2012 2013 2014 2015 2016 2017 '18
3М 6М 12M
18M 24M Total
0
20
40
60
80
100
1Y 18M 2Y 3Y 5Y 7Y 10Y
2010 2011 2012 2013 2014 2015
2016 2017 I 2017 II 2017 III 2017 IV 2018 I
0
100
200
300
400
500
600
700
800
IIIIV I II IIIIV I II IIIIV I II IIIIV I II IIIIV I II IIIIV I II IIIIV I II IIIIV I II IIIIV I
2009 2010 2011 2012 2013 2014 2015 2016 2017 '18
3M 6M 1Y 18M 2Y 3Y 5Y 7Y 10Y
0
20
40
60
80
100
0
100
200
300
400
500
600
700
800
11 3 7 11 3 7 11 3 7 11 3 7 11 3 7 11 3 7 11 3 7 11 3
2011 2012 2013 2014 2015 2016 2017 '18Foreign investors (lhs) Domestic banks (lhs)Others (lhs)* Foreign investors (rhs)Domestic banks (rhs)
0
500
1.000
1.500
2.000
2.500
3.000
3.500
I II III IV I II III IV I II III IV I II III IV I II III IV I II III IV I II III IV I
2011 2012 2013 2014 2015 2016 2017 '18
1Y 18M 2Y 3Y 5Y 10Y 15Y
1.000
1.500
2.000
69
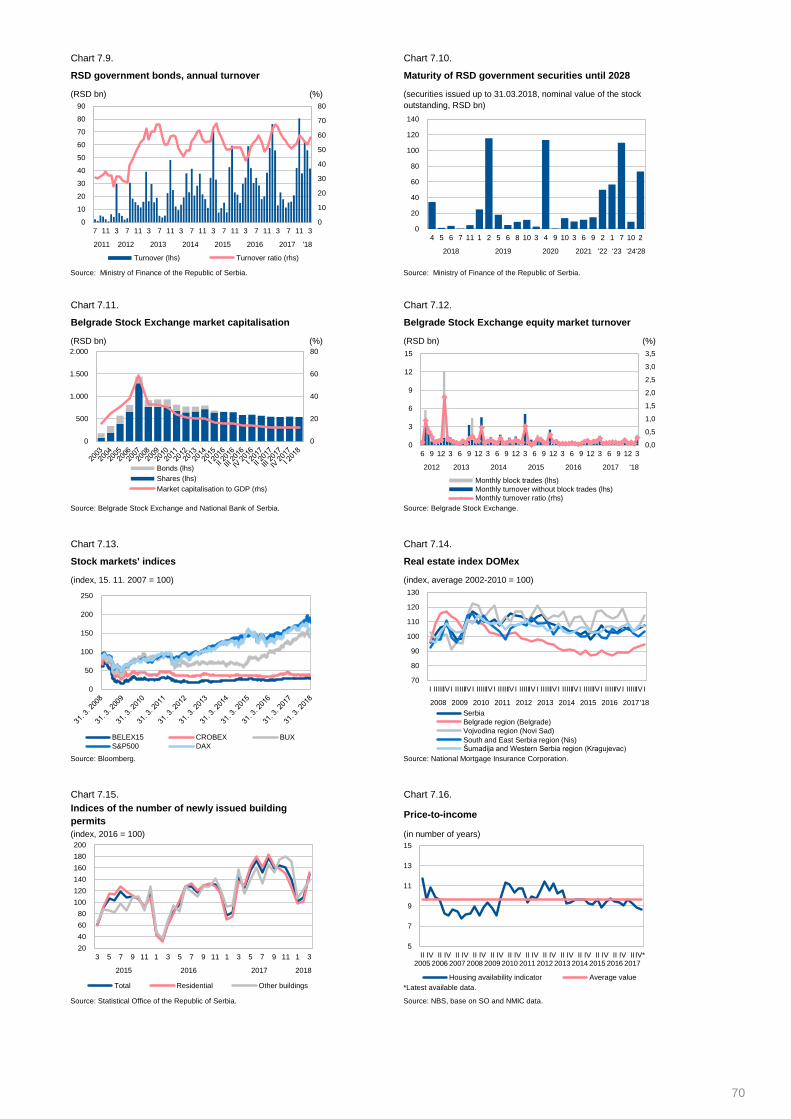
Chart 7.9. Chart 7.10.
(RSD bn) (%)
Source: Ministry of Finance of the Republic of Serbia. Source: Ministry of Finance of the Republic of Serbia.
Chart 7.11. Chart 7.12.
(RSD bn) (%) (RSD bn) (%)
Source: Belgrade Stock Exchange and National Bank of Serbia. Source: Belgrade Stock Exchange.
Chart 7.13. Chart 7.14.
(index, 15. 11. 2007 = 100) (index, average 2002-2010 = 100)
Source: Bloomberg. Source: National Mortgage Insurance Corporation.
Chart 7.15. Chart 7.16.
(index, 2016 = 100) (in number of years)
*Latest available data.
Source: Statistical Office of the Republic of Serbia. Source: NBS, base on SO and NMIC data.
Belgrade Stock Exchange market capitalisation Belgrade Stock Exchange equity market turnover
RSD government bonds, annual turnover
Stock markets' indices
Indices of the number of newly issued building
permits
Real estate index DOMex
Price-to-income
Maturity of RSD government securities until 2028
(securities issued up to 31.03.2018, nominal value of the stock
outstanding, RSD bn)
0
10
20
30
40
50
60
70
80
0
10
20
30
40
50
60
70
80
90
7 11 3 7 11 3 7 11 3 7 11 3 7 11 3 7 11 3 7 11 3
2011 2012 2013 2014 2015 2016 2017 '18
Turnover (lhs) Turnover ratio (rhs)
0
20
40
60
80
100
120
140
4 5 6 7 11 1 2 5 6 8 10 3 4 9 10 3 6 9 2 1 7 10 2
2018 2019 2020 2021 '22 '23 '24'28
0
20
40
60
80
0
500
1.000
1.500
2.000
Bonds (lhs)
Shares (lhs)
Market capitalisation to GDP (rhs)
0,0
0,5
1,0
1,5
2,0
2,5
3,0
3,5
0
3
6
9
12
15
6 9 12 3 6 9 12 3 6 9 12 3 6 9 12 3 6 9 12 3 6 9 12 3
2012 2013 2014 2015 2016 2017 '18
Monthly block trades (lhs)
Monthly turnover without block trades (lhs)
Monthly turnover ratio (rhs)
70
80
90
100
110
120
130
I IIIIIIV I IIIIIIV I IIIIIIV I IIIIIIV I IIIIIIV I IIIIIIV I IIIIIIV I IIIIIIV I IIIIIIV I IIIIIIV I
2008 2009 2010 2011 2012 2013 2014 2015 2016 2017'18
Serbia
Belgrade region (Belgrade)
Vojvodina region (Novi Sad)
South and East Serbiа region (Nis) Šumadija and Western Serbia region (Kragujevac)
20
40
60
80
100
120
140
160
180
200
3 5 7 9 11 1 3 5 7 9 11 1 3 5 7 9 11 1 3
2015 2016 2017 2018
Total Residential Other buildings
0
50
100
150
200
250
BELEX15 CROBEX BUX
S&P500 DAX
5
7
9
11
13
15
II2005
IV II2006
IV II2007
IV II2008
IV II2009
IV II2010
IV II2011
IV II2012
IV II2013
IV II2014
IV II2015
IV II2016
IV II2017
IV*
Housing availability indicator Average value
70

0,0
0,5
1,0
1,5
2,0
2,5
3,0
3,5
71
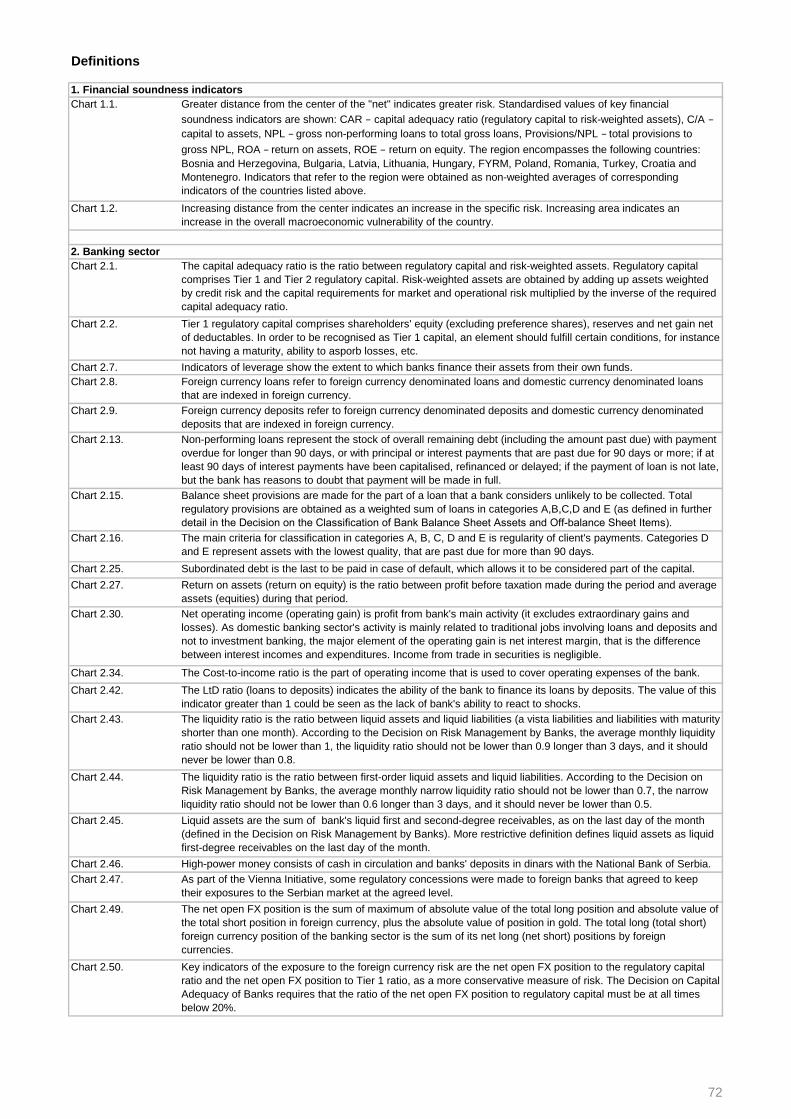
Definitions
Chart 1.1. Greater distance from the center of the "net" indicates greater risk. Standardised values of key financial
soundness indicators are shown: CAR − capital adequacy ratio (regulatory capital to risk-weighted assets), C/A −
capital to assets, NPL − gross non-performing loans to total gross loans, Provisions/NPL − total provisions to
gross NPL, ROA − return on assets, ROE − return on equity. The region encompasses the following countries:
Bosnia and Herzegovina, Bulgaria, Latvia, Lithuania, Hungary, FYRM, Poland, Romania, Turkey, Croatia and
Montenegro. Indicators that refer to the region were obtained as non-weighted averages of corresponding
indicators of the countries listed above.
Chart 1.2. Increasing distance from the center indicates an increase in the specific risk. Increasing area indicates an
increase in the overall macroeconomic vulnerability of the country.
Chart 2.1. The capital adequacy ratio is the ratio between regulatory capital and risk-weighted assets. Regulatory capital
comprises Tier 1 and Tier 2 regulatory capital. Risk-weighted assets are obtained by adding up assets weighted
by credit risk and the capital requirements for market and operational risk multiplied by the inverse of the required
capital adequacy ratio.
Chart 2.2. Tier 1 regulatory capital comprises shareholders' equity (excluding preference shares), reserves and net gain net
of deductables. In order to be recognised as Tier 1 capital, an element should fulfill certain conditions, for instance
not having a maturity, ability to asporb losses, etc.
Chart 2.7. Indicators of leverage show the extent to which banks finance their assets from their own funds.
Chart 2.8. Foreign currency loans refer to foreign currency denominated loans and domestic currency denominated loans
that are indexed in foreign currency.
Chart 2.9. Foreign currency deposits refer to foreign currency denominated deposits and domestic currency denominated
deposits that are indexed in foreign currency.
Chart 2.13. Non-performing loans represent the stock of overall remaining debt (including the amount past due) with payment
overdue for longer than 90 days, or with principal or interest payments that are past due for 90 days or more; if at
least 90 days of interest payments have been capitalised, refinanced or delayed; if the payment of loan is not late,
but the bank has reasons to doubt that payment will be made in full.
Chart 2.15. Balance sheet provisions are made for the part of a loan that a bank considers unlikely to be collected. Total
regulatory provisions are obtained as a weighted sum of loans in categories A,B,C,D and E (as defined in further
detail in the Decision оn the Classification of Bank Balance Sheet Assets and Off-balance Sheet Items).
Chart 2.16. The main criteria for classification in categories A, B, C, D and E is regularity of client's payments. Categories D
and E represent assets with the lowest quality, that are past due for more than 90 days.
Chart 2.25. Subordinated debt is the last to be paid in case of default, which allows it to be considered part of the capital.
Chart 2.27. Return on assets (return on equity) is the ratio between profit before taxation made during the period and average
assets (equities) during that period.
Chart 2.30. Net operating income (operating gain) is profit from bank's main activity (it excludes extraordinary gains and
losses). As domestic banking sector's activity is mainly related to traditional jobs involving loans and deposits and
not to investment banking, the major element of the operating gain is net interest margin, that is the difference
between interest incomes and expenditures. Income from trade in securities is negligible.
Chart 2.34. The Cost-to-income ratio is the part of operating income that is used to cover operating expenses of the bank.
Chart 2.42. The LtD ratio (loans to deposits) indicates the ability of the bank to finance its loans by deposits. The value of this
indicator greater than 1 could be seen as the lack of bank's ability to react to shocks.
Chart 2.43. The liquidity ratio is the ratio between liquid assets and liquid liabilities (a vista liabilities and liabilities with maturity
shorter than one month). According to the Decision on Risk Management by Banks, the average monthly liquidity
ratio should not be lower than 1, the liquidity ratio should not be lower than 0.9 longer than 3 days, and it should
never be lower than 0.8.
Chart 2.44. The liquidity ratio is the ratio between first-order liquid assets and liquid liabilities. According to the Decision on
Risk Management by Banks, the average monthly narrow liquidity ratio should not be lower than 0.7, the narrow
liquidity ratio should not be lower than 0.6 longer than 3 days, and it should never be lower than 0.5.
Chart 2.45. Liquid assets are the sum of bank's liquid first and second-degree receivables, as on the last day of the month
(defined in the Decision on Risk Management by Banks). More restrictive definition defines liquid assets as liquid
first-degree receivables on the last day of the month.
Chart 2.46. High-power money consists of cash in circulation and banks' deposits in dinars with the National Bank of Serbia.
Chart 2.47. As part of the Vienna Initiative, some regulatory concessions were made to foreign banks that agreed to keep
their exposures to the Serbian market at the agreed level.
Chart 2.49. The net open FX position is the sum of maximum of absolute value of the total long position and absolute value of
the total short position in foreign currency, plus the absolute value of position in gold. The total long (total short)
foreign currency position of the banking sector is the sum of its net long (net short) positions by foreign
currencies.
Chart 2.50. Key indicators of the exposure to the foreign currency risk are the net open FX position to the regulatory capital
ratio and the net open FX position to Tier 1 ratio, as a more conservative measure of risk. The Decision on Capital
Adequacy of Banks requires that the ratio of the net open FX position to regulatory capital must be at all times
below 20%.
1. Financial soundness indicators
2. Banking sector
72

Charts 3.7. and 3.8. Profitability indicators are avaliable in annual frequency.
Chart 3.9. The combined indicator is sum of the two ratios shown on chart. The value greater than 100% means that
insurance companies mainly depend on the result of their investement activities in financial markets, instead on
results of their basic activities.
Chart 3.10. The fondex daily value is obtained by multiplying the value of index for the previous day by the weighted average
of chain index values of investement units for every fund.
Chart 6.3. Credit default swap (CDS) is a financial derivative designed to hedge its holder against the default of the issuer of
an underlying bond. CDS spread is a price the owner of CDS has to pay for the provided protection. An increase
in this insurance premium is an indicator of the increase in the credit risk of an underlying bond.
Chart 6.8. The emerging market bond index (EMBI) is the difference between the premium investors require for holding
public debt of the market considered and the premium required for holding US Treasury bonds.
Chart 6.39. According to the IMF definition, FX reserves consist of those external assets that are readily available to and
controlled by monetary authorities for direct financing of payments imbalances, for indirectly regulating the
magnitude of such imbalances through intervention in exchange markets to affect the currency exchange rate,
and/or for other purposes. Gross FX reserves consist of foreign securities, deposits on accounts abroad, effective
foreign money, gold, and special drawing rights. Net FX reserves are gross FX reserves minus banks' deposits
and special drawing rights related to gross FX reserves.
Chart 6.45. According to the Law on Public Debt, public debt of the Republic of Serbia is defined as debt of the Republic,
based on agreements concluded by the Republic; debt of the Republic based on issuing securities; debt of the
Republic based on contracts/agreements according to which obligations of the Republic, pursuant to previously
concluded agreements, have been rescheduled; debt of the Republic, based on the guarantee issued by the
Republic and/or based on the counter-guarantee issued by the Republic; debt of local government and legal
entities for which the Republic has issued guarantees.This Law intorduces the upper limit for the level of public
debt at 45% of GDP.
Chart 7.1. The bid-to-cover ratio is defined as the ratio between the nominal value of total submitted bids and the nominal
value of sold securities.
Chart 7.9. The annual turnover ratio is defined as the ratio between the extent of secondary market trading and the mean of
the stock of securities in the beginning and in the end of period.
Chart 7.16. The availability of an average housing unit to an average household in Republic of Serbia measured by the price-
to-income ratio, calculated as the ratio of the price of a 60m2 apartment to the average disposable income of an
average household in Republic of Serbia
7. Financial markets and real estate market
6. International macroeconomic environment
3. Non-banking financial sector
73