QUARTERLY REVIEW 2008 - Central Bank of Malta · PDF fileThe Quarterly Review is ... CENTRAL...
110
QUARTERLY REVIEW 2008 Vol. 41 No. 2
Transcript of QUARTERLY REVIEW 2008 - Central Bank of Malta · PDF fileThe Quarterly Review is ... CENTRAL...

QUARTERLY REVIEW2008
Vol. 41 No. 2

© Central Bank of Malta, 2008
AddressPjazza KastiljaValletta VLT 1060Malta
Telephone(+356) 2550 0000
Fax(+356) 2550 2500
Website http://www.centralbankmalta.org
E-mail [email protected]
Printed byGutenberg Press LtdGudja RoadTarxien, Malta
All rights reserved. Reproduction is permitted provided that the source is acknowledged. The Quarterly Review is prepared and issued by the Economics and External Relations Division of the Central Bank of Malta. Opinions expressed do not necessarily reflect the official views of the Bank.
The cut-off date for statistical information published in the Economic Survey of this Review is 4 July 2008, except where otherwise indicated. Figures in tables may not add up due to rounding.
ISSN 0008-9273 (print)ISSN 1811-1254 (online)

CoNTENTs
1. Foreword 5
2. The International Environment 7
The world economy
Commodities
3 The Euro Area 11
Output and the labour market
Prices
Monetary and financial developments
Exchange rates
Outlook
4. The Maltese Economy 17
Output
Box 1: Strong performance in tourism
The labour market
Box 2: Business and consumer surveys
Prices
Box 3: Residential property prices
Cost and competitiveness
The balance of payments
Government finance
Monetary and financial developments
Box 4: Economic projections for 2008 and 2009
Box 5: Labour utilisation and economic convergence
49
53
NEWs NoTEs
sTATIsTICAL TABLEs
ECoNoMIC sURVEY

ABBREVIATIoNs
COICOP ClassificationofIndividualConsumptionbyPurposeEBRD European Bank for Reconstruction and DevelopmentECB European Central Bankecu european currency unitEEA European Economic Area EMU Economic and Monetary UnionEONIA Euro OverNight Index AverageERM II exchange rate mechanism IIESA 95 European System of Accounts 1995ESCB European System of Central BanksETC Employment and Training CorporationEU European UnionEURIBOR Euro Interbank Offered RateFI fungibility issueGDP gross domestic productHICP Harmonised Index of Consumer PricesIMF International Monetary FundLFS Labour Force SurveyMIGA Multilateral Investment Guarantee AgencyMFI Monetary Financial InstitutionMFSA Malta Financial Services AuthorityMSE Malta Stock ExchangeNACERev.1 StatisticalclassificationofeconomicactivitiesintheEuropeanCommunityNCB national central bankNPISH Non-ProfitInstitutionsServingHouseholdsNSO NationalStatisticsOfficeOECD Organisation for Economic Co-Operation and DevelopmentOMFI Other Monetary Financial InstitutionOPEC Organisation of Petroleum Exporting CountriesRPI Retail Price Index
CENTRAL BANK OF MALTA Quarterly Review 2008:2
5
1. FoREWoRd
ECoNoMIC sURVEY
With Malta’s entry into the euro area as from 1 January 2008, the monetary policy decisions of the Governing Council of the ECB began to apply in Malta as well. The primary objective of the ECB’s monetarypolicyistoachievepricestability,whichisdefinedintermsofinflationratesofbelow,butcloseto,2%overthemediumterm.Inthisrespect,duringthefirsthalfof2008,theGoverningCouncil, which from the beginning of the year was expanded to include the Governor of the Central Bank of Malta and the Governor of the Central Bank of Cyprus, kept its main policy rate, theminimumbidrateontheECB’smainrefinancingoperations,constantat4%.Atthebeginningoftheyear,theGoverningCouncilconfirmedupsideriskstopricestabilityinthemediumterm,butalsonotedtheuncertaintyabouttheimpactoftheongoingreappraisalofrisksinfinancialmarketson the real economy. TheCouncil also stressed the importance of firmly anchoring inflationexpectationsoverthemediumandlongtermandpreventingsecond-roundeffectsoninflation.As the year progressed, the Governing Council noted that risks to price stability had increased furtherandthatinflationwasexpectedtoremainhighforalongerperiodthanpreviouslythought.As a result, to prevent broadly based second-round effects and to counteract the increasing upside risks to price stability, in July the ECB tightened its policy stance, raising the minimum bid rateby25basispoints to4.25%andreaffirming theoverriding importanceofsustainingpricestability in the medium term.
Asintherestoftheeuroarea,inflationinMaltahasbeenonanupwardtrendinrecentmonths,mainly reflecting the impact of higher food and energy prices. Inflation may rise further inresponse to the revision of water and electricity prices that came into effect at the beginning of July. Hence, it is essential that higher utility bills do not lead to second-round wage and price effectsand thus reinforce inflationarypressures.Whileenergypricesappear tohave risen topermanentlyhigherlevels,temporaryfiscalmeasures,suchashigherenergysubsidies,canonlydelaythenecessaryadjustment,impedetherequiredimprovementinefficientenergyusageandunderminetheprocessoffiscalconsolidation.
GDPgrowthremainedrelativelystronginthefirstquarterof2008,at3.5%.However,accordingto the Bank’s latest projections, growth in 2008 and 2009 is likely to slow down. This is because of anexpectedslowdownindomesticdemand,particularlyprivateconsumption,ashigherinflationerodes purchasing power. Against this background of slower growth, it is a matter of concern that since the second quarter of 2007 exports in real terms have been declining on an annual basis. Toalargeextentthismayreflectdecliningsalesbythesemiconductorindustry,whichhavenotbeen entirely compensated for by exports by other productive sectors. This notwithstanding, there have been positive developments, with strong growth continuing to be registered by two specificnichesectors,namelypharmaceuticalsandremotegaming.Tourismhasalsoextendedits recovery, with robust increases being recorded in the number of visitors, although the positive impact was dampened by the trend decline in the average length of stay as a result of the changing nature of tourism following the advent of low cost airlines.
Labour market dynamics remained positive, with robust employment growth and falling unemploymentuptothefirstquarterof2008.Inthisrespect,however,asarguedinthiseditionof the Quarterly Review, it is imperative that Malta’s growth potential be enhanced by a more

CENTRAL BANK OF MALTA Quarterly Review 2008:2
6
active labour force. Higher female participation in the labour market, in line with the Lisbon targets, is therefore necessary to bridge the income gap between Malta and the EU average. The introduction of appropriate incentives, such as those announced in recent Budgets, represents a step in this direction.
Apartfromthelabourmarket,otherfactorandproductmarketsmustbesufficientlydynamicandflexibletobeabletocopeeffectivelywithalikelyslowdowninMalta’smaintradingpartners.Tosustain the overall pace of growth enjoyed during recent years, growth areas in both the services and the manufacturing sectors must continue to compensate for the decline of other activities, particularly in manufacturing, which have been adversely hit by globalisation and the euro’s overall strength. Moreover, to safeguard the country’s competitiveness, wage growth should mirror gains in productivity, while regulatory measures should further address the distortions arising from restrictive market practices that raise costs across the economy.

CENTRAL BANK OF MALTA Quarterly Review 2008:2
7
2. ThE INTERNATIoNAL ENVIRoNMENT
The world economyIn the first quarter of 2008economic activity in the major industrial countries continued to slow down against a background of continued turbulence in financial markets, though thesurge in global commodity prices did not seem to have had a negative impact on these economies as yet. On the other hand, growth in emerging markets remained strong. But inflationary pressures roseworldwide, in response to higher prices of energy and food.
US economic growth steady, inflation edges up further The US economy grew at an annual rate of 2.5% during the quarter, maintaining the same pace seen in the December quarter (see Table 2.1). On a quarter-on-quarter basis, however, economic expansion, at 0.2%, was modest. Net exports increased on an annual basis, supported by the depreciation of the dollar. At the same time, government consumption expenditure accelerated, while the decline in private investment was less pronounced than it was over the year to December, although residential investment continued to fall. Nevertheless, labour market conditions deteriorated, with the unemployment rate rising to an average of 4.9%. Going into the second quarter, unemployment continued to increase, reaching 5.5% of the labour force in May. Meanwhileinflationaveraged4.1%,0.1percentagepointshigherthaninthefinalquarterof2007,before easing to 3.9% in April (see Chart 2.1). Higher energy and food prices were the main drivers behind the increase.
Against a background of deteriorating conditions, particularly in the housing market, the latter partly asaresultoftheongoingturmoilinfinancialmarkets,theFederalReserveeaseditsmonetarypolicystancesignificantlyduring theperiodunderreview. On22January it lowered its targetfor the federal funds rate by three-quarters of a percentage point and on 30 January it lowered
Table 2.1REAL gdP gRoWThAnnual percentage changes, seasonally adjusted
2006 2007 2008Q4 Q1 Q2 Q3 Q4 Q1
United States 2.6 1.5 1.9 2.8 2.5 2.5Euro area 3.2 3.2 2.6 2.7 2.1 2.2United Kingdom 3.2 3.1 3.3 3.1 2.8 2.3Japan 2.5 3.1 1.7 1.8 1.4 1.3Sources: Eurostat; Bureau of Labor Statistics, US; Statistics Bureau, Japan.
-1.0
0.0
1.0
2.0
3.0
4.0
5.0
J 2005
M M J S N J 2006
M M J S N J 2007
M M J S N J 2008
M
Euro area United States United Kingdom Japan
Chart 2.1CoNsUMER PRICE INFLATIoN (annual percentage changes)
Sources: Eurostat; Bureau of Labor Statistics, US; Statistics Bureau, Japan.

CENTRAL BANK OF MALTA Quarterly Review 2008:2
8
it by a further 50 basis points (see Chart 2.2). In March the Fed reduced its target rate once again, by 75 basis points to 2.25%, in an additional effort to avert a further weakening of economic activity. Moreover, the Fed cut the spread between the federal funds target rate and the discount rate and expanded its securities lending programme to provide more liquidity to the banking system. In April, it cut the federal funds target rate by an additional quarter of a percentage point to 2.0%, as economic activity remained sluggish.
USstockpricesandlong-termyieldsgenerallyfellduringthefirstquarterof2008,drivenmainlyby concerns regarding the state of the economy (see Chart 2.3 and 2.4). Uncertainty about the liquiditysituationofmajorUSfinancialinstitutionsaddedfurtherdownwardpressure.InAprilandMay, however, equity prices and long-term yields rebounded among expectations that the worst of the credit market losses might be over.
UK economic activity slows down, inflation acceleratesIn the United Kingdom the pace of economic activity slowed down during the March quarter, with annualGDPgrowthfallingto2.3%from2.8%inthefinalquarterof2007.Highernetexportsanda rise in household and government expenditure failed to offset a fall in investment. Nevertheless, thejoblessrateremainedunchangedat5.0%inthefirsttwomonthsof2008.Annualconsumerprice inflation averaged 2.4% during the first quarter, up by 0.3 percentage points over theDecember quarter, before surging to 3.0% in April, spurred by spiralling transport, electricity and food prices.
Afterhavingleftitsofficialinterestrate unchanged in January, the Bank of England cut the rate by a quarter of a percentage point to 5.25% in February, as the prospects for output growth deteriorated and the turbulence in global financial marketscontinued. In March the rate was kept on hold, before being lowered again to 5.0% in April. Furthermore, in the same month
0.0
1.0
2.0
3.0
4.0
5.0
6.0
J 2005
M M J S N J 2006
M M J S N J 2007
M M J S N J 2008
M M
ECB minimum bid rate US federal funds rate BoE bank rate BoJ basic discount rate
Chart 2.2oFFICIAL INTEREsT RATEs (percentages per annum, end of month)
Sources: ECB; Federal Reserve; Bank of England; Bank of Japan.
0.0
1.5
3.0
4.5
6.0
J 2005
M M J S N J 2006
M M J S N J 2007
M M J S N J 2008
M M
United States United Kingdom Japan
Chart 2.3LoNg-TERM INTEREsT RATEs(1)
(percentages per annum, monthly averages)
(1) Long-term interest rates refer to yields on ten-year government bonds.Source: Reuters.

CENTRAL BANK OF MALTA Quarterly Review 2008:2
9
the Bank launched a special liquidity scheme allowing banks to swap high quality mortgage-backed and other securities forUKTreasurybillsforafixedperiod.
Long-term bond yields in the United Kingdom followed a similar course to those in the United States and the euro area, and generally fell during the quarter. Stock prices also decreased sharply, reflectingconcerns about the US economy. In fact, during the quarter the FTSE 100 index registereditsworstperformanceinmorethanfiveyears.
Japan’s growth falls, inflationary pressures riseTheJapaneseeconomygrewby1.3%inthefirstthreemonthsoftheyear,0.1percentagepointsless than in the previous three-month period. A further decline in investment brought about a reduction in domestic demand and was the main factor behind the slowdown. Nevertheless, the unemployment rate fell marginally compared to the preceding quarter, declining to 3.8%, before edging up to 4.0% in April. In contrast to recent years, the Japanese economy continued to experiencemildinflationarypressuresduringthequarter,withconsumerpriceinflationaveraging1.0%,upfrom0.5%intheDecemberquarter.InApril,however,inflationeasedto0.8%.
The Bank of Japan kept its overnight call rate and discount rate unchanged at 0.5% and 0.75%, respectively,during thefirstquarterof2008and into thesecond. Developments in long-termbond yields in Japan broadly mirrored those in the United States and the euro area, although Japanese yields remained relatively low. Meanwhile, equity prices, as measured by the Nikkei 225 index, fell sharply as a result of concerns about the global economy and the impact that weaker consumer demand worldwide could have on Japan’s exports.
Emerging Asian economies remain resilientReflectingtheresilienceofgrowthinemergingmarketeconomies,ChinaandIndiacontinuedtogrowstronglyduringthefirstquarterof2008,withtheirGDPexpandingatannualratesof10.6%and8.8%,respectively. Botheconomiesexperiencedstrong inflationarypressures. InChina,the annual rate averaged 8.0%, as bad weather conditions pushed up food prices, while in India wholesalepriceinflationreached7.4%attheendofMarch.
Commodities
Oil prices extend their upward trendThe price of Brent crude oil generally receded in the early part of the year, undermined by concerns about the state of the global economy (see Chart 2.5). From mid-February onwards, however, oil pricesrosesharply,respondingtogeopoliticaltensionsanduncertaintiesinfinancialmarkets.The
90
100
110
120
130
140
150
160
J 2005
M M J S N J 2006
M M J S N J 2007
M M J S N J 2008
M M
S&P 500 FTSE 100 Nikkei 225
Chart 2.4sToCK PRICE INdICEs (index of monthly averages, Jan. 2005=100)
Source: Reuters.

CENTRAL BANK OF MALTA Quarterly Review 2008:2
10
Brent crude oil price reached a historic high of USD 109.93 in mid-March, so that, over the quarter as a whole, it had risen by 8.6%. The surge in oil prices continued into the second quarter with new highs being reached.Strikesbyoilrefineryworkers, continued geopolitical tensions and OPEC’s decision not to increase supply were the main factors underpinning the oil market. By the end of May, the oil price had risen to USD 127.50.
Continued rise in non-energy commodity prices In January and February the Reuters Commodity Index continued to rise, buoyed by rising prices of raw materials and food (see Chart 2.5).1 The increase was initially fuelled by robust demand, though the situation was exacerbated when adverse weather conditions led to a reduced supply of key cereals. In mid-March, however, the prices of non-energy commodities lost some momentum asaresultofanoverallsell-offasinvestorssoughttocashinprofitsandcoverlossesrackeduponotherinvestmentsamidfinancialmarketuncertainty.Nonetheless,overthequarter,theReutersCommodity Index rose by 8.1%. Going into the second quarter, non-energy commodity prices recovered some of their earlier losses before stabilising at a somewhat lower level in May.
Safe haven attributes boost goldGold prices increased by 9.9% duringthefirstquarterof2008,as the metal’s safe haven attributes amid the financialmarket turbulence outweighed the impact on the gold price of the broad-based sell-off of commodities in March (see Chart 2.6). In the subsequent two months, gold prices were morevolatile,fluctuatingwithina range of USD 851.65 and USD 944.70. At the end of May the price of gold fell to USD 885.90 as a rise in the US dollar triggered a sell-off in metals.
1 The Reuters Commodity Index is a weighted index of the prices of seventeen commodities that include food, beverages, vegetable oils, agricultural raw materials and metals, but exclude oil and gold.
40
55
70
85
100
115
130
J 2005
M M J S N J 2006
M M J S N J 2007
M M J S N J 2008
M M1,550
1,800
2,050
2,300
2,550
2,800
3,050
Brent crude Reuters Commodity Index (right scale)
Chart 2.5CoMModITY PRICEs (end of week)
(1) US dollars per barrelSource: Reuters.
(1)
400
500
600
700
800
900
1,000
J 2005
M M J S N J 2006
M M J S N J 2007
M M J S N J 2008
M M
Chart 2.� goLd(US dollars per ounce, end of week)
Source: Reuters.

CENTRAL BANK OF MALTA Quarterly Review 2008:2
11
3. ThE EURo AREA
Amid heightened risks to price stability and the uncertainty surrounding the economic outlook, theGoverningCounciloftheECBkepttheminimumbidrateonthemainrefinancingoperationsunchangedat4.00%duringthefirsthalfof2008. On3July,however, theGoverningCouncilraisedofficialinterestratesby25basispoints,bringingtheminimumbidrateupto4.25%.Thisdecisionwas takenagainstabackgroundof increasedconcernsaboutsecond-round inflationpressures and further evidence of upside risks to price stability over the medium term.
output and the labour market
Economic growth in the euro area exceeds expectationsInthefirstquarterof2008euroareaGDPgrewatasustainedannualrateof2.2%,exceedingmarket expectations (see Table 3.1). Growth was mainly driven by domestic demand, in particular buoyantinvestment,thoughthecontributionofnetexportswasalsosignificant.
Investment growth accelerated to 3.6% during the quarter, adding 0.8 percentage points to the annual growth rate. Though private consumption weakened towards the end of 2007, it continued toprovidesupporttoeuroareagrowthinthefirstquarterof2008,risingby1.2%onanannualbasisand adding a further 0.7 points to GDP growth. Nevertheless, while broadly positive labour market developmentsremainedsupportiveofprivateconsumption,stronginflationinfoodandenergypricesbegantoimpactnegativelyonconsumerconfidence.ThiswasreflectedintheEuropeanCommission’sconsumerandretailtradeconfidenceindicators,bothofwhichdeterioratedfurtherinthefirstquarterof2008.Meanwhile,governmentconsumptionexpandedataslowerpace,1.4% compared with 2.0% a quarter earlier and contributed 0.3 points to overall growth.
Table 3.1REAL gdP gRoWThSeasonally adjusted
2008Q1 Q2 Q3 Q4 Q1
Private consumption 1.5 1.8 1.8 1.2 1.2Government consumption 2.3 2.4 2.6 2.0 1.4GFCF 6.8 3.8 3.9 3.2 3.6domestic demand 3.0 2.3 2.2 1.9 1.�Exports 6.6 5.9 7.2 4.4 5.4Imports 6.1 5.2 6.1 4.0 4.3gdP 3.2 2.� 2.7 2.1 2.2
Private consumption 0.9 1.0 1.0 0.7 0.7Government consumption 0.5 0.5 0.5 0.4 0.3GFCF 1.4 0.8 0.8 0.7 0.8Changes in inventories 0.2 -0.1 -0.2 0.1 -0.1domestic demand 3.0 2.3 2.2 1.9 1.�Exports 2.6 2.3 2.9 1.8 2.2Imports -2.4 -2.0 -2.4 -1.6 -1.7Net exports 0.3 0.3 0.5 0.2 0.5gdP 3.2 2.� 2.7 2.1 2.2Source: Eurostat.
2007
Annual percentage changes
Percentage point contributions

CENTRAL BANK OF MALTA Quarterly Review 2008:2
12
Net exports strengthened further during the quarter, contributing a positive 0.5 percentage points to the annual growth rate. This was mainly due to strong growth in exports.
Labour market conditions remain favourable Labour market conditions remained favourable during the first quarter of 2008, thoughemployment expanded at a slightly slower pace, by 1.6% year-on-year compared with 1.8% in the December quarter.
At the end of March 2008, the area-wide unemployment rate stood at 7.2%, unchanged from the previous month but lower than the 7.6% rate recorded a year earlier (see Chart 3.1). More recent data, however, show that although the unemployment rate remained low in April, the number of unemployedpersonsroseforthefirsttimesinceFebruary2006.
Prices
Inflation accelerates to new highsMountinginflationarypressures,inevidencesincetheautumnof2007,persistedinto2008,withtheannualHICPinflationraterisingto3.6%inMarchfrom3.1%inDecember.Themaindriversofinflationcontinuedtobeoilandfoodcommodityprices(seeChart3.2).
Soaring oil prices, in particular, drove the annual rate of change of energy prices up from 9.2% in December to 11.2% in March. Meanwhile, the sharp increase in the prices of nearly all major agricultural commodities since mid-2007 led to an acceleration in the annual growth rate of processed food prices to 6.8% in March from 5.1% in December. By contrast, the annual growth rate of unprocessed food prices was more contained.
Excluding unprocessed food and energy, annual HICP inflation rose to2.7% inMarchfrom 2.3% in December, mainly reflecting a moderate increase
-250
-200
-150
-100
-50
0
50
100
150
J 2005
M M J S N J 2006
M M J S N J 2007
M M J S N J 2008
M M6.0
6.5
7.0
7.5
8.0
8.5
9.0
9.5
10.0
monthly change in thousands % of labour force (right scale)
Chart 3.1 UNEMPLoYMENT (monthly data, seasonally adjusted)
Source: Eurostat.
Chart 3.2CoNTRIBUTIoNs To YEAR-oN-YEAR hICP INFLATIoN(percentage points, annual percentage change)
-1.0
0.0
1.0
2.0
3.0
4.0
J 2006
M M J S N J 2007
M M J S N J 2008
M M
Energy Non-energy industrial goodsProcessed food including alcohol and tobacco Unprocessed foodServices (overall index excluding goods) All-items HICP
Source: Eurostat.

CENTRAL BANK OF MALTA Quarterly Review 2008:2
13
inservicespriceinflation.1 Meanwhile, the annual increase in non-energy industrial goods prices fellslightly,to0.9%inMarch,signallingtheabsenceofsignificantpricepressures.
After having fallen to 3.3% inApril, euro area inflation rebounded to 3.7% inMay, while thelatestflashestimatefromEurostatindicatesafurtheraccelerationto4.0%inJune.Thisrecentpick-upprobablyreflectsfurtherincreasesintheHICPenergycomponent,duetothepersistentacceleration in oil prices, as well as the strong dynamics exerted by food prices.
Monetary and financial developments
Money growth remains vigorous Theunderlyingpaceofmonetaryexpansionintheeuroarearemainedrobustinthefirstquarterof 2008, despite a decline in the quarterly average annual growth rate of M3 to 11.2% from 12.0% in the preceding quarter (see Table 3.2). While there is evidence of some effects related to the financial turmoil on specific components and counterparts ofM3, the recent financialmarketturbulence does not appear to have had a substantial direct impact on the growth of broad money and credit aggregates in the euro area.
AverageannualM1growthcontinued tomoderate, falling to3.8% in thefirstquarterof2008from 5.9% in the December quarter. Short-term deposits other than overnight deposits continued tomakethelargestcontributiontoannualM3growth,reflectingthevigorousexpansionoftimedeposits with an agreed maturity of up to two years, which rose at an average annual rate of 41.4%duringthequarter.Theshiftintoshort-termdepositswaslargelydrivenbyaflatteningofthe yield curve.
Annual M3 growth accelerated further to 10.5% in May, from 10.1% in March.
Strong growth in credit to the private sector continuesRobust monetary growth continued to be supported by strong expansion of MFI loans to the
1TheHICPmeasurewhichexcludesunprocessedfoodandenergygivesanindicationofunderlyinginflationarypressures.
Table 3.2MoNETARY AggREgATEsAnnual percentage changes, seasonally adjusted, quarterly data are averages
2008Q1 Q2 Q3 Q4 Q1 Jan. Feb. Mar. Apr. May
M1 7.0 �.2 �.5 5.9 3.8 4.4 3.7 2.9 2.5 2.3Currency in circulation 10.4 10.0 8.9 8.0 7.8 7.8 7.7 7.7 8.0 7.5Overnight deposits 6.4 5.5 6.1 5.5 3.1 3.7 2.9 2.0 1.4 1.3M2-M1 (Other short-term deposits) 11.9 13.1 15.0 16.8 18.3 17.8 19.2 18.2 19.8 19.4
Deposits with an agreed maturity of up to two years
29.5 33.1 37.6 40.6 41.4 41.3 43.0 39.2 41.6 40.4
Deposits redeemable at notice of up to three months
-0.7 -2.2 -3.2 -3.9 -3.3 -3.7 -3.1 -2.5 -2.2 -2.4
M2 9.1 9.2 10.3 10.7 10.3 10.4 10.� 9.8 10.4 10.1
M3 10.2 10.� 11.5 12.0 11.2 11.5 11.3 10.1 10.5 10.5
2007 2008
Source: ECB.

CENTRAL BANK OF MALTA Quarterly Review 2008:2
14
non-financial private sector.These rose at an average annual rate of 11.0% during the first quarter of 2008, downslightly from 11.2% in the December quarter. MFI loans to non-financial corporationscontinued to strengthen, rising at an average annual rate of 14.6%inthefirstthreemonthsof 2008 from 14.0% in the preceding quarter and offsetting the moderation in the growth of loans to households. In line with the downward trend observed since early 2006, the annual growth rate of loans to households fell from 6.6% on average in the fourth quarter of 2007 to 5.9% in the following quarter,reflectinghigherbanklendingratesandmoderatinghousingmarketdynamics(seeChart3.3). Meanwhile, the annual growth rate of consumer credit remained unchanged, while that of loans for other purposes moderated further.
InApril,theannualgrowthofMFIloanstonon-financialcorporationswasstrong,unchangedfromthe March rate of 14.9%. However it fell to 14.2% in May.
Spreads between unsecured and secured rates widenAfterhavingrisensignificantlyinDecemberasaresultoftensionsthattypicallyemergeinthemoney market towards the end of the year, unsecured money market interest rates, as measured by EURIBOR rates, decreased significantlyinJanuaryandearlyFebruary,reflectingadownwardshift in market expectations regarding the future path of key ECB interest rates.2 Unsecured money market interest rates then rose in March, reflecting end-of-quarter effects. The three-month EURIBOR thus ended March at 4.73%, up slightly from its end-December level. As a result, spreads between EURIBOR and secured rates, such as those derived from the EONIA swap rate, widened during thefirstquarterof2008and remained exceptionally
2 EURIBOR (euro interbank offered rate) refers to the rate at which a prime bank is willing to lend funds to another prime bank in euro.
4.0
8.0
12.0
16.0
J 2006
M M J S N J 2007
M M J S N J 2008
M
Loans to households Loans to non-financial corporations
MFI loans to the non-financial private sector
Chart 3.3MFI LoANs To ThE NoN-FINANCIAL PRIVATE sECToR (annual percentage changes)
Source: ECB.
3.0
3.5
4.0
4.5
5.0
5.5
J2007
M M J S N J2008
M M
EURIBOR 3-month EONIA swap rate EURIBOR 12-month Minimum bid rate
Chart 3.4KEY INTEREsT RATEs (percentages per annum,daily data)
Sources: ECB; Reuters; Euribor FBE.

CENTRAL BANK OF MALTA Quarterly Review 2008:2
15
wide by historical standards.3 EURIBOR rates also remained significantly above the ECB’sminimum bid rate.
Into the second quarter of 2008, unsecured money market interest rates increased substantially, causing spreads between unsecured and secured money market rates to widen further. Consequently, the money market yield curve derived on the basis of unsecured rates steepened markedly, as can be seen from the sharp rise in the 12-month EURIBOR shown in Chart 3.4.
Euro area equity prices fall EuroareastockpricesbroadlyfollowedglobaltrendsbetweenDecemberandMarch.InthefirsttwoweeksoftheyeartheydroppedsharplyreflectingincreasedriskaversionasmarketconcernsregardingthefinancialandeconomicimplicationsoftheUSsub-primemortgagecrisisintensified.Subsequently, following the Federal Reserve’s decision to loosen its monetary policy stance, stock prices rebounded. Overall, euro area equity prices, as measured by the Dow Jones EURO STOXX index, fell by around 16% between end-December 2007 and end-March 2008 (see Chart 3.5).
BetweentheendofMarchandearlyMay,however,euroareastockpricesrebounded,reflectinga renewed increase in investors’ risk appetite and improved risk perceptions.
Exchange rates
The euro strengthens against other major currenciesIn the foreign exchange markets, the euro continued to strengthen inthefirstquarterof2008.DuringJanuary it generally fluctuatedwithin a narrow range against the US dollar before appreciating steadily throughout February and March (see Chart 3.6). The euro’s firmtrendinMarchreflectedthesharp weakening of the dollar in international markets, possibly on account of indications of slowing 3 EONIA (euro overnight index average) is a measure of the effective interest rate prevailing in the euro interbank overnight market. The EONIAswaprateisthefixedratethatbanksarewillingtopayinexchangeforreceivingtheaverageEONIArateoverthelifetimeofaswap contract.
80
85
90
95
100
105
110
115
J2007
M M J S N J2008
M M
S&P 500 Dow Jones EURO STOXX
Chart 3.5sToCK PRICE INdICEs (index of daily data, Jan. 200�=100)
Source: Reuters.
85
95
105
115
125
J 2005
M M J S N J 2006
M M J S N J 2007
M M J S N J 2008
M M
USD JPY GBP
Chart 3.�ExChANgE RATE MoVEMENTs AgAINsT ThE EURo(index of average monthly rates, Jan. 2005=100)
Source: Eurostat.

CENTRAL BANK OF MALTA Quarterly Review 2008:2
16
activity in the United States and expectations of wider interest rate differentials between the United States and the euro area.
Meanwhile, the fluctuationsthat had characterised the exchange rate of the euro vis-à-vis the Japanese yen since the summer of 2007 diminished inthefirstquarterof2008.TheEuropean currency weakened substantially against the Japanese yen in January on account of some unwinding of carry trade positions. In the following two months it traded within a narrow range amid high expectations of future volatility in the bilateral exchange rate.Intermsofthepoundsterling,theeuroappreciatedsteadilyoverthefirstthreemonthsoftheyear,rising by around 7.5%. The trend was clearly evident in February and March 2008 as prospects for the UK economy became more negative. Going into the second quarter of 2008, the upward trend of the euro against the US dollar persisted duringAprilbutwasreversedinMay,asexpectationsoffurthercutsinUSpolicyratesinthefirsthalf of 2008 were revised. Over the same period, however, the euro continued to appreciate against both the Japanese yen and the pound sterling.
At the end of March, the nominal effective exchange rate of the euro, as measured against the currencies of 22 of the euro area’s trading partners, was 3.6% above the level at the end of December2007(seeChart3.7). Thenominalappreciationof theeurowas influencedbythegains recorded by the single currency against the US dollar.
In April, the euro appreciated further in nominal effective terms, before stabilising in May amid heightenedmarketconcernsabouttheinflationoutlookintheUnitedStates.
outlook
Euro area economic activity expected to slow while high inflation persistsEuro area economic activity is projected to slow down in 2008. According to the latest Eurosystem projections, average annual real GDP growth is expected to lie in a range between 1.5% and 2.1% in 2008 and between 1.0% and 2.0% in 2009. Similarly, the European Commission projects euro area real GDP growth to stand at 1.7% in 2008, before falling to 1.5% in 2009.
Whiledownsideriskstogrowthprevail,euroareainflationislikelytoremainabove3.0%during2008,beforemoderatinggraduallyin2009.ThelatestEurosystemprojectionspointtoannualHICPinflationbetween 3.2% and 3.6% in 2008 and between 1.8% and 3.0% in 2009. Meanwhile, the European CommissionanticipatesthattheannualaverageHICPinflationintheeuroareawillbe3.2%in2008and 2.2% in the following year.
100
105
110
115
120
J 2007
M M J S N J 2008
M M
Chart 3.7EURo NoMINAL EFFECTIVE ExChANgE RATE(index of daily effective exchange rate, Q1 1999=100)
Source: ECB.

CENTRAL BANK OF MALTA Quarterly Review 2008:2
17
4. ThE MALTEsE ECoNoMY
output
Real GDP growth broadly stable The steady pace of economic growth observed since the third quarter of 2005 continued into the first quarter of 2008,when real GDP grew by 3.5% (see Chart 4.1). Growth was underpinned by buoyant domestic demand, particularly consumption and inventory accumulation. In contrast, net exports contributed negatively to growth, as exports contracted at a faster pace than imports (see Table 4.1).
After having declined in the latter half of 2007, private consumption expenditure resumed its upward trend during the quarter under review, rising by 2.1% from a year earlier and adding 1.4 percentage points to overall GDP growth. Nominal data point to higher expenditure on food & beverages and on energy-related items as the main factor boosting consumption. Meanwhile, government consumption picked up strongly, rising by just under 13% year-on-year and contributing
0
1
2
3
4
5
Q1 2005
Q2 Q3 Q4 Q1 2006
Q2 Q3 Q4 Q1 2007
Q2 Q3 Q4 Q1 2008
Chart 4.1REAL gdP gRoWTh(annual percentage changes)
Source: NSO.
2008Q1 Q2 Q3 Q4 Q1
Household final consumption expenditure 2.8 3.2 0.2 0.4 2.1Government final consumption expenditure -1.0 -0.9 -0.2 1.5 12.9Gross fixed capital formation -11.9 6.4 -0.5 23.5 -5.4Inventories as a % of GDP 0.5 5.1 0.0 3.7 4.7domestic demand -3.� -0.4 3.5 11.7 �.8Exports of goods & services 3.9 -2.3 -0.1 -3.3 -4.5Imports of goods & services -4.2 -5.8 -0.6 5.1 -0.4gross domestic product 3.9 3.8 4.0 3.� 3.5
Household final consumption expenditure 1.8 2.1 0.2 0.2 1.4Government final consumption expenditure -0.2 -0.2 0.0 0.3 2.5Gross fixed capital formation -2.9 1.2 -0.1 4.5 -1.1Changes in inventories -2.7 -3.5 3.5 7.2 4.4domestic demand -4.0 -0.4 3.5 12.3 7.2Exports of goods & services 3.5 -2.3 -0.1 -3.3 -4.1Imports of goods & services 4.4 6.4 0.6 -5.4 0.4Net exports 7.9 4.2 0.5 -8.7 -3.7gross domestic product 3.9 3.8 4.0 3.� 3.5
Percentage point contributions
Source: NSO.
Table 4.1gRoss doMEsTIC PRodUCT AT CoNsTANT PRICEs
2007
Annual percentage changes

CENTRAL BANK OF MALTA Quarterly Review 2008:2
18
2.5 percentage points to overall growth. This increase was spurred by higher outlays on employee compensation and intermediate consumption. Grossfixedcapitalformationwasdownfromitsyear-agolevelaslowerprivatesectorspendingon machinery & transport equipment coincided with the completion of construction works at the new hospital. To a certain extent, the reduction was mitigated by increased government spending on medical equipment and by housing-related projects in the private sector.
There was a further contraction inmerchandise exports,mainly reflecting a drop in sales ofelectronics and clothing products. Merchandise imports too declined, but at a slower pace. The resulting drop in net exports of goods and services knocked 3.7 percentage points off GDP growth. Given the correlation between changes in export volumes and in imports of intermediate goods, because of the high import content of exports, the build-up in inventory holdings during the quarter appeared to be linked to anticipated export sales. Indeed, inventories rose to 4.7% of GDP, a full percentage point higher than in the previous quarter. It should be borne in mind, however,thatthisitemincludesthestatisticaldiscrepancyresultingfromunclassifiedexpenditurein the national accounts.
Details of nominal GDP growth by sector indicate that during the quarter the other community, social & personal services sector contributed almost a half of total growth (see Table 4.2). Over the last few quarters, this sector was boosted by the activities of the on-line gaming industry.
Another important growth sector is real estate, renting & business activities, particularly the lastmentioned. During thefirstquarterof2008 thesector’sgrossvalueaddedexpandedby13%, mostly driven by the business activities and, to a lesser extent, the real estate sub-sectors. Construction also contributed positively to value added, despite indications of a slowdown in the property market.
Table 4.2
Percentage points
2008Q1 Q2 Q3 Q4 Q1
Agriculture, hunting & forestry -0.1 -0.2 -0.2 -0.1 0.2 Fishing 0.0 0.0 0.0 -0.5 0.0 Manufacturing 2.2 1.2 1.6 1.2 -0.3 Electricity, gas & water supply 0.2 0.0 0.1 -0.8 -0.9 Construction -0.2 0.1 0.0 0.0 0.3 Wholesale & retail trade 0.1 -0.5 0.8 0.6 0.6 Hotels & restaurants 0.1 0.2 0.7 0.4 0.2 Transport, storage & communication 0.5 0.5 0.8 0.6 0.4 Financial intermediation 1.2 0.8 -1.4 -2.0 -0.7 Real estate, renting & business activities 1.0 1.0 1.3 1.4 1.9 Public administration 0.3 0.3 0.4 0.4 0.6 Education 0.1 0.2 0.4 0.1 0.4 Health & social work 0.2 0.5 0.3 0.1 0.8 Other community, social & personal services 0.6 1.5 1.9 2.6 3.2 gross value added �.0 5.� �.5 4.1 �.7 Net taxation on production and imports 1.0 0.4 0.3 1.7 -0.� Annual nominal gdP growth (%) 7.0 �.0 �.7 5.8 �.2
CoNTRIBUTIoN oF sECToRAL gRoss VALUE AddEd To NoMINAL gdP gRoWTh
2007
Source: NSO.

CENTRAL BANK OF MALTA Quarterly Review 2008:2
19
Meanwhile the pick-up in the wholesale & retail trade in the latter part of 2007 continued into the firstquarterof2008,whenthesector’sgrossvalueaddedroseby5.6%.
Gross value added in the hotels and restaurants sector rose by 8.3% driven by labour compensation and supported in part by the fact that hotels achieved higher room rates during the quarter. The sector’s 0.2 percentage point contribution to gross value added was in line with seasonal patterns and corroborated evidence of the continuing growth in the tourist industry.
Box 1: sTRoNg PERFoRMANCE IN ToURIsM
In the first quarter of 2008,tourist numbers were up by 22% compared to a year ago, aided by the early Easter holiday period (see Chart 1). Although total nights stayed increased substantially, the average length of stay continued on its downward path, falling to 8 nights from 8.7 nights a year earlier. This, in part, reflectsthechangingnatureof the tourism industry, with the growth of low-cost airline travel encouraging further the tendency among travellers to take more frequent but shorter holidays. Occupancy rates rose marginally over a year ago at the higher end of the accommodation spectrum, and more substantially in 2-star hotels, but declined in 3-star hotels and in the “other” accommodation category (see Chart 2).
Meanwhile, the number of cruise liner passengers declined substantially during the quarter, when passenger numbers were almost 46% down from the year-ago level. Subsequent data, however, show a reversal in April and May, with passenger numbers rising at double-digit rates.
-15
-10
-5
0
5
10
15
20
25
Q2 2005
Q3 Q4 Q1 2006
Q2 Q3 Q4 Q1 2007
Q2 Q3 Q4 Q1 2008
Departing tourists Nights stayed
Chart 1ToURIsT ARRIVALs ANd NIghTs sTAYEd(annual percentage changes)
Source: NSO.
0
5
10
15
20
25
30
35
40
45
50
5-Star 4-Star 3-Star 2-Star Other
2005 2006 2007 2008
Chart 2AVERAgE oCCUPANCY RATEs IN ThE FIRsT QUARTER(percent)
Source: NSO.
(1)Includes guesthouses, hostels & holiday complexes.
(1)

CENTRAL BANK OF MALTA Quarterly Review 2008:2
20
Other contributors to GDP growth were public administration, health & social work and the educationsector,partlyreflectingincreasesawardedtogovernmentemployeesinthesesectorswhich came into effect at the beginning of the year. Together, the three sectors accounted for almost 30% of the overall growth in nominal GDP.
The financial intermediation sector reported a reduction in value added as a result of higheroperating expenses. Meanwhile, the ongoing increase in the price of imported oil contributed to a negative growth in value added by the electricity, gas & water supply sector.
In manufacturing, the impact of the ongoing consolidation process was evident in a 1.6% decline in the sector’s gross value added and a 0.3 percentage point decline in the latter’s contribution to nominal GDP growth, mainly on account of a larger contraction in turnover than in intermediate consumption. These developments were corroborated by the results of the NSO’s survey of manufacturing firms, which revealed reduced export sales of semiconductors, electricalmachinery and, to a lesser extent, clothing (see Table 4.3). However, this contraction was partly offsetbycontinuedstronggrowthinexportsofpharmaceuticals.Meanwhile,forthefirsttimeinseveral quarters, there was an increase in local sales by domestic manufacturers, with the food, beverages & tobacco sector accounting for around a half of the gain.
The labour market
Continued buoyancy in the labour marketLabourmarketconditionsremainedbuoyantduringthefirstquarterof2008,withestimatesbasedon national accounts showing a 4.5% increase in the number of employed persons compared with the same period last year.1 This represented the strongest rate of employment growth among 1 Eurostat, Euro Indicators News Release, 83/2008.
MANUFACTURINg sALEsAnnual changes, EUR millions
2008Q1 Q2 Q3 Q4 Q1
Total sales 23.9 3.� -18.4 -5�.� -41.�Exports 34.� 17.9 0.9 -53.9 -53.2
Radio, TV & communication equipment -5.8 4.8 -22.1 -52.9 -43.3Pharmaceuticals 7.6 5.5 18.5 13.1 19.7Electrical machinery & apparatus 13.1 2.9 10.5 3.2 -15.6Clothing, textiles & leather -1.6 -2.3 -6.3 -4.1 -8.4Games & Toys 5.4 3.2 1.0 -4.7 -5.9Printing & publishing 11.9 3.8 -3.3 0.6 4.3Chemicals 2.3 1.6 1.9 1.9 -3.1Other transport equipment 0.2 -1.5 0.8 -2.0 -2.2Food & beverages 0.3 -2.1 -0.5 -5.4 -0.6Other 1.2 2.0 0.4 -3.6 1.9
Local sales -10.7 -14.3 -19.3 -2.� 11.7Food, beverages & tobacco -11.2 -15.7 -17.0 -5.7 5.4Machinery and equipment -0.1 1.2 -0.1 -0.5 2.4Fabricated metal products -0.4 1.7 0.9 2.1 2.1Printing & publishing 1.4 1.6 0.5 1.5 1.0Other -0.4 -3.1 -3.6 0.0 0.8
Source: NSO.
2007
Table 4.3
CENTRAL BANK OF MALTA Quarterly Review 2008:2
21
the countries of the euro area and the second fastest in the EU.
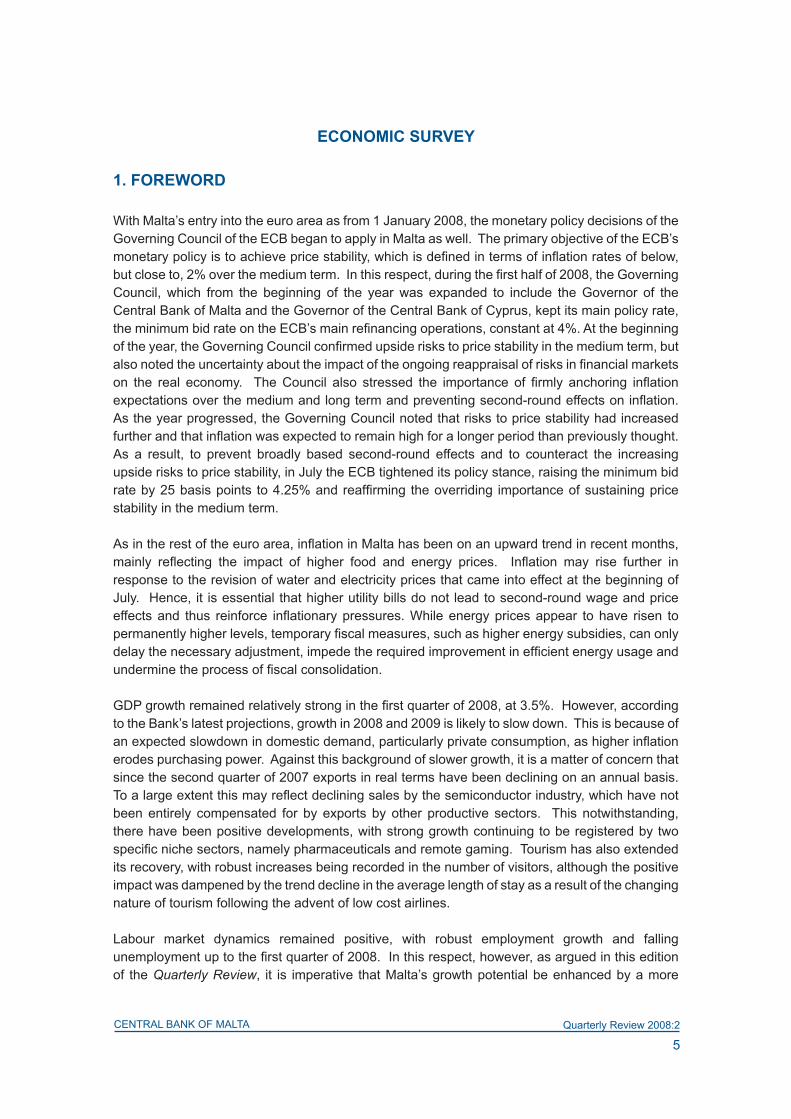
Labour Force Survey2 Meanwhile, the LFS reported an increase of 3.0% in total employment during the quarter. This was coupled with a 1.7% rise in the labour supply (see Table 4.4).
AccordingtotheLFStheriseinemploymentwasmainlyreflectedinfull-timejobs,whichwereupbyasignificant3,067fromayearago,althoughthenumberofthoseinpart-timeemploymentandof full-time employees on reduced hours also increased. The private sector accounted for 84.0% of total employment growth, while in terms of the sectoral distribution, the other community, social & personal services category registered the largest increase, contributing half of the total.
At 54.7%, the employment rate was 0.8 percentage points higher than a year earlier, mainly on account of increased female employment.3 Meanwhile the activity rate remained stable, as an increase of 1.8 percentage points in the activity rate for women, to 38.8%, was accompanied by a 1.6 point decline in the male ratio to 77.0%. The average salary increased by 3.0% over the previous year, mainly on account of higher pay in the other community, social & personal services sector. 2 For the purposes of this section, the cut-off date was extended to 18 July 2008.3 The employment rate and the activity rate represent the number of employed and the labour force, respectively, as a share of the population aged between 15 and 64 years.
Table 4.4
Persons, annual percentage changes
2008 Change %
Q1 Q2 Q3 Q4 Q1 Q1 2008Labour supply 1�5,151 1��,�53 1�7,278 1��,159 1�7,914 1.7Unemployed 11,995 11,073 10,348 10,291 10,137 -15.5Employed 153,156 155,580 156,930 155,868 157,777 3.0By type of employment: Full-time 137,421 138,391 138,304 138,520 140,488 2.2
Full-time with reduced hours 2,217 2,593 2,723 2,654 3,178 43.3 Part-time 13,518 14,596 15,903 14,694 14,111 4.4By economic sector: Private 106,715 109,467 110,266 110,196 110,596 3.6 Public 46,441 46,113 46,664 45,672 47,181 1.6
Activity rate (%) 58.1 59.� 59.9 59.4 58.2 Male 78.6 78.8 78.8 77.9 77.0 Female 37.0 40.3 40.6 40.5 38.8
Employment rate (%) 53.9 55.7 5�.1 55.7 54.7 Male 72.9 74.3 74.5 73.4 72.8 Female 34.2 36.8 37.5 37.7 36.0
Unemployment rate (%) 7.3 �.� �.2 �.2 �.0 Male 7.2 5.6 5.5 5.8 5.4 Female 7.6 8.7 7.6 7.0 7.2
Average annual gross salary (annual growth rate, %) 3.4 2.1 0.� 3.1 3.0Source: NSO.
LABoUR MARKET INdICAToRs BAsEd oN ThE LFs
2007

CENTRAL BANK OF MALTA Quarterly Review 2008:2
22
Box 2: BUsINEss ANd CoNsUMER sURVEYs
second quarter improvement in services and construction1
The Bank’s survey of service andconstructionfirmsrevealeda pick-up in second quarter performance, with almost half of respondents quoting higher turnoverthaninthefirstquarter(see Chart 1). Cost pressures, however, became more evident during the second quarter and were reflected inhigher sellingprices. Still, a greater share of respondents reported higher profits than in the first quarter.Moreover, firms continuedto report additions to their labour complement in line with observed trends in the labour market.
Despite escalating costs, surveyed firms remained optimistic, anticipating higher sales andprofitsandanexpansionintheirworkforceduringthethirdquarter.Forthenextyear,moreover,participants anticipated higher investment outlays and an expansion in employment.
EC survey: industry optimism peaks in MarchAccordingtotheEuropeanCommission’ssurveyofMalteseindustry,confidencepeakedinMarch2008, when the seasonally-adjusted index reached 18 from 4 in December 2007 (see Chart 2). This optimism reflected arundown in stocks of finishedgoods, coupled with improved production expectations for the next three months. At the same time, order books remained virtually stable.
More recent data, however, revealed a reversal in sentiment. Indeed, for the first time sinceJune 2007, the indicator dropped into negative territory in May, having declined by a total of 22 points through April and May. (see Chart 2). This downturn mainly reflected reduced order
1 Fieldwork for this survey was carried out between 13 May and 23 June, 2008.
-15
-10
-5
0
5
10
15
20
25
30
35
40
45
50
55
60
Turnover Costs Selling prices Profits Employment
2007 Q2 2007 Q3 2007 Q4 2008 Q1 2008 Q2 2008 Q3 (F)
Chart 1KEY BUsINEss PERCEPTIoNs sURVEY REsULTs(balance of replies in percentage points)
Source: Central Bank of Malta
-30
-25
-20
-15
-10
-5
0
5
10
15
20
J 2004
M M J S N J 2005
M M J S N J 2006
M M J S N J 2007
M M J S N J 2008
M M
Chart 2INdUsTRIAL CoNFIdENCE INdICAToR(seasonally adjusted, percentage points)
Source: European Commission.

CENTRAL BANK OF MALTA Quarterly Review 2008:2
23
books and less optimistic production expectations for the next three months. On the upside, most firmscontinuedtorundowntheirstockoffinishedgoods.
An analysis by main industrial groupings indicates that weaker sentiment among producers of consumer goods was related to lower order books and a deterioration in production expectations, particularly in May. Similar trends were observed among makers of investment goods, although these also reported lower stock levels. In the intermediate goods sector, moreover, particularly amongfirmsproducingchemicalsandrubber&plastics,orderbooksdeclinedwithrespondentsreportingafurtheraccumulationofstocksoffinishedgoods.Inaddition,productionexpectationsfor the following three months turned negative.
Consumer confidence improves in the first quarter but dips in April and MayThe European Commission’s indicator of consumer sentiment revealed continued improvement during the first quarter,when the seasonally-adjusted index added6 percentage points to itsDecember 2007 level. This surge reflected renewed optimism with regard to the country’sgeneral economic performance, particularly labour market developments, which in turn boosted consumers’outlookregardingtheirownfinancialsituationoverthenexttwelvemonths. Here too,however,more recentdatashowed thatconfidencehaddippedsharply inAprilandMay, halting the steady build-up of consumer optimism recorded since March 2007. Indeed, the seasonally-adjusted indicator slid to -18 in May from -3 in March 2008 (see Chart 3). This survey was carried out against the backdrop of prevailing economic uncertainty abroad and rising oil and food prices. Survey replies indicate that the loss of confidence reflectedconcern about the general economy, particularly the labour market. Consumers were also wary about their own financialsituation and their ability to save in the following twelve months.
-40
-35
-30
-25
-20
-15
-10
-5
0
J 2004
M M J S N J 2005
M M J S N J 2006
M M J S N J 2007
M M J S N J 2008
M M
Chart 3CoNsUMER CoNFIdENCE INdICAToR(seasonally adjusted, percentage points)
Source: European Commission.

CENTRAL BANK OF MALTA Quarterly Review 2008:2
24
Administrative recordsFurther evidence of buoyancy in the labour market during the quarter under review emerges from the administrative records maintained by the ETC, which in February showed an annual growth rate of 2.2% in the full-time gainfully occupied population (see Chart 4.2 and Table 4.5). The ETC records also indicated further gains in the number of part-time positions, which were up by 6.1% on a year earlier.
Employment in the private sector grewby3.3%inthefirstquarter.Theservicessector-particularlytheotherbusinessactivitiesand the recreational, cultural & sporting activities sub sectors - continued to show buoyant growth, while there was further shrinkage in direct production, particularly in the wearing apparel sub-sector, and in the public sector.
Further decline in the number of unemployed personsThe jobless rate for the March quarter based on the LFS methodology dipped to 6.0%, the lowest rate since the inception of the survey in 2000. Meanwhile, the ETC’s measure of unemployment
136,000
138,000
140,000
142,000
144,000
146,000
148,000
150,000
152,000
J 2006
M M J S N J 2007
M M J S N J 2008
3.8
4.0
4.2
4.4
4.6
4.8
5.0
5.2
5.4
Labour force Gainfully occupied Unemployment rate (right scale)Source: NSO.
Chart 4.2LABoUR MARKET TRENds BAsEd oN AdMINIsTRATIVE RECoRds(persons, percent)
Table 4.5
Persons, annual percentage changes
2008 Change %
Feb. June Sep. Dec. Feb. Feb. 2008Labour supply 147,571 14�,470 149,050 149,008 149,7�5 1.5
Gainfully occupied (2) 140,384 140,133 142,421 142,836 143,423 2.2Registered unemployed 7,187 6,337 6,629 6,172 6,342 -11.8Unemployment rate (%) 4.9 4.3 4.4 4.1 4.2
Private sector 97,298 97,191 99,99� 100,145 100,544 3.3 Direct production 33,190 32,993 32,656 32,397 32,466 -2.2 Market services 64,108 64,198 67,340 67,748 68,078 6.2Public sector 42,�34 42,49� 42,002 41,992 42,09� -1.3Temporary employment 452 44� 423 �99 783 73.2
Part-time jobs 43,744 4�,304 4�,979 4�,9�� 4�,408 �.1 Primary 24,199 26,188 26,346 26,070 25,916 7.1
Secondary (3) 19,545 20,116 20,633 20,896 20,492 4.8
(2) This category measures full-time employment.(3) This category includes employees holding both a full-time job and a part-time job.Source: NSO.
LABoUR MARKET INdICAToRs BAsEd oN AdMINIsTRATIVE RECoRds (1)
(1) Figures for March 2008 were not available at time of writing.
2007

CENTRAL BANK OF MALTA Quarterly Review 2008:2
25
reached 4.2% in February 2008, 0.7 percentage points below the year-ago rate. In addition, recent ETC data revealed a further decline in the number of persons on the unemployment register, which in May fell to 6,018, the lowest level in over a decade (see Chart 4.3). In seasonally-adjusted terms the unemployment rate stood at 5.8% in May 2008, marginally higher than in the previous month but considerably below the 6.5% recorded in the same month of 2007.4
Prices
HICP inflation continues to rise Inflation,measuredintermsoftheannualpercentagechangeintheharmonisedindexofconsumerprices (HICP), accelerated from 3.1% in December 2007 to 4.3% in March 2008. Over the same period Malta’s twelve-month moving average rate rose from 0.7% to 1.5% (see Chart 4.4).
In line with the pattern in evidence through most of 2007, the main factor behind the acceleration wasthepersistentriseinthepricesoffooditems,specificallythoseofbread&cereals,fruitandvegetables, which contributed 1.7 percentage points to the rise in the index. The services component added 1.6 points, mainly because of higher hotel and restaurant prices. Smaller contributions came from non-energy industrial goods, which include clothing & footwear, and from the energy component. These two categories contributed 0.6 and 0.5 percentage points, respectively (see Chart 4.5).
Meanwhile, in the euro area, the annual HICP inflationrate increased from 3.1% in December to 3.6% in March. The components with the largest impact on headline inflation were the energy andthe services sub-indices, both contributing 1.1 percentage points. The main reason for the
4 Eurostat, Euro Indicators News Release, 94/2008. Seasonal adjustment corrects the data for seasonal regularities and permits a wider range of inter-period comparisons.
5,500
6,000
6,500
7,000
7,500
8,000
J 2006
M M J S N J 2007
M M J S N J 2008
M M
Chart 4.3REgIsTEREd UNEMPLoYEd(persons)
Source: NSO.
-1.5
-1.0
-0.5
0.0
0.5
1.0
1.5
2.0
2.5
3.0
3.5
4.0
4.5
J 2006
M M J S N J 2007
M M J S N J 2008
M M
Malta annual change Euro area annual change Malta 12-month moving average
Chart 4.4hICP INFLATIoN RATEs(annual percentage changes, annual average percentage changes)
Source: Eurostat.

CENTRAL BANK OF MALTA Quarterly Review 2008:2
26
higherrateofinflationinMalta,compared with the euro area, was the faster domestic growth in prices of unprocessed food and services.
More recent data show that the gap between Malta and the euro area narrowed in May. Malta’s inflation eased to 4.1%, withfood and services remaining the key factors, while the equivalent inflation rate for the euro areaedged up to 3.7%.
Retail Price Index follows a similar pattern DevelopmentsintheRPIduringthefirstquarterof2008generallyparalleledthoseintheHICP,though differences emerge from the exclusion of hotel accommodation from the RPI. At 3.9%, theannualRPIinflationrateinMarchwas0.6percentagepointshigherthanattheendof2007.Moreover, the twelve-monthmovingaveragerateof inflationedgedup to1.9%inMarch from1.3% in December.
The acceleration in RPI inflation wasmainly driven by higher food prices, which contributed2.2 percentage points to the rise in the index, while the clothing & footwear and the transport & communication categories were each responsible for another 0.4 percentage points. (see Table 4.6)
Meanwhile,coreinflation,theCentralBankofMalta’smeasureofinflationpersistence,alsorosemarginally during the quarter, edging up to 1.3% in March from 1.2% at end-2007.
Chart 4.5CoNTRIBUTIoNs To YEAR-oN-YEAR hICP INFLATIoN(percentage points)
-1.5
-1.0
-0.5
0.0
0.5
1.0
1.5
2.0
2.5
3.0
3.5
4.0
4.5
5.0
J2006
M M J S N J2007
M M J S N J2008
M
Energy Non-energy industrial goodsProcessed food including alcohol and tobacco Unprocessed foodServices (overall index excluding goods) All-items HICP
Source: Eurostat.
Table 4.�CoNTRIBUTIoN To YEAR-oN-YEAR RPI INFLATIoNPercentage points
2008Jan. Feb. Mar. Q2 Q3 Q4 Q1
Food 1.8 2.1 2.2 0.4 1.3 1.8 2.0Beverages & tobacco 0.2 0.2 0.2 0.1 0.1 0.2 0.2Clothing & footwear 0.5 0.5 0.4 -0.3 0.0 0.6 0.5Housing 0.3 0.3 0.3 0.2 0.2 0.2 0.3Water, electricity, gas & fuels 0.0 0.0 0.1 -0.4 -0.3 -0.2 0.0Household equipment & house maintenance costs 0.0 0.0 0.0 0.0 0.1 0.0 0.0Transport & communications 0.5 0.4 0.4 -0.5 -0.4 0.1 0.4Personal care & health 0.2 0.1 0.1 0.1 0.1 0.1 0.1Recreation & culture 0.1 0.1 0.1 0.1 0.1 0.1 0.1Other goods & services 0.1 0.1 0.1 0.0 0.0 0.0 0.1RPI (annual percentage change) 3.5 3.7 3.9 -0.2 1.3 3.0 3.7Sources: NSO; Central Bank of Malta.
2008 2007

CENTRAL BANK OF MALTA Quarterly Review 2008:2
27
Box 3: REsIdENTIAL PRoPERTY PRICEs
decline in residential property prices The gradually decelerating trend in house prices observed in recent years turned negative in the first quarter of the year,even though the prices of some property categories were higher. House price movements as measured by the Bank’s residential property index showed a year-on-year contraction of 0.7% in the firstthree months of the year (see Chart 1).
The survey period was also marked by a reduction in the number of advertised listings, coinciding with the wait-and-see attitude that usually prevails ahead of a general election. Indeed, the number of listings was downfromayearago,mainly in thefinishedflatsandfinishedmaisonettescategories,whichmake up approximately 60% of sampled properties. These categories registered price drops of 4.5% and 3.4%, respectively.
Nevertheless,advertisedpricesincreasedforflatsinshellform,housesofcharacterandterracedhouses, albeit at a slower pace than in the same period last year. There was also an acceleration in asked prices across the remaining property types, namely maisonettes in shell form, town houses and villas. Indeed, after having exhibited declining growth rates since the fourth quarter of 2006,pricesformaisonettesinshellformwentupby15.8%inthefirstquarterof2008.
AdifferentpictureemergesfromofficialhousepricedatapublishedbytheNSO.Thesesuggestcontinued growth in residential property values, although at a decelerating pace. The NSO’s property price index showed a fall in the growth rate from 8.3% in the last quarter of 2007 to 6.8%inthefirstquarterof2008.UnliketheBank’sindex,whichisbasedonpricesadvertisedbysellers, the NSO’s measure is calculated from transacted prices for a narrower range of housing categories.1
1 The residential property price index published every year by the NSO is compiled on a monthly basis using prices indicated in contracts of sale as registered at the Inland Revenue Department. The number of observations ranges from 450 to 600 per month. The index differentiates between three types of dwellings (flats,maisonettes and terraced houses) and between six regions (southern harbour,northern harbour, south eastern, western, northern and Gozo). Indices of median prices for each house type are derived using the Laspeyres method. The overall index is derived using the mix-adjustment method. This uses expenditure weights for geographic aggregation and the number of properties transacted as weights in the aggregation of the various property types.
The Bank’s property price index is derived from advertised real estate prices, using observations collected on a monthly basis, usually numberinginexcessof2,000.Theindexisdividedintoeightcategories:finishedandunfinishedflats,finishedandunfinishedmaisonettes,terraced houses, town houses, houses of character and villas. The index is Fischer chained, which is the geometric mean of the chained Laspeyres and chained Paasche indices.
-5
0
5
10
15
20
25
30
35
40
Q1 2004
Q2 Q3 Q4 Q1 2005
Q2 Q3 Q4 Q1 2006
Q2 Q3 Q4 Q1 2007
Q2 Q3 Q4 Q1 2008
Chart 1REsIdENTIAL PRoPERTY PRICEs (annual percentage changes)
Source: Central Bank of Malta.
CENTRAL BANK OF MALTA Quarterly Review 2008:2
28
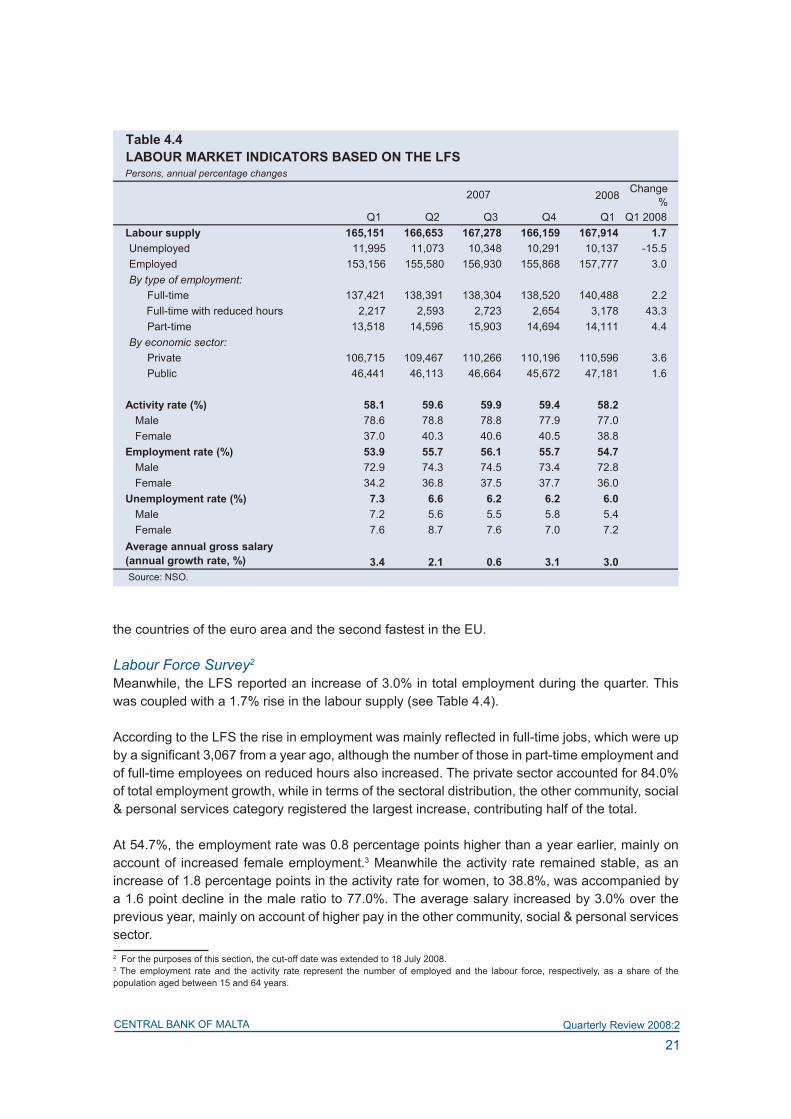
Producer prices decline Prices received by domestic manufacturers for their output were 2.7% lower in March than a year earlier. This constituted the thirteenth consecutive monthly decline in producer prices, measured on an annual basis. Reflecting in part thehigher costs of imported inputs, producer prices charged on output sold in the local market increased by 5.2%. On the other hand, the intensity of competition in foreign markets is reflected in a 12.7%drop inthe prices of exported products. The decline was sharpest for consumer-durable items exported to the euro area.
Cost and competitivenessOn account of its high degree of openness, the Maltese economy is particularly exposed to international competition. Key indicators for 2008 suggest some deterioration in Malta’s international competitiveness, despite an improved standing vis-à-vis the rest of the euro area.
Unit labour costs rise moderatelyUnitlabourcosts(ULC)arethecostofemployedlabourperunitofoutput,or,morespecifically,the ratio of total nominal compensation per employee to labour productivity, with the latter being definedasGDPatconstantpricesperperson inemployment.An increase inULC,relative toother countries, implies a decrease in competitiveness, and vice-versa.
Measuredona four-quartermovingsumbasis, labourproductivity inMalta in thefirstquarterof 2008 was 1.1% higher than its year-ago level. Since this was a smaller increase than the reported 1.7% rise in compensation per employee over the same period, Malta’s ULC increased by 0.4% (see Charts 4.6 and 4.7). By comparison, ULC in the euro area as a whole rose by 1.7%.
Labour productivity has followed a generally upward path since 2003, for a total increase of 6.5% over the period, in the wake of a more erratic but a broadly declining pattern in the previous
95
98
100
103
105
108
110
113
Q4 2003
Q1 2004
Q2 Q3 Q4 Q1 2005
Q2 Q3 Q4 Q1 2006
Q2 Q3 Q4 Q1 2007
Q2 Q3 Q4 Q1 2008
Compensation per employee Labour productivity
Chart 4.� CoMPENsATIoN ANd PRodUCTIVITY(four-quarter moving sum indices, 2003 Q4=100)
Source: ECB.
98
100
102
104
106
Q4 2003
Q1 2004
Q2 Q3 Q4 Q1 2005
Q2 Q3 Q4 Q1 2006
Q2 Q3 Q4 Q1 2007
Q2 Q3 Q4 Q1 2008
Malta Euro area
Chart 4.7UNIT LABoUR CosTs(four-quarter moving sum indices, 2003 Q4=100)
Source: ECB.

CENTRAL BANK OF MALTA Quarterly Review 2008:2
29
two years. Meanwhile, per-employee compensation grew at a faster rate than productivity. In fact, compensation has followed a steady upward path over the decade, rising by 10.3% since 2003. The excess of compensation over productivity growth raised unit labour costs by 3.2%. Over the same period, ULC in the euro area increased by 5.1%, a faster rate than in Malta, leading to an improvement in Malta’s competitive standing in the euro area.
Harmonised Competitiveness Indicator Another measure of multilateral competitiveness is the harmonised competitiveness indicator (HCI), which tracks price level and exchange rate changes vis-à-vis trading partners, weighted by relative trade in manufactured goods, to derive a measure of international competitiveness. It does not attempt to measure competitiveness in the growing services sector. Bearing this caveat in mind, a higher score indicates a deterioration in a country’s international competitiveness, while a lower score indicates an improvement.
Following Malta’s adoption of the 100% peg of the lira against the euro in May 2005 and its subsequent entry into the euro area in January 2008, the exchange rate no longer plays a direct role in determining Malta’s competitiveness relative to the other members of the euro area. However, exchange rate changes vis-à-vis trading partner countries outside the euro area have animpactonMalta’sHCI.Sodorelativeinflationratesvis-à-vistradingpartnersbothwithinandoutside the euro area.
As indicated by the rising HCI in Chart 4.8, Malta’s competitiveness declined by 5.9% during the twelve months to March 2008. Despite a small improvement over the subsequent two months, this indicator was still 5.3% higher in May 2008 than it was a year earlier. This slippage has fallen short of the 6.8% decline in the euro area’s similarly measured competitiveness during the same period.
Similarly, over the longer time span displayed in Chart 4.8, Malta’s competitiveness was broadly unchanged from around mid-2006 through mid-2007, but declined thereafter. In comparison, slippage in the euro area’s competitiveness has exceeded Malta’s since late 2006.
The balance of paymentsDuring thefirstquarterof2008 thedeficiton thecurrentaccountof thebalanceofpaymentsnarrowedcomparedwiththesameperiodayearearlier.Lowernetinvestmentincomeoutflowsandhighernetinwardtransfersaccountedforthisdevelopment.Atthesametime,netoutflowswererecordedonthecapitalandfinancialaccount.5 5Anoteofcautionininterpretingdataforthefirstquarterof2008iswarrantedgiventhesizeablepositiveerrorsandomissionsreported.Theseimplyanoverestimationofthecurrentaccountdeficitand/oranunderestimationofnetinflowsonthecapitalandfinancialaccount.
92
94
96
98
100
102
104
106
108
110
J 2003
M M J S N J 2004
M M J S N J 2005
M M J S N J 2006
M M J S N J 2007
M M J S N J 2008
M M
Malta Euro area
Chart 4.8hARMoNIsEd CoMPETITIVENEss INdICAToRs(May 2005 = 100)
Source: ECB.
CENTRAL BANK OF MALTA Quarterly Review 2008:2
30
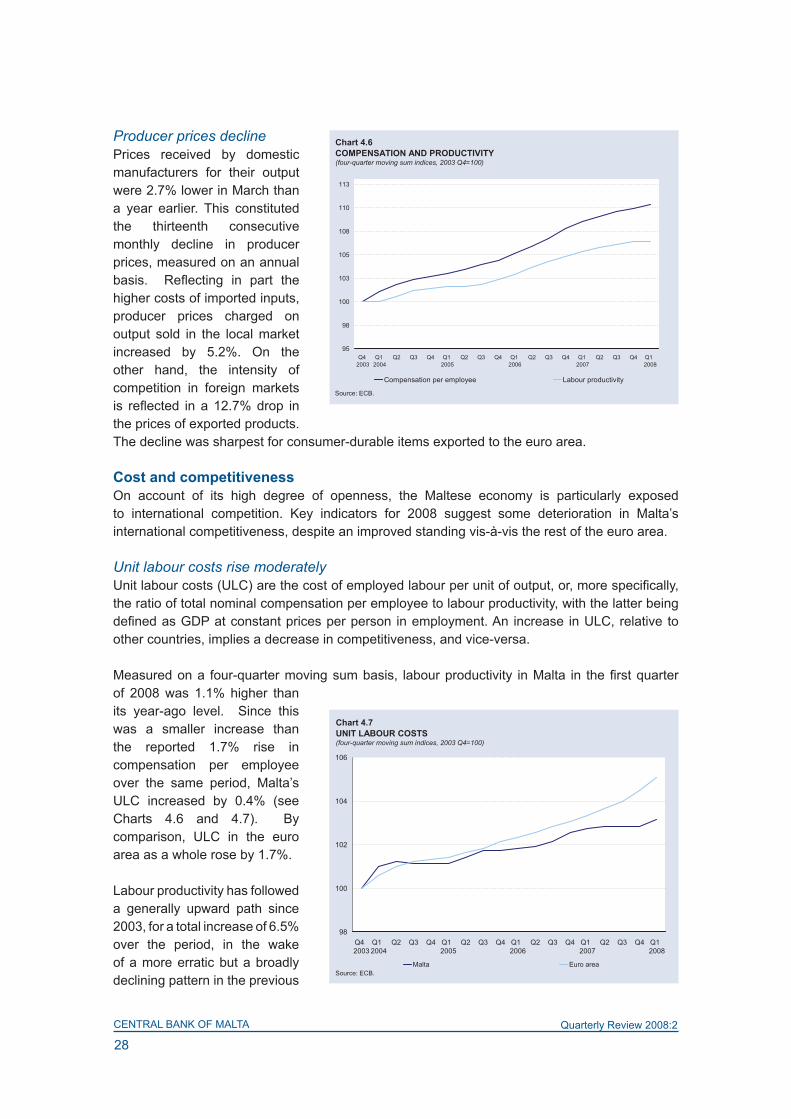
FollowingMalta’sadoptionoftheeuroon1January2008,Malta’sexternalreserveswereredefined.Assets that represent claims on other euro area residents, as well as assets denominated in euro, are no longer considered to form part of the reserves. Instead, depending on the nature of the instrument, such assets are now included with portfolio investment or other investment. In addition, a fraction of the Bank’s reserve assets was transferred to the ECB in exchange for a claimontheECB.Forthesereasons,markedchangeswererecordedinallfinancialaccountsub-components with the exception of direct investment. As a result, data related to these components forthefirstquarterof2008cannotbecomparedwiththoseforearlierperiods.
The current account deficit narrowsDuring the first three monthsof 2008, the shortfall on the current account narrowed by almost EUR 9 million to EUR 68.6 million (see Table 4.7). This mainly reflected a sharpcontraction in the negative balance on the income account and a significant surplus onthe transfers component that outweighed a substantial widening of the merchandise trade deficit. On a cumulativebasis, the current account deficit narrowed slightly duringthe four quarters to March 2008 (see Chart 4.9).
Table 4.7BALANCE oF PAYMENTsEUR millions
2007 2008 2008Q1 Q1 Q2 Q3 Q4 Q1
Current account -77.5 -�8.� -198.7 -172.0 -292.3 -283.4 Goods -183.1 -248.6 -801.2 -816.7 -937.1 -1002.6 Services 170.0 145.8 799.7 827.9 836.5 812.3 Income -56.2 -6.5 -150.6 -144.2 -129.5 -79.7 Current transfers -8.0 40.6 -46.6 -39.0 -62.1 -13.5Capital and financial account 1��.0 -13.0 349.� 338.7 157.0 -22.1 Capital account 3.9 3.3 100.1 95.9 49.3 48.7Financial account (1) 1�2.1 -1�.3 249.4 242.8 107.7 -70.8 Direct investment 149.4 41.7 763.3 885.7 684.4 576.7 Portfolio investment -133.0 -13.0 -537.7 -100.7 365.9 485.9 Financial derivatives 5.4 -127.2 22.4 80.1 120.2 -12.4 Other investment -2.9 151.6 -172.0 -813.4 -736.4 -581.9 Movements in reserves 143.3 -69.4 173.5 191.2 -326.5 -539.2Errors and omissions -88.� 81.7 -150.9 -1��.7 135.3 305.�
Sources: NSO; Central Bank of Malta.
four-quarter moving sum
(1) Data on the components of the financial account for 2008 are not comparable with those for 2007 due to the reclassification of reserve assets on 1 January 2008.
2007
Chart 4.9CURRENT ACCoUNT(four-quarter moving sum, EUR millions)
-550
-450
-350
-250
-150
-50
Q1 2005
Q2 Q3 Q4 Q1 2006
Q2 Q3 Q4 Q1 2007
Q2 Q3 Q4 Q12008
Source: NSO
CENTRAL BANK OF MALTA Quarterly Review 2008:2
31
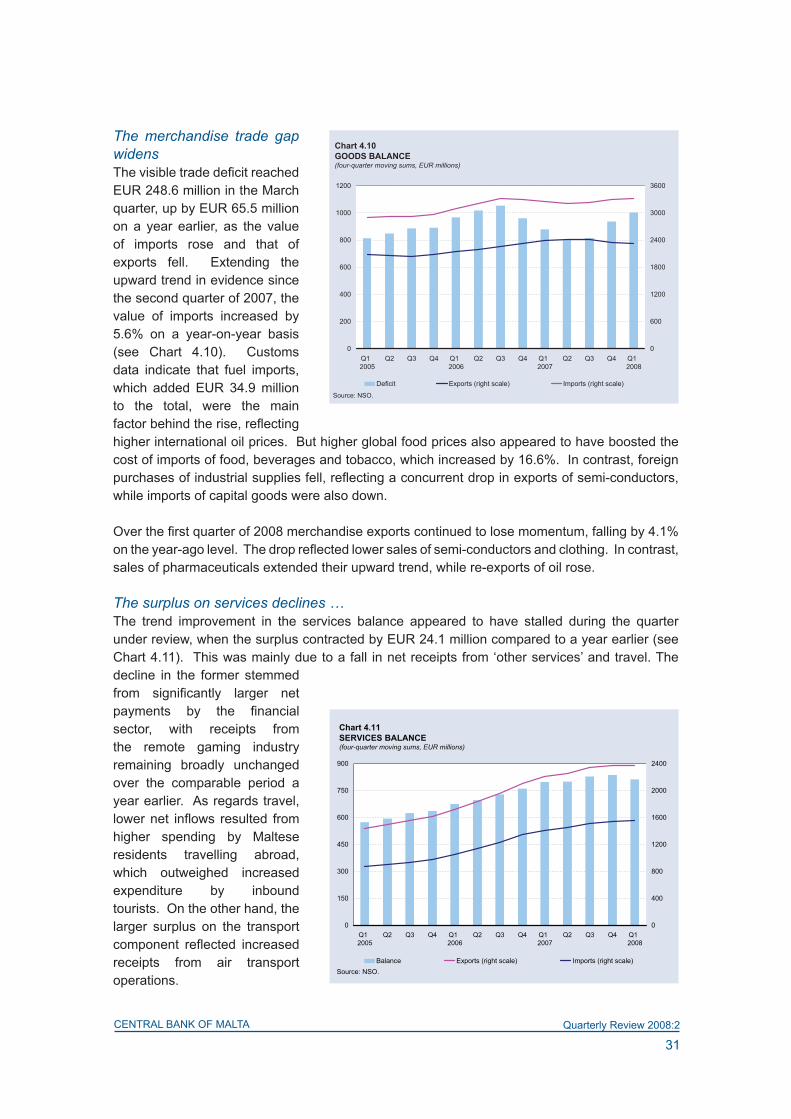
The merchandise trade gap widensThevisibletradedeficitreachedEUR 248.6 million in the March quarter, up by EUR 65.5 million on a year earlier, as the value of imports rose and that of exports fell. Extending the upward trend in evidence since the second quarter of 2007, the value of imports increased by 5.6% on a year-on-year basis (see Chart 4.10). Customs data indicate that fuel imports, which added EUR 34.9 million to the total, were the main factorbehindtherise,reflectinghigher international oil prices. But higher global food prices also appeared to have boosted the cost of imports of food, beverages and tobacco, which increased by 16.6%. In contrast, foreign purchasesofindustrialsuppliesfell,reflectingaconcurrentdropinexportsofsemi-conductors,while imports of capital goods were also down.
Overthefirstquarterof2008merchandiseexportscontinuedtolosemomentum,fallingby4.1%ontheyear-agolevel.Thedropreflectedlowersalesofsemi-conductorsandclothing.Incontrast,sales of pharmaceuticals extended their upward trend, while re-exports of oil rose.
The surplus on services declines … The trend improvement in the services balance appeared to have stalled during the quarter under review, when the surplus contracted by EUR 24.1 million compared to a year earlier (see Chart 4.11). This was mainly due to a fall in net receipts from ‘other services’ and travel. The decline in the former stemmed from significantly larger netpayments by the financialsector, with receipts from the remote gaming industry remaining broadly unchanged over the comparable period a year earlier. As regards travel, lowernet inflows resulted fromhigher spending by Maltese residents travelling abroad, which outweighed increased expenditure by inbound tourists. On the other hand, the larger surplus on the transport component reflected increasedreceipts from air transport operations.
Chart 4.10goods BALANCE (four-quarter moving sums, EUR millions)
0
200
400
600
800
1000
1200
Q1 2005
Q2 Q3 Q4 Q1 2006
Q2 Q3 Q4 Q1 2007
Q2 Q3 Q4 Q1 2008
0
600
1200
1800
2400
3000
3600
Deficit Exports (right scale) Imports (right scale)
Source: NSO.
Chart 4.11sERVICEs BALANCE(four-quarter moving sums, EUR millions)
0
150
300
450
600
750
900
Q1 2005
Q2 Q3 Q4 Q1 2006
Q2 Q3 Q4 Q1 2007
Q2 Q3 Q4 Q1 2008
0
400
800
1200
1600
2000
2400
Balance Exports (right scale) Imports (right scale)Source: NSO.

CENTRAL BANK OF MALTA Quarterly Review 2008:2
32
… but the balance on income and transfers improvesMeanwhile, netoutflowson the incomeaccountweresharply lower comparedwith thesamequarterof2007.Thisreflectedafallinprofitsduetonon-residentdirectinvestorsinMaltaandadrop in interest payments on the other investment account. At the same time, lower receipts on residents’ portfolio investments abroad, mainly bonds and notes, were recorded.
The transfers component swung to a positive balance of EUR 40.6 million, with the increase stemming from higher payments to government by companies engaged in international business.
The capital and financial account registers outflowsAsexplainedearlier,theredefinitionofreserveassetsatthebeginningoftheyearprecludesayear-on-yearcomparisonoffigureswithincertainitemsofthefinancialaccount,morespecificallythe portfolio investment, financial derivatives and other investment components. The capitalaccountwasnotaffectedbythereclassification.
ThecapitalandfinancialaccountpostednetoutflowsofEUR13.0millionduringthefirstquarterof2008(seeTable4.7).Theseweredrivenbydevelopmentsonthefinancialaccount,assmallnetinflowswererecordedonthecapitalaccount.Overall,netoutflowsofEUR16.3millionwererecordedonthefinancialaccount.
The surplus on direct investment amounted to EUR 41.7 million, or EUR 107.7 million less than the amount recorded during the same period in 2007, as a result of a large outward investment by the telecommunications sector and a drop in direct investment by non-residents in Malta. It shouldbepointedout,however, that in thefirstquarterof2007 inwarddirect investmentwasunusuallyhigh,partlyonaccountoflargeequityinflowsintothebankingsector. Duringthefirstquarterof2008,netinflowsofEUR138.6millionwererecordedonthecombinedportfolio investment and other investment accounts. These mirrored a rise in other investment liabilities, consisting mainly of new long-term loans taken out by the banking sector and a rise in deposits by non-residents. In contrast, considerable outflows were reported on financialderivatives, which mostly reflected transactions reported by the banking sector. Meanwhile,reserve assets increased by EUR 69.4 million.
Government finance�
General government deficit widens in the first quarter�
Thegeneralgovernmentbalanceregisteredadeficit intheMarchquarterof2008, in linewiththe usual seasonal pattern, with expenditure exceeding revenue by EUR 162.5 million (see Table 4.8). The shortfall was EUR 54.4 million larger than that recorded during the same quarter a year earlier, as expenditure grew at a faster pace than revenue. Spending expanded across all major categories,exceptforinterestpayments.Thisresultedinawideningoftheprimarydeficit,whichis obtained by deducting interest payments from expenditure, by EUR 66.4 million to EUR 120.6 million.
6Thecut-offdateforinformationongovernmentfinanceis11July2008.7 General government captures both central government, including extra-budgetary units, and local government. General government data are compiled on an accrual basis. In contrast, the Consolidated Fund data capture most of the transactions of central government on a cash basis.

CENTRAL BANK OF MALTA Quarterly Review 2008:2
33
Duringthefirstthreemonthsof2008,generalgovernmentrevenueroseby8.7%comparedtoa year earlier, fuelled mainly by tax receipts. Taxes on income and wealth, in particular, yielded 31.6%morethaninthecorrespondingperiodof2007,largelyreflectingincreasedintakesfromcorporate taxes. ‘Other’ revenue increased by 20.3% on account of increased dividend income and higher market output generated by extra-budgetary units. In contrast, receipts from taxes on production and imports declined marginally, due to lower yields from petroleum duties, while income from capital and current transfers also contracted as a result of a lower amount of grants received from the EU.
Expenditure grew rapidly, rising by 16.9% on a year earlier, with intermediate consumption increasing by almost half over the quarter and accounting for one-third of the overall rise. The latterwasmainlydrivenbysignificantaccrualadjustments,outlaysbyextra-budgetaryunitsandoperationalexpenditure.Meanwhile,spendingonsocialbenefitswentupby15.2%,reflectinghigher outlays on retirement and widows’ pensions and children’s allowances, the latter following the introduction of a measure amended in the 2008 budget.8 Growth in compensation of employees alsopickedup,partlyreflectingarevisionofwagesunderacollectiveagreementcoveringthehealth sector which came into force at the beginning of the year. Expenditure on subsidies rose sharply,onaccountofhigheroutlayspaidtofirmsintheagriculture, foodandenergysectors.Similarly, ‘other’expenditure increasedsignificantly,partly reflectinghighercapital transfers toMalta Enterprise. In contrast, interest payments fell sharply on an accrual basis.
Consolidated Fund deficit widensDevelopments in general government finances mirrored those recorded in the Consolidated8 In the Budget for 2008, the Government announced that the children’s allowance was to be extended to all children, while the allowance forthesecondchildandsubsequentchildrenwastobedoubledtoequalthatforthefirstchild.
Table 4.8gENERAL goVERNMENT BALANCEEUR millions
2008
Q1 Q2 Q3 Q4 Q1 Amount %Revenue 444.8 515.3 523.3 708.� 483.3 38.5 8.7Taxes on production and imports 182.0 191.4 197.5 222.2 179.3 -2.7 -1.5Current taxes on income and wealth 98.6 166.9 167.9 284.0 129.7 31.1 31.6Social contributions 87.3 101.0 91.7 120.5 87.7 0.3 0.4Capital and current transfers 10.1 16.2 29.1 37.3 6.3 -3.8 -37.9Other 66.8 39.8 37.0 44.6 80.4 13.6 20.3Expenditure 552.7 557.5 551.3 �2�.3 �45.8 93.2 1�.9Intermediate consumption 61.9 69.1 68.1 103.5 92.1 30.1 48.7Gross fixed capital formation 51.5 70.2 43.6 49.4 54.0 2.5 4.8Compensation of employees 172.4 176.4 178.2 176.0 190.9 18.5 10.7Subsidies 21.1 24.0 26.4 37.7 32.3 11.3 53.4Interest 53.9 33.0 43.2 52.0 41.9 -12.1 -22.4Social benefits 159.0 177.0 158.1 172.7 183.1 24.2 15.2Other 32.9 8.0 33.6 35.0 51.6 18.7 56.7Primary balance -54.2 -9.7 15.0 135.2 -120.� -��.4 -general government balance -108.2 -42.� -28.2 83.2 -1�2.5 -54.4 -
2007 Change Q1 2008
Source: NSO.

CENTRAL BANK OF MALTA Quarterly Review 2008:2
34
Fund.Thus,inthefirstquarterof 2008, the balance on the Consolidated Fund swung back into deficit (see Chart 4.12).At EUR 210.1 million, this was EUR 80.5 million more than that registered a year earlier, as expenditure growth outstripped the expansion in revenue. The rise in the former was mainly driven by increased spending on social security benefits andcapital outlays. The primary deficitalsoincreased,wideningby EUR 74.2 million to EUR 150.6 million.
Revenue expands furtherDuring the first quarter of 2008 revenue expanded by EUR 29.8 million, or 7.1%, over thecomparable period of the previous year (see Table 4.9). The increase was driven by higher direct tax yields and non-tax revenues.
-215
-165
-115
-65
-15
35
85
Q4 2006
Q1 2007
Q2 Q3 Q4 Q1 2008
Primary balance Fiscal balance
Chart 4.12CoNsoLIdATEd FUNd dEVELoPMENTs(EUR millions)
Source: NSO.
Table 4.9goVERNMENT BUdgETARY oPERATIoNsEUR millions
2007 2008Q1 Q1 Amount %
Revenue 422.3 452.1 29.8 7.1direct tax 15�.3 174.� 18.3 11.7Income tax 76.4 91.3 14.9 19.5Social security contributions 79.9 83.4 3.5 4.4Indirect tax 194.7 195.2 0.5 0.3Value Added Tax 99.7 105.2 5.5 5.5Customs and excise duties 39.6 36.0 -3.6 -9.1Licences, taxes and fines 55.3 54.0 -1.3 -2.4Non-tax(1) 71.2 82.3 11.1 15.�Expenditure 551.9 ��2.2 110.3 20.0Recurrent 503.0 580.0 77.0 15.3Personal emoluments 110.0 120.1 10.1 9.2Programmes and other operational expenditure(2) 293.6 354.6 61.0 20.8Contributions to entities 46.2 45.8 -0.4 -0.9Interest payments 53.2 59.5 6.3 11.8Capital 48.9 82.2 33.3 �8.1Primary balance(3) -7�.4 -150.� -74.2 -Consolidated Fund balance(4) -129.� -210.1 -80.5 -
(3) Revenue less expenditure excluding interest payments.(4) Revenue less expenditure.Source: NSO.
Change
(1) Includes grants but excludes proceeds from sale of assets, sinking funds of converted loans and borrowings.(2) Includes programmes & initiatives and operational & maintenance expenditure.

CENTRAL BANK OF MALTA Quarterly Review 2008:2
35
Direct taxes yielded 11.7% more than a year earlier. Despite the further reduction in average personal tax rates as from January 2008, income tax receipts increased by 19.5%. This was entirely driven by higher yields from corporate taxes. Revenue from social security contributions added 4.4%, largely in line with the increase in employee compensation.
On the other hand, when compared to 2007, indirect tax receipts remained broadly stable. VAT yielded5.5%more,reflectingfastergrowthinnominalprivateconsumptionoverthesameperiod.This offset lower yields from both customs & excise duties, particularly on fuel, and from licences, taxes&finesthatpartlyreflectedweakeractivityonthepropertymarket.
In contrast, non-tax revenue expanded by 15.6%, mainly due to higher dividends received, although anincreaseinCentralBankofMaltaprofitstransferredtoGovernmentalsocontributed.
Expenditure rises sharplyInthefirstthreemonthsoftheyear,expendituregrewbyEUR110.3million,or20.0%,overthecomparable period of 2007, with both recurrent and capital outlays accelerating. The former rose by 15.3%, with programmes and other operational expenditure accounting for more than three-fourthsoftheincrease.Inturn,thismainlyreflectedhigheroutlaysonsocialsecuritybenefits,mostly retirement pensions. Increased spending on children’s allowances also contributed. In addition, spending on vouchers to low-income households to offset the impact of increased energy costs and outlays on agricultural support schemes also rose. The government’s wage bill also increased, adding 9.2%, partly because of the general increase in Civil Service salaries in terms of the collective agreement, but also because of the entry into force of the additional collective agreement covering the health sector. Meanwhile, the timing of coupon payments on bonds issued last year boosted interest payments, which added 11.8%.
CapitalspendingrosebyEUR33.3million,or68.1%,partlyreflectingincreasesin investmentincentives granted by Malta Enterprise and contributions to the Malta Tourism Authority.9 In addition,higheroutlaysoninformationtechnologyinfrastructureandonprojectsco-financedbythe EU also contributed to the rise.
During April and May, expenditure continued to outpace revenue. As a result, the Consolidated FunddeficitreachedEUR235.8millionbyend-May,upbyEUR80.6milliononayearearlier.
General government debt increases10
Duringthefirstquarter,generalgovernmentdebtincreasedbyEUR5.8million.Followingtheadoption of the euro, Maltese euro coins issued are recorded as a currency liability pertaining to the central government, thus increasing the size of government debt. The resultant increase of EUR 23.3 million was, however, partly offset by a reduction in the value of short-term debt securities in issue and by loan repayments.
As a result, general government debt at the end of March amounted to EUR 3,374.0 million, up from EUR 3,277.4 million a year earlier (see Table 4.10). New debt took the form of long-term securities issued in the second half of 2007 as the Government’s debt policy continued to be aimed at reducing its reliance on short-term borrowing. As result, during the year to March long-term debt securities in issue increased by EUR 135.4 million, while the amount of short-term
9 Thispartlyreflectsearlierpaymentscomparedtoayearago.10 Excludes general government debt held by extra-budgetary units, local government and the Sinking Fund.

CENTRAL BANK OF MALTA Quarterly Review 2008:2
36
Table 4.10
2008Q1 Q2 Q3 Q4 Q1
general government debt(1) 3,277.4 3,411.3 3,324.� 3,3�8.1 3,374.0Currency & deposits(2) - - - - 23.3Securities 3,017.9 3,152.3 3,063.5 3,108.3 3,093.9Short-term 399.9 457.0 368.2 354.9 340.6Long-term 2,618.0 2,695.3 2,695.3 2,753.3 2,753.4Loans 259.5 259.0 261.1 259.9 256.8Short-term 25.0 25.1 27.0 25.0 23.0Long-term 234.5 233.9 234.1 234.9 233.8
gENERAL goVERNMENT dEBTEUR millions
(1) Short-term debt includes all instruments with an initial term to maturity of one year or less. Long-term debt includes all debt with an initial term to maturity of over one year.
Source: NSO.
(2) As from January 2008, the Maltese euro coins issued are being considered as a currency liability pertaining to the Central Government
2007
securities (or Treasury bills) in issue decreased by EUR 59.3 million. Consequently, at the end ofthefirstquarterof2008theshareofshort-termsecuritiesinthetotaldebtoutstandingstoodat10.1%, as against 12.2 % a year earlier. Meanwhile, long-term securities accounted for 81.6% of the debt, 1.7 percentage points more than in the previous year. During the period under review, the drop in loans outstanding from EUR 259.5 million at end-March 2007 to EUR 256.8 million a yearlaterreflected,solely,repaymentsdue.Loansaccountedfor7.6%ofgeneralgovernmentdebtattheendoffirstthreemonthsof2008,withcoinsissuedaccountingfortheremainder.
Monetary and financial developmentsEntry into the euro area brought about significant changes to Malta’s monetary aggregates,which,asfromJanuary2008,reflectthecontributionofresidentMFIstotheeuroareamonetaryaggregates.11 Consequently,adirectcomparisonbetweendatareferringtothefirstquarterof2008 and the last three months of 2007 is only possible for selected variables.
On 1 January 2008, Malta adopted the euro as its national currency and the Central Bank of Malta ceased to be directly responsible for monetary policy. Ahead of euro adoption, on 28 December 2007, the Bank’s central intervention rate was lowered to 4.0%, aligning it to the minimum bid rateontheECB’smainrefinancingoperations. Consequently,duringthefirstquarterof2008domestic money market yields declined. In the capital market, yields on both 5-year and 10-year governmentsecuritiesdropped,reflectinglowerbondyieldsintheeuroarea,whileequitypricesfell.
Residents’ deposits grow stronglyThe euro changeover had major implications for the compilation of data on currency in circulation, which are now no longer comparable with the earlier data. In addition, the Maltese contribution to euro area monetary aggregates includes deposit liabilities both to residents of Malta and to other euro area residents, whereas domestic monetary aggregates covering the period until the end of 2007 only included residents’ deposits. Hence, the Maltese contribution to euro area broadmoney(M3)inthefirstquarterof2008exceedstheformerMaltesebroadmoneymeasure.11 For additional information on the presentation of Maltese monetary statistics following the adoption of the euro see Bull, P. (2008), “Presentation of statistics relating to Malta following adoption of the euro”, Central Bank of Malta Quarterly Review, 2008:1, pp 49-53.

CENTRAL BANK OF MALTA Quarterly Review 2008:2
37
The Maltese contribution to euro area M3 stood at EUR 8,686.3 million in March 2008, with the narrow money component amounting to EUR 3,783.5 million. The remainder of this section will focus on developments in residents’ deposits only, where the euro changeover had no impact on definitions.
Monetary expansion during the March quarter stemmed mainly from growth in deposits with an agreed maturity of up to two years. The latter rose by 3.2%, driven primarily by an increase in depositsbelonging tohouseholdsandprivatenon-financial companies (seeTable4.11).12 To some extent, deposit growth was augmented by the launch of a new product by a domestic bank and was also favoured by the absence of Malta Government Stock (MGS) issues on the primary market. In fact, growth in deposits with an agreed maturity of up to two years moderated when compared to the previous quarter, after having accelerated in 2007 partly because of the conversion of currency holdings ahead of euro adoption. In addition, a reduction in deposit interest ratestoreflectthedropinofficialratesfollowingtheCentralBankofMalta’sdecisiontoalignthecentral intervention rate with the minimum bid rate of the ECB could also have dampened deposit expansion. At the same time, despite increasing moderately in absolute terms, growth in deposits redeemable at up to three months’ notice also decelerated compared with the previous three quarters, while growth in overnight deposits turned slightly negative.13
Year-on-year growth in residents’ deposits, excluding those deposits with agreed terms to maturity exceeding two years, had been on an increasing trend since mid-2005. This was driven primarily by growth in short-term deposits, i.e. those with an agreed maturity of up to two years (see Chart 4.13). This acceleration now appears to have levelled off. Thus in March the annual rate of growth of residents’ deposits stood at 18.8%, 1.8 percentage points below the end-December level. Deposits with an agreed maturity
12 In percentage terms, deposits redeemable at notice up to 3 months grew at a much faster pace, as the Table shows, but the increase in such deposits in absolute terms was much smaller.13 Overnight deposits are deposits withdrawable on demand.
Table 4.11REsIdENT dEPosITsEUR millions, percentage changes on the previous quarter
2008 2008March Q1 Q2 Q3 Q4 Q1
Overnight deposits 3,103.7 -0.5 3.2 3.7 4.9 -0.1Deposits redeemable at notice up to 3 months 112.8 -3.8 18.4 9.3 18.0 7.1Deposits with agreed maturity up to 2 years 4,613.1 6.6 4.9 9.6 3.7 3.2Source: Central Bank of Malta.
2007
-5
0
5
10
15
20
25
J 2005
M M J S N J 2006
M M J S N J 2007
M M J S N J 2008
M M
Overnight deposits Deposits up to 3 months Deposits up to 2 years Total deposits in M3
Chart 4.13CoNTRIBUTIoNs To ANNUAL gRoWTh IN REsIdENT dEPosITs(percentage points)
Source: Central Bank of Malta.

CENTRAL BANK OF MALTA Quarterly Review 2008:2
38
of up to two years accounted for 69% of the overall increase in the year to March, down from 73% three months earlier. In contrast, the contribution of growth in overnight deposits to total deposit growth rose by 2 percentage points to 27% in March.
In response to the December cut in official rates, weightedaverage deposit and lending rates both declined during the March quarter. The weighted average rate on residents’ deposits eased only marginally, by just 4 basis points to 2.96%, as lower rates were applied only to new deposits (see Chart 4.14). The average interest rate on both savings and time deposits declined, ending March at 1.67% and 3.92%, respectively. In contrast, the average interest rate on demand deposits rose to 0.83% during the quarter. At the same time, the weighted average rate on loans to residents fell by 34 basis points, ending March at 5.96%.
Going into the second quarter of 2008, the annual rate of growth of total deposits fell to 17.7% in May. At the same time, while the contribution of deposits with an agreed maturity of up to two years to total deposit growth declined to 65%, that of overnight deposits rose to 32%. Additionally, the weighted average interest rates on residents’ deposits and loans both declined marginally, reaching 2.95% and 5.93%, respectively.
Credit expands at a slower pacePrior to euro adoption the analysis of the counterparts to monetary growth focused on developments in domestic credit and the net foreign assets of the banking system. Following the adoption of the euro the credit aggregate also includes credit extended to euro area residents. As at the end of March 2008, credit to euro area residents amounted to EUR 2,443.5 million, and accounted for 23.3% of the overall credit counterpart. Moreover, data on net foreign assets, particularly on theexternalreserves,haveundergonesignificantchangessinceeuroadoption.Therefore,thisanalysis focuses on developments in credit to residents of Malta, where the changeover had no impact on the statistics.
1.5
2.5
3.5
4.5
5.5
6.5
J 2005
M M J S N J 2006
M M J S N J 2007
M M J S N J 2008
M M
Weighted average deposit rate Weighted average lending rate ECB minimum bid rate
Chart 4.14dEPosIT ANd LENdINg RATEs(percentages per annum, end of month)
Source: Central Bank of Malta.
Table 4.12CREdIT To REsIdENTsEUR millions, percentage changes on the previous quarter
2008 2008(1)
March Q1 Q2 Q3 Q4 Q1Total credit 8,023.1 3.5 3.0 1.1 2.8 1.2Credit to general government 1,491.6 7.0 7.5 -1.6 3.3 -2.2Credit to other residents 6,531.6 2.7 1.9 1.7 2.7 2.1
Source: Central Bank of Malta.
2007
(1) Figures for 2008 show the contribution of Maltese MFIs to the euro area totals. Data only include credit to residents of Malta.

CENTRAL BANK OF MALTA Quarterly Review 2008:2
39
Duringthefirstquarterof2008,credit to residents continued to expand, albeit at a slower pace, growing by 1.2% as opposed to 2.8% in the December quarter (see Table 4.12). Growth stemmed entirely from a rise in credit to other residents, which outweighed a drop in credit to general government. The year-on-year rate of credit growth also decelerated, falling to 8.4% from 10.8% at end-December (see Chart 4.15).
After having expanded by 3.3% during the December quarter, credittogeneralgovernmentcontractedby2.2%duringthefirstthreemonthsof2008.Thisdropreflectedadecline in thebankingsystem’sTreasurybillportfolio,whichexceededarise in itsholdings of MGS, as well as a contraction in loans to government. This contraction in gross credit to general government may be associated with a drop in government deposits with the banking system,asthegovernmentrandownitsholdingstofinanceitsoperations.14
Credit to other residents expanded less rapidly during the March quarter, rising by 2.1%, as against the 2.7% increase registered in the previous quarter. The slowdown took place despite the addition of half-yearly accrued interest to borrowers’ loan accounts in March. Credit to other residents mainly consists of loans taken up by the non-bank private sector (see Table 4.13). Loans to the latter grew by 2.2%, fuelled mainly by lending to households, mostly for house purchases, and to the real estate, renting & business activities sector. Lending to the construction andtothewholesale&retailtradesectorsalsoincreasedsignificantly,outweighingdecreasesinborrowing by the tourism industry and the electricity, gas & water supply sector.
On a year-on-year basis, growth in credit to other residents also slowed down during the quarter reviewed,decelerating to8.7% inMarch from9.4% threemonthsearlier, reflecting less rapidgrowth in lending to the private sector. Although it remains vigorous, the annual growth rate of loans to the private sector declined during the quarter, falling to 9.2% in March from 10.1% in December (see Chart 4.16). Growth in residential mortgages remains dominant, even though its contribution to overall private sector loan growth fell to 43.0% in March from 45.0% in December. At the same time, while the contribution of real estate to the annual growth in credit to the private sector rose by 3 percentage points to 21.0% in March, that of construction remained unchanged at 17.0%. As a result, the link between bank lending and the domestic property market became more pronounced. Indeed, while loans to households continue to dominate bank lending to the private sector, these, together with loans to the real estate sector and to the construction industry, make up almost two-thirds of total private sector borrowing.
The results of the Bank Lending Survey conducted in April 2008 indicate that credit standards in 14 UntilDecember2007,thisanalysiswasbasedondevelopmentsinnetclaimsongovernment,whichwasdefinedasgrossclaimsongovernment less government deposits with the banking system. Following the adoption of the euro, the analysis will focus on gross claims on government,asgovernmentdepositsarenowbeingidentifiedwiththeothernetcounterpartsoftheMaltesecontributiontoeuroareaM3.
-30
-20
-10
0
10
20
30
J 2005
M M J S N J 2006
M M J S N J 2007
M M J S N J 2008
M M
Total Credit to general government Credit to other residents
Chart 4.15CREdIT To REsIdENTs(annual percentage changes)
Source: Central Bank of Malta.
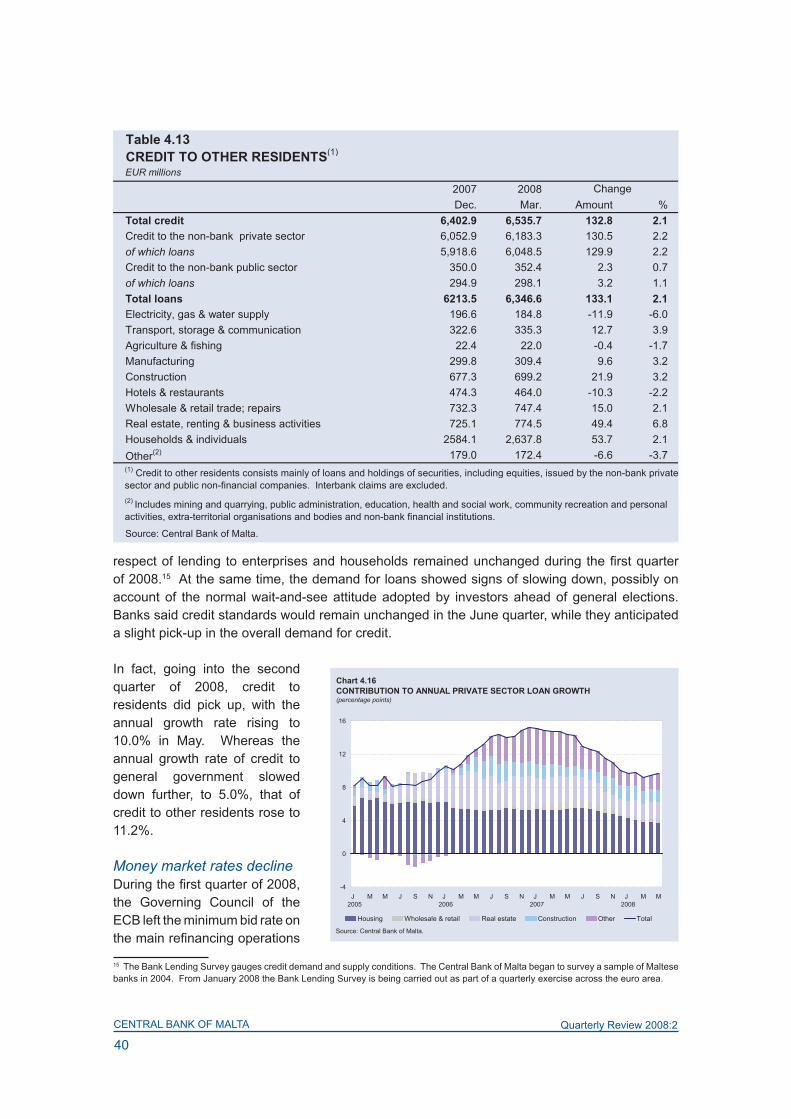
CENTRAL BANK OF MALTA Quarterly Review 2008:2
40
respectof lending toenterprisesandhouseholdsremainedunchangedduring thefirstquarterof 2008.15 At the same time, the demand for loans showed signs of slowing down, possibly on account of the normal wait-and-see attitude adopted by investors ahead of general elections. Banks said credit standards would remain unchanged in the June quarter, while they anticipated a slight pick-up in the overall demand for credit.
In fact, going into the second quarter of 2008, credit to residents did pick up, with the annual growth rate rising to 10.0% in May. Whereas the annual growth rate of credit to general government slowed down further, to 5.0%, that of credit to other residents rose to 11.2%.
Money market rates declineDuringthefirstquarterof2008,the Governing Council of the ECB left the minimum bid rate on themainrefinancingoperations
15 The Bank Lending Survey gauges credit demand and supply conditions. The Central Bank of Malta began to survey a sample of Maltese banks in 2004. From January 2008 the Bank Lending Survey is being carried out as part of a quarterly exercise across the euro area.
-4
0
4
8
12
16
J 2005
M M J S N J 2006
M M J S N J 2007
M M J S N J 2008
M M
Housing Wholesale & retail Real estate Construction Other Total
Chart 4.1�CoNTRIBUTIoN To ANNUAL PRIVATE sECToR LoAN gRoWTh(percentage points)
Source: Central Bank of Malta.
Table 4.13
EUR millions
2007 2008Dec. Mar. Amount %
Total credit �,402.9 �,535.7 132.8 2.1Credit to the non-bank private sector 6,052.9 6,183.3 130.5 2.2of which loans 5,918.6 6,048.5 129.9 2.2Credit to the non-bank public sector 350.0 352.4 2.3 0.7of which loans 294.9 298.1 3.2 1.1Total loans �213.5 �,34�.� 133.1 2.1Electricity, gas & water supply 196.6 184.8 -11.9 -6.0Transport, storage & communication 322.6 335.3 12.7 3.9Agriculture & fishing 22.4 22.0 -0.4 -1.7Manufacturing 299.8 309.4 9.6 3.2Construction 677.3 699.2 21.9 3.2Hotels & restaurants 474.3 464.0 -10.3 -2.2Wholesale & retail trade; repairs 732.3 747.4 15.0 2.1Real estate, renting & business activities 725.1 774.5 49.4 6.8Households & individuals 2584.1 2,637.8 53.7 2.1Other(2) 179.0 172.4 -6.6 -3.7
Source: Central Bank of Malta.
(1) Credit to other residents consists mainly of loans and holdings of securities, including equities, issued by the non-bank private sector and public non-financial companies. Interbank claims are excluded.(2) Includes mining and quarrying, public administration, education, health and social work, community recreation and personal activities, extra-territorial organisations and bodies and non-bank financial institutions.
CREdIT To oThER REsIdENTs(1)
Change

CENTRAL BANK OF MALTA Quarterly Review 2008:2
41
unchanged at 4.00%. At the same time, as discussed in Chapter 3, the three-month euro interbank offered rate (EURIBOR) increased slightly to end March at 4.73% (see Chart 4.17).
Following the cut in the Central Bank of Malta’s central intervention rate from 4.25% to 4.00% at the end of December 2007, the yield on three-month Treasury bills declined, falling from 4.35% in December to 4.13% in February.16 In March, however, the three-month Treasury bill yield rose, as the amount issued increased and as the three-month EURIBOR, which represents an alternative portfolio investment opportunity for domestic banks, went up. It ended the quarter at 4.27%. Primary Treasury bill market activity eased in January 2008 but picked up later. Over the quarter as a whole, the Treasury issued EUR 164.7 million worth of bills, as opposed to EUR 243.3 million in the December quarter. One-month, three-month and six-month bills each accounted for roughly one-third of the total issued. Banks bought slightly more than one-half of the bills issued, while another 30% was taken up by insurance companies.
In the secondary Treasury bill market, turnover decreased marginally, falling from EUR 24.9 million in the last quarter of 2007 to EUR 24.6 million in the quarter under review. Almost all transactions involved the Bank, with the latter’s purchases and sales equalling EUR 20.0 million and EUR 4.6 million, respectively. In line with developments in the primary market, secondary market yields also fell, with the yield on the three-month bill declining to 4.27% in March from 4.35% three months earlier.
During thefirst quarterof 2008, yieldson three-montheuroareagovernment securitieswerebroadly stable. Therefore, as a result of the movements in domestic yields, the differential between the latter and the corresponding euro area yields narrowed initially before widening again later. It ended March at 38 basis points, ten basis points below its level three months earlier (see Chart 4.17).17,18
Going into the second quarter of 2008, primary and secondary market three-month Treasury bill yieldsbothincreasedby40basispointsovertheend-Marchlevel,reflectingagreatersupplyofbills on the primary market and the further rise in the three-month EURIBOR. Thus, by the end of May they had reached 4.67%. At the same time, rates on three-month euro area government securities also rose, though to a lesser extent, ending May at 4.04%. As a result, the short-term differential between local and euro area yields widened to 63 basis points.
16 Since no primary market transactions took place in December, the end-year yield was that in effect at the end of November.17 The Chart shows the secondary market rate on three-month securities issued by the French government, which are often taken as benchmarks for the euro area.18 Up to March 2007 secondary market yields were calculated on the basis of remaining days to maturity divided by 365, while from April 2007 yields are being calculated on the basis of remaining days to maturity divided by 360.
1.5
2.0
2.5
3.0
3.5
4.0
4.5
5.0
J 2005
M M J S N J 2006
M M J S N J 2007
M M J S N J 2008
M M
ECB minimum bid rate 3-month EURIBOR 3-month Treasury bill 3-month benchmark euro
Chart 4.17MoNEY MARKET INTEREsT RATEs(percentages per annum, end of month)
Sources: Central Bank of Malta; ECB; Reuters; Euribor FBE.

CENTRAL BANK OF MALTA Quarterly Review 2008:2
42
Bond yields and equity prices fallThere was no activity in the Maltese primary bond market duringthefirstquarterof2008.
Turnover in the secondary market for government bonds during the March quarter increased to EUR 52.9 million, from EUR 50.2 million in the preceding quarter. The Central Bank of Malta, acting as market-maker, accounted for more than two-thirds of the value traded. Trading was almost equally split between short-term and medium-term bonds. Mirroring a decline in government bond yields in the euro area, those on both 5-year and 10-year domestic government securities fell by 36 basis points and 29 basis points, respectively, ending March at 4.36% and 4.63% (see Chart 4.18).19 The spread between domestic and euro area 10-year government bond yields thus narrowed slightly to 50 basis points.
Activity in the secondary market for corporate bonds more than doubled, with turnover rising to EUR 8.5 million from EUR 3.4 million in the December quarter. Trading was mostly concentrated in four securities, in particular one issued by a local bank. Mirroring the increased demand for corporate bonds, corporate bond yields, on average, declined during the quarter.
During the same period, trading in the equity market increased by EUR 2.9 million when compared to the previous quarter, reaching EUR 20.9 million. Bank shares accounted for almost three-fourths of the total turnover. Equity prices generally declined, reflectingtheimpactofabonusissue by a bank. As a result, the MSE share index dropped by 5.8%, ending the quarter at 4,650 (see Chart 4.19).
Going into the second quarter of 2008, yields on 5-year and 10-year government bonds halted their downward trend, rising to 5.00% and 5.11%, respectively, in May. At the same time the MSE share index fell by a further 9.1% from the end-March level.
19 Until November 2006 ECB data on euro area bond yields were compiled on the basis of national government bond yields weighted by the nominal outstanding amounts. From December 2006 onwards euro area yields are computed on the basis of AAA-rated euro area central government bonds.
3.0
3.5
4.0
4.5
5.0
5.5
J 2005
M M J S N J 2006
M M J S N J 2007
M M J S N J 2008
M M
5-year 10-year 10-year (euro area)
Chart 4.18goVERNMENT BoNd YIELds(percentages per annum, end of month)
Sources: Central Bank of Malta; ECB.
Chart 4.19MALTA sToCK ExChANgE shARE INdEx(end of month)
3000
3500
4000
4500
5000
5500
6000
6500
7000
J 2005
M M J S N J 2006
M M J S N J 2007
M M J S N J 2008
M M
Source: MSE.

CENTRAL BANK OF MALTA Quarterly Review 2008:2
43
Box 4: ECoNoMIC PRoJECTIoNs FoR 2008 ANd 2009
outlook for the Maltese economy1
After peaking in 2007, GDP growth is projected to slow down markedly in 2008 on account of weaker domestic demand and a smaller build-up of inventories. GDP growth is projected at 2.5%, which is around 1.3 percentage points lower than in 2007, and is projected to recover slightly to 2.6% in 2009.
Growth during the forecast horizon is expected to be mostly underpinned by domestic demand, particularly private consumption. Growth in this component is projected to slow down from 2.8% in 2007 to 1.5% in 2008, in line with a sharp deceleration in real disposable income, which is in turn the resultofhigher inflation. Indeed, innominal terms,growth indisposable income in2008 is projected at the same rate as in 2007, as the reduction in personal income tax rates and the increase in family allowances, coupled with a pick-up in wage growth, are expected to compensate for slower growth in employment. By contrast, growth in government consumption is forecast to accelerate to 1.1%.
The projected recovery in investment from 0.3% in 2007 to 2.6% in 2008 is expected to be entirely driven by the private sector and to be underpinned by higher outlays on machinery and equipment. Meanwhile, investment in construction is expected to slow down from the exceptionally high level recorded in the previous year, in line with the anticipated slowdown in the housing market. At the same time, public sector capital outlays are projected to decline in real terms, mostly as a result of the completion of the new hospital in 2007.
The contribution of net exports to growth is anticipated to remain relatively stable, as the impact of a downturn in economic activity in Malta’s trading partners is offset by generally favourable conditions for export growth in business services. Thus, the impact of weaker external demand is likely to affect mostly the manufacturing sector where turnover is expected to decline, especially in the electronics sub-sector. In contrast, the ongoing expansion of new business services is expected to contribute positively to export growth, offsetting the negative impact of global economic conditions on the more traditional export-oriented sectors. At the same time, tourism activity is also expected to expand, although growth will be more moderate than in the previous year when theindustrybenefitedfromtheexpansionofflightcapacitybylowcostairlines.Giventheimportcontent of exports and the anticipated recovery in investment in machinery and equipment, imports are forecast to grow by 0.4% in 2008 after declining in 2007. Nevertheless, on account of the anticipated increases in international commodity prices, the terms of trade are projected todeteriorate,givingrisetoahigherdeficitinthegoodsandservicesaccountofthebalanceofpayments, to 2.7% of GDP compared with 2.0% in the previous year.
In 2009 GDP growth is expected to accelerate marginally to 2.6% as domestic demand strengthens moderately and external demand remains stable. Growth in private consumption is projected to recover slightly, to 1.7%, largely underpinned by an improvement in growth in real disposable income while government consumption is forecast to pick up further, rising by 1.9%. In contrast, growth in investment is projected to slow down to 2.2%, as activity in the 1 The Bank’s outlook for the Maltese economy in 2008 and 2009 is based on information available up to 14 May 2008, and is conditional on certain technical assumptions which are indicated in Table 1.

CENTRAL BANK OF MALTA Quarterly Review 2008:2
44
construction industry is adversely affected by continued weakness in the housing market and the highercostofborrowing.Exportgrowthisexpectedtoacceleratein2009,mainlyreflectinganimprovement in global economic conditions. Consequently, imports should also grow at a faster pace as the terms of trade remain unfavourable in the wake of still high prices for international commodities. However, the gap in export/import prices is expected to narrow somewhat as growth ininternationalcommoditypricesslowsdown.Thus,thedeficitinthegoodsandservicesbalanceand on the current account is expected to be slightly higher in 2009 than in 2008.
Percentages2007 2008 (1) 2009 (1)
Real Economic Activity (% change) GDP 3.8 2.5 2.6
Private consumption expenditure 2.8 1.5 1.7Government consumption expenditure 0.6 1.1 1.9Gross fixed capital formation 0.3 2.6 2.2Inventories (% of GDP) 2.1 2.1 2.1Exports of goods & services -0.6 1.1 1.9Imports of goods & services -1.3 0.4 1.2
Contribution to Real gdP growth (in gdP pts)Domestic demand 2.0 1.6 1.9Net exports 0.6 0.6 0.6Inventories 1.2 0.2 0.1
Balance of Payments (% of gdP)Goods and services balance -2.0 -2.7 -2.9Current account balance -5.6 -6.2 -6.3
Labour Market (% change)Total employment 2.7 1.1 1.3Unemployment rate (% of labour supply) 6.6 6.8 6.7
Prices and Costs (% change)Overall HICP 0.7 4.0 2.7HICP excluding energy 1.1 3.7 2.7Retail price index 1.3 3.8 2.2Compensation per employee 1.5 2.5 2.4Unit labour cost 0.4 0.9 1.4
Public Finances (% of gdP)General government balance -1.8 -1.6 -0.7Government debt 62.6 61.6 59.8
Technical AssumptionsEUR/US$ exchange rate 1.370 1.536 1.545Oil price (US$ per barrel) 72.7 113.3 117.710-year euro area bond yield 4.33 4.35 4.55
(1) Central Bank of Malta projections.
Table 1
PRoJECTIoN oF ThE MAIN MACRoECoNoMIC AggREgATEs FoR MALTA

CENTRAL BANK OF MALTA Quarterly Review 2008:2
45
As regards labour market developments, employment growth in 2008 is projected to slow down to 1.1%, from the exceptionally high level of 2.7% recorded in 2007. Thus, the unemployment rate is expected to rise, albeit marginally, as a consequence of slower economic growth. In 2009 employment growth is expected to pick up to 1.3%, with unemployment easing slightly to 6.7% as a result of the expected mild recovery in economic activity. Meanwhile, the rate of increase of compensation per employee in 2008 is expected to recover to 2.5%, following the moderate increase recorded in 2007. In 2009, growth in compensation per employee is projected to ease marginally to 2.4%.
Despitetheslowerrateofeconomicgrowth,HICPinflationin2008isforecasttoaccelerateto4%from the exceptionally low rate of 0.7% recorded in 2007. Surging energy and food prices are the main factors contributing to the increase. Higher food prices are also expected to have a strong impactonrestaurantservices,whichhaveasignificantweightintheHICP.Inflationinnon-energyindustrial goods is also expected to accelerate in 2008, mainly on account of higher prices for clothing and footwear.
In2009inflationisprojectedtoeaseto2.7%aspricepressuresemanatingfromhigherinternationalfoodandenergypricesareassumed toease.Nevertheless, the inflation rateofspecificsub-components of the index, in particular food, energy and services, is expected to remain well above3%during2009.Theinflationrateofthenon-energyindustrialgoodscategory,however,which accounts for just over 30% of the HICP, is expected to ease to around 1%.
Risks to the projectionsGiventheturmoilininternationalfinancialmarketsanditsnegativeimpactonMalta’smajortradingpartners, the current projections are subject to an unusually high degree of uncertainty. Thus, a more severe downturn in the United States and a further weakening of the US currency against the euro may pose downside risks to growth in Malta’s exports of manufactured goods, particularly electronic components. These risks, however, may be offset by positive developments in the new export-oriented services’ sector, such as IT- and business-related operations, which cater for a wider range of overseas markets. These are expected to continue to expand despite weakening demand conditions in Malta’s major trading partners. Furthermore, the projected slowdown in household real disposable income could have a smaller impact on private consumption if the savings rate of domestic households declines.
Therisks for the inflationprojections for2008arebalanced,althoughanunexpectedsurge inenergy and non-energy commodity prices would exert further upward price pressures in the secondhalfoftheyear.In2009someupsideriskstoinflationcouldmaterialiseasbothenergyand non-energy commodity prices could be susceptible to unexpected increases in the light of continuing geopolitical uncertainty. Other upside risks stem from higher-than-expected wage growth that may arise as a result of the ongoing economic transformation towards higher value-added services.
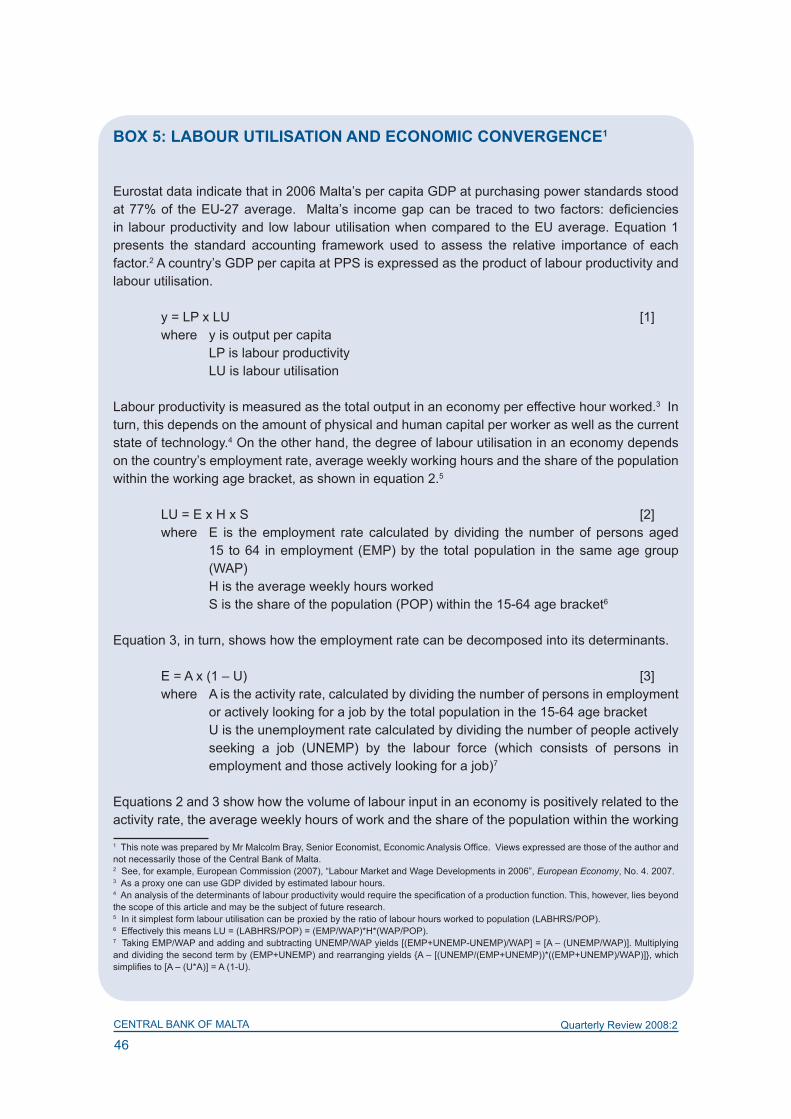
CENTRAL BANK OF MALTA Quarterly Review 2008:2
46
Box 5: LABoUR UTILIsATIoN ANd ECoNoMIC CoNVERgENCE1
Eurostat data indicate that in 2006 Malta’s per capita GDP at purchasing power standards stood at77%of theEU-27average. Malta’s incomegapcanbe traced to two factors:deficienciesin labour productivity and low labour utilisation when compared to the EU average. Equation 1 presents the standard accounting framework used to assess the relative importance of each factor.2 A country’s GDP per capita at PPS is expressed as the product of labour productivity and labour utilisation.
y = LP x LU [1]where y is output per capita
LP is labour productivity LU is labour utilisation
Labour productivity is measured as the total output in an economy per effective hour worked.3 In turn, this depends on the amount of physical and human capital per worker as well as the current state of technology.4 On the other hand, the degree of labour utilisation in an economy depends on the country’s employment rate, average weekly working hours and the share of the population within the working age bracket, as shown in equation 2.5
LU = E x H x S [2]where E is the employment rate calculated by dividing the number of persons aged
15 to 64 in employment (EMP) by the total population in the same age group (WAP)
H is the average weekly hours worked S is the share of the population (POP) within the 15-64 age bracket6
Equation 3, in turn, shows how the employment rate can be decomposed into its determinants.
E = A x (1 – U) [3]where A is the activity rate, calculated by dividing the number of persons in employment
or actively looking for a job by the total population in the 15-64 age bracketU is the unemployment rate calculated by dividing the number of people actively seeking a job (UNEMP) by the labour force (which consists of persons in employment and those actively looking for a job)7
Equations 2 and 3 show how the volume of labour input in an economy is positively related to the activity rate, the average weekly hours of work and the share of the population within the working
1ThisnotewaspreparedbyMrMalcolmBray,SeniorEconomist,EconomicAnalysisOffice.Viewsexpressedarethoseoftheauthorandnot necessarily those of the Central Bank of Malta.2 See, for example, European Commission (2007), “Labour Market and Wage Developments in 2006”, European Economy, No. 4. 2007. 3 As a proxy one can use GDP divided by estimated labour hours.4Ananalysisofthedeterminantsoflabourproductivitywouldrequirethespecificationofaproductionfunction.This,however,liesbeyondthe scope of this article and may be the subject of future research. 5 In it simplest form labour utilisation can be proxied by the ratio of labour hours worked to population (LABHRS/POP).6 Effectively this means LU = (LABHRS/POP) = (EMP/WAP)*H*(WAP/POP). 7 Taking EMP/WAP and adding and subtracting UNEMP/WAP yields [(EMP+UNEMP-UNEMP)/WAP] = [A – (UNEMP/WAP)]. Multiplying and dividing the second term by (EMP+UNEMP) and rearranging yields {A – [(UNEMP/(EMP+UNEMP))*((EMP+UNEMP)/WAP)]}, which simplifiesto[A–(U*A)]=A(1-U).
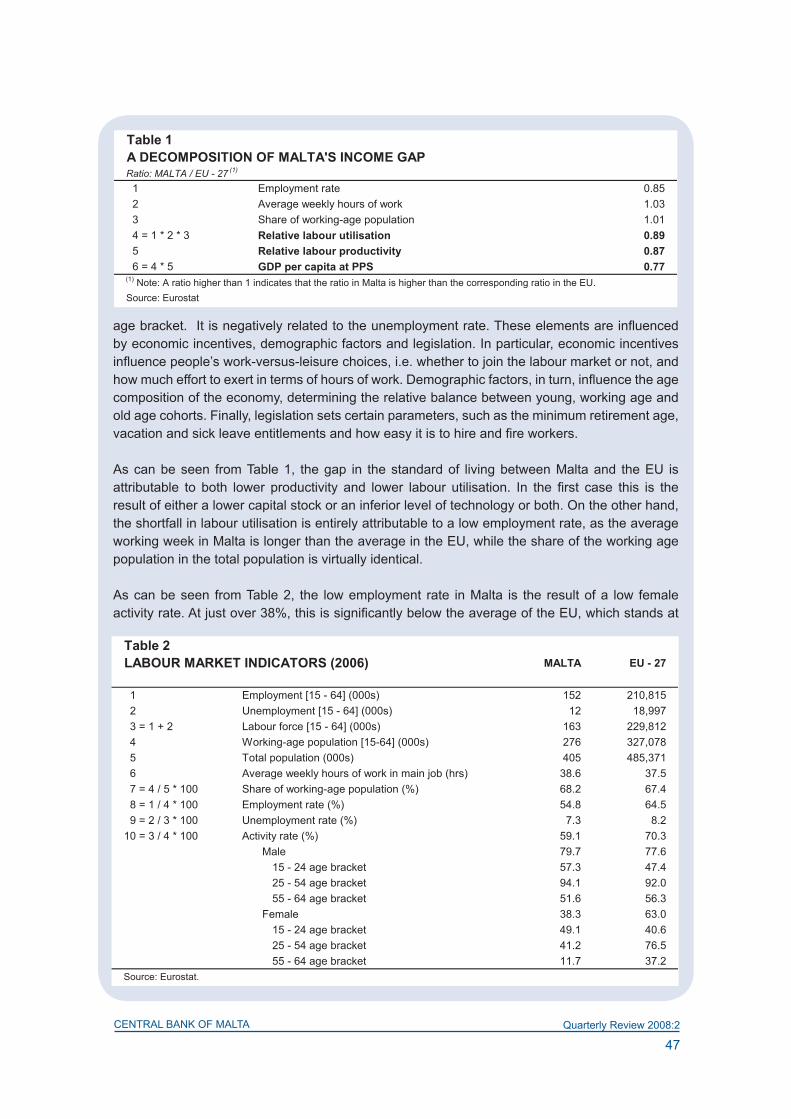
CENTRAL BANK OF MALTA Quarterly Review 2008:2
47
agebracket.Itisnegativelyrelatedtotheunemploymentrate.Theseelementsareinfluencedby economic incentives, demographic factors and legislation. In particular, economic incentives influencepeople’swork-versus-leisurechoices,i.e.whethertojointhelabourmarketornot,andhowmuchefforttoexertintermsofhoursofwork.Demographicfactors,inturn,influencetheagecomposition of the economy, determining the relative balance between young, working age and old age cohorts. Finally, legislation sets certain parameters, such as the minimum retirement age, vacationandsickleaveentitlementsandhoweasyitistohireandfireworkers.
As can be seen from Table 1, the gap in the standard of living between Malta and the EU is attributable to both lower productivity and lower labour utilisation. In the first case this is theresult of either a lower capital stock or an inferior level of technology or both. On the other hand, the shortfall in labour utilisation is entirely attributable to a low employment rate, as the average working week in Malta is longer than the average in the EU, while the share of the working age population in the total population is virtually identical.
As can be seen from Table 2, the low employment rate in Malta is the result of a low female activityrate.Atjustover38%,thisissignificantlybelowtheaverageoftheEU,whichstandsat
Table 1A dECoMPosITIoN oF MALTA's INCoME gAP
1 Employment rate 0.85 2 Average weekly hours of work 1.03 3 Share of working-age population 1.01 4 = 1 * 2 * 3 Relative labour utilisation 0.89 5 Relative labour productivity 0.87 6 = 4 * 5 gdP per capita at PPs 0.77
Source: Eurostat
Ratio: MALTA / EU - 2� (1)
(1) Note: A ratio higher than 1 indicates that the ratio in Malta is higher than the corresponding ratio in the EU.
Table 2LABoUR MARKET INdICAToRs (200�) MALTA EU - 27
1 Employment [15 - 64] (000s) 152 210,815 2 Unemployment [15 - 64] (000s) 12 18,997 3 = 1 + 2 Labour force [15 - 64] (000s) 163 229,812 4 Working-age population [15-64] (000s) 276 327,078 5 Total population (000s) 405 485,371 6 Average weekly hours of work in main job (hrs) 38.6 37.5 7 = 4 / 5 * 100 Share of working-age population (%) 68.2 67.4 8 = 1 / 4 * 100 Employment rate (%) 54.8 64.5 9 = 2 / 3 * 100 Unemployment rate (%) 7.3 8.210 = 3 / 4 * 100 Activity rate (%) 59.1 70.3
Male 79.7 77.615 - 24 age bracket 57.3 47.425 - 54 age bracket 94.1 92.055 - 64 age bracket 51.6 56.3
Female 38.3 63.015 - 24 age bracket 49.1 40.625 - 54 age bracket 41.2 76.555 - 64 age bracket 11.7 37.2
Source: Eurostat.

CENTRAL BANK OF MALTA Quarterly Review 2008:2
48
63%. In fact, as Chart 1 shows, Malta’s female participation rate is the lowest in the EU, with the Scandinavian countries at the other extreme surpassing 70%. In particular, gaps exist in the 25-54 and the 55-64 age brackets, since for those in the 15-24 bracket activity rates are actually higher than the EU average. However, even this relatively high participation rate in this young age bracket may not be a positive development. It may indicate that early entrants into the labour market are spending fewer years in formal education and thus the country is not building adequate human capital resources. This will ultimately undermine their future productivity. As regards male activity rates, these are slightly above those in the EU, again mainly because of the relatively higher participation rate of younger workers. On the other hand, the unemployment rate in Malta is below the average of the EU, although to a certain extent this may be conditioned by the lower activity rate in the country.
Neo-classical growth theory suggests that poorer countries’ standards of living may converge to those of richer economies.8 However, this process is not automatic and may also be lengthy. This justifies theactiveuseofgrowth-orientedpolicies. As thepreviousanalysishasshown, measures aimed at raising Malta’s female participation rate are strongly desirable to bridge the income divide that still exists, as this is the area in which Malta lags furthest behind.9 In this respect it is also worth noting that the Lisbon employment targets call for a 60% female employment rate in EU Member States by 2010. Should Malta reach this target, then, ceteris paribus, this would practically eliminate the gap in employment rates and, hence, in labour utilisation rates. This would leave differences in labour productivity as the only source of any income divide between Malta and the EU average.10
Policies aimed at boosting female labour participation rates can be sub-divided into two categories: those aimed at making it easier for women to combine family with working life, such as the provision of child care centres; and those increasing the attractiveness for women of returning or remaining in the labour market, such as tax incentives. Some measures have already been introduced in this respect. If successful, these should boost Malta’s supply capabilities, enabling the country to converge at a faster pace to the higher EU average standard of living. Although simply raising the female participation rate will not guarantee permanently higher economic growth, at least it will contribute to an upward shift in Malta’s potential output. This can be easier and quicker to achieve than raising the country’s growth rate permanently through ongoing productivity gains. 8 The law of diminishing marginal productivity suggests that additions to capital in less-capital intensive countries yields higher growth than in those countries that are already endowed with a higher capital stock, thus contributing to convergence in living standards. For a textbook treatment of the extensive growth literature refer to Aghion, P. and Howitt P., (1997) Endogenous Growth Theory and Barro, R. and Sala-i-Martin, X. (1998) Economic Growth. 9However,higherfemaleparticipationmaylowerthebirthrateinacountryandthusinfluencetheshareoftheworkingagepopulationinthe total. 10 This presumes that additional labour utilisation does not have a negative effect on economy-wide productivity.
Chart 1: FEMALE PARTICIPATIoN RATEs IN ThE EU (200�)(percent)
0
10
20
30
40
50
60
70
80
Den
mar
k
Sw
eden
Finl
and
Net
herla
nds
Ger
man
y
Est
onia
Uni
ted
Kin
gdom
Por
tuga
l
Aus
tria
Latv
ia
Slo
veni
a
Fran
ce
Lith
uani
a
Cyp
rus
Cze
ch R
epub
lic
Irela
nd
Slo
vaki
a
Bul
garia
Spa
in
Bel
gium
Luxe
mbo
urg
Pol
and
Rom
ania
Hun
gary
Gre
ece
Italy
Mal
ta
Source: Eurostat.

CENTRAL BANK OF MALTA Quarterly Review 2008:2
49
NEWs NoTEs
LoCAL NEWs
Exchange of Maltese currency at the Central Bank of MaltaFrom 1 April the exchange of Maltese lira notes and coins for euros started to take place solely attheCentralBankofMalta.Allsuchexchangesareeffectedattheirrevocablyfixedconversionrate of EUR 1 = MTL 0.4293 and without the imposition of any charges. Maltese lira coins will continue to be exchanged until 1 February 2010 while Maltese lira banknotes can be exchanged until 31 January 2018.
open day at the Central Bank of Malta On Sunday 1 June, to celebrate the 40th Anniversary of the establishment of the Central Bank of Malta and the 10th Anniversary of the European System of Central Banks and the European Central Bank, the Bank opened its premises to the public. Information on the Bank’s history and the structure and workings of the Eurosystem were displayed on panels together with the Bank’s collection of numismatic coins and items of equipment used by the Bank in its operations over the years. To coincide with this event the Bank also launched a publication on the history of its main building. International bank signs syndicated loan facilityOn 6 June, Credit Europe Bank NV, a Dutch bank which has a branch in Malta, signed a syndicated loanfacilitywithaconsortiumofinternationalbanks.ThefacilityistobeusedtofinanceCreditEurope Bank’s international trade-related activities through its Malta branch.
Capital market developments
Listing of a new company On 16 May, RS2 Software p.l.c., a German-owned, Malta-based IT company that services banks, financialinstitutionsandserviceprovidersoperatinginthecardpaymentsindustry,launchedanInitial Public Offer (IPO) consisting of a combined offering of 12,500,000 ordinary shares with a nominal value of EUR 0.20 each at a share price of EUR 0.80 per share. Following the IPO, the company’s share capital increased to 37,500,000 ordinary shares, with 33.3% of this being held by the general public and 66.7% being retained by the existing majority shareholder.
Company issues bondsOn 27 June, United Finance p.l.c. announced the issue of EUR 10,000,000 6.75% bonds 2014-2016, with a nominal value of EUR 100 per bond, to be issued at par. The proceeds of the bondsweretobeusedtore-financematuringbonds,tofinancethegeneralcorporatefundingrequirements of the company and new investments. The issue was oversubscribed and the company exercised an overallotment option to issue an additional EUR 2,000,000.
government plans to privatise the shipyards companyOn 18 June, the Prime Minister announced in a press conference that the Government would be privatising the shipyards company, Malta Shipyards Ltd. The facilities covered by the privatisation would include some of the shipyard’s docks, part of the Marsa dock, the Manoel Island Yacht

CENTRAL BANK OF MALTA Quarterly Review 2008:2
50
Yard and the superyachts repair centre. The part of the shipyards known as Boiler Wharf will be retained by the Government and converted into a berthing spot for cruise liners. The privatisation process will be managed by the Privatisation Unit of the Ministry of Finance, the Economy and Investment.
Legislation related to banking and finance
Legal Notice 145 of 2008This legal notice, issued on 10 June under the Insurance Intermediaries Act, 2006 (Act No. XII of 2006), announced the coming into force on the same date of article 76 (b) (xvii) and paragraph (g)ofsub-article(2)inarticle76(c)ofthesameAct.Theseprovisionsamendthedefinitionof“risk situated in Malta” in the Insurance Business Act and provide that the objective of the Act is, in part, to implement EU Directives relating to insurance against civil liability in respect of the use of motor vehicles.
Legal Notice 163 of 2008This legal notice, issued on 27 June under the Banking Act (Cap. 371), repeals the Interest Rate on Offshore Loans Order, 1980. The repeal of this order ensures consistency in local legislation covering the deregulation of bank interest rates.
Issues of Malta government stockDuring the second quarter of 2008, the Treasury launched the following securities in the primary market:
On 4 April, EUR 326,700 7% Malta Government Stock 2018, which were allotted to the Ecclesiastical Entities at par in terms of the 1991 Agreement between the Holy See and Malta on the transfer of Church property.
On 13 May, EUR 100,000,000, consisting of 5.1% Malta Government Stock 2014 (III) (Fungibility Issue) or 5% Malta Government Stock 2021 (I) (Fungibility Issue), or of any combination of these two stocks, which in the aggregate totalled EUR 100,000,000.
On 20 June, EUR 6,542,600 7% Malta Government Stock 2018 (III), which was allotted to the Foundation for Church Schools at par in terms of the 1991 Agreement between the Holy See and Malta on the transfer of Church property.
surrender of licencesOn 30 April, the MFSA announced that Sabius SICAV Ltd had surrendered the collective investment scheme licence granted to it in relation to the sub-fund “Sabius Fund”. This surrender was entirely voluntary and did not arise from any regulatory action taken by the MFSA.
On 30 June, the MFSA announced that Finacom Investment House Ltd had surrendered its Category 2 Investment Services Licence issued in terms of the Investment Services Act 1994.

CENTRAL BANK OF MALTA Quarterly Review 2008:2
51
INTERNATIoNAL NEWs
The g7 Finance Ministers MeetingThe G7 Finance Ministers met in Washington DC before the IMF Spring Meetings, which were held there on 12-13 April 2008. They noted that near-term global economic prospects had deteriorated and approved a plan aimed at easing the continuing crisis in the global credit markets. The plan further calls for the strengthening of authorities’ responsiveness to financial risks, and puts in place arrangements to dealwith stress in the financial system. The IMF spring MeetingsOn 12 April, the International Monetary and Financial Committee (IMFC) of the IMF met in Washington DC. The Committee noted that the challenges facing the world economy required strongactionandclosecooperationamongthemembership,particularlyinthelightofthefinancialmarkets’ crisis and continuing inflationary risks.TheCommittee agreed that policymakers shouldcontinuetorespondtothechallengeofdealingwiththefinancialcrisisandsupportingactivity,whilemakingsurethat inflationwaskeptundercontrol.TheIMFCalsoendorsedtheagreementbytheExecutive Board on a new income model which would help place the Fund on a sustainable footing. The Development Committee met in Washington DC on 13 April. It endorsed the overall World Bank Group objective of contributing to an inclusive and sustainable globalisation but noted that progress on the achievement of the Millennium Development Goals had been uneven across countries. The Committee asked the World Bank Group and the IMF to provide timely policy andfinancialsupporttovulnerablecountriesdealingwithnegativeshocks,includingthosefromenergyandfoodprices.TheCommitteealsoexpressedstrongsupportforintensifiedanddecisiveefforts to agree on the Doha Round.
The European Council MeetingOn 19-20 June, the European Council met in Brussels. Its conclusions included the following:
• That international financial markets were showing signs of stabilisation, but overallconditions remained fragile.
• That all Millennium Development Goals could still be attained. In this regard it strongly affirmedtheEU’scommitmenttoachieveacollectiveOfficialDevelopmentAssistancetarget of 0.56% of Gross National Income (GNI) by 2010 and of 0.7% of GNI by 2015.
• ThatSlovakiahadfulfilledallconvergencecriteriaandlegalrequirementsforadoptingthe euro as its currency from 1 January 2009 and called on the ECOFIN Council to adopt the necessary procedure at its meeting on 8 July.
ECoFIN Council Meetings – main topics discussed and decisions taken
4 April 2008DuringaninformalmeetingtheCouncildiscussedanumberofkeyissueswithregardtofinancialsupervision including, the full and immediate disclosure of in and off-balance sheet exposures and lossesbyfinancialinstitutionsandwaystoimprovetheinfrastructureforclearingandsettlementforsecuritiestransactions.ItalsoconfirmeditssupportfortheIMF’sproposedreformsonquotasand voice.

CENTRAL BANK OF MALTA Quarterly Review 2008:2
52
14 May 2008The Council discussed the EU’s framework for financial market supervision, particularly theinclusion of a European dimension into the mandates of national supervisory authorities, the improvedfunctioningofEUcommitteesofsupervisorsandthesupervisionofEU-widefinancialgroups by means of “colleges of supervisors”. Furthermore it discussed EU arrangements for financialstability,includingpreparationsforanEU-widecrisismanagementsimulationexerciseinthe spring of 2009 and future work relating to deposit guarantee schemes.
3 June 2008TheCouncil closed theexcessivedeficitprocedureswith regard to theCzechRepublic, Italy,PortugalandSlovakia,followingthereductionoftheirgovernmentdeficitstobelow3%ofGDP.WithrespecttoSlovakia,closureoftheexcessivedeficitprocedurewasanecessarypreconditionfor it to adopt the euro as its currency on 1 January 2009.
slovak koruna revalued in ERM IIOn 28 May, at the request of the Slovak authorities, the ministers of the euro area Member States of the European Community, the European Central Bank and the ministers and the central bank governors of ERM II participating countries decided, by mutual agreement, following a common procedure, to revalue the Slovak koruna by 17.6472%. As a result, the new central rate of the Slovak koruna now stands at EUR 1 = 30.1260 koruna.
The g-8 Finance Ministers MeetingOn 14 June, the G-8 Finance Ministers met in Osaka Japan. Their main conclusions included the following:
• They remained positive about the long-term resilience of their countries’ economies. • Financial market conditions had improved somewhat in the previous few months as bold
measures by major central banks had supported the better functioning of markets. • They were fully committed to the implementation of recommendations made by the
Financial Stability Forum. • They expressed strong concerns about the sharp rise in oil prices and its impact on global
macroeconomic stability. • They noted that the recent steep rise in food prices had severely hit many low-income
food-importing countries.
The EBRd Annual MeetingOn 18-20 May, the EBRD held its Annual Meeting and Business Forum in Kiev, Ukraine. During the Annual Meeting the following decisions were taken:
• To transferpartof theBank’sprofits to its reserves. Thisputs theBank inastrongerposition to take risks and to deliver the transition impact by investing in the region in which it operates.
• To allocate income to a shareholder fund that would be added to the funds supplied by donors and help the Bank promote initiatives in the poorest countries.
• To review an application by Turkey to become a country of operation of the EBRD.

CENTRAL BANK OF MALTA Quarterly Review 2008:2
53
sTATIsTICAL TABLEs


CENTRAL BANK OF MALTA Quarterly Review 2008:2
55
CAPITAL CITY Valletta AREA 316 km2
CURRENCY UNIT Euro exchange rates 1: EUR 1 = USD 1.5812EUR 1 = GBP 0.7958
CLIMATE Average temperature (1990-2007): Dec. - Feb. 13.3o C June - Aug. 26.1o CAverage annual rainfall (1990-2007) 478.7 mm
SELECTED GENERAL GDP growth at constant 2000 prices 2 3.5% ECONOMIC STATISTICS GDP per capita at current market prices 2 (2007) EUR 13,191
GDP per capita in PPS relative to the EU-27 average 2 (2007) 77.1%Ratio of gross general government debt to GDP 2 (2007) 62.4%Ratio of general government deficit to GDP 2 (2007) 1.8%RPI inflation rate 1.9%HICP inflation rate 1.5%Ratio of exports of goods and services to GDP 2 80.5%Ratio of current account deficit to GDP 2 5.2%Employment rate 54.7%Unemployment rate 6.0%
POPULATION Total Maltese and foreigners (2007) 410,290 Males 204,106 Females 206,184Age composition in % of population (2007) 0 - 14 16% 15 - 64 70% 65 + 14%Average annual growth rate (1990-2007) 0.7%Density per km2 (2007) 1,298
HEALTH Life expectancy at birth (2006) Males 77 Females 81Crude birth rate, per 1,000 Maltese inhabitants (2007) 9.5Crude mortality rate, per 1,000 Maltese inhabitants (2006) 7.9Doctors (2007) 1,320
EDUCATION Combined gross enrolment ratio (2005) 81%Number of educational institutions (2005/2006) 342Teachers per 1,000 students (2005/2006) 85Adult literacy rate: age 10+ (2005) Males 91.7% Females 93.9%
LIVING STANDARDS Human Development Index: rank out of 177 countries (2005) 34Mobile phone subscriptions per 100 population (end-Dec 2007) 91.0Private motor vehicle licences per 1,000 population 536Internet subscribers per 100 population (end-Dec 2007) 24.5
2 Provisional. Sources: Central Bank of Malta; Eurostat; Ministry of Finance, the Economy and Investment; NSO; UNDP.
The Maltese Islands - Key information, social and economic statistics(as at end-Mar 2008, unless otherwise indicated)
1 End of month ECB euro foreign exchange reference rates.
CENTRAL BANK OF MALTA Quarterly Review 2008:2
56
Akbank T.A.S.APS Bank LtdBanif Bank Malta plcBank of Valletta plcBAWAG Malta Bank Ltd (from October 2003)Credit Europe NV (from March 2007)Commbank Europe Ltd (from September 2005)Erste Bank (Malta) LtdFIMBank plcFinansbank (Malta) Ltd (from July 2005)Fortis Bank Malta LtdHSBC Bank Malta plcInvestkredit International Bank plcIzola Bank LtdLombard Bank Malta plcMediterranean Bank plc (from January 2006)Raiffeisen Malta Bank plcSparkasse Bank Malta plcTurkiye Garanti Bankasi A.S. Volksbank Malta Ltd
Additional statistics are also provided in electronic format on the website of the Central Bank of Malta atwww.centralbankmalta.org.
The monetary and financial statistics shown in the 'statistical Tables' annex are compiled frominformation submitted to the Central Bank of Malta by the following credit institutions, as at March2008:
In order to reflect Malta's entry into the euro area and the adoption of the euro as its currency on 1 January
2008, the layout and design of a number of tables, in particular in Parts 1 and 3, have been changed
significantly, while others have been replaced with entirely new tables. Hence, users should exercise caution
when comparing these series with earlier data, as the underlying definitions may have changed. For ease of
comparison, all data relating to earlier periods presented in this Quarterly Review are converted into euro at
the fixed exchange rate of EUR1=MTL0.4293. The reasons for this approach were explained in a note entitled
'Conversion of data in Maltese liri into euro' which was published in the 2007:3 issue of the Quarterly Review ,
while the changes to the underlying concepts were explained in a note entitled 'Presentation of statistics
relating to Malta following adoption of the euro' which was published in the 2008:1 issue of the Quarterly
Review . Detailed definitions of the concepts in each table can be found in the 'General Notes' section.

CENTRAL BANK OF MALTA Quarterly Review 2008:2
57
Table 1.1 Financial statement of the Central Bank of Malta 58Table 1.2 Balance sheet of the Central Bank of Malta based on statistical principles 60Table 1.3 Aggregated balance sheet of the other monetary financial institutions based on statistical principles 61Table 1.4a Monetary Base and Monetary Aggregates 63Table 1.4b The Contribution of Resident MFIs to the Euro Area Monetary Aggregates 63Table 1.5a Monetary Financial Institutions Survey 64Table 1.5b The Contribution of Resident MFIs to Selected Counterparts to Euro Area M3 64Table 1.6a Currency in Circulation 65Table 1.6b Currency Issued 65Table 1.7a Denominations of Maltese Currency Issued and Outstanding 66Table 1.7b Denominations of Euro Banknotes Allocated to Malta 66Table 1.7c Denominations of Euro Coins Issued by the Central Bank of Malta on behalf of the Treasury 66Table 1.8 Deposits held with Other Monetary Financial Institutions by Sector 67Table 1.9 Deposits held with Other Monetary Financial Institutions by Currency 68Table 1.10 Other Monetary Financial Institutions Loans by Size Class 69Table 1.11 Other Monetary Financial Institutions Loans to Residents of Malta by Economic Activity 70Table 1.12 Other Monetary Financial Institutions Loans by Sector 71Table 1.13 Other Monetary Financial Institutions Loans by Currency and Original Maturity to Residents of Malta 72Table 1.14 Aggregated Statement of Assets and Liabilities - Investment Funds 73Table 1.15 Monetary Policy Operations of the Central Bank of Malta 74Table 1.16 Key Central Bank of Malta, European Central Bank and Money Market Interest Rates 75Table 1.17 Other Interest Rates 76
PART 2: goVERNMENT FINANCETable 2.1 General Government Revenue and Expenditure 77Table 2.2 General Government Revenue by Main Components 77Table 2.3 General Government Expenditure by Main Components 78Table 2.4 General Government Expenditure by Function 78Table 2.5 General Government Deficit-Debt Adjustment 79Table 2.6 General Government Debt and Guaranteed Debt Outstanding 79Table 2.7 Treasury Bills Issued and Outstanding 80Table 2.8 Treasury Bills Issued and Outstanding (as at end-March 2008) 81Table 2.9 Malta Government Long-Term Debt Securities Outstanding (as at end-March 2008) 82Table 2.10 Malta Government Long-Term Debt Securities Outstanding by Remaining Term to Maturity 83Table 2.11 General Government External Loans by Currrency and Remaining Term to Maturity 83
PART 3: ExChANgE RATEs, ExTERNAL TRANsACTIoNs ANd PosITIoNs Table 3.1a Selected Maltese Lira Exchange Rates (end of period closing middle rates) 84Table 3.1b Selected Maltese Lira Exchange Rates (averages for the period) 84Table 3.2a Euro exchange rates against the major currencies (end of period closing middle rates) 85Table 3.2b Euro exchange rates against the major currencies (averages for the period) 86Table 3.3 Balance of Payments - Current, Capital and Financial Accounts (transactions) 87Table 3.4 Official Reserve Assets 88Table 3.5 International Investment Position (IIP) (end of period amounts) 88Table 3.6 Gross External Debt by Sector, Maturity and Instrument 89Table 3.7 Malta's Foreign Trade 90Table 3.8 Direction of Trade - Exports 91Table 3.9 Direction of Trade - Imports 92
PART 4: REAL ECoNoMY INdICAToRsTable 4.1a Gross Domestic Product, Gross National Income and Expenditure Components (at current market prices) 93Table 4.1b Gross Domestic Product and Expenditure Components (at constant 2000 prices) 93Table 4.2 Tourist Departures by Nationality 94Table 4.3 Labour Market Indicators based on Administrative Records 95Table 4.4 Labour Market Indicators based on the Labour Force Survey 96Table 4.5 Property Prices Index based on Advertised Prices (base 2000 = 100) 96Table 4.6 Development Permits for Commercial, Social and Other Purposes 97Table 4.7 Development Permits for Dwellings, by Type 97Table 4.8 Inflation Rates Measured by the Retail Price Index (base 1946 = 100) 98Table 4.9 Main Categories of Retail Price Index (base December 2002 = 100) 99Table 4.10 Main Categories of Harmonised Index of Consumer Prices (base 2005 = 100) 100
101gENERAL NoTEs
PART 1: MoNETARY, BANKINg, INVEsTMENT FUNds ANd FINANCIAL MARKETs
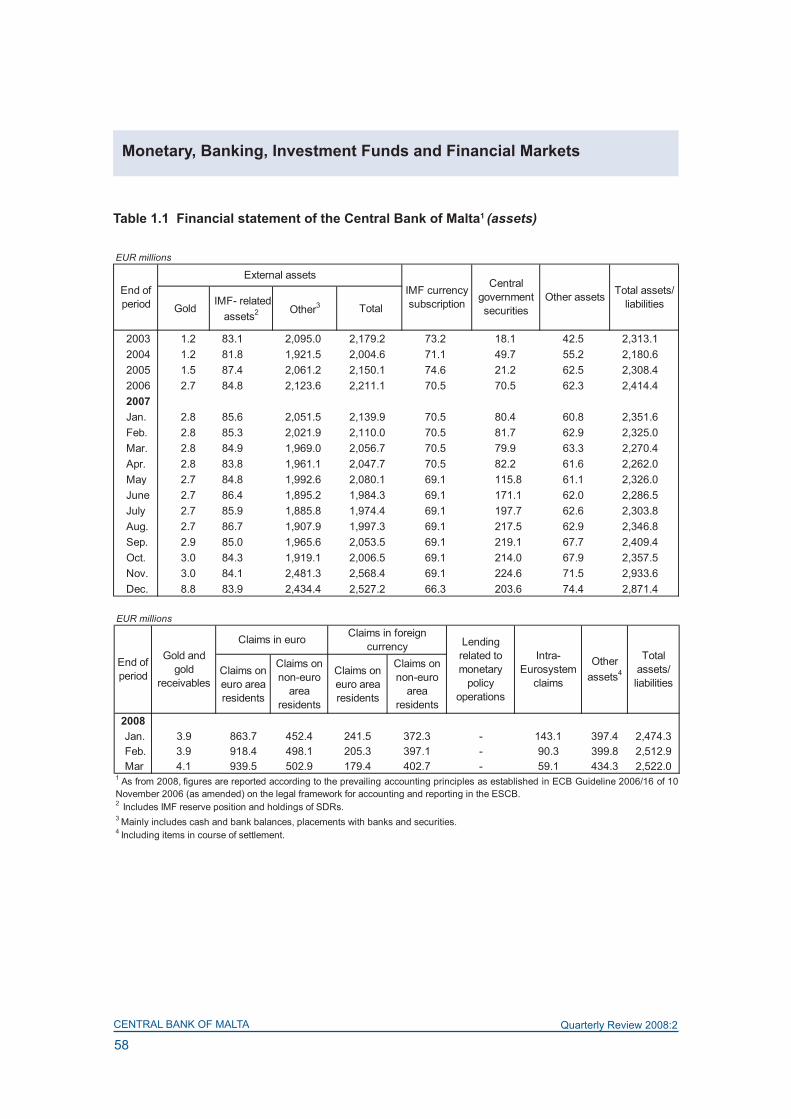
CENTRAL BANK OF MALTA Quarterly Review 2008:2
58
Monetary, Banking, Investment Funds and Financial Markets
Table 1.1 Financial statement of the Central Bank of Malta1 (assets)
EUR millions
Gold IMF- related
assets2 Other3 Total
2003 1.2 83.1 2,095.0 2,179.2 73.2 18.1 42.5 2,313.12004 1.2 81.8 1,921.5 2,004.6 71.1 49.7 55.2 2,180.62005 1.5 87.4 2,061.2 2,150.1 74.6 21.2 62.5 2,308.42006 2.7 84.8 2,123.6 2,211.1 70.5 70.5 62.3 2,414.42007Jan. 2.8 85.6 2,051.5 2,139.9 70.5 80.4 60.8 2,351.6Feb. 2.8 85.3 2,021.9 2,110.0 70.5 81.7 62.9 2,325.0Mar. 2.8 84.9 1,969.0 2,056.7 70.5 79.9 63.3 2,270.4Apr. 2.8 83.8 1,961.1 2,047.7 70.5 82.2 61.6 2,262.0May 2.7 84.8 1,992.6 2,080.1 69.1 115.8 61.1 2,326.0June 2.7 86.4 1,895.2 1,984.3 69.1 171.1 62.0 2,286.5July 2.7 85.9 1,885.8 1,974.4 69.1 197.7 62.6 2,303.8Aug. 2.7 86.7 1,907.9 1,997.3 69.1 217.5 62.9 2,346.8Sep. 2.9 85.0 1,965.6 2,053.5 69.1 219.1 67.7 2,409.4Oct. 3.0 84.3 1,919.1 2,006.5 69.1 214.0 67.9 2,357.5Nov. 3.0 84.1 2,481.3 2,568.4 69.1 224.6 71.5 2,933.6Dec. 8.8 83.9 2,434.4 2,527.2 66.3 203.6 74.4 2,871.4
End of period
External assets IMF currency subscription
Central government securities
Other assets Total assets/ liabilities
EUR millions
Claims on euro area residents
Claims on non-euro
area residents
Claims on euro area residents
Claims on non-euro
area residents
2008 Jan. 3.9 863.7 452.4 241.5 372.3 - 143.1 397.4 2,474.3 Feb. 3.9 918.4 498.1 205.3 397.1 - 90.3 399.8 2,512.9 Mar 4.1 939.5 502.9 179.4 402.7 - 59.1 434.3 2,522.01 As from 2008, figures are reported according to the prevailing accounting principles as established in ECB Guideline 2006/16 of 10November 2006 (as amended) on the legal framework for accounting and reporting in the ESCB.
End of period
Other assets4
Gold and gold
receivables
Total assets/ liabilities
Lending related to monetary
policy operations
Intra-Eurosystem
claims
3 Mainly includes cash and bank balances, placements with banks and securities.
2 Includes IMF reserve position and holdings of SDRs.
4 Including items in course of settlement.
Claims in foreign currencyClaims in euro

CENTRAL BANK OF MALTA Quarterly Review 2008:2
59
Monetary, Banking, Investment Funds and Financial Markets
Table 1.1 Financial statement of the Central Bank of Malta1 (liabilities)
EUR millions
2008 Jan. 749.8 375.0 287.9 87.1 24.9 - 12.1 644.3 59.4 233.8 Feb. 669.3 395.7 264.1 79.9 24.5 - 12.1 798.1 46.2 223.1
Mar 638.9 402.7 282.8 80.9 34.6 - 11.7 767.3 75.4 227.6
4 Includes provisions and revaluation accounts.
Liabilities to euro
area residents
Liabilities to non-
euro area residents
Counterpart of SDRs
allocated by the IMF
Liabilities in foreign currency
Other liabilities3
Liabilities in euro
Liabilities to euro
area residents
Liabilities to non-euro
area residents
3 Includes items in the course of settlement.
End of
period
Banknotes in
circulation2
Liabilities related to monetary
policy operations
Capital and
reserves4
1As from 2008, figures are reported according to the prevailing accounting principles as established in ECB Guideline 2006/16 of 10November 2006 (as amended) on the legal framework for accounting and reporting in the ESCB.2 This comprises the Bank's share of euro banknotes issued in the Eurosystem, based on the banknote allocation key. This amount ispurely notional and may not reflect the amount of currency in circulation in Malta; the series is not comparable with the data prior toJanuary 2008. For 2008, remaining outstanding Maltese Lira banknotes are included.
Intra-Eurosystem
liabilities
EUR millions
Credit institutions
Central government
Other residents Total
2003 1,130.6 73.3 564.1 193.8 19.7 777.6 205.5 59.4 66.72004 1,179.6 71.2 387.4 269.4 26.0 682.8 200.4 - 46.72005 1,211.4 74.6 424.7 343.5 22.2 790.4 196.3 - 35.72006 1,173.9 70.5 660.8 248.2 41.0 950.0 181.0 - 38.92007Jan. 1,130.9 70.5 727.8 186.0 22.5 936.2 177.9 - 36.0Feb. 1,112.4 70.5 753.8 162.5 20.3 936.6 182.2 - 23.3Mar. 1,106.3 70.5 712.5 161.6 21.0 895.1 180.8 - 17.6Apr. 1,085.9 70.5 591.2 286.7 28.9 906.8 178.5 - 20.3May 1,054.3 69.1 679.4 295.9 27.4 1,002.7 175.1 - 24.7June 1,032.8 69.1 606.8 352.7 24.8 984.3 171.5 - 28.7July 990.2 69.1 692.7 322.6 24.7 1,040.1 175.9 - 28.4Aug. 948.7 69.1 772.8 296.6 49.7 1,119.1 179.3 - 30.6Sep. 925.6 69.1 803.5 345.2 53.8 1,202.6 179.9 - 32.2Oct. 875.8 69.1 782.5 349.3 61.9 1,193.7 184.7 - 34.2Nov. 818.2 69.1 1,449.1 304.4 66.9 1,820.4 188.3 - 37.5Dec. 677.8 66.4 1,433.5 387.2 75.7 1,896.4 189.9 - 40.9
DepositsCapital & reserves
External liabilities
End of period
Currency issued
IMF-related liabilities
Other liabilities

CENTRAL BANK OF MALTA Quarterly Review 2008:2
60
Monetary, Banking, Investment Funds and Financial Markets
Table 1.2 Balance sheet of the Central Bank of Malta based on statistical principles (assets)1
Table 1.2 Balance sheet of the Central Bank of Malta based on statistical principles (liabilities)1
EUR millions
2008Jan. 0.4 5.5 209.2 214.7 1,135.6 757.8 287.1 2,180.4 100.7 2,496.2Feb. 0.1 5.4 213.9 219.3 1,120.1 825.6 255.6 2,201.3 131.2 2,551.8Mar 0.0 5.4 215.2 220.6 1,105.4 844.3 228.6 2,178.4 132.4 2,531.3
4 Includes resident interbank claims.
Total assets/
liabilities LoansSecurities other than
shares
Claims on other euro
area residents
1 Based on a detailed description of instrument categories as stipulated in ECB Regulation 2001/13 of 22 November 2001.
3 If the Central Bank issues less currency than the amount attributed to it under the banknote allocation key, the shortfall will be reflected in intra-Eurosystem claims included in this item.
End of period
Holdings of euro
denominated cash2
External assets
Other assets4
Claims on non-
residents of the euro
area
Other external assets3
Total
Claims on residents of Malta
Total
2 May include some holdings of Maltese Lira banknotes and coins.
EUR millions
2008Jan. 805.2 244.9 13.0 258.0 644.7 87.1 16.1 747.9 243.5 441.6Feb. 720.6 223.2 10.0 233.3 803.3 79.9 16.4 899.7 235.5 462.8Mar. 690.1 252.6 10.0 262.7 761.5 80.9 38.0 880.4 229.2 468.9
5 Includes resident interbank liabilities.
Other liabilities5
Deposits from other euro area residents
2 This comprises the Bank's share of euro banknotes issued in the Eurosystem, based on the banknote allocation key (in turn reflecting its share in thepaid-up capital of the ECB), plus coins issued by the Bank on behalf of the Treasury. For 2008, remaining outstanding Maltese Lira banknotes and coinsare included.
4 If the Central Bank issues more currency than the amount attributed to it under the banknote allocation key, the excess will be reflected in intra-Eurosystem liabilities included in this item.
End of period
Currency issued2
Deposits from residents of Malta External liabilities
3 For the purposes of this table deposits withdrawable on demand include deposits redeemable at notice.
Deposits from non-
residents of the euro
area
Other external
liabilities4Total
Capital & reservesWithdrawable
on demand3With agreed
maturity Total
1 Based on a detailed description of instrument categories as stipulated in ECB Regulation 2001/13 of 22 November 2001.

CENTRAL BANK OF MALTA Quarterly Review 2008:2
61
Monetary, Banking, Investment Funds and Financial Markets
Table 1.3 Aggregated balance sheet of the other monetary financial institutions based on statistical principles1 (assets)
EUR millions
LoansSecurities other than
shares
Shares & other equity
Claims on other euro
area residents
Claims on non-residents of
the euro area
Other external assets
Total
2003 607.7 4,449.2 1,449.1 83.1 2,834.4 7,488.9 170.1 10,493.3 818.3 17,900.82004 448.6 4,734.9 1,531.2 77.9 3,631.0 8,798.9 778.2 13,208.0 837.6 20,838.22005 487.5 5,058.0 1,440.3 62.2 4,476.3 13,045.7 1,818.5 19,340.5 806.0 27,194.52006 707.0 5,788.8 1,210.8 83.2 5,217.2 15,981.9 401.9 21,601.1 643.1 30,033.92007Jan. 802.3 5,811.6 1,199.0 83.7 5,391.0 16,694.5 422.6 22,508.1 638.2 31,042.8Feb. 809.7 5,839.0 1,232.3 84.7 5,402.9 17,004.3 392.1 22,799.4 640.5 31,405.6Mar. 776.2 5,956.9 1,283.0 83.8 5,559.0 17,804.8 390.4 23,754.1 594.7 32,448.7Apr. 651.8 5,969.4 1,292.8 85.0 5,870.6 18,435.5 461.6 24,767.7 607.6 33,374.3May 736.8 5,999.9 1,251.1 87.3 5,898.9 19,569.6 541.3 26,009.7 631.9 34,716.8June 649.4 6,066.5 1,296.8 87.1 5,737.9 20,626.0 560.1 26,924.1 687.5 35,711.3July 763.0 6,067.9 1,303.1 94.1 5,918.5 21,000.3 602.6 27,521.4 667.9 36,417.3Aug. 835.5 6,071.1 1,245.6 94.5 5,842.3 21,208.7 534.1 27,585.1 686.1 36,517.9Sep. 841.6 6,166.9 1,221.2 95.1 5,963.7 21,268.6 521.2 27,753.4 633.1 36,711.3Oct. 838.8 6,175.6 1,313.2 95.5 5,623.0 20,905.4 595.4 27,123.9 571.5 36,118.5Nov. 1,510.1 6,235.0 1,300.0 93.3 5,361.3 20,883.9 588.8 26,834.1 593.4 36,565.8Dec. 1,518.0 6,334.8 1,287.2 93.0 5,384.9 21,966.8 595.6 27,947.3 625.9 37,806.22008Jan. 573.1 6,321.5 1,265.1 92.7 5,522.8 22,987.6 596.5 29,106.8 629.2 37,988.3Feb. 527.2 6,352.2 1,281.7 93.0 5,704.5 22,977.2 544.1 29,225.7 652.1 38,131.8Mar. 519.7 6,449.1 1,260.7 92.8 5,687.3 22,264.8 593.4 28,545.5 705.8 37,573.6
2 Includes holdings of cash. May include some holdings of Maltese Lira banknotes and coins.
1 Based on a detailed description of instrument categories as stipulated in ECB Regulation 2001/13 of 22 November 2001.
3 Includes resident interbank claims.
Other assets3
Total assets/
liabilities
End of
period
Balances held with Central Bank of Malta2
Claims on residents of Malta External Assets

CENTRAL BANK OF MALTA Quarterly Review 2008:2
62
Monetary, Banking, Investment Funds and Financial Markets
Table 1.3 Aggregated balance sheet of the other monetary financial institutions based on statistical principles1 (liabilities)
EUR millions
Withdraw-able on demand
Redeem-able at notice
With agreed maturity
Total
Deposits from other
residents of the euro
area
Deposits from non-
residents of the euro
area
Other external
liabilities3Total
2003 2,441.8 67.0 3,726.2 6,235.1 2,426.4 4,862.9 1,623.5 8,912.8 108.6 1,822.4 821.82004 2,589.8 70.0 3,700.7 6,360.5 3,203.2 6,640.3 1,604.8 11,448.3 113.9 2,086.4 829.12005 2,800.2 73.3 3,834.6 6,708.1 5,329.3 9,294.9 2,673.7 17,297.9 75.6 2,359.4 753.52006 2,834.9 71.8 4,300.2 7,206.9 6,385.9 11,167.7 1,458.2 19,011.8 72.7 3,083.0 659.62007Jan. 2,823.1 70.5 4,365.9 7,259.5 6,727.5 11,816.8 1,373.0 19,917.3 128.0 3,063.2 674.9Feb. 2,833.4 67.3 4,436.4 7,337.2 6,577.7 12,221.5 1,347.0 20,146.2 127.5 3,153.3 641.6Mar. 2,815.6 69.0 4,546.8 7,431.4 6,692.8 12,679.0 1,692.1 21,063.9 126.7 3,183.8 642.9Apr. 2,815.7 70.4 4,484.0 7,370.1 6,883.0 13,032.0 2,123.3 22,038.3 125.6 3,197.0 643.3May 2,827.3 77.3 4,592.6 7,497.2 6,828.5 14,139.1 2,242.6 23,210.3 125.9 3,222.1 661.3June 2,910.1 81.7 4,639.9 7,631.7 7,003.8 15,052.7 1,925.3 23,981.8 125.6 3,246.4 725.8July 3,009.8 87.7 4,764.8 7,862.2 7,078.0 15,397.4 1,989.8 24,465.2 125.0 3,238.6 726.1Aug. 2,988.7 89.0 4,955.2 8,032.9 6,917.2 15,128.9 2,373.9 24,420.0 125.0 3,239.8 700.2Sep. 3,015.4 89.3 4,984.5 8,089.2 7,259.4 15,016.9 2,188.4 24,464.6 124.1 3,350.9 682.4Oct. 2,971.1 92.0 5,039.4 8,102.4 7,691.5 13,957.5 2,145.8 23,794.8 123.7 3,431.8 665.7Nov. 3,012.6 96.6 5,068.6 8,177.9 7,391.9 14,665.1 2,123.6 24,180.6 123.0 3,391.9 692.4Dec. 3,139.6 105.3 5,102.7 8,347.6 7,916.4 15,275.8 2,137.9 25,330.1 122.9 3,360.9 644.62008Jan. 3,150.6 108.8 5,172.5 8,431.9 8,073.8 15,339.0 2,033.2 25,446.0 140.7 3,296.6 673.1Feb. 3,152.9 111.2 5,234.7 8,498.9 8,722.9 14,868.9 1,918.1 25,510.0 140.1 3,269.3 713.5Mar. 3,160.1 112.8 5,227.6 8,500.5 8,646.9 14,598.5 1,740.8 24,986.2 139.2 3,197.9 749.8
4 Includes resident interbank liabilities.
3 Up to December 2007, debt securities issued held by non-residents are included under 'other external liabilities'. As from January 2008such data is included under the 'debt securities issued' column.
1 Based on a detailed description of instrument categories as stipulated in ECB Regulation 2001/13 of 22 November 2001.2 Includes general government and private sector deposits.
External Liabilities
Debt securites issued3
Other liabilities4
End of
period
Deposits from residents of Malta 2
Capital & reserves

CENTRAL BANK OF MALTA Quarterly Review 2008:2
63
Monetary, Banking, Investment Funds and Financial Markets
Table 1.4a Monetary base and monetary aggregates
Demand Savings
2003 1,130.6 321.2 1,451.8 1,072.5 637.5 1,763.0 3,473.0 67.0 3,096.9 6,636.9 6,637.02004 1,179.6 338.5 1,518.1 1,132.1 700.8 1,849.8 3,682.6 70.0 3,045.3 6,797.9 6,797.92005 1,211.4 315.7 1,527.1 1,162.2 727.0 2,001.0 3,890.2 73.3 3,121.5 7,085.0 7,085.02006 1,173.9 412.2 1,586.1 1,112.9 726.5 2,020.0 3,859.4 71.8 3,520.6 7,451.7 7,451.72007Jan. 1,130.9 430.7 1,561.6 1,079.0 739.8 2,006.4 3,825.2 70.5 3,562.4 7,458.1 7,458.1Feb. 1,112.4 446.0 1,558.4 1,063.2 736.4 2,012.7 3,812.3 67.3 3,637.8 7,517.4 7,517.4Mar. 1,106.3 433.4 1,539.7 1,054.7 731.2 2,001.8 3,787.6 69.0 3,753.4 7,610.1 7,610.1Apr. 1,085.9 419.9 1,505.8 1,032.9 738.0 2,001.5 3,772.4 70.4 3,774.6 7,617.4 7,617.4May 1,054.3 521.0 1,575.3 1,001.1 757.7 1,996.9 3,755.7 77.3 3,810.6 7,643.6 7,643.6June 1,032.8 441.4 1,474.2 978.7 772.1 2,041.5 3,792.4 81.7 3,936.4 7,810.5 7,810.5July 990.2 479.6 1,469.8 925.8 790.8 2,113.6 3,830.2 87.6 4,060.3 7,978.2 7,978.2Aug. 948.7 488.6 1,437.3 890.4 811.8 2,090.6 3,792.8 89.0 4,292.9 8,174.7 8,174.7Sep. 925.6 489.7 1,415.3 868.4 811.3 2,112.9 3,792.5 89.3 4,313.9 8,195.7 8,195.7Oct. 875.8 496.0 1,371.8 820.4 792.8 2,116.0 3,729.2 92.0 4,384.6 8,205.8 8,205.8Nov. 818.2 1,021.6 1,839.8 763.0 785.8 2,160.0 3,708.8 96.6 4,434.0 8,239.4 8,239.4Dec. 677.8 1,110.0 1,787.8 610.2 806.3 2,278.9 3,695.4 105.3 4,474.6 8,275.3 8,275.3
Broad money (M3)Intermediate money (M2)
Total (M3)1
Narrow money (M1)
Deposits redeemable at notice up to 3 months
Deposits with
agreed maturity up to 2 years
Total (M2)
Currency in
circulation
Deposits withdrawable on demand Total
(M1)
EUR millions
End of period
Monetary base (M0)
Currency issued
OMFI balances
with Central Bank of Malta
Total (M0)
Table 1.4b The contribution of resident MFIs to the euro area monetary aggregates
EUR millions
From residents of Malta
From other euro
area residents
From residents of Malta
From other euro area residents
From residents of Malta
From other euro
area residents
With residents of Malta
With other euro
area residents
2008Jan. 670.7 3,107.4 65.7 108.8 - 4,544.8 269.9 - - -118.7 8,648.6Feb. 637.6 3,084.5 71.0 111.2 - 4,613.0 294.5 - - -112.7 8,699.3Mar. 612.9 3,103.7 66.8 112.8 - 4,613.1 289.5 - - -112.6 8,686.3
Total (M3)Currency
issued2
Overnight deposits3
Deposits redeemable at notice up to 3
months3
Narrow money (M1)
Broad money (M3)
2 This is not a measure of currency in circulation in Malta. It comprises the Central Bank's share of euro banknotes issued in the Eurosystem,based on the banknote allocation key (in turn reflecting its share in the paid-up capital of the ECB), plus coins issued by the Bank on behalf ofthe Treasury, less holdings of issued euro banknotes and coins held by the MFI sector. For 2008, remaining outstanding Maltese Lira banknotesand coins are included. This represents the residual amount after deducting holdings of euro banknotes and coins (and, temporarily, of MalteseLira currency) reported by MFIs in Malta from the currency issued figure as reported in Table 1.2.
4 Debt securities up to 2 years' issued by MFIs in Malta less holdings by MFIs in Malta of such securities issued by MFI anywhere in the euroarea. The column shows net amounts (issues less holdings by MFIs in Malta) and may be negative. Figures also include MMF shares/units.
End of period
Issues less
holdings of MFI debt securities
up to 2 years4
Intermediate money (M2)Repurchase agreements
Deposits with agreed maturity up to 2
years3
3 Deposits with MFIs exclude interbank deposits and deposits held by central government.
1 M3 comprises M2, repurchase agreements and debt securities with agreed maturity of up to 2 years.
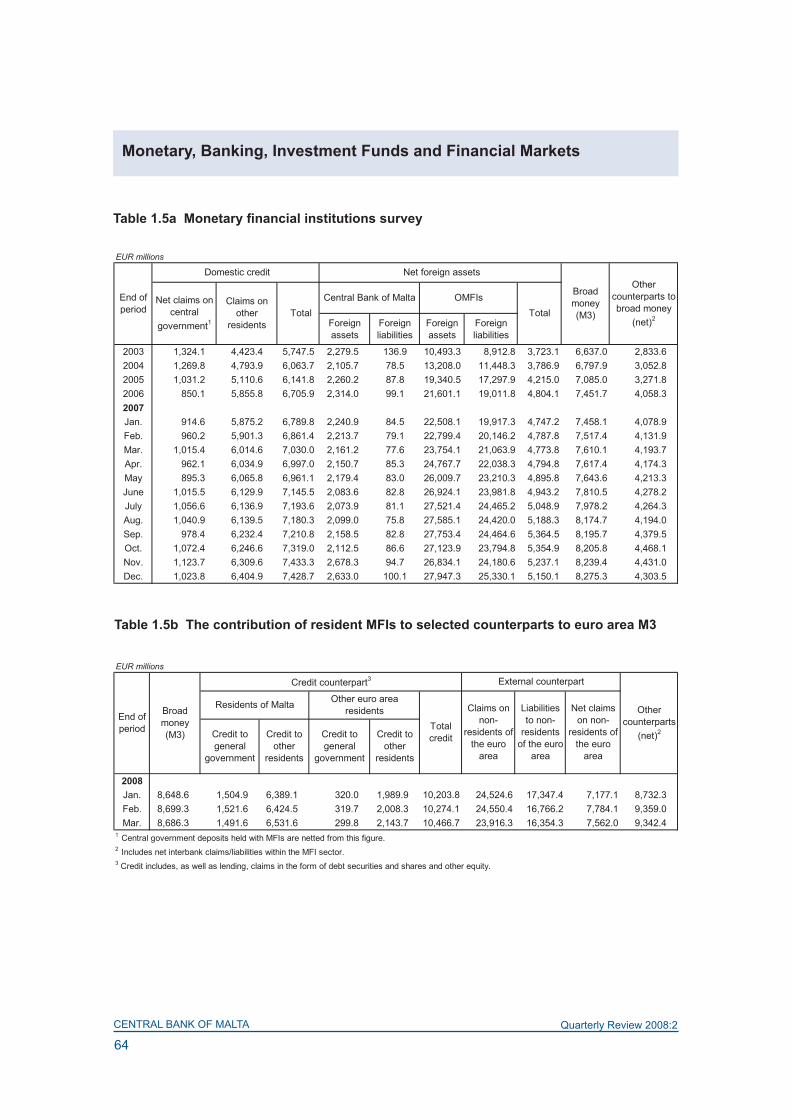
CENTRAL BANK OF MALTA Quarterly Review 2008:2
64
Monetary, Banking, Investment Funds and Financial Markets
Table 1.5a Monetary financial institutions survey
EUR millions
Foreign assets
Foreign liabilities
Foreign assets
Foreign liabilities
2003 1,324.1 4,423.4 5,747.5 2,279.5 136.9 10,493.3 8,912.8 3,723.1 6,637.0 2,833.62004 1,269.8 4,793.9 6,063.7 2,105.7 78.5 13,208.0 11,448.3 3,786.9 6,797.9 3,052.82005 1,031.2 5,110.6 6,141.8 2,260.2 87.8 19,340.5 17,297.9 4,215.0 7,085.0 3,271.82006 850.1 5,855.8 6,705.9 2,314.0 99.1 21,601.1 19,011.8 4,804.1 7,451.7 4,058.32007Jan. 914.6 5,875.2 6,789.8 2,240.9 84.5 22,508.1 19,917.3 4,747.2 7,458.1 4,078.9Feb. 960.2 5,901.3 6,861.4 2,213.7 79.1 22,799.4 20,146.2 4,787.8 7,517.4 4,131.9Mar. 1,015.4 6,014.6 7,030.0 2,161.2 77.6 23,754.1 21,063.9 4,773.8 7,610.1 4,193.7Apr. 962.1 6,034.9 6,997.0 2,150.7 85.3 24,767.7 22,038.3 4,794.8 7,617.4 4,174.3May 895.3 6,065.8 6,961.1 2,179.4 83.0 26,009.7 23,210.3 4,895.8 7,643.6 4,213.3June 1,015.5 6,129.9 7,145.5 2,083.6 82.8 26,924.1 23,981.8 4,943.2 7,810.5 4,278.2July 1,056.6 6,136.9 7,193.6 2,073.9 81.1 27,521.4 24,465.2 5,048.9 7,978.2 4,264.3Aug. 1,040.9 6,139.5 7,180.3 2,099.0 75.8 27,585.1 24,420.0 5,188.3 8,174.7 4,194.0Sep. 978.4 6,232.4 7,210.8 2,158.5 82.8 27,753.4 24,464.6 5,364.5 8,195.7 4,379.5Oct. 1,072.4 6,246.6 7,319.0 2,112.5 86.6 27,123.9 23,794.8 5,354.9 8,205.8 4,468.1Nov. 1,123.7 6,309.6 7,433.3 2,678.3 94.7 26,834.1 24,180.6 5,237.1 8,239.4 4,431.0Dec. 1,023.8 6,404.9 7,428.7 2,633.0 100.1 27,947.3 25,330.1 5,150.1 8,275.3 4,303.5
Other counterparts to broad money
(net)2
Domestic credit Net foreign assets
Broad money (M3)
OMFIsNet claims on central
government1
Central Bank of MaltaTotal
Claims on other
residents Total
End of period
Table 1.5b The contribution of resident MFIs to selected counterparts to euro area M3
EUR millions
2008Jan. 8,648.6 1,504.9 6,389.1 320.0 1,989.9 10,203.8 24,524.6 17,347.4 7,177.1 8,732.3Feb. 8,699.3 1,521.6 6,424.5 319.7 2,008.3 10,274.1 24,550.4 16,766.2 7,784.1 9,359.0Mar. 8,686.3 1,491.6 6,531.6 299.8 2,143.7 10,466.7 23,916.3 16,354.3 7,562.0 9,342.4
2 Includes net interbank claims/liabilities within the MFI sector.
1 Central government deposits held with MFIs are netted from this figure.
Total credit
Credit counterpart3
Other euro area residents
Credit to general
government
Credit to other
residents
Liabilities to non-
residents of the euro
area
3 Credit includes, as well as lending, claims in the form of debt securities and shares and other equity.
End of period
Claims on non-
residents of the euro
area
Broad money (M3) Credit to
general government
Credit to other
residents
Residents of Malta Net claims on non-
residents of the euro
area
Other counterparts
(net)2
External counterpart

CENTRAL BANK OF MALTA Quarterly Review 2008:2
65
Monetary, Banking, Investment Funds and Financial Markets
Table 1.�a Currency in circulation
EUR millions
Notes Coins Total
2003 1,088.0 42.6 1,130.6 58.1 1,072.52004 1,134.8 44.8 1,179.6 47.5 1,132.12005 1,164.5 46.8 1,211.4 49.2 1,162.22006 1,125.4 48.6 1,173.9 61.0 1,113.02007Jan. 1,082.9 48.0 1,130.9 51.9 1,079.0Feb. 1,064.7 47.8 1,112.4 49.2 1,063.2Mar. 1,058.5 47.9 1,106.3 51.6 1,054.7Apr. 1,037.9 47.9 1,085.9 52.9 1,032.9May 1,006.3 48.0 1,054.3 53.2 1,001.1June 984.5 48.3 1,032.8 54.1 978.7July 941.3 49.0 990.2 64.4 925.8Aug. 899.3 49.4 948.7 58.3 890.4Sep. 876.6 49.0 925.6 57.3 868.4Oct. 827.5 48.3 875.8 55.3 820.4Nov. 771.0 47.2 818.2 55.2 763.0Dec. 634.2 43.6 677.8 67.6 610.2
Currency in circulation
End of period
Less currency held by OMFIs
Currency issued and outstanding
Table 1.�b Currency issued
EUR millions
End of period
Notional amount of banknotes issued by the Central Bank of
Malta1
Coins issued by the Central Bank of
Malta on behalf of the Treasury
Less euro banknotes and coins
held by MFIs in Malta
Currency issued excluding holdings
of MFIs
Memo item:Excess / shortfall (-) on the
banknote allocation key 2
2008Jan. 749.8 55.4 134.5 670.7 -102.9Feb. 669.3 51.3 83.0 637.6 -50.2Mar. 638.9 51.2 77.1 612.9 -11.8
1 This comprises the Bank's share of euro banknotes issued in the Eurosystem, based on the banknote allocation key (in turnreflecting its share in the paid-up capital of the ECB). For 2008, remaining outstanding Maltese Lira banknotes and coins are included,hence will not tally with total denominations shown in Table 1.7b.2 The difference between the value of euro banknotes allocated to the Bank in accordance with the banknote allocation key (based onits share in the ECB's capital) and the value of the euro banknotes that the Bank puts into circulation gives rise to intra-Eurosystembalances. If the value of the actual euro banknotes issued is below the value based on the capital share, the difference is recorded asa shortfall (-). If the value of the actual euro banknotes issued is above the value based on the capital share, the difference is recordedas an excess.

CENTRAL BANK OF MALTA Quarterly Review 2008:2
66
Monetary, Banking, Investment Funds and Financial Markets
Table 1.7c denominations of euro coins issued by the Central Bank of Malta on behalf of the Treasury
Table 1.7b denominations of euro banknotes allocated to Malta1
Table 1.7a denominations of Maltese currency issued and outstanding
EUR millions
Lm20 Lm10 Lm5 Lm2 Total
2003 1,130.6 255.5 744.0 71.8 16.7 1,088.02004 1,179.6 257.0 786.3 74.3 17.2 1,134.82005 1,211.4 257.5 812.1 76.8 18.1 1,164.52006 1,173.9 240.5 785.0 80.9 18.9 1,125.42007Jan. 1,130.7 234.3 754.4 75.5 18.4 1,082.6Feb. 1,112.2 231.0 740.6 74.3 18.5 1,064.4Mar. 1,106.1 227.8 735.5 76.0 18.9 1,058.2Apr. 1,085.6 221.8 719.9 76.8 19.1 1,037.7May 1,054.0 214.5 696.4 76.0 19.2 1,006.0June 1,032.6 208.2 679.6 77.1 19.4 984.3July 990.0 195.0 650.0 76.5 19.6 941.1Aug. 948.4 182.6 621.9 75.2 19.4 899.1Sep. 925.4 174.8 607.7 74.7 19.2 876.4Oct. 875.6 163.9 573.6 71.0 18.7 827.3Nov. 818.0 149.8 535.6 67.3 18.2 770.8Dec. 677.6 120.2 439.7 57.5 16.7 634.12008Jan. 245.4 49.9 134.8 18.9 9.6 213.2Feb. 158.8 29.7 77.8 13.8 8.6 130.0Mar. 121.8 19.4 54.5 11.8 8.2 93.9
1 The denominations of coins consist of Lm1, 50c (cents), 25c, 10c, 5c, 2c, 1c, 5m (mils), 3m and 2m.
End of period Total notes & coins1 Currency notes
EUR millions
€5 €10 €20 €50 €100 €200 €5002008Jan. 6.2 58.5 195.3 102.8 34.6 23.0 13.3 433.6Feb. 3.5 60.8 222.6 122.8 38.8 24.3 16.5 489.2Mar. 1.8 63.4 244.7 137.1 38.5 28.1 19.7 533.3
End of period
Euro banknotes Total
1 This comprises the Bank's share of euro banknotes issued in the Eurosystem, based on the banknote allocation key (in turn reflecting itsshare in the paid-up capital of the ECB) plus excess / shortfall on the banknote allocation key.
EUR millions
1€cent 2€cent 5€cent 10€cent 20€cent 50€cent €1 €22008Jan. 0.1 0.2 0.6 1.4 2.0 3.5 6.1 9.3 23.2Feb. 0.1 0.2 0.6 1.2 1.9 3.3 5.6 9.5 22.4Mar. 0.1 0.3 0.6 1.2 1.9 3.4 5.9 9.9 23.3
Total End of period
Euro coins

CENTRAL BANK OF MALTA Quarterly Review 2008:2
67
Monetary, Banking, Investment Funds and Financial Markets
Table 1.8 Deposits held with other monetary financial institutions by sector1
EU
R m
illio
ns
2003
60.7
193.
960
.061
.097
6.1
5,07
8.8
6,43
0.5
3,16
4.5
5,52
4.1
15,1
19.0
2004
66.5
177.
548
.380
.396
5.6
5,19
9.7
6,53
8.0
3,43
1.5
7,16
0.9
17,1
30.4
2005
118.
314
9.3
49.6
136.
01,
042.
95,
361.
36,
857.
35,
575.
29,
976.
422
,409
.020
0621
8.2
73.5
99.1
89.6
1,11
2.8
5,68
7.3
7,28
0.4
6,68
8.4
12,0
55.0
26,0
23.8
2007
Jan.
216.
475
.911
1.0
85.9
1,16
0.3
5,68
5.9
7,33
5.4
6,97
6.3
12,6
67.3
26,9
79.1
Feb.
230.
361
.811
7.2
87.2
1,15
8.0
5,74
4.5
7,39
8.9
6,84
8.1
12,9
98.7
27,2
45.7
Mar
.22
8.7
61.7
127.
610
2.6
1,14
5.9
5,82
6.7
7,49
3.1
6,93
9.7
13,4
82.1
27,9
15.0
Apr
.16
5.4
66.4
121.
287
.61,
138.
65,
857.
37,
436.
57,
152.
413
,790
.128
,379
.0M
ay21
4.8
80.2
115.
896
.91,
146.
35,
923.
57,
577.
57,
099.
014
,824
.129
,500
.6Ju
ne13
9.9
126.
110
4.7
112.
81,
228.
36,
046.
27,
757.
87,
266.
215
,742
.030
,766
.0Ju
ly16
5.5
104.
510
9.8
117.
41,
322.
46,
147.
27,
966.
77,
309.
716
,065
.431
,341
.8A
ug.
168.
897
.013
0.5
109.
01,
416.
66,
208.
08,
129.
87,
355.
616
,145
.231
,630
.6S
ep.
161.
312
3.7
152.
911
2.6
1,40
9.0
6,25
3.3
8,21
2.9
7,46
5.8
16,1
11.5
31,7
90.2
Oct
.15
3.0
103.
717
9.6
125.
21,
354.
46,
290.
28,
206.
18,
009.
614
,878
.331
,094
.0N
ov.
136.
299
.617
4.3
146.
41,
348.
36,
372.
78,
277.
57,
740.
315
,521
.631
,539
.4D
ec.
126.
810
6.1
198.
613
7.8
1,34
2.5
6,54
1.8
8,45
3.7
8,09
0.1
16,2
39.9
32,7
83.8
2008
Jan.
140.
513
2.2
214.
713
1.2
1,36
5.9
6,57
9.6
8,56
4.2
8,17
6.0
16,2
37.8
32,9
78.0
Feb.
148.
515
3.0
220.
915
2.9
1,39
0.2
6,58
6.4
8,65
1.9
8,80
6.5
15,6
92.8
33,1
51.1
Mar
.13
8.3
201.
121
4.1
132.
41,
397.
96,
617.
98,
701.
68,
712.
015
,333
.432
,747
.0
Dep
osits
hel
d by
non
-re
side
nts
of M
alta
Oth
er e
uro
area
re
side
nts
Non
-re
side
nts
of
the
euro
ar
ea
Hou
seho
lds
&
non-
prof
it in
stitu
tions
Res
iden
t dep
osits
Gen
eral
go
vern
men
t2
Mon
etar
y fin
anci
al
inst
itutio
ns
2 In
clud
ing
the
extra
-bud
geta
ry u
nits
.
Tot
al
depo
sits
To
tal
1 Fo
r the
pur
pose
s of
this
tabl
e, d
epos
its in
clud
e lo
ans
and
uncl
eare
d ef
fect
s.
End
of
Per
iod
Insu
ranc
e co
mpa
nies
an
d pe
nsio
n fu
nds
Oth
er fi
nanc
ial
inte
rmed
iarie
s &
fin
anci
al a
uxilia
ries
Non
-fin
anci
al
com
pani
es

CENTRAL BANK OF MALTA Quarterly Review 2008:2
68
Monetary, Banking, Investment Funds and Financial Markets
Table 1.9 Deposits held with other monetary financial institutions by currency1
EUR millions
2003 5,576.2 244.7 303.3 246.0 60.2 22.4 1,832.6 1,309.4 5,524.1 15,119.02004 5,614.5 259.7 353.1 240.7 70.1 20.4 2,400.7 1,010.4 7,160.9 17,130.42005 5,812.9 288.2 423.5 252.9 79.9 22.9 2,820.1 2,732.2 9,976.4 22,409.02006 6,052.9 434.8 446.3 252.6 93.7 49.4 3,856.3 2,782.8 12,055.0 26,023.82007
Jan. 6,075.3 448.3 448.8 266.4 96.6 47.5 3,992.8 2,936.1 12,667.3 26,979.1Feb. 6,134.6 462.3 445.7 257.5 98.9 45.0 4,045.1 2,758.0 12,998.7 27,245.7Mar. 6,227.0 466.5 381.8 323.6 94.2 44.2 4,132.2 2,763.3 13,482.1 27,915.0Apr. 6,151.1 486.7 357.1 347.0 94.6 47.7 4,220.7 2,884.0 13,790.1 28,379.0May 6,300.0 478.0 376.7 328.4 94.3 43.0 4,383.0 2,673.0 14,824.1 29,500.6June 6,356.8 589.4 298.5 345.5 167.6 43.4 4,555.4 2,667.4 15,742.0 30,766.0July 6,536.4 621.7 378.4 337.3 93.0 50.8 4,888.3 2,370.5 16,065.4 31,341.8Aug. 6,637.7 686.2 376.6 342.5 86.8 50.4 5,161.4 2,143.8 16,145.2 31,630.6Sept. 6,698.0 695.2 378.8 353.9 87.0 47.8 5,364.1 2,053.9 16,111.5 31,790.2Oct. 6,714.7 680.2 395.4 328.1 87.7 48.9 5,556.5 2,404.3 14,878.3 31,094.0Nov. 6,802.7 680.1 383.4 322.4 88.8 46.7 5,368.6 2,325.1 15,521.6 31,539.4Dec. 6,922.6 711.2 380.9 316.5 122.5 35.0 5,465.8 2,589.3 16,239.9 32,783.82008Jan. 7,730.5 386.0 321.3 126.4 5,374.2 2,801.8 16,237.8 32,978.0Feb. 7,753.6 386.6 379.5 132.1 5,631.3 3,175.1 15,692.8 33,151.1Mar. 7,786.9 371.7 423.3 119.8 5,713.2 2,998.8 15,333.4 32,747.0
End of period
MTL2
By non-residents of MaltaBy residents of Malta
MTL2
Other euro area residents
2 Maltese Lira denominated deposits were redenominated as euro deposits from the beginning of 2008.
EUR Other
Total deposits
1 Also includes loans granted to the reporting MFIs.
Non-residents of
the euro areaEUR GBP USD Other

CENTRAL BANK OF MALTA Quarterly Review 2008:2
69
Monetary, Banking, Investment Funds and Financial Markets
Table 1.10 Other monetary financial institutions loans by size class1
Upto€25,000 Over€25,000to€250,000Over€250,000to
€1million Over€1million Total
2003 714.7 1,553.3 876.5 2,437.6 5,582.02004 774.8 1,845.8 1,529.6 5,547.2 9,697.42005 811.9 2,173.4 2,247.7 6,898.6 12,131.62006 1,046.2 2,362.9 2,360.0 9,294.3 15,063.42007
Jan. 1,083.3 2,536.5 2,358.7 9,318.0 15,296.5Feb. 981.6 2,503.8 2,396.8 9,728.5 15,610.6Mar. 1,283.8 2,343.4 1,866.4 11,312.0 16,805.7Apr. 1,110.7 2,623.7 1,842.3 11,431.1 17,007.8May 1,236.1 2,717.6 1,869.7 12,103.0 17,926.5June 1,250.5 2,760.7 1,932.5 12,999.9 18,943.6July 1,104.0 3,168.7 1,920.9 13,137.8 19,331.4Aug. 1,088.2 3,605.9 1,968.4 13,366.8 20,029.4Sep. 1,148.4 3,867.6 2,021.5 13,279.7 20,317.2Oct. 872.1 3,879.2 2,090.1 13,010.8 19,852.1Nov. 1,177.5 3,637.0 2,095.3 13,106.4 20,016.2Dec. 1,138.2 3,143.8 2,865.2 14,036.2 21,183.32008
Jan. 1,110.0 3,022.3 2,677.3 14,802.6 21,612.1Feb. 1,150.5 3,056.5 3,031.8 14,942.1 22,180.9Mar. 1,311.0 3,372.2 2,748.4 14,851.5 22,283.1
2 The euro amounts are approximations.
EUR millions
Size classes 2
1 For the purposes of this classification, these include loans extended to residents and non-residents in both domesticand foreign currencies. Loans exclude OMFIs deposits placed with other OMFIs.
End of period

CENTRAL BANK OF MALTA Quarterly Review 2008:2
70
Monetary, Banking, Investment Funds and Financial Markets
Table 1.11 Other monetary financial institutions loans to residents of Malta by economic activity
EU
R m
illio
ns
Lend
ing
for h
ouse
pu
rcha
se
Con
sum
er
cred
it O
ther
le
ndin
g T
otal
P
ublic
se
ctor
Priv
ate
sect
or
2003
195.
431
5.6
430.
546
8.5
481.
967
1.3
276.
01,
030.
284
.230
6.5
1,42
0.8
367.
752
4.4
4,10
3.3
2004
222.
129
5.7
358.
150
5.5
478.
867
6.2
321.
41,
255.
718
8.4
229.
31,
673.
536
2.0
500.
34,
393.
020
0514
2.3
287.
130
6.2
502.
347
4.8
691.
144
4.2
1,52
1.4
212.
721
4.6
1,94
8.7
427.
640
1.1
4,82
3.2
2006
188.
934
0.7
266.
758
6.4
492.
971
5.0
612.
81,
769.
925
0.4
230.
72,
251.
138
0.7
421.
35,
414.
020
07Ja
n.17
7.6
346.
926
1.5
589.
649
5.8
712.
661
7.0
1,79
1.2
251.
123
4.9
2,27
7.2
391.
141
9.2
5,45
0.1
Feb.
176.
934
7.3
259.
659
1.3
497.
170
5.7
627.
81,
810.
625
1.9
238.
72,
301.
238
9.2
419.
55,
476.
5M
ar.
185.
336
1.3
262.
061
0.7
501.
173
7.0
651.
31,
838.
925
4.5
244.
52,
337.
936
7.2
422.
75,
591.
2A
pr.
174.
734
4.1
265.
660
7.8
500.
373
2.7
662.
41,
857.
625
7.8
246.
32,
361.
737
7.3
399.
15,
627.
3M
ay17
0.5
346.
226
9.1
618.
848
7.8
730.
866
0.2
1,88
0.1
263.
724
9.9
2,39
3.8
379.
839
4.9
5,66
2.0
June
176.
334
1.6
270.
862
5.6
484.
073
7.0
668.
61,
908.
926
8.4
251.
02,
428.
238
1.6
398.
05,
715.
7Ju
ly17
5.5
322.
127
0.0
619.
548
4.1
734.
768
5.4
1,92
8.5
271.
925
7.4
2,45
7.8
362.
240
6.8
5,70
4.5
Aug
.17
7.6
313.
427
1.1
633.
547
0.3
715.
569
0.5
1,94
7.2
276.
925
7.0
2,48
1.1
361.
540
4.2
5,71
0.3
Sep
.17
8.6
313.
127
6.7
644.
846
8.5
743.
270
6.3
1,96
7.3
280.
627
0.6
2,51
8.5
347.
840
5.7
5,79
2.0
Oct
.18
3.4
312.
327
8.6
654.
746
3.3
729.
370
2.1
1,98
1.4
282.
626
9.0
2,53
3.0
349.
340
8.7
5,79
7.3
Nov
.18
7.4
317.
229
3.0
666.
947
2.9
721.
870
7.9
1,99
3.8
284.
927
5.9
2,55
4.6
343.
541
1.8
5,85
3.4
Dec
.19
6.6
322.
630
1.3
677.
547
4.3
732.
372
5.1
2,01
4.9
287.
627
6.1
2,57
8.6
356.
842
1.7
5,94
3.3
2008
Jan.
183.
231
5.3
303.
468
1.7
467.
872
3.1
738.
32,
026.
028
5.7
278.
02,
589.
635
0.3
409.
65,
943.
2Fe
b.17
9.3
317.
030
6.3
680.
446
1.5
721.
975
9.4
2,03
6.8
290.
928
3.2
2,61
0.9
347.
240
4.4
5,97
9.5
Mar
.18
4.8
335.
331
0.9
699.
346
4.0
747.
477
4.5
2,05
6.2
292.
228
4.0
2,63
2.4
332.
340
5.9
6,07
4.9
Tota
l len
ding
to
resi
dent
sE
lect
ricity
, ga
s &
w
ater
su
pply
Tran
spor
t, st
orag
e &
co
mm
unic
atio
n O
ther
2H
otel
s &
re
stau
rant
s
Who
lesa
le
& re
tail
trade
; re
pairs
2 In
clud
es lo
ans
to a
gric
ultu
re a
nd fi
shin
g, m
inin
g an
d qu
arry
ing,
pub
lic a
dmin
istra
tion,
edu
catio
n, h
ealth
and
soc
ial w
ork,
fina
ncia
l int
erm
edia
tion
(incl
udin
g in
terb
ank
loan
s), c
omm
unity
, re
crea
tiona
l and
per
sona
l ser
vice
act
iviti
es a
nd e
xtra
-terri
toria
l bod
ies
and
orga
nisa
tions
.
End
of
Per
iod
Con
stru
ctio
nM
anuf
actu
ring
1 E
xclu
ding
loan
s to
uni
ncor
pora
ted
bodi
es s
uch
as p
artn
ersh
ips,
sol
e pr
oprie
tors
and
non
-pro
fit in
stitu
tions
. Loa
ns to
suc
h bo
dies
are
cla
ssifi
ed b
y th
eir m
ain
activ
ity.
Rea
l es
tate
, re
ntin
g &
bu
sine
ss
activ
ities
Hou
seho
lds
& in
divi
dual
s1

CENTRAL BANK OF MALTA Quarterly Review 2008:2
71
Monetary, Banking, Investment Funds and Financial Markets
Table 1.12 Other monetary financial institutions loans by sector
EU
R m
illio
ns
2003
208.
477
4.6
5.7
8.1
2,57
9.1
1,64
7.9
5,22
3.8
1,11
8.2
3,90
4.7
10,2
46.7
2004
129.
462
5.7
7.3
8.2
2,68
6.8
1,90
3.2
5,36
0.6
1,75
6.2
4,04
4.9
11,1
61.7
2005
123.
564
8.6
16.7
13.3
2,73
8.2
2,16
6.4
5,70
6.7
1,95
5.8
6,37
9.0
14,0
41.5
2006
118.
473
9.4
20.0
14.9
3,09
2.7
2,54
2.9
6,52
8.2
2,34
8.2
8,60
1.4
17,4
77.8
2007
Jan.
120.
884
2.4
19.6
13.9
3,08
9.4
2,56
8.0
6,65
4.0
2,39
1.9
8,91
5.3
17,9
61.2
Feb.
124.
784
8.5
19.6
14.0
3,08
9.2
2,59
1.5
6,68
7.5
2,29
8.7
9,25
6.0
18,2
42.2
Mar
.12
5.6
818.
419
.916
.03,
139.
22,
656.
26,
775.
22,
266.
010
,723
.619
,764
.9A
pr.
119.
270
2.7
23.0
23.7
3,12
5.4
2,67
8.1
6,67
2.0
2,60
2.6
10,7
11.1
19,9
85.7
May
120.
579
5.9
24.5
22.7
3,12
3.5
2,70
8.6
6,79
5.7
2,73
0.7
11,7
65.8
21,2
92.3
June
121.
373
2.8
24.0
33.9
3,13
7.2
2,75
0.2
6,79
9.3
2,48
2.8
13,1
31.5
22,4
13.6
July
121.
181
5.6
23.6
20.8
3,12
0.9
2,78
1.3
6,88
3.4
2,68
8.4
13,1
25.0
22,6
96.9
Aug
.12
3.1
888.
623
.317
.93,
108.
12,
798.
66,
959.
72,
783.
113
,885
.423
,628
.3S
ep.
124.
992
0.2
18.8
18.1
3,17
1.1
2,83
4.0
7,08
7.2
2,94
6.1
14,3
87.7
24,4
20.9
Oct
.12
4.8
879.
119
.218
.93,
160.
62,
852.
17,
054.
72,
596.
114
,041
.923
,692
.7N
ov.
124.
01,
547.
819
.017
.93,
200.
72,
873.
57,
782.
82,
344.
014
,167
.824
,294
.6D
ec.
126.
81,
557.
823
.021
.03,
265.
62,
898.
47,
892.
62,
439.
415
,373
.925
,706
.020
08Ja
n.12
7.2
527.
619
.315
.83,
259.
62,
899.
76,
849.
12,
587.
716
,378
.825
,815
.6Fe
b.11
9.9
532.
221
.815
.33,
267.
42,
927.
76,
884.
42,
777.
116
,677
.626
,339
.0M
ar.
107.
957
7.1
21.5
11.2
3,34
8.2
2,96
0.3
7,02
6.2
2,87
1.0
16,1
78.8
26,0
75.9
Non
-res
iden
ts
of th
e eu
ro
area
Non
-fina
ncia
l co
mpa
nies
Hou
seho
lds
&
non-
prof
it in
stitu
tions
Tota
lO
ther
eur
o ar
ea
resi
dent
s
1 For
the
purp
oses
of t
his
tabl
e, lo
ans
incl
ude
depo
sits
.
End
of
Per
iod
Lend
ing
to re
side
nts
of M
alta
1Le
ndin
g to
non
-res
iden
ts o
f M
alta
Tot
al
lend
ing
Gen
eral
go
vern
men
t2
Mon
etar
y fin
anci
al
inst
itutio
ns
Insu
ranc
e co
mpa
nies
an
d pe
nsio
n fu
nds
Oth
er fi
nanc
ial
inte
rmed
iarie
s &
fina
ncia
l au
xilia
ries

CENTRAL BANK OF MALTA Quarterly Review 2008:2
72
Monetary, Banking, Investment Funds and Financial Markets
Table 1.13 Other monetary financial institutions loans by currency and original maturity to residents of Malta
EU
R m
illio
ns Less
th
an 1
ye
ar
Ove
r 1
year
Less
th
an 1
ye
ar
Ove
r 1
year
Less
th
an 1
ye
ar
Ove
r 1
year
Less
th
an 1
ye
ar
Ove
r 1
year
Less
th
an 1
ye
ar
Ove
r 1
year
Less
th
an 1
ye
ar
Ove
r 1
year
2003
1,04
1.2
1,40
4.6
9.5
82.7
14.9
26.3
194.
51,
439.
60.
510
.01.
12.
190
7.9
65.1
23.8
5,22
3.8
2004
961.
01,
546.
525
.992
.521
.439
.521
3.4
1,67
1.6
0.8
10.6
4.1
2.8
687.
162
.321
.15,
360.
720
0586
0.7
1,56
8.3
17.3
263.
318
.510
.220
4.2
1,94
3.2
1.4
15.0
0.1
2.4
696.
786
.419
.05,
706.
720
0690
5.7
1,68
9.6
69.9
395.
121
.111
.321
8.5
2,28
9.2
2.3
29.6
0.1
3.1
713.
615
6.9
22.1
6,52
8.2
2007
Jan.
892.
21,
697.
868
.439
4.9
24.8
11.2
212.
82,
319.
52.
429
.80.
23.
380
7.7
171.
417
.66,
654.
0Fe
b.87
6.1
1,71
6.2
67.9
394.
723
.211
.121
0.8
2,34
3.6
3.3
29.9
0.6
3.3
815.
217
5.3
16.3
6,68
7.5
Mar
.88
1.1
1,75
2.9
68.7
399.
225
.811
.423
1.8
2,38
7.9
1.5
31.2
0.7
3.1
780.
418
0.6
18.9
6,77
5.2
Apr
.85
7.1
1,73
7.5
73.9
421.
424
.211
.323
3.1
2,40
8.5
1.5
31.2
0.7
3.0
674.
917
7.9
15.8
6,67
2.0
May
839.
31,
757.
569
.741
8.0
27.7
11.2
234.
12,
441.
91.
627
.50.
53.
176
3.2
184.
416
.06,
795.
7Ju
ne84
8.9
1,75
5.5
72.2
413.
136
.111
.223
4.9
2,48
1.3
1.6
28.8
0.5
3.0
703.
817
7.4
30.7
6,79
9.3
July
815.
51,
773.
175
.741
2.6
33.2
10.8
236.
22,
508.
91.
530
.90.
83.
077
8.7
181.
521
.06,
883.
5A
ug.
806.
81,
763.
577
.641
7.8
31.7
10.8
238.
42,
522.
61.
632
.50.
62.
985
5.0
181.
017
.16,
959.
7S
ep.
835.
41,
784.
279
.542
8.2
33.1
10.6
250.
42,
543.
62.
130
.54.
82.
788
1.4
174.
126
.67,
087.
2O
ct.
828.
81,
779.
780
.242
9.0
32.4
10.4
247.
52,
564.
22.
430
.74.
72.
685
1.6
168.
222
.37,
054.
7N
ov.
834.
61,
801.
190
.143
0.8
33.8
10.3
243.
32,
587.
52.
032
.24.
93.
596
8.2
735.
74.
77,
782.
8D
ec.
858.
31,
802.
510
8.1
450.
036
.610
.224
1.5
2,61
6.0
2.0
34.4
1.0
3.5
963.
774
4.6
20.3
7,89
2.6
2008
Jan.
940.
22,
268.
339
.411
.723
9.2
2,65
6.4
0.6
3.5
663.
526
.36,
849.
1Fe
b.92
7.1
2,29
0.7
36.7
13.0
243.
42,
680.
20.
83.
466
6.8
22.4
6,88
4.4
Mar
.96
9.5
2,32
8.6
35.3
14.8
246.
92,
709.
30.
73.
464
7.5
70.2
7,02
6.2
2 Mal
tese
lira
den
omin
ated
loan
s w
ere
rede
nom
inat
ed a
s eu
ro d
epos
its fr
om th
e be
ginn
ing
of 2
008.
Tota
l le
ndin
g
Non
-fina
ncia
l cor
pora
tions
Hou
seho
lds
& n
on-p
rofit
inst
itutio
ns
EU
R
Lend
ing
to re
side
nts
of M
alta
1
Oth
er s
ecto
rs
MTL
2E
UR
Oth
er
Oth
erE
nd o
f pe
riod
1 For
the
purp
oses
of t
his
tabl
e, lo
ans
incl
ude
depo
sits
.
MTL
2E
UR
Oth
erM
TL2
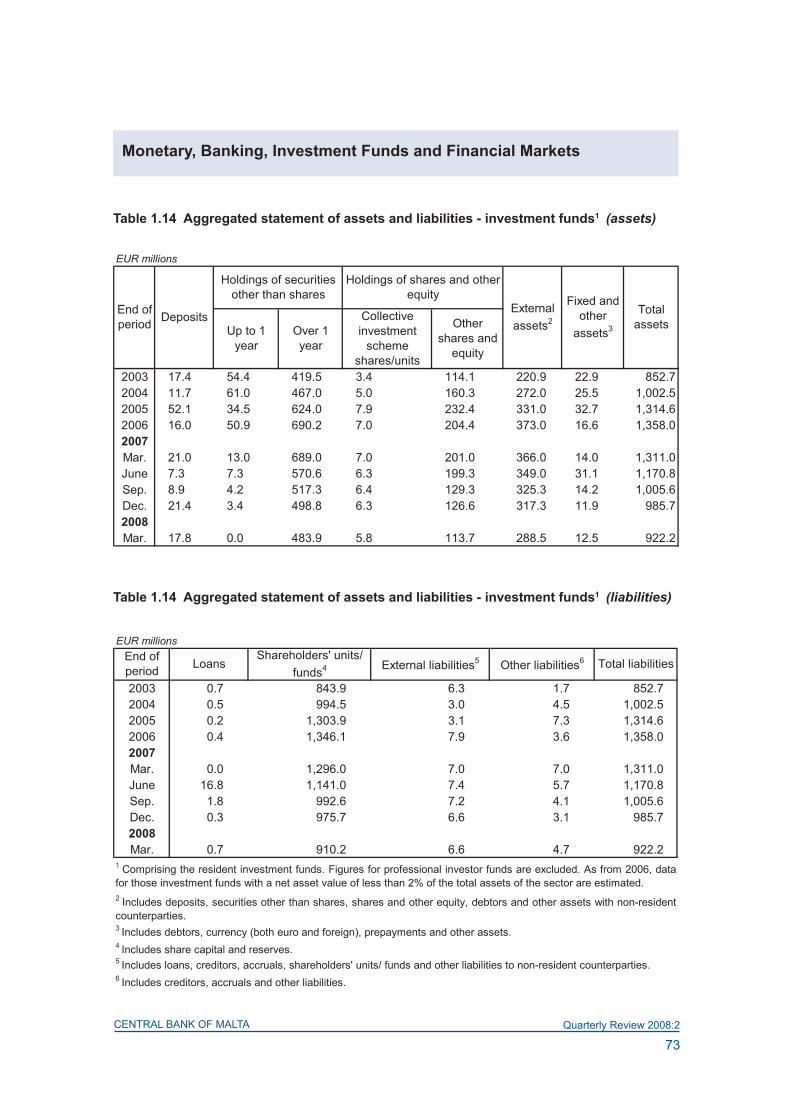
CENTRAL BANK OF MALTA Quarterly Review 2008:2
73
Monetary, Banking, Investment Funds and Financial Markets
EUR millions
2003 17.4 54.4 419.5 3.4 114.1 220.9 22.9 852.72004 11.7 61.0 467.0 5.0 160.3 272.0 25.5 1,002.52005 52.1 34.5 624.0 7.9 232.4 331.0 32.7 1,314.62006 16.0 50.9 690.2 7.0 204.4 373.0 16.6 1,358.02007Mar. 21.0 13.0 689.0 7.0 201.0 366.0 14.0 1,311.0June 7.3 7.3 570.6 6.3 199.3 349.0 31.1 1,170.8Sep. 8.9 4.2 517.3 6.4 129.3 325.3 14.2 1,005.6Dec. 21.4 3.4 498.8 6.3 126.6 317.3 11.9 985.72008Mar. 17.8 0.0 483.9 5.8 113.7 288.5 12.5 922.2
End of period Deposits
Holdings of securities other than shares
Holdings of shares and other equity
External assets2
Fixed and other
assets3
Total assetsUp to 1
yearOver 1 year
Collective investment
scheme shares/units
Other shares and
equity
Table 1.14 Aggregated statement of assets and liabilities - investment funds1 (assets)
EUR millions
2003 0.7 843.9 6.3 1.7 852.72004 0.5 994.5 3.0 4.5 1,002.52005 0.2 1,303.9 3.1 7.3 1,314.62006 0.4 1,346.1 7.9 3.6 1,358.02007Mar. 0.0 1,296.0 7.0 7.0 1,311.0June 16.8 1,141.0 7.4 5.7 1,170.8Sep. 1.8 992.6 7.2 4.1 1,005.6Dec. 0.3 975.7 6.6 3.1 985.72008Mar. 0.7 910.2 6.6 4.7 922.2
1 Comprising the resident investment funds. Figures for professional investor funds are excluded. As from 2006, datafor those investment funds with a net asset value of less than 2% of the total assets of the sector are estimated.
4 Includes share capital and reserves.
Other liabilities6 Total liabilitiesEnd of period Loans
Shareholders' units/ funds4 External liabilities5
5 Includes loans, creditors, accruals, shareholders' units/ funds and other liabilities to non-resident counterparties.6 Includes creditors, accruals and other liabilities.
2 Includes deposits, securities other than shares, shares and other equity, debtors and other assets with non-residentcounterparties.3 Includes debtors, currency (both euro and foreign), prepayments and other assets.
Table 1.14 Aggregated statement of assets and liabilities - investment funds1 (liabilities)

CENTRAL BANK OF MALTA Quarterly Review 2008:2
74
Monetary, Banking, Investment Funds and Financial Markets
Table 1.15 Monetary policy operations of the Central Bank of Malta1
EUR thousands
Amount injected
Amount matured
Amount outstanding
Amount absorbed
Amount matured
Amount outstanding
2003 - - - 2,329 8,197,531 8,196,832 242,954 247,8452004 - - - 13,520 6,282,017 6,476,054 48,917 202,3062005 - - - 26 866,527 930,585 109,015 37,037200� Jan. - - - 531 856,976 731,423 234,568 2,562Feb. - - - 54 1,033,077 985,791 281,854 122,176Mar. - - - 373 1,103,424 1,201,258 184,020 29,816Apr. - - - - 704,868 727,463 161,426 -May - - - 182 692,290 671,791 181,924 2,096June - - - - 1,379,688 1,219,194 342,418 43,093July - - - - 1,392,732 1,411,367 323,783 -Aug. - - - 61 1,487,771 1,392,732 418,821 14,675Sep. - - - 100 1,717,680 1,783,601 352,900 80,363Oct. - - - - 1,341,952 1,339,623 355,229 8,153Nov. - - - - 1,324,948 1,373,399 306,778 37,503Dec. - - - 6,988 1,448,637 1,506,872 248,544 20,4982007 Jan. - - - - 1,082,693 1,034,242 296,995 38,435Feb. - - - - 1,257,862 1,247,147 307,710 21,430Mar. - - - 1,398 1,469,602 1,498,253 279,059 20,266Apr. - - - - 863,965 971,815 171,209 -May - - - - 756,580 769,392 158,397 24,225June - - - - 1,065,455 1,058,467 165,386 191,148July - - - - 903,564 855,812 213,138 16,771Aug. - - - - 1,227,347 1,156,301 284,184 42,860Sep. - - - - 1,121,593 1,092,010 313,767 44,258Oct. - - - - 1,224,319 1,251,572 286,513 16,306Nov. - - - - 1,835,080 1,694,153 427,440 56,441Dec. - - - 466 1,592,127 1,688,097 331,470 81,761
5 The Central Bank of Malta used to provide an overnight deposit facility to credit institutions to absorb temporary liquidityexcesses that could not be taken up by the market.
Period
Liquidity-injection Liquidity-absorption
Reverse repos2 Marginal lending
during the period 3
Term deposits4
Overnight deposits5
1 The information shown in this table represents the position till end-2007. As from January 2008, the Central Bank of Maltaconducts monetary operations as part of the Eurosystem monetary policy operational framework.2 The Central Bank of Malta used to inject liquidity into the banking system through an auction of reverse repos in the event of aliquidity shortage. With effect from 15 September 2005, the maturity period of reverse repos used to be 7 days.3 The Central Bank of Malta used to provide a marginal lending facility to credit institutions in order to satisfy their liquidity needsarising from normal banking business.4 The Central Bank of Malta used to accept placements of term deposits by credit institutions, through auctions, in order to absorbexcess liquidity from the banking system. Up to 14 September 2005 the maturity period of such deposits was 14 days. Thereafterthe maturity period was reduced to 7 days.

CENTRAL BANK OF MALTA Quarterly Review 2008:2
75
Monetary, Banking, Investment Funds and Financial Markets
Table 1.1� Key Central Bank of Malta, European Central Bank and money market interest rates
2008Mar. June Sept. Dec. Mar.
INTEREsT RATEs (%)1
Key ECB interest rates2
Marginal lending facility 3.25 4.50 4.75 5.00 5.00 5.00 5.00Main refinancing operations - minimum bid rate 2.25 3.50 3.75 4.00 4.00 4.00 4.00Deposit facility 1.25 2.50 2.75 3.00 3.00 3.00 3.00
Money market rates (period averages)
Overnight deposit (EONIA) 2.09 2.83 3.69 3.96 4.03 3.88 4.09
Rates for fixed term deposits (EURIBOR)1 month 2.14 2.94 3.84 4.10 4.43 4.71 4.303 months 2.18 3.08 3.89 4.15 4.74 4.85 4.606 months 2.23 3.23 4.00 4.28 4.75 4.82 4.591 year 2.33 3.44 4.11 4.51 4.72 4.79 4.59
Central Bank of Malta2
Central intervention rate 3.25 3.75 4.00 4.25 4.25 4.00Money market intervention rates:
Term deposit rate 3.20 3.70 3.95 4.20 4.20 3.95Reverse repo rate 3.30# 3.80# 4.05# 4.30# 4.30# 4.05#
Rate on standby (collateralised) loans 4.25 4.75 5.00 5.25 5.25 5.00Rate on overnight deposits 2.25 2.75 3.00 3.25 3.25 3.00Remuneration on required reserves 3.00 3.50 3.75 4.00 4.00 4.00
1 End of month rates unless otherwise indicated.2 As from 1 January 2008, the Central Bank of Malta ceased to declare interest rates for its operations. The financial marketinterest rates shown from that date are the key interest rates determined by the ECB for central bank operations throughout theeuro area. Note: # denotes the corridor linked to the central intervention rate.
2005 20062007

CENTRAL BANK OF MALTA Quarterly Review 2008:2
76
Monetary, Banking, Investment Funds and Financial Markets
Table 1.17 other interest rates
2008Mar. June Sept. Dec. Mar.
INTEREsT RATEs (%)1
other monetary financial institutions Weighted average deposit rate 2.13 2.37 2.62 2.77 2.90 3.00 2.96
Current deposits 0.45 0.57 0.69 0.72 0.78 0.78 0.83 Savings deposits 1.17 1.17 1.41 1.62 1.72 1.73 1.67 Time deposits 2.97 3.27 3.51 3.69 3.80 3.96 3.92
Weighted average lending rate 5.51 5.90 6.11 6.34 6.33 6.30 5.96
Non-financial companies 5.99 6.34 6.57 6.81 6.80 6.74 6.28Households and individuals 4.95 5.38 5.54 5.81 5.81 5.80 5.57
Consumer credit 6.70 7.42 7.13 7.82 7.84 7.84 7.65House purchase 4.49 4.95 5.18 5.39 5.39 5.39 5.15Other lending 6.11 6.46 6.66 6.83 6.80 6.74 6.49
government securities Treasury bills (primary market)2
1 month - 3.51 - 4.30 - 4.32 4.18 3 month 3.22 3.91 4.18 4.36 4.37 4.35 4.27 6 month 3.23 4.00 4.24 4.31 4.54 4.54 4.33 1 year 3.22 4.20 - 4.26 4.53 4.39 -
Treasury bills (secondary market) 1 month 3.20 3.75 3.99 4.30 4.33 4.32 4.24 3 month 3.22 3.90 4.18 4.36 4.37 4.35 4.27 6 month 3.27 4.00 4.24 4.47 4.54 4.54 4.33 1 year 3.32 4.20 4.26 4.70 4.61 4.58 4.51 government long-term debt securities 2 year 3.30 4.18 4.32 4.95 4.68 4.54 4.00 5 year 3.65 4.17 4.31 5.03 4.76 4.61 4.06 10 year 4.38 4.33 4.38 5.12 4.85 4.81 4.49 15 year 4.96 4.48 4.54 5.16 5.17 5.10 4.97
MALTA sToCK ExChANgE shARE INdEx 4,981 4,873 4,815 4,809 4,878 4,938 4,6501 End of month rates unless otherwise indicated.2 '-' denotes that no transactions occurred during the reference period.
2005 2006 2007

CENTRAL BANK OF MALTA Quarterly Review 2008:2
77
government Finance
Table 2.1 general government revenue and expenditure1
Table 2.2 general government revenue by main components1
EUR millions
Current Capital Total Current Capital Total
2003 1,640.2 23.6 1,663.8 1,746.3 349.8 2,096.1 -432.2 -282.72004 1,751.1 89.4 1,840.5 1,844.9 203.7 2,048.6 -208.0 -43.92005 1,830.9 173.0 2,003.9 1,909.3 235.9 2,145.1 -141.2 36.62006 1,924.9 169.3 2,094.2 1,991.5 231.8 2,223.4 -129.2 49.62007 2,124.5 67.5 2,192.0 2,085.0 202.7 2,287.7 -95.8 86.32007Mar. 440.7 4.1 444.8 501.0 51.7 552.7 -107.9 -53.9June 502.8 12.4 515.2 503.4 54.1 557.5 -42.3 -9.3Sep. 503.3 19.9 523.2 506.9 44.4 551.3 -28.0 15.2Dec. 677.7 30.9 708.6 573.7 52.6 626.3 82.3 134.32008Mar. 480.1 3.2 483.3 575.0 70.8 645.8 -162.5 -120.6
Deficit (-)/surplus (+)
Primarydeficit (-)/
surplus (+) 2Period
Revenue Expenditure
EUR millions
Direct taxes
Indirect taxes
Social security
contributionsSales Property
income Other Total Capital taxes
Capital transfers Total
2003 519.6 566.1 349.6 82.1 110.0 12.8 1640.2 6.2 17.4 23.6 1,663.8 1441.62004 514.6 651.0 361.3 99.8 98.2 26.2 1751.1 9.4 80.1 89.4 1,840.5 1536.32005 571.5 696.4 386.1 93.6 69.5 13.7 1830.9 17.5 155.5 173.0 2,003.9 1671.52006 599.6 758.1 390.4 95.3 63.2 18.3 1924.9 14.7 154.7 169.3 2,094.2 1762.82007 717.4 793.2 400.5 110.3 77.9 25.3 2124.5 15.7 51.8 67.5 2,192.0 1926.72007Mar. 98.6 182.0 87.3 28.2 38.6 6.0 440.7 3.9 0.2 4.1 444.8 371.8June 166.9 191.4 101.0 31.3 8.5 3.7 502.8 4.1 8.3 12.4 515.2 463.4Sep. 167.9 197.5 91.7 23.8 13.2 9.2 503.3 3.6 16.3 19.9 523.2 460.8Dec. 284.0 222.2 120.5 27.0 17.5 6.4 677.7 4.0 26.9 30.9 708.6 630.82008Mar. 129.7 179.3 87.7 34.0 46.4 3.0 480.1 2.7 0.5 3.2 483.3 399.3
Source: Eurostat; NSO.
2 Deficit(-)/surplus(+) excluding interest paid.3 The fiscal burden comprises taxes and social security contributions.
Capital revenue
Total Memo: Fiscal
burden3
1 Based on ESA95 methodology. Data are provisional.
Period
Current revenue

CENTRAL BANK OF MALTA Quarterly Review 2008:2
78
government Finance
Table 2.4 general government expenditure by function1
Table 2.3 general government expenditure by main components1
EUR millions
2003 647.2 580.3 149.6 220.8 95.6 52.8 1,746.3 206.8 139.4 349.8 2,096.1 2004 658.5 599.0 164.1 249.6 86.0 87.7 1,844.9 177.6 34.8 203.7 2,048.6 2005 668.3 642.2 177.8 240.2 98.8 81.9 1,909.3 233.8 40.8 235.9 2,145.1 2006 678.4 666.0 178.8 293.3 95.9 79.1 1,991.5 211.5 38.6 231.8 2,223.4 2007 703.0 699.0 182.1 302.7 109.1 89.2 2,085.0 214.8 21.1 202.7 2,287.7 2007Mar. 172.4 169.4 53.9 61.9 21.1 22.3 501.0 51.5 3.4 51.7 552.7 June 176.4 184.3 32.9 69.1 24.0 16.7 503.4 70.2 8.1 54.1 557.5 Sep 178.2 166.1 43.2 68.1 26.4 24.8 506.9 43.6 3.4 44.4 551.3 Dec. 176.0 179.2 52.0 103.5 37.7 25.4 573.7 49.4 6.2 52.6 626.3 2008Mar. 190.9 191.4 41.9 92.1 32.3 26.4 575.0 54.0 10.6 70.8 645.8
Total Compensation of employees
PeriodInvestment Capital
transfers Total 2
Current expenditure Capital expenditure
Source: Eurostat; NSO.
Other Total Social benefits Interest Intermediate
consumption Subsidies
1 Based on ESA95 methodology. Data are provisional. 2 Includes acquisitions less disposals of non-financial non-produced assets.
EUR millions
2003 274.1 38.2 76.8 444.5 39.0 64.9 268.9 25.1 268.4 596.2 2,096.1
2004 349.3 44.7 75.1 305.9 42.8 49.8 277.1 27.6 258.1 618.2 2,048.6
2005 324.3 45.1 76.6 307.6 70.4 39.7 312.2 30.3 272.3 666.5 2,145.1
2006 342.5 39.6 76.2 287.5 84.8 41.1 326.8 28.8 282.1 714.1 2,223.4
DefencePublic order & safety
Economic affairs
Environ. protection
Social protection Total
1 Based on Classification of Functions of Government (COFOG). Data are provisional.Source: Eurostat; NSO.
Housing & community amenities
HealthRecreation,
culture & religion
EducationPeriodGeneral public
services

CENTRAL BANK OF MALTA Quarterly Review 2008:2
79
government Finance
Table 2.5 General government deficit-debt adjustment1
Table 2.� general government debt and guaranteed debt outstanding
EUR millions
Currency and
depositsLoans Debt
securitiesShares and other equity
2003 470.2 -432.2 155.0 -53.2 0.0 1.6 -0.2 0.0 -65.3 38.02004 209.5 -208.0 -1.9 -3.0 0.0 0.0 -16.1 -2.9 25.3 1.42005 105.2 -141.2 73.2 0.0 0.0 -58.6 -27.6 0.0 -23.0 -36.02006 -101.3 -129.2 37.3 -2.8 0.0 -222.1 -0.4 -0.1 -42.4 -230.42007 114.8 -95.8 27.2 1.2 0.0 -27.1 -6.2 0.0 24.1 19.1
2 Mainly comprising transactions in other assets and liabilities (trade credits and other receivables/payables).Source: Eurostat.
1 Based on ESA95 methodology. Data are provisional.
Period Change in debt
Deficit (-)/ surplus (+)
Deficit-debt adjustment
Transactions in main financial assetsValuation
effects
Other changes in volume
Other 2 Total
Short-term Long-term Total Short-term Long-term Total
2003 - 541.1 2,112.9 2,654.0 129.0 256.9 385.9 3,039.9 527.22004 - 571.5 2,355.8 2,927.3 84.5 237.5 322.0 3,249.3 609.32005 - 443.1 2,613.6 3,056.7 76.8 221.1 297.8 3,354.5 631.32006 - 373.8 2,617.4 2,991.2 24.2 237.9 262.1 3,253.3 580.72007Mar. - 399.9 2,618.0 3,017.9 25.0 234.5 259.5 3,277.3 560.0June - 457.0 2,695.3 3,152.3 25.0 233.9 259.0 3,411.3 603.8Sep. - 368.2 2,695.3 3,063.5 27.0 234.1 261.1 3,324.6 616.3Dec. - 354.9 2,753.3 3,108.3 24.9 234.9 259.9 3,368.1 628.42008Mar. 23.3 340.6 2,753.4 3,093.9 23.0 233.8 256.7 3,374.0 688.3
EUR millions
PeriodTotal general government
debt 1
Government guaranteed
debt 2
Debt securities Loans
1 In line with the Maastricht criterion, which defines general government debt as total gross debt at nominal value outstanding atthe end of the year and consolidated between and within the sectors of general government. Data are provisional.2 Represents outstanding balances on central government guaranteed debt.
Coins issued
Source: Eurostat; NSO.

CENTRAL BANK OF MALTA Quarterly Review 2008:2
80
government Finance
Table 2.7 Treasury bills issued and outstanding1
OMFIs Others2 Total MFIs Others2 Total
2003 1,660.0 1,415.5 289.8 1,705.3 461.8 79.2 541.1 2004 1,387.7 1,170.0 248.1 1,418.1 466.7 104.8 571.5 2005 1,204.7 831.0 245.3 1,076.3 351.5 91.5 443.0 2006 992.0 522.5 400.2 922.7 249.7 124.2 373.9 2007 Jan. 39.1 7.0 3.3 10.3 247.4 97.6 345.0 Feb. 118.0 113.0 32.7 145.6 281.2 91.5 372.7 Mar. 76.2 88.5 14.9 103.5 330.5 69.4 399.9 Apr. 12.5 38.4 25.9 64.3 364.9 86.8 451.7 May 139.1 62.9 34.2 97.1 322.4 87.2 409.7 June 134.1 136.3 45.2 181.5 363.0 94.0 457.0 July 139.7 75.7 54.6 130.3 349.3 98.3 447.6 Aug. 118.3 44.3 11.6 55.8 284.4 100.7 385.2 Sep. 95.9 60.6 18.4 79.0 261.9 106.3 368.2 Oct. 117.9 114.1 12.8 127.0 315.6 61.7 377.3 Nov. 91.6 66.7 26.7 93.3 299.8 79.2 379.0 Dec. 47.0 16.3 6.7 23.0 278.6 76.3 354.9 2008 Jan. 59.9 0.0 6.1 6.1 231.3 69.8 301.1 Feb. 57.4 45.0 39.8 84.8 247.9 80.6 328.5 Mar. 61.8 41.0 32.9 73.9 232.1 108.5 340.6
1 Amounts are at nominal prices.2 Includes the Malta Government sinking fund.3 On 16 December 1996, the maximum amount of permissible outstanding bills was raised from Lm100 million (€232.9m) toLm200million(€465.9m),andon27November2002thiswasraisedfurthertoLm300million(€698.8m).
EUR millions
End of period
Amount maturing during period
Amount issued in primary market and taken up by Amount outstanding3 and held by
Source: Central Bank of Malta; The Treasury.

CENTRAL BANK OF MALTA Quarterly Review 2008:2
81
government Finance
Table 2.8 Treasury bills issued and outstanding1 (as at end-March 2008)
OMFIs Others2 MFIs Others2
07/03/2008 04/04/2008 4.18 4.23 30.0 21.0 30.0 21.0 51.012/10/2007 11/04/2008 4.57 4.23 39.6 3.3 40.8 2.1 42.918/01/2008 18/04/2008 4.19 4.24 0.0 2.0 0.0 2.0 2.002/11/2007 02/05/2008 4.50 4.25 18.6 1.6 18.7 1.5 20.211/05/2007 09/05/2008 4.26 4.25 1.9 0.0 0.1 1.8 1.908/02/2008 09/05/2008 4.18 4.25 0.0 4.9 0.0 4.8 4.915/02/2008 16/05/2008 4.11 4.25 0.0 10.2 0.0 10.2 10.222/02/2008 23/05/2008 4.13 4.26 10.0 15.7 10.0 15.7 25.731/08/2007 30/05/2008 4.58 4.26 18.6 4.0 18.7 4.0 22.707/12/2007 06/06/2008 4.54 4.26 16.3 6.7 16.3 6.7 23.014/03/2008 13/06/2008 4.17 4.27 3.0 1.4 3.0 1.4 4.420/09/2007 20/06/2008 4.56 4.27 7.0 8.3 7.0 8.3 15.328/03/2008 27/06/2008 4.27 4.27 5.0 3.5 5.0 3.5 8.513/07/2007 11/07/2008 4.53 4.28 0.0 2.2 0.0 2.2 2.212/10/2007 11/07/2008 4.57 4.28 7.0 1.2 7.0 1.2 8.211/01/2008 11/07/2008 4.33 4.28 0.0 0.7 0.0 0.7 0.701/02/2008 01/08/2008 4.27 4.30 18.0 2.6 18.1 2.5 20.609/11/2007 08/08/2008 4.58 4.30 37.3 1.8 37.3 1.8 39.129/02/2008 29/08/2008 4.31 4.31 17.0 6.4 17.0 6.4 23.420/03/2008 19/09/2008 4.33 4.33 3.0 6.9 3.0 6.9 9.911/01/2008 10/10/2008 4.37 4.34 0.0 3.4 0.0 3.4 3.423/11/2007 21/11/2008 4.39 4.39 0.0 0.4 0.0 0.4 0.4
232.3 108.2 232.1 108.5 340.61 Amounts are at nominal prices.2 Includes the Malta Government sinking fund.
Total
Secondary market offer
rate (%)
EUR millions
Source: Central Bank of Malta; The Treasury.
3 On 16 December 1996, the maximum amount of permissible outstanding bills was raised from Lm100 million (€232.9m) to Lm200million(€465.9m),andon27November2002thiswasraisedfurthertoLm300million(€698.8m).
Issue date
Amount issued in the primary market taken up
by
Amount outstanding and
held by Primary market
weighted average rate (%)
Total amount issued /
outstanding3Maturity date
S:\2nd quarter 2008\Statistical Tables\Table 2.8 s

CENTRAL BANK OF MALTA Quarterly Review 2008:2
82
government Finance
Table 2.9 Malta government long-term debt securities outstanding1 (as at end-March 2008)
MFIs Others
7.20 2008 1998 100 4.38 10/06 - 10/12 21.8 1.5 23.37.20 2008 (II) 1998 100 4.40 28/02 - 28/08 54.2 15.7 69.97.00 2009 1999 100 4.46 30/06 - 30/12 0.0 0.2 0.25.90 2009 (II) 1999 100 4.40 01/03 - 01/09 46.5 11.7 58.25.90 2009 (III) 2000/2005 100/107.8 4.57 30/03 - 30/09 142.3 7.5 149.85.90 2010 1999 100 4.28 19/05 - 19/11 31.9 3.0 34.95.75 2010 (II) 2000 100 4.19 10/06 - 10/12 39.5 3.6 43.17.00 2010 (III)2 2000 100 4.20 30/06 - 30/12 0.0 1.3 1.35.40 2010 (IV) 2003/2004 100/104.5 4.19 21/02 - 21/08 55.4 56.4 111.87.50 2011 1996 100 4.42 28/03 - 28/09 18.1 16.9 34.96.25 2011 (II) 2001 100 4.34 01/02 - 01/08 49.6 43.6 93.27.00 2011 (III)2 2002 100 4.45 30/06 - 30/12 0.0 0.3 0.37.80 2012 1997 100 4.45 24/05 - 24/11 35.7 44.6 80.47.00 2012 (II)2 2002 100 4.35 30/06 - 30/12 0.0 0.4 0.45.70 2012 (III) FI3 2005/2007 100/102.75/105.95/
108/108.5/109.74.39 30/03 - 30/09 214.9 140.4 355.2
5.70 2012 (III) FI3 2007 103.85 4.39 30/03 - 30/09 62.0 11.7 73.77.80 2013 1997 100 4.37 18/04 - 18/10 38.1 41.7 79.86.35 2013 (II) 2001 100 4.32 19/05 - 19/11 4.2 56.4 60.67.00 2013 (III) 2003 100 4.39 30/06 - 30/12 0.0 0.2 0.26.60 2014 2000 100 4.42 30/03 - 30/09 2.9 21.6 24.56.45 2014 (II) 2001 100 4.46 24/05 - 24/11 19.3 50.6 69.95.10 2014 (III) 03/04/06/07 100/103.25/
103.64/105.54.44 06/01 - 06/07 51.2 141.0 192.2
7.00 2014 (IV)2 2004 100 4.47 30/06 - 30/12 0.0 4.0 4.06.10 2015 2000 100 4.51 10/06 - 10/12 23.3 46.6 69.95.90 2015 (II) FI3 02/03/07 100/102/105 4.54 09/04 - 09/10 22.5 94.0 116.57.00 2015 (III) 2005 100 4.56 30/06 - 30/12 0.0 0.7 0.77.00 2015 (IV) 2005 100 4.56 03/05 - 03/11 0.0 0.8 0.86.65 2016 2001 100 4.58 28/03 - 28/09 8.2 61.7 69.94.80 2016 (II) FI3 03/04/06 100/101/104 4.61 26/05 - 26/11 48.1 138.2 186.47.00 2016 (III) 2006 100 4.61 30/06 - 30/12 0.0 3.4 3.47.00 2017 2007 100 4.61 18/02 - 18/08 0.0 0.7 0.77.00 2017 (II) 2007 100 4.61 30/06 - 30/12 0.0 10.3 10.37.80 2018 1998 100 4.63 15/01 - 15/07 59.7 103.3 163.16.60 2019 1999 100 4.76 01/03 - 01/09 28.1 74.4 102.55.20 2020 2007 100 4.84 10/06 - 10/12 3.2 23.7 26.95.00 2021 FI/(I)FI3 2004/2005/2007 98.5/100 4.96 08/02 - 08/08 28.1 270.9 299.15.10 2022 2004 100 5.06 16/02 - 16/08 2.6 68.4 71.05.50 2023 2003 100 5.12 06/01 - 06/07 0.5 78.3 78.8
Total 1,111.8 1,649.6 2,761.4
EUR millions
3 Fungible issue. That is, the Accountant General reserves the right to issue, in future, additional amounts of the present stock. In the event ofsuch future issues, these would be amalgamated with the existing stock.Source: Central Bank of Malta; MSE.
Held by Coupon rate (%) Amount Issue price (Lm) Interest dates
1 Amounts are at nominal prices.2 Coupons are reviewable every 2 years and will be set one percentage point less than the normal maximum lending rate allowed at law subjectto a minimum of 7%. Redemption proceeds are payableat€110per€100nominal.
Year of maturity Year of issue
ISMA Yield (%)

CENTRAL BANK OF MALTA Quarterly Review 2008:2
83
government Finance
Table 2.10 Malta government long-term debt securities outstanding by remaining term to maturity1
Table 2.11 general government external loans by currency1 and remaining term to maturity2
EUR millions
Period 1 yr 2-5 yrs 6-10 yrs 11-15 yrs 16 yrs and over Total
2003 103.8 487.8 723.3 630.6 181.3 2,126.82004 128.1 567.9 797.5 627.1 243.0 2,363.62005 103.5 655.5 992.7 463.5 406.1 2,621.32006 163.1 971.8 817.8 592.8 78.8 2,624.32007Mar. 163.1 620.8 1,168.9 522.5 149.8 2,625.0June 81.1 677.8 1,188.0 522.5 233.2 2,702.5Sep. 150.9 963.7 878.6 630.6 78.7 2,702.5Dec. 93.2 1,037.5 889.6 662.5 78.7 2,761.52008Mar. 301.3 829.2 889.6 662.5 78.8 2,761.4
Source: Central Bank of Malta; MSE.
1 Calculations are based on the maximum redemption period of each stock. With respect to the quarterly statistics in this table,the remaining term to maturity classification is applicable as from the end of the reference quarter.
EUR millions
Short-term Long-term Short-term Long-term Short-term Long-term2003 2.0 177.8 1.1 16.4 0.0 3.1 200.32004 1.1 168.6 0.0 12.3 0.4 1.8 184.22005 17.0 142.1 0.0 10.7 0.0 1.6 171.32006 0.0 134.4 1.0 5.6 0.0 1.3 142.32007 0.1 126.6 0.0 3.2 0.0 1.0 131.02007Mar. 0.0 131.8 1.0 5.4 0.0 1.2 139.4June 0.2 130.4 1.0 4.5 0.0 1.1 137.2Sep. 0.2 127.8 0.9 4.1 0.0 1.1 134.1Dec. 0.1 126.6 0.0 3.2 0.0 1.0 131.0
2008 3
Mar. 0.9 123.2 0.0 2.8 0.0 0.9 128.0
2 Including external loans of the extra budgetary units. Short-term maturity refers to loans falling due within 1 year fromthe end of the reference quarter, whereas long-term maturity refers to loans falling due after more than 1 year from the end of thereference quarter.3 Provisional.
End of Period
EUR USD Other foreign currency Total
1 Converted into euro using the ECB official rate as at end of reference period.

CENTRAL BANK OF MALTA Quarterly Review 2008:2
84
Exchange Rates, External Transactions and Positions
Table 3.1a selected Maltese Lira exchange rates1 (end of period closing rates)
Period EUR USD GBP JPY CHF AUD CAD2003 0.4317 2.9197 1.6351 312.16 3.6104 3.8859 3.76922004 0.4343 3.1393 1.6252 321.71 3.5536 4.0301 3.78662005 0.4293 2.7570 1.6012 323.95 3.623 3.7588 3.20722006 0.4293 3.0699 1.5639 364.89 3.7463 3.8869 3.56422007 0.4293 3.4291 1.7082 384.18 3.8544 3.9033 3.36572007Jan. 0.4293 3.0141 1.5458 366.61 3.7784 3.9136 3.5685Feb. 0.4293 3.0788 1.5693 364.14 3.7589 3.9038 3.5954Mar. 0.4293 3.1014 1.5850 366.71 3.7865 3.8397 3.5802Apr. 0.4293 3.1739 1.5908 379.49 3.8331 3.8252 3.5285May 0.4293 3.1375 1.5856 381.37 3.8386 3.7865 3.3910June 0.4293 3.1367 1.5666 385.38 3.8522 3.7065 3.3374Jul. 0.4293 3.1928 1.5700 381.28 3.8484 3.7115 3.3689Aug. 0.4293 3.1898 1.5784 371.23 3.8310 3.8751 3.3678Sep. 0.4293 3.3075 1.6243 380.90 3.8673 3.7474 3.2951Oct. 0.4293 3.3650 1.6244 388.13 3.9065 3.6472 3.2044Nov. 0.4293 3.4399 1.6648 381.24 3.8550 3.8739 3.4283Dec. 0.4293 3.4291 1.7082 384.18 3.8544 3.9033 3.3657
1 All the above exchange rates denote units of foreign currency per one Maltese lira, with the exception of the rateagainst the euro, which denotes units of Maltese lira per one euro.
Table 3.1b selected Maltese Lira exchange rates (averages for the period)1
Period EUR USD GBP JPY CHF AUD CAD2003 0.4261 2.6543 1.6237 307.39 3.5683 4.0806 3.7134 2004 0.4279 2.9061 1.5853 314.19 3.6085 3.9469 3.7801 2005 0.4299 2.8959 1.5910 318.35 3.6015 3.7978 3.5121 2006 0.4293 2.9259 1.5882 340.24 3.6642 3.8828 3.3182 2007 0.4293 3.1920 1.5943 375.51 3.8268 3.8103 3.4224 2007Jan. 0.4293 3.0247 1.5445 364.38 3.7633 3.8665 3.5578 Feb. 0.4293 3.0459 1.5556 367.10 3.7768 3.8928 3.5671 Mar. 0.4293 3.0825 1.5834 361.87 3.7576 3.8930 3.6021 Apr. 0.4293 3.1473 1.5829 373.99 3.8145 3.8074 3.5733 May 0.4293 3.1481 1.5870 380.17 3.8446 3.8158 3.4495 June 0.4293 3.1243 1.5739 383.21 3.8548 3.7114 3.3304 July 0.4293 3.1945 1.5710 388.41 3.8593 3.6835 3.3571 Aug. 0.4293 3.1744 1.5787 370.52 3.8160 3.8298 3.3619 Sep. 0.4293 3.2345 1.6030 371.97 3.8378 3.8320 3.3291 Oct. 0.4293 3.3138 1.6216 384.00 3.8916 3.6882 3.2370 Nov. 0.4293 3.4205 1.6507 379.62 3.8409 3.8135 3.2996 Dec. 0.4293 3.3940 1.6792 380.91 3.8643 3.8898 3.4033
1 Calculated on the arithmetic mean of the daily opening and closing Central Bank of Malta middle rates. All the aboveexchange rates denote units of foreign currency per one Maltese lira, with the exception of the rate against the euro,which denotes units of Maltese lira per one euro.
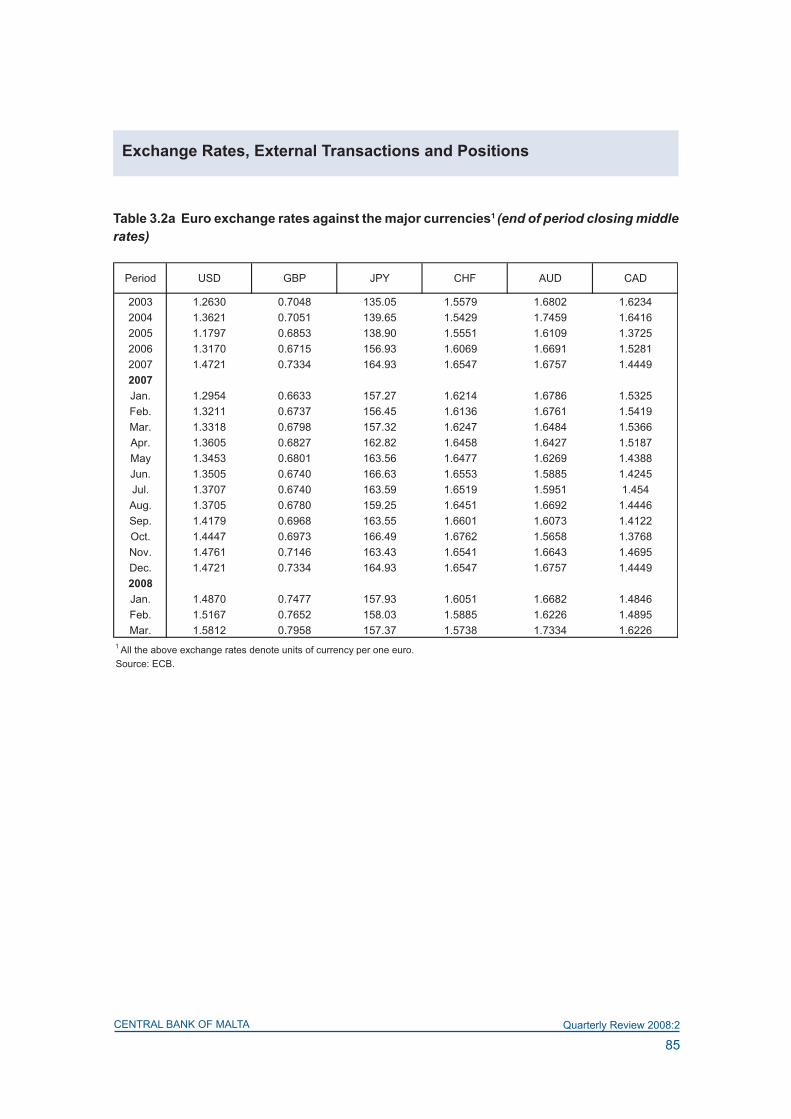
CENTRAL BANK OF MALTA Quarterly Review 2008:2
85
Exchange Rates, External Transactions and Positions
Table 3.2a Euro exchange rates against the major currencies1 (end of period closing middle rates)
Period USD GBP JPY CHF AUD CAD
2003 1.2630 0.7048 135.05 1.5579 1.6802 1.62342004 1.3621 0.7051 139.65 1.5429 1.7459 1.64162005 1.1797 0.6853 138.90 1.5551 1.6109 1.37252006 1.3170 0.6715 156.93 1.6069 1.6691 1.52812007 1.4721 0.7334 164.93 1.6547 1.6757 1.44492007Jan. 1.2954 0.6633 157.27 1.6214 1.6786 1.5325Feb. 1.3211 0.6737 156.45 1.6136 1.6761 1.5419Mar. 1.3318 0.6798 157.32 1.6247 1.6484 1.5366Apr. 1.3605 0.6827 162.82 1.6458 1.6427 1.5187May 1.3453 0.6801 163.56 1.6477 1.6269 1.4388Jun. 1.3505 0.6740 166.63 1.6553 1.5885 1.4245Jul. 1.3707 0.6740 163.59 1.6519 1.5951 1.454Aug. 1.3705 0.6780 159.25 1.6451 1.6692 1.4446Sep. 1.4179 0.6968 163.55 1.6601 1.6073 1.4122Oct. 1.4447 0.6973 166.49 1.6762 1.5658 1.3768Nov. 1.4761 0.7146 163.43 1.6541 1.6643 1.4695Dec. 1.4721 0.7334 164.93 1.6547 1.6757 1.44492008Jan. 1.4870 0.7477 157.93 1.6051 1.6682 1.4846Feb. 1.5167 0.7652 158.03 1.5885 1.6226 1.4895Mar. 1.5812 0.7958 157.37 1.5738 1.7334 1.6226
Source: ECB.
1 All the above exchange rates denote units of currency per one euro.

CENTRAL BANK OF MALTA Quarterly Review 2008:2
86
Exchange Rates, External Transactions and Positions
Table 3.2b Euro exchange rates against the major currencies1 (averages for the period)
Period USD GBP JPY CHF AUD CAD
2003 1.1312 0.6920 130.97 1.5212 1.7379 1.5817 2004 1.2439 0.6787 134.44 1.5438 1.6905 1.6167 2005 1.2441 0.6838 136.85 1.5483 1.6320 1.5087 2006 1.2556 0.6817 146.02 1.5729 1.6668 1.4237 2007 1.3705 0.6843 161.25 1.6427 1.6348 1.4678 2007Jan. 1.2999 0.6634 156.56 1.6155 1.6602 1.5285 Feb. 1.3074 0.6680 157.60 1.6212 1.6708 1.5309 Mar. 1.3242 0.6802 155.24 1.6124 1.6704 1.5472 Apr. 1.3516 0.6793 160.68 1.6375 1.6336 1.5334 May 1.3511 0.6814 163.22 1.6506 1.6378 1.4796 June 1.3419 0.6756 164.55 1.6543 1.5930 1.4293 July 1.3716 0.6744 166.76 1.6567 1.5809 1.4417 Aug. 1.3622 0.6777 159.05 1.6383 1.6442 1.4420 Sep. 1.3896 0.6889 159.82 1.6475 1.6445 1.4273 Oct. 1.4227 0.6961 164.95 1.6706 1.5837 1.3891 Nov. 1.4684 0.7090 162.89 1.6485 1.6373 1.4163 Dec. 1.4570 0.7206 163.55 1.6592 1.6703 1.4620 2008Jan. 1.4718 0.7473 158.68 1.6203 1.6694 1.4862 Feb. 1.4748 0.7509 157.97 1.6080 1.6156 1.4740 Mar. 1.5527 0.7749 156.59 1.5720 1.6763 1.5519
Source: ECB.
1 Calculated on the arithmetic mean of the daily European Central Bank reference exchange rates.
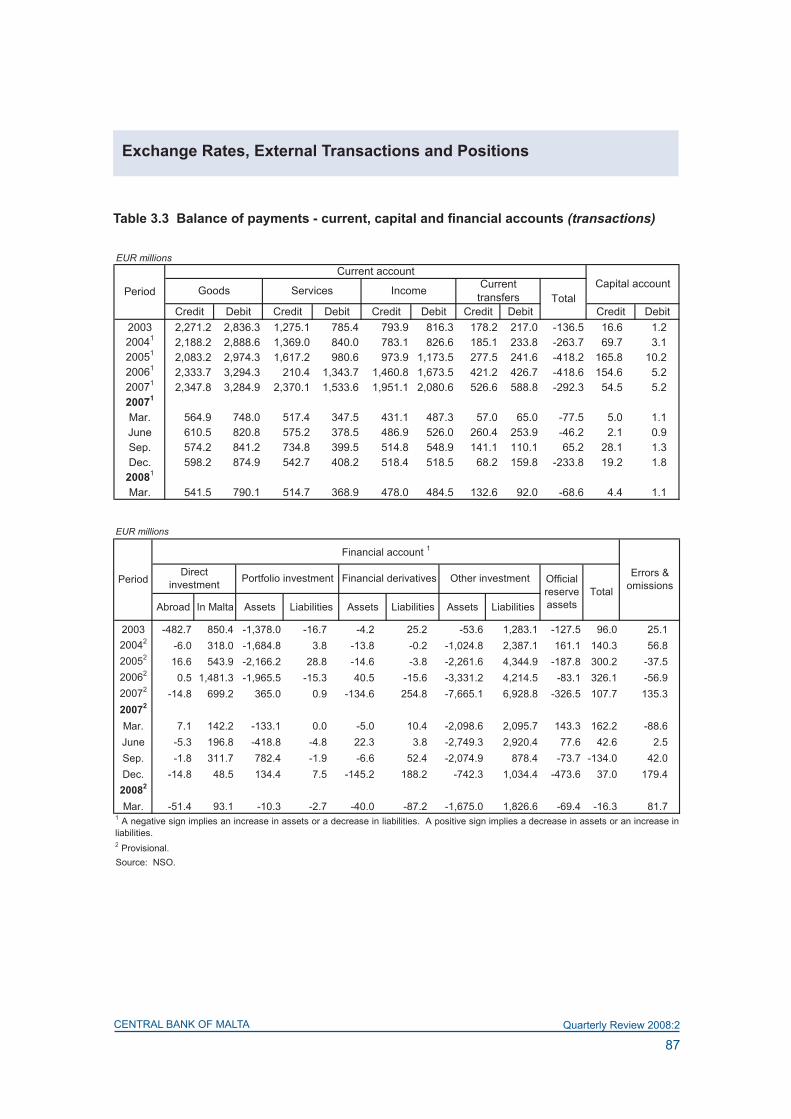
CENTRAL BANK OF MALTA Quarterly Review 2008:2
87
Exchange Rates, External Transactions and Positions
Table 3.3 Balance of payments - current, capital and financial accounts (transactions)
EUR millions
Credit Debit Credit Debit Credit Debit Credit Debit Credit Debit2003 2,271.2 2,836.3 1,275.1 785.4 793.9 816.3 178.2 217.0 -136.5 16.6 1.220041 2,188.2 2,888.6 1,369.0 840.0 783.1 826.6 185.1 233.8 -263.7 69.7 3.120051 2,083.2 2,974.3 1,617.2 980.6 973.9 1,173.5 277.5 241.6 -418.2 165.8 10.220061 2,333.7 3,294.3 210.4 1,343.7 1,460.8 1,673.5 421.2 426.7 -418.6 154.6 5.220071 2,347.8 3,284.9 2,370.1 1,533.6 1,951.1 2,080.6 526.6 588.8 -292.3 54.5 5.220071
Mar. 564.9 748.0 517.4 347.5 431.1 487.3 57.0 65.0 -77.5 5.0 1.1June 610.5 820.8 575.2 378.5 486.9 526.0 260.4 253.9 -46.2 2.1 0.9Sep. 574.2 841.2 734.8 399.5 514.8 548.9 141.1 110.1 65.2 28.1 1.3Dec. 598.2 874.9 542.7 408.2 518.4 518.5 68.2 159.8 -233.8 19.2 1.8
20081
Mar. 541.5 790.1 514.7 368.9 478.0 484.5 132.6 92.0 -68.6 4.4 1.1
TotalGoods Current
transfersPeriod
Current account Capital accountServices Income
EUR millions
Abroad In Malta Assets Liabilities Assets Liabilities Assets Liabilities
2003 -482.7 850.4 -1,378.0 -16.7 -4.2 25.2 -53.6 1,283.1 -127.5 96.0 25.120042 -6.0 318.0 -1,684.8 3.8 -13.8 -0.2 -1,024.8 2,387.1 161.1 140.3 56.820052 16.6 543.9 -2,166.2 28.8 -14.6 -3.8 -2,261.6 4,344.9 -187.8 300.2 -37.520062 0.5 1,481.3 -1,965.5 -15.3 40.5 -15.6 -3,331.2 4,214.5 -83.1 326.1 -56.920072 -14.8 699.2 365.0 0.9 -134.6 254.8 -7,665.1 6,928.8 -326.5 107.7 135.320072
Mar. 7.1 142.2 -133.1 0.0 -5.0 10.4 -2,098.6 2,095.7 143.3 162.2 -88.6June -5.3 196.8 -418.8 -4.8 22.3 3.8 -2,749.3 2,920.4 77.6 42.6 2.5Sep. -1.8 311.7 782.4 -1.9 -6.6 52.4 -2,074.9 878.4 -73.7 -134.0 42.0Dec. -14.8 48.5 134.4 7.5 -145.2 188.2 -742.3 1,034.4 -473.6 37.0 179.420082
Mar. -51.4 93.1 -10.3 -2.7 -40.0 -87.2 -1,675.0 1,826.6 -69.4 -16.3 81.7
2 Provisional.
Portfolio investment Other investment Official reserve assets
TotalFinancial derivatives
Source: NSO.
1 A negative sign implies an increase in assets or a decrease in liabilities. A positive sign implies a decrease in assets or an increase inliabilities.
PeriodDirect
investmentErrors &
omissions
Financial account 1

CENTRAL BANK OF MALTA Quarterly Review 2008:2
88
Exchange Rates, External Transactions and Positions
Table 3.4 Official reserve assets1
Table 3.5 International investment position (IIP) - (end of period amounts)
EUR millions
Currency and deposits
Securities other than
shares
Other reserve assets 2
2003 1.4 35.4 47.8 1,587.7 524.2 3.7 2,200.32004 1.4 35.5 46.5 930.9 1,014.3 0.1 2,028.82005 1.9 38.9 48.8 676.9 1,420.3 2.0 2,188.92006 3.1 39.0 46.2 827.6 1,325.3 -0.6 2,240.62007 8.8 40.8 43.5 1,491.0 966.5 10.8 2,561.42007Jan. 3.2 39.4 46.7 711.1 1,373.3 -5.7 2,167.8Feb. 3.2 39.4 45.8 705.9 1,343.3 3.3 2,141.0Mar. 2.8 39.3 45.7 695.3 1,307.9 4.8 2,095.7Apr. 2.8 38.7 45.0 702.7 1,283.7 4.2 2,077.1May 2.7 39.6 45.2 751.5 1,265.7 -0.8 2,103.9June 2.7 41.2 45.3 682.3 1,238.0 -3.7 2,005.8July 2.7 40.9 45.0 737.6 1,172.7 0.2 1,999.0Aug. 2.7 41.7 45.1 803.4 1,130.5 0.6 2,024.0Sep. 2.9 40.8 44.1 899.3 1,092.1 7.3 2,086.5Oct. 3.0 40.5 43.8 878.5 1,064.2 9.5 2,039.6Nov. 3.0 40.8 43.4 1,481.6 1,026.8 12.5 2,608.0Dec. 8.8 40.8 43.5 1,491.0 966.5 10.8 2,561.4
2008 3
Jan. 3.7 40.8 43.5 152.4 135.1 5.5 380.9Feb. 3.8 40.7 42.7 177.9 132.0 10.4 407.4Mar. 3.5 39.9 41.9 203.9 120.7 22.4 432.4
3 Provisional.
Reserve position in the
IMF
Foreign exchange
Special drawing rights TotalEnd of
periodMonetary
gold
2 Comprising gains or losses on financial derivatives (net).
1 From 2008, official reserve assets correspond to the eurosystem definition of reserves which excludes holdings denominated ineuro and/or vis-à-vis euro area residents. These re-classified assets will appear elsewhere in the financial statement of theCentral Bank of Malta.
Abroad In Malta Assets Liabilities Assets Liabilities Assets Liabilities
2003 736.8 2,617.5 5,600.5 329.1 4.2 25.2 5,803.4 9,589.6 2,200.3 1,783.620041 823.2 2,981.6 7,144.4 354.5 10.7 38.2 6,745.2 11,563.0 2,029.1 1,815.020051 840.4 3,645.7 10,053.8 413.0 42.4 44.3 9,595.6 16,839.5 2,188.9 1,778.92006 1 868.9 4,930.6 11,371.5 407.9 34.5 49.4 12,328.2 19,959.2 2,240.6 1,496.6
1 Provisional.
EUR millions
IIP (net)
Official reserve assets
Portfolio investment
Source: NSO.
Financial derivatives Other investmentsPeriod
Direct investment

CENTRAL BANK OF MALTA Quarterly Review 2008:2
89
Exchange Rates, External Transactions and Positions
Table 3.� gross external debt by sector, maturity and instrument1
Sho
rt te
rmLo
ng
term
Tot
al
(a)
Sho
rt te
rmLo
ng
term
Tota
l (b
)A
ffilia
ted
ente
rpris
esD
irect
in
vest
ors
Tota
l (c)
S
hort
term
Long
te
rmTo
tal
2003
410
.120
3.3
213.
421
4.8
506.
372
1.1
12.1
263.
727
5.8
1,21
0.3
5,51
4.3
3,43
3.1
8,94
7.4
2004
416
.118
6.7
202.
829
1.7
466.
975
8.6
23.1
297.
732
0.8
1,28
2.2
9,46
6.6
1,37
0.2
10,8
36.8
2005
47.
017
3.8
180.
850
2.8
586.
51,
089.
374
.943
9.5
514.
41,
784.
513
,555
.42,
244.
115
,799
.5
2006
47.
614
5.9
153.
548
7.6
549.
31,
036.
972
.381
2.1
884.
42,
074.
914
,114
.44,
880.
018
,994
.5
2007
44.
812
6.9
131.
758
5.4
576.
51,
161.
954
.890
1.3
956.
12,
249.
721
,349
.33,
933.
725
,283
.0
2007
4
Mar
.
4.7
143.
214
7.9
484.
255
6.2
1,04
0.4
68.9
859.
692
8.5
2,11
6.8
16,4
03.4
4,62
1.5
21,0
25.0
June
3.3
140.
814
4.1
502.
355
0.5
1,05
2.8
70.6
863.
493
4.0
2,13
0.9
19,0
50.7
4,86
7.7
23,9
18.4
Sep
.1.
813
7.7
139.
554
5.8
568.
81,
114.
674
.187
7.1
951.
22,
205.
419
,766
.44,
630.
824
,397
.2
Dec
.4.
812
6.9
131.
758
5.4
576.
51,
161.
954
.890
1.3
956.
12,
249.
721
,349
.33,
933.
725
,283
.0
2008
4
Mar
.
3.7
133.
713
7.4
650.
957
8.6
1,22
9.5
58.0
996.
71,
054.
72,
421.
621
,121
.14,
483.
325
,604
.4
4 P
rovi
sion
al.
EU
R m
illio
ns
3 Th
e de
bt o
f the
MFI
s is
fully
bac
ked
by fo
reig
n as
sets
.
End
of
perio
d
Gen
eral
gov
ernm
ent
Tota
l gr
oss
exte
rnal
de
bt
(a+b
+c)
1 Th
ese
data
may
not
be
fully
reco
ncila
ble
with
the
inte
rnat
iona
l inv
estm
ent p
ositi
on (I
IP) s
tatis
tics
prim
arily
due
to c
once
ptua
l diff
eren
ces.
2 C
ompr
isin
g th
e no
n-m
onet
ary
finan
cial
inst
itutio
ns, i
nsur
ance
com
pani
es a
nd p
ensi
on fu
nds,
non
-fina
ncia
l cor
pora
tions
and
the
NP
ISH
.
Oth
er s
ecto
rs2
Dire
ct in
vest
men
t vis
-à-v
is:
Mem
o ite
m: M
FI's
3

CENTRAL BANK OF MALTA Quarterly Review 2008:2
90
Exchange Rates, External Transactions and Positions
Table 3.7 Malta’s foreign trade
EUR millions
2003 2162.4 2984.4 -822.020041 2112.5 3043.1 -930.620051 1959.0 3087.1 -1128.120061 2218.0 3401.3 -1183.320071 2237.1 3458.5 -1221.420071
Jan. 163.3 243.0 -79.7Feb. 160.4 247.4 -87.0Mar. 212.0 289.7 -77.7Apr. 168.7 263.3 -94.6May 205.5 280.4 -74.9June 201.3 307.5 -106.2July 199.3 340.6 -141.3Aug. 167.8 261.0 -93.2Sep. 182.6 267.4 -84.8Oct. 191.4 364.6 -173.2Nov. 194.0 295.2 -101.2Dec. 190.8 298.4 -107.620081
Jan. 179.2 279.1 -99.9Feb. 165.5 265.4 -99.9Mar. 181.9 274.3 -92.4
Source: NSO.
1 Provisional.
Period Balance of trade Exports (f.o.b.) Imports (c.i.f.)

CENTRAL BANK OF MALTA Quarterly Review 2008:2
91
Exchange Rates, External Transactions and Positions
Table 3.8 direction of trade - exports
EUR millions
France Germany Italy Other Euro area Total UK Other
EU Total Asia USA Others
2003 280.5 221.5 72.9 113.4 688.3 253.9 15.8 958.1 576.3 312.8 315.2 2162.420041 328.0 228.3 64.8 86.7 707.7 242.0 67.8 1017.5 544.6 330.3 220.1 2112.520051 284.0 236.4 100.4 92.7 713.5 215.9 75.2 1004.7 460.8 263.7 229.9 1959.020061 326.7 282.9 81.3 125.8 816.7 213.0 82.0 1111.7 631.3 275.5 199.5 2218.020071 271.2 304.9 90.7 131.3 798.1 221.8 86.3 1106.2 669.5 246.7 214.7 2237.120071
Jan. 22.2 26.0 6.7 7.7 62.6 19.6 5.8 88.0 40.0 19.7 15.6 163.3Feb. 19.1 23.0 6.2 9.9 58.2 16.7 6.5 81.4 39.6 21.0 18.4 160.4Mar. 25.6 32.5 8.7 14.4 81.2 22.9 8.1 112.2 55.6 22.7 21.5 212.0Apr. 21.4 24.6 8.1 9.9 64.0 19.3 6.4 89.7 47.4 17.1 14.5 168.7May 24.6 26.2 8.4 12.1 71.3 20.6 9.7 101.6 60.0 22.3 21.6 205.5June 23.3 21.0 8.3 26.4 79.0 16.7 5.1 100.8 59.0 21.3 20.2 201.3July 23.5 30.1 8.8 10.7 73.1 21.1 10.7 104.9 55.2 21.1 18.1 199.3Aug. 19.0 25.7 5.6 8.3 58.6 15.7 6.5 80.8 56.1 17.9 13.0 167.8Sep. 21.4 25.7 8.4 8.4 63.9 17.2 8.9 90.0 60.1 20.4 12.1 182.6Oct. 27.0 26.7 8.5 8.0 70.2 19.2 6.8 96.2 55.7 21.6 17.9 191.4Nov. 21.6 23.7 6.6 9.6 61.5 22.3 5.7 89.5 63.2 19.3 22.0 194.0Dec. 22.5 19.8 6.4 5.8 54.5 10.5 6.2 71.2 77.6 22.3 19.7 190.820081
Jan. 21.3 28.0 12.4 7.8 69.5 16.8 5.0 91.3 47.7 16.6 23.6 179.2Feb. 19.3 23.2 10.5 9.8 62.8 17.1 5.6 85.5 47.5 15.6 16.9 165.5Mar. 19.8 24.5 7.6 7.2 59.1 14.6 5.0 78.7 54.6 26.8 21.8 181.9
TotalEuro area (of which):
EU (of which):
Source: NSO.
All others (of which):
1 Provisional.
Period

CENTRAL BANK OF MALTA Quarterly Review 2008:2
92
Exchange Rates, External Transactions and Positions
Table 3.9 direction of trade - imports
EUR millions
France Germany ItalyOther Euro area
Total UK Other EU Total Asia USA Others
2003 509.9 235.0 685.5 276.0 1,706.5 276.5 37.3 2,020.3 470.1 242.0 252.0 2,984.420041 408.1 265.5 771.0 328.0 1,772.7 367.3 71.0 2,211.0 458.2 162.8 211.0 3,043.120051 291.6 249.9 956.0 335.7 1,833.2 335.9 66.9 2,236.0 417.9 162.4 270.9 3,087.120061 321.5 262.9 964.3 372.9 1,921.7 343.6 70.0 2,335.2 634.9 179.7 251.6 3,401.320071 315.8 289.9 862.5 373.6 1,841.8 497.5 103.0 2,442.3 598.3 206.6 211.3 3,458.520071
Jan. 14.9 23.0 59.7 23.3 120.9 32.2 4.5 157.6 48.2 9.7 27.5 243.0Feb. 23.4 19.0 68.9 27.6 138.9 31.6 8.4 178.9 42.5 11.2 14.8 247.4Mar. 19.7 26.1 84.2 30.7 160.7 33.8 5.7 200.2 56.3 12.3 20.9 289.7Apr. 28.6 22.8 67.8 30.7 149.9 26.5 10.2 186.6 55.5 9.2 12.0 263.3May 28.0 23.5 70.3 29.6 151.4 46.3 7.5 205.2 49.3 7.7 18.2 280.4June 33.2 17.6 79.9 28.1 158.8 43.0 19.5 221.3 41.3 28.4 16.5 307.5July 28.9 25.6 85.7 42.2 182.4 43.0 9.2 234.6 64.5 26.0 15.5 340.6Aug. 30.3 19.5 57.9 29.7 137.4 44.2 7.6 189.2 43.8 9.3 18.7 261.0Sep. 38.9 23.9 58.3 28.4 149.5 43.6 7.2 200.3 46.9 6.8 13.4 267.4Oct. 21.7 28.7 68.9 42.8 162.1 56.7 9.6 228.4 48.8 65.9 21.5 364.6Nov. 26.9 33.7 71.7 30.1 162.4 42.2 7.8 212.4 51.7 9.6 21.5 295.2Dec. 21.3 26.5 89.2 30.4 167.4 54.4 5.8 227.6 49.5 10.5 10.8 298.420081
Jan. 25.4 22.6 68.9 29.2 146.1 38.5 4.3 188.9 58.7 7.5 24.0 279.1Feb. 21.3 26.9 61.0 42.9 152.1 39.0 7.1 198.2 48.8 5.5 12.9 265.4Mar. 21.7 27.0 88.0 31.4 168.1 34.2 4.7 207.0 50.0 6.3 11.0 274.3
Source: NSO.
1 Provisional.
Period Total
EU (of which):
Euro area (of which):All others (of which):

CENTRAL BANK OF MALTA Quarterly Review 2008:2
93
Real Economy Indicators
Table 4.1a gross domestic product, gross national income and expenditure components (at current market prices)
Table 4.1b gross domestic product and expenditure components (at constant 2000 prices)
2003 2,837.3 901.9 861.3 -136.8 4,463.7 3,546.4 3,621.7 -75.4 4,388.4 4,366.0 20041 2,973.8 935.6 841.4 -90.4 4,660.4 3,557.2 3,728.6 -171.5 4,488.9 4,434.6 20051 3,107.2 946.5 926.1 45.3 5,025.0 3,700.3 3,954.9 -254.6 4,770.5 4,552.5 20061 3,205.0 1,020.9 994.4 55.2 5,275.5 4,437.7 4,638.0 -200.4 5,075.1 4,849.8 20071 3,307.6 1,045.1 1,046.2 117.9 5,516.9 4,736.9 4,855.2 -118.3 5,398.5 5,254.3 20071
Mar. 758.6 245.8 247.7 5.3 1,257.4 1,054.7 1,076.0 -21.3 1,236.1 1,178.4 June 807.7 250.9 243.5 63.2 1,365.2 1,185.7 1,199.3 -13.6 1,351.6 1,308.4 Sep. 847.6 260.1 244.0 -0.1 1,351.5 1,309.0 1,240.7 68.3 1,419.9 1,381.4 Dec. 893.8 288.3 311.1 49.5 1,542.6 1,187.6 1,339.2 -151.7 1,390.9 1,386.1 20081
Mar. 798.8 287.1 238.7 57.7 1,382.3 1,072.0 1,141.8 -69.7 1,312.7 1.305.6
Source: NSO.
1 Provisional.2 Consumption by households and NPISH.3 Including acquisitions less disposals of valuables.
External balanceGross
Domestic Product
Gross National Income
Private consumption2
Imports of goods and
services
General government consumption
EUR millions
Exports of goods and services
Net Gross fixed
capital formation
Changes in inventories3 Total
Period
Domestic demand
EUR millions
2003 2,697.5 792.8 796.2 -126.7 4,159.8 3,786.8 3,947.5 -160.7 3,999.2 20041 2,763.4 798.0 770.4 -81.9 4,249.9 3,868.3 4,096.8 -228.5 4,021.4 20051 2,815.3 794.1 834.0 41.4 4,484.8 3,835.6 4,169.9 -334.3 4,150.5 20061 2,833.7 841.5 865.5 49.1 4,589.8 4,219.6 4,518.0 -298.4 4,291.4 20071 2,878.1 840.9 898.3 103.6 4,720.9 4,192.4 4,459.1 -266.7 4,454.2 20071
Mar. 671.9 198.7 215.3 4.7 1,090.7 944.5 999.2 -54.7 1,036.3 June 706.0 201.6 210.5 55.9 1,174.0 1,043.2 1,110.2 -67.1 1,107.0 Sep. 733.4 208.4 207.5 -0.1 1,149.2 1,125.7 1,119.4 6.3 1,155.6 Dec. 766.8 232.1 264.8 43.0 1,306.7 1,072.1 1,238.7 -166.6 1,155.4 20081
Mar. 686.4 224.5 203.8 50.4 1,165.1 902.2 995.2 -92.9 1,072.2 1 Provisional.
TotalExports of goods and services
3 Including acquisitions less disposals of valuables.
2 Consumption by households and NPISH.
Gross fixed capital
formation
Source: NSO.
Period
External balanceGross
Domestic ProductNet
Imports of goods and services
Domestic demand
Private consumption2
General government consumption
Changes in inventories3

CENTRAL BANK OF MALTA Quarterly Review 2008:2
94
Real Economy Indicators
Table 4.2 Tourist departures by nationality1
Thousands
France Germany Italy Other Euro area Total
2005 82.6 138.2 92.4 151.8 465.0 482.6 78.0 1,025.6 145.0 1,170.6 2006 73.4 125.8 112.5 151.1 462.9 431.3 79.3 973.5 150.7 1,124.2 2007 75.1 130.0 113.7 177.8 496.6 482.4 103.5 1,082.5 161.0 1,243.5 2007 Jan. 2.0 4.5 6.8 4.1 17.4 23.1 3.6 44.1 7.6 51.7 Feb. 2.3 6.2 3.9 4.8 17.1 24.4 2.0 43.6 7.0 50.5 Mar. 4.0 10.1 6.3 8.9 29.3 29.3 3.4 62.1 9.2 71.3 Apr. 7.0 11.9 10.5 14.9 44.4 36.6 9.5 90.5 11.3 101.8 May 8.6 10.6 8.4 16.3 43.9 41.3 9.1 94.3 14.8 109.0 June 6.2 11.9 7.3 16.2 41.6 50.0 10.2 101.8 15.6 117.4 July 11.2 10.5 16.8 22.5 61.0 50.9 14.8 126.6 21.1 147.7 Aug. 12.4 12.8 25.3 29.2 79.6 59.3 15.8 154.8 21.6 176.4 Sep. 7.9 14.4 10.9 21.9 55.0 58.1 12.6 125.6 18.1 143.7 Oct. 7.1 19.3 7.5 21.1 55.0 57.5 10.5 123.1 16.9 139.9 Nov. 4.2 11.6 5.2 10.7 31.7 32.9 6.8 71.4 11.1 82.5 Dec. 2.2 6.5 4.7 7.3 20.7 19.0 5.1 44.8 6.7 51.5 2008Jan. 4.4 7.5 8.2 7.9 28.0 22.1 5.5 55.6 8.3 63.9 Feb. 2.8 8.5 5.0 7.7 23.9 22.9 2.6 49.4 8.0 57.3 Mar. 3.9 16.3 11.3 13.3 44.8 31.1 5.1 81.1 9.4 90.5
All others
Source: NSO.
Period
1 Based on the NSO's inbound tourism survey. Data refer to tourist departures by air and sea. Annual figures are not available prior to 2005.
UK
Euro area (of which):
Other EUTotal
EU (of which):
Total

CENTRAL BANK OF MALTA Quarterly Review 2008:2
95
Real Economy Indicators
Table 4.3 Labour market indicators based on administrative records
Number %2 Number %2 Number %2
2003 104.1 41.6 145.7 97.9 40.1 138.0 6.2 6.0 1.5 3.6 7.7 5.32004 103.8 42.0 145.8 97.2 40.4 137.6 6.5 6.3 1.6 3.9 8.2 5.62005 103.0 42.6 145.6 97.2 41.0 138.2 5.8 5.7 1.6 3.7 7.4 5.12006 102.9 43.7 146.6 97.3 42.0 139.3 5.6 5.5 1.7 3.9 7.3 5.020073 102.9 45.0 147.8 97.7 43.4 141.2 5.1 5.0 1.6 3.5 6.7 4.520073 Jan. 103.1 44.4 147.4 97.4 42.7 140.1 5.6 5.5 1.7 3.8 7.3 5.0Feb. 103.1 44.5 147.6 97.6 42.8 140.4 5.5 5.4 1.7 3.7 7.2 4.9Mar. 102.1 44.2 146.3 96.7 42.6 139.3 5.4 5.3 1.6 3.6 7.0 4.8Apr. 102.0 44.2 146.3 96.8 42.8 139.6 5.3 5.2 1.5 3.4 6.8 4.6May 102.1 44.3 146.4 96.9 42.9 139.8 5.2 5.1 1.4 3.2 6.6 4.5June 102.0 44.5 146.5 97.0 43.1 140.1 5.0 4.9 1.4 3.1 6.3 4.3July 102.4 44.8 147.2 97.5 43.3 140.9 4.9 4.7 1.5 3.3 6.3 4.3Aug. 103.4 45.5 149.0 98.5 43.9 142.4 5.0 4.8 1.6 3.6 6.6 4.4Sep. 103.5 45.6 149.1 98.5 43.9 142.4 4.9 4.8 1.7 3.7 6.6 4.4Oct. 103.6 45.8 149.4 98.6 44.1 142.7 5.0 4.8 1.6 3.6 6.7 4.5Nov. 103.8 46.0 149.8 98.8 44.4 143.2 5.0 4.8 1.6 3.5 6.6 4.4Dec. 103.2 45.9 149.0 98.5 44.4 142.8 4.7 4.5 1.5 3.2 6.2 4.120083
Jan. 103.7 46.2 149.9 98.8 44.6 143.4 4.9 4.9 1.6 3.4 6.5 4.3Feb. 103.5 46.2 149.8 98.7 44.7 143.4 4.8 4.6 1.5 3.3 6.3 4.2
2 As a percentage of male, female and total labour supply, respectively.3 Provisional.
Source: ETC.
Thousands
1 Annual figures reflect the average for the year.
Total Period1
Labour supply Gainfully occupied Unemployment
Males Females Males Total Females Total Males Females

CENTRAL BANK OF MALTA Quarterly Review 2008:2
96
Real Economy Indicators
Table 4.4 Labour market indicators based on the Labour Force survey
Table 4.5 Property prices index based on advertised prices (base 2000 = 100)
Number %2 Number %2 Number %2
2003 110.1 49.9 159.9 102.3 45.5 147.8 7.8 7.1 4.3 8.7 12.1 7.62004 110.4 48.9 159.3 103.3 44.5 147.9 7.1 6.4 4.4 9.0 11.5 7.22005 110.5 51.4 161.9 103.4 46.9 150.3 7.1 6.5 4.5 8.8 11.6 7.22006 111.5 52.7 164.3 104.3 48.0 152.4 7.2 6.5 4.7 8.9 11.9 7.32007 111.4 54.9 166.3 104.7 50.7 155.4 6.7 6.0 4.2 7.7 10.9 6.62007Mar. 113.6 51.5 165.2 105.5 47.7 153.2 8.2 7.2 3.8 7.5 12.0 7.3June 110.9 55.8 166.7 104.6 50.9 155.6 6.2 5.6 4.8 8.7 11.1 6.6Sep. 111.0 56.2 167.3 105.0 51.9 156.9 6.1 5.5 4.3 7.6 10.3 6.2Dec. 109.9 56.2 166.2 103.6 52.3 155.9 6.3 5.8 4.0 7.0 10.3 6.22008Mar. 112.8 55.1 167.9 106.7 51.1 157.8 6.1 5.4 4.0 7.2 10.1 6.0
2 As a percentage of male, female and total labour supply, respectively.Source: NSO.
1 Annual figures reflect the average for the year.
Total Males Females Total
Thousands
Period1
Labour supply Gainfully occupied Unemployment
Males Females Males Females Total
Period Total Apartments Maisonettes Terraced houses Others1
2003 129.3 128.2 128.0 130.5 122.82004 155.6 157.0 155.4 151.1 153.82005 170.9 173.7 176.7 188.9 160.32006 177.0 178.3 187.0 196.2 175.02007 178.9 183.3 181.4 205.3 171.9200�Mar. 174.8 174.9 189.4 194.1 177.0June 181.5 180.7 187.2 194.1 185.6Sep. 175.4 179.3 186.3 194.1 168.8Dec. 176.3 178.4 185.3 202.2 168.62007Mar. 180.2 185.2 183.5 198.2 164.5June 181.9 182.6 182.3 210.3 186.8Sep. 177.3 181.7 181.6 210.3 172.7Dec. 176.4 183.5 178.2 202.2 163.82008Mar. 178.8 179.8 181.2 202.1 173.0
1 Consists of town houses, houses of character and villas.Source: Central Bank of Malta estimates.
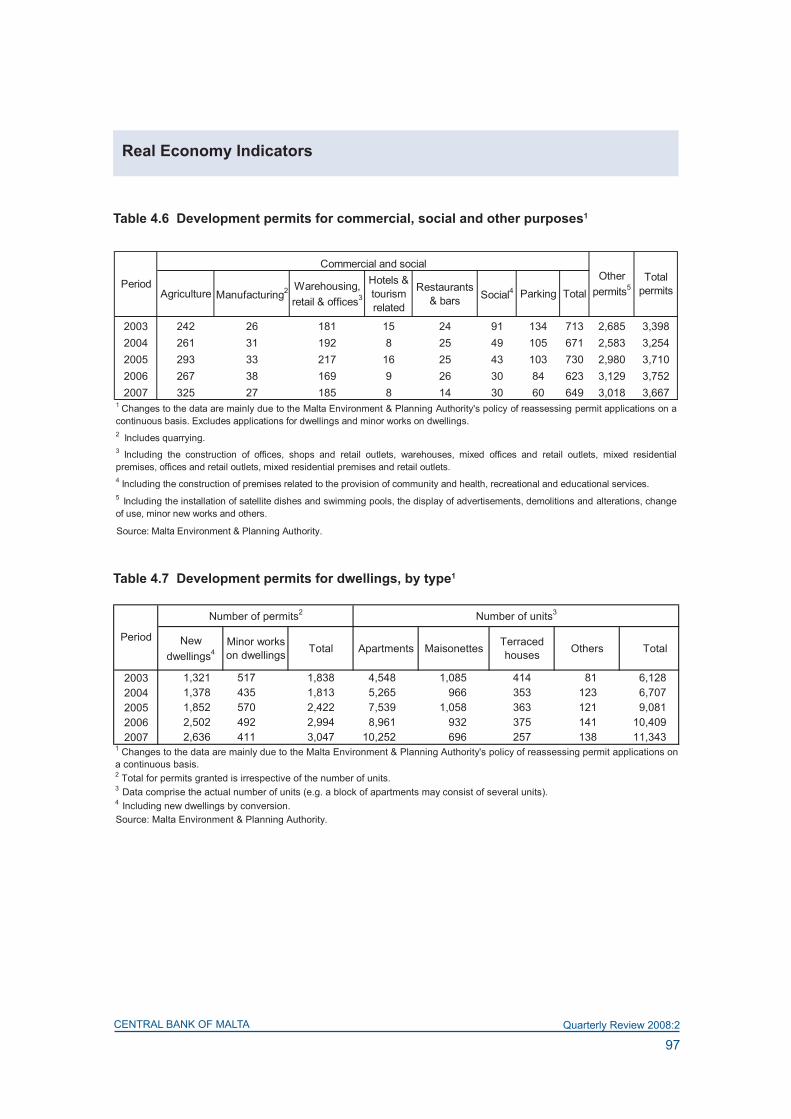
CENTRAL BANK OF MALTA Quarterly Review 2008:2
97
Real Economy Indicators
Table 4.� development permits for commercial, social and other purposes1
Table 4.7 development permits for dwellings, by type1
Agriculture Manufacturing2 Warehousing, retail & offices3
Hotels & tourism related
Restaurants & bars Social4 Parking Total
2003 242 26 181 15 24 91 134 713 2,685 3,3982004 261 31 192 8 25 49 105 671 2,583 3,2542005 293 33 217 16 25 43 103 730 2,980 3,7102006 267 38 169 9 26 30 84 623 3,129 3,7522007 325 27 185 8 14 30 60 649 3,018 3,667
Source: Malta Environment & Planning Authority.
4 Including the construction of premises related to the provision of community and health, recreational and educational services.
3 Including the construction of offices, shops and retail outlets, warehouses, mixed offices and retail outlets, mixed residentialpremises, offices and retail outlets, mixed residential premises and retail outlets.
5 Including the installation of satellite dishes and swimming pools, the display of advertisements, demolitions and alterations, changeof use, minor new works and others.
1 Changes to the data are mainly due to the Malta Environment & Planning Authority's policy of reassessing permit applications on acontinuous basis. Excludes applications for dwellings and minor works on dwellings.
PeriodOther
permits5Total
permits
2 Includes quarrying.
Commercial and social
New dwellings4
Minor works on dwellings Total Apartments Maisonettes Terraced
houses Others Total
2003 1,321 517 1,838 4,548 1,085 414 81 6,1282004 1,378 435 1,813 5,265 966 353 123 6,7072005 1,852 570 2,422 7,539 1,058 363 121 9,0812006 2,502 492 2,994 8,961 932 375 141 10,4092007 2,636 411 3,047 10,252 696 257 138 11,343
Source: Malta Environment & Planning Authority.
3 Data comprise the actual number of units (e.g. a block of apartments may consist of several units). 4 Including new dwellings by conversion.
Period
Number of permits2 Number of units3
1 Changes to the data are mainly due to the Malta Environment & Planning Authority's policy of reassessing permit applications ona continuous basis.2 Total for permits granted is irrespective of the number of units.

CENTRAL BANK OF MALTA Quarterly Review 2008:2
98
Real Economy Indicators
Table 4.8 Inflation rates measured by the Retail Price Index1 (base 1946 = 100)
Year Index Inflation rate (%) Year Index Inflation rate (%)
(continued) 1946 100.00 - 1977 281.84 10.011947 104.90 4.90 1978 295.14 4.721948 113.90 8.58 1979 316.21 7.141949 109.70 -3.69 1980 366.06 15.761950 116.90 6.56 1981 408.16 11.501951 130.10 11.29 1982 431.83 5.801952 140.30 7.84 1983 428.06 -0.871953 139.10 -0.86 1984 426.18 -0.441954 141.20 1.51 1985 425.17 -0.241955 138.80 -1.70 1986 433.67 2.001956 142.00 2.31 1987 435.47 0.421957 145.70 2.61 1988 439.62 0.951958 148.30 1.78 1989 443.39 0.861959 151.10 1.89 1990 456.61 2.981960 158.80 5.10 1991 468.21 2.541961 164.84 3.80 1992 475.89 1.641962 165.16 0.19 1993 495.59 4.141963 168.18 1.83 1994 516.06 4.131964 172.00 2.27 1995 536.61 3.981965 174.70 1.57 1996 549.95 2.491966 175.65 0.54 19972 567.95 3.271967 176.76 0.63 1998 580.61 2.231968 180.42 2.07 1999 593.00 2.131969 184.71 2.38 2000 607.07 2.371970 191.55 3.70 2001 624.85 2.931971 196.00 2.32 2002 638.54 2.191972 202.52 3.33 2003 646.84 1.301973 218.26 7.77 2004 664.88 2.791974 234.16 7.28 2005 684.88 3.011975 254.77 8.80 2006 703.88 2.771976 256.20 0.56 2007 712.68 1.25
2 Following the revision of utility rates in November 1998, the index and the rate of inflation for the year 1997 were revised to567.08 and 3.11% respectively. Consequently, the rate of inflation for 1998 would stand at 2.39%.
1 The Index of Inflation (1946 = 100) is compiled by the NSO on the basis of the Retail Price Index in terms of Article 13 of theHousing (Decontrol) Ordinance, Cap. 158.

CENTRAL BANK OF MALTA Quarterly Review 2008:2
99
Real Economy Indicators
Table 4.9 Main categories of Retail Price Index (based December 2002 = 100)
All
Item
sFo
od
Bev
erag
es&
toba
cco
Clo
thin
g &
fo
otw
ear
Hou
sing
Wat
er,
elec
trici
ty,
gas
& fu
els
H/h
old
equi
p. &
ho
use
mai
nt.
cost
s
Tran
sp.
& c
omm
.
Per
sona
l car
e&
heal
th
Rec
reat
ion
&cu
lture
Oth
er
good
s&
serv
ices
2003
100.
71.
32.
32.
7-6
.42.
20.
0-1
.02.
63.
30.
44.
220
0410
3.6
2.8
0.2
9.2
-2.5
3.8
1.3
2.2
4.0
5.1
1.2
8.0
2005
106.
73.
01.
82.
4-0
.55.
023
.02.
13.
83.
61.
13.
020
0610
9.6
2.8
2.0
2.2
-1.8
4.8
26.0
1.5
3.3
2.9
-0.2
2.3
2007
111.
01.
34.
32.
10.
42.
9-6
.60.
7-1
.11.
71.
60.
420
07Ja
n.10
8.6
2.7
2.2
2.2
-1.4
4.6
24.2
1.4
2.9
2.8
0.0
2.2
Feb.
108.
92.
62.
52.
2-1
.54.
422
.31.
42.
52.
70.
22.
1M
ar.
109.
42.
42.
52.
2-1
.94.
417
.71.
32.
22.
70.
41.
9A
pr.
110.
22.
02.
32.
1-2
.14.
213
.41.
21.
62.
50.
61.
7M
ay11
0.4
1.7
2.3
2.0
-2.6
4.0
9.6
1.0
0.9
2.4
0.7
1.4
June
110.
51.
42.
51.
8-3
.13.
86.
00.
90.
32.
20.
91.
2Ju
ly11
0.7
1.1
2.5
1.8
-3.3
3.6
2.8
0.8
-0.3
2.1
1.0
1.0
Aug
.11
1.0
0.9
2.8
1.8
-3.9
3.5
-0.1
0.7
-0.7
2.0
1.1
0.9
Sep
.11
2.2
0.8
3.2
1.8
-3.4
3.4
-3.0
0.8
-1.3
1.9
1.2
0.7
Oct
.11
3.2
0.8
3.6
1.9
-2.2
3.2
-5.6
0.8
-1.6
1.8
1.4
0.6
Nov
.11
3.5
1.0
3.9
2.0
-0.8
3.0
-6.1
0.8
-1.3
1.8
1.5
0.5
Dec
.11
3.5
1.3
4.3
2.1
0.4
2.9
-6.6
0.7
-1.1
1.7
1.6
0.4
2008
Jan.
112.
41.
44.
72.
31.
02.
9-7
.00.
6-0
.81.
81.
50.
4Fe
b.11
2.9
1.6
5.3
2.3
1.9
2.9
-7.4
0.5
-0.6
1.8
1.4
0.4
Mar
.11
3.7
1.9
5.9
2.4
2.8
2.9
-6.2
0.5
-0.5
1.8
1.3
0.5
1 12-
mon
th m
ovin
g av
erag
e ra
tes
of c
hang
e in
the
RP
I sub
-indi
ces
are
com
pile
d by
the
Cen
tral B
ank
of M
alta
. S
ourc
e: N
SO
.
Per
iod
All
Item
s In
dex
12-m
onth
mov
ing
aver
age
rate
s of
cha
nge
(%)1

CENTRAL BANK OF MALTA Quarterly Review 2008:2
100
Real Economy Indicators
Table 4.10 Main categories of harmonised Index of Consumer Prices (base 2005 = 100)
All
Item
s
Food
& n
on-
alco
holic
be
vera
ges
Alc
ohol
ic
beve
rage
s &
toba
cco
Clo
thin
g &
fo
otw
ear
Hou
sing
, w
ater
, el
ectri
city
, ga
s &
ot
her
fuel
s
Furn
ishi
ngs,
ho
useh
old
equi
pmen
t &
rout
ine
mai
nten
ance
of
the
hous
e
Hea
lthTr
ansp
ort
Com
mu-
nica
tions
Rec
reat
ion
& c
ultu
reE
duca
tion
Res
taur
ants
&
hot
els
Mis
cella
neou
s go
ods
&
serv
ices
2003
94.9
1.9
2.0
1.2
-6.8
1.9
-0.3
5.6
2.1
-0.2
1.3
3.2
7.4
2.3
2004
97.5
2.7
-0.3
13.0
-2.5
2.8
2.8
6.9
4.0
10.2
0.2
3.0
2.6
5.8
2005
100.
02.
51.
81.
8-0
.59.
32.
45.
53.
510
.01.
91.
60.
03.
020
0610
2.6
2.6
2.2
0.6
-1.8
10.6
2.0
4.0
4.2
0.4
0.1
2.6
1.9
2.8
2007
103.
30.
73.
90.
80.
4-0
.10.
82.
7-1
.40.
20.
74.
2-0
.60.
920
07Ja
n.99
.52.
52.
30.
6-1
.410
.01.
93.
93.
60.
20.
42.
61.
82.
8Fe
b.99
.72.
42.
70.
6-1
.49.
41.
83.
82.
90.
20.
62.
71.
52.
6M
ar.
100.
52.
22.
60.
6-1
.98.
21.
63.
82.
50.
30.
92.
71.
52.
5A
pr.
103.
01.
82.
40.
6-2
.16.
81.
53.
51.
80.
30.
82.
90.
92.
3M
ay10
3.8
1.4
2.3
0.6
-2.6
5.6
1.3
3.4
0.9
0.3
0.8
3.0
0.4
2.0
June
104.
01.
12.
40.
5-3
.04.
41.
23.
30.
10.
40.
83.
10.
11.
8Ju
ly
104.
70.
72.
40.
5-3
.33.
41.
03.
1-0
.60.
40.
83.
2-0
.41.
5A
ug.
105.
30.
52.
70.
5-3
.92.
41.
03.
0-1
.20.
41.
03.
3-0
.61.
4S
ep.
105.
80.
42.
90.
6-3
.41.
41.
02.
9-2
.00.
41.
03.
4-0
.91.
2O
ct.
105.
90.
33.
30.
6-2
.20.
50.
92.
8-2
.20.
30.
93.
7-0
.91.
1N
ov.
103.
60.
53.
50.
7-0
.80.
20.
92.
8-1
.80.
30.
84.
0-0
.81.
0D
ec.
103.
70.
73.
90.
80.
4-0
.10.
82.
7-1
.40.
20.
74.
2-0
.60.
920
08Ja
n.10
3.3
0.9
4.4
0.8
1.0
-0.2
0.8
2.7
-10.
50.
34.
5-0
.20.
8Fe
b.10
3.7
1.2
4.9
0.9
1.9
-0.3
0.7
2.7
-0.6
0.7
-0.1
4.8
0.3
0.9
Mar
.10
4.8
1.5
5.6
1.0
2.8
0.1
0.8
2.8
-0.3
0.9
-0.4
5.2
0.7
0.9
Sou
rce:
NS
O, E
uros
tat.
All
Item
s In
dex
12-m
onth
mov
ing
aver
age
rate
s of
cha
nge
(%)
Per
iod

CENTRAL BANK OF MALTA Quarterly Review 2008:2
101
gENERAL NoTEsInordertoreflectMalta’sentryintotheeuroareaandtheadoptionoftheeuroasitscurrencyon 1 January 2008, the layout and design of a number of tables, in particular in Parts 1 and 3,havebeenchangedsignificantly,whileothershavebeenreplacedwithentirelynewtables.Hence users should exercise caution when comparing these series with earlier data, as the underlying definitionsmayhave changed.For easeof comparison, all data relating to earlierperiods presented in this Quarterly ReviewareconvertedintoeuroatthefixedexchangerateofEUR 1 = MTL 0.4293. The reasons for this approach were explained in a note entitled ‘Conversion of data in Maltese liri into euro’ which was published in the 2007:3 issue of the Quarterly Review, while the changes to the underlying concepts were explained in a note entitled ‘Presentation of statistics relating to Malta following adoption of the euro’ which was published in the 2008:1 issue of the Quarterly Review.
PART 1 Monetary, Banking, Investment Funds and Financial Markets
Institutional balance sheets and financial statementsThefinancialstatementoftheCentralBankofMaltapublishedinTable1.1isbasedonaccountingprinciples as established in ECB Guideline 2006/16 (as amended) of 10 November 2006 on the legal framework for accounting and reporting in the ESCB. Consequently, the data in this table may differ from those shown in Table 1.2, which are compiled according to a statistical description of instrument categories as stipulated in ECB Regulation 2001/13 of 22 November 2001. Important changes to data on currency issued and reserve assets following the adoption of the euro are explained below in the ‘measures of money’ and in the ‘external statistics’ section, respectively.
general monetary statistical standardsSince January 2008, the compilation of monetary statistics has been consistent with the statistical concepts and methodologies as set out in ECB Regulation 2001/13 (as amended) concerning the consolidatedbalancesheetofthemonetaryfinancialinstitutions(MFI)sectorandtheEuropean System of Accounts (ESA 1995). Prior to January 2008, the compilation of monetary statistics was broadly in line with the IMF’s Monetary and Financial Statistics Manual (2000).
determination of ‘residence’Monetary data are basedon the classificationof transactionsandpositionsby the residenceof the transactor or holder. A transactor is an economic entity that is capable in its own right of owning assets, incurring liabilities and engaging in economic activities with other entities. The internationally agreed residence criterion for the purposes of statistical compilation is based on the transactor’s ‘centre of economic interest’. The term ‘centre of economic interest’ usually indicates that there exists some location within an economic territory on or from which a unit engages, and intendstocontinuetoengage,ineconomicactivitiesandtransactionsonasignificantscale,eitherindefinitelyoroverafinitebutlongperiodoftime(ayearormore).Transactorswiththeir‘centreof economic interest’ outside the said territory are considered to be non-residents. Diplomatic bodies, embassies, consulates and other entities of foreign governments are considered to be residents of the country they represent.
In national monetary statistics, the key distinction up to December 2007 was between residents and non-residents of Malta. Although that distinction remains relevant for national statistical

CENTRAL BANK OF MALTA Quarterly Review 2008:2
102
purposes, the key distinction now, in particular for the purposes of Malta’s contribution to euro area monetary aggregates shown in Table 1.4 and in other tables, is between residence in Malta or elsewhere in the euro area and residence outside the euro area.
Sector classification In accordance with ESA 95, the main sectors of the Maltese (and euro area) economy, for statistical reporting purposes, are currently subdivided by their primary activity into:
(a) Monetaryfinancialinstitutions(MFIs)(b) Otherfinancialintermediariesandfinancialauxiliaries(c) Insurance corporations and pension funds(d) General government(e) Non-financialcorporations(f) Householdsandnon-profitinstitutionsservinghouseholds(NPISH).
Entitiesthatareconsideredtobenon-residentsareclassifiedinthe‘externalsector’orthe‘restof the world’. As noted above, in many statistical tables in this Quarterly Review, and starting with data for 2008, they are split into other euro area residents and non-residents of the euro area (and maybefurthersub-classifiedbysectoraccordingtotheirprimaryactivity).
(a) Monetary financial institutions (MFIs) consist of:
i. The central bank,which is the national financial institution that exercises control overkeyaspectsofthefinancialsystem,issuescurrency,conductsfinancialmarketoperations,and holds the international reserves of the country. The Central Bank of Malta is part of the Eurosystem, which comprises the ECB and the NCBs of the member countries of the euro area.
ii. Other monetary financial institutions (OMFIs), which in Malta consist almost entirely of credit institutions. The business of OMFIs is to receive deposits and/or close substitutes for deposits from entities other than MFIs and, for their own account (at least in economic terms), to grant credits and/or make investments in securities. Credit institutions licensed in Malta comprise banks licensed by the competent authority under the Banking Act (Cap. 371). In accordance with the Banking Co-ordination Directives of December 1977 and December 1989 (77/780/EEC and 89/646/ EEC), a credit institution is “an undertaking whose business is to receive deposits or other repayable funds from the public - including the proceeds arising from the sales of bank bonds to the public - and to grant credit for its own account”. OMFIs include the Maltese branches and subsidiaries of banks with headquarters abroad.
(b) Other financial intermediaries and financial auxiliaries:
Otherfinancialintermediariesare,broadlyspeaking,financialintermediarieswhicharenotMFIs or insurance corporations and pension funds (see below). The principal activities of these institutionsmay includeoneormoreof the following: long-termfinancing, financialleasing, factoring, security and derivative dealing, receiving deposits and/or close substitutes for deposits from MFIs only (and not from the public), and managing investment trusts, unit trusts and other collective investment schemes (collectively termed investment funds).

CENTRAL BANK OF MALTA Quarterly Review 2008:2
103
Financialauxiliariesarecompaniesthatareprincipallyengagedinauxiliaryfinancialactivities,that is, activities closely related to financial intermediation, but which are not financialintermediariesthemselves.Thefollowingareexamplesofcompaniesclassifiedinthissector:insurance,loanandsecuritiesbrokers,investmentadvisers,flotationcompaniesthatmanageissuesofsecurities,centralsupervisoryauthoritiesoffinancialintermediariesandfinancialmarkets when these are separate institutional units, managers of pension funds and mutual funds and companies providing stock exchange and insurance exchange services.
(c) Insurance corporations and pension funds:
Thissectorcomprisesnon-monetaryfinancialcorporationsprincipallyengagedinfinancialintermediation as the consequence of the pooling of risks. Insurance corporations consist of incorporated, mutual and other entities whose principal function is to provide life, accident, health, fire or other forms of insurance to individual institutional units or groups of units.Pensionfundsprovideretirementbenefitsforspecificgroupsofemployees.
Thenon-monetaryfinancialcorporationsmaybesplit intopublicandprivatecorporations,dependingonwhocontrolsthem.Controloveracompanyisdefinedastheabilitytodeterminegeneral corporate policy by appointing directors or by owning more than half of the voting shares or otherwise controlling more than half of the shareholders’ voting power. In addition, the government may secure control over a company or corporation by a special decree or regulation that enables it to determine corporate policy or to appoint the directors.
(d) general government:
General government includes all institutional units principally engaged in the production of non-market goods and services intended for individual and collective consumption and/or in the redistribution of national income and wealth. Broadly speaking, non-market production meansthattheentitydoesnotcharge“economicallysignificant”pricessuchthatsalescoverat least 50% of production costs. The sector is sub-divided into:
i. Central government, which includes all administrative departments of the state and other central agencies whose competence extends over the whole economic territory of the country.Centralgovernmentthusincludesdepartments,ministries,andofficesofgovernmentlocated in the country together with embassies, consulates, military establishments and other institutions of government located outside the country. Also included in the central government sector are extra-budgetary units, also termed public non-market units. These comprise institutional units under public control that are principally engaged in the production of goods and services not usually sold on a market and/or that are involved in the redistribution of national income and wealth.
ii. other general government, which in Malta comprises the local government sector only. Local government includes administrative departments, councils or agencies whose competence covers only a restricted part of the economic territory of the country.
The public sector (which is not an institutional sector in the ESA 95) comprises the generalgovernmentsectorandpubliccorporations(whichmaybefinancialornon-financialcorporations in the ESA 95), the latter being those companies that are owned by government

CENTRAL BANK OF MALTA Quarterly Review 2008:2
104
or are subject to government control. State-owned corporations are to be distinguished from the extra-budgetary units included in the general government sector, since they are considered to be producing goods and services for the market (i.e. charging “economically significant”pricessuchthatsalescoveratleast50%ofproductioncosts).
(e) Non-financial corporations:
This sector comprises corporations engaged principally in the production of market goods and non-financial services. Included in this sector are market-producing co-operatives,partnerships and sole proprietorships recognised as independent legal entities, which are subdivided into:
i. Public non-financial corporations, i.e. companies that are subject to control by government units-seethenotesonfinancialcorporationsforadefinitionofcontrol.
ii. Private non-financial corporations, i.e. companies that are controlled by non-government units, whether resident or non-resident.
(f) Households and non-profit institutions serving households (NPISH):
This sector comprises individuals or groups of individuals that are consumers and producers ofgoodsandnon-financialservicesexclusivelyintendedfortheirownfinalconsumption.Itincludesalsonon-profitinstitutionsservinghouseholdsprincipallyengagedintheproductionof non-market goods and services intended for particular sections of households (churches, clubs, societies, trade unions, etc.) and market-producing cooperatives, partnerships and sole proprietorships that are not recognised as independent legal entities. Thus many small businesses are included in the household sector.
Classification of economic activitiesTheclassificationofeconomicactivitiesfollowsthestandardsofRegulation(EEC)No3037/90entitled “Nomenclature générale des activités économiques dans les Communautés européennes” (GeneralindustrialclassificationofeconomicactivitieswithintheEuropeanCommunities),knownby the acronym NACE Rev.1.
Measures of moneyUntil the end of 2007, the Central Bank of Malta compiled data on the following monetary aggregates: the monetary base (M0), narrow money (M1), intermediate money (M2) and broad money (M3). The monetary base (M0) consisted of currency in issue and OMFI deposits with the Bank. Narrow money (M1) included the most liquid components of M3, namely currency in circulation, demand deposits and savings deposits withdrawable on demand. Intermediate money (M2) comprised M1, residents’ savings deposits redeemable at notice and time deposits with an agreed maturity of up to and including two years. Broad money (M3) comprised M2 and the OMFIs’ repurchase agreements with the non-bank sector and their debt securities issued with an agreed maturity of up to and including two years and held by the non-bank sector.
Since January 2008, the Central Bank of Malta has been transmitting to the ECB data collected from MFIs in Malta as a contribution to the euro area monetary aggregates compiled by the ECB.

CENTRAL BANK OF MALTA Quarterly Review 2008:2
105
The euro area aggregates are defined in a similar way to theMaltesemonetary aggregatesformerly compiled by the Bank. However it is not possible to calculate the money holdings of Maltese residents within the euro area totals. This is because statistics on currency issued for Malta now show a notional issue of euro banknotes attributed to the Central Bank of Malta according to what is called the banknote allocation key, based on the Bank’s share in the capital of the ECB. This may be quite different from the amount of euro banknotes in the hands of Maltese residents because euro area aggregates include cross-border holdings of monetary instruments within the euro area (in this case, holdings by Maltese residents of deposits and other monetary instruments issued by MFIs throughout the euro area, the amount of which is not known).
In the euro area, by agreement between the members, the share of each central bank in the Eurosystem1 in the total issue of banknotes in the area is deemed to be that central bank’s share in the capital of the ECB adjusted for a notional 8% of the total issue, which is attributed to the ECB itself. This is called the banknote allocation key. In the euro area, the Central Bank of Malta may in practice issue more than this, or less, in response to demand; the excess or shortfall will appear elsewhere in the Bank’s balance sheet as an intra-Eurosystem liability or asset. The main point is that the entry in the column ‘Banknotes in circulation’ in the Financial Statements of the Bank will be a notional amount conforming to the banknote allocation key.
The Quarterly Review Table 1.4b show the contribution of Maltese MFIs to the euro area totals. This comprises the notional issue of euro currency attributed to the Bank according to the banknote allocation key, plus the issue of coins (where the Central Bank acts as agent of the Treasury), and, for 2008 only, remaining amounts of Maltese Lira currency notes outstanding less holdings of euro banknotes and coins and, temporarily, of Maltese Lira currency reported by MFIs in Malta; deposits held by Maltese residents and by residents of other euro area countries with MFIs in Malta excluding any holdings belonging to central governments (since central government holdings of deposits are excluded from the ECB’s monetary aggregates) and any interbank deposits; and any marketable instruments of the kind included in euro area M3 issued by MFIs in Malta less holdings by Maltese MFIs of such instruments issued by MFIs resident anywhere in the euro area. Because Maltese MFIs may hold more of these instruments than they issue, this part of the Maltese contribution to euro area M3 may be negative. Similarly, the ‘credit counterpart’ to euro area M3 contributed by Maltese MFIs (Table 1.5b) comprises all Maltese MFI lending (including through the acquisition of securities in any form) to Maltese and all other euro area residents (other than MFIs). The so-called ‘external counterpart’ will be limited to their net claims on non-residents of the euro area2. ‘Other counterparts (net)’ comprise other items in the balance sheets of Maltese MFIs (including the Central Bank of Malta).
Compilation and valuation principlesMonetary statistics are based on the monthly balance sheets provided by the Central Bank of Malta and the local OMFIs (Tables 1.2-1.3), with details of OMFIs’ deposits and loans in Tables 1.8-1.13. The local OMFIs must submit data to the Central Bank of Malta not later than twelve calendar days following the end of the reporting period. Bank branches and subsidiaries operating inMaltabutwhoseheadoffices/parentcompaniesarelocatedabroadareOMFIsandareobligedtosubmitthesamedata.Thereportinginstitutionscompilemonthlyfinancialinformationinline
1 The Eurosystem comprises the ECB and the national central banks of the other EU Member States in the euro area.2 This is Maltese MFIs’ (including the Central Bank of Malta’s) claims on non-residents of the euro area, minus their liabilities to non-residents of the euro area, in all forms and in foreign currency as well as in euro.

CENTRAL BANK OF MALTA Quarterly Review 2008:2
106
with ECB Regulation 2001/13 (as amended). In addition, in certain instances, the OMFIs are requiredtosubmitreturnsinaccordancewithspecificstatisticalrequirementsasinstructedbytheCentral Bank of Malta.
MFIs report stock positions, which are outstanding balances as at the end of the reference period, and for certain items transactions during the period. They show separately positions and transactions with residents of Malta, with residents of other euro area countries, and with non-residents of the euro area. Assets and liabilities are generally reported at market or fair value and on an accruals basis; deposits and loans are reported at nominal value. Thus, the effects of transactions and other events are recognised when they occur rather than when cash isreceivedorpaid.Transactionsarerecordedatthetimeofchangeinownershipofafinancialasset. In this context, change in ownership is accomplished when all rights, obligations and risks are discharged by one party and assumed by another. Instruments are reported in accordance withtheirmaturityatissue,i.e.byoriginalmaturity.Originalmaturityreferstothefixedperiodoflifeofafinancialinstrumentbeforewhichitcannotberedeemed,orcanberedeemedonlywithsomesignificantpenalty.
Allfinancialassetsandliabilitiesarereportedonagrossbasis.Loans-whichincludeoverdrafts,bills discounted and any other facility whereby funds are lent - are reported gross of all related provisions, both general and specific. Financial assets and liabilities that have demonstrablevalue-aswellasnon-financialassets-areconsideredason-balancesheetitems.Otherfinancialinstruments, whose value is conditional on the occurrence of uncertain future events, such as contingent instruments, are not recorded on the statistical balance sheet.
Release of monetary statisticsMonetary aggregates for the euro area are published by the ECB on the 19th working day of the month following the reference month. The ECB publishes certain more detailed monetary data on a quarterly basis. The Maltese contribution to the monthly aggregates is then posted on the Central BankofMalta’swebsite.Whenfirstpublished,monetarystatisticsareconsideredprovisionalsincethe Bank may need to revise the data referring to the periods prior to the current reference period arisingfrom,forexample,reclassificationsorimprovedreportingprocedures.TheECBacceptsrevisions to the previous month’s data with each monthly submission; revisions to earlier periods are normally submitted with the next provision of quarterly data. Malta’s contributions to the euro area aggregates published by the Central Bank of Malta must be consistent with the latest euro area aggregates published by the ECB. Subsequently, such provisional data are released to the press by the Central Bank of Malta on a monthly basis and in more detail in the Central Bank of Malta’s Quarterly Review and Annual Report. The statistics released in the Quarterly Review and Annual Report are generally considered to be final.Major revisions to the data are alsohighlighted by means of footnotes in these publications. When major revisions to the compilation methodologyarecarriedout,theBankreleasesadvancenoticesinitsofficialpublications.
Financial market interest ratesUp to 31 December 2007, the Table entitled ‘Financial Markets’ showed the statutory interest rates determined by the Central Bank of Malta and other indicative benchmark money market rates on instruments denominated in Maltese Liri as end-of-period rates and as a percentage per annum. The repurchase agreement/term deposit rates were the rates actually dealt in at the end

CENTRAL BANK OF MALTA Quarterly Review 2008:2
107
of the month or the rates offered by the Central Bank of Malta. The interbank market offered rates weretheratesprevailinginthelastdealingsbetweenbanksintheofficialinterbankmarketduringthe last month of the period being reported on. When no deals were transacted, the Central Bank ofMaltafixingrateaveragewasshown.
As from 1 January 2008, the Central Bank of Malta ceased to declare interest rates for its operations as the Maltese money market became part of the integrated euro area-wide interbank market.Thus,asfromthatdate(andwithsomeearlierdataforconvenience),thefinancialmarketinterest rates shown in Table 1.16 are the key interest rates determined by the ECB for central bankoperations throughout theeuroarea,andovernight (EONIA)andfixed-term(EURIBOR)rates on wholesale business in euro-denominated deposits as reported daily by a panel of active institutions in the euro area interbank market. Table 1.17 shows the weighted average rates paid on resident current, savings and time deposits by MFIs in Malta (in Maltese Liri to end-2007, in euro since), calculated by multiplying each amount by the different rates on each type of deposit and dividing by the total amount of each type of deposit. The weighted average rate on time deposits is calculated on all time deposits. The weighted average lending rate is calculated by multiplying the amount of each loan extended to residents by the interest rate applied thereto and dividing by the total amount.
Yields on Treasury bills and government securities up to end-2007 are rates on instruments denominated in Maltese Liri. All outstanding Treasury bills and government securities denominated in Maltese Liri were redenominated in euro at the beginning of 2008. The primary market rates on Treasury bills are the weighted averages of the rates attached to the bills that are taken upbybiddersattheweeklyauction.Treasurybillsareclassifiedbyoriginalmaturity.A“-”signmeans that no transactions occurred during the reference period. Until end-2007, the secondary market yields represented the selling rates quoted by the Central Bank of Malta at the end of the reference period for each respective tenor.
Interest rates on Malta Government long-term debt securities represent average International Securities Market Association (ISMA) redemption yields on applicable stocks with the periods specified referring to the remaining term tomaturity. ISMA yields are quoted on the basis ofan annual compounding period, irrespective of how many coupon periods per annum the stock has. The MSE share index is based on the last closing trade prices of the shares of all eligible companies weighted by their current market capitalisation. The index has a base of 1,000 on 27 December 1995.
Investment fundsThe investment funds sector consists of collective investment schemes licensed by the MFSA; the data in Table 1.14 exclude professional investor funds and money market funds. The balance sheet is aggregated, not consolidated, and therefore includes, among the assets and liabilities, holdings by investment funds of shares/units issued by other investment funds.
Part 2 government FinanceTables in this section show the general government fiscal position compiled on the basisof ESA 95 methodology. The data are consolidated between the sectors of government. Thesources for suchdataare theNSOandEurostat.Governmentexpenditure classifiedby function (Table 2.4)isbasedontheOECD’sClassificationoftheFunctionsofGovernment

CENTRAL BANK OF MALTA Quarterly Review 2008:2
108
(COFOG),whichisaclassificationofthefunctions,orsocio-economicobjectives,thatthegeneralgovernment sector aims to achieve through various outlays.
Table 2.5 on the general government deficit-debt adjustment (DDA) shows how the generalgovernmentdeficitisfinancedandconsiderstherelationshipbetweenthedeficitandMaastrichtdebt. TheDDA thus reconciles the deficit over a given periodwith the change inMaastrichtdebt between the beginning and the end of that period. The difference is mainly explained by governmenttransactionsinfinancialassets,suchasthroughprivatisationreceiptsortheutilisationof its deposit accounts, and by valuation effects on debt.
Thegeneralgovernmentdebtisdefinedasthetotalgrossdebtatnominalvalueoutstandingatthe end of a period and consolidated between and within the various sections of the government. Also shown are data on debt guaranteed by the government (Table 2.6), which mainly relate tothedebtsofnon-financialpublicsectorcorporations.Government-guaranteeddebtexcludesguarantees on the MIGA and IBRD positions and government guarantees on foreign loans taken by the Central Bank of Malta on behalf of government, which loans already feature in the calculation of government external debt. Government-guaranteed debt includes guarantees on loans taken by, or granted by, the extra-budgetary units. The methodology underlying the compilation of data on the external loans of general government is generally consistent with the standards of the World Bank’s Debtor Reporting System (DRS). The data refer to external loans with an original maturity of one year and over. Debt is recognised when disbursement of funds is effected. Data on debt denominated in other currencies are converted into euro using end-of-period exchange rates.
Part 3 Exchange Rates, External Transactions and PositionsUp to end-2007, statistics on exchange rates showed the end-of-period and average exchange rates of the Maltese Lira against other currencies. The Maltese Lira average exchange rates were calculated as the arithmetic mean of the daily opening and closing Central Bank of Malta middle rates in the reference period.
From 2008, statistics on exchange rates (Tables 3.2a-3.2b) show the end-of-period and the average bilateral exchange rates of the euro against other selected major currencies.
Theconceptsanddefinitionsusedinthecompilationofbalanceofpaymentsandinternationalinvestment position (IIP) statistics (Tables 3.3-3.5) are generally in line with the IMF Balance of Payments Manual (BPM5) and in accordance with ECB Guideline 2004/15 (as amended). Credit entries are recorded for e.g. exports, income receivable, and financial transactions reflectingreductions in the economy’s foreign assets or increases in its foreign liabilities. Conversely, debitentriesarerecordedfore.g.imports,incomepayable,andfinancialtransactionsreflectingincreases in assets or decreases in liabilities. The concepts of economic territory, residence, valuation and time of recording are broadly identical to those used in the compilation of monetary statistics. The IIP statistics are based on positions vis-à-vis nonresidents of Malta and are, in most cases, valued at current market prices. Wherever possible a distinction is made between transactions and positions with residents of other euro area countries and those with non-residents oftheeuroarea.Uptotheendof2007,officialreserveassets(Table3.4)comprisedgold,claimson the IMF, and liquid claims held by the Central Bank of Malta on entities resident outside Malta, mainly central banks, other banks and governments, in line with the IMF’s Balance of Payments

CENTRAL BANK OF MALTA Quarterly Review 2008:2
109
Manual(BPM5).From2008,officialreserveassetscorrespondtothepartofthereserveassetsoftheEurosystemheldbytheCentralBankofMalta,andareconfinedtogold,claimsontheIMF,and liquid claims held by the Central Bank of Malta on entities resident outside the euro area and denominated in currencies other than the euro. All euro-denominated assets, and assets denominated in any currency representing claims on entities resident in the euro area held by the Bankandclassifiedasofficialreserveassetsuptotheendof2007,wereonMalta’sentryintotheeuroareareclassifiedasportfolioinvestmentorotherinvestment,dependingonthenatureof the instrument.
Latest trade data are based on the respective NSO press release. Historical data are updated by the Central Bank of Malta on a monthly basis, going back thirteen months, while every calendar quarter data are revised going back three years.
The concepts used in the compilation of gross external debt generally comply with the IMF’s “External debt statistics – guide for compilers and users”. Such data may not be fully reconcilable with the data shown in the IIP primarily due to some conceptual differences. The external debt of the MFIs is being shown separately as a memorandum item as such debt is fully backed by foreign assets of these institutions.
Part 4 Real EconomyNational accounts and other general economic statistics are mostly produced by the NSO in accordance with ESA 95 standards except for the labour market indicators in Table 4.3, which are based on the ETC’s administrative records, and the RPI (Tables 4.8-4.9). Data on development permits (Tables 4.6-4.7) are taken from the Malta Environment and Planning Authority (MEPA).
Labour market statistics comprise those compiled on the basis of the NSO’s Labour Force Survey (LFS) and the ETC’s administrative records. The LFS is based on a random sample of private households using concepts and definitions outlined by Eurostat according to methodologiesestablished by the International Labour Organisation (ILO). From March 2004, data are based on a weekly survey carried out throughout the reference quarter; from June 2005 data are weighted usinganewprocedureandarethusnotstrictlycomparablewithearlierfigures.Thelabourmarketdata based on the administrative records of the ETC represent a measure of the gainfully occupied populationusinginformationobtainedfromtheengagementandterminationformsfiledwiththeETC itself. ETC data on unemployment are based on the number of persons registering for work under Parts 1 and 2 of the unemployment register.
The RPI covers all monetary consumption expenditure incurred by Maltese residents weighted according to the spending pattern derived from the Household Budgetary Survey 2000/1. The HICP,bycontrast,(Table4.10)coversallhouseholdfinalconsumptionexpenditureirrespectiveof nationality or residence status.
Consequently, the HICP uses weights that cover not only resident private and institutional household expenditure but also expenditure by tourists in Malta. The differences in these weighting schemes account for thesignificantmonthlydisparitiesbetween theRPIand theHICP.Thesourcesofdata used in the compilation of the Central Bank of Malta’s property prices index (Table 4.5) are the advertisements for the sale of properties in all localities in Malta and Gozo carried in the property section of a local Sunday newspaper. Data for a particular quarter are derived from

CENTRAL BANK OF MALTA Quarterly Review 2008:2
110
thenewspaperspublishedonthefirstSundayofeachmonthofthatquarter.Thepropertytypesincludeflatsandmaisonettes,bothinshellandinfinishedform,togetherwithterracedhouses,townhouses, houses of character and villas. Indices for each property type are derived on the basis of median prices weighted by the number of observations in each property category. The overall index is a Fischer chained index, calculated as the square root of the product of the chained Laspeyres and the chained Paasche indices. Annual data are derived as an average of the quarterly indices. Prices of commercial properties are excluded from the index.