QUARTERLY REPORT Q4 2017€¦ · · 2018-02-13Please find below the summary of fourth quarter of...
12
QUARTERLY REPORT Q4 2017 Wroclaw, 02/13/2018
Transcript of QUARTERLY REPORT Q4 2017€¦ · · 2018-02-13Please find below the summary of fourth quarter of...

QUARTERLY REPORT Q4 2017
Wroclaw, 02/13/2018

THE MANAGEMENT BOARD`S LETTER
Dear Shareholders,
Please find below the summary of fourth quarter of 2017 in a form of short letter highlighting only the most important business aspects of our Capital Group.
Sales activities in the reported period were specifically important, with record number and value of negotiated contracts. Unfortunately, all of major sales projects which we and our Customers planned to close last year, were moved to first months of 2018. One of the examples that which has already materialized was a breakthrough contract with HDI Sigorta (Talanx Group) reported in the second half of the January with an ESPI 2/2018 report. In the very near future we expect to announce another wins that we worked on during 2016 and 2017.
Intensive activity in the insurance sector has generated results which are mutually significant for the business. The DataWalk system was tested with several customers during pilot engagements and used in full production in Warta (Talanx Group), in each case generating quantifiable benefits. As a reminder, we’ve started our work in the insurance sector with projects aimed on a sub-process of the claims liquidation process: detection and prevention of frauds. With each new project, our trendsetting customers were discovering new applications of our system, widening it’s usage on additional parts of the claim liquidation process and other related processes. An example is analyzing their sales network in the context of eliminating abuses and promoting these microchannels that generate the best growth and margin through low burden of losses.
During one of the recent pilot implementations of DataWalk we were able to help our customer identify and confirm improprieties responsible for tens of millions of zlotys annual margin, with only part of this value coming from anti-fraud. Most of this business case was built on an identification of inefficiencies in their claim liquidation process, which is responsible for approximately 70% of the costs in the standard business model in European insurance. We’re preparing to publish very positive results of DataWalk production usage in Warta, and we expect that this will allow us to achieve an expanded market positioning in the insurance sector. Our contract with HDI Sigorta, won as a result of execution of pioneer implementation executed mostly remotely, is proof confirming that a sales approach focused on generating value for customers is working for us. We have won against competitors including the largest global vendors, offering both Turkish references, local marketing-sales-engineering resources and traditional system architecture with an inelastic approach to link analysis. As part of the engagement with HDI Sigorta we were able to test for the first time a new technique of DataWalk usage, enabling identification of organized crime groups with advanced graph theory, and results we have achieved with the customer are very promising.
The fourth quarter was also very busy for our US subsidiary. We’ve started the process of building the sales funnel with trendsetting customers and effects of that will be reported separately.
In regards to the second area of our focus: law enforcement and intelligence, building the business relationships with entities from this sector requires from us undergoing a number of certifications and verification processes by different agencies both in US and Poland.In the fourth quarter of last year we successfully passed several independent processes in this matter. A new opportunity for forming partnerships, that in some cases became a necessity, has emerged. As a result we have started a partner program in order to team up with system integration companies which have experience in the public sector and are interested in joint-offering with us to the law enforcement and intelligence community. Our objective is to identify and sign up partners-trendsetters, enabling a young high-tech company participation in the most important government projects. Utilizing relationships and the position of our international expert Chris Westphal, we’ve signed our first partner contracts and as a result we’ve started work on multiple new sales projects within our Capital Group. As to financial context of our development, we’ve closed a financing round of 12 million zlotys ($3,5M) in the reported quarter, by issuing shares to a narrow group of two institutional funds and two private investors – Kirk Bradley and Chris Westphal. Objectives of this A2 round (A round extension) were to increase equity of our Company in order to offer sense of security and stability to our current and future customers, as well as to plan the moment of B round execution to a time, when we close future, strategical sales projects, including a first commercial customer in US. Summarizing year 2017, it was a busy time of proving business effects of our cooperation with our first customers. We have confirmed commercial applications of the DataWalk system, acquired the first

patents and built a product which we continue to develop in order to offer value more than 10 times higher than alternatives. Time of starting to scale our operations is coming soon. We’re foreseeing that 2018 will be a breakthrough year for our Capital Group, measured by new customers and effects of our system usage directly influencing growth of international security. Thank you for putting your trust in us. We invite you to take part in quarterly summaries organized for our investors and to visit our headquarters in Wroclaw. Yours faithfully,
Paweł Wieczyński CEO

1. BASIC INFORMATION PiLab S.A.
Company Name: PiLab SA
Company Address: ul. Rzeźnicza 32-33, 50-130 Wrocław
Phone: +48 71 707 21 74
Fax: +48 71 707 22 73
E-mail: [email protected]
www: www.pilab.pl Source: Company DataWalk Inc. (US Subsidiary)
Company Name: DataWalk Inc.
Company Address: 1209 Orange Street, Wilmington, Delaware 19801
Company Address: 2479 East Bayshore Road, Suite 205 Palo Alto, CA 94303
E-mail: [email protected]
www: www.datawalk.com Source: Company

2. TIMELINE
Source: Company
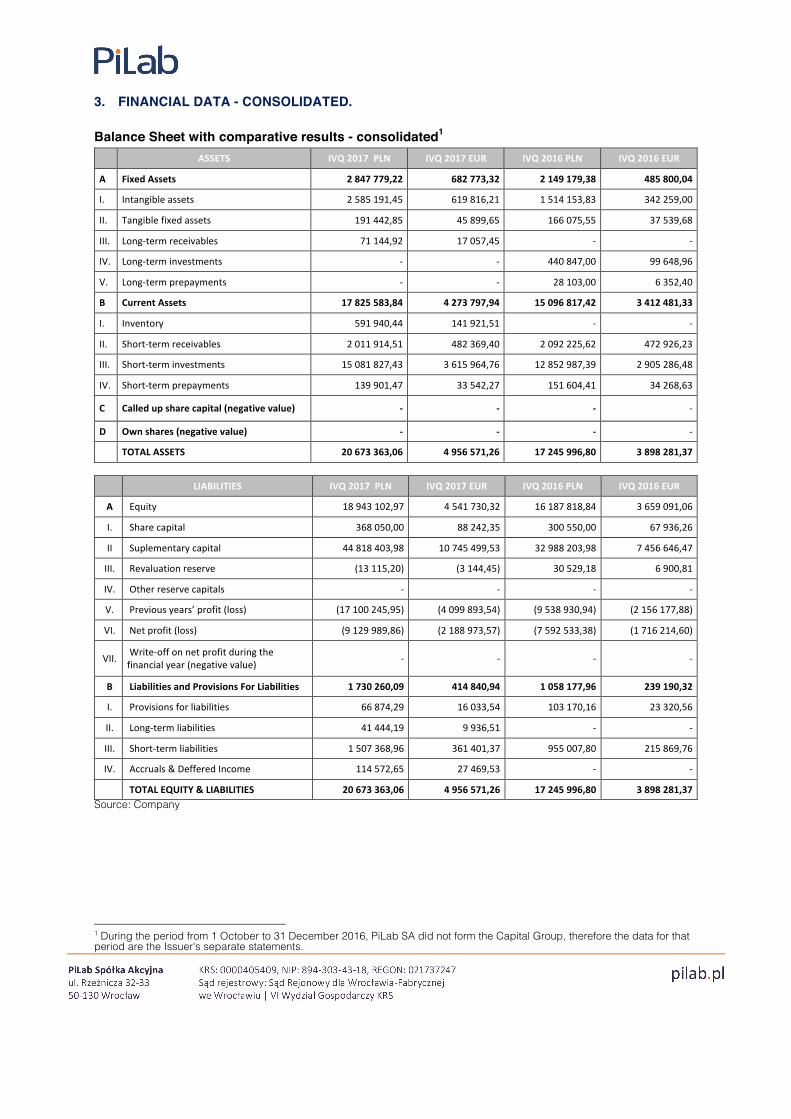
3. FINANCIAL DATA - CONSOLIDATED. Balance Sheet with comparative results - consolidated1 ASSETS IVQ 2017 PLN IVQ 2017 EUR IVQ 2016 PLN IVQ 2016 EUR
A Fixed Assets 2 847 779,22 682 773,32 2 149 179,38 485 800,04
I. Intangible assets 2 585 191,45 619 816,21 1 514 153,83 342 259,00
II. Tangible fixed assets 191 442,85 45 899,65 166 075,55 37 539,68
III. Long-‐term receivables 71 144,92 17 057,45 -‐ -‐
IV. Long-‐term investments -‐ -‐ 440 847,00 99 648,96
V. Long-‐term prepayments -‐ -‐ 28 103,00 6 352,40
B Current Assets 17 825 583,84 4 273 797,94 15 096 817,42 3 412 481,33
I. Inventory 591 940,44 141 921,51 -‐ -‐
II. Short-‐term receivables 2 011 914,51 482 369,40 2 092 225,62 472 926,23
III. Short-‐term investments 15 081 827,43 3 615 964,76 12 852 987,39 2 905 286,48
IV. Short-‐term prepayments 139 901,47 33 542,27 151 604,41 34 268,63
C Called up share capital (negative value) -‐ -‐ -‐ -‐
D Own shares (negative value) -‐ -‐ -‐ -‐
TOTAL ASSETS 20 673 363,06 4 956 571,26 17 245 996,80 3 898 281,37
LIABILITIES IVQ 2017 PLN IVQ 2017 EUR IVQ 2016 PLN IVQ 2016 EUR
A Equity 18 943 102,97 4 541 730,32 16 187 818,84 3 659 091,06
I. Share capital 368 050,00 88 242,35 300 550,00 67 936,26
II Suplementary capital 44 818 403,98 10 745 499,53 32 988 203,98 7 456 646,47
III. Revaluation reserve (13 115,20) (3 144,45) 30 529,18 6 900,81
IV. Other reserve capitals -‐ -‐ -‐ -‐
V. Previous years’ profit (loss) (17 100 245,95) (4 099 893,54) (9 538 930,94) (2 156 177,88)
VI. Net profit (loss) (9 129 989,86) (2 188 973,57) (7 592 533,38) (1 716 214,60)
VII. Write-‐off on net profit during the financial year (negative value) -‐ -‐ -‐ -‐
B Liabilities and Provisions For Liabilities 1 730 260,09 414 840,94 1 058 177,96 239 190,32
I. Provisions for liabilities 66 874,29 16 033,54 103 170,16 23 320,56
II. Long-‐term liabilities 41 444,19 9 936,51 -‐ -‐
III. Short-‐term liabilities 1 507 368,96 361 401,37 955 007,80 215 869,76
IV. Accruals & Deffered Income 114 572,65 27 469,53 -‐ -‐
TOTAL EQUITY & LIABILITIES 20 673 363,06 4 956 571,26 17 245 996,80 3 898 281,37 Source: Company
1 During the period from 1 October to 31 December 2016, PiLab SA did not form the Capital Group, therefore the data for that period are the Issuer's separate statements.

Profit and loss account with comparative results - consolidated2
PROFIT AND LOSS ACCOUNT IVQ 2017 IVQ 2017 IVQ 2016 IVQ 2016
PLN EUR PLN EUR
A Revenues from sales 604 100,22 142 725,56 1 004 234,51 229 460,64
I. Sales of products and services 604 100,22 142 725,56 1 004 234,51 229 460,64
II. Change in work in progress -‐ -‐ -‐ -‐
III. Intercompany sales -‐ -‐ -‐ -‐
IV. Sales of goods and materials -‐ -‐ -‐ -‐
B Operating costs 3 034 071,38 716 833,95 3 085 799,89 705 083,95
I. Depreciation 44 542,60 10 523,70 49 646,61 11 343,91
II. Materials & energy 18 368,24 4 339,71 45 076,96 10 299,77
III. Cost of services 1 745 154,44 412 312,63 2 111 988,36 482 574,74
IV. Taxes and fees 11 722,69 2 769,62 8 828,97 2 017,36
V. Salaries 866 619,97 204 748,85 637 222,32 145 600,90
VI. Benefits 231 020,73 54 581,28 111 870,47 25 561,63
VII. Other costs 116 642,72 27 558,17 121 166,20 27 685,64
VIII. Cost of goods and materials sold -‐ -‐ -‐ -‐
C Profit/Loss on sales (A-‐B) (2 429 971,16) (574 108,39) (2 081 565,38) (475 623,30)
D Other operating incomes 13 576,80 3 207,67 25 204,21 5 758,99
I. Profit on sale of fixed assets -‐ -‐ 25 203,25 5 758,77
II. Subsides -‐ -‐ -‐ -‐
III. Actualization of fixed assets -‐ -‐ -‐ -‐
IV. Other operating incomes 13 576,80 3 207,67 0,96 0,22
E Other operating costs 15 249,92 3 602,97 360 602,73 82 395,23
I. Loss on sale of fixed assets -‐ -‐ -‐ -‐
II. Actualization of fixed assets -‐ -‐ 353 942,81 80 873,49
III. Other operating costs 15 249,92 3 602,97 6 659,92 1 521,75
F Profit/Loss on activity (C +D-‐ E) (2 431 644,28) (574 503,68) (2 416 963,90) (552 259,55)
G Financial incomes 34 424,36 8 133,15 154 949,92 35 404,99
I. Dividends -‐ -‐ -‐ -‐
II. Interest incomes 12 637,08 2 985,65 15 423,56 3 524,18
III. Profit on sold investments 86 646,90 20 471,32 -‐ -‐
IV. Actualization of investments (64 859,62) (15 323,82) (262,51) -‐ 59,98
V. Other -‐ -‐ 139 788,87 31 940,79
H Financial costs 81 338,24 19 217,09 (30 196,57) -‐ 6 899,71
I. Interest expenses 1 100,98 260,12 (30 196,57) -‐ 6 899,71
II. Loss on sold investments -‐ -‐ -‐ -‐
III. Actualization of investments 17 913,00 4 232,15 -‐ -‐
IV. Other 62 324,26 14 724,82 -‐ -‐
2 During the period from 1 October to 31 December 2016, PiLab SA did not form the Capital Group, therefore the data for that period are the Issuer's separate statements.

I Gross Profit/Loss (F+G-‐H) (2 478 558,16) (585 587,62) (2 231 817,41) (509 954,85)
J Income tax -‐ -‐ 8 264,00 1 888,27
K Other statutory appropriations of the profit -‐ -‐ -‐ -‐
L Net Profit/Loss (I-‐J-‐K) (2 478 558,16) (585 587,62) (2 240 081,41) (511 843,12) Source: Company Cash flow with comparative results - consolidated3
IVQ 2017 IVQ 2017 IVQ 2016 IVQ 2016
PLN EUR PLN EUR
A. Cash flows from operating activities
I. Net profit (loss) (2 478 558,16) (585 587,62) (2 240 081,41) (511 843,12)
II. Total adjustments 1 191 930,98 281 607,28 389 968,68 89 105,15
III. Net cash flows from operating activities (I +/-‐ II) (1 286 627,18) (303 980,34) (1 850 112,73) (422 737,97)
B. Cash flows from investment activities
I. Inflows 2 705 160,24 639 124,94 247 339,43 56 515,35
II. Outflows 11 187 820,51 2 643 250,13 622 628,22 142 266,24
III. Net cash flows from investment activities (I-‐II) (8 482 660,27) (2 004 125,19) (375 288,79) (85 750,89)
C. Cash flows from financial activities
I. Inflows 11 897 700,00 2 810 967,25 -‐ -‐
II. Outflows 1 920,44 453,73 17 131,25 3 914,37
III. Net cash flows from financial activities (I-‐II) 11 895 779,56 2 810 513,53 (17 131,25) (3 914,37)
D. Total net cash flows (A.III. +/-‐ B.III +/-‐ C.III) 2 126 492,11 502 408,00 (2 242 532,77) (512 403,24)
E. Balance sheet change in cash, including: 2 071 257,01 489 358,08 (2 114 505,48) (483 149,89)
F. Cash opening balance 2 995 195,87 707 649,17 12 366 060,72 2 825 559,40
G. Closing balance of cash (F+/-‐D), including: 5 121 687,97 1 210 057,17 10 123 527,95 2 313 156,16
Source: Company Statement of changes in share equity (funds) with comparative results - consolidated4
Statement of changes in share equity (funds) IVQ 2017 IVQ 2017 IVQ 2016 IVQ 2016
PLN EUR PLN EUR
Opening balance of equity 9 530 436,57 2 251 674,28 18 397 371,07 4 203 672,13
Opening balance of equity after adjustments 9 530 436,57 2 251 674,28 18 397 371,07 4 203 672,13
Closing balance of equity 18 943 102,97 4 475 524,02 16 187 818,84 3 698 804,72
Equity including proposed profit distribution (loss coverage) 18 943 102,97 4 475 524,02 16 187 818,84 3 698 804,72
Source: Company
3 During the period from 1 October to 31 December 2016, PiLab SA did not form the Capital Group, therefore the data for that period are the Issuer's separate statements. 4 During the period from 1 October to 31 December 2016, PiLab SA did not form the Capital Group, therefore the data for that period are the Issuer's separate statements.

4. FINANCIAL DATA – SEPARATE. Balance Sheet with comparative results
ASSETS IVQ 2017 PLN IVQ 2017 EUR IVQ 2016 PLN IVQ 2016 EUR
A Fixed Assets 3 214 083,05 770 597,01 2 149 179,38 485 800,04
I. Intangible assets 2 585 191,46 619 816,22 1 514 153,83 342 259,00
II. Tangible fixed assets 191 442,85 45 899,65 166 075,55 37 539,68
III. Long-‐term receivables 71 144,92 17 057,45 -‐ -‐
IV. Long-‐term investments 366 303,82 87 823,69 440 847,00 99 648,96
V. Long-‐term prepayments -‐ -‐ 28 103,00 6 352,40
B Current Assets 17 475 684,89 4 189 907,43 15 096 817,42 3 412 481,33
I. Inventory 591 940,44 141 921,51 -‐ -‐
II. Short-‐term receivables 1 977 101,51 474 022,76 2 092 225,62 472 926,23
III. Short-‐term investments 14 789 474,92 3 545 871,38 12 852 987,39 2 905 286,48
IV. Short-‐term prepayments 117 168,02 28 091,78 151 604,41 34 268,63
C Called up share capital (negative value) -‐ -‐ -‐ -‐
D Own shares (negative value) -‐ -‐ -‐ -‐
TOTAL ASSETS 20 689 767,94 4 960 504,43 17 245 996,80 3 898 281,37
LIABILITIES IVQ 2017 PLN IVQ 2017 EUR IVQ 2016 PLN IVQ 2016 EUR
A Equity 18 799 011,78 4 507 183,53 16 187 818,84 3 659 091,06
I. Share capital 368 050,00 88 242,35 300 550,00 67 936,26
II. Suplementary capital 44 818 403,98 10 745 499,53 32 988 203,98 7 456 646,47
III. Revaluation reserve -‐ -‐ 30 529,18 6 900,81
IV. Other reserve capitals -‐ -‐ -‐ -‐
V. Previous years’ profit (loss) (17 131 464,32) (4 107 378,34) (9 538 930,94) (2 156 177,88)
VI. Net profit (loss) (9 255 977,88) (2 219 180,00) (7 592 533,38) (1 716 214,60)
VII. Write-‐off on net profit during the financial year (negative value) -‐ -‐ -‐ -‐
B Liabilities and Provisions For Liabilities 1 890 756,16 453 320,90 1 058 177,96 239 190,32
I. Provisions for liabilities 66 874,29 16 033,54 103 170,16 23 320,56
II. Long-‐term liabilities 41 444,19 9 936,51 -‐ -‐
III. Short-‐term liabilities 1 667 865,03 399 881,33 955 007,80 215 869,76
IV. Accruals & Deffered Income 114 572,65 27 469,53 -‐ -‐
TOTAL EQUITY & LIABILITIES 20 689 767,94 4 960 504,43 17 245 996,80 3 898 281,37 Source: Company

Profit and loss account with comparative results
PROFIT AND LOSS ACCOUNT IVQ 2017 IVQ 2017 IVQ 2016 IVQ 2016
PLN EUR PLN EUR
A Revenues from sales 568 162,22 134 234,80 1 004 234,51 229 460,64
I. Sales of products and services 568 162,22 134 234,80 1 004 234,51 229 460,64
II. Change in work in progress -‐ -‐ -‐ -‐
III. Intercompany sales -‐ -‐ -‐ -‐
IV. Sales of goods and materials -‐ -‐ -‐ -‐
B Operating costs 3 036 688,21 717 452,21 3 085 799,89 705 083,95
I. Depreciation 44 542,60 10 523,70 49 646,61 11 343,91
II. Materials & energy 14 833,52 3 504,59 45 076,96 10 299,77
III. Cost of services 2 228 980,94 526 622,16 2 111 988,36 482 574,74
IV. Taxes and fees 9 925,79 2 345,08 8 828,97 2 017,36
V. Salaries 509 935,25 120 478,02 637 222,32 145 600,90
VI. Benefits 131 310,10 31 023,51 111 870,47 25 561,63
VII. Other costs 97 160,01 22 955,16 121 166,20 27 685,64
VIII. Cost of goods and materials sold -‐ -‐ -‐ -‐
C Profit/Loss on sales (A-‐B) (2 468 525,99) (583 217,41) (2 081 565,38) (475 623,30)
D Other operating incomes 13 576,80 3 207,67 25 204,21 5 758,99
I. Profit on sale of fixed assets -‐ -‐ 25 203,25 5 758,77
II. Subsides -‐ -‐ -‐ -‐
III. Actualization of fixed assets -‐ -‐ -‐ -‐
IV. Other operating incomes 13 576,80 3 207,67 0,96 0,22
E Other operating costs 15 249,92 3 602,97 360 602,73 82 395,23
I. Loss on sale of fixed assets -‐ -‐ -‐ -‐
II. Actualization of fixed assets -‐ -‐ 353 942,81 80 873,49
III. Other operating costs 15 249,92 3 602,97 6 659,92 1 521,75
F Profit/Loss on activity (C+D-‐E) (2 470 199,11) (583 612,70) (2 416 963,90) (552 259,55)
G Financial incomes 34 424,36 8 133,15 154 949,92 35 404,99
I. Dividends -‐ -‐ -‐ -‐
II. Interest incomes 12 637,08 2 985,65 15 423,56 3 524,18
III. Profit on sold investments 86 646,90 20 471,32 -‐ -‐
IV. Actualization of investments (64 859,62) (15 323,82) (262,51) (59,98)
V. Other -‐ -‐ 139 788,87 31 940,79
H Financial costs 81 338,24 19 217,09 (30 196,57) (6 899,71)
I. Interest expenses 1 100,98 260,12 (30 196,57) (6 899,71)
II. Loss on sold investments -‐ -‐ -‐ -‐
III. Actualization of investments 17 913,00 4 232,15 -‐ -‐
IV. Other 62 324,26 14 724,82 -‐ -‐
I Gross Profit/Loss (F+G-‐H) (2 517 112,99) (594 696,64) (2 231 817,41) (509 954,85)
J Income tax -‐ -‐ 8 264,00 1 888,27

K Other statutory appropriations of the profit -‐ -‐ -‐ -‐
L Net Profit/Loss (I-‐J-‐K) (2 517 112,99) (594 696,64) (2 240 081,41) (511 843,12) Source: Company Cash flow with comparative results
IVQ 2017 IVQ 2017 IVQ 2016 IVQ 2016
PLN EUR PLN EUR
A. Cash flows from operating activities
I. Net profit (loss) (2 517 112,99) (594 696,64) (2 240 081,41) (511 843,12)
II. Total adjustments 1 155 986,85 273 115,07 389 968,68 89 105,15
III. Net cash flows from operating activities (I +/-‐ II) (1 361 126,14) (321 581,57) (1 850 112,73) (422 737,97)
B. Cash flows from investment activities
I. Inflows 2 705 160,24 639 124,94 247 339,43 56 515,35
II. Outflows 11 187 820,51 2 643 250,13 622 628,22 142 266,24
III. Net cash flows from investment activities (I-‐II) (8 482 660,27) (2 004 125,19) (375 288,79) (85 750,89)
C. Cash flows from financial activities
I. Inflows 11 897 700,00 2 810 967,25 -‐ -‐
II. Outflows 1 920,44 453,73 17 131,25 3 914,37
III. Net cash flows from financial activities (I-‐II) 11 895 779,56 2 810 513,53 (17 131,25) (3 914,37)
D. Total net cash flows (A.III. +/-‐ B.III +/-‐ C.III) 2 051 993,15 484 806,77 (2 242 532,77) (512 403,24)
E. Balance sheet change in cash, including: 1 996 758,05 471 756,85 (2 114 505,48) (483 149,89)
F. Cash opening balance 2 777 342,32 656 178,78 12 366 060,72 2 825 559,40
G. Closing balance of cash (F+/-‐D), including: 4 829 335,47 1 140 985,56 10 123 527,95 2 313 156,16
Source: Company Statement of changes in share equity (funds) with comparative results
Statement of changes in share equity (funds) IVQ 2017 IVQ 2017 IVQ 2016 IVQ 2017 IVQ 2017 IVQ 2016 IVQ 2016
PLN EUR PLN EUR
I. Opening balance of equity 9 418 424,76 2 225 210,22 18 397 371,07 4 203 672,13
I.a. Opening balance of equity after adjustments 9 418 424,76 2 225 210,22 18 397 371,07 4 203 672,13
II. Closing balance of equity 18 799 011,78 4 441 480,83 16 187 818,84 3 698 804,72
III. Equity including proposed profit distribution (loss coverage) 18 799 011,78 4 441 480,83 16 187 818,84 3 698 804,72
Source: Company

5. THE MANAGEMENT BOARD’S COMMENTS ON FACTORS AND EVENTS THAT AFFECT THE ACHIEVED FINANCIAL RESULTS
PiLab is continuing execution of a strategy aimed to develop a world-class product in the data analytics market. The Company achieved a milestone of confirming high business value of the impact generated through production usage of its core product – the DataWalk system. Results observed in the insurance sector prove ROI achieved in weeks and potential double-digit increases in margin. Thanks to these our Capital Group was able to significantly increase amount and value of the projects at earlier and later sales stages. A purchase executed by first fully commercial customer outside of Poland – HDI Sigorta, Talanx Group (reported in ESPI 2/2018), marked an important milestone and a visible effect of the above. In the US, DataWalk Inc. is working on starting new customer evaluations and closing first customer deals that will mark historical milestones for our Company. During the reported period, spending has been controlled within the projected budgets. 6. NOTES TO FINANCIAL DATA The following exchange rates were applied: EUR:
from to for Balance Sheet
for profit and loss
for cash flow
01.01.2016 31.12.2016 4,4240 4,3765 4,3765
01.01.2017 31.12.2017 4,1709 4,2326 4,2326
Balance Sheet applicable exchange rate represents the exchange rate as of the last day of the month ending the relevant period. Profit and loss account and Cash flow exchange rate represents the average of exchange rates effective on the last day of each month within the relevant period.