Quarterly Report on the Euro Area (QREA) Vol.13...
56
ISSN 1830-6403 (online) ISSN 1725-5759 (print) Economic and Financial Affairs Quarterly Report on the Euro Area Volume 13 N° 1 (2014) Highlights in this issue • Focus: The drivers of total factor productivity in catching-up economies • New estimates of Phillips curves and structural unemployment in the euro area • The relationship between government and export sector wages and implications for competitiveness • Latvia: maintaining sustainable growth after the boom-bust years • Corporate balance sheet adjustment in the euro area and the US
Transcript of Quarterly Report on the Euro Area (QREA) Vol.13...

ISSN 1830-6403 (online)ISSN 1725-5759 (print)
Economic and Financial Affairs
Quarterly Report on the Euro Area
Volume 13 Ndeg 1 (2014)
Highlights in this issuebull Focus The drivers of total factor productivity in
catching-up economies
bull New estimates of Phillips curves and structuralunemployment in the euro area
bull The relationship between government and export sectorwages and implications for competitiveness
bull Latvia maintaining sustainable growth after theboom-bust years
bull Corporate balance sheet adjustment in the euro areaand the US
LEGAL NOTICE
Neither the European Commission nor any person acting on its behalf may be held responsible for the use which may be made of the information contained in this publication or for any errors which despite careful preparation and checking may appear
This paper exists in English only and can be downloaded from httpeceuropaeueconomy_financepublications
More information on the European Union is available on httpeuropaeu
KC-AK-14-001-EN-N (online) KC-AK-14-001-EN-C (print) ISSN 1830-6403 (online) ISSN 1725-5759 (print)
copy European Union 2014 Reproduction is authorised provided the source is acknowledged
European Commission Directorate-General for Economic and Financial Affairs
Quarterly Report on the Euro Area
VOLUME 13 N 1 (2014)
Table of contents
Editorial 5
I The drivers of total factor productivity in catching-up economies 7
I1 Introduction 7 I2 TFP performance in the euro area at sectoral level 8 I3 Potential TFP drivers 9 I4 Empirical evidence of the drivers of TFP 13 I5 Conclusions 19
II Special topics on the euro area economy 21
II1 New estimates of Phillips curves and structural unemployment in the euro area 21 II2 The relationship between government and export sector wages and implications for
competitiveness 27 II3 Latvia maintaining sustainable growth after the boom-bust years 35 II4 Corporate balance sheet adjustment in the euro area and the United States 40
III Recent DG ECFIN publications 47
Boxes
I1 The drivers of TFP ndash an empirical assessment 14 II11 Alternative specifications for the Phillips curve 24 II21 The long-run relationship between manufacturing and general government
compensations per employee size and institutions matter 30
Editorial
Volume 13 No 1 | 5
DG ECFINrsquos latest Economic Forecast confirms that the recovery though still fragile is expected to continue to gain in strength while also becoming more balanced across growth drivers Domestic consumption and investment are set to strengthen gradually reducing the dependency of the recovery on the external sector Besides thanks to substantial improvements in public finances since 2011 the fiscal effort (measured as the change in structural balance) is now close to neutral for the euro area as a whole Growth has also returned in many of the vulnerable Member States Risks remain however tilted to the downside both for growth and the inflation outlook
Sustained policy efforts at all institutional levels have put the EMU on a much firmer footing But it would be premature to declare victory We have not yet reached a steady state in which the EMU architecture is complete and all the main economic challenges have been solved
The in-depth reviews (IDRs) on macroeconomic imbalances published earlier this month illustrate that while progress has been made on some fronts serious challenges remain For instance on some counts external rebalancing is progressing rapidly in those countries that had accumulated large external deficits before the crisis Their current accounts have moved into surplus and they have achieved substantial gains in cost-competitiveness Nevertheless the rebalancing process has to continue given that the high debt accumulated over many years has in general been curbed only modestly so far
The most indebted countries can make their rebalancing process more rapid and less painful by acting simultaneously in a range of areas Firstly they need to make sure that fiscal consolidation is as growth-friendly as possible and does not exacerbate social hardship Secondly policies can also help mitigate the negative impact of private sector deleveraging on growth Improved bankruptcy frameworks have an important role to play here but above all it is essential to boost exports in order to offset the persistent shortfall in private sector demand that necessarily comes with deleveraging Labour cost moderation and wage differentiation reflecting productivity developments is the standard adjustment channel in this respect To ensure sustainable
improvements the labour cost adjustment channel has to be complemented with measures aimed at increasing productivity and non-price competitiveness In this respect the analysis presented in the focus section of this report is encouraging It shows that some structural reforms can on top of their usual positive effects on the functioning of labour and product markets also contribute to enhance growth in productivity Admittedly some reforms may take time to play out but given the length of deleveraging processes their rapid implementation will help make these processes more sustainable and mitigate their social and economic costs
Of course high debt levels must in any case be addressed through responsible fiscal policies and growth-enhancing structural reforms At the same time successful past experiences of deleveraging and external rebalancing benefitted from a supportive external environment As called for by the Commission in the IDRs less indebted Member States should address distortions in savings and investment behaviours so as to raise domestic demand particularly investment and pursue reforms opening up markets and boosting potential growth Moreover it is necessary to avoid a prolonged period of excessively low overall euro area inflation The continuation of the current levels of euro area inflation mdash well below the ECB definition of price stability mdash would make the task of vulnerable countries which have to simultaneously regain competitiveness and reduce indebtedness very challenging
Overall Member States should take action individually and collectively to address macroeconomic imbalances in the euro area An important element of the euro arearsquos responsibility relates to financial fragmentation Addressing fragmentation notably through the Banking Union and well-capitalised banks will greatly facilitate the capital reallocation processes towards more productive uses and help channel savings from surplus countries to peripheral countries The forthcoming agreement on the SRM and the AQR are essential milestones in this process
Member States are making progress in addressing their challenges but efforts must be stepped up We hope to see a strong response and stand ready to support them
Dealing with a legacy of high private and public debt
Marco Buti Director General
I The drivers of total factor productivity in catching-up economies (1)
Volume 13 No 1 | 7
I1 Introduction
The pace of euro area income per capita convergence has slowed since the mid-1990s This mainly reflects poor growth rates in some of the catching-up economies (ie Greece Spain and Portugal) but also in some Member States with a higher income per capita than the euro area average (eg Italy) Their weak performance mirrors an excessive allocation of resources towards less productive sectors but also reflects low growth in total factor productivity (TFP) in a broad range of industries (see European Commission 2013) (2) TFP measures the efficiency with which inputs are being used in the production process and it can be understood as a rough measure of the rate of technological progress in the economy
The empirical evidence suggests that the TFP performance of the euro area catching-up economies before the beginning of the global economic and financial crisis in 2008 can be split into three phases (i) The 1980s and early 1990s were characterised by average TFP growth rates above the euro arearsquos average supporting a strong convergence towards the rest of the euro area (ii) around the mid-1990s TFP performance slowed down significantly bringing convergence to
(1) The section was prepared by Narcissa Balta and Philipp Mohl (2) European Commission (2013) `Focus Catching-up processes in
the euro arearsquo Quarterly Report on the Euro Area Vol 12(1) pp 7-18
a halt (iii) between the end of 1990s until the crisis TFP actually declined resulting in a divergence of catching-up economies from the rest of the euro area Member States The last period can be illustrated by an atypical positive correlation between the initial level of GDP per capita and average TFP growth rates (see Graph I1) This evidence on divergence is at odds with the results of seminal papers pointing to a small convergence effect for at least some European regions in previous decades (Barro and Sala-i-Martin 1991 Sala-i-Martin 1996) (3)
Against this background the focus section takes a closer look at the key drivers of TFP growth over the period 1994 to 2007 with a special focus on the euro area catching-up economies The group labelled as lsquoeuro area catching-up economiesrsquo hereafter includes Portugal and Spain which were part of the euro since its inception and therefore for most of the sample considered Due to data constraints at the sectoral level Greece could not be considered in most of the analysis hereafter Occasionally Italy is also discussed as an example Although not a catching-up country Italyrsquos TFP performance diverged significantly from the rest of the euro area in the decade preceding the crisis
(3) Barro R and X Sala-i-Martin (1991) `Convergence across states and regionsrsquo Brookings Papers on Economic Activity Vol 1 pp 107-182 Sala-i-Martin X (1996) `Region cohesion evidence and theories of regional growth and convergencersquo European Economic Review Vol 40 pp 1325-1352
The pace of total factor productivity (TFP) convergence in the euro area slowed down in the mid-1990s This mainly reflects poor TFP growth in the euro arearsquos catching-up economies Measured in terms of TFP the technology gap between leaders and laggards in a broad range of industries actually increased between 1994 and 2007 The persistence of the technology gap suggests that the causes are deep-rooted and at least partly structural
Panel regression results based on an endogenous growth model indicate that the TFP divergence between euro area catching-up economies in the decade preceding the global financial and economic crisis can be partly explained by the weakening of the convergence channel lower spending on innovation activities such as RampD and ICT deteriorating government effectiveness and faster population ageing
Throughout the crisis a broad range of reforms aimed at improving framework conditions have been adopted in catching-up economies and are likely to raise TFP growth rates However since convergence is shown to be more difficult for economies getting closer to the technological frontier the adoption of further structural measures would help ensure a faster TFP convergence process In particular policies that foster innovation activities reduce further the restrictiveness of employment protection legislation lower corporate tax rates and improve government effectiveness appear to support TFP growth (1)
8 | Quarterly Report on the Euro Area
The empirical identification of key drivers of TFP is challenging since TFP cannot be observed directly and it is hard to measure The TFP data used are taken from the EU KLEMS database which offers the advantage of sector-level data
The focus section is structured as follows Section I2 provides an overview of TFP performance in the euro area Section I3 reviews potential structural drivers of TFP taking into account the insights of the literature Section I4 analyses key drivers of TFP based on a panel econometric approach Finally Section I5 concludes
Graph I1 Total factor productivity developments euro area (1)
(1) The sample consists of the euro area Member States in 2007 Due to data availability LU is not covered and growth rates for PT and EL refer to the period 1995 to 2006 Source DG ECFIN based on EU KLEMS and WIOD
I2 TFP performance in the euro area at sectoral level
In brief this section shows that most industries in the euro area catching-up economies exhibited poor TFP performance during the pre-crisis decade leading to a divergence with the rest of the euro area in several sectors The persistence of this weakness as well as its broad sectoral representation suggests that the weak TFP performance is at least partly structural in nature
This section takes a closer look at TFP performance in the euro area at the sectoral level The data for TFP growth rates are taken from the EU KLEMS database (4) In the EU KLEMS
(4) EU KLEMS methodology for deriving TFP measures differs from the European Commission TFP trend estimation methodology which is based on the commonly agreed production
methodology TFP is corrected for changes in the quality of both labour and capital inputs so as to capture disembodied technological progress (5) This implies for instance that changes in the composition of the labour force or the rapid shifts in investment towards information and communication technologies (ICT) over the recent years are not reflected in the EU KLEMS TFP measure but in the inputs used in the production function The TFP level is determined by anchoring the EU KLEMS TFP growth rates to the 1997 PPP-adjusted TFP levels of the Groningen Growth and Development Centrersquos productivity level database (6)
Weak productivity growth in the euro area catching-up economies in the decade preceding the financial and economic crisis affected most industries (Graph I2) On the one hand a handful of industries have registered significant productivity losses notably some service sectors and construction On the other hand in the manufacturing sector annual average TFP growth between 1999 and 2007 has been close to zero or even slightly negative (Graph I2) despite the sectorrsquos openness to trade and close integration with the EU market Only the financial intermediation sector showed significantly positive growth rates
The observed poor performance in productivity led the catching-up economies and Italy to diverge from the rest of the euro area (Graph I3) The TFP gap between euro area catching-up economies and the technological leaders (ie the countries where the TFP level was the highest in the industry considered among a sample of OECD countries) was not concentrated just in a handful of industries Instead there was little progress in TFP convergence in most industries
function methodology for calculating potential output For details DrsquoAuria F C Denis K Havik K Mc Morrow C Planas R Raciborski W Roumlger and A Rossi (2010) lsquoThe production function methodology for calculating potential growth rates and output gapsrsquo ECFIN Economic Papers No 420
(5) For more details on EU KLEMS see OrsquoMahony M and MP Timmer (2009) lsquoOutput input and productivity measures at the industry level the EU KLEMS databasersquo The Economic Journal Vol 119 (June) pp F374-F403
(6) See Inklaar R and MP Timmer (2009) `Productivity convergence across industries and countries the importance of theory-based measurementrsquo Macroeconomic Dynamics Vol 12 (Sup 2) pp 218-240
I The drivers of total factor productivity in catching-up economies
Volume 13 No 1 | 9
Graph I2 TFP performance at sectoral level (1)
(1994-2007 avg annual change)
(1) The chart shows average annual TFP growth rates over the period 1994 to 2007 Euro area consists of the euro area Member States in 2007 (except EL) Catching-up countries includes PT ES and IT The sector classification used for Graphs I2 I3 and I4 includes (sector codes in parenthesis) manufacturing (consisting of food beverages and tobacco (15-16) pulp paper printing and publishing (21-22) machinery (29) electrical and optical equipment (30-33) and other manufacturing (36-37)) construction (F) wholesale and retail trade (G) hotels and restaurants (H) transport and storage (60-63) financial intermediation (J) renting of machinery and equipment and other business activities (71-74) real estate activities (K) public administration education and health (L-N) Source EU KLEMS
Graph I3 Average technology gap divergence at sectoral level (1)
(in pp)
(1) The graph shows the average technology gap in selected sectors between 1994 and 2007 (see Graph I2 for a description of sectors and country groups) Source DG ECFIN based on EU KLEMS
The persistence of the gap (and in many cases its widening) over the 1994-2007 period suggests that the weakness of TFP performance is at least partly structural This implies that some structural
features present in manufacturing and services sectors and more so in non-tradable services sectors impeded TFP growth in the catching up economies in the pre-crisis period even though there was a surge in investment during that time Without substantial policy action and structural reforms the catching-up economies could be facing a long period of relatively low TFP growth in the medium-term
I3 Potential TFP drivers
In brief the literature has identified a broad set of factors supporting TFP growth In particular policy measures which affect the quality of human capital the capital stock and the structuralinstitutional framework conditions of the economy seem to be beneficial for TFP growth
This section takes a closer look at the key TFP drivers identified in the literature The review builds upon the insights of endogenous growth models which put a great emphasis on the role of innovation in promoting productivity (7) In this framework TFP is mainly driven by the quality of labour and capital inputs (ie the skill structure of the labour force and the quality of the capital stock) as well as the structural and institutional framework conditions in which the economy operates
Quality of labour inputs
There is plenty of evidence in the literature showing that a higher skilled labour force tends to promote innovation leading to a rise in productivity (8)
Some euro area catching-up economies (eg Portugal) but also some of the more advanced economies (eg Italy) started with a very low proportion of high-skilled workers and despite significant progress are still struggling with a high share of low-skilled workers in the economy This driver may still be negatively affecting their TFP performance
(7) For example in Aghion P and P Howitt (2006) lsquoAppropriate growth policies a unifying frameworkrsquo Journal of the European Economic Association Vol 4(23) pp 269-314
(8) See European Commission (2009) lsquoTrade costs openness and productivity market access at home and abroadrsquo Industrial Policy and Economic Reform Papers No 10 January Sondermann (2012) lsquoProductivity in the euro area Any evidence of convergencersquo ECB Working Paper No 1431 April
10 | Quarterly Report on the Euro Area
However given the progress observed the quality of human capital endowments is not likely to have been a potential driver of the divergence in TFP growth rates between the catching-up economies and the rest of the euro area The evidence suggests that the skill structure improved during the pre-crisis period The increase in the share of high-skilled hours worked has been broad based in manufacturing but even more so in services sectors It has also been more pronounced in the euro area catching-up economies than in those of the core suggesting that there has been some convergence of skill structures in the euro area (Graph I4)
Graph I4 Change in the share of high-skilled hours worked between periods
1995-01 and 2001-07 (1) (in pp)
(1) Advanced euro area economies DE FR NL AT and FI Catching-up economies (ES and PT) as well as IT See also Graph I2 for a description of sectors Source DG ECFIN based on EU KLEMS and WIOD
Quality of capital inputs
In terms of the quality of capital inputs the literature suggests that investment in ICT plays a prominent role in explaining TFP performance (9) Investment in ICT increases an economyrsquos productive potential by raising its capital stock but also increases its potential for rapid technical progress with positive effects on TFP growth
(9) Marrocu E Paci R and S Usai (2013) lsquoProductivity growth in
the old and new Europe The role of agglomeration externalitiesrsquo Journal of Regional Science Vol 53(3) pp 418-442 Griffith R Redding S and J van Reenen (2004) lsquoMapping the two faces of RampD productivity growth in a panel of OECD industriesrsquo The Review of Economics and Statistics Vol 86(4) pp 883-895
In terms of the quality of capital inputs the relative contribution to the added value of the non-ICT component of capital seems to be much greater in the euro area catching-up economies than in the rest of the euro area (Graph I5) This pattern is observable across all sectors with the exception of the ICT-producing industries (ie electrical and optical equipment postal services and communications) Moreover in most euro area countries the contribution to growth of the ICT-component of capital relative to its non-ICT component further deteriorated in the latter years of the pre-crisis period (2004-2007) especially in the weak TFP performing euro area countries (eg Spain Portugal and Italy) This implies that in terms of the quality of capital inputs insufficient investment in ICT could be an important explanation for the disappointing TFP performance in the catching-up countries
Graph I5 Contribution to value added growth of non-ICT and ICT capital
(1995-2007 avg in )
(1) PT 1995-2005 Source DG ECFIN based on EU KLEMS and WIOD
Finally the literature provides evidence that countries that spend more on RampD tend to exhibit higher growth rates of TFP (10) This seems to be confirmed over the sample period analysed Graph I6 illustrates that countries that spent a smaller share of GDP on RampD (eg Spain Portugal and Italy) also had lower annual average growth rates of TFP during the pre-crisis period
(10) Griffith R Redding S and J van Reenen (2004) lsquoMapping the
two faces of RampD productivity growth in a panel of OECD
I The drivers of total factor productivity in catching-up economies
Volume 13 No 1 | 11
Graph I6 TFP growth and RampD spending
Source DG ECFIN based on EU KLEMS and WIOD
Structuralinstitutional drivers related to framework conditions
Apart from the quality of labour and capital inputs the literature suggests that structuralinstitutional drivers affecting the framework conditions in which the economy operates have a significant impact on TFP
A large body of economic literature suggests that more rigid product and labour markets tend to weaken productivity by slowing down the catching-up process of best-practice technologies delaying firm-level adjustments andor reducing direct productivity gains (11)
The OECD product market regulation (PMR) indicators which measure the degree of anti-competitive regulation in selected sectors of the economy have improved for most sectors of the euro area countries during the pre-crisis period (1994-2007) At the same time countries with a higher PMR indicator in 1994 showed lower productivity growth over the period resulting in a negative correlation between TFP growth and the degree of anti-competitive regulation All catching-up economies as well as Italy showed stricter product market regulation in 1994 (Graph I7)
industriesrsquo The Review of Economics and Statistics Vol 86(4) pp 883-895 Inklaar R Timmer M and van Ark B (2008) lsquoMarket services productivity across Europe and the USrsquo Economic Policy 23 pp 139-194
(11) Nicoletti G and S Scarpetta (2003) lsquoRegulation productivity and growth OECD evidencersquo Economic Policy April pp 9-72 Burda M and B Svergnini (2009) lsquoTFP growth in old and new Europersquo Comparative Economic Studies Vol 51 pp 447-466
Graph I7 Product market regulation (1)
(1) The graph shows the OECD lsquoregimpactrsquo indicator which assigns higher indicators to stricter product market regulation Source DG ECFIN based on OECD
Looking at labour market rigidities the OECD employment protection indicators (EPL) show that the catching-up economies started with a relatively high degree of rigidity in their employment protection legislation (Graph I8) The negative correlation between the average TFP growth over 1994 to 2007 and the score in the EPL indicator in 1994 indicates that the poor TFP performance observed over the pre-crisis period could to some extent be negatively related to the initial level of the employment protection legislation However the correlation seems to be much weaker than in the case of RampD spending
Graph I8 Employment protection legislation (1)
(1) The graph shows the employment protection indicator for regular contracts in terms of individual and collective dismissals Higher values stand for stricter protection rules Source DG ECFIN based on OECD
12 | Quarterly Report on the Euro Area
Poor productivity performance has also been linked by several studies to the deteriorating quality of institutions (12) The institutional quality as measured by the government effectiveness of the World Bank Governance Indicators database was indeed low in the euro area economies with poor productivity performance (Graph I9) This seems to be particularly the case of Italy
Graph I9 Effectiveness of governments (1)
(1) Government effectiveness captures perceptions of the quality of public services the quality of the civil service and the degree of its independence from political pressures the quality of policy formulation and implementation and the credibility of the governmentrsquos commitment to such policies Higher values point to higher government effectiveness Source DG ECFIN based on World Bank (2013) Worldwide governance indicators
Finally there is also evidence that higher corporate tax rates can distort factor prices and reduce entrepreneurship and RampD activities resulting in a negative impact on TFP (13) The negative correlation between average TFP growth rates over the period 1994-2007 and the corporate tax rate in 1994 seem to support this hypothesis (Graph I10)
(12) Bertola G (2013) lsquoPolicy coordination convergence and the rise
and crisis of EMU imbalancesrsquo lsquoThe future of EMUrsquo Fellowship ECFIN Economic Paper 490 Acemoglu D Johnson S and J Robinson (2001) lsquoThe colonial origins of comparative development an empirical investigationrsquo American Economic Review Vol 91(1) pp 1369-1401
(13) Vartia L (2008) lsquoHow do taxes affect investment and productivity An industry-level analysis of OECD countriesrsquo OECD Economics Department Working Papers No 656
Graph I10 Effective average tax rates (1)
(1) Effective average tax rates are calculated in line with Devereux MP and R Griffith (2003) lsquoEvaluating tax policy for location decisionsrsquo International Tax and Public Finance Vol 10 pp 107-126 Source DG ECFIN based on Elschner C and M Overesch (2007) lsquoTrends in corporate tax levels in Europersquo Intereconomics Vol 42(3) pp 127-132
I4 Empirical evidence of the drivers of TFP
In brief this section presents panel regression results based on an endogenous growth model The findings show that TFP growth over 1994-2007 was mainly driven by the convergence and spillover channel as well as spending for innovation activities For euro area catching-up countries policy measures that reduce employment protection legislation lower corporate tax rates and improve government effectiveness seem to have the most beneficial impact on TFP growth
The aim of this section is to analyse the main drivers of TFP using a panel data approach The identification of key determinants of TFP is challenging since TFP is hard to measure and it can be affected by a broad set of factors shaping the institutional and economic features of the economy
The empirical approach investigates TFP performance in OECD economies thereby excluding emerging countries Relying solely on country-specific information may however lead to biased results due to the small sample size Therefore the analysis benefits from the sector-specific information of the EU KLEMS database One major drawback of this approach however is that EU KLEMS only offers data until 2007 Against this background the drivers of TFP are analysed using a sample of up to 20 OECD countries and 14 sectors over the time period 1994 to 2007
I The drivers of total factor productivity in catching-up economies
Volume 13 No 1 | 13
The dependent variable is defined as total factor productivity growth in line with the growth accounting methodology of EU KLEMS (see Section I2) The selection of potential explanatory factors with a causal impact on TFP was made based on the key explanatory variables presented in Section I3
Two independent variables are of particular importance First the technology gap which measures the distance between the TFP level of the country concerned and the country with the highest TFP level This variable provides an indication of the impact from the convergence channel It is expected that with a larger technology gap the potential benefit of adopting new technologies increases resulting in a higher TFP growth rate Second the possibility of positive innovation and knowledge spillovers is captured by including the TFP growth rate of the country with the highest TFP level (the technology leader) This variable measures the importance of the spillover channel Apart from these explanatory variables the specification includes a large set of control factors in line with Section I3 such as the impact of ICT compensation RampD expenditure the share of high-skilled population as well as country- sector- and time-fixed effects (see Box I1 for more detailed results)
The findings of a first set of (restricted) empirical regressions (14) show that convergence and spillover effects are important factors in explaining TFP growth Both variables appear to be strongly significant The larger the distance to the frontier the more sizeable the positive impact from the convergence channel on TFP gets At the same time an increase of the spillover effect as realised by the TFP growth of the technology leader results in a higher TFP growth rate The empirical findings suggest that the impact from the spillover channel is stronger than the impact from the convergence channel The results also reveal that the strength of the spillover channel seems to have increased over time while that of the convergence channel has weakened
Apart from the convergence and spillover channels TFP growth appears to be strongly supported by innovation activities as captured by
(14) As a starting point TFP growth was regressed on the technology gap and the spillover channel apart from country- sector- and time-fixed effects thereby omitting further control variables
the share of ICT compensation in total compensation and RampD expenditure By contrast labour skills as measured by the share of population aged 25 and over who have completed tertiary education turns out not to be significant This finding indicates that the correction of TFP done in EU KLEMS for changes in the quality of input factors (see Section I2) appears to be successful for labour but not completely so for capital input factors
There is no clear evidence that other structural variables have a direct significant impact on TFP growth However it is possible that the impact of other potential factors could depend on the state of the convergence or spillover channel For instance certain structural variables may only be significant for more (or less) advanced countries ie those with a small (or high) gap to the technology frontier
To investigate these conditional effects another set of regressions was run to estimate a set of interaction models In these regressions the technology gap and the spillover term are interacted with the structural drivers related to the framework conditions presented in Section I3 These indicators capture different policy areas that are proxied by five variables namely labour market flexibility (employment protection legislation) tax regimes (effective average tax rates) institutional quality (government effectiveness) population ageing (old age dependency ratio) and product market regulations (OECD regimpact indicator)
The results of these interaction models show that the effect of the structural variables on TFP growth is dependent on the technology gap More rigid employment protection legislation tends to have a negative impact on TFP growth The negative impact becomes stronger the less advanced the economy is The impact on TFP growth is however not statistically significant for the least advanced economies ie those which have a very high technology gap An increase in corporate tax rates and ageing population seem to have a particularly detrimental impact on TFP in less advanced economies Improving government effectiveness tends to have a positive and significant impact on TFP growth for medium- and more advanced economies Finally the results do not suggest a statistically significant impact of product market regulation
14 | Quarterly Report on the Euro Area
(Continued on the next page)
I The drivers of total factor productivity in catching-up economies
Volume 13 No 1 | 15
Box (continued)
(Continued on the next page)
16 | Quarterly Report on the Euro Area
Box (continued)
(Continued on the next page)
I The drivers of total factor productivity in catching-up economies
Volume 13 No 1 | 17
Box (continued)
(Continued on the next page)
18 | Quarterly Report on the Euro Area
The interaction models reveal that the impact of the structural variables also seems to be conditional on the spillover channel ie the growth rates of the economies with the highest TFP level Stricter employment protection legislation an increase of the corporate income tax rate or a higher old age dependency ratio all have a detrimental impact on TFP growth when the TFP growth rate of the technology leader is high Since sectors closely related to ICT appear to show the highest growth rates over the sample period the findings implicitly suggest that these sectors tend to react strongest to changes in labour market flexibility tax regimes and population ageing The effect from improving the effectiveness of governments by contrast seems to be of great importance for all sectors Finally product market regulation does not seem
to matter for TFP growth irrespective of the growth rate of the leading economy
Applying the findings of the panel regressions conducted for up to 20 economies to the euro area economies allows for the following tentative conclusions
bull The TFP divergence between euro area catching-up economies relative to the rest of the euro area in the decade preceding the global financial and economic crisis can be partly explained by the following indicators a weakening of the convergence channel lower spending on innovation activities such as RampD and ICT deteriorating government effectiveness and faster population ageing
Box (continued)
I The drivers of total factor productivity in catching-up economies
Volume 13 No 1 | 19
bull Looking forward policy measures that fosterinnovation activities reduce the restrictivenessof employment protection legislation lowercorporate tax rates and improve governmenteffectiveness could help promote TFP growthin the euro area catching-up economies
bull It is worth stressing that according to theregression results employment protectionlegislation has not contributed to the TFPdivergence process since euro area catching-upeconomies did not fall behind the rest of theeuro area in this respect between 1994 and2007 Similarly corporate tax policy does notseem to have been a source of divergence overthat period Nevertheless the regression resultsalso indicate that policy action in those twoareas could improve TFP growth in thecatching-up countries as well as in the rest ofthe euro area
I5 Conclusions
The TFP income convergence process in the euro area weakened in the decade preceding the economic and financial crisis mainly due to weak TFP growth in catching-up economies In fact the gap between euro area catching-up economies and technological leaders actually widened in a broad range of sectors
The persistence of the technology gap since the mid-1990s suggests that the causes are deep-rooted and at least partly structural The econometric analysis presented in this focus section shows that the TFP divergence between euro area catching-up economies and the rest of the euro area can be partly explained by the following indicators a weakening of the convergence channel lower spending on innovation activities such as RampD and ICT deteriorating government effectiveness and faster population ageing
In response to the crisis catching-up countries have put in place a broad range of reforms aimed at improving framework conditions labour market flexibility and the efficiency of the business environment These are likely to raise TFP growth rates in the years to come
However since catching-up is shown to be more difficult for economies approaching the technological frontier the adoption of further structural measures would also help more advanced countries accelerate their TFP convergence In particular measures that foster innovation activities reduce further the restrictiveness of employment protection legislation lower corporate tax rates and improve government effectiveness appear to be the most effective at promoting TFP growth
II Special topics on the euro area economy
Volume 13 No 1 | 21
II1 New estimates of Phillips curves and structural unemployment in the euro area (15)
The Phillips curve can be used to estimate the non-cyclical part of unemployment In such models this estimate is commonly referred to as the lsquonon-accelerating wage rate of unemploymentrsquo (NAWRU)(16) The Phillips curve can be specified in various ways reflecting different assumptions regarding the formation of expectations DG ECFIN has recently extended its framework to cover rational expectations This section looks at the sensitivity of the results to alternative expectation assumptions reporting NAWRU estimates based on Phillips curves produced using rational expectations and those (as used to date) allowing only for static or adaptive expectations
Our findings show that for the euro area as a whole the alternative expectation assumptions yield similar NAWRU estimates In particular the NAWRU appears to have increased recently suggesting a deterioration of labour market performance beyond what could be considered merely cyclical For Spain however the results vary more depending on the assumptions used The Phillips curve based on rational expectations points to a more moderate NAWRU increase than that used by DG ECFIN to date However all estimates point to a substantial post-crisis increase in the NAWRU for Spain
In interpreting the rise in the NAWRU it is important to bear in mind that both structural and non-structural factors are driving developments Analysis shows that in the presence of rigidities crisis-related events can have temporary but long-lasting effects on labour market performance Structural factors can play a role too as illustrated by the steady decline in the NAWRU in Germany which appears to be related to structural effects brought about by the Hartz reforms
-------------------------------
(15) Section prepared by Fabrice Orlandi (16) The Phillips curve features a relationship between the
unemployment gap and an inflation or labour-cost variable In the case of the former the non-cyclical unemployment estimate obtained is usually referred to as the lsquonon-accelerating inflation rate of unemploymentrsquo (NAIRU) while with the latter it is referred to as the lsquonon-accelerating wage rate of unemploymentrsquo (NAWRU)
Introduction
Unemployment rates increased sharply in the euro area in the wake of the crisis and the surge has proved particularly persistent Assessing this development is of paramount importance to policy-makersrsquo efforts to find adequate responses to the effects of the crisis
The non-cyclical part of unemployment play a key role in this assessment as it identifies the proportion of the deterioration that is likely to last beyond the business cycle In the EU context this indicator is particularly important as it is a factor to be fed into the potential output calculations used to compute cyclically-adjusted fiscal figures important benchmarks for country surveillance under the EUrsquos fiscal framework(17)
The non-cyclical part of unemployment is not an observable variable however and has to be estimated which means that it is subject to uncertainty In part the uncertainty stems from the fact that different estimation models are available The Phillips curve is commonly used as a key element in estimation models(18) but can itself be specified in various ways most notably reflecting alternative assumptions as to the formation of expectations(19)
This section sets out DG ECFINrsquos approach to estimating the non-cyclical part of unemployment in particular in its use of the Phillips curve We also investigate the sensitivity of the results to alternative expectation assumptions highlighting the results obtained for the case of rational expectations the case recently incorporated in DG ECFINrsquos estimation framework
The results presented here focus on the euro area but results are also reported for Spain and Germany two countries that have witnessed starkly different non-cyclical unemployment developments
(17) For details on the EUrsquos SGP framework see Vademecum on the Stability and Growth Pact European Economy mdash Occasional Paper No 151 DG ECFIN European Commission May 2013
(18) For an illustration of structural unemployment analysis based on an alternative concept see eg Unemployment dynamics during recessions and recoveries Okunrsquos law and beyond IMF WEO April 2010
(19) For details on the Phillips curve see Fuhrer J YK Kodrzycki GP Olivei and J Sneddon Little Understanding inflation and the implication for monetary policy mdash a Phillips curve retrospective MIT Press 2009
22 | Quarterly Report on the Euro Area
in the recent past We use long time series usually starting in 1965 to capture medium-term cycles The latest DG ECFIN forecasts are also included in the dataset
Alternative NAWRU models
Non-cyclical unemployment is estimated on the basis of models that pin-down its statistical and economic properties DG ECFINrsquos approach relies on an lsquounobserved componentrsquo model which features a Phillips curve The curve links cyclical unemployment (ie the unemployment gap) to labour cost developments while non-cyclical unemployment is assumed not to be affected by labour cost developments In this setting non-cyclical unemployment estimates are commonly referred to as the lsquonon-accelerating wage rate of unemploymentrsquo (NAWRU)(20)
The specification of the Phillips curve reflects particular assumptions made regarding inflation expectations In the past DG ECFINrsquos considered only static and adaptive expectations More recently the case of rational expectations has been added providing a more comprehensive framework (see Box II11)
More specifically the so-called traditional Keynesian Phillips (TKP) curve based on static or adaptive expectation assumptions a positive unemployment gap ( minus lowast) with a fall in the change of the growth rate of nominal unit labour cost (∆ ) (and vice versa) ∆ = minus ( minus lowast) The new Keynesian Phillips (NKP) curve based on rational expectations implies that a positive unemployment gap ( minus lowast) is associated with a fall in the growth rate of real unit labour cost (∆ ) Lagged effects are also relevant because some wage-setters may use ad hoc rules and not fully optimise = ∆ minus ( minus lowast)+ ( minus lowast ) (20) For further details on the DG ECFIN approach see DrsquoAuria F
C Denis K Havik K Mc Morrow C Planas R Raciborski W Roumlger and A Rossi (2010) The production function methodology for calculating potential growth rates and output gaps European Economy mdash Economic Paper No 420 DG ECFIN European Commission July 2010
These alternative Phillips curves thus rely on different labour cost indicators to determine the unemployment gap (and thus also the NAWRU) namely ∆ and ∆ As explained in Box II11 this does not mean that the models are fundamentally different Instead it illustrates the impact of assumptions as to expectation formation on the specification of the Phillips curve
NAWRU developments
For the euro area as a whole NAWRU estimates based on the TKP and the NKP show a similar pattern (see Graph II11)(21) The similarity suggests that for most countries in the euro area results are not overly sensitive to the specification of the Phillips curve (ie to assumptions as regards expectation formation) In practice it also suggests that alternative labour cost indicators (ie change in unit labour cost (ULC) growth and real unit labour cost (RULC) growth) underwent broadly similar developments in the euro area this is confirmed by the top chart in Graph II12
Graph II11 shows that non-cyclical unemployment in the euro area posted a steady increase up to the mid-90s followed by an improvement that was then halted by the recent crisis The recent rise in the NAWRU suggests that the increases in unemployment seen in the aftermath of the crisis are to some extent likely to last beyond the cyclical upturn
Graph II11 also shows NAWRU developments for Spain and Germany illustrating the diversity within the euro area Spain has witnessed developments that have been similar to though more dramatic than those in the euro area as a whole Germany posted a starkly different profile with its NAWRU falling steadily (from 2002 according to the NKP or 2004 according to the TKP)
As regards sensitivity the NAWRU estimates for Spain vary considerably depending on the specification With the NKP the recent increase is more moderate with the NAWRU reaching 220 by 2015 while the estimated level with the TKP is 264 Recent results for Germany are less sensitive to assumptions regarding expectations (21) NAWRUs referred to in this section are those computed for the
Commissionrsquos 2014 winter forecast Latest available NAWRUs can be downloaded from the AMECO database httpeceuropaeueconomy_financeameco
II Special topics on the euro area economy
Volume 13 No 1 | 23
with the two Phillips curve specifications producing similar NAWRUs However around
Graph II11 Alternative NAWRU estimates euro area Germany and Spain (1)
(1965-2015 in )
(1)GDP weighted average of euro-area countries for which alternative NAWRUs have been computed (ie AT BE DE EL ES FI FR IE IT NL and PT) For AT both NAWRUs are based on the backward-looking model as the forward-looking model yields econometrically unsatisfactory results (2)Component of the NAWRU explained only by structural determinants (see Orlandi (2012) op cit) Source DG ECFIN calculations based on Eurostat data
2005 some difference across the two specifications is observed for Germany with the NKP producing a relatively less volatile NAWRU Given that the current NAWRU estimates for Germany based on the TKP and NKP specifications do not diverge greatly and taking into account the stability considerations in moving to a new specification Germany continues to use the TKP specification
NAWRU differences for Spain depending on the curve specification stem from corresponding differences between the labour cost indicators used Graph II12 shows that recently RULC growth posted greater and more persistent moderation in Spain than change in nominal ULC growth For Germany the indicators have followed more similar paths over recent years (as they have in the euro area as a whole) More fundamentally in times of heightened economic volatility andor big labour market adjustments (eg recent crisis Hartz reforms) the TKP model is likely to yield NAWRUs that are more pro-cyclical as it does not take full account of the price rigidities that play an important role in the adjustment process of the labour market These rigidities are better reflected in the NKP model
To sum up except in the case of Spain recent NAWRU estimates for the euro area do not appear to be sensitive to assumptions as regards expectations with alternative Phillips curve specifications yielding similar results Overall results point to a recent increase in the NAWRU across the euro area with the notable exception of Germany A rise in the NAWRU points to persistent deterioration in labour market performance Identifying the causes of the deterioration calls for cautious interpretation however
NAWRU versus Structural Unemployment
Understanding the sharp and protracted rise in unemployment in the wake of the crisis is of paramount importance from a policy perspective What caused the rise Is it a sign of structural deterioration Or is it purely cyclical reflecting the prolonged slowdown These questions are the subject of lively debate with views ranging from lsquoitrsquos all demandrsquo(22) to lsquoitrsquos allmostly structuralrsquo(23)
(22) See eg Krugman P (2010) Debunking the structural unemployment myth New York Times 28 September 2010
24 | Quarterly Report on the Euro Area
(23) See eg Kocherlakota N (2010) Inside the FOMC speech at
Marquette Michigan 17 August 2010
(Continued on the next page)
II Special topics on the euro area economy
Volume 13 No 1 | 25
In particular changes in the NAWRU are sometimes interpreted as a sign of a structural change Careful analysis of developments in the NAWRUs produced by DG ECFIN shows that they can be driven by both structural and non-structural factors(24)
In particular crisis-related shocks (eg unwinding of unsustainable developments) especially boom-bust episodes in the housing market that can trigger a lengthy process of deleveraging in the construction sector have a statistically significant impact on the NAWRU The real interest rate and Total Factor Productivity (TFP) growth which controls more generally for the presence of such shocks also play a part in driving NAWRU develpoments
At a theoretical level adding various rigidities (eg real wage rigidity cyclical price mark-ups or sluggish adjustment of the reservation wage) to the traditional labour market model can be shown to yield a NAWRU that is not solely determined by structural factors
Despite uncertainties the NAWRU remains a useful policy indicator It is a well-defined concept that provides useful information on the nature of unemployment rate developments In particular it identifies risks of persistent labour market deteriorations that may not always be caused by structural phenomena(25)
In this context it appears useful to distinguish between the NAWRU and a narrowly defined notion of structural unemployment affected only by structural factors as shown in Graph II11 by
(24) For further details see Orlandi F (2012) Structural unemployment and its determinants in the EU countries European Economy mdash Economic Paper No 455 DG ECFIN European Commission May 2012
(25) For further details see Cyclical and structural unemployment in the euro area in Labour Market Developments in Europe 2013 European Commission
the lsquostructural unemploymentrsquo series The latter represents the portion of the NAWRU that according to econometric results appears to be explained by structural features of the labour market As can be seen the series has remained broadly stable during the crisis Except for a notable decline due to structural labour market reforms in Germany change in the NAWRU in the euro area is not related to structural change This is also the case in Spain where structural unemployment has remained broadly stable
Recent increases in the euro-area NAWRU should therefore not be interpreted as a sign of big structural change at the current juncture Rather in most countries the increases reflect the effects of shocks that in the presence of various rigidities have a long-lasting impact on unemployment rates
To sum up the decline in the NAWRU at euro-area level and in countries like Spain in the run-up to the crisis appears mostly attributable to non-structural factors such as unsustainable developments in the housing sector The build-up and subsequent unwinding of imbalances has caused large economic shocks (eg need for sectoral reallocation) which have a persistent effect on the performance of the labour market However in some countries structural factors have also played a role in driving NAWRU developments In Germany for example the decline in the NAWRU seems related to some aspects of the Hartz reforms (eg the change in the period of eligibility for unemployment benefit appears to have contributed to a decline of the NAWRU over recent years) This suggests that large-scale reforms as currently being enacted in some countries will tend to translate into a gradual lowering of the NAWRU over coming years For example recent efforts in Ireland to bring down the labour tax wedge appear to be contributing to more favourable NAWRU developments A number of countries (eg France) have failed to
Box (continued)
26 | Quarterly Report on the Euro Area
post similar improvements in their underlying labour market structures
Graph II12 Alternative labour cost signals for the euro area Germany and Spain (1)
(1965-2014)
(1)GDP-weighted average of euro-area countries for which alternative NAWRUs have been computed (ie AT BE DE EL ES FI FR IE IT NL and PT) (2)Private consumption deflated ULC Source DG ECFIN calculations based on Eurostat data
Conclusions
Alternative Phillips curve specifications based on different assumptions regarding expectation formation point to broadly similar NAWRU results for the euro area Estimates point to a recent rise in the NAWRU suggesting that post-crisis unemployment increases are to some extent persistent
In the case of Spain alternative Phillips curve specifications yield somewhat different NAWRU results pointing to the current importance for that country of theoretical considerations regarding expectations The NKP which uses rational expectations and relies on RULC growth to identify the unemployment gap yields a more moderate NAWRU increase over recent years than the TKP (hitherto used by DG ECFIN) which allows only for static or adaptive expectations and relies on the signal provided by the change in nominal ULC growth While this sensitivity in the results underlines the need for caution in interpreting NAWRU estimates it should also be borne in mind that all specifications point to an important increase in the NAWRU for Spain at this juncture
The deterioration in the NAWRU signals difficulties that are likely to last beyond the cyclical upturn In interpreting those developments it is important to recognise that changes in the NAWRU can be caused by both structural and non-structural factors While the improvement in the NAWRU in Germany seems to be caused by structural factors the deterioration in Spain seems to be caused more by crisis-related events that have persistent effects due to the presence of various rigidities that tend to slow down the adjustment process
II Special topics on the euro area economy
Volume 13 No 1 | 27
II2 The relationship between government and export sector wages and implications for competitiveness (26)
In 2012 the general government sector employed on average about 15 of the labour force in the euro area Since most countries in the euro area are now trying to consolidate public finances whilst also trying to boost competitiveness for external rebalancing and to reduce unemployment it is crucial to assess whether there is any wage spillover from the public to the export sector in particular under conditions of fiscal stress This section shows that there has been a link between government and manufacturing wages over the long-run which is much closer when the government employs a large share of the labour force Government size dimension is especially important during fiscal consolidation If the government wage bill is inflated due to unjustified wage premia for example limiting government wage growth is a fiscal strategy that may among other effects deliver competitiveness gains that contribute to external rebalancing and help boost employment in the tradable sector
-----------------------
Introduction
General government employment accounts for a considerable share of the labour force in the euro area It stood at about 15 in 2012 with but some cross-country variation The evolution of government wages is likely to have an impact not only on fiscal variables and on the sustainability of public finances but also on the labour market on cost competitiveness and on external rebalancing within the euro area This section looks at the relationship between public and private sector wages at a time when most euro area countries are trying to consolidate their public finances improve competitiveness to support external rebalancing whilst also having to tackle high unemployment levels (27)
Changes in general government compensations may spill over into the private sector through both
(26) Section prepared by Benedicta Marzinotto and Alessandro Turrini
(27) Throughout the section the public sector is referred to alongside general government which refers to public offices at all levels of government non-market public owned hospitals schools and social security organizations Thus the term public is used as a synonym for general government
market-based and institutional channels For example excessive government wages may crowd out private sector employment inflating cost conditions and leading to competitiveness losses (28) There are channels of transmission also in the opposite direction from the private to the government sector Wage growth linked to productivity improvements in the private sector can spill over into the public if there is labour mobility across sectors This can affect governments capacity to keep wage expenditure growth under control
Against this background this section analyses the relationship between general government and manufacturing wages in order to assess the potential for and conditions of a wage spillover from the insulated government sector to the export sector The relationship is analysed by looking at a sample of EU countries over the period 1980-2013 in a co-integration framework that makes it possible to distinguish between long-run and short-run effects The relationship between the two wages is also assessed for different fiscal scenarios differentiating between normal periods and periods of fiscal adjustment
The various forms the relationship takes
The relationship between public and private wages takes many forms It may be influenced by market forces andor by institutional features of the wage setting system in each country Changes in private wages can affect government wage growth in the following ways
bull Wage bargaining in the private sector has ademonstration effect on public wage-settersPerez and Sanchez (2011) find evidence ofsignalling by the private sector in thenegotiation phase in France and Germanybefore the EMU period (29) Signalling may bemotivated by envy effects that reflect thestrength of the wage-bargaining position (30) or
(28) See for example Alesina A and R Perotti (1997) The welfare state and competitiveness American Economic Review Vol 87 pp 921-939 Alesina A Ardagna S Perotti R and Schiantarelli F (2002) Fiscal policy profits and investment American Economic Review Vol 92(3) pp 571-589 Ardagna S (2004) Fiscal stabilizations when do they work and why European Economic Review Vol 48 pp 1047-1074
(29) Perez JJ and AJ Sanchez (2011) Is there a signalling role for public wages Evidence of the euro area based on macro data Empirical Economics Vol 41(2) pp 421-445
(30) Maffezzoli M (2001) Non-Walrasian labor markets and real business cycles Review of Economic Dynamics Vol 4(4) pp 860-
28 | Quarterly Report on the Euro Area
by the fact that the same trade union negotiates wages for both sectors
bull Wage-bargaining practices may explicitly or implicitly grant wage leadership to the private sector Under the Scandinavian wage-setting model the private export sector typically takes the lead dictating bargaining outcomes to other sectors including the public sector (31)
bull There may also be established practices and institutional mechanisms that make public wages responsive to private wage settlements usually those of the export sector This is the case if for example there is a formal rule under which the growth rate of private wages is automatically applied to public sector wages (32)
It is of course a two-way street Changes in government wages affect private wage growth in a number of ways
bull Wage adjustment in the public sector causes cross-sector labour shifts and a change in the private sectors labour supply As the supply of labour changes so does the competitive private sectors equilibrium wage
bull Adjustments to government wages affect the outside option of unionised private sector bargainers putting pressures on the bargaining process (33) with for example private sector workers tempted to move to the general government sector due to large public wage increases
892 Ardagna S (2007) Fiscal policy in unionized labor markets Journal of Economic Dynamics and Control Vol 31(5) pp 1498-1534
(31) For a review see Lindquist J and R Vilhemsson (2006) Is the Swedish central government a wage leader Applied Economics Vol 38 pp 1617-1625 Friberg K (2007) Intersectoral wage linkages the case of Sweden Empirical Economics Vol 32 pp 161-184 Traxler F and B Brandl (2012) Collective bargaining inter-sectoral heterogeneity and competitiveness a cross-national comparison of macroeconomic performance British Journal of Industrial Relations Vol 50(1) pp 73-98 Ramskloger P (2012) Is there a European wage leader Wage spillovers in the European Monetary Union Cambridge Journal of Economics Vol 36(4) pp 941-962 and (2013) The nationalndashtransnational wage-setting nexus in Europe What have we learned from the early years of monetary integration Journal of Common Market Studies Vol 51(5) pp 916-930
(32) For evidence on the Netherlands see Hartog J and H Oosterbeek (1993) Public and private sector wages in the Netherlands European Economic Review Vol 37(1) pp 97-114
(33) Afonso A and P Gomes (2008) Interactions between private and public sector wages ECB Working Paper No 971
bull Changes in public wages may be fully compensated in government budgets by changes in labour taxation that alter labour costs in the private sector (34) and might also affect union behaviour (35)
Co-movements between government and private wages may also take place in the absence of direct links when driven by factors common to both sectors For example public wages may be pro-cyclical and change in a manner similar to private wages over the cycle (36) Co-movements in aggregate wage series could be linked to developments common to both factors relating to the composition of the labour force
Testing the relationship between government and manufacturing wages
To analyse more systematically the long- and short-term effects of government wages on the export sector a cointegration approach is used linking manufacturing compensations to a number of determinants including compensation in the government sector The long-term relationship is analysed in terms of levels while the Error Correction Mechanism (ECM) equation makes it possible to estimate the short-term relation between export sector wage growth shocks in explanatory variables and their deviation from the long-term relationship The long-term relationship in also analysed in terms of levels using a dynamic ordinary least squares (DOLS) model and the results incorporated in an ECM model
Estimates were made on a sample of 17 EU countries for which data are available over the period 1980-2013 This has not only has the advantage of gaining degrees of freedom and reinforcing the results It also makes it possible to
(34) Holmlund B (1993) Wage setting in private and public sectors
in a model with endogenous government behaviour European Journal of Political Economy Vol 9(2) pp 149-162
(35) The spillover from the public to the private sector is likely to be mediated by the structure of wage-setting systems Alesina and Perotti (1997) find that increases in labour taxation do not necessarily lead to higher wage demands by unions in highly centralised bargaining systems as large wage setters would internalise the consequences from higher labour costs on employment
(36) For instance Lane (2003) and Lamo et al (2007) find that public wages are pro-cyclical because of discretionary fiscal expansion in good times Lane P (2003) The cyclical behaviour of fiscal policy evidence from the OECD in Journal of Public Economics Vol 87 pp 2661-2675 Lamo A Perez JJ Schuknecht L (2007) The cyclicality of consumption wages and employment of the public sector in the euro area ECB Working Paper No 757
II Special topics on the euro area economy
Volume 13 No 1 | 29
investigate the role of framework conditions in bringing the impact of general government to bear on manufacturing wages by means of appropriate sample splits Box II21 shows the estimation methodology and the results
Much of the variance in manufacturing wages is explained by variables usually used when estimating wage equations (ie the price level labour productivity and the unemployment rate) and by general government wage levels Both the long- and short-term elasticity of manufacturing wages with respect to government wages is estimated to be around 03-04 This tallies with the results of similar studies (eg Afonso and Gomes 2008) It works both ways general government wages also react to manufacturing wages They have a long-term elasticity of 08 and a short-term elasticity of 04 (37) This is consistent with the fact that it is more usual for the private sector than for the government to take the lead in terms of wages as the available literature also shows (38) The DOLS cointegration estimation delivers qualitatively identical results The results are still valid when the sample is restricted to just the euro area (39) The relationship tested on real wages is symmetrical because manufacturing wages respond to government wages whether they are increased or reduced
One hypothesis tested here is whether the size of the government sector determines the extent to which changes to government wages affect average conditions on the private market if for example there is cross-sector mobility In order to test how this market-based channel works the same EU sample is split into two groups of countries those in which the average share of government to total employment is above the whole EU samplersquos median and countries in which it is below the median Results show that in the long-run the impact of public on manufacturing wages is considerably higher in the case of large public sectors This divide disappears in the short-run In the opposite direction going from manufacturing to public wages the split does not produce differentiated results This confirms that government size matters when it comes to the public sectors long-term impact on the labour
(37) The results are not shown (38) Perez JJ and AJ Sanchez (2011) (39) Still it should be noted that the sample used excludes some key
countries in the euro area
market The DOLS methodology confirms these results (40)
Another hypothesis that is tested is whether the way wages are set in the public sector increases the chances of manufacturing wages reacting to government wages Broadly speaking two wage-setting systems may be identified
bull This first is that wages are mainly set on thebasis of collective bargaining
bull The second is that wages are set on the basis ofunilateral decision by the government (41)
The results show that the way wages are set does not fundamentally alter the relation between government and manufacturing wages in the long- or the short-term It is however interesting to note that across all methodologies used the relationship between manufacturing wages and labour productivity is weaker in countries characterised by a unilateral decision wage-setting system This is probably because in such a case the spillover from public to private wages is such that private wages tend to be misaligned with sectoral productivity This is not the case when government wages are set through a collective bargaining wage-setting system possibly because bargaining processes even in a particular type of insulated sector such as the public one reflect market forces more than a unilateral government decision
The relationship between government and manufacturing wages under fiscal stress
Most countries in the euro area have recently been trying to cut government wage bills by freezing wages cutting or retrenching specific indemnities or benefits (including bonuses andor holidays) or blocking turnover As a result the share of government compensations in total government spending has fallen Between 2008 and 2012 this fall was particularly sharp for Latvia Portugal and Romania followed by Hungary Spain Denmark and Estonia (Graph II21)
(40) The results from the DOLS are not shown (41) For a classification of EU wage-setting systems in the government
sector see European Commission Directorate for Economic and Financial Affairs (2014) Government wages and labour market outcomes Occasional Paper forthcoming
30 | Quarterly Report on the Euro Area
(Continued on the next page)
II Special topics on the euro area economy
Volume 13 No 1 | 31
Box (continued)
(Continued on the next page)
32 | Quarterly Report on the Euro Area
Box (continued)
II Special topics on the euro area economy
Volume 13 No 1 | 33
The recent crisis marked a watershed in the evolution of public compensations Between 1999 and 2007 relative government wage growth did not vary from cold-shower periods (or periods of more gradual fiscal consolidation) to periods of non-consolidation (42)
Graph II21 Change in the share of general government compensations to
total spending (2008-2012 in pp)
Source DG ECFIN calculations based on AMECO
Conversely starting with the 2008-2009 crisis compensations per employee in the government sector grew more slowly compared with those in the manufacturing sector and more clearly so during fiscal consolidation (Graph II22)
It is possible that under conditions of fiscal stress the relationship between government and export sector wages differs from that of normal periods This aspect has been neglected in previous analyses To shed some light on it Table II21 shows the correlation between government wage growth and manufacturing wage growth under alternative fiscal conditions (consolidation and non-consolidation) differentiating between countries with large and small public sectors The evidence shows that the two wages are closely related in periods of fiscal stress only if the government employs a large share of the labour forces This suggests that the possibility of
(42) By convention episodes of fiscal consolidation are defined as those during which the structural primary balance improves by at least 15 per cent of GDP in one year or at least 3 per cent in three years with a minimum improvement of 05 per cent in each year Such a definition makes it possible to distinguish between cases of cold-shower consolidation episodes and more gradual consolidation episodes
expenditure-based fiscal consolidation having the type of supply-side effects described in Alesina and Perotti (1997) Alesina et al (2002) and Ardagna (2004) may be a consequence of the size of the public sector among other things
Graph II22 Government and manufacturing compensations under
alternative fiscal conditions EU countries (1999-2007 and 2008-2012 avg annual change)
Source DG ECFIN calculations based on OECD
Table II21 Correlation between government and manufacturing
compensations growth under alternative fiscal conditions EU (1)
(1) Pearson correlation coefficients Sample EU countries (excluding AT BG CY DE EL LT LV MT RO SI) over 1980-2012 (1995-2012 in the case of CZ EE HU SK) Source DG ECFIN calculations based on OECD
Concluding remarks
Spillovers which are the result of high wages in the general government sector have been mentioned as one of the drivers of competitiveness losses in
34 | Quarterly Report on the Euro Area
some countries in the euro area before the crisis (43)
The results presented here speak to this debate and may be summarised as follows Government wage levels have a long-term impact on wages in the manufacturing sector even more so in countries in which the government sector employs a relatively large share of the labour force That said their short-term impact remains unaffected by the size of the public sector Looking at it the other way round manufacturing wages usually have a greater impact on government wages regardless of size This is arguably because private sector wage leadership is more common than public sector wage leadership
(43) Blanchard O (2007) Adjustment within the euro The difficult
case of Portugal in Portuguese Economic Journal 61 1-21
The way government wages are set also plays a role In collective bargaining systems not only are government and manufacturing wages related in both the long- and the short-term (as they are also when the government sets wages by unilateral decision) Also most importantly wages in the tradable sector are better aligned with labour productivity The evidence provided here indicates that if the government wage bill is inflated for example due to unjustified wage premia limiting public wage growth would spill over into the private export sector reducing labour costs and helping boost competitiveness and employment in the sector Whilst structural reforms including skill upgrading in manufacturing are an important and necessary ingredient for achieving non-reversible gains in competitiveness the adjustment of competitiveness through fiscal policy remains a complementary tool to deliver sustained external rebalancing
II Special topics on the euro area economy
Volume 13 No 1 | 35
II3 Latvia maintaining sustainable growth after the boom-bust years (44)
Latvia had been keen to join the euro area at the earliest opportunity with entry in January 2008 the clear target As the economy overheated however significant macro-economic imbalances accumulated which deferred these plans Between 2005 and 2007 unsustainable GDP growth went hand in hand with a mounting current account deficit and a housing market spiralling out of control When credit flows then abruptly reversed the countryrsquos GDP contracted dramatically Latvia was placed in the EUIMF-led financial assistance programme and was forced to carry out ambitious fiscal consolidation and structural reforms Reallocating resources to the tradable sector was the first important step on the road to an export-driven recovery Under the burden of deleveraging and consolidation the revival of domestic demand was slow at first From 2011 however supported by favourable labour market developments growth in demand has accelerated Latvia has reclaimed its position as the fastest-growing EU economy however the current level of growth is lower than the unstainable rates recorded in the boom years and it is now seen as sustainable Thanks to this balanced growth Latvia has not been subject to the MIP since its launch in 2012 Despite the financial assistance-supported measures to preserve equity the social burden of economic adjustment as evidenced by poverty social exclusion and emigration rates has been high but measures are being taken by the authorities to counter these effects Continued commitment to prudent fiscal policies will be critical for the countryrsquos economic future The use of macro-prudential tools to reduce the risks posed by large non-resident financial flows and the implementation of ambitious structural reforms will also play an important role
-----------------------
Introduction
To welcome Latvias recent adoption of the euro this section reviews the countrys recent boom-bust experience and discusses the challenges ahead
Five years ago it would have been difficult to imagine that Latvia would be able to fulfil the conditions for adopting the euro and enter the euro
(44) Section prepared by Gatis Eglitis and Christian Weise
area in January 2014 After EU accession in May 2004 significant macro-economic imbalances had started to accumulate on the back of an overheating economy and by autumn 2008 the country was on the brink of bankruptcy A painful and seemingly impossible economic adjustment to be achieved by means of internal devaluation lay ahead This would require unprecedented fiscal consolidation huge redundancies and difficult structural reforms threatening political and social stability Yet despite pronounced scepticism from the outset and particularly at the height of the crisis in mid-2009 the economy has moved back to growth The measures implemented took some time to take effect with the economy continuing to decline at first before picking up as seen in the lsquoVrsquo-shaped recovery but a protracted recession was avoided Latviarsquos GDP growth has exceeded expectations reaching levels of 54 in 2011 52 in 2012 and around 4 in 2013 The two factors that were critical to the countryrsquos economic recovery were a return to international competitiveness and the rapid correction of external imbalances The budget deficit decreased significantly and is expected to reach a balanced position in the near future The level of government debt is projected to stay around 40-42 of GDP in 2013-2014 and to decline to 33 of GDP in 2015 as the repayments to the EU take effect and sizable cash buffers will be reduced The financial assistance programme was successfully completed in January 2012 Financial support had not been necessary since October 2010 however and the government had re-entered international bond markets in June 2011 well ahead of schedule (45) As of 2013 GDP per capita in constant prices has returned to the level reached at its peak in 2007 Due to the decline in the population however the absolute value of GDP in constant prices was still about 9 below 2007 levels with current projections suggesting that a full recovery to the pre-crisis peak will be achieved in 2015
Overheating imbalances and a big bust
Latvia joined the EU in seemingly good macroeconomic health and having pegged its currency to the Special Drawing Right (SDR) in
(45) Occasional Paper 120 issued by the European Commission Directorate-General for Economic and Financial Affairs EU Balance of Payments assistance for Latvia foundations of success httpseceuropaeueconomy_financepublicationsoccasional_paper2012op120_enhtm
36 | Quarterly Report on the Euro Area
1994 and then to the euro in 2005 was keen to join the euro area in January 2008 Upon entering the Exchange Rate Mechanism II (ERM II) on 2 May 2005 the authorities unilaterally committed to maintaining a smaller fluctuation margin of plusmn1 around the central rate ndash seen as a sign of the countryrsquos determination to join the euro area The Latvian economy was the fastest growing in the EU between 2000 and 2007 and between 2005 and 2007 real GDP growth reached a yearly average of over 10 Following accession to the EU in 2004 Latvia along with other EU countries witnessed a rapid credit expansion Loans to residents grew at an average annual rate of close to 50 between 2004 and 2008 a reflection of the excess liquidity at that time and of the resulting hot money inflows into central and eastern European economies which were rapidly converging with their western European counterparts Foreign investment exploded driven by commercial banksrsquo mispricing of risk and over-optimistic expectations of convergence A number of privatisation deals and most importantly a burgeoning real-estate market characterised by soaring prices also served to attract foreign investors The tradable sector was meanwhile largely neglected By way of illustration foreign direct investment (FDI) reached relatively high levels of 84 and 81 of GDP in 2006 and 2007 respectively but most of this was directed towards the real-estate market while the proportion of total FDI relating to manufacturing was only 12 in 2013 Significant imbalances were accumulating as indicated by a current account deficit that reached around 22 of GDP in 2006 and 2007 and by labour market tightening Nominal wages doubled between 2004 and 2007 increasing much faster than productivity and thus damaging international competitiveness
By early 2008 more cautious bank lending had caused economic growth to slow significantly By autumn of the same year this slowdown had developed into a strong contraction reflecting the wider global economic situation The global economy fell into recession commodity prices reached record highs and the general risk aversion seen in global markets following the collapse of Lehman Brothers cut off Latviarsquos access to financial markets The second largest domestic bank Parex had to be rescued Latvia ultimately experienced the most severe GDP contraction of all EU countries at close to 18 in 2009 The government deficit threatened to spiral out of control Having been at 03 of GDP in 2007 and 42 in 2008 in spring 2009 it was projected to
reach levels well above 15 of GDP by the end of year in the absence of a significant consolidation package
Faced with an economic crisis of this order Latvia agreed a medium-term financial assistance programme the balance of payments programme (BoP) with the EU and the IMF in December 2008 (46) The aim of this was to preserve the existing exchange-rate arrangement The assistance offered to Latvia was made subject to a number of policy conditions relating to fiscal consolidation financial sector stabilisation and the introduction of a wide range of structural reforms including a significant acceleration in the absorption of EU structural funds The Latvian government also undertook to strengthen the social safety net so as to protect the most vulnerable from the effects of the crisis
Brave measures in difficult times
Given that the exchange rate was at that time pegged to the euro some economists suggested devaluation as the only way out of the crisis The national authorities and international partners did not see that as a viable option however because its effectiveness would have been severely limited by the degree to which imports were used in the manufacture of exports and the high proportion of foreign liabilities Furthermore it would have brought with it the risk of mass bankruptcy and a partial collapse of the domestic banking system at a time when the judicial system was clearly not capable of coping with such a fall-out In addition devaluation would have provided no incentive to solve Latviarsquos structural problems including weak fiscal governance the unsustainability of pension expenditure loss-making state-owned banks a lack of competitiveness and weak institutions
Between 2009 and 2011 the Latvian government carried out an ambitious programme of fiscal adjustment designed to correct the previously loose fiscal policy the weaknesses of which had been hidden by the countryrsquos strong economic growth This difficult adjustment restored Latviarsquos public finances to better health and established a
(46) Funds available from EU countries IMF World Bank EBRD
and Norway amounted to euro 75 billion of which Latvia used euro 45 billion (60) with euro 29 billion lent by the European Commission on behalf of the EU The first tranche of EUR 1 billion (13 of the total) was repaid by Latvia on 25 March 2014
II Special topics on the euro area economy
Volume 13 No 1 | 37
framework which would be sustainable in the long term The nominal balance improved with the deficit being cut from 98 of GDP in 2009 to 13 of GDP in 2012 and 2013 (see graph II31) The structural deficit also fell from its peak of 55 of GDP in 2008 to around 025 of GDP in 2012 and 2013 beating Latviarsquos medium-term objective of -05 of GDP as set in the convergence programmes
Latviarsquos fiscal consolidation measures were undoubtedly bold with fiscal savings equivalent to around 17 of GDP implemented within three years The measures were frontloaded and half of these savings were implemented in the first year alone The measures were on the whole expenditure-oriented with over half of the savings coming from cuts to health education and public administration budgets The most notable measure relating to revenue was an increase in VAT from 18 to 22 The consolidation strategy was eventually successful in containing the adverse effects of the budget deficit on the economy In fact it even appears to have triggered lsquonon-Keynesianrsquo effects on demand by restoring confidence and stimulating demand and investment at the point when it was most needed (47)
Graph II31 Latviarsquos government budget balance and debt (2008-15 of GDP)
Source DG ECFIN Commissionrsquos spring 2013 forecast
The fiscal framework was also strengthened significantly by the law on fiscal discipline coming into force in March 2013 and the creation of a fiscal council in January 2014 The signing of the
(47) Ibid see Chapter 4 Fiscal consolidation in the midst of the crisis
Treaty on Stability Coordination and Governance in the EMU (48) in March 2012 provided further EU-level support for the national fiscal framework
An additional factor that was critical to the success of the consolidation strategy but is often overlooked was the availability of significant EU funds (particularly from around 2009 onwards) which acted as a much-needed demand trigger in sectors affected by the decline in economic activity Between 2007 and 2013 Latvia benefited from the third highest allocation of EU funds after Hungary and Lithuania receiving a yearly average equivalent to around 28 of GDP or 70 of gross fixed capital formation(49) As on average every euro of national budget spending was supplemented by five to six euros co-financing from EU funds national expenditure on items such as road and public building construction vocational education and training of unemployed science infrastructure development and healthcare was often replaced by Structural funds financing despite being in conflict with the EU funds additionality principle Clearly such large inflows of EU financing also generated substantial tax revenues in particular VAT at a time when private consumption was weak
The Latvian labour market demonstrated a high level of flexibility during the crisis thanks in part to a decentralised wage-setting system Significant public-sector wage cuts indirectly supported nominal wage reduction in the private sector in 2009 and 2010 when earnings per employee fell by a total of 19 over two years Employment levels fell sharply especially in the private sector as jobs were cut in construction and manufacturing The unemployment rate reached around 20 in early 2010 but had fallen back to 119 by 2013 due mainly to growth in employment with the participation rate also increasing significantly over this period The projection from the Commissionrsquos 2014 winter forecast shows wages in 2014-15 growing broadly in line with productivity although the labour market is tightening and structural problems in particular regional differences and skill mismatches could create pressures in the economy
(48) httpeuropean-councileuropaeumedia639235st00tscg26_en12pdf
(49) Source Directorate-General for Regional Policy Infoview
38 | Quarterly Report on the Euro Area
External cost competitiveness has improved noticeably since 2008 with labour costs falling significantly and labour productivity in particular in the tradable sector increasing In 2008 the real effective exchange rate (REER) adjusted for unit labour costs reached a peak of 64 above the 2000 level before falling by about 20 in 2009-10 since when it has remained broadly stable (see graph II32) This level of REER is considered sustainable as the country has been seen to be steadily gaining market share over recent years (including as measured by exports adjusted for the growth of markets) The percentage of the countryrsquos GDP attributable to exports rose to 60 in 2013 from 43 in 2007 with some 60 of exports destined for the EU and 12 for Russia
Graph II32 Effective exchange rates Latvia v 35 trading partners
(Jan 2007-Dec 2013 monthly avg 2007 = 100)
Source DG ECFIN
The social burden of economic adjustment has admittedly been high in Latvia despite the policy measures contained in the Memorandum of Understanding stipulating inter alia establishment of a comprehensive social safety net supporting local governments in providing social assistance and discounting social payments from overall budget targets High unemployment has led to a wave of emigration to richer EU countries which coupled with Latviarsquos low fertility and high death rates has seen the population decrease by 8-10 since 2008 Net emigration has now fallen substantially however since the peak of the crisis years The rates of poverty and social exclusion in Latvia are among the highest in the EU families with children unemployed people people with disabilities and people living in rural areas are particularly at risk The countryrsquos spending on
social protection and healthcare as a percentage of GDP is among the lowest in the EU Furthermore the social protection measures which do exist to reduce poverty tend to be ineffective highlighting the importance of a robust social safety net It appears however that with the improved economic situation and increasing levels of general social awareness the authorities are finally starting to address the challenges of poverty and social exclusion with greater determination In recent years for example taxation of low-income earners has been cut slightly and child poverty has been reduced thanks to increases in various child-related benefits Proposals for reforms to social assistance in line with 2013 World Banks study are being gradually implemented Better targeted more effective policies relating to the active labour market mostly financed by the European Social Fund are helping unemployed people in particular the long-term unemployed and young people to find work or to obtain relevant training
As part of the BoP programme and in the context of the assessment of Latviarsquos readiness to join the euro area financial supervision has been tightened and EU resources for supervision and monitoring increased in particular for monitoring the growing non-resident banking sector Additional liquidity and capital adequacy requirements for non-resident banks were introduced in 2013 regular on- and off-site checks of these banks are being performed the deposit guarantee fund has been further strengthened and monitoring has been stepped up in relation to pledged assets and the origin of funds in bank recapitalizations This strengthened regulatory policy has been introduced partly as a result of lessons learnt at significant cost in the past five years most notably with the Parex and Krajbanka failures
Latvia has implemented a series of ambitious reforms to the business environment in recent years with the aim of reducing start-up costs simplifying procedures for property registration construction permits and tax collection and introducing out-of-court settlement of insolvencies In doing so Latvia has brought its regulatory framework a significant step closer to what is regarded as best practice In the World Bankrsquos 2014 Doing Business report Latvia was ranked 25th out of 185 countries with only four euro-area members faring better
II Special topics on the euro area economy
Volume 13 No 1 | 39
Conclusion
The origins of Latviarsquos years of boom and bust can be traced back to the domestic regional and global circumstances at that time globally excess liquidity and hot money flowing into vulnerable countries regionally unrealistic expectations of income convergence in central and eastern Europe and domestically undue optimism about growth in personal incomes and mispricing of risk by commercial banks amplified by the behaviour of both policymakers and individuals
A broad range of country-specific and general economic factors have contributed to the successful economic adjustment seen in Latvia since the height of the crisis Ambitious front-loaded and largely expenditure-based fiscal consolidation helped to contain the budget deficit whilst the confidence generated by the introduction of a credible programme itself aided the economic recovery The flexibility of the labour market meanwhile helped companies to restore competitiveness by means of wage reductions and job cuts Competitiveness was also improved by steps taken to shift the tax burden from labour to consumption and property The recovery in Latvia was very much export-driven with the growth in exports made possible by the openness of the economy and the faster-than-expected economic growth experienced by major trading partners A number of structural reforms including bank restructuring and measures improving the use of EU funds have contributed to the development of a more favourable business environment A generous allocation from the European structural funds meanwhile helped to boost public investment and supported financing and reforms in many important sectors Above all the success of the recovery measures implemented in Latvia proved that for a tough internal economic adjustment to be effective there needs to be both a determined political will to carry out unpopular reforms and also a fully-developed comprehensive social safety net to protect more vulnerable groups
in society during difficult times In addition Latvia benefited from the fact that those looking for work were able to migrate to other EU countries which helped to alleviate the social tension created by the effects of the crisis Some of the lessons above are clearly applicable to other Member States undergoing challenging economic adjustment while others are more Latvia-specific
While Latviarsquos current level of economic growth is regarded as sustainable (50) and the adoption of the euro is recognised as a significant and hard-earned achievement it is not the end of the road The current robust economic situation should be used to advance reforms and improve Latvias long-term growth potential rather than lead to complacency and relaxation of reform efforts Sustainable convergence of the economy in the longer term will require inter alia ongoing commitment to prudent fiscal policies (there are some recent signs of less prudent fiscal decision-making) a continuous use of macro-prudential tools to reduce risks from growing non-resident financial flows especially in view of recent Ukraine events and the implementation of reforms in a number of vested-interest-heavy areas These include higher education and science state owned enterprise management electricity and gas market liberalization and the judiciary including insolvency framework But above all and in order to ensure economic and social sustainability for years to come high rates of poverty social exclusion and dismal demographic trends need to be addressed boldly These and other structural challenges are being addressed by the Commission under the European Semester and the Post Program Surveillance frameworks Also Latvia has joined a euro area that is very different from what it was just a few years ago the euro area economic governance framework has been greatly strengthened entailing stricter obligations
(50) The Commissionrsquos alert mechanism reports issued under the Macroeconomic Imbalance Procedure have not identified economic imbalances in Latvia requiring further in-depth investigation for possible policy action
httpeceuropaeueurope2020pdf2014amr2014_enpdf
40 | Quarterly Report on the Euro Area
II4 Corporate balance sheet adjustment in the euro area and the United States (51)
This section compares balance sheet adjustment in the non-financial corporate sector in the euro area and the United States It shows that the adjustment since the crisis has been faster in the latter Despite similar steep rises in corporate debt in pre-crisis years US corporations have cut debt more than those in the euro area Shifts from loans to bonds and extensions of debt maturity have also been more pronounced in the United States Much of the difference in balance sheet consolidation can be traced back to more positive profitability trends providing US firms with the internal funds necessary to adjust balance sheets Differences in dividend distribution strategies and in corporations physical investment behaviours also played a role Profitability differences reflect differences both in cyclical conditions and labour market adjustment Comparatively slow progress in balance sheet consolidation is likely to weigh on investment recovery in the euro area
-----------------------
Introduction
Both the euro area and the United States experienced a surge in corporate indebtedness in the years preceding the global financial crisis and in its early stages The ratio of debt to gross value added by non-financial corporations (NFCs) rose by about 40 pp between 2005 and 2009 Deteriorating growth prospects and changing attitudes to risk have prompted NFCs in both economies to adjust their balance sheets As previously argued in the Quarterly Report balance sheet adjustment can have a substantial effect on economic activity and it is important to monitor regularly the ongoing adjustment in the euro area (52) This section contributes to the monitoring by comparing progress in corporate deleveraging in the euro area and in the United States two regions where firms entered the crisis with excessive debt
(51) Section prepared by Plamen Nikolov (52) See European Commission (2010) Focus Balance sheet
adjustment in the corporate sector Quarterly Report on the Euro Area Vol9 (3) pp 9-19 A more detailed overview of the literature on the impact of balance sheet adjustment can be found in Cuerpo C I Drumond J Lendvai P Pontuch and R Raciborski (2013) Indebtedness deleveraging dynamics and macroeconomic adjustment European Economy Economic Papers 477
Firms consolidate their balance sheets primarily by raising their net lendingborrowing (NLB) ie the cash obtained from their production activity and available for financial operations (53) A rise in NLB is achieved either by increasing savings or cuttingpostponing physical investment Firms increase savings by raising profits and reducing the dividends distributed to shareholders In firmsrsquo financial accounts a rise in corporate NLB is associated with a rise in financial assets andor a cut in financial liabilities The section reviews recent developments in euro area and US profitability savings and NLB and looks at the instruments that the corporate sector has used to consolidate its balance sheet on both the asset and the liability side
Corporate profits have disappointed in the euro area hellip
National account data show that corporate profitability in the euro area reached a pre-crisis peak in 2007Q3 ie later than in the United States where it had already started to decline in 2007 (54)
Graph II41 NFC profitability euro area and US
(2000Q1-2013Q3 of GVA)
20
25
30
35
40
45
00Q1 01Q3 03Q1 04Q3 06Q1 07Q3 09Q1 10Q3 12Q1 13Q3
Euro area (1)
US
(1)Excluding Latvia Source Eurostat US Bureau of Economic Analysis DG ECFIN calculations
(53) Firms can also consolidate their balance sheets by raising equity (54) Profitability like the other national account variables for the
corporate sector presented in this section is measured as a proportion of corporate sector activity represented by gross value added (GVA) It is calculated as the gross operating surplus plus financial revenues and subsidies and minus financial and tax expenses Financial expenses do not include earnings distributed to shareholders
II Special topics on the euro area economy
Volume 13 No 1 | 41
The 2008-09 recession brought a sharp drop in corporate profitability in the euro area Profitability recovered briefly in 2010 to reach a new peak in 2011 but has declined again since then (Graph II41) In the United States the impact of the crisis was rather muted with profits recovering vigorously after 2008 As a ratio to gross value added (GVA) US corporate profits had already passed their pre-crisis level in 2009 before flattening out in the past two years Overall by 2013 profitability in the euro area was still about 2 pp below its pre-crisis peak while in the United States it stood around 3 pp above
hellip mostly due to weak operating surplus
The disappointing profit performance in the euro area relative to the United States is largely due to differing developments in gross operating surplus Looking at the breakdown of the contribution to the cumulative change in corporate profitability since the start of the crisis there is a marked difference between firms in the euro area and those in the United States (Graphs II42 and II43) (55)
Graph II42 Profitability breakdown of NFCs euro area (1)
(cumulative change in from 2007Q3 peak to 2013Q3)
35
36
37
38
39
40
41
42
-100
-80
-60
-40
-20
0
20
40
60
80
100
07Q4 08Q4 09Q4 10Q4 11Q4 12Q4
Taxes (lhs)
Other net current transfers received (lhs)
Net property income received excl dividends paid (lhs)
Operating surplus (lhs)
Profits(rhs)(2)
(1)Excluding Latvia(2)Profits in of GVA Source Eurostat DG ECFIN calculations
In the euro area a fall in the ratio of operating surplus to GVA dragged overall profitability down after 2008 Despite an improvement in 2011 in
(55) The illustration of the contributions to the cumulative change in profitability only serves to depict the relative importance of the various components of the change in profits since the crisis The starting point for the cumulative change should not be interpreted as a reference point for a desirable profit recovery
2013 operating surplus was still contributing negatively to the cumulative change in profitability since the pre-crisis peak In contrast operating surplus in the United States responded to the crisis earlier than in the euro area but its contribution to the change in profits remained positive
Graph II43 Profitability breakdown of NFCs US
(cumulative change in from 2005Q3 peak to 2013Q3)
24
25
26
27
28
29
30
31
-100
-80
-60
-40
-20
0
20
40
60
80
100
05Q4 06Q4 07Q4 08Q4 09Q4 10Q4 11Q4 12Q4
Taxes (lhs)Other net current transfers received (lhs)Net property income received excl dividends paid (lhs)Operating surplus (lhs)Profits(rhs)(2)
(1) Profits in of GVA Source Federal Reserve Board US Bureau of Economic Analysis DG ECFIN calculations
Unlike operating surplus income tax payments and net income from non-operational activities did not differ significantly between the euro area and the United States (56) In both economies lower corporate tax payments resulting from lower profits generated by NFCs naturally had a positive impact on the cumulative change in profits from the pre-crisis peak
Differences in labour market developments are at the root of differences in profitability
Differences in operating surplus and profitability between the United States and the euro area can be attributed partly to differences in the business cycle In 2011Q1 NFCsrsquo gross value added was still 12 below its pre-crisis peak in the euro area but 11 above in the United States The main channel through which cyclical developments can affect operating surplus is the labour market
(56) In fact the ratio of profit tax payments to profits (a crude measure of an aggregate tax rate) in the euro area and the United States has been almost the same since the start of the crisis falling substantially in 2008-09 indicating that tax policy was not more favourable for profits in one economy than in the other
42 | Quarterly Report on the Euro Area
The cyclicality of operating surplus depends on the impact of the cycle on labour productivity as well as on wages The worse performance of operating surplus in the euro area since 2008 as compared with that in the United States reflects a stronger deterioration in labour productivity accompanied by unfavourable developments in wages per employee
Labour productivity growth in the euro area turned sharply negative in 2009 opening a big gap with the positive (albeit modest) wage growth (Graph II44) In the United States on the other hand labour productivity growth became negative earlier but to a lesser extent and some downward wage adjustment took place in 2009
Graph II44 Labour productivity and wages euro area and US
(2001Q4-2013Q3 y-o-y change)
-4
-3
-2
-1
0
1
2
3
4
5
01Q4 03Q2 04Q4 06Q2 07Q4 09Q2 10Q4 12Q2
Average wage per employee euro area (1) (2)Average wage per employee US (1)Labour productivity euro area (2) (3)Labour productivity US (3)
(1)Real wages calculated by the GDP deflator(2)Euro area excluding Latvia(3)In terms of total employment (thousands) Source Eurostat US Bureau of Economic Analysis US Bureau of Labour Statistics DG ECFIN calculations
There are a number of reasons for the different labour adjustments in the euro area and the United States In the former apart from a higher level of employment protection short-term work schemes were put in place in the early stages of the crisis (57) In addition as labour force adjustment tends to be more costly in the euro area some firms (particularly small firms and those with highly qualified employees) preferred to retain their
(57) According to the OECD Public short-term work schemes have
played an important role in preserving jobs during the crisis in a number of countries although significant hours reductions were also achieved via lower overtime hours hours averaging arrangements and employer initiatives see OECD Employment Outlook 2010 ndash Moving Beyond the Job Crisis
labour force (58) Because of a lack of wage flexibility the higher degree of lsquolabour hoardingrsquo in the euro area came at the expense of lower operating surplus and profits and consequently put a downward pressure on the capacity accumulate internal funds to deleverage
Corporate savings are much lower in the euro area
Negative developments in euro area corporate profitability were reflected in corporate savings which together with physical investment determines the internal funds available for balance sheet adjustment In 2009-10 there was a sharp drop in euro area savings because profits acted as shock absorbers and fell more rapidly than dividend payments leaving less spare cash available In contrast savings by US NFCs increased substantially on rising profits after an early-crisis low point and reached a historically high level of around 23 of GVA in 2010Q3 (Graph II45)
Graph II45 Savings of NFCs (2000Q1- 2013Q3 of GVA)
15
16
17
18
19
20
21
22
23
24
00Q1 01Q3 03Q1 04Q3 06Q1 07Q3 09Q1 10Q3 12Q1 13Q3
Euro area (1)
US
(1)Euro area excluding Latvia Source Eurostat Bureau of Economic Analysis DG ECFIN calculations
The impression that US corporate behaviour has been more geared towards accumulating savings than that in the euro area is reinforced when one looks at dividend distribution Dividends paid by euro area NFCs have been on a declining trend since the start of the crisis but those paid by US firms have also decreased This is remarkable given (58) See Box 12 Labour hoarding across different types of firms in
OECD Employment Outlook 2010 ndash Moving Beyond the Job Crisis
II Special topics on the euro area economy
Volume 13 No 1 | 43
the positive profit developments in the United States (Graph II46) A drop in dividends alongside profit growth suggests that after 2008 US companies preferred to direct a bigger proportion of the profit recovery to corporate savings and thereby balance sheet adjustment The ratio of dividends to profits in the United States has fallen from about one third before the crisis to one quarter now This ratio also dropped in the euro area although by less (59)
Graph II46 Dividends paid of NFCs (2000Q1-2013Q3 of GVA)
0
5
10
15
20
25
00Q1 01Q3 03Q1 04Q3 06Q1 07Q3 09Q1 10Q3 12Q1 13Q3
Euro area (1)
US
(1)Euro area excluding Latvia Source Eurostat Federal Reserve Board DG ECFIN calculations
Disappointing physical investment in the euro area and the United States
Cutting investment in physical assets is another way of reducing excessive indebtedness Corporate investment as a proportion of activity dropped sharply both in the euro area and in the United States in the early stages of the crisis (Graph II47)
After a modest recovery in 2010-11 the investment rate decreased again in the euro area The investment recovery was more solid in the United States but has lost momentum since the end of 2012 and the investment rate remains below its pre-crisis peak Overall it seems that euro area corporations partly compensated for less supportive savings developments than in the US by
(59) Dividend payments are not the only way of distributing profits to shareholders Equity buybacks can also be used for this purpose and firms that choose this option will tend to have higher savings and lower dividends paid
curbing physical investment more than their US counterparts
Graph II47 Investment of NFCs (2000Q1- 2013Q3 of GVA)
15
16
17
18
19
20
21
22
23
24
00Q1 01Q3 03Q1 04Q3 06Q1 07Q3 09Q1 10Q3 12Q1 13Q3
Euro area (1)
US
(1)Excluding Latvia Source Eurostat US Bureau of Economic Analysis DG ECFIN calculations
A more modest increase in net lending in the euro area than in the US
Since 2013 firmsrsquo net lending in the euro area has been in positive territory but substantially less so than that in the United States (Graph II48) Positive NLB in the euro area unlike that in the United States is mostly due to a low investment rate alone rather than low investment combined with high savings The combination of disappointing investment and high savings has translated into historically high and sustained NLB for US firms
This persistent net lending position in the United States is atypical as firms usually invest more than they save It suggests that US firms have been adjusting their balance sheets significantly since the beginning of the crisis via their internal funds while euro area firms seem to have opted for much slower balance sheet adjustment
44 | Quarterly Report on the Euro Area
Graph II48 Net lendingborrowing of NFCs
(2000Q1- 2013Q3 of GVA)
-10
-8
-6
-4
-2
0
2
4
6
8
00Q1 01Q3 03Q1 04Q3 06Q1 07Q3 09Q1 10Q3 12Q1 13Q3
Euro area (1)
US
(1)Excluding Latvia Source Eurostat US Bureau of Economic Analysis DG ECFIN calculations
Debt deleveraging has been more pronounced in the US than in the euro area
The faster pace of adjustment of balance sheets in the United States is confirmed by the corporate debt data (Graph II49) (60) (61) While both the euro area and the United States entered the crisis with swiftly rising and historically high levels of debt deleveraging has progressed more rapidly in the latter since the crisis By the beginning of 2012 US corporate debt had fallen by approximately 15 pp as a proportion of activity while euro area debt had dropped by 7 pp (62)
(60) Non-financial corporate debt consists of loans and securities
other than shares (corporate bonds) both can be classified as short- or long-term depending on whether their original maturity is less or more than one year
(61) This section analyses developments in non-consolidated financial flows and stocks in the euro area and in the United States for two reasons it is important to have a sense of financial positions within the institutional sector eg loans between NFCs are an important part of intra-firm relationships as head offices use them to finance subsidiaries for example perhaps for tax reasons This is relatively more important in the euro area than in the United States Consolidated financial asset and flow data eliminate these intra-sector positions and different approaches may be taken to consolidation as in the euro area there is the additional issue of cross-border consolidation between Member States while there is no need for flows and positions between firms in different US states to be treated separately
(62) The debt-to-equity ratio is another measure of corporate leverage widely followed by investors Faster stock market recovery helped US firms reduce this ratio more than those in the euro area
Graph II49 Debt levels of NFCs(1) (1999Q1-2013Q3 of GVA)
100
120
140
160
180
200
220
99Q1 00Q3 02Q1 03Q3 05Q1 06Q3 08Q1 09Q3 11Q1 12Q3
Euro area (2)
US
(1)Securities other than shares and loans(2)Excluding Latvia Source Eurostat US Bureau of Economic Analysis DG ECFIN calculations
Firms in the euro area and the United States entered the crisis with almost the same level of short-term debt as a proportion of total debt Since the crisis the adjustment away from short-term debt has been significantly more pronounced in the United States suggesting more active balance sheet restructuring
Graph II410 Debt flows of NFCs(1) (1999Q1- 2013Q3 of GVA)
-15
-10
-5
0
5
10
15
20
99Q1 01Q1 03Q1 05Q1 07Q1 09Q1 11Q1 13Q1
Euro area bonds (2)
US bonds
Euro area loans (2)
US loans
(1)Securities other than shares and loans (2)Excluding Latvia Source Eurostat US Bureau of Economic Analysis DG ECFIN calculations
Due to differences in the structure of corporate finance loans (as opposed to bonds) tend to form a bigger proportion of debt in the euro area than in the United States An important element of the
II Special topics on the euro area economy
Volume 13 No 1 | 45
corporate balance sheet adjustment process in both economies has been a movement away from an excessive reliance on loans (Graph II410) and towards bond financing This trend has been substantially more pronounced in the United States presumably reflecting the fact that bond markets are more developed in that country
Developments in non-financial corporate debt were also influenced by developments in financial intermediation in particular in the banking sector Financial accounts show NFCsrsquo debt exposure but do not indicate whether the debt holder is a bank According to bank balance sheet statistics the nominal growth of loans vis-agrave-vis NFCs has been mostly negative in the euro area since 2009Q4 (Graph II411) Coupled with the positive loan inflows seen in the national accounts between 2010Q3 and 2012Q3 (Graph II410) this shows a degree of substitution in corporate loan liability ownership between banks and other financial firms and sectors (including other NFCs) in this period According to the counterparty breakdown of NFC domestic loans published by the ECB corporate borrowings from other NFCs represented 29 of all loans by 2013Q3 (up from 26 in 2008Q1) while the proportion of borrowings from monetary financial institutions (MFIs) had dropped (from 60 in 2008Q1) to an all-time low of 53 The proportion of loans from other non-bank financial intermediaries also increased There is less evidence of a shift from banks to other loan providers in the United States where loans between NFCs are much more limited
Graph II411 Bank loans to NFCs (1999Q1- 2013Q3 y-o-y change)
-20
-15
-10
-5
0
5
10
15
20
25
99Q1 00Q3 02Q1 03Q3 05Q1 06Q3 08Q1 09Q3 11Q1 12Q3
Euro area bank loans to NFCs (1)US bank loans to NFCs
(1)Excluding Latvia Source ECB US Federal Reserve Board DG ECFIN calculations
Positive NLB has been used to acquire safe financial assets in both regions
In both the euro area and the United States the positive NLB has been used to deleverage but also to invest in safe financial assets At the beginning of the crisis much of the positive corporate NLB in the United States was invested in money market mutual funds which is essentially investment in short-term low-risk assets (Graph II412) (63)
Currency and deposits (another type of safe asset) have increased substantially in the euro area in recent years as a proportion of total firm activity (Graph II413) This rise was driven almost exclusively by a rapid increase in firmsrsquo savings deposits To some extent a similar trend is observable in the United States In particular US cash balances (a sub-component of currency and deposits) approached 12 of GVA by the end of 2013 a level not seen since the early 1990s On the other hand savings deposits have grown more modestly resulting in a moderately positive overall trend in currency and deposits
Graph II412 Mutual fund shares of NFCs (1999Q1- 2013Q3 of GVA)
0
2
4
6
8
10
12
14
99Q1 01Q1 03Q1 05Q1 07Q1 09Q1 11Q1 13Q1
Euro area (1)
US (2)
(1)Excluding Latvia(2)In the USA these asset series can be broken down into investment in money market mutual funds and investment in other mutual funds The 2009-11 increase is fully attributable to the former Source Eurostat US Bureau of Economic Analysis DG ECFIN calculations
Overall these two aspects of corporate financial investment behaviour signify considerable liquidity concerns on the part of firms in both the euro area
(63) Euro area financial accounts only show firmsrsquo investment in mutual funds overall and do not distinguish between types of mutual funds
46 | Quarterly Report on the Euro Area
and the United States They also represent a drive towards lower-risk assets perhaps indicating increased risk aversion by corporations or a tendency to postpone physical investment in a context of perceived high uncertainty
Graph II413 Currency and deposits ndash NFCs
(1999Q1- 2013Q3 of GVA)
0
5
10
15
20
25
30
35
40
45
99Q1 00Q3 02Q1 03Q3 05Q1 06Q3 08Q1 09Q3 11Q1 12Q3
Euro area (1)
US
(1)Excluding Latvia Source Eurostat US Bureau of Economic Analysis DG ECFIN calculations
Conclusion
Although both regions saw similar steep rises in corporate debt in the pre-crisis years balance sheet adjustment since the crisis has been significantly slower in the euro area than in the United States The more rapid adjustment in the United States can be explained by a stronger cyclical recovery more supportive profitability developments and reduced dividend payment ratios In the euro area profitability has been hindered by a combination of lower flexibility in the labour markets and slow wage adjustment
The slower balance sheet adjustment in the euro area corporate sector is visible in a slower fall in indebtedness but also a slower adjustment of the structure of balance sheets In particular the shift from loans to bonds and the extension of debt maturity have been more pronounced in the United States In both regions firms have used their positive NLB to accelerate the accumulation of safe and liquid financial assets This could reflect continuing uncertainty regarding future demand and growth prospects
Overall the evidence discussed in this section shows that euro area firms are lagging significantly behind their US counterparts in terms of balance sheet consolidation Given that investment rates remain disappointing even in the more advanced US corporate sector a degree of caution appears warranted when assessing short-term prospects for corporate investment in the euro area
III Recent DG ECFIN publications
Volume 13 No 1 | 47
1 Occasional Papers
European Economy Occasional Papers 170 January 2014 Financial Assistance Programme for the Recapitalisation of Financial Institutions in Spain Fifth Review ndash Winter 2014 httpeceuropaeueconomy_financepublicationsoccasional_paper2014pdfocp170_enpdf
European Economy Occasional Papers 169 December 2013 The Economic Adjustment Programme for Cyprus Second Review ndash Autumn 2013 httpeceuropaeueconomy_financepublicationsoccasional_paper2013pdfocp169_enpdf
European Economy Occasional Papers 168 December 2013 Fiscal frameworks in the European Union ommission services country factsheets for the Autumn 2013 Peer Review httpeceuropaeueconomy_financepublicationsoccasional_paper2013pdfocp168_enpdf
European Economy Occasional Papers 167 December 2013 Economic Adjustment Programme for Ireland - Autumn 2013 Review httpeceuropaeueconomy_financepublicationsoccasional_paper2013pdfocp167_enpdf
European Economy Occasional Papers 166 December 2013 Progress towards meeting the economic criteria for EU accession the EU Commissionrsquos 2013 assessments httpeceuropaeueconomy_financepublicationsoccasional_paper2013pdfocp166_enpdf
European Economy Occasional Papers 165 November 2013 Romania Balance-of-Payments Assistance Programme 2013-2015 httpeceuropaeueconomy_financepublicationsoccasional_paper2013pdfocp165_enpdf
European Economy Occasional Papers 164 November 2013 The Economic Adjustment Programme for Portugal Eighth and Ninth Review httpeceuropaeueconomy_financepublicationsoccasional_paper2013pdfocp164_enpdf
European Economy Occasional Papers 163 November 2013 Financial Assistance Programme for the Recapitalisation of Financial Institutions in Spain Fourth Review ndash Autumn 2013 httpeceuropaeueconomy_financepublicationsoccasional_paper2013pdfocp163_enpdf
European Economy Occasional Papers 162 October 2013 Economic Adjustment Programme for Ireland Summer 2013 Review httpeceuropaeueconomy_financepublicationsoccasional_paper2013pdfocp162_enpdf
2 Economic papers
European Economy Economic Papers 514 February 2014 Martin Larch Kristin Magnusson Bernard Balint Tatar Hard work and More How to successfully conduct adjustment with official assistance httpeceuropaeueconomy_financepublicationseconomic_paper2014pdfecp514_enpdf
European Economy Economic Papers 513 February 2014 Florian Woumlhlbier Caterina Astarita Gilles Mourre Consolidation on the revenue side and growth-friendly tax structures an indicator based approach httpeceuropaeueconomy_financepublicationseconomic_paper2014pdfecp513_enpdf
48 | Quarterly Report on the Euro Area
European Economy Economic Papers 512 December 2013 Alexander Schwan Etienne Sail Assessing the economic and budgetary impact of linking retirement ages and pension benefits to increases in longevity httpeceuropaeueconomy_financepublicationseconomic_paper2013pdfecp512_enpdf 3 Other publications
Winter forecast 2014 - EU economy recovery gaining ground httpeceuropaeueconomy_financepublicationseuropean_economy2014pdfee2_enpdf 4 Regular publications
Business and Consumer Surveys (harmonised surveys for different sectors of the economies in the European Union (EU) and the applicant countries) httpeceuropaeueconomy_financedb_indicatorssurveysindex_enhtm Business Climate Indicator for the euro area (monthly indicator designed to deliver a clear and early assessment of the cyclical situation) httpeceuropaeueconomy_financedb_indicatorssurveysdocuments2013bci_2013_11_enpdf Key indicators for the euro area (presents the most relevant economic statistics concerning the euro area) httpeceuropaeueconomy_financedb_indicatorskey_indicatorsindex_enhtm Monthly and quarterly notes on the euro-denominated bond markets (looks at the volumes of debt issued the maturity structures and the conditions in the market) httpeceuropaeueconomy_financepublicationsbond_marketindex_enhtm Price and Cost Competitiveness httpeceuropaeueconomy_financedb_indicatorscompetitivenessindex_enhtm
50 | Quarterly Report on the Euro Area
Editor-in-Chief Elena Flores
Overall coordination Eric Ruscher
Data assistance Christos Zavos
Comments on the report would be gratefully received and should be sent to
Elena Flores Director ndash Policy Strategy and Coordination Directorate-General for Economic and Financial Affairs Office CHAR 1566
B-1049 Brussels
Email elenafloreseceuropaeu
or
Eric Ruscher Head of Unit ndash Macroeconomy of the euro area Directorate-General for Economic and Financial Affairs Office CHAR 15248
B-1049 Brussels
Email ericruschereceuropaeu
HOW TO OBTAIN EU PUBLICATIONS Free publications bull one copy
via EU Bookshop (httpbookshopeuropaeu) bull more than one copy or postersmaps
from the European Unionrsquos representations (httpeceuropaeurepresent_enhtm) from the delegations in non-EU countries (httpeeaseuropaeudelegationsindex_enhtm) by contacting the Europe Direct service (httpeuropaeueuropedirectindex_enhtm) or calling 00 800 6 7 8 9 10 11 (freephone number from anywhere in the EU) () () The information given is free as are most calls (though some operators phone boxes or hotels may charge you)
Priced publications bull via EU Bookshop (httpbookshopeuropaeu) Priced subscriptions bull via one of the sales agents of the Publications Office of the European Union
(httppublicationseuropaeuothersagentsindex_enhtm)
KC-AK-14-001-en-n
- Blank Page
- Blank Page
- Blank Page
- Blank Page
-

I The drivers of total factor productivity in catching-up economies
Volume 13 No 1 | 9
Graph I2 TFP performance at sectoral level (1)
(1994-2007 avg annual change)
(1) The chart shows average annual TFP growth rates over the period 1994 to 2007 Euro area consists of the euro area Member States in 2007 (except EL) Catching-up countries includes PT ES and IT The sector classification used for Graphs I2 I3 and I4 includes (sector codes in parenthesis) manufacturing (consisting of food beverages and tobacco (15-16) pulp paper printing and publishing (21-22) machinery (29) electrical and optical equipment (30-33) and other manufacturing (36-37)) construction (F) wholesale and retail trade (G) hotels and restaurants (H) transport and storage (60-63) financial intermediation (J) renting of machinery and equipment and other business activities (71-74) real estate activities (K) public administration education and health (L-N) Source EU KLEMS
Graph I3 Average technology gap divergence at sectoral level (1)
(in pp)
(1) The graph shows the average technology gap in selected sectors between 1994 and 2007 (see Graph I2 for a description of sectors and country groups) Source DG ECFIN based on EU KLEMS
The persistence of the gap (and in many cases its widening) over the 1994-2007 period suggests that the weakness of TFP performance is at least partly structural This implies that some structural
features present in manufacturing and services sectors and more so in non-tradable services sectors impeded TFP growth in the catching up economies in the pre-crisis period even though there was a surge in investment during that time Without substantial policy action and structural reforms the catching-up economies could be facing a long period of relatively low TFP growth in the medium-term
I3 Potential TFP drivers
In brief the literature has identified a broad set of factors supporting TFP growth In particular policy measures which affect the quality of human capital the capital stock and the structuralinstitutional framework conditions of the economy seem to be beneficial for TFP growth
This section takes a closer look at the key TFP drivers identified in the literature The review builds upon the insights of endogenous growth models which put a great emphasis on the role of innovation in promoting productivity (7) In this framework TFP is mainly driven by the quality of labour and capital inputs (ie the skill structure of the labour force and the quality of the capital stock) as well as the structural and institutional framework conditions in which the economy operates
Quality of labour inputs
There is plenty of evidence in the literature showing that a higher skilled labour force tends to promote innovation leading to a rise in productivity (8)
Some euro area catching-up economies (eg Portugal) but also some of the more advanced economies (eg Italy) started with a very low proportion of high-skilled workers and despite significant progress are still struggling with a high share of low-skilled workers in the economy This driver may still be negatively affecting their TFP performance
(7) For example in Aghion P and P Howitt (2006) lsquoAppropriate growth policies a unifying frameworkrsquo Journal of the European Economic Association Vol 4(23) pp 269-314
(8) See European Commission (2009) lsquoTrade costs openness and productivity market access at home and abroadrsquo Industrial Policy and Economic Reform Papers No 10 January Sondermann (2012) lsquoProductivity in the euro area Any evidence of convergencersquo ECB Working Paper No 1431 April
10 | Quarterly Report on the Euro Area
However given the progress observed the quality of human capital endowments is not likely to have been a potential driver of the divergence in TFP growth rates between the catching-up economies and the rest of the euro area The evidence suggests that the skill structure improved during the pre-crisis period The increase in the share of high-skilled hours worked has been broad based in manufacturing but even more so in services sectors It has also been more pronounced in the euro area catching-up economies than in those of the core suggesting that there has been some convergence of skill structures in the euro area (Graph I4)
Graph I4 Change in the share of high-skilled hours worked between periods
1995-01 and 2001-07 (1) (in pp)
(1) Advanced euro area economies DE FR NL AT and FI Catching-up economies (ES and PT) as well as IT See also Graph I2 for a description of sectors Source DG ECFIN based on EU KLEMS and WIOD
Quality of capital inputs
In terms of the quality of capital inputs the literature suggests that investment in ICT plays a prominent role in explaining TFP performance (9) Investment in ICT increases an economyrsquos productive potential by raising its capital stock but also increases its potential for rapid technical progress with positive effects on TFP growth
(9) Marrocu E Paci R and S Usai (2013) lsquoProductivity growth in
the old and new Europe The role of agglomeration externalitiesrsquo Journal of Regional Science Vol 53(3) pp 418-442 Griffith R Redding S and J van Reenen (2004) lsquoMapping the two faces of RampD productivity growth in a panel of OECD industriesrsquo The Review of Economics and Statistics Vol 86(4) pp 883-895
In terms of the quality of capital inputs the relative contribution to the added value of the non-ICT component of capital seems to be much greater in the euro area catching-up economies than in the rest of the euro area (Graph I5) This pattern is observable across all sectors with the exception of the ICT-producing industries (ie electrical and optical equipment postal services and communications) Moreover in most euro area countries the contribution to growth of the ICT-component of capital relative to its non-ICT component further deteriorated in the latter years of the pre-crisis period (2004-2007) especially in the weak TFP performing euro area countries (eg Spain Portugal and Italy) This implies that in terms of the quality of capital inputs insufficient investment in ICT could be an important explanation for the disappointing TFP performance in the catching-up countries
Graph I5 Contribution to value added growth of non-ICT and ICT capital
(1995-2007 avg in )
(1) PT 1995-2005 Source DG ECFIN based on EU KLEMS and WIOD
Finally the literature provides evidence that countries that spend more on RampD tend to exhibit higher growth rates of TFP (10) This seems to be confirmed over the sample period analysed Graph I6 illustrates that countries that spent a smaller share of GDP on RampD (eg Spain Portugal and Italy) also had lower annual average growth rates of TFP during the pre-crisis period
(10) Griffith R Redding S and J van Reenen (2004) lsquoMapping the
two faces of RampD productivity growth in a panel of OECD
I The drivers of total factor productivity in catching-up economies
Volume 13 No 1 | 11
Graph I6 TFP growth and RampD spending
Source DG ECFIN based on EU KLEMS and WIOD
Structuralinstitutional drivers related to framework conditions
Apart from the quality of labour and capital inputs the literature suggests that structuralinstitutional drivers affecting the framework conditions in which the economy operates have a significant impact on TFP
A large body of economic literature suggests that more rigid product and labour markets tend to weaken productivity by slowing down the catching-up process of best-practice technologies delaying firm-level adjustments andor reducing direct productivity gains (11)
The OECD product market regulation (PMR) indicators which measure the degree of anti-competitive regulation in selected sectors of the economy have improved for most sectors of the euro area countries during the pre-crisis period (1994-2007) At the same time countries with a higher PMR indicator in 1994 showed lower productivity growth over the period resulting in a negative correlation between TFP growth and the degree of anti-competitive regulation All catching-up economies as well as Italy showed stricter product market regulation in 1994 (Graph I7)
industriesrsquo The Review of Economics and Statistics Vol 86(4) pp 883-895 Inklaar R Timmer M and van Ark B (2008) lsquoMarket services productivity across Europe and the USrsquo Economic Policy 23 pp 139-194
(11) Nicoletti G and S Scarpetta (2003) lsquoRegulation productivity and growth OECD evidencersquo Economic Policy April pp 9-72 Burda M and B Svergnini (2009) lsquoTFP growth in old and new Europersquo Comparative Economic Studies Vol 51 pp 447-466
Graph I7 Product market regulation (1)
(1) The graph shows the OECD lsquoregimpactrsquo indicator which assigns higher indicators to stricter product market regulation Source DG ECFIN based on OECD
Looking at labour market rigidities the OECD employment protection indicators (EPL) show that the catching-up economies started with a relatively high degree of rigidity in their employment protection legislation (Graph I8) The negative correlation between the average TFP growth over 1994 to 2007 and the score in the EPL indicator in 1994 indicates that the poor TFP performance observed over the pre-crisis period could to some extent be negatively related to the initial level of the employment protection legislation However the correlation seems to be much weaker than in the case of RampD spending
Graph I8 Employment protection legislation (1)
(1) The graph shows the employment protection indicator for regular contracts in terms of individual and collective dismissals Higher values stand for stricter protection rules Source DG ECFIN based on OECD
12 | Quarterly Report on the Euro Area
Poor productivity performance has also been linked by several studies to the deteriorating quality of institutions (12) The institutional quality as measured by the government effectiveness of the World Bank Governance Indicators database was indeed low in the euro area economies with poor productivity performance (Graph I9) This seems to be particularly the case of Italy
Graph I9 Effectiveness of governments (1)
(1) Government effectiveness captures perceptions of the quality of public services the quality of the civil service and the degree of its independence from political pressures the quality of policy formulation and implementation and the credibility of the governmentrsquos commitment to such policies Higher values point to higher government effectiveness Source DG ECFIN based on World Bank (2013) Worldwide governance indicators
Finally there is also evidence that higher corporate tax rates can distort factor prices and reduce entrepreneurship and RampD activities resulting in a negative impact on TFP (13) The negative correlation between average TFP growth rates over the period 1994-2007 and the corporate tax rate in 1994 seem to support this hypothesis (Graph I10)
(12) Bertola G (2013) lsquoPolicy coordination convergence and the rise
and crisis of EMU imbalancesrsquo lsquoThe future of EMUrsquo Fellowship ECFIN Economic Paper 490 Acemoglu D Johnson S and J Robinson (2001) lsquoThe colonial origins of comparative development an empirical investigationrsquo American Economic Review Vol 91(1) pp 1369-1401
(13) Vartia L (2008) lsquoHow do taxes affect investment and productivity An industry-level analysis of OECD countriesrsquo OECD Economics Department Working Papers No 656
Graph I10 Effective average tax rates (1)
(1) Effective average tax rates are calculated in line with Devereux MP and R Griffith (2003) lsquoEvaluating tax policy for location decisionsrsquo International Tax and Public Finance Vol 10 pp 107-126 Source DG ECFIN based on Elschner C and M Overesch (2007) lsquoTrends in corporate tax levels in Europersquo Intereconomics Vol 42(3) pp 127-132
I4 Empirical evidence of the drivers of TFP
In brief this section presents panel regression results based on an endogenous growth model The findings show that TFP growth over 1994-2007 was mainly driven by the convergence and spillover channel as well as spending for innovation activities For euro area catching-up countries policy measures that reduce employment protection legislation lower corporate tax rates and improve government effectiveness seem to have the most beneficial impact on TFP growth
The aim of this section is to analyse the main drivers of TFP using a panel data approach The identification of key determinants of TFP is challenging since TFP is hard to measure and it can be affected by a broad set of factors shaping the institutional and economic features of the economy
The empirical approach investigates TFP performance in OECD economies thereby excluding emerging countries Relying solely on country-specific information may however lead to biased results due to the small sample size Therefore the analysis benefits from the sector-specific information of the EU KLEMS database One major drawback of this approach however is that EU KLEMS only offers data until 2007 Against this background the drivers of TFP are analysed using a sample of up to 20 OECD countries and 14 sectors over the time period 1994 to 2007
I The drivers of total factor productivity in catching-up economies
Volume 13 No 1 | 13
The dependent variable is defined as total factor productivity growth in line with the growth accounting methodology of EU KLEMS (see Section I2) The selection of potential explanatory factors with a causal impact on TFP was made based on the key explanatory variables presented in Section I3
Two independent variables are of particular importance First the technology gap which measures the distance between the TFP level of the country concerned and the country with the highest TFP level This variable provides an indication of the impact from the convergence channel It is expected that with a larger technology gap the potential benefit of adopting new technologies increases resulting in a higher TFP growth rate Second the possibility of positive innovation and knowledge spillovers is captured by including the TFP growth rate of the country with the highest TFP level (the technology leader) This variable measures the importance of the spillover channel Apart from these explanatory variables the specification includes a large set of control factors in line with Section I3 such as the impact of ICT compensation RampD expenditure the share of high-skilled population as well as country- sector- and time-fixed effects (see Box I1 for more detailed results)
The findings of a first set of (restricted) empirical regressions (14) show that convergence and spillover effects are important factors in explaining TFP growth Both variables appear to be strongly significant The larger the distance to the frontier the more sizeable the positive impact from the convergence channel on TFP gets At the same time an increase of the spillover effect as realised by the TFP growth of the technology leader results in a higher TFP growth rate The empirical findings suggest that the impact from the spillover channel is stronger than the impact from the convergence channel The results also reveal that the strength of the spillover channel seems to have increased over time while that of the convergence channel has weakened
Apart from the convergence and spillover channels TFP growth appears to be strongly supported by innovation activities as captured by
(14) As a starting point TFP growth was regressed on the technology gap and the spillover channel apart from country- sector- and time-fixed effects thereby omitting further control variables
the share of ICT compensation in total compensation and RampD expenditure By contrast labour skills as measured by the share of population aged 25 and over who have completed tertiary education turns out not to be significant This finding indicates that the correction of TFP done in EU KLEMS for changes in the quality of input factors (see Section I2) appears to be successful for labour but not completely so for capital input factors
There is no clear evidence that other structural variables have a direct significant impact on TFP growth However it is possible that the impact of other potential factors could depend on the state of the convergence or spillover channel For instance certain structural variables may only be significant for more (or less) advanced countries ie those with a small (or high) gap to the technology frontier
To investigate these conditional effects another set of regressions was run to estimate a set of interaction models In these regressions the technology gap and the spillover term are interacted with the structural drivers related to the framework conditions presented in Section I3 These indicators capture different policy areas that are proxied by five variables namely labour market flexibility (employment protection legislation) tax regimes (effective average tax rates) institutional quality (government effectiveness) population ageing (old age dependency ratio) and product market regulations (OECD regimpact indicator)
The results of these interaction models show that the effect of the structural variables on TFP growth is dependent on the technology gap More rigid employment protection legislation tends to have a negative impact on TFP growth The negative impact becomes stronger the less advanced the economy is The impact on TFP growth is however not statistically significant for the least advanced economies ie those which have a very high technology gap An increase in corporate tax rates and ageing population seem to have a particularly detrimental impact on TFP in less advanced economies Improving government effectiveness tends to have a positive and significant impact on TFP growth for medium- and more advanced economies Finally the results do not suggest a statistically significant impact of product market regulation
14 | Quarterly Report on the Euro Area
(Continued on the next page)
I The drivers of total factor productivity in catching-up economies
Volume 13 No 1 | 15
Box (continued)
(Continued on the next page)
16 | Quarterly Report on the Euro Area
Box (continued)
(Continued on the next page)
I The drivers of total factor productivity in catching-up economies
Volume 13 No 1 | 17
Box (continued)
(Continued on the next page)
18 | Quarterly Report on the Euro Area
The interaction models reveal that the impact of the structural variables also seems to be conditional on the spillover channel ie the growth rates of the economies with the highest TFP level Stricter employment protection legislation an increase of the corporate income tax rate or a higher old age dependency ratio all have a detrimental impact on TFP growth when the TFP growth rate of the technology leader is high Since sectors closely related to ICT appear to show the highest growth rates over the sample period the findings implicitly suggest that these sectors tend to react strongest to changes in labour market flexibility tax regimes and population ageing The effect from improving the effectiveness of governments by contrast seems to be of great importance for all sectors Finally product market regulation does not seem
to matter for TFP growth irrespective of the growth rate of the leading economy
Applying the findings of the panel regressions conducted for up to 20 economies to the euro area economies allows for the following tentative conclusions
bull The TFP divergence between euro area catching-up economies relative to the rest of the euro area in the decade preceding the global financial and economic crisis can be partly explained by the following indicators a weakening of the convergence channel lower spending on innovation activities such as RampD and ICT deteriorating government effectiveness and faster population ageing
Box (continued)
I The drivers of total factor productivity in catching-up economies
Volume 13 No 1 | 19
bull Looking forward policy measures that fosterinnovation activities reduce the restrictivenessof employment protection legislation lowercorporate tax rates and improve governmenteffectiveness could help promote TFP growthin the euro area catching-up economies
bull It is worth stressing that according to theregression results employment protectionlegislation has not contributed to the TFPdivergence process since euro area catching-upeconomies did not fall behind the rest of theeuro area in this respect between 1994 and2007 Similarly corporate tax policy does notseem to have been a source of divergence overthat period Nevertheless the regression resultsalso indicate that policy action in those twoareas could improve TFP growth in thecatching-up countries as well as in the rest ofthe euro area
I5 Conclusions
The TFP income convergence process in the euro area weakened in the decade preceding the economic and financial crisis mainly due to weak TFP growth in catching-up economies In fact the gap between euro area catching-up economies and technological leaders actually widened in a broad range of sectors
The persistence of the technology gap since the mid-1990s suggests that the causes are deep-rooted and at least partly structural The econometric analysis presented in this focus section shows that the TFP divergence between euro area catching-up economies and the rest of the euro area can be partly explained by the following indicators a weakening of the convergence channel lower spending on innovation activities such as RampD and ICT deteriorating government effectiveness and faster population ageing
In response to the crisis catching-up countries have put in place a broad range of reforms aimed at improving framework conditions labour market flexibility and the efficiency of the business environment These are likely to raise TFP growth rates in the years to come
However since catching-up is shown to be more difficult for economies approaching the technological frontier the adoption of further structural measures would also help more advanced countries accelerate their TFP convergence In particular measures that foster innovation activities reduce further the restrictiveness of employment protection legislation lower corporate tax rates and improve government effectiveness appear to be the most effective at promoting TFP growth
II Special topics on the euro area economy
Volume 13 No 1 | 21
II1 New estimates of Phillips curves and structural unemployment in the euro area (15)
The Phillips curve can be used to estimate the non-cyclical part of unemployment In such models this estimate is commonly referred to as the lsquonon-accelerating wage rate of unemploymentrsquo (NAWRU)(16) The Phillips curve can be specified in various ways reflecting different assumptions regarding the formation of expectations DG ECFIN has recently extended its framework to cover rational expectations This section looks at the sensitivity of the results to alternative expectation assumptions reporting NAWRU estimates based on Phillips curves produced using rational expectations and those (as used to date) allowing only for static or adaptive expectations
Our findings show that for the euro area as a whole the alternative expectation assumptions yield similar NAWRU estimates In particular the NAWRU appears to have increased recently suggesting a deterioration of labour market performance beyond what could be considered merely cyclical For Spain however the results vary more depending on the assumptions used The Phillips curve based on rational expectations points to a more moderate NAWRU increase than that used by DG ECFIN to date However all estimates point to a substantial post-crisis increase in the NAWRU for Spain
In interpreting the rise in the NAWRU it is important to bear in mind that both structural and non-structural factors are driving developments Analysis shows that in the presence of rigidities crisis-related events can have temporary but long-lasting effects on labour market performance Structural factors can play a role too as illustrated by the steady decline in the NAWRU in Germany which appears to be related to structural effects brought about by the Hartz reforms
-------------------------------
(15) Section prepared by Fabrice Orlandi (16) The Phillips curve features a relationship between the
unemployment gap and an inflation or labour-cost variable In the case of the former the non-cyclical unemployment estimate obtained is usually referred to as the lsquonon-accelerating inflation rate of unemploymentrsquo (NAIRU) while with the latter it is referred to as the lsquonon-accelerating wage rate of unemploymentrsquo (NAWRU)
Introduction
Unemployment rates increased sharply in the euro area in the wake of the crisis and the surge has proved particularly persistent Assessing this development is of paramount importance to policy-makersrsquo efforts to find adequate responses to the effects of the crisis
The non-cyclical part of unemployment play a key role in this assessment as it identifies the proportion of the deterioration that is likely to last beyond the business cycle In the EU context this indicator is particularly important as it is a factor to be fed into the potential output calculations used to compute cyclically-adjusted fiscal figures important benchmarks for country surveillance under the EUrsquos fiscal framework(17)
The non-cyclical part of unemployment is not an observable variable however and has to be estimated which means that it is subject to uncertainty In part the uncertainty stems from the fact that different estimation models are available The Phillips curve is commonly used as a key element in estimation models(18) but can itself be specified in various ways most notably reflecting alternative assumptions as to the formation of expectations(19)
This section sets out DG ECFINrsquos approach to estimating the non-cyclical part of unemployment in particular in its use of the Phillips curve We also investigate the sensitivity of the results to alternative expectation assumptions highlighting the results obtained for the case of rational expectations the case recently incorporated in DG ECFINrsquos estimation framework
The results presented here focus on the euro area but results are also reported for Spain and Germany two countries that have witnessed starkly different non-cyclical unemployment developments
(17) For details on the EUrsquos SGP framework see Vademecum on the Stability and Growth Pact European Economy mdash Occasional Paper No 151 DG ECFIN European Commission May 2013
(18) For an illustration of structural unemployment analysis based on an alternative concept see eg Unemployment dynamics during recessions and recoveries Okunrsquos law and beyond IMF WEO April 2010
(19) For details on the Phillips curve see Fuhrer J YK Kodrzycki GP Olivei and J Sneddon Little Understanding inflation and the implication for monetary policy mdash a Phillips curve retrospective MIT Press 2009
22 | Quarterly Report on the Euro Area
in the recent past We use long time series usually starting in 1965 to capture medium-term cycles The latest DG ECFIN forecasts are also included in the dataset
Alternative NAWRU models
Non-cyclical unemployment is estimated on the basis of models that pin-down its statistical and economic properties DG ECFINrsquos approach relies on an lsquounobserved componentrsquo model which features a Phillips curve The curve links cyclical unemployment (ie the unemployment gap) to labour cost developments while non-cyclical unemployment is assumed not to be affected by labour cost developments In this setting non-cyclical unemployment estimates are commonly referred to as the lsquonon-accelerating wage rate of unemploymentrsquo (NAWRU)(20)
The specification of the Phillips curve reflects particular assumptions made regarding inflation expectations In the past DG ECFINrsquos considered only static and adaptive expectations More recently the case of rational expectations has been added providing a more comprehensive framework (see Box II11)
More specifically the so-called traditional Keynesian Phillips (TKP) curve based on static or adaptive expectation assumptions a positive unemployment gap ( minus lowast) with a fall in the change of the growth rate of nominal unit labour cost (∆ ) (and vice versa) ∆ = minus ( minus lowast) The new Keynesian Phillips (NKP) curve based on rational expectations implies that a positive unemployment gap ( minus lowast) is associated with a fall in the growth rate of real unit labour cost (∆ ) Lagged effects are also relevant because some wage-setters may use ad hoc rules and not fully optimise = ∆ minus ( minus lowast)+ ( minus lowast ) (20) For further details on the DG ECFIN approach see DrsquoAuria F
C Denis K Havik K Mc Morrow C Planas R Raciborski W Roumlger and A Rossi (2010) The production function methodology for calculating potential growth rates and output gaps European Economy mdash Economic Paper No 420 DG ECFIN European Commission July 2010
These alternative Phillips curves thus rely on different labour cost indicators to determine the unemployment gap (and thus also the NAWRU) namely ∆ and ∆ As explained in Box II11 this does not mean that the models are fundamentally different Instead it illustrates the impact of assumptions as to expectation formation on the specification of the Phillips curve
NAWRU developments
For the euro area as a whole NAWRU estimates based on the TKP and the NKP show a similar pattern (see Graph II11)(21) The similarity suggests that for most countries in the euro area results are not overly sensitive to the specification of the Phillips curve (ie to assumptions as regards expectation formation) In practice it also suggests that alternative labour cost indicators (ie change in unit labour cost (ULC) growth and real unit labour cost (RULC) growth) underwent broadly similar developments in the euro area this is confirmed by the top chart in Graph II12
Graph II11 shows that non-cyclical unemployment in the euro area posted a steady increase up to the mid-90s followed by an improvement that was then halted by the recent crisis The recent rise in the NAWRU suggests that the increases in unemployment seen in the aftermath of the crisis are to some extent likely to last beyond the cyclical upturn
Graph II11 also shows NAWRU developments for Spain and Germany illustrating the diversity within the euro area Spain has witnessed developments that have been similar to though more dramatic than those in the euro area as a whole Germany posted a starkly different profile with its NAWRU falling steadily (from 2002 according to the NKP or 2004 according to the TKP)
As regards sensitivity the NAWRU estimates for Spain vary considerably depending on the specification With the NKP the recent increase is more moderate with the NAWRU reaching 220 by 2015 while the estimated level with the TKP is 264 Recent results for Germany are less sensitive to assumptions regarding expectations (21) NAWRUs referred to in this section are those computed for the
Commissionrsquos 2014 winter forecast Latest available NAWRUs can be downloaded from the AMECO database httpeceuropaeueconomy_financeameco
II Special topics on the euro area economy
Volume 13 No 1 | 23
with the two Phillips curve specifications producing similar NAWRUs However around
Graph II11 Alternative NAWRU estimates euro area Germany and Spain (1)
(1965-2015 in )
(1)GDP weighted average of euro-area countries for which alternative NAWRUs have been computed (ie AT BE DE EL ES FI FR IE IT NL and PT) For AT both NAWRUs are based on the backward-looking model as the forward-looking model yields econometrically unsatisfactory results (2)Component of the NAWRU explained only by structural determinants (see Orlandi (2012) op cit) Source DG ECFIN calculations based on Eurostat data
2005 some difference across the two specifications is observed for Germany with the NKP producing a relatively less volatile NAWRU Given that the current NAWRU estimates for Germany based on the TKP and NKP specifications do not diverge greatly and taking into account the stability considerations in moving to a new specification Germany continues to use the TKP specification
NAWRU differences for Spain depending on the curve specification stem from corresponding differences between the labour cost indicators used Graph II12 shows that recently RULC growth posted greater and more persistent moderation in Spain than change in nominal ULC growth For Germany the indicators have followed more similar paths over recent years (as they have in the euro area as a whole) More fundamentally in times of heightened economic volatility andor big labour market adjustments (eg recent crisis Hartz reforms) the TKP model is likely to yield NAWRUs that are more pro-cyclical as it does not take full account of the price rigidities that play an important role in the adjustment process of the labour market These rigidities are better reflected in the NKP model
To sum up except in the case of Spain recent NAWRU estimates for the euro area do not appear to be sensitive to assumptions as regards expectations with alternative Phillips curve specifications yielding similar results Overall results point to a recent increase in the NAWRU across the euro area with the notable exception of Germany A rise in the NAWRU points to persistent deterioration in labour market performance Identifying the causes of the deterioration calls for cautious interpretation however
NAWRU versus Structural Unemployment
Understanding the sharp and protracted rise in unemployment in the wake of the crisis is of paramount importance from a policy perspective What caused the rise Is it a sign of structural deterioration Or is it purely cyclical reflecting the prolonged slowdown These questions are the subject of lively debate with views ranging from lsquoitrsquos all demandrsquo(22) to lsquoitrsquos allmostly structuralrsquo(23)
(22) See eg Krugman P (2010) Debunking the structural unemployment myth New York Times 28 September 2010
24 | Quarterly Report on the Euro Area
(23) See eg Kocherlakota N (2010) Inside the FOMC speech at
Marquette Michigan 17 August 2010
(Continued on the next page)
II Special topics on the euro area economy
Volume 13 No 1 | 25
In particular changes in the NAWRU are sometimes interpreted as a sign of a structural change Careful analysis of developments in the NAWRUs produced by DG ECFIN shows that they can be driven by both structural and non-structural factors(24)
In particular crisis-related shocks (eg unwinding of unsustainable developments) especially boom-bust episodes in the housing market that can trigger a lengthy process of deleveraging in the construction sector have a statistically significant impact on the NAWRU The real interest rate and Total Factor Productivity (TFP) growth which controls more generally for the presence of such shocks also play a part in driving NAWRU develpoments
At a theoretical level adding various rigidities (eg real wage rigidity cyclical price mark-ups or sluggish adjustment of the reservation wage) to the traditional labour market model can be shown to yield a NAWRU that is not solely determined by structural factors
Despite uncertainties the NAWRU remains a useful policy indicator It is a well-defined concept that provides useful information on the nature of unemployment rate developments In particular it identifies risks of persistent labour market deteriorations that may not always be caused by structural phenomena(25)
In this context it appears useful to distinguish between the NAWRU and a narrowly defined notion of structural unemployment affected only by structural factors as shown in Graph II11 by
(24) For further details see Orlandi F (2012) Structural unemployment and its determinants in the EU countries European Economy mdash Economic Paper No 455 DG ECFIN European Commission May 2012
(25) For further details see Cyclical and structural unemployment in the euro area in Labour Market Developments in Europe 2013 European Commission
the lsquostructural unemploymentrsquo series The latter represents the portion of the NAWRU that according to econometric results appears to be explained by structural features of the labour market As can be seen the series has remained broadly stable during the crisis Except for a notable decline due to structural labour market reforms in Germany change in the NAWRU in the euro area is not related to structural change This is also the case in Spain where structural unemployment has remained broadly stable
Recent increases in the euro-area NAWRU should therefore not be interpreted as a sign of big structural change at the current juncture Rather in most countries the increases reflect the effects of shocks that in the presence of various rigidities have a long-lasting impact on unemployment rates
To sum up the decline in the NAWRU at euro-area level and in countries like Spain in the run-up to the crisis appears mostly attributable to non-structural factors such as unsustainable developments in the housing sector The build-up and subsequent unwinding of imbalances has caused large economic shocks (eg need for sectoral reallocation) which have a persistent effect on the performance of the labour market However in some countries structural factors have also played a role in driving NAWRU developments In Germany for example the decline in the NAWRU seems related to some aspects of the Hartz reforms (eg the change in the period of eligibility for unemployment benefit appears to have contributed to a decline of the NAWRU over recent years) This suggests that large-scale reforms as currently being enacted in some countries will tend to translate into a gradual lowering of the NAWRU over coming years For example recent efforts in Ireland to bring down the labour tax wedge appear to be contributing to more favourable NAWRU developments A number of countries (eg France) have failed to
Box (continued)
26 | Quarterly Report on the Euro Area
post similar improvements in their underlying labour market structures
Graph II12 Alternative labour cost signals for the euro area Germany and Spain (1)
(1965-2014)
(1)GDP-weighted average of euro-area countries for which alternative NAWRUs have been computed (ie AT BE DE EL ES FI FR IE IT NL and PT) (2)Private consumption deflated ULC Source DG ECFIN calculations based on Eurostat data
Conclusions
Alternative Phillips curve specifications based on different assumptions regarding expectation formation point to broadly similar NAWRU results for the euro area Estimates point to a recent rise in the NAWRU suggesting that post-crisis unemployment increases are to some extent persistent
In the case of Spain alternative Phillips curve specifications yield somewhat different NAWRU results pointing to the current importance for that country of theoretical considerations regarding expectations The NKP which uses rational expectations and relies on RULC growth to identify the unemployment gap yields a more moderate NAWRU increase over recent years than the TKP (hitherto used by DG ECFIN) which allows only for static or adaptive expectations and relies on the signal provided by the change in nominal ULC growth While this sensitivity in the results underlines the need for caution in interpreting NAWRU estimates it should also be borne in mind that all specifications point to an important increase in the NAWRU for Spain at this juncture
The deterioration in the NAWRU signals difficulties that are likely to last beyond the cyclical upturn In interpreting those developments it is important to recognise that changes in the NAWRU can be caused by both structural and non-structural factors While the improvement in the NAWRU in Germany seems to be caused by structural factors the deterioration in Spain seems to be caused more by crisis-related events that have persistent effects due to the presence of various rigidities that tend to slow down the adjustment process
II Special topics on the euro area economy
Volume 13 No 1 | 27
II2 The relationship between government and export sector wages and implications for competitiveness (26)
In 2012 the general government sector employed on average about 15 of the labour force in the euro area Since most countries in the euro area are now trying to consolidate public finances whilst also trying to boost competitiveness for external rebalancing and to reduce unemployment it is crucial to assess whether there is any wage spillover from the public to the export sector in particular under conditions of fiscal stress This section shows that there has been a link between government and manufacturing wages over the long-run which is much closer when the government employs a large share of the labour force Government size dimension is especially important during fiscal consolidation If the government wage bill is inflated due to unjustified wage premia for example limiting government wage growth is a fiscal strategy that may among other effects deliver competitiveness gains that contribute to external rebalancing and help boost employment in the tradable sector
-----------------------
Introduction
General government employment accounts for a considerable share of the labour force in the euro area It stood at about 15 in 2012 with but some cross-country variation The evolution of government wages is likely to have an impact not only on fiscal variables and on the sustainability of public finances but also on the labour market on cost competitiveness and on external rebalancing within the euro area This section looks at the relationship between public and private sector wages at a time when most euro area countries are trying to consolidate their public finances improve competitiveness to support external rebalancing whilst also having to tackle high unemployment levels (27)
Changes in general government compensations may spill over into the private sector through both
(26) Section prepared by Benedicta Marzinotto and Alessandro Turrini
(27) Throughout the section the public sector is referred to alongside general government which refers to public offices at all levels of government non-market public owned hospitals schools and social security organizations Thus the term public is used as a synonym for general government
market-based and institutional channels For example excessive government wages may crowd out private sector employment inflating cost conditions and leading to competitiveness losses (28) There are channels of transmission also in the opposite direction from the private to the government sector Wage growth linked to productivity improvements in the private sector can spill over into the public if there is labour mobility across sectors This can affect governments capacity to keep wage expenditure growth under control
Against this background this section analyses the relationship between general government and manufacturing wages in order to assess the potential for and conditions of a wage spillover from the insulated government sector to the export sector The relationship is analysed by looking at a sample of EU countries over the period 1980-2013 in a co-integration framework that makes it possible to distinguish between long-run and short-run effects The relationship between the two wages is also assessed for different fiscal scenarios differentiating between normal periods and periods of fiscal adjustment
The various forms the relationship takes
The relationship between public and private wages takes many forms It may be influenced by market forces andor by institutional features of the wage setting system in each country Changes in private wages can affect government wage growth in the following ways
bull Wage bargaining in the private sector has ademonstration effect on public wage-settersPerez and Sanchez (2011) find evidence ofsignalling by the private sector in thenegotiation phase in France and Germanybefore the EMU period (29) Signalling may bemotivated by envy effects that reflect thestrength of the wage-bargaining position (30) or
(28) See for example Alesina A and R Perotti (1997) The welfare state and competitiveness American Economic Review Vol 87 pp 921-939 Alesina A Ardagna S Perotti R and Schiantarelli F (2002) Fiscal policy profits and investment American Economic Review Vol 92(3) pp 571-589 Ardagna S (2004) Fiscal stabilizations when do they work and why European Economic Review Vol 48 pp 1047-1074
(29) Perez JJ and AJ Sanchez (2011) Is there a signalling role for public wages Evidence of the euro area based on macro data Empirical Economics Vol 41(2) pp 421-445
(30) Maffezzoli M (2001) Non-Walrasian labor markets and real business cycles Review of Economic Dynamics Vol 4(4) pp 860-
28 | Quarterly Report on the Euro Area
by the fact that the same trade union negotiates wages for both sectors
bull Wage-bargaining practices may explicitly or implicitly grant wage leadership to the private sector Under the Scandinavian wage-setting model the private export sector typically takes the lead dictating bargaining outcomes to other sectors including the public sector (31)
bull There may also be established practices and institutional mechanisms that make public wages responsive to private wage settlements usually those of the export sector This is the case if for example there is a formal rule under which the growth rate of private wages is automatically applied to public sector wages (32)
It is of course a two-way street Changes in government wages affect private wage growth in a number of ways
bull Wage adjustment in the public sector causes cross-sector labour shifts and a change in the private sectors labour supply As the supply of labour changes so does the competitive private sectors equilibrium wage
bull Adjustments to government wages affect the outside option of unionised private sector bargainers putting pressures on the bargaining process (33) with for example private sector workers tempted to move to the general government sector due to large public wage increases
892 Ardagna S (2007) Fiscal policy in unionized labor markets Journal of Economic Dynamics and Control Vol 31(5) pp 1498-1534
(31) For a review see Lindquist J and R Vilhemsson (2006) Is the Swedish central government a wage leader Applied Economics Vol 38 pp 1617-1625 Friberg K (2007) Intersectoral wage linkages the case of Sweden Empirical Economics Vol 32 pp 161-184 Traxler F and B Brandl (2012) Collective bargaining inter-sectoral heterogeneity and competitiveness a cross-national comparison of macroeconomic performance British Journal of Industrial Relations Vol 50(1) pp 73-98 Ramskloger P (2012) Is there a European wage leader Wage spillovers in the European Monetary Union Cambridge Journal of Economics Vol 36(4) pp 941-962 and (2013) The nationalndashtransnational wage-setting nexus in Europe What have we learned from the early years of monetary integration Journal of Common Market Studies Vol 51(5) pp 916-930
(32) For evidence on the Netherlands see Hartog J and H Oosterbeek (1993) Public and private sector wages in the Netherlands European Economic Review Vol 37(1) pp 97-114
(33) Afonso A and P Gomes (2008) Interactions between private and public sector wages ECB Working Paper No 971
bull Changes in public wages may be fully compensated in government budgets by changes in labour taxation that alter labour costs in the private sector (34) and might also affect union behaviour (35)
Co-movements between government and private wages may also take place in the absence of direct links when driven by factors common to both sectors For example public wages may be pro-cyclical and change in a manner similar to private wages over the cycle (36) Co-movements in aggregate wage series could be linked to developments common to both factors relating to the composition of the labour force
Testing the relationship between government and manufacturing wages
To analyse more systematically the long- and short-term effects of government wages on the export sector a cointegration approach is used linking manufacturing compensations to a number of determinants including compensation in the government sector The long-term relationship is analysed in terms of levels while the Error Correction Mechanism (ECM) equation makes it possible to estimate the short-term relation between export sector wage growth shocks in explanatory variables and their deviation from the long-term relationship The long-term relationship in also analysed in terms of levels using a dynamic ordinary least squares (DOLS) model and the results incorporated in an ECM model
Estimates were made on a sample of 17 EU countries for which data are available over the period 1980-2013 This has not only has the advantage of gaining degrees of freedom and reinforcing the results It also makes it possible to
(34) Holmlund B (1993) Wage setting in private and public sectors
in a model with endogenous government behaviour European Journal of Political Economy Vol 9(2) pp 149-162
(35) The spillover from the public to the private sector is likely to be mediated by the structure of wage-setting systems Alesina and Perotti (1997) find that increases in labour taxation do not necessarily lead to higher wage demands by unions in highly centralised bargaining systems as large wage setters would internalise the consequences from higher labour costs on employment
(36) For instance Lane (2003) and Lamo et al (2007) find that public wages are pro-cyclical because of discretionary fiscal expansion in good times Lane P (2003) The cyclical behaviour of fiscal policy evidence from the OECD in Journal of Public Economics Vol 87 pp 2661-2675 Lamo A Perez JJ Schuknecht L (2007) The cyclicality of consumption wages and employment of the public sector in the euro area ECB Working Paper No 757
II Special topics on the euro area economy
Volume 13 No 1 | 29
investigate the role of framework conditions in bringing the impact of general government to bear on manufacturing wages by means of appropriate sample splits Box II21 shows the estimation methodology and the results
Much of the variance in manufacturing wages is explained by variables usually used when estimating wage equations (ie the price level labour productivity and the unemployment rate) and by general government wage levels Both the long- and short-term elasticity of manufacturing wages with respect to government wages is estimated to be around 03-04 This tallies with the results of similar studies (eg Afonso and Gomes 2008) It works both ways general government wages also react to manufacturing wages They have a long-term elasticity of 08 and a short-term elasticity of 04 (37) This is consistent with the fact that it is more usual for the private sector than for the government to take the lead in terms of wages as the available literature also shows (38) The DOLS cointegration estimation delivers qualitatively identical results The results are still valid when the sample is restricted to just the euro area (39) The relationship tested on real wages is symmetrical because manufacturing wages respond to government wages whether they are increased or reduced
One hypothesis tested here is whether the size of the government sector determines the extent to which changes to government wages affect average conditions on the private market if for example there is cross-sector mobility In order to test how this market-based channel works the same EU sample is split into two groups of countries those in which the average share of government to total employment is above the whole EU samplersquos median and countries in which it is below the median Results show that in the long-run the impact of public on manufacturing wages is considerably higher in the case of large public sectors This divide disappears in the short-run In the opposite direction going from manufacturing to public wages the split does not produce differentiated results This confirms that government size matters when it comes to the public sectors long-term impact on the labour
(37) The results are not shown (38) Perez JJ and AJ Sanchez (2011) (39) Still it should be noted that the sample used excludes some key
countries in the euro area
market The DOLS methodology confirms these results (40)
Another hypothesis that is tested is whether the way wages are set in the public sector increases the chances of manufacturing wages reacting to government wages Broadly speaking two wage-setting systems may be identified
bull This first is that wages are mainly set on thebasis of collective bargaining
bull The second is that wages are set on the basis ofunilateral decision by the government (41)
The results show that the way wages are set does not fundamentally alter the relation between government and manufacturing wages in the long- or the short-term It is however interesting to note that across all methodologies used the relationship between manufacturing wages and labour productivity is weaker in countries characterised by a unilateral decision wage-setting system This is probably because in such a case the spillover from public to private wages is such that private wages tend to be misaligned with sectoral productivity This is not the case when government wages are set through a collective bargaining wage-setting system possibly because bargaining processes even in a particular type of insulated sector such as the public one reflect market forces more than a unilateral government decision
The relationship between government and manufacturing wages under fiscal stress
Most countries in the euro area have recently been trying to cut government wage bills by freezing wages cutting or retrenching specific indemnities or benefits (including bonuses andor holidays) or blocking turnover As a result the share of government compensations in total government spending has fallen Between 2008 and 2012 this fall was particularly sharp for Latvia Portugal and Romania followed by Hungary Spain Denmark and Estonia (Graph II21)
(40) The results from the DOLS are not shown (41) For a classification of EU wage-setting systems in the government
sector see European Commission Directorate for Economic and Financial Affairs (2014) Government wages and labour market outcomes Occasional Paper forthcoming
30 | Quarterly Report on the Euro Area
(Continued on the next page)
II Special topics on the euro area economy
Volume 13 No 1 | 31
Box (continued)
(Continued on the next page)
32 | Quarterly Report on the Euro Area
Box (continued)
II Special topics on the euro area economy
Volume 13 No 1 | 33
The recent crisis marked a watershed in the evolution of public compensations Between 1999 and 2007 relative government wage growth did not vary from cold-shower periods (or periods of more gradual fiscal consolidation) to periods of non-consolidation (42)
Graph II21 Change in the share of general government compensations to
total spending (2008-2012 in pp)
Source DG ECFIN calculations based on AMECO
Conversely starting with the 2008-2009 crisis compensations per employee in the government sector grew more slowly compared with those in the manufacturing sector and more clearly so during fiscal consolidation (Graph II22)
It is possible that under conditions of fiscal stress the relationship between government and export sector wages differs from that of normal periods This aspect has been neglected in previous analyses To shed some light on it Table II21 shows the correlation between government wage growth and manufacturing wage growth under alternative fiscal conditions (consolidation and non-consolidation) differentiating between countries with large and small public sectors The evidence shows that the two wages are closely related in periods of fiscal stress only if the government employs a large share of the labour forces This suggests that the possibility of
(42) By convention episodes of fiscal consolidation are defined as those during which the structural primary balance improves by at least 15 per cent of GDP in one year or at least 3 per cent in three years with a minimum improvement of 05 per cent in each year Such a definition makes it possible to distinguish between cases of cold-shower consolidation episodes and more gradual consolidation episodes
expenditure-based fiscal consolidation having the type of supply-side effects described in Alesina and Perotti (1997) Alesina et al (2002) and Ardagna (2004) may be a consequence of the size of the public sector among other things
Graph II22 Government and manufacturing compensations under
alternative fiscal conditions EU countries (1999-2007 and 2008-2012 avg annual change)
Source DG ECFIN calculations based on OECD
Table II21 Correlation between government and manufacturing
compensations growth under alternative fiscal conditions EU (1)
(1) Pearson correlation coefficients Sample EU countries (excluding AT BG CY DE EL LT LV MT RO SI) over 1980-2012 (1995-2012 in the case of CZ EE HU SK) Source DG ECFIN calculations based on OECD
Concluding remarks
Spillovers which are the result of high wages in the general government sector have been mentioned as one of the drivers of competitiveness losses in
34 | Quarterly Report on the Euro Area
some countries in the euro area before the crisis (43)
The results presented here speak to this debate and may be summarised as follows Government wage levels have a long-term impact on wages in the manufacturing sector even more so in countries in which the government sector employs a relatively large share of the labour force That said their short-term impact remains unaffected by the size of the public sector Looking at it the other way round manufacturing wages usually have a greater impact on government wages regardless of size This is arguably because private sector wage leadership is more common than public sector wage leadership
(43) Blanchard O (2007) Adjustment within the euro The difficult
case of Portugal in Portuguese Economic Journal 61 1-21
The way government wages are set also plays a role In collective bargaining systems not only are government and manufacturing wages related in both the long- and the short-term (as they are also when the government sets wages by unilateral decision) Also most importantly wages in the tradable sector are better aligned with labour productivity The evidence provided here indicates that if the government wage bill is inflated for example due to unjustified wage premia limiting public wage growth would spill over into the private export sector reducing labour costs and helping boost competitiveness and employment in the sector Whilst structural reforms including skill upgrading in manufacturing are an important and necessary ingredient for achieving non-reversible gains in competitiveness the adjustment of competitiveness through fiscal policy remains a complementary tool to deliver sustained external rebalancing
II Special topics on the euro area economy
Volume 13 No 1 | 35
II3 Latvia maintaining sustainable growth after the boom-bust years (44)
Latvia had been keen to join the euro area at the earliest opportunity with entry in January 2008 the clear target As the economy overheated however significant macro-economic imbalances accumulated which deferred these plans Between 2005 and 2007 unsustainable GDP growth went hand in hand with a mounting current account deficit and a housing market spiralling out of control When credit flows then abruptly reversed the countryrsquos GDP contracted dramatically Latvia was placed in the EUIMF-led financial assistance programme and was forced to carry out ambitious fiscal consolidation and structural reforms Reallocating resources to the tradable sector was the first important step on the road to an export-driven recovery Under the burden of deleveraging and consolidation the revival of domestic demand was slow at first From 2011 however supported by favourable labour market developments growth in demand has accelerated Latvia has reclaimed its position as the fastest-growing EU economy however the current level of growth is lower than the unstainable rates recorded in the boom years and it is now seen as sustainable Thanks to this balanced growth Latvia has not been subject to the MIP since its launch in 2012 Despite the financial assistance-supported measures to preserve equity the social burden of economic adjustment as evidenced by poverty social exclusion and emigration rates has been high but measures are being taken by the authorities to counter these effects Continued commitment to prudent fiscal policies will be critical for the countryrsquos economic future The use of macro-prudential tools to reduce the risks posed by large non-resident financial flows and the implementation of ambitious structural reforms will also play an important role
-----------------------
Introduction
To welcome Latvias recent adoption of the euro this section reviews the countrys recent boom-bust experience and discusses the challenges ahead
Five years ago it would have been difficult to imagine that Latvia would be able to fulfil the conditions for adopting the euro and enter the euro
(44) Section prepared by Gatis Eglitis and Christian Weise
area in January 2014 After EU accession in May 2004 significant macro-economic imbalances had started to accumulate on the back of an overheating economy and by autumn 2008 the country was on the brink of bankruptcy A painful and seemingly impossible economic adjustment to be achieved by means of internal devaluation lay ahead This would require unprecedented fiscal consolidation huge redundancies and difficult structural reforms threatening political and social stability Yet despite pronounced scepticism from the outset and particularly at the height of the crisis in mid-2009 the economy has moved back to growth The measures implemented took some time to take effect with the economy continuing to decline at first before picking up as seen in the lsquoVrsquo-shaped recovery but a protracted recession was avoided Latviarsquos GDP growth has exceeded expectations reaching levels of 54 in 2011 52 in 2012 and around 4 in 2013 The two factors that were critical to the countryrsquos economic recovery were a return to international competitiveness and the rapid correction of external imbalances The budget deficit decreased significantly and is expected to reach a balanced position in the near future The level of government debt is projected to stay around 40-42 of GDP in 2013-2014 and to decline to 33 of GDP in 2015 as the repayments to the EU take effect and sizable cash buffers will be reduced The financial assistance programme was successfully completed in January 2012 Financial support had not been necessary since October 2010 however and the government had re-entered international bond markets in June 2011 well ahead of schedule (45) As of 2013 GDP per capita in constant prices has returned to the level reached at its peak in 2007 Due to the decline in the population however the absolute value of GDP in constant prices was still about 9 below 2007 levels with current projections suggesting that a full recovery to the pre-crisis peak will be achieved in 2015
Overheating imbalances and a big bust
Latvia joined the EU in seemingly good macroeconomic health and having pegged its currency to the Special Drawing Right (SDR) in
(45) Occasional Paper 120 issued by the European Commission Directorate-General for Economic and Financial Affairs EU Balance of Payments assistance for Latvia foundations of success httpseceuropaeueconomy_financepublicationsoccasional_paper2012op120_enhtm
36 | Quarterly Report on the Euro Area
1994 and then to the euro in 2005 was keen to join the euro area in January 2008 Upon entering the Exchange Rate Mechanism II (ERM II) on 2 May 2005 the authorities unilaterally committed to maintaining a smaller fluctuation margin of plusmn1 around the central rate ndash seen as a sign of the countryrsquos determination to join the euro area The Latvian economy was the fastest growing in the EU between 2000 and 2007 and between 2005 and 2007 real GDP growth reached a yearly average of over 10 Following accession to the EU in 2004 Latvia along with other EU countries witnessed a rapid credit expansion Loans to residents grew at an average annual rate of close to 50 between 2004 and 2008 a reflection of the excess liquidity at that time and of the resulting hot money inflows into central and eastern European economies which were rapidly converging with their western European counterparts Foreign investment exploded driven by commercial banksrsquo mispricing of risk and over-optimistic expectations of convergence A number of privatisation deals and most importantly a burgeoning real-estate market characterised by soaring prices also served to attract foreign investors The tradable sector was meanwhile largely neglected By way of illustration foreign direct investment (FDI) reached relatively high levels of 84 and 81 of GDP in 2006 and 2007 respectively but most of this was directed towards the real-estate market while the proportion of total FDI relating to manufacturing was only 12 in 2013 Significant imbalances were accumulating as indicated by a current account deficit that reached around 22 of GDP in 2006 and 2007 and by labour market tightening Nominal wages doubled between 2004 and 2007 increasing much faster than productivity and thus damaging international competitiveness
By early 2008 more cautious bank lending had caused economic growth to slow significantly By autumn of the same year this slowdown had developed into a strong contraction reflecting the wider global economic situation The global economy fell into recession commodity prices reached record highs and the general risk aversion seen in global markets following the collapse of Lehman Brothers cut off Latviarsquos access to financial markets The second largest domestic bank Parex had to be rescued Latvia ultimately experienced the most severe GDP contraction of all EU countries at close to 18 in 2009 The government deficit threatened to spiral out of control Having been at 03 of GDP in 2007 and 42 in 2008 in spring 2009 it was projected to
reach levels well above 15 of GDP by the end of year in the absence of a significant consolidation package
Faced with an economic crisis of this order Latvia agreed a medium-term financial assistance programme the balance of payments programme (BoP) with the EU and the IMF in December 2008 (46) The aim of this was to preserve the existing exchange-rate arrangement The assistance offered to Latvia was made subject to a number of policy conditions relating to fiscal consolidation financial sector stabilisation and the introduction of a wide range of structural reforms including a significant acceleration in the absorption of EU structural funds The Latvian government also undertook to strengthen the social safety net so as to protect the most vulnerable from the effects of the crisis
Brave measures in difficult times
Given that the exchange rate was at that time pegged to the euro some economists suggested devaluation as the only way out of the crisis The national authorities and international partners did not see that as a viable option however because its effectiveness would have been severely limited by the degree to which imports were used in the manufacture of exports and the high proportion of foreign liabilities Furthermore it would have brought with it the risk of mass bankruptcy and a partial collapse of the domestic banking system at a time when the judicial system was clearly not capable of coping with such a fall-out In addition devaluation would have provided no incentive to solve Latviarsquos structural problems including weak fiscal governance the unsustainability of pension expenditure loss-making state-owned banks a lack of competitiveness and weak institutions
Between 2009 and 2011 the Latvian government carried out an ambitious programme of fiscal adjustment designed to correct the previously loose fiscal policy the weaknesses of which had been hidden by the countryrsquos strong economic growth This difficult adjustment restored Latviarsquos public finances to better health and established a
(46) Funds available from EU countries IMF World Bank EBRD
and Norway amounted to euro 75 billion of which Latvia used euro 45 billion (60) with euro 29 billion lent by the European Commission on behalf of the EU The first tranche of EUR 1 billion (13 of the total) was repaid by Latvia on 25 March 2014
II Special topics on the euro area economy
Volume 13 No 1 | 37
framework which would be sustainable in the long term The nominal balance improved with the deficit being cut from 98 of GDP in 2009 to 13 of GDP in 2012 and 2013 (see graph II31) The structural deficit also fell from its peak of 55 of GDP in 2008 to around 025 of GDP in 2012 and 2013 beating Latviarsquos medium-term objective of -05 of GDP as set in the convergence programmes
Latviarsquos fiscal consolidation measures were undoubtedly bold with fiscal savings equivalent to around 17 of GDP implemented within three years The measures were frontloaded and half of these savings were implemented in the first year alone The measures were on the whole expenditure-oriented with over half of the savings coming from cuts to health education and public administration budgets The most notable measure relating to revenue was an increase in VAT from 18 to 22 The consolidation strategy was eventually successful in containing the adverse effects of the budget deficit on the economy In fact it even appears to have triggered lsquonon-Keynesianrsquo effects on demand by restoring confidence and stimulating demand and investment at the point when it was most needed (47)
Graph II31 Latviarsquos government budget balance and debt (2008-15 of GDP)
Source DG ECFIN Commissionrsquos spring 2013 forecast
The fiscal framework was also strengthened significantly by the law on fiscal discipline coming into force in March 2013 and the creation of a fiscal council in January 2014 The signing of the
(47) Ibid see Chapter 4 Fiscal consolidation in the midst of the crisis
Treaty on Stability Coordination and Governance in the EMU (48) in March 2012 provided further EU-level support for the national fiscal framework
An additional factor that was critical to the success of the consolidation strategy but is often overlooked was the availability of significant EU funds (particularly from around 2009 onwards) which acted as a much-needed demand trigger in sectors affected by the decline in economic activity Between 2007 and 2013 Latvia benefited from the third highest allocation of EU funds after Hungary and Lithuania receiving a yearly average equivalent to around 28 of GDP or 70 of gross fixed capital formation(49) As on average every euro of national budget spending was supplemented by five to six euros co-financing from EU funds national expenditure on items such as road and public building construction vocational education and training of unemployed science infrastructure development and healthcare was often replaced by Structural funds financing despite being in conflict with the EU funds additionality principle Clearly such large inflows of EU financing also generated substantial tax revenues in particular VAT at a time when private consumption was weak
The Latvian labour market demonstrated a high level of flexibility during the crisis thanks in part to a decentralised wage-setting system Significant public-sector wage cuts indirectly supported nominal wage reduction in the private sector in 2009 and 2010 when earnings per employee fell by a total of 19 over two years Employment levels fell sharply especially in the private sector as jobs were cut in construction and manufacturing The unemployment rate reached around 20 in early 2010 but had fallen back to 119 by 2013 due mainly to growth in employment with the participation rate also increasing significantly over this period The projection from the Commissionrsquos 2014 winter forecast shows wages in 2014-15 growing broadly in line with productivity although the labour market is tightening and structural problems in particular regional differences and skill mismatches could create pressures in the economy
(48) httpeuropean-councileuropaeumedia639235st00tscg26_en12pdf
(49) Source Directorate-General for Regional Policy Infoview
38 | Quarterly Report on the Euro Area
External cost competitiveness has improved noticeably since 2008 with labour costs falling significantly and labour productivity in particular in the tradable sector increasing In 2008 the real effective exchange rate (REER) adjusted for unit labour costs reached a peak of 64 above the 2000 level before falling by about 20 in 2009-10 since when it has remained broadly stable (see graph II32) This level of REER is considered sustainable as the country has been seen to be steadily gaining market share over recent years (including as measured by exports adjusted for the growth of markets) The percentage of the countryrsquos GDP attributable to exports rose to 60 in 2013 from 43 in 2007 with some 60 of exports destined for the EU and 12 for Russia
Graph II32 Effective exchange rates Latvia v 35 trading partners
(Jan 2007-Dec 2013 monthly avg 2007 = 100)
Source DG ECFIN
The social burden of economic adjustment has admittedly been high in Latvia despite the policy measures contained in the Memorandum of Understanding stipulating inter alia establishment of a comprehensive social safety net supporting local governments in providing social assistance and discounting social payments from overall budget targets High unemployment has led to a wave of emigration to richer EU countries which coupled with Latviarsquos low fertility and high death rates has seen the population decrease by 8-10 since 2008 Net emigration has now fallen substantially however since the peak of the crisis years The rates of poverty and social exclusion in Latvia are among the highest in the EU families with children unemployed people people with disabilities and people living in rural areas are particularly at risk The countryrsquos spending on
social protection and healthcare as a percentage of GDP is among the lowest in the EU Furthermore the social protection measures which do exist to reduce poverty tend to be ineffective highlighting the importance of a robust social safety net It appears however that with the improved economic situation and increasing levels of general social awareness the authorities are finally starting to address the challenges of poverty and social exclusion with greater determination In recent years for example taxation of low-income earners has been cut slightly and child poverty has been reduced thanks to increases in various child-related benefits Proposals for reforms to social assistance in line with 2013 World Banks study are being gradually implemented Better targeted more effective policies relating to the active labour market mostly financed by the European Social Fund are helping unemployed people in particular the long-term unemployed and young people to find work or to obtain relevant training
As part of the BoP programme and in the context of the assessment of Latviarsquos readiness to join the euro area financial supervision has been tightened and EU resources for supervision and monitoring increased in particular for monitoring the growing non-resident banking sector Additional liquidity and capital adequacy requirements for non-resident banks were introduced in 2013 regular on- and off-site checks of these banks are being performed the deposit guarantee fund has been further strengthened and monitoring has been stepped up in relation to pledged assets and the origin of funds in bank recapitalizations This strengthened regulatory policy has been introduced partly as a result of lessons learnt at significant cost in the past five years most notably with the Parex and Krajbanka failures
Latvia has implemented a series of ambitious reforms to the business environment in recent years with the aim of reducing start-up costs simplifying procedures for property registration construction permits and tax collection and introducing out-of-court settlement of insolvencies In doing so Latvia has brought its regulatory framework a significant step closer to what is regarded as best practice In the World Bankrsquos 2014 Doing Business report Latvia was ranked 25th out of 185 countries with only four euro-area members faring better
II Special topics on the euro area economy
Volume 13 No 1 | 39
Conclusion
The origins of Latviarsquos years of boom and bust can be traced back to the domestic regional and global circumstances at that time globally excess liquidity and hot money flowing into vulnerable countries regionally unrealistic expectations of income convergence in central and eastern Europe and domestically undue optimism about growth in personal incomes and mispricing of risk by commercial banks amplified by the behaviour of both policymakers and individuals
A broad range of country-specific and general economic factors have contributed to the successful economic adjustment seen in Latvia since the height of the crisis Ambitious front-loaded and largely expenditure-based fiscal consolidation helped to contain the budget deficit whilst the confidence generated by the introduction of a credible programme itself aided the economic recovery The flexibility of the labour market meanwhile helped companies to restore competitiveness by means of wage reductions and job cuts Competitiveness was also improved by steps taken to shift the tax burden from labour to consumption and property The recovery in Latvia was very much export-driven with the growth in exports made possible by the openness of the economy and the faster-than-expected economic growth experienced by major trading partners A number of structural reforms including bank restructuring and measures improving the use of EU funds have contributed to the development of a more favourable business environment A generous allocation from the European structural funds meanwhile helped to boost public investment and supported financing and reforms in many important sectors Above all the success of the recovery measures implemented in Latvia proved that for a tough internal economic adjustment to be effective there needs to be both a determined political will to carry out unpopular reforms and also a fully-developed comprehensive social safety net to protect more vulnerable groups
in society during difficult times In addition Latvia benefited from the fact that those looking for work were able to migrate to other EU countries which helped to alleviate the social tension created by the effects of the crisis Some of the lessons above are clearly applicable to other Member States undergoing challenging economic adjustment while others are more Latvia-specific
While Latviarsquos current level of economic growth is regarded as sustainable (50) and the adoption of the euro is recognised as a significant and hard-earned achievement it is not the end of the road The current robust economic situation should be used to advance reforms and improve Latvias long-term growth potential rather than lead to complacency and relaxation of reform efforts Sustainable convergence of the economy in the longer term will require inter alia ongoing commitment to prudent fiscal policies (there are some recent signs of less prudent fiscal decision-making) a continuous use of macro-prudential tools to reduce risks from growing non-resident financial flows especially in view of recent Ukraine events and the implementation of reforms in a number of vested-interest-heavy areas These include higher education and science state owned enterprise management electricity and gas market liberalization and the judiciary including insolvency framework But above all and in order to ensure economic and social sustainability for years to come high rates of poverty social exclusion and dismal demographic trends need to be addressed boldly These and other structural challenges are being addressed by the Commission under the European Semester and the Post Program Surveillance frameworks Also Latvia has joined a euro area that is very different from what it was just a few years ago the euro area economic governance framework has been greatly strengthened entailing stricter obligations
(50) The Commissionrsquos alert mechanism reports issued under the Macroeconomic Imbalance Procedure have not identified economic imbalances in Latvia requiring further in-depth investigation for possible policy action
httpeceuropaeueurope2020pdf2014amr2014_enpdf
40 | Quarterly Report on the Euro Area
II4 Corporate balance sheet adjustment in the euro area and the United States (51)
This section compares balance sheet adjustment in the non-financial corporate sector in the euro area and the United States It shows that the adjustment since the crisis has been faster in the latter Despite similar steep rises in corporate debt in pre-crisis years US corporations have cut debt more than those in the euro area Shifts from loans to bonds and extensions of debt maturity have also been more pronounced in the United States Much of the difference in balance sheet consolidation can be traced back to more positive profitability trends providing US firms with the internal funds necessary to adjust balance sheets Differences in dividend distribution strategies and in corporations physical investment behaviours also played a role Profitability differences reflect differences both in cyclical conditions and labour market adjustment Comparatively slow progress in balance sheet consolidation is likely to weigh on investment recovery in the euro area
-----------------------
Introduction
Both the euro area and the United States experienced a surge in corporate indebtedness in the years preceding the global financial crisis and in its early stages The ratio of debt to gross value added by non-financial corporations (NFCs) rose by about 40 pp between 2005 and 2009 Deteriorating growth prospects and changing attitudes to risk have prompted NFCs in both economies to adjust their balance sheets As previously argued in the Quarterly Report balance sheet adjustment can have a substantial effect on economic activity and it is important to monitor regularly the ongoing adjustment in the euro area (52) This section contributes to the monitoring by comparing progress in corporate deleveraging in the euro area and in the United States two regions where firms entered the crisis with excessive debt
(51) Section prepared by Plamen Nikolov (52) See European Commission (2010) Focus Balance sheet
adjustment in the corporate sector Quarterly Report on the Euro Area Vol9 (3) pp 9-19 A more detailed overview of the literature on the impact of balance sheet adjustment can be found in Cuerpo C I Drumond J Lendvai P Pontuch and R Raciborski (2013) Indebtedness deleveraging dynamics and macroeconomic adjustment European Economy Economic Papers 477
Firms consolidate their balance sheets primarily by raising their net lendingborrowing (NLB) ie the cash obtained from their production activity and available for financial operations (53) A rise in NLB is achieved either by increasing savings or cuttingpostponing physical investment Firms increase savings by raising profits and reducing the dividends distributed to shareholders In firmsrsquo financial accounts a rise in corporate NLB is associated with a rise in financial assets andor a cut in financial liabilities The section reviews recent developments in euro area and US profitability savings and NLB and looks at the instruments that the corporate sector has used to consolidate its balance sheet on both the asset and the liability side
Corporate profits have disappointed in the euro area hellip
National account data show that corporate profitability in the euro area reached a pre-crisis peak in 2007Q3 ie later than in the United States where it had already started to decline in 2007 (54)
Graph II41 NFC profitability euro area and US
(2000Q1-2013Q3 of GVA)
20
25
30
35
40
45
00Q1 01Q3 03Q1 04Q3 06Q1 07Q3 09Q1 10Q3 12Q1 13Q3
Euro area (1)
US
(1)Excluding Latvia Source Eurostat US Bureau of Economic Analysis DG ECFIN calculations
(53) Firms can also consolidate their balance sheets by raising equity (54) Profitability like the other national account variables for the
corporate sector presented in this section is measured as a proportion of corporate sector activity represented by gross value added (GVA) It is calculated as the gross operating surplus plus financial revenues and subsidies and minus financial and tax expenses Financial expenses do not include earnings distributed to shareholders
II Special topics on the euro area economy
Volume 13 No 1 | 41
The 2008-09 recession brought a sharp drop in corporate profitability in the euro area Profitability recovered briefly in 2010 to reach a new peak in 2011 but has declined again since then (Graph II41) In the United States the impact of the crisis was rather muted with profits recovering vigorously after 2008 As a ratio to gross value added (GVA) US corporate profits had already passed their pre-crisis level in 2009 before flattening out in the past two years Overall by 2013 profitability in the euro area was still about 2 pp below its pre-crisis peak while in the United States it stood around 3 pp above
hellip mostly due to weak operating surplus
The disappointing profit performance in the euro area relative to the United States is largely due to differing developments in gross operating surplus Looking at the breakdown of the contribution to the cumulative change in corporate profitability since the start of the crisis there is a marked difference between firms in the euro area and those in the United States (Graphs II42 and II43) (55)
Graph II42 Profitability breakdown of NFCs euro area (1)
(cumulative change in from 2007Q3 peak to 2013Q3)
35
36
37
38
39
40
41
42
-100
-80
-60
-40
-20
0
20
40
60
80
100
07Q4 08Q4 09Q4 10Q4 11Q4 12Q4
Taxes (lhs)
Other net current transfers received (lhs)
Net property income received excl dividends paid (lhs)
Operating surplus (lhs)
Profits(rhs)(2)
(1)Excluding Latvia(2)Profits in of GVA Source Eurostat DG ECFIN calculations
In the euro area a fall in the ratio of operating surplus to GVA dragged overall profitability down after 2008 Despite an improvement in 2011 in
(55) The illustration of the contributions to the cumulative change in profitability only serves to depict the relative importance of the various components of the change in profits since the crisis The starting point for the cumulative change should not be interpreted as a reference point for a desirable profit recovery
2013 operating surplus was still contributing negatively to the cumulative change in profitability since the pre-crisis peak In contrast operating surplus in the United States responded to the crisis earlier than in the euro area but its contribution to the change in profits remained positive
Graph II43 Profitability breakdown of NFCs US
(cumulative change in from 2005Q3 peak to 2013Q3)
24
25
26
27
28
29
30
31
-100
-80
-60
-40
-20
0
20
40
60
80
100
05Q4 06Q4 07Q4 08Q4 09Q4 10Q4 11Q4 12Q4
Taxes (lhs)Other net current transfers received (lhs)Net property income received excl dividends paid (lhs)Operating surplus (lhs)Profits(rhs)(2)
(1) Profits in of GVA Source Federal Reserve Board US Bureau of Economic Analysis DG ECFIN calculations
Unlike operating surplus income tax payments and net income from non-operational activities did not differ significantly between the euro area and the United States (56) In both economies lower corporate tax payments resulting from lower profits generated by NFCs naturally had a positive impact on the cumulative change in profits from the pre-crisis peak
Differences in labour market developments are at the root of differences in profitability
Differences in operating surplus and profitability between the United States and the euro area can be attributed partly to differences in the business cycle In 2011Q1 NFCsrsquo gross value added was still 12 below its pre-crisis peak in the euro area but 11 above in the United States The main channel through which cyclical developments can affect operating surplus is the labour market
(56) In fact the ratio of profit tax payments to profits (a crude measure of an aggregate tax rate) in the euro area and the United States has been almost the same since the start of the crisis falling substantially in 2008-09 indicating that tax policy was not more favourable for profits in one economy than in the other
42 | Quarterly Report on the Euro Area
The cyclicality of operating surplus depends on the impact of the cycle on labour productivity as well as on wages The worse performance of operating surplus in the euro area since 2008 as compared with that in the United States reflects a stronger deterioration in labour productivity accompanied by unfavourable developments in wages per employee
Labour productivity growth in the euro area turned sharply negative in 2009 opening a big gap with the positive (albeit modest) wage growth (Graph II44) In the United States on the other hand labour productivity growth became negative earlier but to a lesser extent and some downward wage adjustment took place in 2009
Graph II44 Labour productivity and wages euro area and US
(2001Q4-2013Q3 y-o-y change)
-4
-3
-2
-1
0
1
2
3
4
5
01Q4 03Q2 04Q4 06Q2 07Q4 09Q2 10Q4 12Q2
Average wage per employee euro area (1) (2)Average wage per employee US (1)Labour productivity euro area (2) (3)Labour productivity US (3)
(1)Real wages calculated by the GDP deflator(2)Euro area excluding Latvia(3)In terms of total employment (thousands) Source Eurostat US Bureau of Economic Analysis US Bureau of Labour Statistics DG ECFIN calculations
There are a number of reasons for the different labour adjustments in the euro area and the United States In the former apart from a higher level of employment protection short-term work schemes were put in place in the early stages of the crisis (57) In addition as labour force adjustment tends to be more costly in the euro area some firms (particularly small firms and those with highly qualified employees) preferred to retain their
(57) According to the OECD Public short-term work schemes have
played an important role in preserving jobs during the crisis in a number of countries although significant hours reductions were also achieved via lower overtime hours hours averaging arrangements and employer initiatives see OECD Employment Outlook 2010 ndash Moving Beyond the Job Crisis
labour force (58) Because of a lack of wage flexibility the higher degree of lsquolabour hoardingrsquo in the euro area came at the expense of lower operating surplus and profits and consequently put a downward pressure on the capacity accumulate internal funds to deleverage
Corporate savings are much lower in the euro area
Negative developments in euro area corporate profitability were reflected in corporate savings which together with physical investment determines the internal funds available for balance sheet adjustment In 2009-10 there was a sharp drop in euro area savings because profits acted as shock absorbers and fell more rapidly than dividend payments leaving less spare cash available In contrast savings by US NFCs increased substantially on rising profits after an early-crisis low point and reached a historically high level of around 23 of GVA in 2010Q3 (Graph II45)
Graph II45 Savings of NFCs (2000Q1- 2013Q3 of GVA)
15
16
17
18
19
20
21
22
23
24
00Q1 01Q3 03Q1 04Q3 06Q1 07Q3 09Q1 10Q3 12Q1 13Q3
Euro area (1)
US
(1)Euro area excluding Latvia Source Eurostat Bureau of Economic Analysis DG ECFIN calculations
The impression that US corporate behaviour has been more geared towards accumulating savings than that in the euro area is reinforced when one looks at dividend distribution Dividends paid by euro area NFCs have been on a declining trend since the start of the crisis but those paid by US firms have also decreased This is remarkable given (58) See Box 12 Labour hoarding across different types of firms in
OECD Employment Outlook 2010 ndash Moving Beyond the Job Crisis
II Special topics on the euro area economy
Volume 13 No 1 | 43
the positive profit developments in the United States (Graph II46) A drop in dividends alongside profit growth suggests that after 2008 US companies preferred to direct a bigger proportion of the profit recovery to corporate savings and thereby balance sheet adjustment The ratio of dividends to profits in the United States has fallen from about one third before the crisis to one quarter now This ratio also dropped in the euro area although by less (59)
Graph II46 Dividends paid of NFCs (2000Q1-2013Q3 of GVA)
0
5
10
15
20
25
00Q1 01Q3 03Q1 04Q3 06Q1 07Q3 09Q1 10Q3 12Q1 13Q3
Euro area (1)
US
(1)Euro area excluding Latvia Source Eurostat Federal Reserve Board DG ECFIN calculations
Disappointing physical investment in the euro area and the United States
Cutting investment in physical assets is another way of reducing excessive indebtedness Corporate investment as a proportion of activity dropped sharply both in the euro area and in the United States in the early stages of the crisis (Graph II47)
After a modest recovery in 2010-11 the investment rate decreased again in the euro area The investment recovery was more solid in the United States but has lost momentum since the end of 2012 and the investment rate remains below its pre-crisis peak Overall it seems that euro area corporations partly compensated for less supportive savings developments than in the US by
(59) Dividend payments are not the only way of distributing profits to shareholders Equity buybacks can also be used for this purpose and firms that choose this option will tend to have higher savings and lower dividends paid
curbing physical investment more than their US counterparts
Graph II47 Investment of NFCs (2000Q1- 2013Q3 of GVA)
15
16
17
18
19
20
21
22
23
24
00Q1 01Q3 03Q1 04Q3 06Q1 07Q3 09Q1 10Q3 12Q1 13Q3
Euro area (1)
US
(1)Excluding Latvia Source Eurostat US Bureau of Economic Analysis DG ECFIN calculations
A more modest increase in net lending in the euro area than in the US
Since 2013 firmsrsquo net lending in the euro area has been in positive territory but substantially less so than that in the United States (Graph II48) Positive NLB in the euro area unlike that in the United States is mostly due to a low investment rate alone rather than low investment combined with high savings The combination of disappointing investment and high savings has translated into historically high and sustained NLB for US firms
This persistent net lending position in the United States is atypical as firms usually invest more than they save It suggests that US firms have been adjusting their balance sheets significantly since the beginning of the crisis via their internal funds while euro area firms seem to have opted for much slower balance sheet adjustment
44 | Quarterly Report on the Euro Area
Graph II48 Net lendingborrowing of NFCs
(2000Q1- 2013Q3 of GVA)
-10
-8
-6
-4
-2
0
2
4
6
8
00Q1 01Q3 03Q1 04Q3 06Q1 07Q3 09Q1 10Q3 12Q1 13Q3
Euro area (1)
US
(1)Excluding Latvia Source Eurostat US Bureau of Economic Analysis DG ECFIN calculations
Debt deleveraging has been more pronounced in the US than in the euro area
The faster pace of adjustment of balance sheets in the United States is confirmed by the corporate debt data (Graph II49) (60) (61) While both the euro area and the United States entered the crisis with swiftly rising and historically high levels of debt deleveraging has progressed more rapidly in the latter since the crisis By the beginning of 2012 US corporate debt had fallen by approximately 15 pp as a proportion of activity while euro area debt had dropped by 7 pp (62)
(60) Non-financial corporate debt consists of loans and securities
other than shares (corporate bonds) both can be classified as short- or long-term depending on whether their original maturity is less or more than one year
(61) This section analyses developments in non-consolidated financial flows and stocks in the euro area and in the United States for two reasons it is important to have a sense of financial positions within the institutional sector eg loans between NFCs are an important part of intra-firm relationships as head offices use them to finance subsidiaries for example perhaps for tax reasons This is relatively more important in the euro area than in the United States Consolidated financial asset and flow data eliminate these intra-sector positions and different approaches may be taken to consolidation as in the euro area there is the additional issue of cross-border consolidation between Member States while there is no need for flows and positions between firms in different US states to be treated separately
(62) The debt-to-equity ratio is another measure of corporate leverage widely followed by investors Faster stock market recovery helped US firms reduce this ratio more than those in the euro area
Graph II49 Debt levels of NFCs(1) (1999Q1-2013Q3 of GVA)
100
120
140
160
180
200
220
99Q1 00Q3 02Q1 03Q3 05Q1 06Q3 08Q1 09Q3 11Q1 12Q3
Euro area (2)
US
(1)Securities other than shares and loans(2)Excluding Latvia Source Eurostat US Bureau of Economic Analysis DG ECFIN calculations
Firms in the euro area and the United States entered the crisis with almost the same level of short-term debt as a proportion of total debt Since the crisis the adjustment away from short-term debt has been significantly more pronounced in the United States suggesting more active balance sheet restructuring
Graph II410 Debt flows of NFCs(1) (1999Q1- 2013Q3 of GVA)
-15
-10
-5
0
5
10
15
20
99Q1 01Q1 03Q1 05Q1 07Q1 09Q1 11Q1 13Q1
Euro area bonds (2)
US bonds
Euro area loans (2)
US loans
(1)Securities other than shares and loans (2)Excluding Latvia Source Eurostat US Bureau of Economic Analysis DG ECFIN calculations
Due to differences in the structure of corporate finance loans (as opposed to bonds) tend to form a bigger proportion of debt in the euro area than in the United States An important element of the
II Special topics on the euro area economy
Volume 13 No 1 | 45
corporate balance sheet adjustment process in both economies has been a movement away from an excessive reliance on loans (Graph II410) and towards bond financing This trend has been substantially more pronounced in the United States presumably reflecting the fact that bond markets are more developed in that country
Developments in non-financial corporate debt were also influenced by developments in financial intermediation in particular in the banking sector Financial accounts show NFCsrsquo debt exposure but do not indicate whether the debt holder is a bank According to bank balance sheet statistics the nominal growth of loans vis-agrave-vis NFCs has been mostly negative in the euro area since 2009Q4 (Graph II411) Coupled with the positive loan inflows seen in the national accounts between 2010Q3 and 2012Q3 (Graph II410) this shows a degree of substitution in corporate loan liability ownership between banks and other financial firms and sectors (including other NFCs) in this period According to the counterparty breakdown of NFC domestic loans published by the ECB corporate borrowings from other NFCs represented 29 of all loans by 2013Q3 (up from 26 in 2008Q1) while the proportion of borrowings from monetary financial institutions (MFIs) had dropped (from 60 in 2008Q1) to an all-time low of 53 The proportion of loans from other non-bank financial intermediaries also increased There is less evidence of a shift from banks to other loan providers in the United States where loans between NFCs are much more limited
Graph II411 Bank loans to NFCs (1999Q1- 2013Q3 y-o-y change)
-20
-15
-10
-5
0
5
10
15
20
25
99Q1 00Q3 02Q1 03Q3 05Q1 06Q3 08Q1 09Q3 11Q1 12Q3
Euro area bank loans to NFCs (1)US bank loans to NFCs
(1)Excluding Latvia Source ECB US Federal Reserve Board DG ECFIN calculations
Positive NLB has been used to acquire safe financial assets in both regions
In both the euro area and the United States the positive NLB has been used to deleverage but also to invest in safe financial assets At the beginning of the crisis much of the positive corporate NLB in the United States was invested in money market mutual funds which is essentially investment in short-term low-risk assets (Graph II412) (63)
Currency and deposits (another type of safe asset) have increased substantially in the euro area in recent years as a proportion of total firm activity (Graph II413) This rise was driven almost exclusively by a rapid increase in firmsrsquo savings deposits To some extent a similar trend is observable in the United States In particular US cash balances (a sub-component of currency and deposits) approached 12 of GVA by the end of 2013 a level not seen since the early 1990s On the other hand savings deposits have grown more modestly resulting in a moderately positive overall trend in currency and deposits
Graph II412 Mutual fund shares of NFCs (1999Q1- 2013Q3 of GVA)
0
2
4
6
8
10
12
14
99Q1 01Q1 03Q1 05Q1 07Q1 09Q1 11Q1 13Q1
Euro area (1)
US (2)
(1)Excluding Latvia(2)In the USA these asset series can be broken down into investment in money market mutual funds and investment in other mutual funds The 2009-11 increase is fully attributable to the former Source Eurostat US Bureau of Economic Analysis DG ECFIN calculations
Overall these two aspects of corporate financial investment behaviour signify considerable liquidity concerns on the part of firms in both the euro area
(63) Euro area financial accounts only show firmsrsquo investment in mutual funds overall and do not distinguish between types of mutual funds
46 | Quarterly Report on the Euro Area
and the United States They also represent a drive towards lower-risk assets perhaps indicating increased risk aversion by corporations or a tendency to postpone physical investment in a context of perceived high uncertainty
Graph II413 Currency and deposits ndash NFCs
(1999Q1- 2013Q3 of GVA)
0
5
10
15
20
25
30
35
40
45
99Q1 00Q3 02Q1 03Q3 05Q1 06Q3 08Q1 09Q3 11Q1 12Q3
Euro area (1)
US
(1)Excluding Latvia Source Eurostat US Bureau of Economic Analysis DG ECFIN calculations
Conclusion
Although both regions saw similar steep rises in corporate debt in the pre-crisis years balance sheet adjustment since the crisis has been significantly slower in the euro area than in the United States The more rapid adjustment in the United States can be explained by a stronger cyclical recovery more supportive profitability developments and reduced dividend payment ratios In the euro area profitability has been hindered by a combination of lower flexibility in the labour markets and slow wage adjustment
The slower balance sheet adjustment in the euro area corporate sector is visible in a slower fall in indebtedness but also a slower adjustment of the structure of balance sheets In particular the shift from loans to bonds and the extension of debt maturity have been more pronounced in the United States In both regions firms have used their positive NLB to accelerate the accumulation of safe and liquid financial assets This could reflect continuing uncertainty regarding future demand and growth prospects
Overall the evidence discussed in this section shows that euro area firms are lagging significantly behind their US counterparts in terms of balance sheet consolidation Given that investment rates remain disappointing even in the more advanced US corporate sector a degree of caution appears warranted when assessing short-term prospects for corporate investment in the euro area
III Recent DG ECFIN publications
Volume 13 No 1 | 47
1 Occasional Papers
European Economy Occasional Papers 170 January 2014 Financial Assistance Programme for the Recapitalisation of Financial Institutions in Spain Fifth Review ndash Winter 2014 httpeceuropaeueconomy_financepublicationsoccasional_paper2014pdfocp170_enpdf
European Economy Occasional Papers 169 December 2013 The Economic Adjustment Programme for Cyprus Second Review ndash Autumn 2013 httpeceuropaeueconomy_financepublicationsoccasional_paper2013pdfocp169_enpdf
European Economy Occasional Papers 168 December 2013 Fiscal frameworks in the European Union ommission services country factsheets for the Autumn 2013 Peer Review httpeceuropaeueconomy_financepublicationsoccasional_paper2013pdfocp168_enpdf
European Economy Occasional Papers 167 December 2013 Economic Adjustment Programme for Ireland - Autumn 2013 Review httpeceuropaeueconomy_financepublicationsoccasional_paper2013pdfocp167_enpdf
European Economy Occasional Papers 166 December 2013 Progress towards meeting the economic criteria for EU accession the EU Commissionrsquos 2013 assessments httpeceuropaeueconomy_financepublicationsoccasional_paper2013pdfocp166_enpdf
European Economy Occasional Papers 165 November 2013 Romania Balance-of-Payments Assistance Programme 2013-2015 httpeceuropaeueconomy_financepublicationsoccasional_paper2013pdfocp165_enpdf
European Economy Occasional Papers 164 November 2013 The Economic Adjustment Programme for Portugal Eighth and Ninth Review httpeceuropaeueconomy_financepublicationsoccasional_paper2013pdfocp164_enpdf
European Economy Occasional Papers 163 November 2013 Financial Assistance Programme for the Recapitalisation of Financial Institutions in Spain Fourth Review ndash Autumn 2013 httpeceuropaeueconomy_financepublicationsoccasional_paper2013pdfocp163_enpdf
European Economy Occasional Papers 162 October 2013 Economic Adjustment Programme for Ireland Summer 2013 Review httpeceuropaeueconomy_financepublicationsoccasional_paper2013pdfocp162_enpdf
2 Economic papers
European Economy Economic Papers 514 February 2014 Martin Larch Kristin Magnusson Bernard Balint Tatar Hard work and More How to successfully conduct adjustment with official assistance httpeceuropaeueconomy_financepublicationseconomic_paper2014pdfecp514_enpdf
European Economy Economic Papers 513 February 2014 Florian Woumlhlbier Caterina Astarita Gilles Mourre Consolidation on the revenue side and growth-friendly tax structures an indicator based approach httpeceuropaeueconomy_financepublicationseconomic_paper2014pdfecp513_enpdf
48 | Quarterly Report on the Euro Area
European Economy Economic Papers 512 December 2013 Alexander Schwan Etienne Sail Assessing the economic and budgetary impact of linking retirement ages and pension benefits to increases in longevity httpeceuropaeueconomy_financepublicationseconomic_paper2013pdfecp512_enpdf 3 Other publications
Winter forecast 2014 - EU economy recovery gaining ground httpeceuropaeueconomy_financepublicationseuropean_economy2014pdfee2_enpdf 4 Regular publications
Business and Consumer Surveys (harmonised surveys for different sectors of the economies in the European Union (EU) and the applicant countries) httpeceuropaeueconomy_financedb_indicatorssurveysindex_enhtm Business Climate Indicator for the euro area (monthly indicator designed to deliver a clear and early assessment of the cyclical situation) httpeceuropaeueconomy_financedb_indicatorssurveysdocuments2013bci_2013_11_enpdf Key indicators for the euro area (presents the most relevant economic statistics concerning the euro area) httpeceuropaeueconomy_financedb_indicatorskey_indicatorsindex_enhtm Monthly and quarterly notes on the euro-denominated bond markets (looks at the volumes of debt issued the maturity structures and the conditions in the market) httpeceuropaeueconomy_financepublicationsbond_marketindex_enhtm Price and Cost Competitiveness httpeceuropaeueconomy_financedb_indicatorscompetitivenessindex_enhtm
50 | Quarterly Report on the Euro Area
Editor-in-Chief Elena Flores
Overall coordination Eric Ruscher
Data assistance Christos Zavos
Comments on the report would be gratefully received and should be sent to
Elena Flores Director ndash Policy Strategy and Coordination Directorate-General for Economic and Financial Affairs Office CHAR 1566
B-1049 Brussels
Email elenafloreseceuropaeu
or
Eric Ruscher Head of Unit ndash Macroeconomy of the euro area Directorate-General for Economic and Financial Affairs Office CHAR 15248
B-1049 Brussels
Email ericruschereceuropaeu
HOW TO OBTAIN EU PUBLICATIONS Free publications bull one copy
via EU Bookshop (httpbookshopeuropaeu) bull more than one copy or postersmaps
from the European Unionrsquos representations (httpeceuropaeurepresent_enhtm) from the delegations in non-EU countries (httpeeaseuropaeudelegationsindex_enhtm) by contacting the Europe Direct service (httpeuropaeueuropedirectindex_enhtm) or calling 00 800 6 7 8 9 10 11 (freephone number from anywhere in the EU) () () The information given is free as are most calls (though some operators phone boxes or hotels may charge you)
Priced publications bull via EU Bookshop (httpbookshopeuropaeu) Priced subscriptions bull via one of the sales agents of the Publications Office of the European Union
(httppublicationseuropaeuothersagentsindex_enhtm)
KC-AK-14-001-en-n
- Blank Page
- Blank Page
- Blank Page
- Blank Page
-
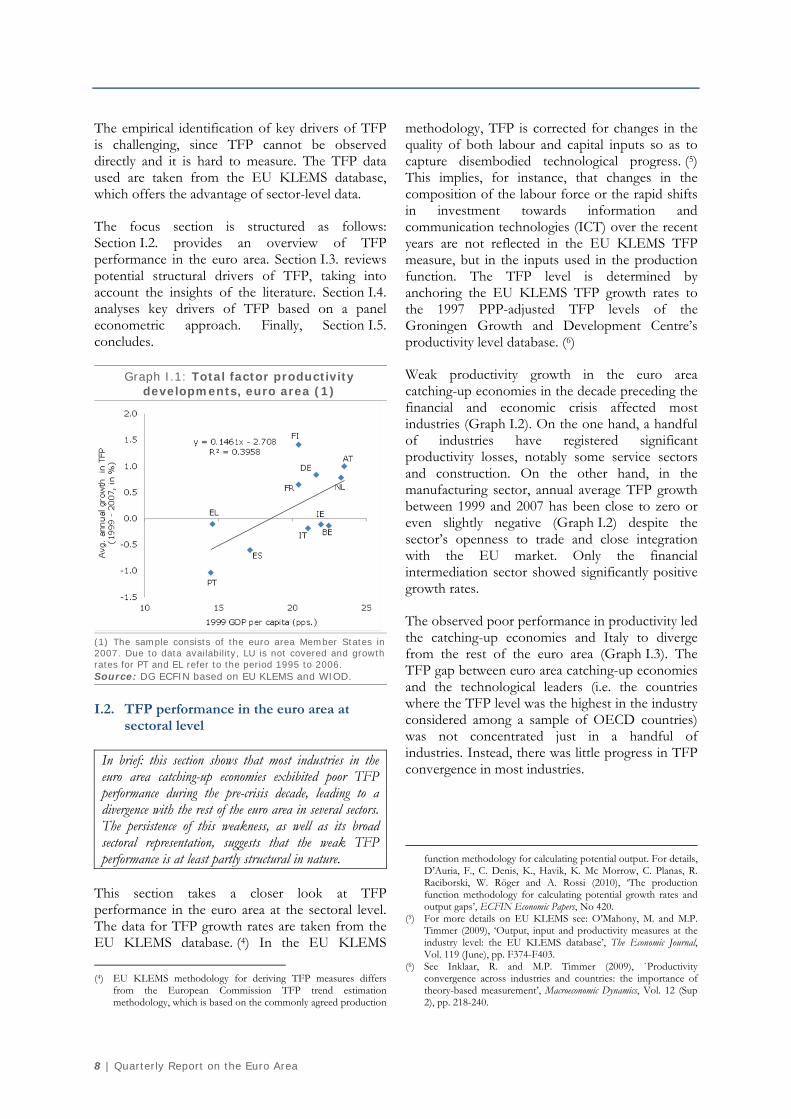
I The drivers of total factor productivity in catching-up economies
Volume 13 No 1 | 11
Graph I6 TFP growth and RampD spending
Source DG ECFIN based on EU KLEMS and WIOD
Structuralinstitutional drivers related to framework conditions
Apart from the quality of labour and capital inputs the literature suggests that structuralinstitutional drivers affecting the framework conditions in which the economy operates have a significant impact on TFP
A large body of economic literature suggests that more rigid product and labour markets tend to weaken productivity by slowing down the catching-up process of best-practice technologies delaying firm-level adjustments andor reducing direct productivity gains (11)
The OECD product market regulation (PMR) indicators which measure the degree of anti-competitive regulation in selected sectors of the economy have improved for most sectors of the euro area countries during the pre-crisis period (1994-2007) At the same time countries with a higher PMR indicator in 1994 showed lower productivity growth over the period resulting in a negative correlation between TFP growth and the degree of anti-competitive regulation All catching-up economies as well as Italy showed stricter product market regulation in 1994 (Graph I7)
industriesrsquo The Review of Economics and Statistics Vol 86(4) pp 883-895 Inklaar R Timmer M and van Ark B (2008) lsquoMarket services productivity across Europe and the USrsquo Economic Policy 23 pp 139-194
(11) Nicoletti G and S Scarpetta (2003) lsquoRegulation productivity and growth OECD evidencersquo Economic Policy April pp 9-72 Burda M and B Svergnini (2009) lsquoTFP growth in old and new Europersquo Comparative Economic Studies Vol 51 pp 447-466
Graph I7 Product market regulation (1)
(1) The graph shows the OECD lsquoregimpactrsquo indicator which assigns higher indicators to stricter product market regulation Source DG ECFIN based on OECD
Looking at labour market rigidities the OECD employment protection indicators (EPL) show that the catching-up economies started with a relatively high degree of rigidity in their employment protection legislation (Graph I8) The negative correlation between the average TFP growth over 1994 to 2007 and the score in the EPL indicator in 1994 indicates that the poor TFP performance observed over the pre-crisis period could to some extent be negatively related to the initial level of the employment protection legislation However the correlation seems to be much weaker than in the case of RampD spending
Graph I8 Employment protection legislation (1)
(1) The graph shows the employment protection indicator for regular contracts in terms of individual and collective dismissals Higher values stand for stricter protection rules Source DG ECFIN based on OECD
12 | Quarterly Report on the Euro Area
Poor productivity performance has also been linked by several studies to the deteriorating quality of institutions (12) The institutional quality as measured by the government effectiveness of the World Bank Governance Indicators database was indeed low in the euro area economies with poor productivity performance (Graph I9) This seems to be particularly the case of Italy
Graph I9 Effectiveness of governments (1)
(1) Government effectiveness captures perceptions of the quality of public services the quality of the civil service and the degree of its independence from political pressures the quality of policy formulation and implementation and the credibility of the governmentrsquos commitment to such policies Higher values point to higher government effectiveness Source DG ECFIN based on World Bank (2013) Worldwide governance indicators
Finally there is also evidence that higher corporate tax rates can distort factor prices and reduce entrepreneurship and RampD activities resulting in a negative impact on TFP (13) The negative correlation between average TFP growth rates over the period 1994-2007 and the corporate tax rate in 1994 seem to support this hypothesis (Graph I10)
(12) Bertola G (2013) lsquoPolicy coordination convergence and the rise
and crisis of EMU imbalancesrsquo lsquoThe future of EMUrsquo Fellowship ECFIN Economic Paper 490 Acemoglu D Johnson S and J Robinson (2001) lsquoThe colonial origins of comparative development an empirical investigationrsquo American Economic Review Vol 91(1) pp 1369-1401
(13) Vartia L (2008) lsquoHow do taxes affect investment and productivity An industry-level analysis of OECD countriesrsquo OECD Economics Department Working Papers No 656
Graph I10 Effective average tax rates (1)
(1) Effective average tax rates are calculated in line with Devereux MP and R Griffith (2003) lsquoEvaluating tax policy for location decisionsrsquo International Tax and Public Finance Vol 10 pp 107-126 Source DG ECFIN based on Elschner C and M Overesch (2007) lsquoTrends in corporate tax levels in Europersquo Intereconomics Vol 42(3) pp 127-132
I4 Empirical evidence of the drivers of TFP
In brief this section presents panel regression results based on an endogenous growth model The findings show that TFP growth over 1994-2007 was mainly driven by the convergence and spillover channel as well as spending for innovation activities For euro area catching-up countries policy measures that reduce employment protection legislation lower corporate tax rates and improve government effectiveness seem to have the most beneficial impact on TFP growth
The aim of this section is to analyse the main drivers of TFP using a panel data approach The identification of key determinants of TFP is challenging since TFP is hard to measure and it can be affected by a broad set of factors shaping the institutional and economic features of the economy
The empirical approach investigates TFP performance in OECD economies thereby excluding emerging countries Relying solely on country-specific information may however lead to biased results due to the small sample size Therefore the analysis benefits from the sector-specific information of the EU KLEMS database One major drawback of this approach however is that EU KLEMS only offers data until 2007 Against this background the drivers of TFP are analysed using a sample of up to 20 OECD countries and 14 sectors over the time period 1994 to 2007
I The drivers of total factor productivity in catching-up economies
Volume 13 No 1 | 13
The dependent variable is defined as total factor productivity growth in line with the growth accounting methodology of EU KLEMS (see Section I2) The selection of potential explanatory factors with a causal impact on TFP was made based on the key explanatory variables presented in Section I3
Two independent variables are of particular importance First the technology gap which measures the distance between the TFP level of the country concerned and the country with the highest TFP level This variable provides an indication of the impact from the convergence channel It is expected that with a larger technology gap the potential benefit of adopting new technologies increases resulting in a higher TFP growth rate Second the possibility of positive innovation and knowledge spillovers is captured by including the TFP growth rate of the country with the highest TFP level (the technology leader) This variable measures the importance of the spillover channel Apart from these explanatory variables the specification includes a large set of control factors in line with Section I3 such as the impact of ICT compensation RampD expenditure the share of high-skilled population as well as country- sector- and time-fixed effects (see Box I1 for more detailed results)
The findings of a first set of (restricted) empirical regressions (14) show that convergence and spillover effects are important factors in explaining TFP growth Both variables appear to be strongly significant The larger the distance to the frontier the more sizeable the positive impact from the convergence channel on TFP gets At the same time an increase of the spillover effect as realised by the TFP growth of the technology leader results in a higher TFP growth rate The empirical findings suggest that the impact from the spillover channel is stronger than the impact from the convergence channel The results also reveal that the strength of the spillover channel seems to have increased over time while that of the convergence channel has weakened
Apart from the convergence and spillover channels TFP growth appears to be strongly supported by innovation activities as captured by
(14) As a starting point TFP growth was regressed on the technology gap and the spillover channel apart from country- sector- and time-fixed effects thereby omitting further control variables
the share of ICT compensation in total compensation and RampD expenditure By contrast labour skills as measured by the share of population aged 25 and over who have completed tertiary education turns out not to be significant This finding indicates that the correction of TFP done in EU KLEMS for changes in the quality of input factors (see Section I2) appears to be successful for labour but not completely so for capital input factors
There is no clear evidence that other structural variables have a direct significant impact on TFP growth However it is possible that the impact of other potential factors could depend on the state of the convergence or spillover channel For instance certain structural variables may only be significant for more (or less) advanced countries ie those with a small (or high) gap to the technology frontier
To investigate these conditional effects another set of regressions was run to estimate a set of interaction models In these regressions the technology gap and the spillover term are interacted with the structural drivers related to the framework conditions presented in Section I3 These indicators capture different policy areas that are proxied by five variables namely labour market flexibility (employment protection legislation) tax regimes (effective average tax rates) institutional quality (government effectiveness) population ageing (old age dependency ratio) and product market regulations (OECD regimpact indicator)
The results of these interaction models show that the effect of the structural variables on TFP growth is dependent on the technology gap More rigid employment protection legislation tends to have a negative impact on TFP growth The negative impact becomes stronger the less advanced the economy is The impact on TFP growth is however not statistically significant for the least advanced economies ie those which have a very high technology gap An increase in corporate tax rates and ageing population seem to have a particularly detrimental impact on TFP in less advanced economies Improving government effectiveness tends to have a positive and significant impact on TFP growth for medium- and more advanced economies Finally the results do not suggest a statistically significant impact of product market regulation
14 | Quarterly Report on the Euro Area
(Continued on the next page)
I The drivers of total factor productivity in catching-up economies
Volume 13 No 1 | 15
Box (continued)
(Continued on the next page)
16 | Quarterly Report on the Euro Area
Box (continued)
(Continued on the next page)
I The drivers of total factor productivity in catching-up economies
Volume 13 No 1 | 17
Box (continued)
(Continued on the next page)
18 | Quarterly Report on the Euro Area
The interaction models reveal that the impact of the structural variables also seems to be conditional on the spillover channel ie the growth rates of the economies with the highest TFP level Stricter employment protection legislation an increase of the corporate income tax rate or a higher old age dependency ratio all have a detrimental impact on TFP growth when the TFP growth rate of the technology leader is high Since sectors closely related to ICT appear to show the highest growth rates over the sample period the findings implicitly suggest that these sectors tend to react strongest to changes in labour market flexibility tax regimes and population ageing The effect from improving the effectiveness of governments by contrast seems to be of great importance for all sectors Finally product market regulation does not seem
to matter for TFP growth irrespective of the growth rate of the leading economy
Applying the findings of the panel regressions conducted for up to 20 economies to the euro area economies allows for the following tentative conclusions
bull The TFP divergence between euro area catching-up economies relative to the rest of the euro area in the decade preceding the global financial and economic crisis can be partly explained by the following indicators a weakening of the convergence channel lower spending on innovation activities such as RampD and ICT deteriorating government effectiveness and faster population ageing
Box (continued)
I The drivers of total factor productivity in catching-up economies
Volume 13 No 1 | 19
bull Looking forward policy measures that fosterinnovation activities reduce the restrictivenessof employment protection legislation lowercorporate tax rates and improve governmenteffectiveness could help promote TFP growthin the euro area catching-up economies
bull It is worth stressing that according to theregression results employment protectionlegislation has not contributed to the TFPdivergence process since euro area catching-upeconomies did not fall behind the rest of theeuro area in this respect between 1994 and2007 Similarly corporate tax policy does notseem to have been a source of divergence overthat period Nevertheless the regression resultsalso indicate that policy action in those twoareas could improve TFP growth in thecatching-up countries as well as in the rest ofthe euro area
I5 Conclusions
The TFP income convergence process in the euro area weakened in the decade preceding the economic and financial crisis mainly due to weak TFP growth in catching-up economies In fact the gap between euro area catching-up economies and technological leaders actually widened in a broad range of sectors
The persistence of the technology gap since the mid-1990s suggests that the causes are deep-rooted and at least partly structural The econometric analysis presented in this focus section shows that the TFP divergence between euro area catching-up economies and the rest of the euro area can be partly explained by the following indicators a weakening of the convergence channel lower spending on innovation activities such as RampD and ICT deteriorating government effectiveness and faster population ageing
In response to the crisis catching-up countries have put in place a broad range of reforms aimed at improving framework conditions labour market flexibility and the efficiency of the business environment These are likely to raise TFP growth rates in the years to come
However since catching-up is shown to be more difficult for economies approaching the technological frontier the adoption of further structural measures would also help more advanced countries accelerate their TFP convergence In particular measures that foster innovation activities reduce further the restrictiveness of employment protection legislation lower corporate tax rates and improve government effectiveness appear to be the most effective at promoting TFP growth
II Special topics on the euro area economy
Volume 13 No 1 | 21
II1 New estimates of Phillips curves and structural unemployment in the euro area (15)
The Phillips curve can be used to estimate the non-cyclical part of unemployment In such models this estimate is commonly referred to as the lsquonon-accelerating wage rate of unemploymentrsquo (NAWRU)(16) The Phillips curve can be specified in various ways reflecting different assumptions regarding the formation of expectations DG ECFIN has recently extended its framework to cover rational expectations This section looks at the sensitivity of the results to alternative expectation assumptions reporting NAWRU estimates based on Phillips curves produced using rational expectations and those (as used to date) allowing only for static or adaptive expectations
Our findings show that for the euro area as a whole the alternative expectation assumptions yield similar NAWRU estimates In particular the NAWRU appears to have increased recently suggesting a deterioration of labour market performance beyond what could be considered merely cyclical For Spain however the results vary more depending on the assumptions used The Phillips curve based on rational expectations points to a more moderate NAWRU increase than that used by DG ECFIN to date However all estimates point to a substantial post-crisis increase in the NAWRU for Spain
In interpreting the rise in the NAWRU it is important to bear in mind that both structural and non-structural factors are driving developments Analysis shows that in the presence of rigidities crisis-related events can have temporary but long-lasting effects on labour market performance Structural factors can play a role too as illustrated by the steady decline in the NAWRU in Germany which appears to be related to structural effects brought about by the Hartz reforms
-------------------------------
(15) Section prepared by Fabrice Orlandi (16) The Phillips curve features a relationship between the
unemployment gap and an inflation or labour-cost variable In the case of the former the non-cyclical unemployment estimate obtained is usually referred to as the lsquonon-accelerating inflation rate of unemploymentrsquo (NAIRU) while with the latter it is referred to as the lsquonon-accelerating wage rate of unemploymentrsquo (NAWRU)
Introduction
Unemployment rates increased sharply in the euro area in the wake of the crisis and the surge has proved particularly persistent Assessing this development is of paramount importance to policy-makersrsquo efforts to find adequate responses to the effects of the crisis
The non-cyclical part of unemployment play a key role in this assessment as it identifies the proportion of the deterioration that is likely to last beyond the business cycle In the EU context this indicator is particularly important as it is a factor to be fed into the potential output calculations used to compute cyclically-adjusted fiscal figures important benchmarks for country surveillance under the EUrsquos fiscal framework(17)
The non-cyclical part of unemployment is not an observable variable however and has to be estimated which means that it is subject to uncertainty In part the uncertainty stems from the fact that different estimation models are available The Phillips curve is commonly used as a key element in estimation models(18) but can itself be specified in various ways most notably reflecting alternative assumptions as to the formation of expectations(19)
This section sets out DG ECFINrsquos approach to estimating the non-cyclical part of unemployment in particular in its use of the Phillips curve We also investigate the sensitivity of the results to alternative expectation assumptions highlighting the results obtained for the case of rational expectations the case recently incorporated in DG ECFINrsquos estimation framework
The results presented here focus on the euro area but results are also reported for Spain and Germany two countries that have witnessed starkly different non-cyclical unemployment developments
(17) For details on the EUrsquos SGP framework see Vademecum on the Stability and Growth Pact European Economy mdash Occasional Paper No 151 DG ECFIN European Commission May 2013
(18) For an illustration of structural unemployment analysis based on an alternative concept see eg Unemployment dynamics during recessions and recoveries Okunrsquos law and beyond IMF WEO April 2010
(19) For details on the Phillips curve see Fuhrer J YK Kodrzycki GP Olivei and J Sneddon Little Understanding inflation and the implication for monetary policy mdash a Phillips curve retrospective MIT Press 2009
22 | Quarterly Report on the Euro Area
in the recent past We use long time series usually starting in 1965 to capture medium-term cycles The latest DG ECFIN forecasts are also included in the dataset
Alternative NAWRU models
Non-cyclical unemployment is estimated on the basis of models that pin-down its statistical and economic properties DG ECFINrsquos approach relies on an lsquounobserved componentrsquo model which features a Phillips curve The curve links cyclical unemployment (ie the unemployment gap) to labour cost developments while non-cyclical unemployment is assumed not to be affected by labour cost developments In this setting non-cyclical unemployment estimates are commonly referred to as the lsquonon-accelerating wage rate of unemploymentrsquo (NAWRU)(20)
The specification of the Phillips curve reflects particular assumptions made regarding inflation expectations In the past DG ECFINrsquos considered only static and adaptive expectations More recently the case of rational expectations has been added providing a more comprehensive framework (see Box II11)
More specifically the so-called traditional Keynesian Phillips (TKP) curve based on static or adaptive expectation assumptions a positive unemployment gap ( minus lowast) with a fall in the change of the growth rate of nominal unit labour cost (∆ ) (and vice versa) ∆ = minus ( minus lowast) The new Keynesian Phillips (NKP) curve based on rational expectations implies that a positive unemployment gap ( minus lowast) is associated with a fall in the growth rate of real unit labour cost (∆ ) Lagged effects are also relevant because some wage-setters may use ad hoc rules and not fully optimise = ∆ minus ( minus lowast)+ ( minus lowast ) (20) For further details on the DG ECFIN approach see DrsquoAuria F
C Denis K Havik K Mc Morrow C Planas R Raciborski W Roumlger and A Rossi (2010) The production function methodology for calculating potential growth rates and output gaps European Economy mdash Economic Paper No 420 DG ECFIN European Commission July 2010
These alternative Phillips curves thus rely on different labour cost indicators to determine the unemployment gap (and thus also the NAWRU) namely ∆ and ∆ As explained in Box II11 this does not mean that the models are fundamentally different Instead it illustrates the impact of assumptions as to expectation formation on the specification of the Phillips curve
NAWRU developments
For the euro area as a whole NAWRU estimates based on the TKP and the NKP show a similar pattern (see Graph II11)(21) The similarity suggests that for most countries in the euro area results are not overly sensitive to the specification of the Phillips curve (ie to assumptions as regards expectation formation) In practice it also suggests that alternative labour cost indicators (ie change in unit labour cost (ULC) growth and real unit labour cost (RULC) growth) underwent broadly similar developments in the euro area this is confirmed by the top chart in Graph II12
Graph II11 shows that non-cyclical unemployment in the euro area posted a steady increase up to the mid-90s followed by an improvement that was then halted by the recent crisis The recent rise in the NAWRU suggests that the increases in unemployment seen in the aftermath of the crisis are to some extent likely to last beyond the cyclical upturn
Graph II11 also shows NAWRU developments for Spain and Germany illustrating the diversity within the euro area Spain has witnessed developments that have been similar to though more dramatic than those in the euro area as a whole Germany posted a starkly different profile with its NAWRU falling steadily (from 2002 according to the NKP or 2004 according to the TKP)
As regards sensitivity the NAWRU estimates for Spain vary considerably depending on the specification With the NKP the recent increase is more moderate with the NAWRU reaching 220 by 2015 while the estimated level with the TKP is 264 Recent results for Germany are less sensitive to assumptions regarding expectations (21) NAWRUs referred to in this section are those computed for the
Commissionrsquos 2014 winter forecast Latest available NAWRUs can be downloaded from the AMECO database httpeceuropaeueconomy_financeameco
II Special topics on the euro area economy
Volume 13 No 1 | 23
with the two Phillips curve specifications producing similar NAWRUs However around
Graph II11 Alternative NAWRU estimates euro area Germany and Spain (1)
(1965-2015 in )
(1)GDP weighted average of euro-area countries for which alternative NAWRUs have been computed (ie AT BE DE EL ES FI FR IE IT NL and PT) For AT both NAWRUs are based on the backward-looking model as the forward-looking model yields econometrically unsatisfactory results (2)Component of the NAWRU explained only by structural determinants (see Orlandi (2012) op cit) Source DG ECFIN calculations based on Eurostat data
2005 some difference across the two specifications is observed for Germany with the NKP producing a relatively less volatile NAWRU Given that the current NAWRU estimates for Germany based on the TKP and NKP specifications do not diverge greatly and taking into account the stability considerations in moving to a new specification Germany continues to use the TKP specification
NAWRU differences for Spain depending on the curve specification stem from corresponding differences between the labour cost indicators used Graph II12 shows that recently RULC growth posted greater and more persistent moderation in Spain than change in nominal ULC growth For Germany the indicators have followed more similar paths over recent years (as they have in the euro area as a whole) More fundamentally in times of heightened economic volatility andor big labour market adjustments (eg recent crisis Hartz reforms) the TKP model is likely to yield NAWRUs that are more pro-cyclical as it does not take full account of the price rigidities that play an important role in the adjustment process of the labour market These rigidities are better reflected in the NKP model
To sum up except in the case of Spain recent NAWRU estimates for the euro area do not appear to be sensitive to assumptions as regards expectations with alternative Phillips curve specifications yielding similar results Overall results point to a recent increase in the NAWRU across the euro area with the notable exception of Germany A rise in the NAWRU points to persistent deterioration in labour market performance Identifying the causes of the deterioration calls for cautious interpretation however
NAWRU versus Structural Unemployment
Understanding the sharp and protracted rise in unemployment in the wake of the crisis is of paramount importance from a policy perspective What caused the rise Is it a sign of structural deterioration Or is it purely cyclical reflecting the prolonged slowdown These questions are the subject of lively debate with views ranging from lsquoitrsquos all demandrsquo(22) to lsquoitrsquos allmostly structuralrsquo(23)
(22) See eg Krugman P (2010) Debunking the structural unemployment myth New York Times 28 September 2010
24 | Quarterly Report on the Euro Area
(23) See eg Kocherlakota N (2010) Inside the FOMC speech at
Marquette Michigan 17 August 2010
(Continued on the next page)
II Special topics on the euro area economy
Volume 13 No 1 | 25
In particular changes in the NAWRU are sometimes interpreted as a sign of a structural change Careful analysis of developments in the NAWRUs produced by DG ECFIN shows that they can be driven by both structural and non-structural factors(24)
In particular crisis-related shocks (eg unwinding of unsustainable developments) especially boom-bust episodes in the housing market that can trigger a lengthy process of deleveraging in the construction sector have a statistically significant impact on the NAWRU The real interest rate and Total Factor Productivity (TFP) growth which controls more generally for the presence of such shocks also play a part in driving NAWRU develpoments
At a theoretical level adding various rigidities (eg real wage rigidity cyclical price mark-ups or sluggish adjustment of the reservation wage) to the traditional labour market model can be shown to yield a NAWRU that is not solely determined by structural factors
Despite uncertainties the NAWRU remains a useful policy indicator It is a well-defined concept that provides useful information on the nature of unemployment rate developments In particular it identifies risks of persistent labour market deteriorations that may not always be caused by structural phenomena(25)
In this context it appears useful to distinguish between the NAWRU and a narrowly defined notion of structural unemployment affected only by structural factors as shown in Graph II11 by
(24) For further details see Orlandi F (2012) Structural unemployment and its determinants in the EU countries European Economy mdash Economic Paper No 455 DG ECFIN European Commission May 2012
(25) For further details see Cyclical and structural unemployment in the euro area in Labour Market Developments in Europe 2013 European Commission
the lsquostructural unemploymentrsquo series The latter represents the portion of the NAWRU that according to econometric results appears to be explained by structural features of the labour market As can be seen the series has remained broadly stable during the crisis Except for a notable decline due to structural labour market reforms in Germany change in the NAWRU in the euro area is not related to structural change This is also the case in Spain where structural unemployment has remained broadly stable
Recent increases in the euro-area NAWRU should therefore not be interpreted as a sign of big structural change at the current juncture Rather in most countries the increases reflect the effects of shocks that in the presence of various rigidities have a long-lasting impact on unemployment rates
To sum up the decline in the NAWRU at euro-area level and in countries like Spain in the run-up to the crisis appears mostly attributable to non-structural factors such as unsustainable developments in the housing sector The build-up and subsequent unwinding of imbalances has caused large economic shocks (eg need for sectoral reallocation) which have a persistent effect on the performance of the labour market However in some countries structural factors have also played a role in driving NAWRU developments In Germany for example the decline in the NAWRU seems related to some aspects of the Hartz reforms (eg the change in the period of eligibility for unemployment benefit appears to have contributed to a decline of the NAWRU over recent years) This suggests that large-scale reforms as currently being enacted in some countries will tend to translate into a gradual lowering of the NAWRU over coming years For example recent efforts in Ireland to bring down the labour tax wedge appear to be contributing to more favourable NAWRU developments A number of countries (eg France) have failed to
Box (continued)
26 | Quarterly Report on the Euro Area
post similar improvements in their underlying labour market structures
Graph II12 Alternative labour cost signals for the euro area Germany and Spain (1)
(1965-2014)
(1)GDP-weighted average of euro-area countries for which alternative NAWRUs have been computed (ie AT BE DE EL ES FI FR IE IT NL and PT) (2)Private consumption deflated ULC Source DG ECFIN calculations based on Eurostat data
Conclusions
Alternative Phillips curve specifications based on different assumptions regarding expectation formation point to broadly similar NAWRU results for the euro area Estimates point to a recent rise in the NAWRU suggesting that post-crisis unemployment increases are to some extent persistent
In the case of Spain alternative Phillips curve specifications yield somewhat different NAWRU results pointing to the current importance for that country of theoretical considerations regarding expectations The NKP which uses rational expectations and relies on RULC growth to identify the unemployment gap yields a more moderate NAWRU increase over recent years than the TKP (hitherto used by DG ECFIN) which allows only for static or adaptive expectations and relies on the signal provided by the change in nominal ULC growth While this sensitivity in the results underlines the need for caution in interpreting NAWRU estimates it should also be borne in mind that all specifications point to an important increase in the NAWRU for Spain at this juncture
The deterioration in the NAWRU signals difficulties that are likely to last beyond the cyclical upturn In interpreting those developments it is important to recognise that changes in the NAWRU can be caused by both structural and non-structural factors While the improvement in the NAWRU in Germany seems to be caused by structural factors the deterioration in Spain seems to be caused more by crisis-related events that have persistent effects due to the presence of various rigidities that tend to slow down the adjustment process
II Special topics on the euro area economy
Volume 13 No 1 | 27
II2 The relationship between government and export sector wages and implications for competitiveness (26)
In 2012 the general government sector employed on average about 15 of the labour force in the euro area Since most countries in the euro area are now trying to consolidate public finances whilst also trying to boost competitiveness for external rebalancing and to reduce unemployment it is crucial to assess whether there is any wage spillover from the public to the export sector in particular under conditions of fiscal stress This section shows that there has been a link between government and manufacturing wages over the long-run which is much closer when the government employs a large share of the labour force Government size dimension is especially important during fiscal consolidation If the government wage bill is inflated due to unjustified wage premia for example limiting government wage growth is a fiscal strategy that may among other effects deliver competitiveness gains that contribute to external rebalancing and help boost employment in the tradable sector
-----------------------
Introduction
General government employment accounts for a considerable share of the labour force in the euro area It stood at about 15 in 2012 with but some cross-country variation The evolution of government wages is likely to have an impact not only on fiscal variables and on the sustainability of public finances but also on the labour market on cost competitiveness and on external rebalancing within the euro area This section looks at the relationship between public and private sector wages at a time when most euro area countries are trying to consolidate their public finances improve competitiveness to support external rebalancing whilst also having to tackle high unemployment levels (27)
Changes in general government compensations may spill over into the private sector through both
(26) Section prepared by Benedicta Marzinotto and Alessandro Turrini
(27) Throughout the section the public sector is referred to alongside general government which refers to public offices at all levels of government non-market public owned hospitals schools and social security organizations Thus the term public is used as a synonym for general government
market-based and institutional channels For example excessive government wages may crowd out private sector employment inflating cost conditions and leading to competitiveness losses (28) There are channels of transmission also in the opposite direction from the private to the government sector Wage growth linked to productivity improvements in the private sector can spill over into the public if there is labour mobility across sectors This can affect governments capacity to keep wage expenditure growth under control
Against this background this section analyses the relationship between general government and manufacturing wages in order to assess the potential for and conditions of a wage spillover from the insulated government sector to the export sector The relationship is analysed by looking at a sample of EU countries over the period 1980-2013 in a co-integration framework that makes it possible to distinguish between long-run and short-run effects The relationship between the two wages is also assessed for different fiscal scenarios differentiating between normal periods and periods of fiscal adjustment
The various forms the relationship takes
The relationship between public and private wages takes many forms It may be influenced by market forces andor by institutional features of the wage setting system in each country Changes in private wages can affect government wage growth in the following ways
bull Wage bargaining in the private sector has ademonstration effect on public wage-settersPerez and Sanchez (2011) find evidence ofsignalling by the private sector in thenegotiation phase in France and Germanybefore the EMU period (29) Signalling may bemotivated by envy effects that reflect thestrength of the wage-bargaining position (30) or
(28) See for example Alesina A and R Perotti (1997) The welfare state and competitiveness American Economic Review Vol 87 pp 921-939 Alesina A Ardagna S Perotti R and Schiantarelli F (2002) Fiscal policy profits and investment American Economic Review Vol 92(3) pp 571-589 Ardagna S (2004) Fiscal stabilizations when do they work and why European Economic Review Vol 48 pp 1047-1074
(29) Perez JJ and AJ Sanchez (2011) Is there a signalling role for public wages Evidence of the euro area based on macro data Empirical Economics Vol 41(2) pp 421-445
(30) Maffezzoli M (2001) Non-Walrasian labor markets and real business cycles Review of Economic Dynamics Vol 4(4) pp 860-
28 | Quarterly Report on the Euro Area
by the fact that the same trade union negotiates wages for both sectors
bull Wage-bargaining practices may explicitly or implicitly grant wage leadership to the private sector Under the Scandinavian wage-setting model the private export sector typically takes the lead dictating bargaining outcomes to other sectors including the public sector (31)
bull There may also be established practices and institutional mechanisms that make public wages responsive to private wage settlements usually those of the export sector This is the case if for example there is a formal rule under which the growth rate of private wages is automatically applied to public sector wages (32)
It is of course a two-way street Changes in government wages affect private wage growth in a number of ways
bull Wage adjustment in the public sector causes cross-sector labour shifts and a change in the private sectors labour supply As the supply of labour changes so does the competitive private sectors equilibrium wage
bull Adjustments to government wages affect the outside option of unionised private sector bargainers putting pressures on the bargaining process (33) with for example private sector workers tempted to move to the general government sector due to large public wage increases
892 Ardagna S (2007) Fiscal policy in unionized labor markets Journal of Economic Dynamics and Control Vol 31(5) pp 1498-1534
(31) For a review see Lindquist J and R Vilhemsson (2006) Is the Swedish central government a wage leader Applied Economics Vol 38 pp 1617-1625 Friberg K (2007) Intersectoral wage linkages the case of Sweden Empirical Economics Vol 32 pp 161-184 Traxler F and B Brandl (2012) Collective bargaining inter-sectoral heterogeneity and competitiveness a cross-national comparison of macroeconomic performance British Journal of Industrial Relations Vol 50(1) pp 73-98 Ramskloger P (2012) Is there a European wage leader Wage spillovers in the European Monetary Union Cambridge Journal of Economics Vol 36(4) pp 941-962 and (2013) The nationalndashtransnational wage-setting nexus in Europe What have we learned from the early years of monetary integration Journal of Common Market Studies Vol 51(5) pp 916-930
(32) For evidence on the Netherlands see Hartog J and H Oosterbeek (1993) Public and private sector wages in the Netherlands European Economic Review Vol 37(1) pp 97-114
(33) Afonso A and P Gomes (2008) Interactions between private and public sector wages ECB Working Paper No 971
bull Changes in public wages may be fully compensated in government budgets by changes in labour taxation that alter labour costs in the private sector (34) and might also affect union behaviour (35)
Co-movements between government and private wages may also take place in the absence of direct links when driven by factors common to both sectors For example public wages may be pro-cyclical and change in a manner similar to private wages over the cycle (36) Co-movements in aggregate wage series could be linked to developments common to both factors relating to the composition of the labour force
Testing the relationship between government and manufacturing wages
To analyse more systematically the long- and short-term effects of government wages on the export sector a cointegration approach is used linking manufacturing compensations to a number of determinants including compensation in the government sector The long-term relationship is analysed in terms of levels while the Error Correction Mechanism (ECM) equation makes it possible to estimate the short-term relation between export sector wage growth shocks in explanatory variables and their deviation from the long-term relationship The long-term relationship in also analysed in terms of levels using a dynamic ordinary least squares (DOLS) model and the results incorporated in an ECM model
Estimates were made on a sample of 17 EU countries for which data are available over the period 1980-2013 This has not only has the advantage of gaining degrees of freedom and reinforcing the results It also makes it possible to
(34) Holmlund B (1993) Wage setting in private and public sectors
in a model with endogenous government behaviour European Journal of Political Economy Vol 9(2) pp 149-162
(35) The spillover from the public to the private sector is likely to be mediated by the structure of wage-setting systems Alesina and Perotti (1997) find that increases in labour taxation do not necessarily lead to higher wage demands by unions in highly centralised bargaining systems as large wage setters would internalise the consequences from higher labour costs on employment
(36) For instance Lane (2003) and Lamo et al (2007) find that public wages are pro-cyclical because of discretionary fiscal expansion in good times Lane P (2003) The cyclical behaviour of fiscal policy evidence from the OECD in Journal of Public Economics Vol 87 pp 2661-2675 Lamo A Perez JJ Schuknecht L (2007) The cyclicality of consumption wages and employment of the public sector in the euro area ECB Working Paper No 757
II Special topics on the euro area economy
Volume 13 No 1 | 29
investigate the role of framework conditions in bringing the impact of general government to bear on manufacturing wages by means of appropriate sample splits Box II21 shows the estimation methodology and the results
Much of the variance in manufacturing wages is explained by variables usually used when estimating wage equations (ie the price level labour productivity and the unemployment rate) and by general government wage levels Both the long- and short-term elasticity of manufacturing wages with respect to government wages is estimated to be around 03-04 This tallies with the results of similar studies (eg Afonso and Gomes 2008) It works both ways general government wages also react to manufacturing wages They have a long-term elasticity of 08 and a short-term elasticity of 04 (37) This is consistent with the fact that it is more usual for the private sector than for the government to take the lead in terms of wages as the available literature also shows (38) The DOLS cointegration estimation delivers qualitatively identical results The results are still valid when the sample is restricted to just the euro area (39) The relationship tested on real wages is symmetrical because manufacturing wages respond to government wages whether they are increased or reduced
One hypothesis tested here is whether the size of the government sector determines the extent to which changes to government wages affect average conditions on the private market if for example there is cross-sector mobility In order to test how this market-based channel works the same EU sample is split into two groups of countries those in which the average share of government to total employment is above the whole EU samplersquos median and countries in which it is below the median Results show that in the long-run the impact of public on manufacturing wages is considerably higher in the case of large public sectors This divide disappears in the short-run In the opposite direction going from manufacturing to public wages the split does not produce differentiated results This confirms that government size matters when it comes to the public sectors long-term impact on the labour
(37) The results are not shown (38) Perez JJ and AJ Sanchez (2011) (39) Still it should be noted that the sample used excludes some key
countries in the euro area
market The DOLS methodology confirms these results (40)
Another hypothesis that is tested is whether the way wages are set in the public sector increases the chances of manufacturing wages reacting to government wages Broadly speaking two wage-setting systems may be identified
bull This first is that wages are mainly set on thebasis of collective bargaining
bull The second is that wages are set on the basis ofunilateral decision by the government (41)
The results show that the way wages are set does not fundamentally alter the relation between government and manufacturing wages in the long- or the short-term It is however interesting to note that across all methodologies used the relationship between manufacturing wages and labour productivity is weaker in countries characterised by a unilateral decision wage-setting system This is probably because in such a case the spillover from public to private wages is such that private wages tend to be misaligned with sectoral productivity This is not the case when government wages are set through a collective bargaining wage-setting system possibly because bargaining processes even in a particular type of insulated sector such as the public one reflect market forces more than a unilateral government decision
The relationship between government and manufacturing wages under fiscal stress
Most countries in the euro area have recently been trying to cut government wage bills by freezing wages cutting or retrenching specific indemnities or benefits (including bonuses andor holidays) or blocking turnover As a result the share of government compensations in total government spending has fallen Between 2008 and 2012 this fall was particularly sharp for Latvia Portugal and Romania followed by Hungary Spain Denmark and Estonia (Graph II21)
(40) The results from the DOLS are not shown (41) For a classification of EU wage-setting systems in the government
sector see European Commission Directorate for Economic and Financial Affairs (2014) Government wages and labour market outcomes Occasional Paper forthcoming
30 | Quarterly Report on the Euro Area
(Continued on the next page)
II Special topics on the euro area economy
Volume 13 No 1 | 31
Box (continued)
(Continued on the next page)
32 | Quarterly Report on the Euro Area
Box (continued)
II Special topics on the euro area economy
Volume 13 No 1 | 33
The recent crisis marked a watershed in the evolution of public compensations Between 1999 and 2007 relative government wage growth did not vary from cold-shower periods (or periods of more gradual fiscal consolidation) to periods of non-consolidation (42)
Graph II21 Change in the share of general government compensations to
total spending (2008-2012 in pp)
Source DG ECFIN calculations based on AMECO
Conversely starting with the 2008-2009 crisis compensations per employee in the government sector grew more slowly compared with those in the manufacturing sector and more clearly so during fiscal consolidation (Graph II22)
It is possible that under conditions of fiscal stress the relationship between government and export sector wages differs from that of normal periods This aspect has been neglected in previous analyses To shed some light on it Table II21 shows the correlation between government wage growth and manufacturing wage growth under alternative fiscal conditions (consolidation and non-consolidation) differentiating between countries with large and small public sectors The evidence shows that the two wages are closely related in periods of fiscal stress only if the government employs a large share of the labour forces This suggests that the possibility of
(42) By convention episodes of fiscal consolidation are defined as those during which the structural primary balance improves by at least 15 per cent of GDP in one year or at least 3 per cent in three years with a minimum improvement of 05 per cent in each year Such a definition makes it possible to distinguish between cases of cold-shower consolidation episodes and more gradual consolidation episodes
expenditure-based fiscal consolidation having the type of supply-side effects described in Alesina and Perotti (1997) Alesina et al (2002) and Ardagna (2004) may be a consequence of the size of the public sector among other things
Graph II22 Government and manufacturing compensations under
alternative fiscal conditions EU countries (1999-2007 and 2008-2012 avg annual change)
Source DG ECFIN calculations based on OECD
Table II21 Correlation between government and manufacturing
compensations growth under alternative fiscal conditions EU (1)
(1) Pearson correlation coefficients Sample EU countries (excluding AT BG CY DE EL LT LV MT RO SI) over 1980-2012 (1995-2012 in the case of CZ EE HU SK) Source DG ECFIN calculations based on OECD
Concluding remarks
Spillovers which are the result of high wages in the general government sector have been mentioned as one of the drivers of competitiveness losses in
34 | Quarterly Report on the Euro Area
some countries in the euro area before the crisis (43)
The results presented here speak to this debate and may be summarised as follows Government wage levels have a long-term impact on wages in the manufacturing sector even more so in countries in which the government sector employs a relatively large share of the labour force That said their short-term impact remains unaffected by the size of the public sector Looking at it the other way round manufacturing wages usually have a greater impact on government wages regardless of size This is arguably because private sector wage leadership is more common than public sector wage leadership
(43) Blanchard O (2007) Adjustment within the euro The difficult
case of Portugal in Portuguese Economic Journal 61 1-21
The way government wages are set also plays a role In collective bargaining systems not only are government and manufacturing wages related in both the long- and the short-term (as they are also when the government sets wages by unilateral decision) Also most importantly wages in the tradable sector are better aligned with labour productivity The evidence provided here indicates that if the government wage bill is inflated for example due to unjustified wage premia limiting public wage growth would spill over into the private export sector reducing labour costs and helping boost competitiveness and employment in the sector Whilst structural reforms including skill upgrading in manufacturing are an important and necessary ingredient for achieving non-reversible gains in competitiveness the adjustment of competitiveness through fiscal policy remains a complementary tool to deliver sustained external rebalancing
II Special topics on the euro area economy
Volume 13 No 1 | 35
II3 Latvia maintaining sustainable growth after the boom-bust years (44)
Latvia had been keen to join the euro area at the earliest opportunity with entry in January 2008 the clear target As the economy overheated however significant macro-economic imbalances accumulated which deferred these plans Between 2005 and 2007 unsustainable GDP growth went hand in hand with a mounting current account deficit and a housing market spiralling out of control When credit flows then abruptly reversed the countryrsquos GDP contracted dramatically Latvia was placed in the EUIMF-led financial assistance programme and was forced to carry out ambitious fiscal consolidation and structural reforms Reallocating resources to the tradable sector was the first important step on the road to an export-driven recovery Under the burden of deleveraging and consolidation the revival of domestic demand was slow at first From 2011 however supported by favourable labour market developments growth in demand has accelerated Latvia has reclaimed its position as the fastest-growing EU economy however the current level of growth is lower than the unstainable rates recorded in the boom years and it is now seen as sustainable Thanks to this balanced growth Latvia has not been subject to the MIP since its launch in 2012 Despite the financial assistance-supported measures to preserve equity the social burden of economic adjustment as evidenced by poverty social exclusion and emigration rates has been high but measures are being taken by the authorities to counter these effects Continued commitment to prudent fiscal policies will be critical for the countryrsquos economic future The use of macro-prudential tools to reduce the risks posed by large non-resident financial flows and the implementation of ambitious structural reforms will also play an important role
-----------------------
Introduction
To welcome Latvias recent adoption of the euro this section reviews the countrys recent boom-bust experience and discusses the challenges ahead
Five years ago it would have been difficult to imagine that Latvia would be able to fulfil the conditions for adopting the euro and enter the euro
(44) Section prepared by Gatis Eglitis and Christian Weise
area in January 2014 After EU accession in May 2004 significant macro-economic imbalances had started to accumulate on the back of an overheating economy and by autumn 2008 the country was on the brink of bankruptcy A painful and seemingly impossible economic adjustment to be achieved by means of internal devaluation lay ahead This would require unprecedented fiscal consolidation huge redundancies and difficult structural reforms threatening political and social stability Yet despite pronounced scepticism from the outset and particularly at the height of the crisis in mid-2009 the economy has moved back to growth The measures implemented took some time to take effect with the economy continuing to decline at first before picking up as seen in the lsquoVrsquo-shaped recovery but a protracted recession was avoided Latviarsquos GDP growth has exceeded expectations reaching levels of 54 in 2011 52 in 2012 and around 4 in 2013 The two factors that were critical to the countryrsquos economic recovery were a return to international competitiveness and the rapid correction of external imbalances The budget deficit decreased significantly and is expected to reach a balanced position in the near future The level of government debt is projected to stay around 40-42 of GDP in 2013-2014 and to decline to 33 of GDP in 2015 as the repayments to the EU take effect and sizable cash buffers will be reduced The financial assistance programme was successfully completed in January 2012 Financial support had not been necessary since October 2010 however and the government had re-entered international bond markets in June 2011 well ahead of schedule (45) As of 2013 GDP per capita in constant prices has returned to the level reached at its peak in 2007 Due to the decline in the population however the absolute value of GDP in constant prices was still about 9 below 2007 levels with current projections suggesting that a full recovery to the pre-crisis peak will be achieved in 2015
Overheating imbalances and a big bust
Latvia joined the EU in seemingly good macroeconomic health and having pegged its currency to the Special Drawing Right (SDR) in
(45) Occasional Paper 120 issued by the European Commission Directorate-General for Economic and Financial Affairs EU Balance of Payments assistance for Latvia foundations of success httpseceuropaeueconomy_financepublicationsoccasional_paper2012op120_enhtm
36 | Quarterly Report on the Euro Area
1994 and then to the euro in 2005 was keen to join the euro area in January 2008 Upon entering the Exchange Rate Mechanism II (ERM II) on 2 May 2005 the authorities unilaterally committed to maintaining a smaller fluctuation margin of plusmn1 around the central rate ndash seen as a sign of the countryrsquos determination to join the euro area The Latvian economy was the fastest growing in the EU between 2000 and 2007 and between 2005 and 2007 real GDP growth reached a yearly average of over 10 Following accession to the EU in 2004 Latvia along with other EU countries witnessed a rapid credit expansion Loans to residents grew at an average annual rate of close to 50 between 2004 and 2008 a reflection of the excess liquidity at that time and of the resulting hot money inflows into central and eastern European economies which were rapidly converging with their western European counterparts Foreign investment exploded driven by commercial banksrsquo mispricing of risk and over-optimistic expectations of convergence A number of privatisation deals and most importantly a burgeoning real-estate market characterised by soaring prices also served to attract foreign investors The tradable sector was meanwhile largely neglected By way of illustration foreign direct investment (FDI) reached relatively high levels of 84 and 81 of GDP in 2006 and 2007 respectively but most of this was directed towards the real-estate market while the proportion of total FDI relating to manufacturing was only 12 in 2013 Significant imbalances were accumulating as indicated by a current account deficit that reached around 22 of GDP in 2006 and 2007 and by labour market tightening Nominal wages doubled between 2004 and 2007 increasing much faster than productivity and thus damaging international competitiveness
By early 2008 more cautious bank lending had caused economic growth to slow significantly By autumn of the same year this slowdown had developed into a strong contraction reflecting the wider global economic situation The global economy fell into recession commodity prices reached record highs and the general risk aversion seen in global markets following the collapse of Lehman Brothers cut off Latviarsquos access to financial markets The second largest domestic bank Parex had to be rescued Latvia ultimately experienced the most severe GDP contraction of all EU countries at close to 18 in 2009 The government deficit threatened to spiral out of control Having been at 03 of GDP in 2007 and 42 in 2008 in spring 2009 it was projected to
reach levels well above 15 of GDP by the end of year in the absence of a significant consolidation package
Faced with an economic crisis of this order Latvia agreed a medium-term financial assistance programme the balance of payments programme (BoP) with the EU and the IMF in December 2008 (46) The aim of this was to preserve the existing exchange-rate arrangement The assistance offered to Latvia was made subject to a number of policy conditions relating to fiscal consolidation financial sector stabilisation and the introduction of a wide range of structural reforms including a significant acceleration in the absorption of EU structural funds The Latvian government also undertook to strengthen the social safety net so as to protect the most vulnerable from the effects of the crisis
Brave measures in difficult times
Given that the exchange rate was at that time pegged to the euro some economists suggested devaluation as the only way out of the crisis The national authorities and international partners did not see that as a viable option however because its effectiveness would have been severely limited by the degree to which imports were used in the manufacture of exports and the high proportion of foreign liabilities Furthermore it would have brought with it the risk of mass bankruptcy and a partial collapse of the domestic banking system at a time when the judicial system was clearly not capable of coping with such a fall-out In addition devaluation would have provided no incentive to solve Latviarsquos structural problems including weak fiscal governance the unsustainability of pension expenditure loss-making state-owned banks a lack of competitiveness and weak institutions
Between 2009 and 2011 the Latvian government carried out an ambitious programme of fiscal adjustment designed to correct the previously loose fiscal policy the weaknesses of which had been hidden by the countryrsquos strong economic growth This difficult adjustment restored Latviarsquos public finances to better health and established a
(46) Funds available from EU countries IMF World Bank EBRD
and Norway amounted to euro 75 billion of which Latvia used euro 45 billion (60) with euro 29 billion lent by the European Commission on behalf of the EU The first tranche of EUR 1 billion (13 of the total) was repaid by Latvia on 25 March 2014
II Special topics on the euro area economy
Volume 13 No 1 | 37
framework which would be sustainable in the long term The nominal balance improved with the deficit being cut from 98 of GDP in 2009 to 13 of GDP in 2012 and 2013 (see graph II31) The structural deficit also fell from its peak of 55 of GDP in 2008 to around 025 of GDP in 2012 and 2013 beating Latviarsquos medium-term objective of -05 of GDP as set in the convergence programmes
Latviarsquos fiscal consolidation measures were undoubtedly bold with fiscal savings equivalent to around 17 of GDP implemented within three years The measures were frontloaded and half of these savings were implemented in the first year alone The measures were on the whole expenditure-oriented with over half of the savings coming from cuts to health education and public administration budgets The most notable measure relating to revenue was an increase in VAT from 18 to 22 The consolidation strategy was eventually successful in containing the adverse effects of the budget deficit on the economy In fact it even appears to have triggered lsquonon-Keynesianrsquo effects on demand by restoring confidence and stimulating demand and investment at the point when it was most needed (47)
Graph II31 Latviarsquos government budget balance and debt (2008-15 of GDP)
Source DG ECFIN Commissionrsquos spring 2013 forecast
The fiscal framework was also strengthened significantly by the law on fiscal discipline coming into force in March 2013 and the creation of a fiscal council in January 2014 The signing of the
(47) Ibid see Chapter 4 Fiscal consolidation in the midst of the crisis
Treaty on Stability Coordination and Governance in the EMU (48) in March 2012 provided further EU-level support for the national fiscal framework
An additional factor that was critical to the success of the consolidation strategy but is often overlooked was the availability of significant EU funds (particularly from around 2009 onwards) which acted as a much-needed demand trigger in sectors affected by the decline in economic activity Between 2007 and 2013 Latvia benefited from the third highest allocation of EU funds after Hungary and Lithuania receiving a yearly average equivalent to around 28 of GDP or 70 of gross fixed capital formation(49) As on average every euro of national budget spending was supplemented by five to six euros co-financing from EU funds national expenditure on items such as road and public building construction vocational education and training of unemployed science infrastructure development and healthcare was often replaced by Structural funds financing despite being in conflict with the EU funds additionality principle Clearly such large inflows of EU financing also generated substantial tax revenues in particular VAT at a time when private consumption was weak
The Latvian labour market demonstrated a high level of flexibility during the crisis thanks in part to a decentralised wage-setting system Significant public-sector wage cuts indirectly supported nominal wage reduction in the private sector in 2009 and 2010 when earnings per employee fell by a total of 19 over two years Employment levels fell sharply especially in the private sector as jobs were cut in construction and manufacturing The unemployment rate reached around 20 in early 2010 but had fallen back to 119 by 2013 due mainly to growth in employment with the participation rate also increasing significantly over this period The projection from the Commissionrsquos 2014 winter forecast shows wages in 2014-15 growing broadly in line with productivity although the labour market is tightening and structural problems in particular regional differences and skill mismatches could create pressures in the economy
(48) httpeuropean-councileuropaeumedia639235st00tscg26_en12pdf
(49) Source Directorate-General for Regional Policy Infoview
38 | Quarterly Report on the Euro Area
External cost competitiveness has improved noticeably since 2008 with labour costs falling significantly and labour productivity in particular in the tradable sector increasing In 2008 the real effective exchange rate (REER) adjusted for unit labour costs reached a peak of 64 above the 2000 level before falling by about 20 in 2009-10 since when it has remained broadly stable (see graph II32) This level of REER is considered sustainable as the country has been seen to be steadily gaining market share over recent years (including as measured by exports adjusted for the growth of markets) The percentage of the countryrsquos GDP attributable to exports rose to 60 in 2013 from 43 in 2007 with some 60 of exports destined for the EU and 12 for Russia
Graph II32 Effective exchange rates Latvia v 35 trading partners
(Jan 2007-Dec 2013 monthly avg 2007 = 100)
Source DG ECFIN
The social burden of economic adjustment has admittedly been high in Latvia despite the policy measures contained in the Memorandum of Understanding stipulating inter alia establishment of a comprehensive social safety net supporting local governments in providing social assistance and discounting social payments from overall budget targets High unemployment has led to a wave of emigration to richer EU countries which coupled with Latviarsquos low fertility and high death rates has seen the population decrease by 8-10 since 2008 Net emigration has now fallen substantially however since the peak of the crisis years The rates of poverty and social exclusion in Latvia are among the highest in the EU families with children unemployed people people with disabilities and people living in rural areas are particularly at risk The countryrsquos spending on
social protection and healthcare as a percentage of GDP is among the lowest in the EU Furthermore the social protection measures which do exist to reduce poverty tend to be ineffective highlighting the importance of a robust social safety net It appears however that with the improved economic situation and increasing levels of general social awareness the authorities are finally starting to address the challenges of poverty and social exclusion with greater determination In recent years for example taxation of low-income earners has been cut slightly and child poverty has been reduced thanks to increases in various child-related benefits Proposals for reforms to social assistance in line with 2013 World Banks study are being gradually implemented Better targeted more effective policies relating to the active labour market mostly financed by the European Social Fund are helping unemployed people in particular the long-term unemployed and young people to find work or to obtain relevant training
As part of the BoP programme and in the context of the assessment of Latviarsquos readiness to join the euro area financial supervision has been tightened and EU resources for supervision and monitoring increased in particular for monitoring the growing non-resident banking sector Additional liquidity and capital adequacy requirements for non-resident banks were introduced in 2013 regular on- and off-site checks of these banks are being performed the deposit guarantee fund has been further strengthened and monitoring has been stepped up in relation to pledged assets and the origin of funds in bank recapitalizations This strengthened regulatory policy has been introduced partly as a result of lessons learnt at significant cost in the past five years most notably with the Parex and Krajbanka failures
Latvia has implemented a series of ambitious reforms to the business environment in recent years with the aim of reducing start-up costs simplifying procedures for property registration construction permits and tax collection and introducing out-of-court settlement of insolvencies In doing so Latvia has brought its regulatory framework a significant step closer to what is regarded as best practice In the World Bankrsquos 2014 Doing Business report Latvia was ranked 25th out of 185 countries with only four euro-area members faring better
II Special topics on the euro area economy
Volume 13 No 1 | 39
Conclusion
The origins of Latviarsquos years of boom and bust can be traced back to the domestic regional and global circumstances at that time globally excess liquidity and hot money flowing into vulnerable countries regionally unrealistic expectations of income convergence in central and eastern Europe and domestically undue optimism about growth in personal incomes and mispricing of risk by commercial banks amplified by the behaviour of both policymakers and individuals
A broad range of country-specific and general economic factors have contributed to the successful economic adjustment seen in Latvia since the height of the crisis Ambitious front-loaded and largely expenditure-based fiscal consolidation helped to contain the budget deficit whilst the confidence generated by the introduction of a credible programme itself aided the economic recovery The flexibility of the labour market meanwhile helped companies to restore competitiveness by means of wage reductions and job cuts Competitiveness was also improved by steps taken to shift the tax burden from labour to consumption and property The recovery in Latvia was very much export-driven with the growth in exports made possible by the openness of the economy and the faster-than-expected economic growth experienced by major trading partners A number of structural reforms including bank restructuring and measures improving the use of EU funds have contributed to the development of a more favourable business environment A generous allocation from the European structural funds meanwhile helped to boost public investment and supported financing and reforms in many important sectors Above all the success of the recovery measures implemented in Latvia proved that for a tough internal economic adjustment to be effective there needs to be both a determined political will to carry out unpopular reforms and also a fully-developed comprehensive social safety net to protect more vulnerable groups
in society during difficult times In addition Latvia benefited from the fact that those looking for work were able to migrate to other EU countries which helped to alleviate the social tension created by the effects of the crisis Some of the lessons above are clearly applicable to other Member States undergoing challenging economic adjustment while others are more Latvia-specific
While Latviarsquos current level of economic growth is regarded as sustainable (50) and the adoption of the euro is recognised as a significant and hard-earned achievement it is not the end of the road The current robust economic situation should be used to advance reforms and improve Latvias long-term growth potential rather than lead to complacency and relaxation of reform efforts Sustainable convergence of the economy in the longer term will require inter alia ongoing commitment to prudent fiscal policies (there are some recent signs of less prudent fiscal decision-making) a continuous use of macro-prudential tools to reduce risks from growing non-resident financial flows especially in view of recent Ukraine events and the implementation of reforms in a number of vested-interest-heavy areas These include higher education and science state owned enterprise management electricity and gas market liberalization and the judiciary including insolvency framework But above all and in order to ensure economic and social sustainability for years to come high rates of poverty social exclusion and dismal demographic trends need to be addressed boldly These and other structural challenges are being addressed by the Commission under the European Semester and the Post Program Surveillance frameworks Also Latvia has joined a euro area that is very different from what it was just a few years ago the euro area economic governance framework has been greatly strengthened entailing stricter obligations
(50) The Commissionrsquos alert mechanism reports issued under the Macroeconomic Imbalance Procedure have not identified economic imbalances in Latvia requiring further in-depth investigation for possible policy action
httpeceuropaeueurope2020pdf2014amr2014_enpdf
40 | Quarterly Report on the Euro Area
II4 Corporate balance sheet adjustment in the euro area and the United States (51)
This section compares balance sheet adjustment in the non-financial corporate sector in the euro area and the United States It shows that the adjustment since the crisis has been faster in the latter Despite similar steep rises in corporate debt in pre-crisis years US corporations have cut debt more than those in the euro area Shifts from loans to bonds and extensions of debt maturity have also been more pronounced in the United States Much of the difference in balance sheet consolidation can be traced back to more positive profitability trends providing US firms with the internal funds necessary to adjust balance sheets Differences in dividend distribution strategies and in corporations physical investment behaviours also played a role Profitability differences reflect differences both in cyclical conditions and labour market adjustment Comparatively slow progress in balance sheet consolidation is likely to weigh on investment recovery in the euro area
-----------------------
Introduction
Both the euro area and the United States experienced a surge in corporate indebtedness in the years preceding the global financial crisis and in its early stages The ratio of debt to gross value added by non-financial corporations (NFCs) rose by about 40 pp between 2005 and 2009 Deteriorating growth prospects and changing attitudes to risk have prompted NFCs in both economies to adjust their balance sheets As previously argued in the Quarterly Report balance sheet adjustment can have a substantial effect on economic activity and it is important to monitor regularly the ongoing adjustment in the euro area (52) This section contributes to the monitoring by comparing progress in corporate deleveraging in the euro area and in the United States two regions where firms entered the crisis with excessive debt
(51) Section prepared by Plamen Nikolov (52) See European Commission (2010) Focus Balance sheet
adjustment in the corporate sector Quarterly Report on the Euro Area Vol9 (3) pp 9-19 A more detailed overview of the literature on the impact of balance sheet adjustment can be found in Cuerpo C I Drumond J Lendvai P Pontuch and R Raciborski (2013) Indebtedness deleveraging dynamics and macroeconomic adjustment European Economy Economic Papers 477
Firms consolidate their balance sheets primarily by raising their net lendingborrowing (NLB) ie the cash obtained from their production activity and available for financial operations (53) A rise in NLB is achieved either by increasing savings or cuttingpostponing physical investment Firms increase savings by raising profits and reducing the dividends distributed to shareholders In firmsrsquo financial accounts a rise in corporate NLB is associated with a rise in financial assets andor a cut in financial liabilities The section reviews recent developments in euro area and US profitability savings and NLB and looks at the instruments that the corporate sector has used to consolidate its balance sheet on both the asset and the liability side
Corporate profits have disappointed in the euro area hellip
National account data show that corporate profitability in the euro area reached a pre-crisis peak in 2007Q3 ie later than in the United States where it had already started to decline in 2007 (54)
Graph II41 NFC profitability euro area and US
(2000Q1-2013Q3 of GVA)
20
25
30
35
40
45
00Q1 01Q3 03Q1 04Q3 06Q1 07Q3 09Q1 10Q3 12Q1 13Q3
Euro area (1)
US
(1)Excluding Latvia Source Eurostat US Bureau of Economic Analysis DG ECFIN calculations
(53) Firms can also consolidate their balance sheets by raising equity (54) Profitability like the other national account variables for the
corporate sector presented in this section is measured as a proportion of corporate sector activity represented by gross value added (GVA) It is calculated as the gross operating surplus plus financial revenues and subsidies and minus financial and tax expenses Financial expenses do not include earnings distributed to shareholders
II Special topics on the euro area economy
Volume 13 No 1 | 41
The 2008-09 recession brought a sharp drop in corporate profitability in the euro area Profitability recovered briefly in 2010 to reach a new peak in 2011 but has declined again since then (Graph II41) In the United States the impact of the crisis was rather muted with profits recovering vigorously after 2008 As a ratio to gross value added (GVA) US corporate profits had already passed their pre-crisis level in 2009 before flattening out in the past two years Overall by 2013 profitability in the euro area was still about 2 pp below its pre-crisis peak while in the United States it stood around 3 pp above
hellip mostly due to weak operating surplus
The disappointing profit performance in the euro area relative to the United States is largely due to differing developments in gross operating surplus Looking at the breakdown of the contribution to the cumulative change in corporate profitability since the start of the crisis there is a marked difference between firms in the euro area and those in the United States (Graphs II42 and II43) (55)
Graph II42 Profitability breakdown of NFCs euro area (1)
(cumulative change in from 2007Q3 peak to 2013Q3)
35
36
37
38
39
40
41
42
-100
-80
-60
-40
-20
0
20
40
60
80
100
07Q4 08Q4 09Q4 10Q4 11Q4 12Q4
Taxes (lhs)
Other net current transfers received (lhs)
Net property income received excl dividends paid (lhs)
Operating surplus (lhs)
Profits(rhs)(2)
(1)Excluding Latvia(2)Profits in of GVA Source Eurostat DG ECFIN calculations
In the euro area a fall in the ratio of operating surplus to GVA dragged overall profitability down after 2008 Despite an improvement in 2011 in
(55) The illustration of the contributions to the cumulative change in profitability only serves to depict the relative importance of the various components of the change in profits since the crisis The starting point for the cumulative change should not be interpreted as a reference point for a desirable profit recovery
2013 operating surplus was still contributing negatively to the cumulative change in profitability since the pre-crisis peak In contrast operating surplus in the United States responded to the crisis earlier than in the euro area but its contribution to the change in profits remained positive
Graph II43 Profitability breakdown of NFCs US
(cumulative change in from 2005Q3 peak to 2013Q3)
24
25
26
27
28
29
30
31
-100
-80
-60
-40
-20
0
20
40
60
80
100
05Q4 06Q4 07Q4 08Q4 09Q4 10Q4 11Q4 12Q4
Taxes (lhs)Other net current transfers received (lhs)Net property income received excl dividends paid (lhs)Operating surplus (lhs)Profits(rhs)(2)
(1) Profits in of GVA Source Federal Reserve Board US Bureau of Economic Analysis DG ECFIN calculations
Unlike operating surplus income tax payments and net income from non-operational activities did not differ significantly between the euro area and the United States (56) In both economies lower corporate tax payments resulting from lower profits generated by NFCs naturally had a positive impact on the cumulative change in profits from the pre-crisis peak
Differences in labour market developments are at the root of differences in profitability
Differences in operating surplus and profitability between the United States and the euro area can be attributed partly to differences in the business cycle In 2011Q1 NFCsrsquo gross value added was still 12 below its pre-crisis peak in the euro area but 11 above in the United States The main channel through which cyclical developments can affect operating surplus is the labour market
(56) In fact the ratio of profit tax payments to profits (a crude measure of an aggregate tax rate) in the euro area and the United States has been almost the same since the start of the crisis falling substantially in 2008-09 indicating that tax policy was not more favourable for profits in one economy than in the other
42 | Quarterly Report on the Euro Area
The cyclicality of operating surplus depends on the impact of the cycle on labour productivity as well as on wages The worse performance of operating surplus in the euro area since 2008 as compared with that in the United States reflects a stronger deterioration in labour productivity accompanied by unfavourable developments in wages per employee
Labour productivity growth in the euro area turned sharply negative in 2009 opening a big gap with the positive (albeit modest) wage growth (Graph II44) In the United States on the other hand labour productivity growth became negative earlier but to a lesser extent and some downward wage adjustment took place in 2009
Graph II44 Labour productivity and wages euro area and US
(2001Q4-2013Q3 y-o-y change)
-4
-3
-2
-1
0
1
2
3
4
5
01Q4 03Q2 04Q4 06Q2 07Q4 09Q2 10Q4 12Q2
Average wage per employee euro area (1) (2)Average wage per employee US (1)Labour productivity euro area (2) (3)Labour productivity US (3)
(1)Real wages calculated by the GDP deflator(2)Euro area excluding Latvia(3)In terms of total employment (thousands) Source Eurostat US Bureau of Economic Analysis US Bureau of Labour Statistics DG ECFIN calculations
There are a number of reasons for the different labour adjustments in the euro area and the United States In the former apart from a higher level of employment protection short-term work schemes were put in place in the early stages of the crisis (57) In addition as labour force adjustment tends to be more costly in the euro area some firms (particularly small firms and those with highly qualified employees) preferred to retain their
(57) According to the OECD Public short-term work schemes have
played an important role in preserving jobs during the crisis in a number of countries although significant hours reductions were also achieved via lower overtime hours hours averaging arrangements and employer initiatives see OECD Employment Outlook 2010 ndash Moving Beyond the Job Crisis
labour force (58) Because of a lack of wage flexibility the higher degree of lsquolabour hoardingrsquo in the euro area came at the expense of lower operating surplus and profits and consequently put a downward pressure on the capacity accumulate internal funds to deleverage
Corporate savings are much lower in the euro area
Negative developments in euro area corporate profitability were reflected in corporate savings which together with physical investment determines the internal funds available for balance sheet adjustment In 2009-10 there was a sharp drop in euro area savings because profits acted as shock absorbers and fell more rapidly than dividend payments leaving less spare cash available In contrast savings by US NFCs increased substantially on rising profits after an early-crisis low point and reached a historically high level of around 23 of GVA in 2010Q3 (Graph II45)
Graph II45 Savings of NFCs (2000Q1- 2013Q3 of GVA)
15
16
17
18
19
20
21
22
23
24
00Q1 01Q3 03Q1 04Q3 06Q1 07Q3 09Q1 10Q3 12Q1 13Q3
Euro area (1)
US
(1)Euro area excluding Latvia Source Eurostat Bureau of Economic Analysis DG ECFIN calculations
The impression that US corporate behaviour has been more geared towards accumulating savings than that in the euro area is reinforced when one looks at dividend distribution Dividends paid by euro area NFCs have been on a declining trend since the start of the crisis but those paid by US firms have also decreased This is remarkable given (58) See Box 12 Labour hoarding across different types of firms in
OECD Employment Outlook 2010 ndash Moving Beyond the Job Crisis
II Special topics on the euro area economy
Volume 13 No 1 | 43
the positive profit developments in the United States (Graph II46) A drop in dividends alongside profit growth suggests that after 2008 US companies preferred to direct a bigger proportion of the profit recovery to corporate savings and thereby balance sheet adjustment The ratio of dividends to profits in the United States has fallen from about one third before the crisis to one quarter now This ratio also dropped in the euro area although by less (59)
Graph II46 Dividends paid of NFCs (2000Q1-2013Q3 of GVA)
0
5
10
15
20
25
00Q1 01Q3 03Q1 04Q3 06Q1 07Q3 09Q1 10Q3 12Q1 13Q3
Euro area (1)
US
(1)Euro area excluding Latvia Source Eurostat Federal Reserve Board DG ECFIN calculations
Disappointing physical investment in the euro area and the United States
Cutting investment in physical assets is another way of reducing excessive indebtedness Corporate investment as a proportion of activity dropped sharply both in the euro area and in the United States in the early stages of the crisis (Graph II47)
After a modest recovery in 2010-11 the investment rate decreased again in the euro area The investment recovery was more solid in the United States but has lost momentum since the end of 2012 and the investment rate remains below its pre-crisis peak Overall it seems that euro area corporations partly compensated for less supportive savings developments than in the US by
(59) Dividend payments are not the only way of distributing profits to shareholders Equity buybacks can also be used for this purpose and firms that choose this option will tend to have higher savings and lower dividends paid
curbing physical investment more than their US counterparts
Graph II47 Investment of NFCs (2000Q1- 2013Q3 of GVA)
15
16
17
18
19
20
21
22
23
24
00Q1 01Q3 03Q1 04Q3 06Q1 07Q3 09Q1 10Q3 12Q1 13Q3
Euro area (1)
US
(1)Excluding Latvia Source Eurostat US Bureau of Economic Analysis DG ECFIN calculations
A more modest increase in net lending in the euro area than in the US
Since 2013 firmsrsquo net lending in the euro area has been in positive territory but substantially less so than that in the United States (Graph II48) Positive NLB in the euro area unlike that in the United States is mostly due to a low investment rate alone rather than low investment combined with high savings The combination of disappointing investment and high savings has translated into historically high and sustained NLB for US firms
This persistent net lending position in the United States is atypical as firms usually invest more than they save It suggests that US firms have been adjusting their balance sheets significantly since the beginning of the crisis via their internal funds while euro area firms seem to have opted for much slower balance sheet adjustment
44 | Quarterly Report on the Euro Area
Graph II48 Net lendingborrowing of NFCs
(2000Q1- 2013Q3 of GVA)
-10
-8
-6
-4
-2
0
2
4
6
8
00Q1 01Q3 03Q1 04Q3 06Q1 07Q3 09Q1 10Q3 12Q1 13Q3
Euro area (1)
US
(1)Excluding Latvia Source Eurostat US Bureau of Economic Analysis DG ECFIN calculations
Debt deleveraging has been more pronounced in the US than in the euro area
The faster pace of adjustment of balance sheets in the United States is confirmed by the corporate debt data (Graph II49) (60) (61) While both the euro area and the United States entered the crisis with swiftly rising and historically high levels of debt deleveraging has progressed more rapidly in the latter since the crisis By the beginning of 2012 US corporate debt had fallen by approximately 15 pp as a proportion of activity while euro area debt had dropped by 7 pp (62)
(60) Non-financial corporate debt consists of loans and securities
other than shares (corporate bonds) both can be classified as short- or long-term depending on whether their original maturity is less or more than one year
(61) This section analyses developments in non-consolidated financial flows and stocks in the euro area and in the United States for two reasons it is important to have a sense of financial positions within the institutional sector eg loans between NFCs are an important part of intra-firm relationships as head offices use them to finance subsidiaries for example perhaps for tax reasons This is relatively more important in the euro area than in the United States Consolidated financial asset and flow data eliminate these intra-sector positions and different approaches may be taken to consolidation as in the euro area there is the additional issue of cross-border consolidation between Member States while there is no need for flows and positions between firms in different US states to be treated separately
(62) The debt-to-equity ratio is another measure of corporate leverage widely followed by investors Faster stock market recovery helped US firms reduce this ratio more than those in the euro area
Graph II49 Debt levels of NFCs(1) (1999Q1-2013Q3 of GVA)
100
120
140
160
180
200
220
99Q1 00Q3 02Q1 03Q3 05Q1 06Q3 08Q1 09Q3 11Q1 12Q3
Euro area (2)
US
(1)Securities other than shares and loans(2)Excluding Latvia Source Eurostat US Bureau of Economic Analysis DG ECFIN calculations
Firms in the euro area and the United States entered the crisis with almost the same level of short-term debt as a proportion of total debt Since the crisis the adjustment away from short-term debt has been significantly more pronounced in the United States suggesting more active balance sheet restructuring
Graph II410 Debt flows of NFCs(1) (1999Q1- 2013Q3 of GVA)
-15
-10
-5
0
5
10
15
20
99Q1 01Q1 03Q1 05Q1 07Q1 09Q1 11Q1 13Q1
Euro area bonds (2)
US bonds
Euro area loans (2)
US loans
(1)Securities other than shares and loans (2)Excluding Latvia Source Eurostat US Bureau of Economic Analysis DG ECFIN calculations
Due to differences in the structure of corporate finance loans (as opposed to bonds) tend to form a bigger proportion of debt in the euro area than in the United States An important element of the
II Special topics on the euro area economy
Volume 13 No 1 | 45
corporate balance sheet adjustment process in both economies has been a movement away from an excessive reliance on loans (Graph II410) and towards bond financing This trend has been substantially more pronounced in the United States presumably reflecting the fact that bond markets are more developed in that country
Developments in non-financial corporate debt were also influenced by developments in financial intermediation in particular in the banking sector Financial accounts show NFCsrsquo debt exposure but do not indicate whether the debt holder is a bank According to bank balance sheet statistics the nominal growth of loans vis-agrave-vis NFCs has been mostly negative in the euro area since 2009Q4 (Graph II411) Coupled with the positive loan inflows seen in the national accounts between 2010Q3 and 2012Q3 (Graph II410) this shows a degree of substitution in corporate loan liability ownership between banks and other financial firms and sectors (including other NFCs) in this period According to the counterparty breakdown of NFC domestic loans published by the ECB corporate borrowings from other NFCs represented 29 of all loans by 2013Q3 (up from 26 in 2008Q1) while the proportion of borrowings from monetary financial institutions (MFIs) had dropped (from 60 in 2008Q1) to an all-time low of 53 The proportion of loans from other non-bank financial intermediaries also increased There is less evidence of a shift from banks to other loan providers in the United States where loans between NFCs are much more limited
Graph II411 Bank loans to NFCs (1999Q1- 2013Q3 y-o-y change)
-20
-15
-10
-5
0
5
10
15
20
25
99Q1 00Q3 02Q1 03Q3 05Q1 06Q3 08Q1 09Q3 11Q1 12Q3
Euro area bank loans to NFCs (1)US bank loans to NFCs
(1)Excluding Latvia Source ECB US Federal Reserve Board DG ECFIN calculations
Positive NLB has been used to acquire safe financial assets in both regions
In both the euro area and the United States the positive NLB has been used to deleverage but also to invest in safe financial assets At the beginning of the crisis much of the positive corporate NLB in the United States was invested in money market mutual funds which is essentially investment in short-term low-risk assets (Graph II412) (63)
Currency and deposits (another type of safe asset) have increased substantially in the euro area in recent years as a proportion of total firm activity (Graph II413) This rise was driven almost exclusively by a rapid increase in firmsrsquo savings deposits To some extent a similar trend is observable in the United States In particular US cash balances (a sub-component of currency and deposits) approached 12 of GVA by the end of 2013 a level not seen since the early 1990s On the other hand savings deposits have grown more modestly resulting in a moderately positive overall trend in currency and deposits
Graph II412 Mutual fund shares of NFCs (1999Q1- 2013Q3 of GVA)
0
2
4
6
8
10
12
14
99Q1 01Q1 03Q1 05Q1 07Q1 09Q1 11Q1 13Q1
Euro area (1)
US (2)
(1)Excluding Latvia(2)In the USA these asset series can be broken down into investment in money market mutual funds and investment in other mutual funds The 2009-11 increase is fully attributable to the former Source Eurostat US Bureau of Economic Analysis DG ECFIN calculations
Overall these two aspects of corporate financial investment behaviour signify considerable liquidity concerns on the part of firms in both the euro area
(63) Euro area financial accounts only show firmsrsquo investment in mutual funds overall and do not distinguish between types of mutual funds
46 | Quarterly Report on the Euro Area
and the United States They also represent a drive towards lower-risk assets perhaps indicating increased risk aversion by corporations or a tendency to postpone physical investment in a context of perceived high uncertainty
Graph II413 Currency and deposits ndash NFCs
(1999Q1- 2013Q3 of GVA)
0
5
10
15
20
25
30
35
40
45
99Q1 00Q3 02Q1 03Q3 05Q1 06Q3 08Q1 09Q3 11Q1 12Q3
Euro area (1)
US
(1)Excluding Latvia Source Eurostat US Bureau of Economic Analysis DG ECFIN calculations
Conclusion
Although both regions saw similar steep rises in corporate debt in the pre-crisis years balance sheet adjustment since the crisis has been significantly slower in the euro area than in the United States The more rapid adjustment in the United States can be explained by a stronger cyclical recovery more supportive profitability developments and reduced dividend payment ratios In the euro area profitability has been hindered by a combination of lower flexibility in the labour markets and slow wage adjustment
The slower balance sheet adjustment in the euro area corporate sector is visible in a slower fall in indebtedness but also a slower adjustment of the structure of balance sheets In particular the shift from loans to bonds and the extension of debt maturity have been more pronounced in the United States In both regions firms have used their positive NLB to accelerate the accumulation of safe and liquid financial assets This could reflect continuing uncertainty regarding future demand and growth prospects
Overall the evidence discussed in this section shows that euro area firms are lagging significantly behind their US counterparts in terms of balance sheet consolidation Given that investment rates remain disappointing even in the more advanced US corporate sector a degree of caution appears warranted when assessing short-term prospects for corporate investment in the euro area
III Recent DG ECFIN publications
Volume 13 No 1 | 47
1 Occasional Papers
European Economy Occasional Papers 170 January 2014 Financial Assistance Programme for the Recapitalisation of Financial Institutions in Spain Fifth Review ndash Winter 2014 httpeceuropaeueconomy_financepublicationsoccasional_paper2014pdfocp170_enpdf
European Economy Occasional Papers 169 December 2013 The Economic Adjustment Programme for Cyprus Second Review ndash Autumn 2013 httpeceuropaeueconomy_financepublicationsoccasional_paper2013pdfocp169_enpdf
European Economy Occasional Papers 168 December 2013 Fiscal frameworks in the European Union ommission services country factsheets for the Autumn 2013 Peer Review httpeceuropaeueconomy_financepublicationsoccasional_paper2013pdfocp168_enpdf
European Economy Occasional Papers 167 December 2013 Economic Adjustment Programme for Ireland - Autumn 2013 Review httpeceuropaeueconomy_financepublicationsoccasional_paper2013pdfocp167_enpdf
European Economy Occasional Papers 166 December 2013 Progress towards meeting the economic criteria for EU accession the EU Commissionrsquos 2013 assessments httpeceuropaeueconomy_financepublicationsoccasional_paper2013pdfocp166_enpdf
European Economy Occasional Papers 165 November 2013 Romania Balance-of-Payments Assistance Programme 2013-2015 httpeceuropaeueconomy_financepublicationsoccasional_paper2013pdfocp165_enpdf
European Economy Occasional Papers 164 November 2013 The Economic Adjustment Programme for Portugal Eighth and Ninth Review httpeceuropaeueconomy_financepublicationsoccasional_paper2013pdfocp164_enpdf
European Economy Occasional Papers 163 November 2013 Financial Assistance Programme for the Recapitalisation of Financial Institutions in Spain Fourth Review ndash Autumn 2013 httpeceuropaeueconomy_financepublicationsoccasional_paper2013pdfocp163_enpdf
European Economy Occasional Papers 162 October 2013 Economic Adjustment Programme for Ireland Summer 2013 Review httpeceuropaeueconomy_financepublicationsoccasional_paper2013pdfocp162_enpdf
2 Economic papers
European Economy Economic Papers 514 February 2014 Martin Larch Kristin Magnusson Bernard Balint Tatar Hard work and More How to successfully conduct adjustment with official assistance httpeceuropaeueconomy_financepublicationseconomic_paper2014pdfecp514_enpdf
European Economy Economic Papers 513 February 2014 Florian Woumlhlbier Caterina Astarita Gilles Mourre Consolidation on the revenue side and growth-friendly tax structures an indicator based approach httpeceuropaeueconomy_financepublicationseconomic_paper2014pdfecp513_enpdf
48 | Quarterly Report on the Euro Area
European Economy Economic Papers 512 December 2013 Alexander Schwan Etienne Sail Assessing the economic and budgetary impact of linking retirement ages and pension benefits to increases in longevity httpeceuropaeueconomy_financepublicationseconomic_paper2013pdfecp512_enpdf 3 Other publications
Winter forecast 2014 - EU economy recovery gaining ground httpeceuropaeueconomy_financepublicationseuropean_economy2014pdfee2_enpdf 4 Regular publications
Business and Consumer Surveys (harmonised surveys for different sectors of the economies in the European Union (EU) and the applicant countries) httpeceuropaeueconomy_financedb_indicatorssurveysindex_enhtm Business Climate Indicator for the euro area (monthly indicator designed to deliver a clear and early assessment of the cyclical situation) httpeceuropaeueconomy_financedb_indicatorssurveysdocuments2013bci_2013_11_enpdf Key indicators for the euro area (presents the most relevant economic statistics concerning the euro area) httpeceuropaeueconomy_financedb_indicatorskey_indicatorsindex_enhtm Monthly and quarterly notes on the euro-denominated bond markets (looks at the volumes of debt issued the maturity structures and the conditions in the market) httpeceuropaeueconomy_financepublicationsbond_marketindex_enhtm Price and Cost Competitiveness httpeceuropaeueconomy_financedb_indicatorscompetitivenessindex_enhtm
50 | Quarterly Report on the Euro Area
Editor-in-Chief Elena Flores
Overall coordination Eric Ruscher
Data assistance Christos Zavos
Comments on the report would be gratefully received and should be sent to
Elena Flores Director ndash Policy Strategy and Coordination Directorate-General for Economic and Financial Affairs Office CHAR 1566
B-1049 Brussels
Email elenafloreseceuropaeu
or
Eric Ruscher Head of Unit ndash Macroeconomy of the euro area Directorate-General for Economic and Financial Affairs Office CHAR 15248
B-1049 Brussels
Email ericruschereceuropaeu
HOW TO OBTAIN EU PUBLICATIONS Free publications bull one copy
via EU Bookshop (httpbookshopeuropaeu) bull more than one copy or postersmaps
from the European Unionrsquos representations (httpeceuropaeurepresent_enhtm) from the delegations in non-EU countries (httpeeaseuropaeudelegationsindex_enhtm) by contacting the Europe Direct service (httpeuropaeueuropedirectindex_enhtm) or calling 00 800 6 7 8 9 10 11 (freephone number from anywhere in the EU) () () The information given is free as are most calls (though some operators phone boxes or hotels may charge you)
Priced publications bull via EU Bookshop (httpbookshopeuropaeu) Priced subscriptions bull via one of the sales agents of the Publications Office of the European Union
(httppublicationseuropaeuothersagentsindex_enhtm)
KC-AK-14-001-en-n
- Blank Page
- Blank Page
- Blank Page
- Blank Page
-
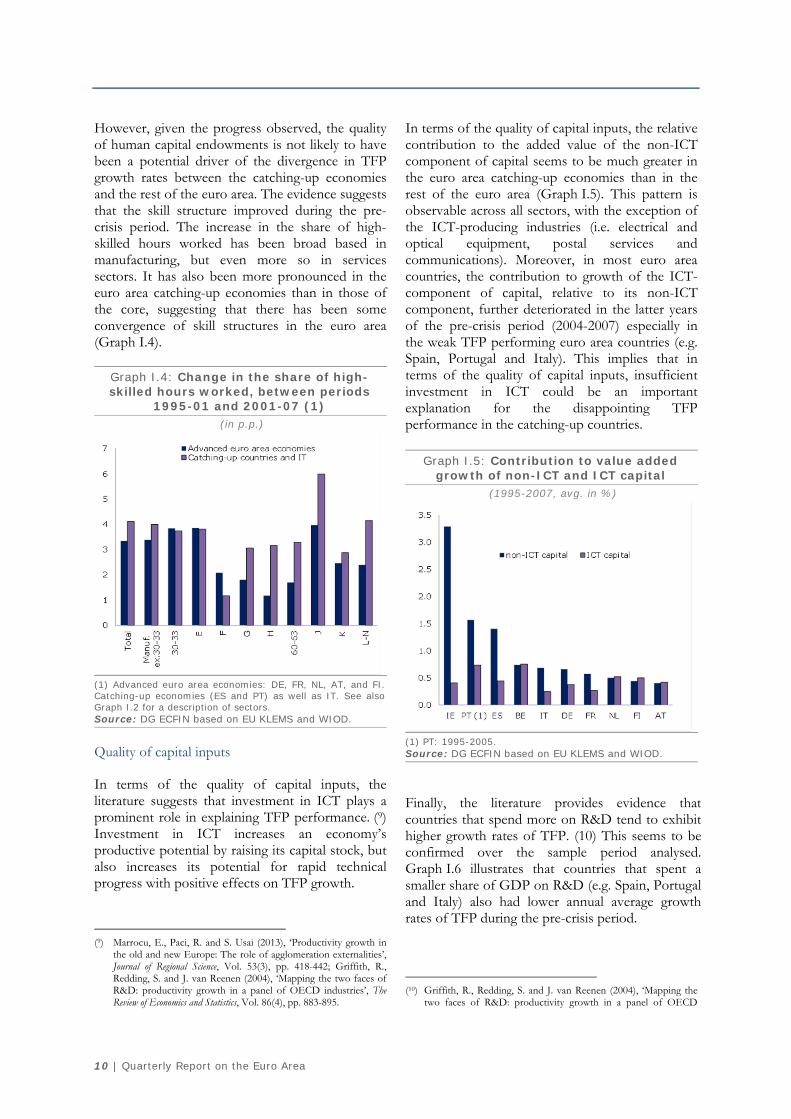
I The drivers of total factor productivity in catching-up economies
Volume 13 No 1 | 13
The dependent variable is defined as total factor productivity growth in line with the growth accounting methodology of EU KLEMS (see Section I2) The selection of potential explanatory factors with a causal impact on TFP was made based on the key explanatory variables presented in Section I3
Two independent variables are of particular importance First the technology gap which measures the distance between the TFP level of the country concerned and the country with the highest TFP level This variable provides an indication of the impact from the convergence channel It is expected that with a larger technology gap the potential benefit of adopting new technologies increases resulting in a higher TFP growth rate Second the possibility of positive innovation and knowledge spillovers is captured by including the TFP growth rate of the country with the highest TFP level (the technology leader) This variable measures the importance of the spillover channel Apart from these explanatory variables the specification includes a large set of control factors in line with Section I3 such as the impact of ICT compensation RampD expenditure the share of high-skilled population as well as country- sector- and time-fixed effects (see Box I1 for more detailed results)
The findings of a first set of (restricted) empirical regressions (14) show that convergence and spillover effects are important factors in explaining TFP growth Both variables appear to be strongly significant The larger the distance to the frontier the more sizeable the positive impact from the convergence channel on TFP gets At the same time an increase of the spillover effect as realised by the TFP growth of the technology leader results in a higher TFP growth rate The empirical findings suggest that the impact from the spillover channel is stronger than the impact from the convergence channel The results also reveal that the strength of the spillover channel seems to have increased over time while that of the convergence channel has weakened
Apart from the convergence and spillover channels TFP growth appears to be strongly supported by innovation activities as captured by
(14) As a starting point TFP growth was regressed on the technology gap and the spillover channel apart from country- sector- and time-fixed effects thereby omitting further control variables
the share of ICT compensation in total compensation and RampD expenditure By contrast labour skills as measured by the share of population aged 25 and over who have completed tertiary education turns out not to be significant This finding indicates that the correction of TFP done in EU KLEMS for changes in the quality of input factors (see Section I2) appears to be successful for labour but not completely so for capital input factors
There is no clear evidence that other structural variables have a direct significant impact on TFP growth However it is possible that the impact of other potential factors could depend on the state of the convergence or spillover channel For instance certain structural variables may only be significant for more (or less) advanced countries ie those with a small (or high) gap to the technology frontier
To investigate these conditional effects another set of regressions was run to estimate a set of interaction models In these regressions the technology gap and the spillover term are interacted with the structural drivers related to the framework conditions presented in Section I3 These indicators capture different policy areas that are proxied by five variables namely labour market flexibility (employment protection legislation) tax regimes (effective average tax rates) institutional quality (government effectiveness) population ageing (old age dependency ratio) and product market regulations (OECD regimpact indicator)
The results of these interaction models show that the effect of the structural variables on TFP growth is dependent on the technology gap More rigid employment protection legislation tends to have a negative impact on TFP growth The negative impact becomes stronger the less advanced the economy is The impact on TFP growth is however not statistically significant for the least advanced economies ie those which have a very high technology gap An increase in corporate tax rates and ageing population seem to have a particularly detrimental impact on TFP in less advanced economies Improving government effectiveness tends to have a positive and significant impact on TFP growth for medium- and more advanced economies Finally the results do not suggest a statistically significant impact of product market regulation
14 | Quarterly Report on the Euro Area
(Continued on the next page)
I The drivers of total factor productivity in catching-up economies
Volume 13 No 1 | 15
Box (continued)
(Continued on the next page)
16 | Quarterly Report on the Euro Area
Box (continued)
(Continued on the next page)
I The drivers of total factor productivity in catching-up economies
Volume 13 No 1 | 17
Box (continued)
(Continued on the next page)
18 | Quarterly Report on the Euro Area
The interaction models reveal that the impact of the structural variables also seems to be conditional on the spillover channel ie the growth rates of the economies with the highest TFP level Stricter employment protection legislation an increase of the corporate income tax rate or a higher old age dependency ratio all have a detrimental impact on TFP growth when the TFP growth rate of the technology leader is high Since sectors closely related to ICT appear to show the highest growth rates over the sample period the findings implicitly suggest that these sectors tend to react strongest to changes in labour market flexibility tax regimes and population ageing The effect from improving the effectiveness of governments by contrast seems to be of great importance for all sectors Finally product market regulation does not seem
to matter for TFP growth irrespective of the growth rate of the leading economy
Applying the findings of the panel regressions conducted for up to 20 economies to the euro area economies allows for the following tentative conclusions
bull The TFP divergence between euro area catching-up economies relative to the rest of the euro area in the decade preceding the global financial and economic crisis can be partly explained by the following indicators a weakening of the convergence channel lower spending on innovation activities such as RampD and ICT deteriorating government effectiveness and faster population ageing
Box (continued)
I The drivers of total factor productivity in catching-up economies
Volume 13 No 1 | 19
bull Looking forward policy measures that fosterinnovation activities reduce the restrictivenessof employment protection legislation lowercorporate tax rates and improve governmenteffectiveness could help promote TFP growthin the euro area catching-up economies
bull It is worth stressing that according to theregression results employment protectionlegislation has not contributed to the TFPdivergence process since euro area catching-upeconomies did not fall behind the rest of theeuro area in this respect between 1994 and2007 Similarly corporate tax policy does notseem to have been a source of divergence overthat period Nevertheless the regression resultsalso indicate that policy action in those twoareas could improve TFP growth in thecatching-up countries as well as in the rest ofthe euro area
I5 Conclusions
The TFP income convergence process in the euro area weakened in the decade preceding the economic and financial crisis mainly due to weak TFP growth in catching-up economies In fact the gap between euro area catching-up economies and technological leaders actually widened in a broad range of sectors
The persistence of the technology gap since the mid-1990s suggests that the causes are deep-rooted and at least partly structural The econometric analysis presented in this focus section shows that the TFP divergence between euro area catching-up economies and the rest of the euro area can be partly explained by the following indicators a weakening of the convergence channel lower spending on innovation activities such as RampD and ICT deteriorating government effectiveness and faster population ageing
In response to the crisis catching-up countries have put in place a broad range of reforms aimed at improving framework conditions labour market flexibility and the efficiency of the business environment These are likely to raise TFP growth rates in the years to come
However since catching-up is shown to be more difficult for economies approaching the technological frontier the adoption of further structural measures would also help more advanced countries accelerate their TFP convergence In particular measures that foster innovation activities reduce further the restrictiveness of employment protection legislation lower corporate tax rates and improve government effectiveness appear to be the most effective at promoting TFP growth
II Special topics on the euro area economy
Volume 13 No 1 | 21
II1 New estimates of Phillips curves and structural unemployment in the euro area (15)
The Phillips curve can be used to estimate the non-cyclical part of unemployment In such models this estimate is commonly referred to as the lsquonon-accelerating wage rate of unemploymentrsquo (NAWRU)(16) The Phillips curve can be specified in various ways reflecting different assumptions regarding the formation of expectations DG ECFIN has recently extended its framework to cover rational expectations This section looks at the sensitivity of the results to alternative expectation assumptions reporting NAWRU estimates based on Phillips curves produced using rational expectations and those (as used to date) allowing only for static or adaptive expectations
Our findings show that for the euro area as a whole the alternative expectation assumptions yield similar NAWRU estimates In particular the NAWRU appears to have increased recently suggesting a deterioration of labour market performance beyond what could be considered merely cyclical For Spain however the results vary more depending on the assumptions used The Phillips curve based on rational expectations points to a more moderate NAWRU increase than that used by DG ECFIN to date However all estimates point to a substantial post-crisis increase in the NAWRU for Spain
In interpreting the rise in the NAWRU it is important to bear in mind that both structural and non-structural factors are driving developments Analysis shows that in the presence of rigidities crisis-related events can have temporary but long-lasting effects on labour market performance Structural factors can play a role too as illustrated by the steady decline in the NAWRU in Germany which appears to be related to structural effects brought about by the Hartz reforms
-------------------------------
(15) Section prepared by Fabrice Orlandi (16) The Phillips curve features a relationship between the
unemployment gap and an inflation or labour-cost variable In the case of the former the non-cyclical unemployment estimate obtained is usually referred to as the lsquonon-accelerating inflation rate of unemploymentrsquo (NAIRU) while with the latter it is referred to as the lsquonon-accelerating wage rate of unemploymentrsquo (NAWRU)
Introduction
Unemployment rates increased sharply in the euro area in the wake of the crisis and the surge has proved particularly persistent Assessing this development is of paramount importance to policy-makersrsquo efforts to find adequate responses to the effects of the crisis
The non-cyclical part of unemployment play a key role in this assessment as it identifies the proportion of the deterioration that is likely to last beyond the business cycle In the EU context this indicator is particularly important as it is a factor to be fed into the potential output calculations used to compute cyclically-adjusted fiscal figures important benchmarks for country surveillance under the EUrsquos fiscal framework(17)
The non-cyclical part of unemployment is not an observable variable however and has to be estimated which means that it is subject to uncertainty In part the uncertainty stems from the fact that different estimation models are available The Phillips curve is commonly used as a key element in estimation models(18) but can itself be specified in various ways most notably reflecting alternative assumptions as to the formation of expectations(19)
This section sets out DG ECFINrsquos approach to estimating the non-cyclical part of unemployment in particular in its use of the Phillips curve We also investigate the sensitivity of the results to alternative expectation assumptions highlighting the results obtained for the case of rational expectations the case recently incorporated in DG ECFINrsquos estimation framework
The results presented here focus on the euro area but results are also reported for Spain and Germany two countries that have witnessed starkly different non-cyclical unemployment developments
(17) For details on the EUrsquos SGP framework see Vademecum on the Stability and Growth Pact European Economy mdash Occasional Paper No 151 DG ECFIN European Commission May 2013
(18) For an illustration of structural unemployment analysis based on an alternative concept see eg Unemployment dynamics during recessions and recoveries Okunrsquos law and beyond IMF WEO April 2010
(19) For details on the Phillips curve see Fuhrer J YK Kodrzycki GP Olivei and J Sneddon Little Understanding inflation and the implication for monetary policy mdash a Phillips curve retrospective MIT Press 2009
22 | Quarterly Report on the Euro Area
in the recent past We use long time series usually starting in 1965 to capture medium-term cycles The latest DG ECFIN forecasts are also included in the dataset
Alternative NAWRU models
Non-cyclical unemployment is estimated on the basis of models that pin-down its statistical and economic properties DG ECFINrsquos approach relies on an lsquounobserved componentrsquo model which features a Phillips curve The curve links cyclical unemployment (ie the unemployment gap) to labour cost developments while non-cyclical unemployment is assumed not to be affected by labour cost developments In this setting non-cyclical unemployment estimates are commonly referred to as the lsquonon-accelerating wage rate of unemploymentrsquo (NAWRU)(20)
The specification of the Phillips curve reflects particular assumptions made regarding inflation expectations In the past DG ECFINrsquos considered only static and adaptive expectations More recently the case of rational expectations has been added providing a more comprehensive framework (see Box II11)
More specifically the so-called traditional Keynesian Phillips (TKP) curve based on static or adaptive expectation assumptions a positive unemployment gap ( minus lowast) with a fall in the change of the growth rate of nominal unit labour cost (∆ ) (and vice versa) ∆ = minus ( minus lowast) The new Keynesian Phillips (NKP) curve based on rational expectations implies that a positive unemployment gap ( minus lowast) is associated with a fall in the growth rate of real unit labour cost (∆ ) Lagged effects are also relevant because some wage-setters may use ad hoc rules and not fully optimise = ∆ minus ( minus lowast)+ ( minus lowast ) (20) For further details on the DG ECFIN approach see DrsquoAuria F
C Denis K Havik K Mc Morrow C Planas R Raciborski W Roumlger and A Rossi (2010) The production function methodology for calculating potential growth rates and output gaps European Economy mdash Economic Paper No 420 DG ECFIN European Commission July 2010
These alternative Phillips curves thus rely on different labour cost indicators to determine the unemployment gap (and thus also the NAWRU) namely ∆ and ∆ As explained in Box II11 this does not mean that the models are fundamentally different Instead it illustrates the impact of assumptions as to expectation formation on the specification of the Phillips curve
NAWRU developments
For the euro area as a whole NAWRU estimates based on the TKP and the NKP show a similar pattern (see Graph II11)(21) The similarity suggests that for most countries in the euro area results are not overly sensitive to the specification of the Phillips curve (ie to assumptions as regards expectation formation) In practice it also suggests that alternative labour cost indicators (ie change in unit labour cost (ULC) growth and real unit labour cost (RULC) growth) underwent broadly similar developments in the euro area this is confirmed by the top chart in Graph II12
Graph II11 shows that non-cyclical unemployment in the euro area posted a steady increase up to the mid-90s followed by an improvement that was then halted by the recent crisis The recent rise in the NAWRU suggests that the increases in unemployment seen in the aftermath of the crisis are to some extent likely to last beyond the cyclical upturn
Graph II11 also shows NAWRU developments for Spain and Germany illustrating the diversity within the euro area Spain has witnessed developments that have been similar to though more dramatic than those in the euro area as a whole Germany posted a starkly different profile with its NAWRU falling steadily (from 2002 according to the NKP or 2004 according to the TKP)
As regards sensitivity the NAWRU estimates for Spain vary considerably depending on the specification With the NKP the recent increase is more moderate with the NAWRU reaching 220 by 2015 while the estimated level with the TKP is 264 Recent results for Germany are less sensitive to assumptions regarding expectations (21) NAWRUs referred to in this section are those computed for the
Commissionrsquos 2014 winter forecast Latest available NAWRUs can be downloaded from the AMECO database httpeceuropaeueconomy_financeameco
II Special topics on the euro area economy
Volume 13 No 1 | 23
with the two Phillips curve specifications producing similar NAWRUs However around
Graph II11 Alternative NAWRU estimates euro area Germany and Spain (1)
(1965-2015 in )
(1)GDP weighted average of euro-area countries for which alternative NAWRUs have been computed (ie AT BE DE EL ES FI FR IE IT NL and PT) For AT both NAWRUs are based on the backward-looking model as the forward-looking model yields econometrically unsatisfactory results (2)Component of the NAWRU explained only by structural determinants (see Orlandi (2012) op cit) Source DG ECFIN calculations based on Eurostat data
2005 some difference across the two specifications is observed for Germany with the NKP producing a relatively less volatile NAWRU Given that the current NAWRU estimates for Germany based on the TKP and NKP specifications do not diverge greatly and taking into account the stability considerations in moving to a new specification Germany continues to use the TKP specification
NAWRU differences for Spain depending on the curve specification stem from corresponding differences between the labour cost indicators used Graph II12 shows that recently RULC growth posted greater and more persistent moderation in Spain than change in nominal ULC growth For Germany the indicators have followed more similar paths over recent years (as they have in the euro area as a whole) More fundamentally in times of heightened economic volatility andor big labour market adjustments (eg recent crisis Hartz reforms) the TKP model is likely to yield NAWRUs that are more pro-cyclical as it does not take full account of the price rigidities that play an important role in the adjustment process of the labour market These rigidities are better reflected in the NKP model
To sum up except in the case of Spain recent NAWRU estimates for the euro area do not appear to be sensitive to assumptions as regards expectations with alternative Phillips curve specifications yielding similar results Overall results point to a recent increase in the NAWRU across the euro area with the notable exception of Germany A rise in the NAWRU points to persistent deterioration in labour market performance Identifying the causes of the deterioration calls for cautious interpretation however
NAWRU versus Structural Unemployment
Understanding the sharp and protracted rise in unemployment in the wake of the crisis is of paramount importance from a policy perspective What caused the rise Is it a sign of structural deterioration Or is it purely cyclical reflecting the prolonged slowdown These questions are the subject of lively debate with views ranging from lsquoitrsquos all demandrsquo(22) to lsquoitrsquos allmostly structuralrsquo(23)
(22) See eg Krugman P (2010) Debunking the structural unemployment myth New York Times 28 September 2010
24 | Quarterly Report on the Euro Area
(23) See eg Kocherlakota N (2010) Inside the FOMC speech at
Marquette Michigan 17 August 2010
(Continued on the next page)
II Special topics on the euro area economy
Volume 13 No 1 | 25
In particular changes in the NAWRU are sometimes interpreted as a sign of a structural change Careful analysis of developments in the NAWRUs produced by DG ECFIN shows that they can be driven by both structural and non-structural factors(24)
In particular crisis-related shocks (eg unwinding of unsustainable developments) especially boom-bust episodes in the housing market that can trigger a lengthy process of deleveraging in the construction sector have a statistically significant impact on the NAWRU The real interest rate and Total Factor Productivity (TFP) growth which controls more generally for the presence of such shocks also play a part in driving NAWRU develpoments
At a theoretical level adding various rigidities (eg real wage rigidity cyclical price mark-ups or sluggish adjustment of the reservation wage) to the traditional labour market model can be shown to yield a NAWRU that is not solely determined by structural factors
Despite uncertainties the NAWRU remains a useful policy indicator It is a well-defined concept that provides useful information on the nature of unemployment rate developments In particular it identifies risks of persistent labour market deteriorations that may not always be caused by structural phenomena(25)
In this context it appears useful to distinguish between the NAWRU and a narrowly defined notion of structural unemployment affected only by structural factors as shown in Graph II11 by
(24) For further details see Orlandi F (2012) Structural unemployment and its determinants in the EU countries European Economy mdash Economic Paper No 455 DG ECFIN European Commission May 2012
(25) For further details see Cyclical and structural unemployment in the euro area in Labour Market Developments in Europe 2013 European Commission
the lsquostructural unemploymentrsquo series The latter represents the portion of the NAWRU that according to econometric results appears to be explained by structural features of the labour market As can be seen the series has remained broadly stable during the crisis Except for a notable decline due to structural labour market reforms in Germany change in the NAWRU in the euro area is not related to structural change This is also the case in Spain where structural unemployment has remained broadly stable
Recent increases in the euro-area NAWRU should therefore not be interpreted as a sign of big structural change at the current juncture Rather in most countries the increases reflect the effects of shocks that in the presence of various rigidities have a long-lasting impact on unemployment rates
To sum up the decline in the NAWRU at euro-area level and in countries like Spain in the run-up to the crisis appears mostly attributable to non-structural factors such as unsustainable developments in the housing sector The build-up and subsequent unwinding of imbalances has caused large economic shocks (eg need for sectoral reallocation) which have a persistent effect on the performance of the labour market However in some countries structural factors have also played a role in driving NAWRU developments In Germany for example the decline in the NAWRU seems related to some aspects of the Hartz reforms (eg the change in the period of eligibility for unemployment benefit appears to have contributed to a decline of the NAWRU over recent years) This suggests that large-scale reforms as currently being enacted in some countries will tend to translate into a gradual lowering of the NAWRU over coming years For example recent efforts in Ireland to bring down the labour tax wedge appear to be contributing to more favourable NAWRU developments A number of countries (eg France) have failed to
Box (continued)
26 | Quarterly Report on the Euro Area
post similar improvements in their underlying labour market structures
Graph II12 Alternative labour cost signals for the euro area Germany and Spain (1)
(1965-2014)
(1)GDP-weighted average of euro-area countries for which alternative NAWRUs have been computed (ie AT BE DE EL ES FI FR IE IT NL and PT) (2)Private consumption deflated ULC Source DG ECFIN calculations based on Eurostat data
Conclusions
Alternative Phillips curve specifications based on different assumptions regarding expectation formation point to broadly similar NAWRU results for the euro area Estimates point to a recent rise in the NAWRU suggesting that post-crisis unemployment increases are to some extent persistent
In the case of Spain alternative Phillips curve specifications yield somewhat different NAWRU results pointing to the current importance for that country of theoretical considerations regarding expectations The NKP which uses rational expectations and relies on RULC growth to identify the unemployment gap yields a more moderate NAWRU increase over recent years than the TKP (hitherto used by DG ECFIN) which allows only for static or adaptive expectations and relies on the signal provided by the change in nominal ULC growth While this sensitivity in the results underlines the need for caution in interpreting NAWRU estimates it should also be borne in mind that all specifications point to an important increase in the NAWRU for Spain at this juncture
The deterioration in the NAWRU signals difficulties that are likely to last beyond the cyclical upturn In interpreting those developments it is important to recognise that changes in the NAWRU can be caused by both structural and non-structural factors While the improvement in the NAWRU in Germany seems to be caused by structural factors the deterioration in Spain seems to be caused more by crisis-related events that have persistent effects due to the presence of various rigidities that tend to slow down the adjustment process
II Special topics on the euro area economy
Volume 13 No 1 | 27
II2 The relationship between government and export sector wages and implications for competitiveness (26)
In 2012 the general government sector employed on average about 15 of the labour force in the euro area Since most countries in the euro area are now trying to consolidate public finances whilst also trying to boost competitiveness for external rebalancing and to reduce unemployment it is crucial to assess whether there is any wage spillover from the public to the export sector in particular under conditions of fiscal stress This section shows that there has been a link between government and manufacturing wages over the long-run which is much closer when the government employs a large share of the labour force Government size dimension is especially important during fiscal consolidation If the government wage bill is inflated due to unjustified wage premia for example limiting government wage growth is a fiscal strategy that may among other effects deliver competitiveness gains that contribute to external rebalancing and help boost employment in the tradable sector
-----------------------
Introduction
General government employment accounts for a considerable share of the labour force in the euro area It stood at about 15 in 2012 with but some cross-country variation The evolution of government wages is likely to have an impact not only on fiscal variables and on the sustainability of public finances but also on the labour market on cost competitiveness and on external rebalancing within the euro area This section looks at the relationship between public and private sector wages at a time when most euro area countries are trying to consolidate their public finances improve competitiveness to support external rebalancing whilst also having to tackle high unemployment levels (27)
Changes in general government compensations may spill over into the private sector through both
(26) Section prepared by Benedicta Marzinotto and Alessandro Turrini
(27) Throughout the section the public sector is referred to alongside general government which refers to public offices at all levels of government non-market public owned hospitals schools and social security organizations Thus the term public is used as a synonym for general government
market-based and institutional channels For example excessive government wages may crowd out private sector employment inflating cost conditions and leading to competitiveness losses (28) There are channels of transmission also in the opposite direction from the private to the government sector Wage growth linked to productivity improvements in the private sector can spill over into the public if there is labour mobility across sectors This can affect governments capacity to keep wage expenditure growth under control
Against this background this section analyses the relationship between general government and manufacturing wages in order to assess the potential for and conditions of a wage spillover from the insulated government sector to the export sector The relationship is analysed by looking at a sample of EU countries over the period 1980-2013 in a co-integration framework that makes it possible to distinguish between long-run and short-run effects The relationship between the two wages is also assessed for different fiscal scenarios differentiating between normal periods and periods of fiscal adjustment
The various forms the relationship takes
The relationship between public and private wages takes many forms It may be influenced by market forces andor by institutional features of the wage setting system in each country Changes in private wages can affect government wage growth in the following ways
bull Wage bargaining in the private sector has ademonstration effect on public wage-settersPerez and Sanchez (2011) find evidence ofsignalling by the private sector in thenegotiation phase in France and Germanybefore the EMU period (29) Signalling may bemotivated by envy effects that reflect thestrength of the wage-bargaining position (30) or
(28) See for example Alesina A and R Perotti (1997) The welfare state and competitiveness American Economic Review Vol 87 pp 921-939 Alesina A Ardagna S Perotti R and Schiantarelli F (2002) Fiscal policy profits and investment American Economic Review Vol 92(3) pp 571-589 Ardagna S (2004) Fiscal stabilizations when do they work and why European Economic Review Vol 48 pp 1047-1074
(29) Perez JJ and AJ Sanchez (2011) Is there a signalling role for public wages Evidence of the euro area based on macro data Empirical Economics Vol 41(2) pp 421-445
(30) Maffezzoli M (2001) Non-Walrasian labor markets and real business cycles Review of Economic Dynamics Vol 4(4) pp 860-
28 | Quarterly Report on the Euro Area
by the fact that the same trade union negotiates wages for both sectors
bull Wage-bargaining practices may explicitly or implicitly grant wage leadership to the private sector Under the Scandinavian wage-setting model the private export sector typically takes the lead dictating bargaining outcomes to other sectors including the public sector (31)
bull There may also be established practices and institutional mechanisms that make public wages responsive to private wage settlements usually those of the export sector This is the case if for example there is a formal rule under which the growth rate of private wages is automatically applied to public sector wages (32)
It is of course a two-way street Changes in government wages affect private wage growth in a number of ways
bull Wage adjustment in the public sector causes cross-sector labour shifts and a change in the private sectors labour supply As the supply of labour changes so does the competitive private sectors equilibrium wage
bull Adjustments to government wages affect the outside option of unionised private sector bargainers putting pressures on the bargaining process (33) with for example private sector workers tempted to move to the general government sector due to large public wage increases
892 Ardagna S (2007) Fiscal policy in unionized labor markets Journal of Economic Dynamics and Control Vol 31(5) pp 1498-1534
(31) For a review see Lindquist J and R Vilhemsson (2006) Is the Swedish central government a wage leader Applied Economics Vol 38 pp 1617-1625 Friberg K (2007) Intersectoral wage linkages the case of Sweden Empirical Economics Vol 32 pp 161-184 Traxler F and B Brandl (2012) Collective bargaining inter-sectoral heterogeneity and competitiveness a cross-national comparison of macroeconomic performance British Journal of Industrial Relations Vol 50(1) pp 73-98 Ramskloger P (2012) Is there a European wage leader Wage spillovers in the European Monetary Union Cambridge Journal of Economics Vol 36(4) pp 941-962 and (2013) The nationalndashtransnational wage-setting nexus in Europe What have we learned from the early years of monetary integration Journal of Common Market Studies Vol 51(5) pp 916-930
(32) For evidence on the Netherlands see Hartog J and H Oosterbeek (1993) Public and private sector wages in the Netherlands European Economic Review Vol 37(1) pp 97-114
(33) Afonso A and P Gomes (2008) Interactions between private and public sector wages ECB Working Paper No 971
bull Changes in public wages may be fully compensated in government budgets by changes in labour taxation that alter labour costs in the private sector (34) and might also affect union behaviour (35)
Co-movements between government and private wages may also take place in the absence of direct links when driven by factors common to both sectors For example public wages may be pro-cyclical and change in a manner similar to private wages over the cycle (36) Co-movements in aggregate wage series could be linked to developments common to both factors relating to the composition of the labour force
Testing the relationship between government and manufacturing wages
To analyse more systematically the long- and short-term effects of government wages on the export sector a cointegration approach is used linking manufacturing compensations to a number of determinants including compensation in the government sector The long-term relationship is analysed in terms of levels while the Error Correction Mechanism (ECM) equation makes it possible to estimate the short-term relation between export sector wage growth shocks in explanatory variables and their deviation from the long-term relationship The long-term relationship in also analysed in terms of levels using a dynamic ordinary least squares (DOLS) model and the results incorporated in an ECM model
Estimates were made on a sample of 17 EU countries for which data are available over the period 1980-2013 This has not only has the advantage of gaining degrees of freedom and reinforcing the results It also makes it possible to
(34) Holmlund B (1993) Wage setting in private and public sectors
in a model with endogenous government behaviour European Journal of Political Economy Vol 9(2) pp 149-162
(35) The spillover from the public to the private sector is likely to be mediated by the structure of wage-setting systems Alesina and Perotti (1997) find that increases in labour taxation do not necessarily lead to higher wage demands by unions in highly centralised bargaining systems as large wage setters would internalise the consequences from higher labour costs on employment
(36) For instance Lane (2003) and Lamo et al (2007) find that public wages are pro-cyclical because of discretionary fiscal expansion in good times Lane P (2003) The cyclical behaviour of fiscal policy evidence from the OECD in Journal of Public Economics Vol 87 pp 2661-2675 Lamo A Perez JJ Schuknecht L (2007) The cyclicality of consumption wages and employment of the public sector in the euro area ECB Working Paper No 757
II Special topics on the euro area economy
Volume 13 No 1 | 29
investigate the role of framework conditions in bringing the impact of general government to bear on manufacturing wages by means of appropriate sample splits Box II21 shows the estimation methodology and the results
Much of the variance in manufacturing wages is explained by variables usually used when estimating wage equations (ie the price level labour productivity and the unemployment rate) and by general government wage levels Both the long- and short-term elasticity of manufacturing wages with respect to government wages is estimated to be around 03-04 This tallies with the results of similar studies (eg Afonso and Gomes 2008) It works both ways general government wages also react to manufacturing wages They have a long-term elasticity of 08 and a short-term elasticity of 04 (37) This is consistent with the fact that it is more usual for the private sector than for the government to take the lead in terms of wages as the available literature also shows (38) The DOLS cointegration estimation delivers qualitatively identical results The results are still valid when the sample is restricted to just the euro area (39) The relationship tested on real wages is symmetrical because manufacturing wages respond to government wages whether they are increased or reduced
One hypothesis tested here is whether the size of the government sector determines the extent to which changes to government wages affect average conditions on the private market if for example there is cross-sector mobility In order to test how this market-based channel works the same EU sample is split into two groups of countries those in which the average share of government to total employment is above the whole EU samplersquos median and countries in which it is below the median Results show that in the long-run the impact of public on manufacturing wages is considerably higher in the case of large public sectors This divide disappears in the short-run In the opposite direction going from manufacturing to public wages the split does not produce differentiated results This confirms that government size matters when it comes to the public sectors long-term impact on the labour
(37) The results are not shown (38) Perez JJ and AJ Sanchez (2011) (39) Still it should be noted that the sample used excludes some key
countries in the euro area
market The DOLS methodology confirms these results (40)
Another hypothesis that is tested is whether the way wages are set in the public sector increases the chances of manufacturing wages reacting to government wages Broadly speaking two wage-setting systems may be identified
bull This first is that wages are mainly set on thebasis of collective bargaining
bull The second is that wages are set on the basis ofunilateral decision by the government (41)
The results show that the way wages are set does not fundamentally alter the relation between government and manufacturing wages in the long- or the short-term It is however interesting to note that across all methodologies used the relationship between manufacturing wages and labour productivity is weaker in countries characterised by a unilateral decision wage-setting system This is probably because in such a case the spillover from public to private wages is such that private wages tend to be misaligned with sectoral productivity This is not the case when government wages are set through a collective bargaining wage-setting system possibly because bargaining processes even in a particular type of insulated sector such as the public one reflect market forces more than a unilateral government decision
The relationship between government and manufacturing wages under fiscal stress
Most countries in the euro area have recently been trying to cut government wage bills by freezing wages cutting or retrenching specific indemnities or benefits (including bonuses andor holidays) or blocking turnover As a result the share of government compensations in total government spending has fallen Between 2008 and 2012 this fall was particularly sharp for Latvia Portugal and Romania followed by Hungary Spain Denmark and Estonia (Graph II21)
(40) The results from the DOLS are not shown (41) For a classification of EU wage-setting systems in the government
sector see European Commission Directorate for Economic and Financial Affairs (2014) Government wages and labour market outcomes Occasional Paper forthcoming
30 | Quarterly Report on the Euro Area
(Continued on the next page)
II Special topics on the euro area economy
Volume 13 No 1 | 31
Box (continued)
(Continued on the next page)
32 | Quarterly Report on the Euro Area
Box (continued)
II Special topics on the euro area economy
Volume 13 No 1 | 33
The recent crisis marked a watershed in the evolution of public compensations Between 1999 and 2007 relative government wage growth did not vary from cold-shower periods (or periods of more gradual fiscal consolidation) to periods of non-consolidation (42)
Graph II21 Change in the share of general government compensations to
total spending (2008-2012 in pp)
Source DG ECFIN calculations based on AMECO
Conversely starting with the 2008-2009 crisis compensations per employee in the government sector grew more slowly compared with those in the manufacturing sector and more clearly so during fiscal consolidation (Graph II22)
It is possible that under conditions of fiscal stress the relationship between government and export sector wages differs from that of normal periods This aspect has been neglected in previous analyses To shed some light on it Table II21 shows the correlation between government wage growth and manufacturing wage growth under alternative fiscal conditions (consolidation and non-consolidation) differentiating between countries with large and small public sectors The evidence shows that the two wages are closely related in periods of fiscal stress only if the government employs a large share of the labour forces This suggests that the possibility of
(42) By convention episodes of fiscal consolidation are defined as those during which the structural primary balance improves by at least 15 per cent of GDP in one year or at least 3 per cent in three years with a minimum improvement of 05 per cent in each year Such a definition makes it possible to distinguish between cases of cold-shower consolidation episodes and more gradual consolidation episodes
expenditure-based fiscal consolidation having the type of supply-side effects described in Alesina and Perotti (1997) Alesina et al (2002) and Ardagna (2004) may be a consequence of the size of the public sector among other things
Graph II22 Government and manufacturing compensations under
alternative fiscal conditions EU countries (1999-2007 and 2008-2012 avg annual change)
Source DG ECFIN calculations based on OECD
Table II21 Correlation between government and manufacturing
compensations growth under alternative fiscal conditions EU (1)
(1) Pearson correlation coefficients Sample EU countries (excluding AT BG CY DE EL LT LV MT RO SI) over 1980-2012 (1995-2012 in the case of CZ EE HU SK) Source DG ECFIN calculations based on OECD
Concluding remarks
Spillovers which are the result of high wages in the general government sector have been mentioned as one of the drivers of competitiveness losses in
34 | Quarterly Report on the Euro Area
some countries in the euro area before the crisis (43)
The results presented here speak to this debate and may be summarised as follows Government wage levels have a long-term impact on wages in the manufacturing sector even more so in countries in which the government sector employs a relatively large share of the labour force That said their short-term impact remains unaffected by the size of the public sector Looking at it the other way round manufacturing wages usually have a greater impact on government wages regardless of size This is arguably because private sector wage leadership is more common than public sector wage leadership
(43) Blanchard O (2007) Adjustment within the euro The difficult
case of Portugal in Portuguese Economic Journal 61 1-21
The way government wages are set also plays a role In collective bargaining systems not only are government and manufacturing wages related in both the long- and the short-term (as they are also when the government sets wages by unilateral decision) Also most importantly wages in the tradable sector are better aligned with labour productivity The evidence provided here indicates that if the government wage bill is inflated for example due to unjustified wage premia limiting public wage growth would spill over into the private export sector reducing labour costs and helping boost competitiveness and employment in the sector Whilst structural reforms including skill upgrading in manufacturing are an important and necessary ingredient for achieving non-reversible gains in competitiveness the adjustment of competitiveness through fiscal policy remains a complementary tool to deliver sustained external rebalancing
II Special topics on the euro area economy
Volume 13 No 1 | 35
II3 Latvia maintaining sustainable growth after the boom-bust years (44)
Latvia had been keen to join the euro area at the earliest opportunity with entry in January 2008 the clear target As the economy overheated however significant macro-economic imbalances accumulated which deferred these plans Between 2005 and 2007 unsustainable GDP growth went hand in hand with a mounting current account deficit and a housing market spiralling out of control When credit flows then abruptly reversed the countryrsquos GDP contracted dramatically Latvia was placed in the EUIMF-led financial assistance programme and was forced to carry out ambitious fiscal consolidation and structural reforms Reallocating resources to the tradable sector was the first important step on the road to an export-driven recovery Under the burden of deleveraging and consolidation the revival of domestic demand was slow at first From 2011 however supported by favourable labour market developments growth in demand has accelerated Latvia has reclaimed its position as the fastest-growing EU economy however the current level of growth is lower than the unstainable rates recorded in the boom years and it is now seen as sustainable Thanks to this balanced growth Latvia has not been subject to the MIP since its launch in 2012 Despite the financial assistance-supported measures to preserve equity the social burden of economic adjustment as evidenced by poverty social exclusion and emigration rates has been high but measures are being taken by the authorities to counter these effects Continued commitment to prudent fiscal policies will be critical for the countryrsquos economic future The use of macro-prudential tools to reduce the risks posed by large non-resident financial flows and the implementation of ambitious structural reforms will also play an important role
-----------------------
Introduction
To welcome Latvias recent adoption of the euro this section reviews the countrys recent boom-bust experience and discusses the challenges ahead
Five years ago it would have been difficult to imagine that Latvia would be able to fulfil the conditions for adopting the euro and enter the euro
(44) Section prepared by Gatis Eglitis and Christian Weise
area in January 2014 After EU accession in May 2004 significant macro-economic imbalances had started to accumulate on the back of an overheating economy and by autumn 2008 the country was on the brink of bankruptcy A painful and seemingly impossible economic adjustment to be achieved by means of internal devaluation lay ahead This would require unprecedented fiscal consolidation huge redundancies and difficult structural reforms threatening political and social stability Yet despite pronounced scepticism from the outset and particularly at the height of the crisis in mid-2009 the economy has moved back to growth The measures implemented took some time to take effect with the economy continuing to decline at first before picking up as seen in the lsquoVrsquo-shaped recovery but a protracted recession was avoided Latviarsquos GDP growth has exceeded expectations reaching levels of 54 in 2011 52 in 2012 and around 4 in 2013 The two factors that were critical to the countryrsquos economic recovery were a return to international competitiveness and the rapid correction of external imbalances The budget deficit decreased significantly and is expected to reach a balanced position in the near future The level of government debt is projected to stay around 40-42 of GDP in 2013-2014 and to decline to 33 of GDP in 2015 as the repayments to the EU take effect and sizable cash buffers will be reduced The financial assistance programme was successfully completed in January 2012 Financial support had not been necessary since October 2010 however and the government had re-entered international bond markets in June 2011 well ahead of schedule (45) As of 2013 GDP per capita in constant prices has returned to the level reached at its peak in 2007 Due to the decline in the population however the absolute value of GDP in constant prices was still about 9 below 2007 levels with current projections suggesting that a full recovery to the pre-crisis peak will be achieved in 2015
Overheating imbalances and a big bust
Latvia joined the EU in seemingly good macroeconomic health and having pegged its currency to the Special Drawing Right (SDR) in
(45) Occasional Paper 120 issued by the European Commission Directorate-General for Economic and Financial Affairs EU Balance of Payments assistance for Latvia foundations of success httpseceuropaeueconomy_financepublicationsoccasional_paper2012op120_enhtm
36 | Quarterly Report on the Euro Area
1994 and then to the euro in 2005 was keen to join the euro area in January 2008 Upon entering the Exchange Rate Mechanism II (ERM II) on 2 May 2005 the authorities unilaterally committed to maintaining a smaller fluctuation margin of plusmn1 around the central rate ndash seen as a sign of the countryrsquos determination to join the euro area The Latvian economy was the fastest growing in the EU between 2000 and 2007 and between 2005 and 2007 real GDP growth reached a yearly average of over 10 Following accession to the EU in 2004 Latvia along with other EU countries witnessed a rapid credit expansion Loans to residents grew at an average annual rate of close to 50 between 2004 and 2008 a reflection of the excess liquidity at that time and of the resulting hot money inflows into central and eastern European economies which were rapidly converging with their western European counterparts Foreign investment exploded driven by commercial banksrsquo mispricing of risk and over-optimistic expectations of convergence A number of privatisation deals and most importantly a burgeoning real-estate market characterised by soaring prices also served to attract foreign investors The tradable sector was meanwhile largely neglected By way of illustration foreign direct investment (FDI) reached relatively high levels of 84 and 81 of GDP in 2006 and 2007 respectively but most of this was directed towards the real-estate market while the proportion of total FDI relating to manufacturing was only 12 in 2013 Significant imbalances were accumulating as indicated by a current account deficit that reached around 22 of GDP in 2006 and 2007 and by labour market tightening Nominal wages doubled between 2004 and 2007 increasing much faster than productivity and thus damaging international competitiveness
By early 2008 more cautious bank lending had caused economic growth to slow significantly By autumn of the same year this slowdown had developed into a strong contraction reflecting the wider global economic situation The global economy fell into recession commodity prices reached record highs and the general risk aversion seen in global markets following the collapse of Lehman Brothers cut off Latviarsquos access to financial markets The second largest domestic bank Parex had to be rescued Latvia ultimately experienced the most severe GDP contraction of all EU countries at close to 18 in 2009 The government deficit threatened to spiral out of control Having been at 03 of GDP in 2007 and 42 in 2008 in spring 2009 it was projected to
reach levels well above 15 of GDP by the end of year in the absence of a significant consolidation package
Faced with an economic crisis of this order Latvia agreed a medium-term financial assistance programme the balance of payments programme (BoP) with the EU and the IMF in December 2008 (46) The aim of this was to preserve the existing exchange-rate arrangement The assistance offered to Latvia was made subject to a number of policy conditions relating to fiscal consolidation financial sector stabilisation and the introduction of a wide range of structural reforms including a significant acceleration in the absorption of EU structural funds The Latvian government also undertook to strengthen the social safety net so as to protect the most vulnerable from the effects of the crisis
Brave measures in difficult times
Given that the exchange rate was at that time pegged to the euro some economists suggested devaluation as the only way out of the crisis The national authorities and international partners did not see that as a viable option however because its effectiveness would have been severely limited by the degree to which imports were used in the manufacture of exports and the high proportion of foreign liabilities Furthermore it would have brought with it the risk of mass bankruptcy and a partial collapse of the domestic banking system at a time when the judicial system was clearly not capable of coping with such a fall-out In addition devaluation would have provided no incentive to solve Latviarsquos structural problems including weak fiscal governance the unsustainability of pension expenditure loss-making state-owned banks a lack of competitiveness and weak institutions
Between 2009 and 2011 the Latvian government carried out an ambitious programme of fiscal adjustment designed to correct the previously loose fiscal policy the weaknesses of which had been hidden by the countryrsquos strong economic growth This difficult adjustment restored Latviarsquos public finances to better health and established a
(46) Funds available from EU countries IMF World Bank EBRD
and Norway amounted to euro 75 billion of which Latvia used euro 45 billion (60) with euro 29 billion lent by the European Commission on behalf of the EU The first tranche of EUR 1 billion (13 of the total) was repaid by Latvia on 25 March 2014
II Special topics on the euro area economy
Volume 13 No 1 | 37
framework which would be sustainable in the long term The nominal balance improved with the deficit being cut from 98 of GDP in 2009 to 13 of GDP in 2012 and 2013 (see graph II31) The structural deficit also fell from its peak of 55 of GDP in 2008 to around 025 of GDP in 2012 and 2013 beating Latviarsquos medium-term objective of -05 of GDP as set in the convergence programmes
Latviarsquos fiscal consolidation measures were undoubtedly bold with fiscal savings equivalent to around 17 of GDP implemented within three years The measures were frontloaded and half of these savings were implemented in the first year alone The measures were on the whole expenditure-oriented with over half of the savings coming from cuts to health education and public administration budgets The most notable measure relating to revenue was an increase in VAT from 18 to 22 The consolidation strategy was eventually successful in containing the adverse effects of the budget deficit on the economy In fact it even appears to have triggered lsquonon-Keynesianrsquo effects on demand by restoring confidence and stimulating demand and investment at the point when it was most needed (47)
Graph II31 Latviarsquos government budget balance and debt (2008-15 of GDP)
Source DG ECFIN Commissionrsquos spring 2013 forecast
The fiscal framework was also strengthened significantly by the law on fiscal discipline coming into force in March 2013 and the creation of a fiscal council in January 2014 The signing of the
(47) Ibid see Chapter 4 Fiscal consolidation in the midst of the crisis
Treaty on Stability Coordination and Governance in the EMU (48) in March 2012 provided further EU-level support for the national fiscal framework
An additional factor that was critical to the success of the consolidation strategy but is often overlooked was the availability of significant EU funds (particularly from around 2009 onwards) which acted as a much-needed demand trigger in sectors affected by the decline in economic activity Between 2007 and 2013 Latvia benefited from the third highest allocation of EU funds after Hungary and Lithuania receiving a yearly average equivalent to around 28 of GDP or 70 of gross fixed capital formation(49) As on average every euro of national budget spending was supplemented by five to six euros co-financing from EU funds national expenditure on items such as road and public building construction vocational education and training of unemployed science infrastructure development and healthcare was often replaced by Structural funds financing despite being in conflict with the EU funds additionality principle Clearly such large inflows of EU financing also generated substantial tax revenues in particular VAT at a time when private consumption was weak
The Latvian labour market demonstrated a high level of flexibility during the crisis thanks in part to a decentralised wage-setting system Significant public-sector wage cuts indirectly supported nominal wage reduction in the private sector in 2009 and 2010 when earnings per employee fell by a total of 19 over two years Employment levels fell sharply especially in the private sector as jobs were cut in construction and manufacturing The unemployment rate reached around 20 in early 2010 but had fallen back to 119 by 2013 due mainly to growth in employment with the participation rate also increasing significantly over this period The projection from the Commissionrsquos 2014 winter forecast shows wages in 2014-15 growing broadly in line with productivity although the labour market is tightening and structural problems in particular regional differences and skill mismatches could create pressures in the economy
(48) httpeuropean-councileuropaeumedia639235st00tscg26_en12pdf
(49) Source Directorate-General for Regional Policy Infoview
38 | Quarterly Report on the Euro Area
External cost competitiveness has improved noticeably since 2008 with labour costs falling significantly and labour productivity in particular in the tradable sector increasing In 2008 the real effective exchange rate (REER) adjusted for unit labour costs reached a peak of 64 above the 2000 level before falling by about 20 in 2009-10 since when it has remained broadly stable (see graph II32) This level of REER is considered sustainable as the country has been seen to be steadily gaining market share over recent years (including as measured by exports adjusted for the growth of markets) The percentage of the countryrsquos GDP attributable to exports rose to 60 in 2013 from 43 in 2007 with some 60 of exports destined for the EU and 12 for Russia
Graph II32 Effective exchange rates Latvia v 35 trading partners
(Jan 2007-Dec 2013 monthly avg 2007 = 100)
Source DG ECFIN
The social burden of economic adjustment has admittedly been high in Latvia despite the policy measures contained in the Memorandum of Understanding stipulating inter alia establishment of a comprehensive social safety net supporting local governments in providing social assistance and discounting social payments from overall budget targets High unemployment has led to a wave of emigration to richer EU countries which coupled with Latviarsquos low fertility and high death rates has seen the population decrease by 8-10 since 2008 Net emigration has now fallen substantially however since the peak of the crisis years The rates of poverty and social exclusion in Latvia are among the highest in the EU families with children unemployed people people with disabilities and people living in rural areas are particularly at risk The countryrsquos spending on
social protection and healthcare as a percentage of GDP is among the lowest in the EU Furthermore the social protection measures which do exist to reduce poverty tend to be ineffective highlighting the importance of a robust social safety net It appears however that with the improved economic situation and increasing levels of general social awareness the authorities are finally starting to address the challenges of poverty and social exclusion with greater determination In recent years for example taxation of low-income earners has been cut slightly and child poverty has been reduced thanks to increases in various child-related benefits Proposals for reforms to social assistance in line with 2013 World Banks study are being gradually implemented Better targeted more effective policies relating to the active labour market mostly financed by the European Social Fund are helping unemployed people in particular the long-term unemployed and young people to find work or to obtain relevant training
As part of the BoP programme and in the context of the assessment of Latviarsquos readiness to join the euro area financial supervision has been tightened and EU resources for supervision and monitoring increased in particular for monitoring the growing non-resident banking sector Additional liquidity and capital adequacy requirements for non-resident banks were introduced in 2013 regular on- and off-site checks of these banks are being performed the deposit guarantee fund has been further strengthened and monitoring has been stepped up in relation to pledged assets and the origin of funds in bank recapitalizations This strengthened regulatory policy has been introduced partly as a result of lessons learnt at significant cost in the past five years most notably with the Parex and Krajbanka failures
Latvia has implemented a series of ambitious reforms to the business environment in recent years with the aim of reducing start-up costs simplifying procedures for property registration construction permits and tax collection and introducing out-of-court settlement of insolvencies In doing so Latvia has brought its regulatory framework a significant step closer to what is regarded as best practice In the World Bankrsquos 2014 Doing Business report Latvia was ranked 25th out of 185 countries with only four euro-area members faring better
II Special topics on the euro area economy
Volume 13 No 1 | 39
Conclusion
The origins of Latviarsquos years of boom and bust can be traced back to the domestic regional and global circumstances at that time globally excess liquidity and hot money flowing into vulnerable countries regionally unrealistic expectations of income convergence in central and eastern Europe and domestically undue optimism about growth in personal incomes and mispricing of risk by commercial banks amplified by the behaviour of both policymakers and individuals
A broad range of country-specific and general economic factors have contributed to the successful economic adjustment seen in Latvia since the height of the crisis Ambitious front-loaded and largely expenditure-based fiscal consolidation helped to contain the budget deficit whilst the confidence generated by the introduction of a credible programme itself aided the economic recovery The flexibility of the labour market meanwhile helped companies to restore competitiveness by means of wage reductions and job cuts Competitiveness was also improved by steps taken to shift the tax burden from labour to consumption and property The recovery in Latvia was very much export-driven with the growth in exports made possible by the openness of the economy and the faster-than-expected economic growth experienced by major trading partners A number of structural reforms including bank restructuring and measures improving the use of EU funds have contributed to the development of a more favourable business environment A generous allocation from the European structural funds meanwhile helped to boost public investment and supported financing and reforms in many important sectors Above all the success of the recovery measures implemented in Latvia proved that for a tough internal economic adjustment to be effective there needs to be both a determined political will to carry out unpopular reforms and also a fully-developed comprehensive social safety net to protect more vulnerable groups
in society during difficult times In addition Latvia benefited from the fact that those looking for work were able to migrate to other EU countries which helped to alleviate the social tension created by the effects of the crisis Some of the lessons above are clearly applicable to other Member States undergoing challenging economic adjustment while others are more Latvia-specific
While Latviarsquos current level of economic growth is regarded as sustainable (50) and the adoption of the euro is recognised as a significant and hard-earned achievement it is not the end of the road The current robust economic situation should be used to advance reforms and improve Latvias long-term growth potential rather than lead to complacency and relaxation of reform efforts Sustainable convergence of the economy in the longer term will require inter alia ongoing commitment to prudent fiscal policies (there are some recent signs of less prudent fiscal decision-making) a continuous use of macro-prudential tools to reduce risks from growing non-resident financial flows especially in view of recent Ukraine events and the implementation of reforms in a number of vested-interest-heavy areas These include higher education and science state owned enterprise management electricity and gas market liberalization and the judiciary including insolvency framework But above all and in order to ensure economic and social sustainability for years to come high rates of poverty social exclusion and dismal demographic trends need to be addressed boldly These and other structural challenges are being addressed by the Commission under the European Semester and the Post Program Surveillance frameworks Also Latvia has joined a euro area that is very different from what it was just a few years ago the euro area economic governance framework has been greatly strengthened entailing stricter obligations
(50) The Commissionrsquos alert mechanism reports issued under the Macroeconomic Imbalance Procedure have not identified economic imbalances in Latvia requiring further in-depth investigation for possible policy action
httpeceuropaeueurope2020pdf2014amr2014_enpdf
40 | Quarterly Report on the Euro Area
II4 Corporate balance sheet adjustment in the euro area and the United States (51)
This section compares balance sheet adjustment in the non-financial corporate sector in the euro area and the United States It shows that the adjustment since the crisis has been faster in the latter Despite similar steep rises in corporate debt in pre-crisis years US corporations have cut debt more than those in the euro area Shifts from loans to bonds and extensions of debt maturity have also been more pronounced in the United States Much of the difference in balance sheet consolidation can be traced back to more positive profitability trends providing US firms with the internal funds necessary to adjust balance sheets Differences in dividend distribution strategies and in corporations physical investment behaviours also played a role Profitability differences reflect differences both in cyclical conditions and labour market adjustment Comparatively slow progress in balance sheet consolidation is likely to weigh on investment recovery in the euro area
-----------------------
Introduction
Both the euro area and the United States experienced a surge in corporate indebtedness in the years preceding the global financial crisis and in its early stages The ratio of debt to gross value added by non-financial corporations (NFCs) rose by about 40 pp between 2005 and 2009 Deteriorating growth prospects and changing attitudes to risk have prompted NFCs in both economies to adjust their balance sheets As previously argued in the Quarterly Report balance sheet adjustment can have a substantial effect on economic activity and it is important to monitor regularly the ongoing adjustment in the euro area (52) This section contributes to the monitoring by comparing progress in corporate deleveraging in the euro area and in the United States two regions where firms entered the crisis with excessive debt
(51) Section prepared by Plamen Nikolov (52) See European Commission (2010) Focus Balance sheet
adjustment in the corporate sector Quarterly Report on the Euro Area Vol9 (3) pp 9-19 A more detailed overview of the literature on the impact of balance sheet adjustment can be found in Cuerpo C I Drumond J Lendvai P Pontuch and R Raciborski (2013) Indebtedness deleveraging dynamics and macroeconomic adjustment European Economy Economic Papers 477
Firms consolidate their balance sheets primarily by raising their net lendingborrowing (NLB) ie the cash obtained from their production activity and available for financial operations (53) A rise in NLB is achieved either by increasing savings or cuttingpostponing physical investment Firms increase savings by raising profits and reducing the dividends distributed to shareholders In firmsrsquo financial accounts a rise in corporate NLB is associated with a rise in financial assets andor a cut in financial liabilities The section reviews recent developments in euro area and US profitability savings and NLB and looks at the instruments that the corporate sector has used to consolidate its balance sheet on both the asset and the liability side
Corporate profits have disappointed in the euro area hellip
National account data show that corporate profitability in the euro area reached a pre-crisis peak in 2007Q3 ie later than in the United States where it had already started to decline in 2007 (54)
Graph II41 NFC profitability euro area and US
(2000Q1-2013Q3 of GVA)
20
25
30
35
40
45
00Q1 01Q3 03Q1 04Q3 06Q1 07Q3 09Q1 10Q3 12Q1 13Q3
Euro area (1)
US
(1)Excluding Latvia Source Eurostat US Bureau of Economic Analysis DG ECFIN calculations
(53) Firms can also consolidate their balance sheets by raising equity (54) Profitability like the other national account variables for the
corporate sector presented in this section is measured as a proportion of corporate sector activity represented by gross value added (GVA) It is calculated as the gross operating surplus plus financial revenues and subsidies and minus financial and tax expenses Financial expenses do not include earnings distributed to shareholders
II Special topics on the euro area economy
Volume 13 No 1 | 41
The 2008-09 recession brought a sharp drop in corporate profitability in the euro area Profitability recovered briefly in 2010 to reach a new peak in 2011 but has declined again since then (Graph II41) In the United States the impact of the crisis was rather muted with profits recovering vigorously after 2008 As a ratio to gross value added (GVA) US corporate profits had already passed their pre-crisis level in 2009 before flattening out in the past two years Overall by 2013 profitability in the euro area was still about 2 pp below its pre-crisis peak while in the United States it stood around 3 pp above
hellip mostly due to weak operating surplus
The disappointing profit performance in the euro area relative to the United States is largely due to differing developments in gross operating surplus Looking at the breakdown of the contribution to the cumulative change in corporate profitability since the start of the crisis there is a marked difference between firms in the euro area and those in the United States (Graphs II42 and II43) (55)
Graph II42 Profitability breakdown of NFCs euro area (1)
(cumulative change in from 2007Q3 peak to 2013Q3)
35
36
37
38
39
40
41
42
-100
-80
-60
-40
-20
0
20
40
60
80
100
07Q4 08Q4 09Q4 10Q4 11Q4 12Q4
Taxes (lhs)
Other net current transfers received (lhs)
Net property income received excl dividends paid (lhs)
Operating surplus (lhs)
Profits(rhs)(2)
(1)Excluding Latvia(2)Profits in of GVA Source Eurostat DG ECFIN calculations
In the euro area a fall in the ratio of operating surplus to GVA dragged overall profitability down after 2008 Despite an improvement in 2011 in
(55) The illustration of the contributions to the cumulative change in profitability only serves to depict the relative importance of the various components of the change in profits since the crisis The starting point for the cumulative change should not be interpreted as a reference point for a desirable profit recovery
2013 operating surplus was still contributing negatively to the cumulative change in profitability since the pre-crisis peak In contrast operating surplus in the United States responded to the crisis earlier than in the euro area but its contribution to the change in profits remained positive
Graph II43 Profitability breakdown of NFCs US
(cumulative change in from 2005Q3 peak to 2013Q3)
24
25
26
27
28
29
30
31
-100
-80
-60
-40
-20
0
20
40
60
80
100
05Q4 06Q4 07Q4 08Q4 09Q4 10Q4 11Q4 12Q4
Taxes (lhs)Other net current transfers received (lhs)Net property income received excl dividends paid (lhs)Operating surplus (lhs)Profits(rhs)(2)
(1) Profits in of GVA Source Federal Reserve Board US Bureau of Economic Analysis DG ECFIN calculations
Unlike operating surplus income tax payments and net income from non-operational activities did not differ significantly between the euro area and the United States (56) In both economies lower corporate tax payments resulting from lower profits generated by NFCs naturally had a positive impact on the cumulative change in profits from the pre-crisis peak
Differences in labour market developments are at the root of differences in profitability
Differences in operating surplus and profitability between the United States and the euro area can be attributed partly to differences in the business cycle In 2011Q1 NFCsrsquo gross value added was still 12 below its pre-crisis peak in the euro area but 11 above in the United States The main channel through which cyclical developments can affect operating surplus is the labour market
(56) In fact the ratio of profit tax payments to profits (a crude measure of an aggregate tax rate) in the euro area and the United States has been almost the same since the start of the crisis falling substantially in 2008-09 indicating that tax policy was not more favourable for profits in one economy than in the other
42 | Quarterly Report on the Euro Area
The cyclicality of operating surplus depends on the impact of the cycle on labour productivity as well as on wages The worse performance of operating surplus in the euro area since 2008 as compared with that in the United States reflects a stronger deterioration in labour productivity accompanied by unfavourable developments in wages per employee
Labour productivity growth in the euro area turned sharply negative in 2009 opening a big gap with the positive (albeit modest) wage growth (Graph II44) In the United States on the other hand labour productivity growth became negative earlier but to a lesser extent and some downward wage adjustment took place in 2009
Graph II44 Labour productivity and wages euro area and US
(2001Q4-2013Q3 y-o-y change)
-4
-3
-2
-1
0
1
2
3
4
5
01Q4 03Q2 04Q4 06Q2 07Q4 09Q2 10Q4 12Q2
Average wage per employee euro area (1) (2)Average wage per employee US (1)Labour productivity euro area (2) (3)Labour productivity US (3)
(1)Real wages calculated by the GDP deflator(2)Euro area excluding Latvia(3)In terms of total employment (thousands) Source Eurostat US Bureau of Economic Analysis US Bureau of Labour Statistics DG ECFIN calculations
There are a number of reasons for the different labour adjustments in the euro area and the United States In the former apart from a higher level of employment protection short-term work schemes were put in place in the early stages of the crisis (57) In addition as labour force adjustment tends to be more costly in the euro area some firms (particularly small firms and those with highly qualified employees) preferred to retain their
(57) According to the OECD Public short-term work schemes have
played an important role in preserving jobs during the crisis in a number of countries although significant hours reductions were also achieved via lower overtime hours hours averaging arrangements and employer initiatives see OECD Employment Outlook 2010 ndash Moving Beyond the Job Crisis
labour force (58) Because of a lack of wage flexibility the higher degree of lsquolabour hoardingrsquo in the euro area came at the expense of lower operating surplus and profits and consequently put a downward pressure on the capacity accumulate internal funds to deleverage
Corporate savings are much lower in the euro area
Negative developments in euro area corporate profitability were reflected in corporate savings which together with physical investment determines the internal funds available for balance sheet adjustment In 2009-10 there was a sharp drop in euro area savings because profits acted as shock absorbers and fell more rapidly than dividend payments leaving less spare cash available In contrast savings by US NFCs increased substantially on rising profits after an early-crisis low point and reached a historically high level of around 23 of GVA in 2010Q3 (Graph II45)
Graph II45 Savings of NFCs (2000Q1- 2013Q3 of GVA)
15
16
17
18
19
20
21
22
23
24
00Q1 01Q3 03Q1 04Q3 06Q1 07Q3 09Q1 10Q3 12Q1 13Q3
Euro area (1)
US
(1)Euro area excluding Latvia Source Eurostat Bureau of Economic Analysis DG ECFIN calculations
The impression that US corporate behaviour has been more geared towards accumulating savings than that in the euro area is reinforced when one looks at dividend distribution Dividends paid by euro area NFCs have been on a declining trend since the start of the crisis but those paid by US firms have also decreased This is remarkable given (58) See Box 12 Labour hoarding across different types of firms in
OECD Employment Outlook 2010 ndash Moving Beyond the Job Crisis
II Special topics on the euro area economy
Volume 13 No 1 | 43
the positive profit developments in the United States (Graph II46) A drop in dividends alongside profit growth suggests that after 2008 US companies preferred to direct a bigger proportion of the profit recovery to corporate savings and thereby balance sheet adjustment The ratio of dividends to profits in the United States has fallen from about one third before the crisis to one quarter now This ratio also dropped in the euro area although by less (59)
Graph II46 Dividends paid of NFCs (2000Q1-2013Q3 of GVA)
0
5
10
15
20
25
00Q1 01Q3 03Q1 04Q3 06Q1 07Q3 09Q1 10Q3 12Q1 13Q3
Euro area (1)
US
(1)Euro area excluding Latvia Source Eurostat Federal Reserve Board DG ECFIN calculations
Disappointing physical investment in the euro area and the United States
Cutting investment in physical assets is another way of reducing excessive indebtedness Corporate investment as a proportion of activity dropped sharply both in the euro area and in the United States in the early stages of the crisis (Graph II47)
After a modest recovery in 2010-11 the investment rate decreased again in the euro area The investment recovery was more solid in the United States but has lost momentum since the end of 2012 and the investment rate remains below its pre-crisis peak Overall it seems that euro area corporations partly compensated for less supportive savings developments than in the US by
(59) Dividend payments are not the only way of distributing profits to shareholders Equity buybacks can also be used for this purpose and firms that choose this option will tend to have higher savings and lower dividends paid
curbing physical investment more than their US counterparts
Graph II47 Investment of NFCs (2000Q1- 2013Q3 of GVA)
15
16
17
18
19
20
21
22
23
24
00Q1 01Q3 03Q1 04Q3 06Q1 07Q3 09Q1 10Q3 12Q1 13Q3
Euro area (1)
US
(1)Excluding Latvia Source Eurostat US Bureau of Economic Analysis DG ECFIN calculations
A more modest increase in net lending in the euro area than in the US
Since 2013 firmsrsquo net lending in the euro area has been in positive territory but substantially less so than that in the United States (Graph II48) Positive NLB in the euro area unlike that in the United States is mostly due to a low investment rate alone rather than low investment combined with high savings The combination of disappointing investment and high savings has translated into historically high and sustained NLB for US firms
This persistent net lending position in the United States is atypical as firms usually invest more than they save It suggests that US firms have been adjusting their balance sheets significantly since the beginning of the crisis via their internal funds while euro area firms seem to have opted for much slower balance sheet adjustment
44 | Quarterly Report on the Euro Area
Graph II48 Net lendingborrowing of NFCs
(2000Q1- 2013Q3 of GVA)
-10
-8
-6
-4
-2
0
2
4
6
8
00Q1 01Q3 03Q1 04Q3 06Q1 07Q3 09Q1 10Q3 12Q1 13Q3
Euro area (1)
US
(1)Excluding Latvia Source Eurostat US Bureau of Economic Analysis DG ECFIN calculations
Debt deleveraging has been more pronounced in the US than in the euro area
The faster pace of adjustment of balance sheets in the United States is confirmed by the corporate debt data (Graph II49) (60) (61) While both the euro area and the United States entered the crisis with swiftly rising and historically high levels of debt deleveraging has progressed more rapidly in the latter since the crisis By the beginning of 2012 US corporate debt had fallen by approximately 15 pp as a proportion of activity while euro area debt had dropped by 7 pp (62)
(60) Non-financial corporate debt consists of loans and securities
other than shares (corporate bonds) both can be classified as short- or long-term depending on whether their original maturity is less or more than one year
(61) This section analyses developments in non-consolidated financial flows and stocks in the euro area and in the United States for two reasons it is important to have a sense of financial positions within the institutional sector eg loans between NFCs are an important part of intra-firm relationships as head offices use them to finance subsidiaries for example perhaps for tax reasons This is relatively more important in the euro area than in the United States Consolidated financial asset and flow data eliminate these intra-sector positions and different approaches may be taken to consolidation as in the euro area there is the additional issue of cross-border consolidation between Member States while there is no need for flows and positions between firms in different US states to be treated separately
(62) The debt-to-equity ratio is another measure of corporate leverage widely followed by investors Faster stock market recovery helped US firms reduce this ratio more than those in the euro area
Graph II49 Debt levels of NFCs(1) (1999Q1-2013Q3 of GVA)
100
120
140
160
180
200
220
99Q1 00Q3 02Q1 03Q3 05Q1 06Q3 08Q1 09Q3 11Q1 12Q3
Euro area (2)
US
(1)Securities other than shares and loans(2)Excluding Latvia Source Eurostat US Bureau of Economic Analysis DG ECFIN calculations
Firms in the euro area and the United States entered the crisis with almost the same level of short-term debt as a proportion of total debt Since the crisis the adjustment away from short-term debt has been significantly more pronounced in the United States suggesting more active balance sheet restructuring
Graph II410 Debt flows of NFCs(1) (1999Q1- 2013Q3 of GVA)
-15
-10
-5
0
5
10
15
20
99Q1 01Q1 03Q1 05Q1 07Q1 09Q1 11Q1 13Q1
Euro area bonds (2)
US bonds
Euro area loans (2)
US loans
(1)Securities other than shares and loans (2)Excluding Latvia Source Eurostat US Bureau of Economic Analysis DG ECFIN calculations
Due to differences in the structure of corporate finance loans (as opposed to bonds) tend to form a bigger proportion of debt in the euro area than in the United States An important element of the
II Special topics on the euro area economy
Volume 13 No 1 | 45
corporate balance sheet adjustment process in both economies has been a movement away from an excessive reliance on loans (Graph II410) and towards bond financing This trend has been substantially more pronounced in the United States presumably reflecting the fact that bond markets are more developed in that country
Developments in non-financial corporate debt were also influenced by developments in financial intermediation in particular in the banking sector Financial accounts show NFCsrsquo debt exposure but do not indicate whether the debt holder is a bank According to bank balance sheet statistics the nominal growth of loans vis-agrave-vis NFCs has been mostly negative in the euro area since 2009Q4 (Graph II411) Coupled with the positive loan inflows seen in the national accounts between 2010Q3 and 2012Q3 (Graph II410) this shows a degree of substitution in corporate loan liability ownership between banks and other financial firms and sectors (including other NFCs) in this period According to the counterparty breakdown of NFC domestic loans published by the ECB corporate borrowings from other NFCs represented 29 of all loans by 2013Q3 (up from 26 in 2008Q1) while the proportion of borrowings from monetary financial institutions (MFIs) had dropped (from 60 in 2008Q1) to an all-time low of 53 The proportion of loans from other non-bank financial intermediaries also increased There is less evidence of a shift from banks to other loan providers in the United States where loans between NFCs are much more limited
Graph II411 Bank loans to NFCs (1999Q1- 2013Q3 y-o-y change)
-20
-15
-10
-5
0
5
10
15
20
25
99Q1 00Q3 02Q1 03Q3 05Q1 06Q3 08Q1 09Q3 11Q1 12Q3
Euro area bank loans to NFCs (1)US bank loans to NFCs
(1)Excluding Latvia Source ECB US Federal Reserve Board DG ECFIN calculations
Positive NLB has been used to acquire safe financial assets in both regions
In both the euro area and the United States the positive NLB has been used to deleverage but also to invest in safe financial assets At the beginning of the crisis much of the positive corporate NLB in the United States was invested in money market mutual funds which is essentially investment in short-term low-risk assets (Graph II412) (63)
Currency and deposits (another type of safe asset) have increased substantially in the euro area in recent years as a proportion of total firm activity (Graph II413) This rise was driven almost exclusively by a rapid increase in firmsrsquo savings deposits To some extent a similar trend is observable in the United States In particular US cash balances (a sub-component of currency and deposits) approached 12 of GVA by the end of 2013 a level not seen since the early 1990s On the other hand savings deposits have grown more modestly resulting in a moderately positive overall trend in currency and deposits
Graph II412 Mutual fund shares of NFCs (1999Q1- 2013Q3 of GVA)
0
2
4
6
8
10
12
14
99Q1 01Q1 03Q1 05Q1 07Q1 09Q1 11Q1 13Q1
Euro area (1)
US (2)
(1)Excluding Latvia(2)In the USA these asset series can be broken down into investment in money market mutual funds and investment in other mutual funds The 2009-11 increase is fully attributable to the former Source Eurostat US Bureau of Economic Analysis DG ECFIN calculations
Overall these two aspects of corporate financial investment behaviour signify considerable liquidity concerns on the part of firms in both the euro area
(63) Euro area financial accounts only show firmsrsquo investment in mutual funds overall and do not distinguish between types of mutual funds
46 | Quarterly Report on the Euro Area
and the United States They also represent a drive towards lower-risk assets perhaps indicating increased risk aversion by corporations or a tendency to postpone physical investment in a context of perceived high uncertainty
Graph II413 Currency and deposits ndash NFCs
(1999Q1- 2013Q3 of GVA)
0
5
10
15
20
25
30
35
40
45
99Q1 00Q3 02Q1 03Q3 05Q1 06Q3 08Q1 09Q3 11Q1 12Q3
Euro area (1)
US
(1)Excluding Latvia Source Eurostat US Bureau of Economic Analysis DG ECFIN calculations
Conclusion
Although both regions saw similar steep rises in corporate debt in the pre-crisis years balance sheet adjustment since the crisis has been significantly slower in the euro area than in the United States The more rapid adjustment in the United States can be explained by a stronger cyclical recovery more supportive profitability developments and reduced dividend payment ratios In the euro area profitability has been hindered by a combination of lower flexibility in the labour markets and slow wage adjustment
The slower balance sheet adjustment in the euro area corporate sector is visible in a slower fall in indebtedness but also a slower adjustment of the structure of balance sheets In particular the shift from loans to bonds and the extension of debt maturity have been more pronounced in the United States In both regions firms have used their positive NLB to accelerate the accumulation of safe and liquid financial assets This could reflect continuing uncertainty regarding future demand and growth prospects
Overall the evidence discussed in this section shows that euro area firms are lagging significantly behind their US counterparts in terms of balance sheet consolidation Given that investment rates remain disappointing even in the more advanced US corporate sector a degree of caution appears warranted when assessing short-term prospects for corporate investment in the euro area
III Recent DG ECFIN publications
Volume 13 No 1 | 47
1 Occasional Papers
European Economy Occasional Papers 170 January 2014 Financial Assistance Programme for the Recapitalisation of Financial Institutions in Spain Fifth Review ndash Winter 2014 httpeceuropaeueconomy_financepublicationsoccasional_paper2014pdfocp170_enpdf
European Economy Occasional Papers 169 December 2013 The Economic Adjustment Programme for Cyprus Second Review ndash Autumn 2013 httpeceuropaeueconomy_financepublicationsoccasional_paper2013pdfocp169_enpdf
European Economy Occasional Papers 168 December 2013 Fiscal frameworks in the European Union ommission services country factsheets for the Autumn 2013 Peer Review httpeceuropaeueconomy_financepublicationsoccasional_paper2013pdfocp168_enpdf
European Economy Occasional Papers 167 December 2013 Economic Adjustment Programme for Ireland - Autumn 2013 Review httpeceuropaeueconomy_financepublicationsoccasional_paper2013pdfocp167_enpdf
European Economy Occasional Papers 166 December 2013 Progress towards meeting the economic criteria for EU accession the EU Commissionrsquos 2013 assessments httpeceuropaeueconomy_financepublicationsoccasional_paper2013pdfocp166_enpdf
European Economy Occasional Papers 165 November 2013 Romania Balance-of-Payments Assistance Programme 2013-2015 httpeceuropaeueconomy_financepublicationsoccasional_paper2013pdfocp165_enpdf
European Economy Occasional Papers 164 November 2013 The Economic Adjustment Programme for Portugal Eighth and Ninth Review httpeceuropaeueconomy_financepublicationsoccasional_paper2013pdfocp164_enpdf
European Economy Occasional Papers 163 November 2013 Financial Assistance Programme for the Recapitalisation of Financial Institutions in Spain Fourth Review ndash Autumn 2013 httpeceuropaeueconomy_financepublicationsoccasional_paper2013pdfocp163_enpdf
European Economy Occasional Papers 162 October 2013 Economic Adjustment Programme for Ireland Summer 2013 Review httpeceuropaeueconomy_financepublicationsoccasional_paper2013pdfocp162_enpdf
2 Economic papers
European Economy Economic Papers 514 February 2014 Martin Larch Kristin Magnusson Bernard Balint Tatar Hard work and More How to successfully conduct adjustment with official assistance httpeceuropaeueconomy_financepublicationseconomic_paper2014pdfecp514_enpdf
European Economy Economic Papers 513 February 2014 Florian Woumlhlbier Caterina Astarita Gilles Mourre Consolidation on the revenue side and growth-friendly tax structures an indicator based approach httpeceuropaeueconomy_financepublicationseconomic_paper2014pdfecp513_enpdf
48 | Quarterly Report on the Euro Area
European Economy Economic Papers 512 December 2013 Alexander Schwan Etienne Sail Assessing the economic and budgetary impact of linking retirement ages and pension benefits to increases in longevity httpeceuropaeueconomy_financepublicationseconomic_paper2013pdfecp512_enpdf 3 Other publications
Winter forecast 2014 - EU economy recovery gaining ground httpeceuropaeueconomy_financepublicationseuropean_economy2014pdfee2_enpdf 4 Regular publications
Business and Consumer Surveys (harmonised surveys for different sectors of the economies in the European Union (EU) and the applicant countries) httpeceuropaeueconomy_financedb_indicatorssurveysindex_enhtm Business Climate Indicator for the euro area (monthly indicator designed to deliver a clear and early assessment of the cyclical situation) httpeceuropaeueconomy_financedb_indicatorssurveysdocuments2013bci_2013_11_enpdf Key indicators for the euro area (presents the most relevant economic statistics concerning the euro area) httpeceuropaeueconomy_financedb_indicatorskey_indicatorsindex_enhtm Monthly and quarterly notes on the euro-denominated bond markets (looks at the volumes of debt issued the maturity structures and the conditions in the market) httpeceuropaeueconomy_financepublicationsbond_marketindex_enhtm Price and Cost Competitiveness httpeceuropaeueconomy_financedb_indicatorscompetitivenessindex_enhtm
50 | Quarterly Report on the Euro Area
Editor-in-Chief Elena Flores
Overall coordination Eric Ruscher
Data assistance Christos Zavos
Comments on the report would be gratefully received and should be sent to
Elena Flores Director ndash Policy Strategy and Coordination Directorate-General for Economic and Financial Affairs Office CHAR 1566
B-1049 Brussels
Email elenafloreseceuropaeu
or
Eric Ruscher Head of Unit ndash Macroeconomy of the euro area Directorate-General for Economic and Financial Affairs Office CHAR 15248
B-1049 Brussels
Email ericruschereceuropaeu
HOW TO OBTAIN EU PUBLICATIONS Free publications bull one copy
via EU Bookshop (httpbookshopeuropaeu) bull more than one copy or postersmaps
from the European Unionrsquos representations (httpeceuropaeurepresent_enhtm) from the delegations in non-EU countries (httpeeaseuropaeudelegationsindex_enhtm) by contacting the Europe Direct service (httpeuropaeueuropedirectindex_enhtm) or calling 00 800 6 7 8 9 10 11 (freephone number from anywhere in the EU) () () The information given is free as are most calls (though some operators phone boxes or hotels may charge you)
Priced publications bull via EU Bookshop (httpbookshopeuropaeu) Priced subscriptions bull via one of the sales agents of the Publications Office of the European Union
(httppublicationseuropaeuothersagentsindex_enhtm)
KC-AK-14-001-en-n
- Blank Page
- Blank Page
- Blank Page
- Blank Page
-

I The drivers of total factor productivity in catching-up economies
Volume 13 No 1 | 15
Box (continued)
(Continued on the next page)
16 | Quarterly Report on the Euro Area
Box (continued)
(Continued on the next page)
I The drivers of total factor productivity in catching-up economies
Volume 13 No 1 | 17
Box (continued)
(Continued on the next page)
18 | Quarterly Report on the Euro Area
The interaction models reveal that the impact of the structural variables also seems to be conditional on the spillover channel ie the growth rates of the economies with the highest TFP level Stricter employment protection legislation an increase of the corporate income tax rate or a higher old age dependency ratio all have a detrimental impact on TFP growth when the TFP growth rate of the technology leader is high Since sectors closely related to ICT appear to show the highest growth rates over the sample period the findings implicitly suggest that these sectors tend to react strongest to changes in labour market flexibility tax regimes and population ageing The effect from improving the effectiveness of governments by contrast seems to be of great importance for all sectors Finally product market regulation does not seem
to matter for TFP growth irrespective of the growth rate of the leading economy
Applying the findings of the panel regressions conducted for up to 20 economies to the euro area economies allows for the following tentative conclusions
bull The TFP divergence between euro area catching-up economies relative to the rest of the euro area in the decade preceding the global financial and economic crisis can be partly explained by the following indicators a weakening of the convergence channel lower spending on innovation activities such as RampD and ICT deteriorating government effectiveness and faster population ageing
Box (continued)
I The drivers of total factor productivity in catching-up economies
Volume 13 No 1 | 19
bull Looking forward policy measures that fosterinnovation activities reduce the restrictivenessof employment protection legislation lowercorporate tax rates and improve governmenteffectiveness could help promote TFP growthin the euro area catching-up economies
bull It is worth stressing that according to theregression results employment protectionlegislation has not contributed to the TFPdivergence process since euro area catching-upeconomies did not fall behind the rest of theeuro area in this respect between 1994 and2007 Similarly corporate tax policy does notseem to have been a source of divergence overthat period Nevertheless the regression resultsalso indicate that policy action in those twoareas could improve TFP growth in thecatching-up countries as well as in the rest ofthe euro area
I5 Conclusions
The TFP income convergence process in the euro area weakened in the decade preceding the economic and financial crisis mainly due to weak TFP growth in catching-up economies In fact the gap between euro area catching-up economies and technological leaders actually widened in a broad range of sectors
The persistence of the technology gap since the mid-1990s suggests that the causes are deep-rooted and at least partly structural The econometric analysis presented in this focus section shows that the TFP divergence between euro area catching-up economies and the rest of the euro area can be partly explained by the following indicators a weakening of the convergence channel lower spending on innovation activities such as RampD and ICT deteriorating government effectiveness and faster population ageing
In response to the crisis catching-up countries have put in place a broad range of reforms aimed at improving framework conditions labour market flexibility and the efficiency of the business environment These are likely to raise TFP growth rates in the years to come
However since catching-up is shown to be more difficult for economies approaching the technological frontier the adoption of further structural measures would also help more advanced countries accelerate their TFP convergence In particular measures that foster innovation activities reduce further the restrictiveness of employment protection legislation lower corporate tax rates and improve government effectiveness appear to be the most effective at promoting TFP growth
II Special topics on the euro area economy
Volume 13 No 1 | 21
II1 New estimates of Phillips curves and structural unemployment in the euro area (15)
The Phillips curve can be used to estimate the non-cyclical part of unemployment In such models this estimate is commonly referred to as the lsquonon-accelerating wage rate of unemploymentrsquo (NAWRU)(16) The Phillips curve can be specified in various ways reflecting different assumptions regarding the formation of expectations DG ECFIN has recently extended its framework to cover rational expectations This section looks at the sensitivity of the results to alternative expectation assumptions reporting NAWRU estimates based on Phillips curves produced using rational expectations and those (as used to date) allowing only for static or adaptive expectations
Our findings show that for the euro area as a whole the alternative expectation assumptions yield similar NAWRU estimates In particular the NAWRU appears to have increased recently suggesting a deterioration of labour market performance beyond what could be considered merely cyclical For Spain however the results vary more depending on the assumptions used The Phillips curve based on rational expectations points to a more moderate NAWRU increase than that used by DG ECFIN to date However all estimates point to a substantial post-crisis increase in the NAWRU for Spain
In interpreting the rise in the NAWRU it is important to bear in mind that both structural and non-structural factors are driving developments Analysis shows that in the presence of rigidities crisis-related events can have temporary but long-lasting effects on labour market performance Structural factors can play a role too as illustrated by the steady decline in the NAWRU in Germany which appears to be related to structural effects brought about by the Hartz reforms
-------------------------------
(15) Section prepared by Fabrice Orlandi (16) The Phillips curve features a relationship between the
unemployment gap and an inflation or labour-cost variable In the case of the former the non-cyclical unemployment estimate obtained is usually referred to as the lsquonon-accelerating inflation rate of unemploymentrsquo (NAIRU) while with the latter it is referred to as the lsquonon-accelerating wage rate of unemploymentrsquo (NAWRU)
Introduction
Unemployment rates increased sharply in the euro area in the wake of the crisis and the surge has proved particularly persistent Assessing this development is of paramount importance to policy-makersrsquo efforts to find adequate responses to the effects of the crisis
The non-cyclical part of unemployment play a key role in this assessment as it identifies the proportion of the deterioration that is likely to last beyond the business cycle In the EU context this indicator is particularly important as it is a factor to be fed into the potential output calculations used to compute cyclically-adjusted fiscal figures important benchmarks for country surveillance under the EUrsquos fiscal framework(17)
The non-cyclical part of unemployment is not an observable variable however and has to be estimated which means that it is subject to uncertainty In part the uncertainty stems from the fact that different estimation models are available The Phillips curve is commonly used as a key element in estimation models(18) but can itself be specified in various ways most notably reflecting alternative assumptions as to the formation of expectations(19)
This section sets out DG ECFINrsquos approach to estimating the non-cyclical part of unemployment in particular in its use of the Phillips curve We also investigate the sensitivity of the results to alternative expectation assumptions highlighting the results obtained for the case of rational expectations the case recently incorporated in DG ECFINrsquos estimation framework
The results presented here focus on the euro area but results are also reported for Spain and Germany two countries that have witnessed starkly different non-cyclical unemployment developments
(17) For details on the EUrsquos SGP framework see Vademecum on the Stability and Growth Pact European Economy mdash Occasional Paper No 151 DG ECFIN European Commission May 2013
(18) For an illustration of structural unemployment analysis based on an alternative concept see eg Unemployment dynamics during recessions and recoveries Okunrsquos law and beyond IMF WEO April 2010
(19) For details on the Phillips curve see Fuhrer J YK Kodrzycki GP Olivei and J Sneddon Little Understanding inflation and the implication for monetary policy mdash a Phillips curve retrospective MIT Press 2009
22 | Quarterly Report on the Euro Area
in the recent past We use long time series usually starting in 1965 to capture medium-term cycles The latest DG ECFIN forecasts are also included in the dataset
Alternative NAWRU models
Non-cyclical unemployment is estimated on the basis of models that pin-down its statistical and economic properties DG ECFINrsquos approach relies on an lsquounobserved componentrsquo model which features a Phillips curve The curve links cyclical unemployment (ie the unemployment gap) to labour cost developments while non-cyclical unemployment is assumed not to be affected by labour cost developments In this setting non-cyclical unemployment estimates are commonly referred to as the lsquonon-accelerating wage rate of unemploymentrsquo (NAWRU)(20)
The specification of the Phillips curve reflects particular assumptions made regarding inflation expectations In the past DG ECFINrsquos considered only static and adaptive expectations More recently the case of rational expectations has been added providing a more comprehensive framework (see Box II11)
More specifically the so-called traditional Keynesian Phillips (TKP) curve based on static or adaptive expectation assumptions a positive unemployment gap ( minus lowast) with a fall in the change of the growth rate of nominal unit labour cost (∆ ) (and vice versa) ∆ = minus ( minus lowast) The new Keynesian Phillips (NKP) curve based on rational expectations implies that a positive unemployment gap ( minus lowast) is associated with a fall in the growth rate of real unit labour cost (∆ ) Lagged effects are also relevant because some wage-setters may use ad hoc rules and not fully optimise = ∆ minus ( minus lowast)+ ( minus lowast ) (20) For further details on the DG ECFIN approach see DrsquoAuria F
C Denis K Havik K Mc Morrow C Planas R Raciborski W Roumlger and A Rossi (2010) The production function methodology for calculating potential growth rates and output gaps European Economy mdash Economic Paper No 420 DG ECFIN European Commission July 2010
These alternative Phillips curves thus rely on different labour cost indicators to determine the unemployment gap (and thus also the NAWRU) namely ∆ and ∆ As explained in Box II11 this does not mean that the models are fundamentally different Instead it illustrates the impact of assumptions as to expectation formation on the specification of the Phillips curve
NAWRU developments
For the euro area as a whole NAWRU estimates based on the TKP and the NKP show a similar pattern (see Graph II11)(21) The similarity suggests that for most countries in the euro area results are not overly sensitive to the specification of the Phillips curve (ie to assumptions as regards expectation formation) In practice it also suggests that alternative labour cost indicators (ie change in unit labour cost (ULC) growth and real unit labour cost (RULC) growth) underwent broadly similar developments in the euro area this is confirmed by the top chart in Graph II12
Graph II11 shows that non-cyclical unemployment in the euro area posted a steady increase up to the mid-90s followed by an improvement that was then halted by the recent crisis The recent rise in the NAWRU suggests that the increases in unemployment seen in the aftermath of the crisis are to some extent likely to last beyond the cyclical upturn
Graph II11 also shows NAWRU developments for Spain and Germany illustrating the diversity within the euro area Spain has witnessed developments that have been similar to though more dramatic than those in the euro area as a whole Germany posted a starkly different profile with its NAWRU falling steadily (from 2002 according to the NKP or 2004 according to the TKP)
As regards sensitivity the NAWRU estimates for Spain vary considerably depending on the specification With the NKP the recent increase is more moderate with the NAWRU reaching 220 by 2015 while the estimated level with the TKP is 264 Recent results for Germany are less sensitive to assumptions regarding expectations (21) NAWRUs referred to in this section are those computed for the
Commissionrsquos 2014 winter forecast Latest available NAWRUs can be downloaded from the AMECO database httpeceuropaeueconomy_financeameco
II Special topics on the euro area economy
Volume 13 No 1 | 23
with the two Phillips curve specifications producing similar NAWRUs However around
Graph II11 Alternative NAWRU estimates euro area Germany and Spain (1)
(1965-2015 in )
(1)GDP weighted average of euro-area countries for which alternative NAWRUs have been computed (ie AT BE DE EL ES FI FR IE IT NL and PT) For AT both NAWRUs are based on the backward-looking model as the forward-looking model yields econometrically unsatisfactory results (2)Component of the NAWRU explained only by structural determinants (see Orlandi (2012) op cit) Source DG ECFIN calculations based on Eurostat data
2005 some difference across the two specifications is observed for Germany with the NKP producing a relatively less volatile NAWRU Given that the current NAWRU estimates for Germany based on the TKP and NKP specifications do not diverge greatly and taking into account the stability considerations in moving to a new specification Germany continues to use the TKP specification
NAWRU differences for Spain depending on the curve specification stem from corresponding differences between the labour cost indicators used Graph II12 shows that recently RULC growth posted greater and more persistent moderation in Spain than change in nominal ULC growth For Germany the indicators have followed more similar paths over recent years (as they have in the euro area as a whole) More fundamentally in times of heightened economic volatility andor big labour market adjustments (eg recent crisis Hartz reforms) the TKP model is likely to yield NAWRUs that are more pro-cyclical as it does not take full account of the price rigidities that play an important role in the adjustment process of the labour market These rigidities are better reflected in the NKP model
To sum up except in the case of Spain recent NAWRU estimates for the euro area do not appear to be sensitive to assumptions as regards expectations with alternative Phillips curve specifications yielding similar results Overall results point to a recent increase in the NAWRU across the euro area with the notable exception of Germany A rise in the NAWRU points to persistent deterioration in labour market performance Identifying the causes of the deterioration calls for cautious interpretation however
NAWRU versus Structural Unemployment
Understanding the sharp and protracted rise in unemployment in the wake of the crisis is of paramount importance from a policy perspective What caused the rise Is it a sign of structural deterioration Or is it purely cyclical reflecting the prolonged slowdown These questions are the subject of lively debate with views ranging from lsquoitrsquos all demandrsquo(22) to lsquoitrsquos allmostly structuralrsquo(23)
(22) See eg Krugman P (2010) Debunking the structural unemployment myth New York Times 28 September 2010
24 | Quarterly Report on the Euro Area
(23) See eg Kocherlakota N (2010) Inside the FOMC speech at
Marquette Michigan 17 August 2010
(Continued on the next page)
II Special topics on the euro area economy
Volume 13 No 1 | 25
In particular changes in the NAWRU are sometimes interpreted as a sign of a structural change Careful analysis of developments in the NAWRUs produced by DG ECFIN shows that they can be driven by both structural and non-structural factors(24)
In particular crisis-related shocks (eg unwinding of unsustainable developments) especially boom-bust episodes in the housing market that can trigger a lengthy process of deleveraging in the construction sector have a statistically significant impact on the NAWRU The real interest rate and Total Factor Productivity (TFP) growth which controls more generally for the presence of such shocks also play a part in driving NAWRU develpoments
At a theoretical level adding various rigidities (eg real wage rigidity cyclical price mark-ups or sluggish adjustment of the reservation wage) to the traditional labour market model can be shown to yield a NAWRU that is not solely determined by structural factors
Despite uncertainties the NAWRU remains a useful policy indicator It is a well-defined concept that provides useful information on the nature of unemployment rate developments In particular it identifies risks of persistent labour market deteriorations that may not always be caused by structural phenomena(25)
In this context it appears useful to distinguish between the NAWRU and a narrowly defined notion of structural unemployment affected only by structural factors as shown in Graph II11 by
(24) For further details see Orlandi F (2012) Structural unemployment and its determinants in the EU countries European Economy mdash Economic Paper No 455 DG ECFIN European Commission May 2012
(25) For further details see Cyclical and structural unemployment in the euro area in Labour Market Developments in Europe 2013 European Commission
the lsquostructural unemploymentrsquo series The latter represents the portion of the NAWRU that according to econometric results appears to be explained by structural features of the labour market As can be seen the series has remained broadly stable during the crisis Except for a notable decline due to structural labour market reforms in Germany change in the NAWRU in the euro area is not related to structural change This is also the case in Spain where structural unemployment has remained broadly stable
Recent increases in the euro-area NAWRU should therefore not be interpreted as a sign of big structural change at the current juncture Rather in most countries the increases reflect the effects of shocks that in the presence of various rigidities have a long-lasting impact on unemployment rates
To sum up the decline in the NAWRU at euro-area level and in countries like Spain in the run-up to the crisis appears mostly attributable to non-structural factors such as unsustainable developments in the housing sector The build-up and subsequent unwinding of imbalances has caused large economic shocks (eg need for sectoral reallocation) which have a persistent effect on the performance of the labour market However in some countries structural factors have also played a role in driving NAWRU developments In Germany for example the decline in the NAWRU seems related to some aspects of the Hartz reforms (eg the change in the period of eligibility for unemployment benefit appears to have contributed to a decline of the NAWRU over recent years) This suggests that large-scale reforms as currently being enacted in some countries will tend to translate into a gradual lowering of the NAWRU over coming years For example recent efforts in Ireland to bring down the labour tax wedge appear to be contributing to more favourable NAWRU developments A number of countries (eg France) have failed to
Box (continued)
26 | Quarterly Report on the Euro Area
post similar improvements in their underlying labour market structures
Graph II12 Alternative labour cost signals for the euro area Germany and Spain (1)
(1965-2014)
(1)GDP-weighted average of euro-area countries for which alternative NAWRUs have been computed (ie AT BE DE EL ES FI FR IE IT NL and PT) (2)Private consumption deflated ULC Source DG ECFIN calculations based on Eurostat data
Conclusions
Alternative Phillips curve specifications based on different assumptions regarding expectation formation point to broadly similar NAWRU results for the euro area Estimates point to a recent rise in the NAWRU suggesting that post-crisis unemployment increases are to some extent persistent
In the case of Spain alternative Phillips curve specifications yield somewhat different NAWRU results pointing to the current importance for that country of theoretical considerations regarding expectations The NKP which uses rational expectations and relies on RULC growth to identify the unemployment gap yields a more moderate NAWRU increase over recent years than the TKP (hitherto used by DG ECFIN) which allows only for static or adaptive expectations and relies on the signal provided by the change in nominal ULC growth While this sensitivity in the results underlines the need for caution in interpreting NAWRU estimates it should also be borne in mind that all specifications point to an important increase in the NAWRU for Spain at this juncture
The deterioration in the NAWRU signals difficulties that are likely to last beyond the cyclical upturn In interpreting those developments it is important to recognise that changes in the NAWRU can be caused by both structural and non-structural factors While the improvement in the NAWRU in Germany seems to be caused by structural factors the deterioration in Spain seems to be caused more by crisis-related events that have persistent effects due to the presence of various rigidities that tend to slow down the adjustment process
II Special topics on the euro area economy
Volume 13 No 1 | 27
II2 The relationship between government and export sector wages and implications for competitiveness (26)
In 2012 the general government sector employed on average about 15 of the labour force in the euro area Since most countries in the euro area are now trying to consolidate public finances whilst also trying to boost competitiveness for external rebalancing and to reduce unemployment it is crucial to assess whether there is any wage spillover from the public to the export sector in particular under conditions of fiscal stress This section shows that there has been a link between government and manufacturing wages over the long-run which is much closer when the government employs a large share of the labour force Government size dimension is especially important during fiscal consolidation If the government wage bill is inflated due to unjustified wage premia for example limiting government wage growth is a fiscal strategy that may among other effects deliver competitiveness gains that contribute to external rebalancing and help boost employment in the tradable sector
-----------------------
Introduction
General government employment accounts for a considerable share of the labour force in the euro area It stood at about 15 in 2012 with but some cross-country variation The evolution of government wages is likely to have an impact not only on fiscal variables and on the sustainability of public finances but also on the labour market on cost competitiveness and on external rebalancing within the euro area This section looks at the relationship between public and private sector wages at a time when most euro area countries are trying to consolidate their public finances improve competitiveness to support external rebalancing whilst also having to tackle high unemployment levels (27)
Changes in general government compensations may spill over into the private sector through both
(26) Section prepared by Benedicta Marzinotto and Alessandro Turrini
(27) Throughout the section the public sector is referred to alongside general government which refers to public offices at all levels of government non-market public owned hospitals schools and social security organizations Thus the term public is used as a synonym for general government
market-based and institutional channels For example excessive government wages may crowd out private sector employment inflating cost conditions and leading to competitiveness losses (28) There are channels of transmission also in the opposite direction from the private to the government sector Wage growth linked to productivity improvements in the private sector can spill over into the public if there is labour mobility across sectors This can affect governments capacity to keep wage expenditure growth under control
Against this background this section analyses the relationship between general government and manufacturing wages in order to assess the potential for and conditions of a wage spillover from the insulated government sector to the export sector The relationship is analysed by looking at a sample of EU countries over the period 1980-2013 in a co-integration framework that makes it possible to distinguish between long-run and short-run effects The relationship between the two wages is also assessed for different fiscal scenarios differentiating between normal periods and periods of fiscal adjustment
The various forms the relationship takes
The relationship between public and private wages takes many forms It may be influenced by market forces andor by institutional features of the wage setting system in each country Changes in private wages can affect government wage growth in the following ways
bull Wage bargaining in the private sector has ademonstration effect on public wage-settersPerez and Sanchez (2011) find evidence ofsignalling by the private sector in thenegotiation phase in France and Germanybefore the EMU period (29) Signalling may bemotivated by envy effects that reflect thestrength of the wage-bargaining position (30) or
(28) See for example Alesina A and R Perotti (1997) The welfare state and competitiveness American Economic Review Vol 87 pp 921-939 Alesina A Ardagna S Perotti R and Schiantarelli F (2002) Fiscal policy profits and investment American Economic Review Vol 92(3) pp 571-589 Ardagna S (2004) Fiscal stabilizations when do they work and why European Economic Review Vol 48 pp 1047-1074
(29) Perez JJ and AJ Sanchez (2011) Is there a signalling role for public wages Evidence of the euro area based on macro data Empirical Economics Vol 41(2) pp 421-445
(30) Maffezzoli M (2001) Non-Walrasian labor markets and real business cycles Review of Economic Dynamics Vol 4(4) pp 860-
28 | Quarterly Report on the Euro Area
by the fact that the same trade union negotiates wages for both sectors
bull Wage-bargaining practices may explicitly or implicitly grant wage leadership to the private sector Under the Scandinavian wage-setting model the private export sector typically takes the lead dictating bargaining outcomes to other sectors including the public sector (31)
bull There may also be established practices and institutional mechanisms that make public wages responsive to private wage settlements usually those of the export sector This is the case if for example there is a formal rule under which the growth rate of private wages is automatically applied to public sector wages (32)
It is of course a two-way street Changes in government wages affect private wage growth in a number of ways
bull Wage adjustment in the public sector causes cross-sector labour shifts and a change in the private sectors labour supply As the supply of labour changes so does the competitive private sectors equilibrium wage
bull Adjustments to government wages affect the outside option of unionised private sector bargainers putting pressures on the bargaining process (33) with for example private sector workers tempted to move to the general government sector due to large public wage increases
892 Ardagna S (2007) Fiscal policy in unionized labor markets Journal of Economic Dynamics and Control Vol 31(5) pp 1498-1534
(31) For a review see Lindquist J and R Vilhemsson (2006) Is the Swedish central government a wage leader Applied Economics Vol 38 pp 1617-1625 Friberg K (2007) Intersectoral wage linkages the case of Sweden Empirical Economics Vol 32 pp 161-184 Traxler F and B Brandl (2012) Collective bargaining inter-sectoral heterogeneity and competitiveness a cross-national comparison of macroeconomic performance British Journal of Industrial Relations Vol 50(1) pp 73-98 Ramskloger P (2012) Is there a European wage leader Wage spillovers in the European Monetary Union Cambridge Journal of Economics Vol 36(4) pp 941-962 and (2013) The nationalndashtransnational wage-setting nexus in Europe What have we learned from the early years of monetary integration Journal of Common Market Studies Vol 51(5) pp 916-930
(32) For evidence on the Netherlands see Hartog J and H Oosterbeek (1993) Public and private sector wages in the Netherlands European Economic Review Vol 37(1) pp 97-114
(33) Afonso A and P Gomes (2008) Interactions between private and public sector wages ECB Working Paper No 971
bull Changes in public wages may be fully compensated in government budgets by changes in labour taxation that alter labour costs in the private sector (34) and might also affect union behaviour (35)
Co-movements between government and private wages may also take place in the absence of direct links when driven by factors common to both sectors For example public wages may be pro-cyclical and change in a manner similar to private wages over the cycle (36) Co-movements in aggregate wage series could be linked to developments common to both factors relating to the composition of the labour force
Testing the relationship between government and manufacturing wages
To analyse more systematically the long- and short-term effects of government wages on the export sector a cointegration approach is used linking manufacturing compensations to a number of determinants including compensation in the government sector The long-term relationship is analysed in terms of levels while the Error Correction Mechanism (ECM) equation makes it possible to estimate the short-term relation between export sector wage growth shocks in explanatory variables and their deviation from the long-term relationship The long-term relationship in also analysed in terms of levels using a dynamic ordinary least squares (DOLS) model and the results incorporated in an ECM model
Estimates were made on a sample of 17 EU countries for which data are available over the period 1980-2013 This has not only has the advantage of gaining degrees of freedom and reinforcing the results It also makes it possible to
(34) Holmlund B (1993) Wage setting in private and public sectors
in a model with endogenous government behaviour European Journal of Political Economy Vol 9(2) pp 149-162
(35) The spillover from the public to the private sector is likely to be mediated by the structure of wage-setting systems Alesina and Perotti (1997) find that increases in labour taxation do not necessarily lead to higher wage demands by unions in highly centralised bargaining systems as large wage setters would internalise the consequences from higher labour costs on employment
(36) For instance Lane (2003) and Lamo et al (2007) find that public wages are pro-cyclical because of discretionary fiscal expansion in good times Lane P (2003) The cyclical behaviour of fiscal policy evidence from the OECD in Journal of Public Economics Vol 87 pp 2661-2675 Lamo A Perez JJ Schuknecht L (2007) The cyclicality of consumption wages and employment of the public sector in the euro area ECB Working Paper No 757
II Special topics on the euro area economy
Volume 13 No 1 | 29
investigate the role of framework conditions in bringing the impact of general government to bear on manufacturing wages by means of appropriate sample splits Box II21 shows the estimation methodology and the results
Much of the variance in manufacturing wages is explained by variables usually used when estimating wage equations (ie the price level labour productivity and the unemployment rate) and by general government wage levels Both the long- and short-term elasticity of manufacturing wages with respect to government wages is estimated to be around 03-04 This tallies with the results of similar studies (eg Afonso and Gomes 2008) It works both ways general government wages also react to manufacturing wages They have a long-term elasticity of 08 and a short-term elasticity of 04 (37) This is consistent with the fact that it is more usual for the private sector than for the government to take the lead in terms of wages as the available literature also shows (38) The DOLS cointegration estimation delivers qualitatively identical results The results are still valid when the sample is restricted to just the euro area (39) The relationship tested on real wages is symmetrical because manufacturing wages respond to government wages whether they are increased or reduced
One hypothesis tested here is whether the size of the government sector determines the extent to which changes to government wages affect average conditions on the private market if for example there is cross-sector mobility In order to test how this market-based channel works the same EU sample is split into two groups of countries those in which the average share of government to total employment is above the whole EU samplersquos median and countries in which it is below the median Results show that in the long-run the impact of public on manufacturing wages is considerably higher in the case of large public sectors This divide disappears in the short-run In the opposite direction going from manufacturing to public wages the split does not produce differentiated results This confirms that government size matters when it comes to the public sectors long-term impact on the labour
(37) The results are not shown (38) Perez JJ and AJ Sanchez (2011) (39) Still it should be noted that the sample used excludes some key
countries in the euro area
market The DOLS methodology confirms these results (40)
Another hypothesis that is tested is whether the way wages are set in the public sector increases the chances of manufacturing wages reacting to government wages Broadly speaking two wage-setting systems may be identified
bull This first is that wages are mainly set on thebasis of collective bargaining
bull The second is that wages are set on the basis ofunilateral decision by the government (41)
The results show that the way wages are set does not fundamentally alter the relation between government and manufacturing wages in the long- or the short-term It is however interesting to note that across all methodologies used the relationship between manufacturing wages and labour productivity is weaker in countries characterised by a unilateral decision wage-setting system This is probably because in such a case the spillover from public to private wages is such that private wages tend to be misaligned with sectoral productivity This is not the case when government wages are set through a collective bargaining wage-setting system possibly because bargaining processes even in a particular type of insulated sector such as the public one reflect market forces more than a unilateral government decision
The relationship between government and manufacturing wages under fiscal stress
Most countries in the euro area have recently been trying to cut government wage bills by freezing wages cutting or retrenching specific indemnities or benefits (including bonuses andor holidays) or blocking turnover As a result the share of government compensations in total government spending has fallen Between 2008 and 2012 this fall was particularly sharp for Latvia Portugal and Romania followed by Hungary Spain Denmark and Estonia (Graph II21)
(40) The results from the DOLS are not shown (41) For a classification of EU wage-setting systems in the government
sector see European Commission Directorate for Economic and Financial Affairs (2014) Government wages and labour market outcomes Occasional Paper forthcoming
30 | Quarterly Report on the Euro Area
(Continued on the next page)
II Special topics on the euro area economy
Volume 13 No 1 | 31
Box (continued)
(Continued on the next page)
32 | Quarterly Report on the Euro Area
Box (continued)
II Special topics on the euro area economy
Volume 13 No 1 | 33
The recent crisis marked a watershed in the evolution of public compensations Between 1999 and 2007 relative government wage growth did not vary from cold-shower periods (or periods of more gradual fiscal consolidation) to periods of non-consolidation (42)
Graph II21 Change in the share of general government compensations to
total spending (2008-2012 in pp)
Source DG ECFIN calculations based on AMECO
Conversely starting with the 2008-2009 crisis compensations per employee in the government sector grew more slowly compared with those in the manufacturing sector and more clearly so during fiscal consolidation (Graph II22)
It is possible that under conditions of fiscal stress the relationship between government and export sector wages differs from that of normal periods This aspect has been neglected in previous analyses To shed some light on it Table II21 shows the correlation between government wage growth and manufacturing wage growth under alternative fiscal conditions (consolidation and non-consolidation) differentiating between countries with large and small public sectors The evidence shows that the two wages are closely related in periods of fiscal stress only if the government employs a large share of the labour forces This suggests that the possibility of
(42) By convention episodes of fiscal consolidation are defined as those during which the structural primary balance improves by at least 15 per cent of GDP in one year or at least 3 per cent in three years with a minimum improvement of 05 per cent in each year Such a definition makes it possible to distinguish between cases of cold-shower consolidation episodes and more gradual consolidation episodes
expenditure-based fiscal consolidation having the type of supply-side effects described in Alesina and Perotti (1997) Alesina et al (2002) and Ardagna (2004) may be a consequence of the size of the public sector among other things
Graph II22 Government and manufacturing compensations under
alternative fiscal conditions EU countries (1999-2007 and 2008-2012 avg annual change)
Source DG ECFIN calculations based on OECD
Table II21 Correlation between government and manufacturing
compensations growth under alternative fiscal conditions EU (1)
(1) Pearson correlation coefficients Sample EU countries (excluding AT BG CY DE EL LT LV MT RO SI) over 1980-2012 (1995-2012 in the case of CZ EE HU SK) Source DG ECFIN calculations based on OECD
Concluding remarks
Spillovers which are the result of high wages in the general government sector have been mentioned as one of the drivers of competitiveness losses in
34 | Quarterly Report on the Euro Area
some countries in the euro area before the crisis (43)
The results presented here speak to this debate and may be summarised as follows Government wage levels have a long-term impact on wages in the manufacturing sector even more so in countries in which the government sector employs a relatively large share of the labour force That said their short-term impact remains unaffected by the size of the public sector Looking at it the other way round manufacturing wages usually have a greater impact on government wages regardless of size This is arguably because private sector wage leadership is more common than public sector wage leadership
(43) Blanchard O (2007) Adjustment within the euro The difficult
case of Portugal in Portuguese Economic Journal 61 1-21
The way government wages are set also plays a role In collective bargaining systems not only are government and manufacturing wages related in both the long- and the short-term (as they are also when the government sets wages by unilateral decision) Also most importantly wages in the tradable sector are better aligned with labour productivity The evidence provided here indicates that if the government wage bill is inflated for example due to unjustified wage premia limiting public wage growth would spill over into the private export sector reducing labour costs and helping boost competitiveness and employment in the sector Whilst structural reforms including skill upgrading in manufacturing are an important and necessary ingredient for achieving non-reversible gains in competitiveness the adjustment of competitiveness through fiscal policy remains a complementary tool to deliver sustained external rebalancing
II Special topics on the euro area economy
Volume 13 No 1 | 35
II3 Latvia maintaining sustainable growth after the boom-bust years (44)
Latvia had been keen to join the euro area at the earliest opportunity with entry in January 2008 the clear target As the economy overheated however significant macro-economic imbalances accumulated which deferred these plans Between 2005 and 2007 unsustainable GDP growth went hand in hand with a mounting current account deficit and a housing market spiralling out of control When credit flows then abruptly reversed the countryrsquos GDP contracted dramatically Latvia was placed in the EUIMF-led financial assistance programme and was forced to carry out ambitious fiscal consolidation and structural reforms Reallocating resources to the tradable sector was the first important step on the road to an export-driven recovery Under the burden of deleveraging and consolidation the revival of domestic demand was slow at first From 2011 however supported by favourable labour market developments growth in demand has accelerated Latvia has reclaimed its position as the fastest-growing EU economy however the current level of growth is lower than the unstainable rates recorded in the boom years and it is now seen as sustainable Thanks to this balanced growth Latvia has not been subject to the MIP since its launch in 2012 Despite the financial assistance-supported measures to preserve equity the social burden of economic adjustment as evidenced by poverty social exclusion and emigration rates has been high but measures are being taken by the authorities to counter these effects Continued commitment to prudent fiscal policies will be critical for the countryrsquos economic future The use of macro-prudential tools to reduce the risks posed by large non-resident financial flows and the implementation of ambitious structural reforms will also play an important role
-----------------------
Introduction
To welcome Latvias recent adoption of the euro this section reviews the countrys recent boom-bust experience and discusses the challenges ahead
Five years ago it would have been difficult to imagine that Latvia would be able to fulfil the conditions for adopting the euro and enter the euro
(44) Section prepared by Gatis Eglitis and Christian Weise
area in January 2014 After EU accession in May 2004 significant macro-economic imbalances had started to accumulate on the back of an overheating economy and by autumn 2008 the country was on the brink of bankruptcy A painful and seemingly impossible economic adjustment to be achieved by means of internal devaluation lay ahead This would require unprecedented fiscal consolidation huge redundancies and difficult structural reforms threatening political and social stability Yet despite pronounced scepticism from the outset and particularly at the height of the crisis in mid-2009 the economy has moved back to growth The measures implemented took some time to take effect with the economy continuing to decline at first before picking up as seen in the lsquoVrsquo-shaped recovery but a protracted recession was avoided Latviarsquos GDP growth has exceeded expectations reaching levels of 54 in 2011 52 in 2012 and around 4 in 2013 The two factors that were critical to the countryrsquos economic recovery were a return to international competitiveness and the rapid correction of external imbalances The budget deficit decreased significantly and is expected to reach a balanced position in the near future The level of government debt is projected to stay around 40-42 of GDP in 2013-2014 and to decline to 33 of GDP in 2015 as the repayments to the EU take effect and sizable cash buffers will be reduced The financial assistance programme was successfully completed in January 2012 Financial support had not been necessary since October 2010 however and the government had re-entered international bond markets in June 2011 well ahead of schedule (45) As of 2013 GDP per capita in constant prices has returned to the level reached at its peak in 2007 Due to the decline in the population however the absolute value of GDP in constant prices was still about 9 below 2007 levels with current projections suggesting that a full recovery to the pre-crisis peak will be achieved in 2015
Overheating imbalances and a big bust
Latvia joined the EU in seemingly good macroeconomic health and having pegged its currency to the Special Drawing Right (SDR) in
(45) Occasional Paper 120 issued by the European Commission Directorate-General for Economic and Financial Affairs EU Balance of Payments assistance for Latvia foundations of success httpseceuropaeueconomy_financepublicationsoccasional_paper2012op120_enhtm
36 | Quarterly Report on the Euro Area
1994 and then to the euro in 2005 was keen to join the euro area in January 2008 Upon entering the Exchange Rate Mechanism II (ERM II) on 2 May 2005 the authorities unilaterally committed to maintaining a smaller fluctuation margin of plusmn1 around the central rate ndash seen as a sign of the countryrsquos determination to join the euro area The Latvian economy was the fastest growing in the EU between 2000 and 2007 and between 2005 and 2007 real GDP growth reached a yearly average of over 10 Following accession to the EU in 2004 Latvia along with other EU countries witnessed a rapid credit expansion Loans to residents grew at an average annual rate of close to 50 between 2004 and 2008 a reflection of the excess liquidity at that time and of the resulting hot money inflows into central and eastern European economies which were rapidly converging with their western European counterparts Foreign investment exploded driven by commercial banksrsquo mispricing of risk and over-optimistic expectations of convergence A number of privatisation deals and most importantly a burgeoning real-estate market characterised by soaring prices also served to attract foreign investors The tradable sector was meanwhile largely neglected By way of illustration foreign direct investment (FDI) reached relatively high levels of 84 and 81 of GDP in 2006 and 2007 respectively but most of this was directed towards the real-estate market while the proportion of total FDI relating to manufacturing was only 12 in 2013 Significant imbalances were accumulating as indicated by a current account deficit that reached around 22 of GDP in 2006 and 2007 and by labour market tightening Nominal wages doubled between 2004 and 2007 increasing much faster than productivity and thus damaging international competitiveness
By early 2008 more cautious bank lending had caused economic growth to slow significantly By autumn of the same year this slowdown had developed into a strong contraction reflecting the wider global economic situation The global economy fell into recession commodity prices reached record highs and the general risk aversion seen in global markets following the collapse of Lehman Brothers cut off Latviarsquos access to financial markets The second largest domestic bank Parex had to be rescued Latvia ultimately experienced the most severe GDP contraction of all EU countries at close to 18 in 2009 The government deficit threatened to spiral out of control Having been at 03 of GDP in 2007 and 42 in 2008 in spring 2009 it was projected to
reach levels well above 15 of GDP by the end of year in the absence of a significant consolidation package
Faced with an economic crisis of this order Latvia agreed a medium-term financial assistance programme the balance of payments programme (BoP) with the EU and the IMF in December 2008 (46) The aim of this was to preserve the existing exchange-rate arrangement The assistance offered to Latvia was made subject to a number of policy conditions relating to fiscal consolidation financial sector stabilisation and the introduction of a wide range of structural reforms including a significant acceleration in the absorption of EU structural funds The Latvian government also undertook to strengthen the social safety net so as to protect the most vulnerable from the effects of the crisis
Brave measures in difficult times
Given that the exchange rate was at that time pegged to the euro some economists suggested devaluation as the only way out of the crisis The national authorities and international partners did not see that as a viable option however because its effectiveness would have been severely limited by the degree to which imports were used in the manufacture of exports and the high proportion of foreign liabilities Furthermore it would have brought with it the risk of mass bankruptcy and a partial collapse of the domestic banking system at a time when the judicial system was clearly not capable of coping with such a fall-out In addition devaluation would have provided no incentive to solve Latviarsquos structural problems including weak fiscal governance the unsustainability of pension expenditure loss-making state-owned banks a lack of competitiveness and weak institutions
Between 2009 and 2011 the Latvian government carried out an ambitious programme of fiscal adjustment designed to correct the previously loose fiscal policy the weaknesses of which had been hidden by the countryrsquos strong economic growth This difficult adjustment restored Latviarsquos public finances to better health and established a
(46) Funds available from EU countries IMF World Bank EBRD
and Norway amounted to euro 75 billion of which Latvia used euro 45 billion (60) with euro 29 billion lent by the European Commission on behalf of the EU The first tranche of EUR 1 billion (13 of the total) was repaid by Latvia on 25 March 2014
II Special topics on the euro area economy
Volume 13 No 1 | 37
framework which would be sustainable in the long term The nominal balance improved with the deficit being cut from 98 of GDP in 2009 to 13 of GDP in 2012 and 2013 (see graph II31) The structural deficit also fell from its peak of 55 of GDP in 2008 to around 025 of GDP in 2012 and 2013 beating Latviarsquos medium-term objective of -05 of GDP as set in the convergence programmes
Latviarsquos fiscal consolidation measures were undoubtedly bold with fiscal savings equivalent to around 17 of GDP implemented within three years The measures were frontloaded and half of these savings were implemented in the first year alone The measures were on the whole expenditure-oriented with over half of the savings coming from cuts to health education and public administration budgets The most notable measure relating to revenue was an increase in VAT from 18 to 22 The consolidation strategy was eventually successful in containing the adverse effects of the budget deficit on the economy In fact it even appears to have triggered lsquonon-Keynesianrsquo effects on demand by restoring confidence and stimulating demand and investment at the point when it was most needed (47)
Graph II31 Latviarsquos government budget balance and debt (2008-15 of GDP)
Source DG ECFIN Commissionrsquos spring 2013 forecast
The fiscal framework was also strengthened significantly by the law on fiscal discipline coming into force in March 2013 and the creation of a fiscal council in January 2014 The signing of the
(47) Ibid see Chapter 4 Fiscal consolidation in the midst of the crisis
Treaty on Stability Coordination and Governance in the EMU (48) in March 2012 provided further EU-level support for the national fiscal framework
An additional factor that was critical to the success of the consolidation strategy but is often overlooked was the availability of significant EU funds (particularly from around 2009 onwards) which acted as a much-needed demand trigger in sectors affected by the decline in economic activity Between 2007 and 2013 Latvia benefited from the third highest allocation of EU funds after Hungary and Lithuania receiving a yearly average equivalent to around 28 of GDP or 70 of gross fixed capital formation(49) As on average every euro of national budget spending was supplemented by five to six euros co-financing from EU funds national expenditure on items such as road and public building construction vocational education and training of unemployed science infrastructure development and healthcare was often replaced by Structural funds financing despite being in conflict with the EU funds additionality principle Clearly such large inflows of EU financing also generated substantial tax revenues in particular VAT at a time when private consumption was weak
The Latvian labour market demonstrated a high level of flexibility during the crisis thanks in part to a decentralised wage-setting system Significant public-sector wage cuts indirectly supported nominal wage reduction in the private sector in 2009 and 2010 when earnings per employee fell by a total of 19 over two years Employment levels fell sharply especially in the private sector as jobs were cut in construction and manufacturing The unemployment rate reached around 20 in early 2010 but had fallen back to 119 by 2013 due mainly to growth in employment with the participation rate also increasing significantly over this period The projection from the Commissionrsquos 2014 winter forecast shows wages in 2014-15 growing broadly in line with productivity although the labour market is tightening and structural problems in particular regional differences and skill mismatches could create pressures in the economy
(48) httpeuropean-councileuropaeumedia639235st00tscg26_en12pdf
(49) Source Directorate-General for Regional Policy Infoview
38 | Quarterly Report on the Euro Area
External cost competitiveness has improved noticeably since 2008 with labour costs falling significantly and labour productivity in particular in the tradable sector increasing In 2008 the real effective exchange rate (REER) adjusted for unit labour costs reached a peak of 64 above the 2000 level before falling by about 20 in 2009-10 since when it has remained broadly stable (see graph II32) This level of REER is considered sustainable as the country has been seen to be steadily gaining market share over recent years (including as measured by exports adjusted for the growth of markets) The percentage of the countryrsquos GDP attributable to exports rose to 60 in 2013 from 43 in 2007 with some 60 of exports destined for the EU and 12 for Russia
Graph II32 Effective exchange rates Latvia v 35 trading partners
(Jan 2007-Dec 2013 monthly avg 2007 = 100)
Source DG ECFIN
The social burden of economic adjustment has admittedly been high in Latvia despite the policy measures contained in the Memorandum of Understanding stipulating inter alia establishment of a comprehensive social safety net supporting local governments in providing social assistance and discounting social payments from overall budget targets High unemployment has led to a wave of emigration to richer EU countries which coupled with Latviarsquos low fertility and high death rates has seen the population decrease by 8-10 since 2008 Net emigration has now fallen substantially however since the peak of the crisis years The rates of poverty and social exclusion in Latvia are among the highest in the EU families with children unemployed people people with disabilities and people living in rural areas are particularly at risk The countryrsquos spending on
social protection and healthcare as a percentage of GDP is among the lowest in the EU Furthermore the social protection measures which do exist to reduce poverty tend to be ineffective highlighting the importance of a robust social safety net It appears however that with the improved economic situation and increasing levels of general social awareness the authorities are finally starting to address the challenges of poverty and social exclusion with greater determination In recent years for example taxation of low-income earners has been cut slightly and child poverty has been reduced thanks to increases in various child-related benefits Proposals for reforms to social assistance in line with 2013 World Banks study are being gradually implemented Better targeted more effective policies relating to the active labour market mostly financed by the European Social Fund are helping unemployed people in particular the long-term unemployed and young people to find work or to obtain relevant training
As part of the BoP programme and in the context of the assessment of Latviarsquos readiness to join the euro area financial supervision has been tightened and EU resources for supervision and monitoring increased in particular for monitoring the growing non-resident banking sector Additional liquidity and capital adequacy requirements for non-resident banks were introduced in 2013 regular on- and off-site checks of these banks are being performed the deposit guarantee fund has been further strengthened and monitoring has been stepped up in relation to pledged assets and the origin of funds in bank recapitalizations This strengthened regulatory policy has been introduced partly as a result of lessons learnt at significant cost in the past five years most notably with the Parex and Krajbanka failures
Latvia has implemented a series of ambitious reforms to the business environment in recent years with the aim of reducing start-up costs simplifying procedures for property registration construction permits and tax collection and introducing out-of-court settlement of insolvencies In doing so Latvia has brought its regulatory framework a significant step closer to what is regarded as best practice In the World Bankrsquos 2014 Doing Business report Latvia was ranked 25th out of 185 countries with only four euro-area members faring better
II Special topics on the euro area economy
Volume 13 No 1 | 39
Conclusion
The origins of Latviarsquos years of boom and bust can be traced back to the domestic regional and global circumstances at that time globally excess liquidity and hot money flowing into vulnerable countries regionally unrealistic expectations of income convergence in central and eastern Europe and domestically undue optimism about growth in personal incomes and mispricing of risk by commercial banks amplified by the behaviour of both policymakers and individuals
A broad range of country-specific and general economic factors have contributed to the successful economic adjustment seen in Latvia since the height of the crisis Ambitious front-loaded and largely expenditure-based fiscal consolidation helped to contain the budget deficit whilst the confidence generated by the introduction of a credible programme itself aided the economic recovery The flexibility of the labour market meanwhile helped companies to restore competitiveness by means of wage reductions and job cuts Competitiveness was also improved by steps taken to shift the tax burden from labour to consumption and property The recovery in Latvia was very much export-driven with the growth in exports made possible by the openness of the economy and the faster-than-expected economic growth experienced by major trading partners A number of structural reforms including bank restructuring and measures improving the use of EU funds have contributed to the development of a more favourable business environment A generous allocation from the European structural funds meanwhile helped to boost public investment and supported financing and reforms in many important sectors Above all the success of the recovery measures implemented in Latvia proved that for a tough internal economic adjustment to be effective there needs to be both a determined political will to carry out unpopular reforms and also a fully-developed comprehensive social safety net to protect more vulnerable groups
in society during difficult times In addition Latvia benefited from the fact that those looking for work were able to migrate to other EU countries which helped to alleviate the social tension created by the effects of the crisis Some of the lessons above are clearly applicable to other Member States undergoing challenging economic adjustment while others are more Latvia-specific
While Latviarsquos current level of economic growth is regarded as sustainable (50) and the adoption of the euro is recognised as a significant and hard-earned achievement it is not the end of the road The current robust economic situation should be used to advance reforms and improve Latvias long-term growth potential rather than lead to complacency and relaxation of reform efforts Sustainable convergence of the economy in the longer term will require inter alia ongoing commitment to prudent fiscal policies (there are some recent signs of less prudent fiscal decision-making) a continuous use of macro-prudential tools to reduce risks from growing non-resident financial flows especially in view of recent Ukraine events and the implementation of reforms in a number of vested-interest-heavy areas These include higher education and science state owned enterprise management electricity and gas market liberalization and the judiciary including insolvency framework But above all and in order to ensure economic and social sustainability for years to come high rates of poverty social exclusion and dismal demographic trends need to be addressed boldly These and other structural challenges are being addressed by the Commission under the European Semester and the Post Program Surveillance frameworks Also Latvia has joined a euro area that is very different from what it was just a few years ago the euro area economic governance framework has been greatly strengthened entailing stricter obligations
(50) The Commissionrsquos alert mechanism reports issued under the Macroeconomic Imbalance Procedure have not identified economic imbalances in Latvia requiring further in-depth investigation for possible policy action
httpeceuropaeueurope2020pdf2014amr2014_enpdf
40 | Quarterly Report on the Euro Area
II4 Corporate balance sheet adjustment in the euro area and the United States (51)
This section compares balance sheet adjustment in the non-financial corporate sector in the euro area and the United States It shows that the adjustment since the crisis has been faster in the latter Despite similar steep rises in corporate debt in pre-crisis years US corporations have cut debt more than those in the euro area Shifts from loans to bonds and extensions of debt maturity have also been more pronounced in the United States Much of the difference in balance sheet consolidation can be traced back to more positive profitability trends providing US firms with the internal funds necessary to adjust balance sheets Differences in dividend distribution strategies and in corporations physical investment behaviours also played a role Profitability differences reflect differences both in cyclical conditions and labour market adjustment Comparatively slow progress in balance sheet consolidation is likely to weigh on investment recovery in the euro area
-----------------------
Introduction
Both the euro area and the United States experienced a surge in corporate indebtedness in the years preceding the global financial crisis and in its early stages The ratio of debt to gross value added by non-financial corporations (NFCs) rose by about 40 pp between 2005 and 2009 Deteriorating growth prospects and changing attitudes to risk have prompted NFCs in both economies to adjust their balance sheets As previously argued in the Quarterly Report balance sheet adjustment can have a substantial effect on economic activity and it is important to monitor regularly the ongoing adjustment in the euro area (52) This section contributes to the monitoring by comparing progress in corporate deleveraging in the euro area and in the United States two regions where firms entered the crisis with excessive debt
(51) Section prepared by Plamen Nikolov (52) See European Commission (2010) Focus Balance sheet
adjustment in the corporate sector Quarterly Report on the Euro Area Vol9 (3) pp 9-19 A more detailed overview of the literature on the impact of balance sheet adjustment can be found in Cuerpo C I Drumond J Lendvai P Pontuch and R Raciborski (2013) Indebtedness deleveraging dynamics and macroeconomic adjustment European Economy Economic Papers 477
Firms consolidate their balance sheets primarily by raising their net lendingborrowing (NLB) ie the cash obtained from their production activity and available for financial operations (53) A rise in NLB is achieved either by increasing savings or cuttingpostponing physical investment Firms increase savings by raising profits and reducing the dividends distributed to shareholders In firmsrsquo financial accounts a rise in corporate NLB is associated with a rise in financial assets andor a cut in financial liabilities The section reviews recent developments in euro area and US profitability savings and NLB and looks at the instruments that the corporate sector has used to consolidate its balance sheet on both the asset and the liability side
Corporate profits have disappointed in the euro area hellip
National account data show that corporate profitability in the euro area reached a pre-crisis peak in 2007Q3 ie later than in the United States where it had already started to decline in 2007 (54)
Graph II41 NFC profitability euro area and US
(2000Q1-2013Q3 of GVA)
20
25
30
35
40
45
00Q1 01Q3 03Q1 04Q3 06Q1 07Q3 09Q1 10Q3 12Q1 13Q3
Euro area (1)
US
(1)Excluding Latvia Source Eurostat US Bureau of Economic Analysis DG ECFIN calculations
(53) Firms can also consolidate their balance sheets by raising equity (54) Profitability like the other national account variables for the
corporate sector presented in this section is measured as a proportion of corporate sector activity represented by gross value added (GVA) It is calculated as the gross operating surplus plus financial revenues and subsidies and minus financial and tax expenses Financial expenses do not include earnings distributed to shareholders
II Special topics on the euro area economy
Volume 13 No 1 | 41
The 2008-09 recession brought a sharp drop in corporate profitability in the euro area Profitability recovered briefly in 2010 to reach a new peak in 2011 but has declined again since then (Graph II41) In the United States the impact of the crisis was rather muted with profits recovering vigorously after 2008 As a ratio to gross value added (GVA) US corporate profits had already passed their pre-crisis level in 2009 before flattening out in the past two years Overall by 2013 profitability in the euro area was still about 2 pp below its pre-crisis peak while in the United States it stood around 3 pp above
hellip mostly due to weak operating surplus
The disappointing profit performance in the euro area relative to the United States is largely due to differing developments in gross operating surplus Looking at the breakdown of the contribution to the cumulative change in corporate profitability since the start of the crisis there is a marked difference between firms in the euro area and those in the United States (Graphs II42 and II43) (55)
Graph II42 Profitability breakdown of NFCs euro area (1)
(cumulative change in from 2007Q3 peak to 2013Q3)
35
36
37
38
39
40
41
42
-100
-80
-60
-40
-20
0
20
40
60
80
100
07Q4 08Q4 09Q4 10Q4 11Q4 12Q4
Taxes (lhs)
Other net current transfers received (lhs)
Net property income received excl dividends paid (lhs)
Operating surplus (lhs)
Profits(rhs)(2)
(1)Excluding Latvia(2)Profits in of GVA Source Eurostat DG ECFIN calculations
In the euro area a fall in the ratio of operating surplus to GVA dragged overall profitability down after 2008 Despite an improvement in 2011 in
(55) The illustration of the contributions to the cumulative change in profitability only serves to depict the relative importance of the various components of the change in profits since the crisis The starting point for the cumulative change should not be interpreted as a reference point for a desirable profit recovery
2013 operating surplus was still contributing negatively to the cumulative change in profitability since the pre-crisis peak In contrast operating surplus in the United States responded to the crisis earlier than in the euro area but its contribution to the change in profits remained positive
Graph II43 Profitability breakdown of NFCs US
(cumulative change in from 2005Q3 peak to 2013Q3)
24
25
26
27
28
29
30
31
-100
-80
-60
-40
-20
0
20
40
60
80
100
05Q4 06Q4 07Q4 08Q4 09Q4 10Q4 11Q4 12Q4
Taxes (lhs)Other net current transfers received (lhs)Net property income received excl dividends paid (lhs)Operating surplus (lhs)Profits(rhs)(2)
(1) Profits in of GVA Source Federal Reserve Board US Bureau of Economic Analysis DG ECFIN calculations
Unlike operating surplus income tax payments and net income from non-operational activities did not differ significantly between the euro area and the United States (56) In both economies lower corporate tax payments resulting from lower profits generated by NFCs naturally had a positive impact on the cumulative change in profits from the pre-crisis peak
Differences in labour market developments are at the root of differences in profitability
Differences in operating surplus and profitability between the United States and the euro area can be attributed partly to differences in the business cycle In 2011Q1 NFCsrsquo gross value added was still 12 below its pre-crisis peak in the euro area but 11 above in the United States The main channel through which cyclical developments can affect operating surplus is the labour market
(56) In fact the ratio of profit tax payments to profits (a crude measure of an aggregate tax rate) in the euro area and the United States has been almost the same since the start of the crisis falling substantially in 2008-09 indicating that tax policy was not more favourable for profits in one economy than in the other
42 | Quarterly Report on the Euro Area
The cyclicality of operating surplus depends on the impact of the cycle on labour productivity as well as on wages The worse performance of operating surplus in the euro area since 2008 as compared with that in the United States reflects a stronger deterioration in labour productivity accompanied by unfavourable developments in wages per employee
Labour productivity growth in the euro area turned sharply negative in 2009 opening a big gap with the positive (albeit modest) wage growth (Graph II44) In the United States on the other hand labour productivity growth became negative earlier but to a lesser extent and some downward wage adjustment took place in 2009
Graph II44 Labour productivity and wages euro area and US
(2001Q4-2013Q3 y-o-y change)
-4
-3
-2
-1
0
1
2
3
4
5
01Q4 03Q2 04Q4 06Q2 07Q4 09Q2 10Q4 12Q2
Average wage per employee euro area (1) (2)Average wage per employee US (1)Labour productivity euro area (2) (3)Labour productivity US (3)
(1)Real wages calculated by the GDP deflator(2)Euro area excluding Latvia(3)In terms of total employment (thousands) Source Eurostat US Bureau of Economic Analysis US Bureau of Labour Statistics DG ECFIN calculations
There are a number of reasons for the different labour adjustments in the euro area and the United States In the former apart from a higher level of employment protection short-term work schemes were put in place in the early stages of the crisis (57) In addition as labour force adjustment tends to be more costly in the euro area some firms (particularly small firms and those with highly qualified employees) preferred to retain their
(57) According to the OECD Public short-term work schemes have
played an important role in preserving jobs during the crisis in a number of countries although significant hours reductions were also achieved via lower overtime hours hours averaging arrangements and employer initiatives see OECD Employment Outlook 2010 ndash Moving Beyond the Job Crisis
labour force (58) Because of a lack of wage flexibility the higher degree of lsquolabour hoardingrsquo in the euro area came at the expense of lower operating surplus and profits and consequently put a downward pressure on the capacity accumulate internal funds to deleverage
Corporate savings are much lower in the euro area
Negative developments in euro area corporate profitability were reflected in corporate savings which together with physical investment determines the internal funds available for balance sheet adjustment In 2009-10 there was a sharp drop in euro area savings because profits acted as shock absorbers and fell more rapidly than dividend payments leaving less spare cash available In contrast savings by US NFCs increased substantially on rising profits after an early-crisis low point and reached a historically high level of around 23 of GVA in 2010Q3 (Graph II45)
Graph II45 Savings of NFCs (2000Q1- 2013Q3 of GVA)
15
16
17
18
19
20
21
22
23
24
00Q1 01Q3 03Q1 04Q3 06Q1 07Q3 09Q1 10Q3 12Q1 13Q3
Euro area (1)
US
(1)Euro area excluding Latvia Source Eurostat Bureau of Economic Analysis DG ECFIN calculations
The impression that US corporate behaviour has been more geared towards accumulating savings than that in the euro area is reinforced when one looks at dividend distribution Dividends paid by euro area NFCs have been on a declining trend since the start of the crisis but those paid by US firms have also decreased This is remarkable given (58) See Box 12 Labour hoarding across different types of firms in
OECD Employment Outlook 2010 ndash Moving Beyond the Job Crisis
II Special topics on the euro area economy
Volume 13 No 1 | 43
the positive profit developments in the United States (Graph II46) A drop in dividends alongside profit growth suggests that after 2008 US companies preferred to direct a bigger proportion of the profit recovery to corporate savings and thereby balance sheet adjustment The ratio of dividends to profits in the United States has fallen from about one third before the crisis to one quarter now This ratio also dropped in the euro area although by less (59)
Graph II46 Dividends paid of NFCs (2000Q1-2013Q3 of GVA)
0
5
10
15
20
25
00Q1 01Q3 03Q1 04Q3 06Q1 07Q3 09Q1 10Q3 12Q1 13Q3
Euro area (1)
US
(1)Euro area excluding Latvia Source Eurostat Federal Reserve Board DG ECFIN calculations
Disappointing physical investment in the euro area and the United States
Cutting investment in physical assets is another way of reducing excessive indebtedness Corporate investment as a proportion of activity dropped sharply both in the euro area and in the United States in the early stages of the crisis (Graph II47)
After a modest recovery in 2010-11 the investment rate decreased again in the euro area The investment recovery was more solid in the United States but has lost momentum since the end of 2012 and the investment rate remains below its pre-crisis peak Overall it seems that euro area corporations partly compensated for less supportive savings developments than in the US by
(59) Dividend payments are not the only way of distributing profits to shareholders Equity buybacks can also be used for this purpose and firms that choose this option will tend to have higher savings and lower dividends paid
curbing physical investment more than their US counterparts
Graph II47 Investment of NFCs (2000Q1- 2013Q3 of GVA)
15
16
17
18
19
20
21
22
23
24
00Q1 01Q3 03Q1 04Q3 06Q1 07Q3 09Q1 10Q3 12Q1 13Q3
Euro area (1)
US
(1)Excluding Latvia Source Eurostat US Bureau of Economic Analysis DG ECFIN calculations
A more modest increase in net lending in the euro area than in the US
Since 2013 firmsrsquo net lending in the euro area has been in positive territory but substantially less so than that in the United States (Graph II48) Positive NLB in the euro area unlike that in the United States is mostly due to a low investment rate alone rather than low investment combined with high savings The combination of disappointing investment and high savings has translated into historically high and sustained NLB for US firms
This persistent net lending position in the United States is atypical as firms usually invest more than they save It suggests that US firms have been adjusting their balance sheets significantly since the beginning of the crisis via their internal funds while euro area firms seem to have opted for much slower balance sheet adjustment
44 | Quarterly Report on the Euro Area
Graph II48 Net lendingborrowing of NFCs
(2000Q1- 2013Q3 of GVA)
-10
-8
-6
-4
-2
0
2
4
6
8
00Q1 01Q3 03Q1 04Q3 06Q1 07Q3 09Q1 10Q3 12Q1 13Q3
Euro area (1)
US
(1)Excluding Latvia Source Eurostat US Bureau of Economic Analysis DG ECFIN calculations
Debt deleveraging has been more pronounced in the US than in the euro area
The faster pace of adjustment of balance sheets in the United States is confirmed by the corporate debt data (Graph II49) (60) (61) While both the euro area and the United States entered the crisis with swiftly rising and historically high levels of debt deleveraging has progressed more rapidly in the latter since the crisis By the beginning of 2012 US corporate debt had fallen by approximately 15 pp as a proportion of activity while euro area debt had dropped by 7 pp (62)
(60) Non-financial corporate debt consists of loans and securities
other than shares (corporate bonds) both can be classified as short- or long-term depending on whether their original maturity is less or more than one year
(61) This section analyses developments in non-consolidated financial flows and stocks in the euro area and in the United States for two reasons it is important to have a sense of financial positions within the institutional sector eg loans between NFCs are an important part of intra-firm relationships as head offices use them to finance subsidiaries for example perhaps for tax reasons This is relatively more important in the euro area than in the United States Consolidated financial asset and flow data eliminate these intra-sector positions and different approaches may be taken to consolidation as in the euro area there is the additional issue of cross-border consolidation between Member States while there is no need for flows and positions between firms in different US states to be treated separately
(62) The debt-to-equity ratio is another measure of corporate leverage widely followed by investors Faster stock market recovery helped US firms reduce this ratio more than those in the euro area
Graph II49 Debt levels of NFCs(1) (1999Q1-2013Q3 of GVA)
100
120
140
160
180
200
220
99Q1 00Q3 02Q1 03Q3 05Q1 06Q3 08Q1 09Q3 11Q1 12Q3
Euro area (2)
US
(1)Securities other than shares and loans(2)Excluding Latvia Source Eurostat US Bureau of Economic Analysis DG ECFIN calculations
Firms in the euro area and the United States entered the crisis with almost the same level of short-term debt as a proportion of total debt Since the crisis the adjustment away from short-term debt has been significantly more pronounced in the United States suggesting more active balance sheet restructuring
Graph II410 Debt flows of NFCs(1) (1999Q1- 2013Q3 of GVA)
-15
-10
-5
0
5
10
15
20
99Q1 01Q1 03Q1 05Q1 07Q1 09Q1 11Q1 13Q1
Euro area bonds (2)
US bonds
Euro area loans (2)
US loans
(1)Securities other than shares and loans (2)Excluding Latvia Source Eurostat US Bureau of Economic Analysis DG ECFIN calculations
Due to differences in the structure of corporate finance loans (as opposed to bonds) tend to form a bigger proportion of debt in the euro area than in the United States An important element of the
II Special topics on the euro area economy
Volume 13 No 1 | 45
corporate balance sheet adjustment process in both economies has been a movement away from an excessive reliance on loans (Graph II410) and towards bond financing This trend has been substantially more pronounced in the United States presumably reflecting the fact that bond markets are more developed in that country
Developments in non-financial corporate debt were also influenced by developments in financial intermediation in particular in the banking sector Financial accounts show NFCsrsquo debt exposure but do not indicate whether the debt holder is a bank According to bank balance sheet statistics the nominal growth of loans vis-agrave-vis NFCs has been mostly negative in the euro area since 2009Q4 (Graph II411) Coupled with the positive loan inflows seen in the national accounts between 2010Q3 and 2012Q3 (Graph II410) this shows a degree of substitution in corporate loan liability ownership between banks and other financial firms and sectors (including other NFCs) in this period According to the counterparty breakdown of NFC domestic loans published by the ECB corporate borrowings from other NFCs represented 29 of all loans by 2013Q3 (up from 26 in 2008Q1) while the proportion of borrowings from monetary financial institutions (MFIs) had dropped (from 60 in 2008Q1) to an all-time low of 53 The proportion of loans from other non-bank financial intermediaries also increased There is less evidence of a shift from banks to other loan providers in the United States where loans between NFCs are much more limited
Graph II411 Bank loans to NFCs (1999Q1- 2013Q3 y-o-y change)
-20
-15
-10
-5
0
5
10
15
20
25
99Q1 00Q3 02Q1 03Q3 05Q1 06Q3 08Q1 09Q3 11Q1 12Q3
Euro area bank loans to NFCs (1)US bank loans to NFCs
(1)Excluding Latvia Source ECB US Federal Reserve Board DG ECFIN calculations
Positive NLB has been used to acquire safe financial assets in both regions
In both the euro area and the United States the positive NLB has been used to deleverage but also to invest in safe financial assets At the beginning of the crisis much of the positive corporate NLB in the United States was invested in money market mutual funds which is essentially investment in short-term low-risk assets (Graph II412) (63)
Currency and deposits (another type of safe asset) have increased substantially in the euro area in recent years as a proportion of total firm activity (Graph II413) This rise was driven almost exclusively by a rapid increase in firmsrsquo savings deposits To some extent a similar trend is observable in the United States In particular US cash balances (a sub-component of currency and deposits) approached 12 of GVA by the end of 2013 a level not seen since the early 1990s On the other hand savings deposits have grown more modestly resulting in a moderately positive overall trend in currency and deposits
Graph II412 Mutual fund shares of NFCs (1999Q1- 2013Q3 of GVA)
0
2
4
6
8
10
12
14
99Q1 01Q1 03Q1 05Q1 07Q1 09Q1 11Q1 13Q1
Euro area (1)
US (2)
(1)Excluding Latvia(2)In the USA these asset series can be broken down into investment in money market mutual funds and investment in other mutual funds The 2009-11 increase is fully attributable to the former Source Eurostat US Bureau of Economic Analysis DG ECFIN calculations
Overall these two aspects of corporate financial investment behaviour signify considerable liquidity concerns on the part of firms in both the euro area
(63) Euro area financial accounts only show firmsrsquo investment in mutual funds overall and do not distinguish between types of mutual funds
46 | Quarterly Report on the Euro Area
and the United States They also represent a drive towards lower-risk assets perhaps indicating increased risk aversion by corporations or a tendency to postpone physical investment in a context of perceived high uncertainty
Graph II413 Currency and deposits ndash NFCs
(1999Q1- 2013Q3 of GVA)
0
5
10
15
20
25
30
35
40
45
99Q1 00Q3 02Q1 03Q3 05Q1 06Q3 08Q1 09Q3 11Q1 12Q3
Euro area (1)
US
(1)Excluding Latvia Source Eurostat US Bureau of Economic Analysis DG ECFIN calculations
Conclusion
Although both regions saw similar steep rises in corporate debt in the pre-crisis years balance sheet adjustment since the crisis has been significantly slower in the euro area than in the United States The more rapid adjustment in the United States can be explained by a stronger cyclical recovery more supportive profitability developments and reduced dividend payment ratios In the euro area profitability has been hindered by a combination of lower flexibility in the labour markets and slow wage adjustment
The slower balance sheet adjustment in the euro area corporate sector is visible in a slower fall in indebtedness but also a slower adjustment of the structure of balance sheets In particular the shift from loans to bonds and the extension of debt maturity have been more pronounced in the United States In both regions firms have used their positive NLB to accelerate the accumulation of safe and liquid financial assets This could reflect continuing uncertainty regarding future demand and growth prospects
Overall the evidence discussed in this section shows that euro area firms are lagging significantly behind their US counterparts in terms of balance sheet consolidation Given that investment rates remain disappointing even in the more advanced US corporate sector a degree of caution appears warranted when assessing short-term prospects for corporate investment in the euro area
III Recent DG ECFIN publications
Volume 13 No 1 | 47
1 Occasional Papers
European Economy Occasional Papers 170 January 2014 Financial Assistance Programme for the Recapitalisation of Financial Institutions in Spain Fifth Review ndash Winter 2014 httpeceuropaeueconomy_financepublicationsoccasional_paper2014pdfocp170_enpdf
European Economy Occasional Papers 169 December 2013 The Economic Adjustment Programme for Cyprus Second Review ndash Autumn 2013 httpeceuropaeueconomy_financepublicationsoccasional_paper2013pdfocp169_enpdf
European Economy Occasional Papers 168 December 2013 Fiscal frameworks in the European Union ommission services country factsheets for the Autumn 2013 Peer Review httpeceuropaeueconomy_financepublicationsoccasional_paper2013pdfocp168_enpdf
European Economy Occasional Papers 167 December 2013 Economic Adjustment Programme for Ireland - Autumn 2013 Review httpeceuropaeueconomy_financepublicationsoccasional_paper2013pdfocp167_enpdf
European Economy Occasional Papers 166 December 2013 Progress towards meeting the economic criteria for EU accession the EU Commissionrsquos 2013 assessments httpeceuropaeueconomy_financepublicationsoccasional_paper2013pdfocp166_enpdf
European Economy Occasional Papers 165 November 2013 Romania Balance-of-Payments Assistance Programme 2013-2015 httpeceuropaeueconomy_financepublicationsoccasional_paper2013pdfocp165_enpdf
European Economy Occasional Papers 164 November 2013 The Economic Adjustment Programme for Portugal Eighth and Ninth Review httpeceuropaeueconomy_financepublicationsoccasional_paper2013pdfocp164_enpdf
European Economy Occasional Papers 163 November 2013 Financial Assistance Programme for the Recapitalisation of Financial Institutions in Spain Fourth Review ndash Autumn 2013 httpeceuropaeueconomy_financepublicationsoccasional_paper2013pdfocp163_enpdf
European Economy Occasional Papers 162 October 2013 Economic Adjustment Programme for Ireland Summer 2013 Review httpeceuropaeueconomy_financepublicationsoccasional_paper2013pdfocp162_enpdf
2 Economic papers
European Economy Economic Papers 514 February 2014 Martin Larch Kristin Magnusson Bernard Balint Tatar Hard work and More How to successfully conduct adjustment with official assistance httpeceuropaeueconomy_financepublicationseconomic_paper2014pdfecp514_enpdf
European Economy Economic Papers 513 February 2014 Florian Woumlhlbier Caterina Astarita Gilles Mourre Consolidation on the revenue side and growth-friendly tax structures an indicator based approach httpeceuropaeueconomy_financepublicationseconomic_paper2014pdfecp513_enpdf
48 | Quarterly Report on the Euro Area
European Economy Economic Papers 512 December 2013 Alexander Schwan Etienne Sail Assessing the economic and budgetary impact of linking retirement ages and pension benefits to increases in longevity httpeceuropaeueconomy_financepublicationseconomic_paper2013pdfecp512_enpdf 3 Other publications
Winter forecast 2014 - EU economy recovery gaining ground httpeceuropaeueconomy_financepublicationseuropean_economy2014pdfee2_enpdf 4 Regular publications
Business and Consumer Surveys (harmonised surveys for different sectors of the economies in the European Union (EU) and the applicant countries) httpeceuropaeueconomy_financedb_indicatorssurveysindex_enhtm Business Climate Indicator for the euro area (monthly indicator designed to deliver a clear and early assessment of the cyclical situation) httpeceuropaeueconomy_financedb_indicatorssurveysdocuments2013bci_2013_11_enpdf Key indicators for the euro area (presents the most relevant economic statistics concerning the euro area) httpeceuropaeueconomy_financedb_indicatorskey_indicatorsindex_enhtm Monthly and quarterly notes on the euro-denominated bond markets (looks at the volumes of debt issued the maturity structures and the conditions in the market) httpeceuropaeueconomy_financepublicationsbond_marketindex_enhtm Price and Cost Competitiveness httpeceuropaeueconomy_financedb_indicatorscompetitivenessindex_enhtm
50 | Quarterly Report on the Euro Area
Editor-in-Chief Elena Flores
Overall coordination Eric Ruscher
Data assistance Christos Zavos
Comments on the report would be gratefully received and should be sent to
Elena Flores Director ndash Policy Strategy and Coordination Directorate-General for Economic and Financial Affairs Office CHAR 1566
B-1049 Brussels
Email elenafloreseceuropaeu
or
Eric Ruscher Head of Unit ndash Macroeconomy of the euro area Directorate-General for Economic and Financial Affairs Office CHAR 15248
B-1049 Brussels
Email ericruschereceuropaeu
HOW TO OBTAIN EU PUBLICATIONS Free publications bull one copy
via EU Bookshop (httpbookshopeuropaeu) bull more than one copy or postersmaps
from the European Unionrsquos representations (httpeceuropaeurepresent_enhtm) from the delegations in non-EU countries (httpeeaseuropaeudelegationsindex_enhtm) by contacting the Europe Direct service (httpeuropaeueuropedirectindex_enhtm) or calling 00 800 6 7 8 9 10 11 (freephone number from anywhere in the EU) () () The information given is free as are most calls (though some operators phone boxes or hotels may charge you)
Priced publications bull via EU Bookshop (httpbookshopeuropaeu) Priced subscriptions bull via one of the sales agents of the Publications Office of the European Union
(httppublicationseuropaeuothersagentsindex_enhtm)
KC-AK-14-001-en-n
- Blank Page
- Blank Page
- Blank Page
- Blank Page
-

I The drivers of total factor productivity in catching-up economies
Volume 13 No 1 | 17
Box (continued)
(Continued on the next page)
18 | Quarterly Report on the Euro Area
The interaction models reveal that the impact of the structural variables also seems to be conditional on the spillover channel ie the growth rates of the economies with the highest TFP level Stricter employment protection legislation an increase of the corporate income tax rate or a higher old age dependency ratio all have a detrimental impact on TFP growth when the TFP growth rate of the technology leader is high Since sectors closely related to ICT appear to show the highest growth rates over the sample period the findings implicitly suggest that these sectors tend to react strongest to changes in labour market flexibility tax regimes and population ageing The effect from improving the effectiveness of governments by contrast seems to be of great importance for all sectors Finally product market regulation does not seem
to matter for TFP growth irrespective of the growth rate of the leading economy
Applying the findings of the panel regressions conducted for up to 20 economies to the euro area economies allows for the following tentative conclusions
bull The TFP divergence between euro area catching-up economies relative to the rest of the euro area in the decade preceding the global financial and economic crisis can be partly explained by the following indicators a weakening of the convergence channel lower spending on innovation activities such as RampD and ICT deteriorating government effectiveness and faster population ageing
Box (continued)
I The drivers of total factor productivity in catching-up economies
Volume 13 No 1 | 19
bull Looking forward policy measures that fosterinnovation activities reduce the restrictivenessof employment protection legislation lowercorporate tax rates and improve governmenteffectiveness could help promote TFP growthin the euro area catching-up economies
bull It is worth stressing that according to theregression results employment protectionlegislation has not contributed to the TFPdivergence process since euro area catching-upeconomies did not fall behind the rest of theeuro area in this respect between 1994 and2007 Similarly corporate tax policy does notseem to have been a source of divergence overthat period Nevertheless the regression resultsalso indicate that policy action in those twoareas could improve TFP growth in thecatching-up countries as well as in the rest ofthe euro area
I5 Conclusions
The TFP income convergence process in the euro area weakened in the decade preceding the economic and financial crisis mainly due to weak TFP growth in catching-up economies In fact the gap between euro area catching-up economies and technological leaders actually widened in a broad range of sectors
The persistence of the technology gap since the mid-1990s suggests that the causes are deep-rooted and at least partly structural The econometric analysis presented in this focus section shows that the TFP divergence between euro area catching-up economies and the rest of the euro area can be partly explained by the following indicators a weakening of the convergence channel lower spending on innovation activities such as RampD and ICT deteriorating government effectiveness and faster population ageing
In response to the crisis catching-up countries have put in place a broad range of reforms aimed at improving framework conditions labour market flexibility and the efficiency of the business environment These are likely to raise TFP growth rates in the years to come
However since catching-up is shown to be more difficult for economies approaching the technological frontier the adoption of further structural measures would also help more advanced countries accelerate their TFP convergence In particular measures that foster innovation activities reduce further the restrictiveness of employment protection legislation lower corporate tax rates and improve government effectiveness appear to be the most effective at promoting TFP growth
II Special topics on the euro area economy
Volume 13 No 1 | 21
II1 New estimates of Phillips curves and structural unemployment in the euro area (15)
The Phillips curve can be used to estimate the non-cyclical part of unemployment In such models this estimate is commonly referred to as the lsquonon-accelerating wage rate of unemploymentrsquo (NAWRU)(16) The Phillips curve can be specified in various ways reflecting different assumptions regarding the formation of expectations DG ECFIN has recently extended its framework to cover rational expectations This section looks at the sensitivity of the results to alternative expectation assumptions reporting NAWRU estimates based on Phillips curves produced using rational expectations and those (as used to date) allowing only for static or adaptive expectations
Our findings show that for the euro area as a whole the alternative expectation assumptions yield similar NAWRU estimates In particular the NAWRU appears to have increased recently suggesting a deterioration of labour market performance beyond what could be considered merely cyclical For Spain however the results vary more depending on the assumptions used The Phillips curve based on rational expectations points to a more moderate NAWRU increase than that used by DG ECFIN to date However all estimates point to a substantial post-crisis increase in the NAWRU for Spain
In interpreting the rise in the NAWRU it is important to bear in mind that both structural and non-structural factors are driving developments Analysis shows that in the presence of rigidities crisis-related events can have temporary but long-lasting effects on labour market performance Structural factors can play a role too as illustrated by the steady decline in the NAWRU in Germany which appears to be related to structural effects brought about by the Hartz reforms
-------------------------------
(15) Section prepared by Fabrice Orlandi (16) The Phillips curve features a relationship between the
unemployment gap and an inflation or labour-cost variable In the case of the former the non-cyclical unemployment estimate obtained is usually referred to as the lsquonon-accelerating inflation rate of unemploymentrsquo (NAIRU) while with the latter it is referred to as the lsquonon-accelerating wage rate of unemploymentrsquo (NAWRU)
Introduction
Unemployment rates increased sharply in the euro area in the wake of the crisis and the surge has proved particularly persistent Assessing this development is of paramount importance to policy-makersrsquo efforts to find adequate responses to the effects of the crisis
The non-cyclical part of unemployment play a key role in this assessment as it identifies the proportion of the deterioration that is likely to last beyond the business cycle In the EU context this indicator is particularly important as it is a factor to be fed into the potential output calculations used to compute cyclically-adjusted fiscal figures important benchmarks for country surveillance under the EUrsquos fiscal framework(17)
The non-cyclical part of unemployment is not an observable variable however and has to be estimated which means that it is subject to uncertainty In part the uncertainty stems from the fact that different estimation models are available The Phillips curve is commonly used as a key element in estimation models(18) but can itself be specified in various ways most notably reflecting alternative assumptions as to the formation of expectations(19)
This section sets out DG ECFINrsquos approach to estimating the non-cyclical part of unemployment in particular in its use of the Phillips curve We also investigate the sensitivity of the results to alternative expectation assumptions highlighting the results obtained for the case of rational expectations the case recently incorporated in DG ECFINrsquos estimation framework
The results presented here focus on the euro area but results are also reported for Spain and Germany two countries that have witnessed starkly different non-cyclical unemployment developments
(17) For details on the EUrsquos SGP framework see Vademecum on the Stability and Growth Pact European Economy mdash Occasional Paper No 151 DG ECFIN European Commission May 2013
(18) For an illustration of structural unemployment analysis based on an alternative concept see eg Unemployment dynamics during recessions and recoveries Okunrsquos law and beyond IMF WEO April 2010
(19) For details on the Phillips curve see Fuhrer J YK Kodrzycki GP Olivei and J Sneddon Little Understanding inflation and the implication for monetary policy mdash a Phillips curve retrospective MIT Press 2009
22 | Quarterly Report on the Euro Area
in the recent past We use long time series usually starting in 1965 to capture medium-term cycles The latest DG ECFIN forecasts are also included in the dataset
Alternative NAWRU models
Non-cyclical unemployment is estimated on the basis of models that pin-down its statistical and economic properties DG ECFINrsquos approach relies on an lsquounobserved componentrsquo model which features a Phillips curve The curve links cyclical unemployment (ie the unemployment gap) to labour cost developments while non-cyclical unemployment is assumed not to be affected by labour cost developments In this setting non-cyclical unemployment estimates are commonly referred to as the lsquonon-accelerating wage rate of unemploymentrsquo (NAWRU)(20)
The specification of the Phillips curve reflects particular assumptions made regarding inflation expectations In the past DG ECFINrsquos considered only static and adaptive expectations More recently the case of rational expectations has been added providing a more comprehensive framework (see Box II11)
More specifically the so-called traditional Keynesian Phillips (TKP) curve based on static or adaptive expectation assumptions a positive unemployment gap ( minus lowast) with a fall in the change of the growth rate of nominal unit labour cost (∆ ) (and vice versa) ∆ = minus ( minus lowast) The new Keynesian Phillips (NKP) curve based on rational expectations implies that a positive unemployment gap ( minus lowast) is associated with a fall in the growth rate of real unit labour cost (∆ ) Lagged effects are also relevant because some wage-setters may use ad hoc rules and not fully optimise = ∆ minus ( minus lowast)+ ( minus lowast ) (20) For further details on the DG ECFIN approach see DrsquoAuria F
C Denis K Havik K Mc Morrow C Planas R Raciborski W Roumlger and A Rossi (2010) The production function methodology for calculating potential growth rates and output gaps European Economy mdash Economic Paper No 420 DG ECFIN European Commission July 2010
These alternative Phillips curves thus rely on different labour cost indicators to determine the unemployment gap (and thus also the NAWRU) namely ∆ and ∆ As explained in Box II11 this does not mean that the models are fundamentally different Instead it illustrates the impact of assumptions as to expectation formation on the specification of the Phillips curve
NAWRU developments
For the euro area as a whole NAWRU estimates based on the TKP and the NKP show a similar pattern (see Graph II11)(21) The similarity suggests that for most countries in the euro area results are not overly sensitive to the specification of the Phillips curve (ie to assumptions as regards expectation formation) In practice it also suggests that alternative labour cost indicators (ie change in unit labour cost (ULC) growth and real unit labour cost (RULC) growth) underwent broadly similar developments in the euro area this is confirmed by the top chart in Graph II12
Graph II11 shows that non-cyclical unemployment in the euro area posted a steady increase up to the mid-90s followed by an improvement that was then halted by the recent crisis The recent rise in the NAWRU suggests that the increases in unemployment seen in the aftermath of the crisis are to some extent likely to last beyond the cyclical upturn
Graph II11 also shows NAWRU developments for Spain and Germany illustrating the diversity within the euro area Spain has witnessed developments that have been similar to though more dramatic than those in the euro area as a whole Germany posted a starkly different profile with its NAWRU falling steadily (from 2002 according to the NKP or 2004 according to the TKP)
As regards sensitivity the NAWRU estimates for Spain vary considerably depending on the specification With the NKP the recent increase is more moderate with the NAWRU reaching 220 by 2015 while the estimated level with the TKP is 264 Recent results for Germany are less sensitive to assumptions regarding expectations (21) NAWRUs referred to in this section are those computed for the
Commissionrsquos 2014 winter forecast Latest available NAWRUs can be downloaded from the AMECO database httpeceuropaeueconomy_financeameco
II Special topics on the euro area economy
Volume 13 No 1 | 23
with the two Phillips curve specifications producing similar NAWRUs However around
Graph II11 Alternative NAWRU estimates euro area Germany and Spain (1)
(1965-2015 in )
(1)GDP weighted average of euro-area countries for which alternative NAWRUs have been computed (ie AT BE DE EL ES FI FR IE IT NL and PT) For AT both NAWRUs are based on the backward-looking model as the forward-looking model yields econometrically unsatisfactory results (2)Component of the NAWRU explained only by structural determinants (see Orlandi (2012) op cit) Source DG ECFIN calculations based on Eurostat data
2005 some difference across the two specifications is observed for Germany with the NKP producing a relatively less volatile NAWRU Given that the current NAWRU estimates for Germany based on the TKP and NKP specifications do not diverge greatly and taking into account the stability considerations in moving to a new specification Germany continues to use the TKP specification
NAWRU differences for Spain depending on the curve specification stem from corresponding differences between the labour cost indicators used Graph II12 shows that recently RULC growth posted greater and more persistent moderation in Spain than change in nominal ULC growth For Germany the indicators have followed more similar paths over recent years (as they have in the euro area as a whole) More fundamentally in times of heightened economic volatility andor big labour market adjustments (eg recent crisis Hartz reforms) the TKP model is likely to yield NAWRUs that are more pro-cyclical as it does not take full account of the price rigidities that play an important role in the adjustment process of the labour market These rigidities are better reflected in the NKP model
To sum up except in the case of Spain recent NAWRU estimates for the euro area do not appear to be sensitive to assumptions as regards expectations with alternative Phillips curve specifications yielding similar results Overall results point to a recent increase in the NAWRU across the euro area with the notable exception of Germany A rise in the NAWRU points to persistent deterioration in labour market performance Identifying the causes of the deterioration calls for cautious interpretation however
NAWRU versus Structural Unemployment
Understanding the sharp and protracted rise in unemployment in the wake of the crisis is of paramount importance from a policy perspective What caused the rise Is it a sign of structural deterioration Or is it purely cyclical reflecting the prolonged slowdown These questions are the subject of lively debate with views ranging from lsquoitrsquos all demandrsquo(22) to lsquoitrsquos allmostly structuralrsquo(23)
(22) See eg Krugman P (2010) Debunking the structural unemployment myth New York Times 28 September 2010
24 | Quarterly Report on the Euro Area
(23) See eg Kocherlakota N (2010) Inside the FOMC speech at
Marquette Michigan 17 August 2010
(Continued on the next page)
II Special topics on the euro area economy
Volume 13 No 1 | 25
In particular changes in the NAWRU are sometimes interpreted as a sign of a structural change Careful analysis of developments in the NAWRUs produced by DG ECFIN shows that they can be driven by both structural and non-structural factors(24)
In particular crisis-related shocks (eg unwinding of unsustainable developments) especially boom-bust episodes in the housing market that can trigger a lengthy process of deleveraging in the construction sector have a statistically significant impact on the NAWRU The real interest rate and Total Factor Productivity (TFP) growth which controls more generally for the presence of such shocks also play a part in driving NAWRU develpoments
At a theoretical level adding various rigidities (eg real wage rigidity cyclical price mark-ups or sluggish adjustment of the reservation wage) to the traditional labour market model can be shown to yield a NAWRU that is not solely determined by structural factors
Despite uncertainties the NAWRU remains a useful policy indicator It is a well-defined concept that provides useful information on the nature of unemployment rate developments In particular it identifies risks of persistent labour market deteriorations that may not always be caused by structural phenomena(25)
In this context it appears useful to distinguish between the NAWRU and a narrowly defined notion of structural unemployment affected only by structural factors as shown in Graph II11 by
(24) For further details see Orlandi F (2012) Structural unemployment and its determinants in the EU countries European Economy mdash Economic Paper No 455 DG ECFIN European Commission May 2012
(25) For further details see Cyclical and structural unemployment in the euro area in Labour Market Developments in Europe 2013 European Commission
the lsquostructural unemploymentrsquo series The latter represents the portion of the NAWRU that according to econometric results appears to be explained by structural features of the labour market As can be seen the series has remained broadly stable during the crisis Except for a notable decline due to structural labour market reforms in Germany change in the NAWRU in the euro area is not related to structural change This is also the case in Spain where structural unemployment has remained broadly stable
Recent increases in the euro-area NAWRU should therefore not be interpreted as a sign of big structural change at the current juncture Rather in most countries the increases reflect the effects of shocks that in the presence of various rigidities have a long-lasting impact on unemployment rates
To sum up the decline in the NAWRU at euro-area level and in countries like Spain in the run-up to the crisis appears mostly attributable to non-structural factors such as unsustainable developments in the housing sector The build-up and subsequent unwinding of imbalances has caused large economic shocks (eg need for sectoral reallocation) which have a persistent effect on the performance of the labour market However in some countries structural factors have also played a role in driving NAWRU developments In Germany for example the decline in the NAWRU seems related to some aspects of the Hartz reforms (eg the change in the period of eligibility for unemployment benefit appears to have contributed to a decline of the NAWRU over recent years) This suggests that large-scale reforms as currently being enacted in some countries will tend to translate into a gradual lowering of the NAWRU over coming years For example recent efforts in Ireland to bring down the labour tax wedge appear to be contributing to more favourable NAWRU developments A number of countries (eg France) have failed to
Box (continued)
26 | Quarterly Report on the Euro Area
post similar improvements in their underlying labour market structures
Graph II12 Alternative labour cost signals for the euro area Germany and Spain (1)
(1965-2014)
(1)GDP-weighted average of euro-area countries for which alternative NAWRUs have been computed (ie AT BE DE EL ES FI FR IE IT NL and PT) (2)Private consumption deflated ULC Source DG ECFIN calculations based on Eurostat data
Conclusions
Alternative Phillips curve specifications based on different assumptions regarding expectation formation point to broadly similar NAWRU results for the euro area Estimates point to a recent rise in the NAWRU suggesting that post-crisis unemployment increases are to some extent persistent
In the case of Spain alternative Phillips curve specifications yield somewhat different NAWRU results pointing to the current importance for that country of theoretical considerations regarding expectations The NKP which uses rational expectations and relies on RULC growth to identify the unemployment gap yields a more moderate NAWRU increase over recent years than the TKP (hitherto used by DG ECFIN) which allows only for static or adaptive expectations and relies on the signal provided by the change in nominal ULC growth While this sensitivity in the results underlines the need for caution in interpreting NAWRU estimates it should also be borne in mind that all specifications point to an important increase in the NAWRU for Spain at this juncture
The deterioration in the NAWRU signals difficulties that are likely to last beyond the cyclical upturn In interpreting those developments it is important to recognise that changes in the NAWRU can be caused by both structural and non-structural factors While the improvement in the NAWRU in Germany seems to be caused by structural factors the deterioration in Spain seems to be caused more by crisis-related events that have persistent effects due to the presence of various rigidities that tend to slow down the adjustment process
II Special topics on the euro area economy
Volume 13 No 1 | 27
II2 The relationship between government and export sector wages and implications for competitiveness (26)
In 2012 the general government sector employed on average about 15 of the labour force in the euro area Since most countries in the euro area are now trying to consolidate public finances whilst also trying to boost competitiveness for external rebalancing and to reduce unemployment it is crucial to assess whether there is any wage spillover from the public to the export sector in particular under conditions of fiscal stress This section shows that there has been a link between government and manufacturing wages over the long-run which is much closer when the government employs a large share of the labour force Government size dimension is especially important during fiscal consolidation If the government wage bill is inflated due to unjustified wage premia for example limiting government wage growth is a fiscal strategy that may among other effects deliver competitiveness gains that contribute to external rebalancing and help boost employment in the tradable sector
-----------------------
Introduction
General government employment accounts for a considerable share of the labour force in the euro area It stood at about 15 in 2012 with but some cross-country variation The evolution of government wages is likely to have an impact not only on fiscal variables and on the sustainability of public finances but also on the labour market on cost competitiveness and on external rebalancing within the euro area This section looks at the relationship between public and private sector wages at a time when most euro area countries are trying to consolidate their public finances improve competitiveness to support external rebalancing whilst also having to tackle high unemployment levels (27)
Changes in general government compensations may spill over into the private sector through both
(26) Section prepared by Benedicta Marzinotto and Alessandro Turrini
(27) Throughout the section the public sector is referred to alongside general government which refers to public offices at all levels of government non-market public owned hospitals schools and social security organizations Thus the term public is used as a synonym for general government
market-based and institutional channels For example excessive government wages may crowd out private sector employment inflating cost conditions and leading to competitiveness losses (28) There are channels of transmission also in the opposite direction from the private to the government sector Wage growth linked to productivity improvements in the private sector can spill over into the public if there is labour mobility across sectors This can affect governments capacity to keep wage expenditure growth under control
Against this background this section analyses the relationship between general government and manufacturing wages in order to assess the potential for and conditions of a wage spillover from the insulated government sector to the export sector The relationship is analysed by looking at a sample of EU countries over the period 1980-2013 in a co-integration framework that makes it possible to distinguish between long-run and short-run effects The relationship between the two wages is also assessed for different fiscal scenarios differentiating between normal periods and periods of fiscal adjustment
The various forms the relationship takes
The relationship between public and private wages takes many forms It may be influenced by market forces andor by institutional features of the wage setting system in each country Changes in private wages can affect government wage growth in the following ways
bull Wage bargaining in the private sector has ademonstration effect on public wage-settersPerez and Sanchez (2011) find evidence ofsignalling by the private sector in thenegotiation phase in France and Germanybefore the EMU period (29) Signalling may bemotivated by envy effects that reflect thestrength of the wage-bargaining position (30) or
(28) See for example Alesina A and R Perotti (1997) The welfare state and competitiveness American Economic Review Vol 87 pp 921-939 Alesina A Ardagna S Perotti R and Schiantarelli F (2002) Fiscal policy profits and investment American Economic Review Vol 92(3) pp 571-589 Ardagna S (2004) Fiscal stabilizations when do they work and why European Economic Review Vol 48 pp 1047-1074
(29) Perez JJ and AJ Sanchez (2011) Is there a signalling role for public wages Evidence of the euro area based on macro data Empirical Economics Vol 41(2) pp 421-445
(30) Maffezzoli M (2001) Non-Walrasian labor markets and real business cycles Review of Economic Dynamics Vol 4(4) pp 860-
28 | Quarterly Report on the Euro Area
by the fact that the same trade union negotiates wages for both sectors
bull Wage-bargaining practices may explicitly or implicitly grant wage leadership to the private sector Under the Scandinavian wage-setting model the private export sector typically takes the lead dictating bargaining outcomes to other sectors including the public sector (31)
bull There may also be established practices and institutional mechanisms that make public wages responsive to private wage settlements usually those of the export sector This is the case if for example there is a formal rule under which the growth rate of private wages is automatically applied to public sector wages (32)
It is of course a two-way street Changes in government wages affect private wage growth in a number of ways
bull Wage adjustment in the public sector causes cross-sector labour shifts and a change in the private sectors labour supply As the supply of labour changes so does the competitive private sectors equilibrium wage
bull Adjustments to government wages affect the outside option of unionised private sector bargainers putting pressures on the bargaining process (33) with for example private sector workers tempted to move to the general government sector due to large public wage increases
892 Ardagna S (2007) Fiscal policy in unionized labor markets Journal of Economic Dynamics and Control Vol 31(5) pp 1498-1534
(31) For a review see Lindquist J and R Vilhemsson (2006) Is the Swedish central government a wage leader Applied Economics Vol 38 pp 1617-1625 Friberg K (2007) Intersectoral wage linkages the case of Sweden Empirical Economics Vol 32 pp 161-184 Traxler F and B Brandl (2012) Collective bargaining inter-sectoral heterogeneity and competitiveness a cross-national comparison of macroeconomic performance British Journal of Industrial Relations Vol 50(1) pp 73-98 Ramskloger P (2012) Is there a European wage leader Wage spillovers in the European Monetary Union Cambridge Journal of Economics Vol 36(4) pp 941-962 and (2013) The nationalndashtransnational wage-setting nexus in Europe What have we learned from the early years of monetary integration Journal of Common Market Studies Vol 51(5) pp 916-930
(32) For evidence on the Netherlands see Hartog J and H Oosterbeek (1993) Public and private sector wages in the Netherlands European Economic Review Vol 37(1) pp 97-114
(33) Afonso A and P Gomes (2008) Interactions between private and public sector wages ECB Working Paper No 971
bull Changes in public wages may be fully compensated in government budgets by changes in labour taxation that alter labour costs in the private sector (34) and might also affect union behaviour (35)
Co-movements between government and private wages may also take place in the absence of direct links when driven by factors common to both sectors For example public wages may be pro-cyclical and change in a manner similar to private wages over the cycle (36) Co-movements in aggregate wage series could be linked to developments common to both factors relating to the composition of the labour force
Testing the relationship between government and manufacturing wages
To analyse more systematically the long- and short-term effects of government wages on the export sector a cointegration approach is used linking manufacturing compensations to a number of determinants including compensation in the government sector The long-term relationship is analysed in terms of levels while the Error Correction Mechanism (ECM) equation makes it possible to estimate the short-term relation between export sector wage growth shocks in explanatory variables and their deviation from the long-term relationship The long-term relationship in also analysed in terms of levels using a dynamic ordinary least squares (DOLS) model and the results incorporated in an ECM model
Estimates were made on a sample of 17 EU countries for which data are available over the period 1980-2013 This has not only has the advantage of gaining degrees of freedom and reinforcing the results It also makes it possible to
(34) Holmlund B (1993) Wage setting in private and public sectors
in a model with endogenous government behaviour European Journal of Political Economy Vol 9(2) pp 149-162
(35) The spillover from the public to the private sector is likely to be mediated by the structure of wage-setting systems Alesina and Perotti (1997) find that increases in labour taxation do not necessarily lead to higher wage demands by unions in highly centralised bargaining systems as large wage setters would internalise the consequences from higher labour costs on employment
(36) For instance Lane (2003) and Lamo et al (2007) find that public wages are pro-cyclical because of discretionary fiscal expansion in good times Lane P (2003) The cyclical behaviour of fiscal policy evidence from the OECD in Journal of Public Economics Vol 87 pp 2661-2675 Lamo A Perez JJ Schuknecht L (2007) The cyclicality of consumption wages and employment of the public sector in the euro area ECB Working Paper No 757
II Special topics on the euro area economy
Volume 13 No 1 | 29
investigate the role of framework conditions in bringing the impact of general government to bear on manufacturing wages by means of appropriate sample splits Box II21 shows the estimation methodology and the results
Much of the variance in manufacturing wages is explained by variables usually used when estimating wage equations (ie the price level labour productivity and the unemployment rate) and by general government wage levels Both the long- and short-term elasticity of manufacturing wages with respect to government wages is estimated to be around 03-04 This tallies with the results of similar studies (eg Afonso and Gomes 2008) It works both ways general government wages also react to manufacturing wages They have a long-term elasticity of 08 and a short-term elasticity of 04 (37) This is consistent with the fact that it is more usual for the private sector than for the government to take the lead in terms of wages as the available literature also shows (38) The DOLS cointegration estimation delivers qualitatively identical results The results are still valid when the sample is restricted to just the euro area (39) The relationship tested on real wages is symmetrical because manufacturing wages respond to government wages whether they are increased or reduced
One hypothesis tested here is whether the size of the government sector determines the extent to which changes to government wages affect average conditions on the private market if for example there is cross-sector mobility In order to test how this market-based channel works the same EU sample is split into two groups of countries those in which the average share of government to total employment is above the whole EU samplersquos median and countries in which it is below the median Results show that in the long-run the impact of public on manufacturing wages is considerably higher in the case of large public sectors This divide disappears in the short-run In the opposite direction going from manufacturing to public wages the split does not produce differentiated results This confirms that government size matters when it comes to the public sectors long-term impact on the labour
(37) The results are not shown (38) Perez JJ and AJ Sanchez (2011) (39) Still it should be noted that the sample used excludes some key
countries in the euro area
market The DOLS methodology confirms these results (40)
Another hypothesis that is tested is whether the way wages are set in the public sector increases the chances of manufacturing wages reacting to government wages Broadly speaking two wage-setting systems may be identified
bull This first is that wages are mainly set on thebasis of collective bargaining
bull The second is that wages are set on the basis ofunilateral decision by the government (41)
The results show that the way wages are set does not fundamentally alter the relation between government and manufacturing wages in the long- or the short-term It is however interesting to note that across all methodologies used the relationship between manufacturing wages and labour productivity is weaker in countries characterised by a unilateral decision wage-setting system This is probably because in such a case the spillover from public to private wages is such that private wages tend to be misaligned with sectoral productivity This is not the case when government wages are set through a collective bargaining wage-setting system possibly because bargaining processes even in a particular type of insulated sector such as the public one reflect market forces more than a unilateral government decision
The relationship between government and manufacturing wages under fiscal stress
Most countries in the euro area have recently been trying to cut government wage bills by freezing wages cutting or retrenching specific indemnities or benefits (including bonuses andor holidays) or blocking turnover As a result the share of government compensations in total government spending has fallen Between 2008 and 2012 this fall was particularly sharp for Latvia Portugal and Romania followed by Hungary Spain Denmark and Estonia (Graph II21)
(40) The results from the DOLS are not shown (41) For a classification of EU wage-setting systems in the government
sector see European Commission Directorate for Economic and Financial Affairs (2014) Government wages and labour market outcomes Occasional Paper forthcoming
30 | Quarterly Report on the Euro Area
(Continued on the next page)
II Special topics on the euro area economy
Volume 13 No 1 | 31
Box (continued)
(Continued on the next page)
32 | Quarterly Report on the Euro Area
Box (continued)
II Special topics on the euro area economy
Volume 13 No 1 | 33
The recent crisis marked a watershed in the evolution of public compensations Between 1999 and 2007 relative government wage growth did not vary from cold-shower periods (or periods of more gradual fiscal consolidation) to periods of non-consolidation (42)
Graph II21 Change in the share of general government compensations to
total spending (2008-2012 in pp)
Source DG ECFIN calculations based on AMECO
Conversely starting with the 2008-2009 crisis compensations per employee in the government sector grew more slowly compared with those in the manufacturing sector and more clearly so during fiscal consolidation (Graph II22)
It is possible that under conditions of fiscal stress the relationship between government and export sector wages differs from that of normal periods This aspect has been neglected in previous analyses To shed some light on it Table II21 shows the correlation between government wage growth and manufacturing wage growth under alternative fiscal conditions (consolidation and non-consolidation) differentiating between countries with large and small public sectors The evidence shows that the two wages are closely related in periods of fiscal stress only if the government employs a large share of the labour forces This suggests that the possibility of
(42) By convention episodes of fiscal consolidation are defined as those during which the structural primary balance improves by at least 15 per cent of GDP in one year or at least 3 per cent in three years with a minimum improvement of 05 per cent in each year Such a definition makes it possible to distinguish between cases of cold-shower consolidation episodes and more gradual consolidation episodes
expenditure-based fiscal consolidation having the type of supply-side effects described in Alesina and Perotti (1997) Alesina et al (2002) and Ardagna (2004) may be a consequence of the size of the public sector among other things
Graph II22 Government and manufacturing compensations under
alternative fiscal conditions EU countries (1999-2007 and 2008-2012 avg annual change)
Source DG ECFIN calculations based on OECD
Table II21 Correlation between government and manufacturing
compensations growth under alternative fiscal conditions EU (1)
(1) Pearson correlation coefficients Sample EU countries (excluding AT BG CY DE EL LT LV MT RO SI) over 1980-2012 (1995-2012 in the case of CZ EE HU SK) Source DG ECFIN calculations based on OECD
Concluding remarks
Spillovers which are the result of high wages in the general government sector have been mentioned as one of the drivers of competitiveness losses in
34 | Quarterly Report on the Euro Area
some countries in the euro area before the crisis (43)
The results presented here speak to this debate and may be summarised as follows Government wage levels have a long-term impact on wages in the manufacturing sector even more so in countries in which the government sector employs a relatively large share of the labour force That said their short-term impact remains unaffected by the size of the public sector Looking at it the other way round manufacturing wages usually have a greater impact on government wages regardless of size This is arguably because private sector wage leadership is more common than public sector wage leadership
(43) Blanchard O (2007) Adjustment within the euro The difficult
case of Portugal in Portuguese Economic Journal 61 1-21
The way government wages are set also plays a role In collective bargaining systems not only are government and manufacturing wages related in both the long- and the short-term (as they are also when the government sets wages by unilateral decision) Also most importantly wages in the tradable sector are better aligned with labour productivity The evidence provided here indicates that if the government wage bill is inflated for example due to unjustified wage premia limiting public wage growth would spill over into the private export sector reducing labour costs and helping boost competitiveness and employment in the sector Whilst structural reforms including skill upgrading in manufacturing are an important and necessary ingredient for achieving non-reversible gains in competitiveness the adjustment of competitiveness through fiscal policy remains a complementary tool to deliver sustained external rebalancing
II Special topics on the euro area economy
Volume 13 No 1 | 35
II3 Latvia maintaining sustainable growth after the boom-bust years (44)
Latvia had been keen to join the euro area at the earliest opportunity with entry in January 2008 the clear target As the economy overheated however significant macro-economic imbalances accumulated which deferred these plans Between 2005 and 2007 unsustainable GDP growth went hand in hand with a mounting current account deficit and a housing market spiralling out of control When credit flows then abruptly reversed the countryrsquos GDP contracted dramatically Latvia was placed in the EUIMF-led financial assistance programme and was forced to carry out ambitious fiscal consolidation and structural reforms Reallocating resources to the tradable sector was the first important step on the road to an export-driven recovery Under the burden of deleveraging and consolidation the revival of domestic demand was slow at first From 2011 however supported by favourable labour market developments growth in demand has accelerated Latvia has reclaimed its position as the fastest-growing EU economy however the current level of growth is lower than the unstainable rates recorded in the boom years and it is now seen as sustainable Thanks to this balanced growth Latvia has not been subject to the MIP since its launch in 2012 Despite the financial assistance-supported measures to preserve equity the social burden of economic adjustment as evidenced by poverty social exclusion and emigration rates has been high but measures are being taken by the authorities to counter these effects Continued commitment to prudent fiscal policies will be critical for the countryrsquos economic future The use of macro-prudential tools to reduce the risks posed by large non-resident financial flows and the implementation of ambitious structural reforms will also play an important role
-----------------------
Introduction
To welcome Latvias recent adoption of the euro this section reviews the countrys recent boom-bust experience and discusses the challenges ahead
Five years ago it would have been difficult to imagine that Latvia would be able to fulfil the conditions for adopting the euro and enter the euro
(44) Section prepared by Gatis Eglitis and Christian Weise
area in January 2014 After EU accession in May 2004 significant macro-economic imbalances had started to accumulate on the back of an overheating economy and by autumn 2008 the country was on the brink of bankruptcy A painful and seemingly impossible economic adjustment to be achieved by means of internal devaluation lay ahead This would require unprecedented fiscal consolidation huge redundancies and difficult structural reforms threatening political and social stability Yet despite pronounced scepticism from the outset and particularly at the height of the crisis in mid-2009 the economy has moved back to growth The measures implemented took some time to take effect with the economy continuing to decline at first before picking up as seen in the lsquoVrsquo-shaped recovery but a protracted recession was avoided Latviarsquos GDP growth has exceeded expectations reaching levels of 54 in 2011 52 in 2012 and around 4 in 2013 The two factors that were critical to the countryrsquos economic recovery were a return to international competitiveness and the rapid correction of external imbalances The budget deficit decreased significantly and is expected to reach a balanced position in the near future The level of government debt is projected to stay around 40-42 of GDP in 2013-2014 and to decline to 33 of GDP in 2015 as the repayments to the EU take effect and sizable cash buffers will be reduced The financial assistance programme was successfully completed in January 2012 Financial support had not been necessary since October 2010 however and the government had re-entered international bond markets in June 2011 well ahead of schedule (45) As of 2013 GDP per capita in constant prices has returned to the level reached at its peak in 2007 Due to the decline in the population however the absolute value of GDP in constant prices was still about 9 below 2007 levels with current projections suggesting that a full recovery to the pre-crisis peak will be achieved in 2015
Overheating imbalances and a big bust
Latvia joined the EU in seemingly good macroeconomic health and having pegged its currency to the Special Drawing Right (SDR) in
(45) Occasional Paper 120 issued by the European Commission Directorate-General for Economic and Financial Affairs EU Balance of Payments assistance for Latvia foundations of success httpseceuropaeueconomy_financepublicationsoccasional_paper2012op120_enhtm
36 | Quarterly Report on the Euro Area
1994 and then to the euro in 2005 was keen to join the euro area in January 2008 Upon entering the Exchange Rate Mechanism II (ERM II) on 2 May 2005 the authorities unilaterally committed to maintaining a smaller fluctuation margin of plusmn1 around the central rate ndash seen as a sign of the countryrsquos determination to join the euro area The Latvian economy was the fastest growing in the EU between 2000 and 2007 and between 2005 and 2007 real GDP growth reached a yearly average of over 10 Following accession to the EU in 2004 Latvia along with other EU countries witnessed a rapid credit expansion Loans to residents grew at an average annual rate of close to 50 between 2004 and 2008 a reflection of the excess liquidity at that time and of the resulting hot money inflows into central and eastern European economies which were rapidly converging with their western European counterparts Foreign investment exploded driven by commercial banksrsquo mispricing of risk and over-optimistic expectations of convergence A number of privatisation deals and most importantly a burgeoning real-estate market characterised by soaring prices also served to attract foreign investors The tradable sector was meanwhile largely neglected By way of illustration foreign direct investment (FDI) reached relatively high levels of 84 and 81 of GDP in 2006 and 2007 respectively but most of this was directed towards the real-estate market while the proportion of total FDI relating to manufacturing was only 12 in 2013 Significant imbalances were accumulating as indicated by a current account deficit that reached around 22 of GDP in 2006 and 2007 and by labour market tightening Nominal wages doubled between 2004 and 2007 increasing much faster than productivity and thus damaging international competitiveness
By early 2008 more cautious bank lending had caused economic growth to slow significantly By autumn of the same year this slowdown had developed into a strong contraction reflecting the wider global economic situation The global economy fell into recession commodity prices reached record highs and the general risk aversion seen in global markets following the collapse of Lehman Brothers cut off Latviarsquos access to financial markets The second largest domestic bank Parex had to be rescued Latvia ultimately experienced the most severe GDP contraction of all EU countries at close to 18 in 2009 The government deficit threatened to spiral out of control Having been at 03 of GDP in 2007 and 42 in 2008 in spring 2009 it was projected to
reach levels well above 15 of GDP by the end of year in the absence of a significant consolidation package
Faced with an economic crisis of this order Latvia agreed a medium-term financial assistance programme the balance of payments programme (BoP) with the EU and the IMF in December 2008 (46) The aim of this was to preserve the existing exchange-rate arrangement The assistance offered to Latvia was made subject to a number of policy conditions relating to fiscal consolidation financial sector stabilisation and the introduction of a wide range of structural reforms including a significant acceleration in the absorption of EU structural funds The Latvian government also undertook to strengthen the social safety net so as to protect the most vulnerable from the effects of the crisis
Brave measures in difficult times
Given that the exchange rate was at that time pegged to the euro some economists suggested devaluation as the only way out of the crisis The national authorities and international partners did not see that as a viable option however because its effectiveness would have been severely limited by the degree to which imports were used in the manufacture of exports and the high proportion of foreign liabilities Furthermore it would have brought with it the risk of mass bankruptcy and a partial collapse of the domestic banking system at a time when the judicial system was clearly not capable of coping with such a fall-out In addition devaluation would have provided no incentive to solve Latviarsquos structural problems including weak fiscal governance the unsustainability of pension expenditure loss-making state-owned banks a lack of competitiveness and weak institutions
Between 2009 and 2011 the Latvian government carried out an ambitious programme of fiscal adjustment designed to correct the previously loose fiscal policy the weaknesses of which had been hidden by the countryrsquos strong economic growth This difficult adjustment restored Latviarsquos public finances to better health and established a
(46) Funds available from EU countries IMF World Bank EBRD
and Norway amounted to euro 75 billion of which Latvia used euro 45 billion (60) with euro 29 billion lent by the European Commission on behalf of the EU The first tranche of EUR 1 billion (13 of the total) was repaid by Latvia on 25 March 2014
II Special topics on the euro area economy
Volume 13 No 1 | 37
framework which would be sustainable in the long term The nominal balance improved with the deficit being cut from 98 of GDP in 2009 to 13 of GDP in 2012 and 2013 (see graph II31) The structural deficit also fell from its peak of 55 of GDP in 2008 to around 025 of GDP in 2012 and 2013 beating Latviarsquos medium-term objective of -05 of GDP as set in the convergence programmes
Latviarsquos fiscal consolidation measures were undoubtedly bold with fiscal savings equivalent to around 17 of GDP implemented within three years The measures were frontloaded and half of these savings were implemented in the first year alone The measures were on the whole expenditure-oriented with over half of the savings coming from cuts to health education and public administration budgets The most notable measure relating to revenue was an increase in VAT from 18 to 22 The consolidation strategy was eventually successful in containing the adverse effects of the budget deficit on the economy In fact it even appears to have triggered lsquonon-Keynesianrsquo effects on demand by restoring confidence and stimulating demand and investment at the point when it was most needed (47)
Graph II31 Latviarsquos government budget balance and debt (2008-15 of GDP)
Source DG ECFIN Commissionrsquos spring 2013 forecast
The fiscal framework was also strengthened significantly by the law on fiscal discipline coming into force in March 2013 and the creation of a fiscal council in January 2014 The signing of the
(47) Ibid see Chapter 4 Fiscal consolidation in the midst of the crisis
Treaty on Stability Coordination and Governance in the EMU (48) in March 2012 provided further EU-level support for the national fiscal framework
An additional factor that was critical to the success of the consolidation strategy but is often overlooked was the availability of significant EU funds (particularly from around 2009 onwards) which acted as a much-needed demand trigger in sectors affected by the decline in economic activity Between 2007 and 2013 Latvia benefited from the third highest allocation of EU funds after Hungary and Lithuania receiving a yearly average equivalent to around 28 of GDP or 70 of gross fixed capital formation(49) As on average every euro of national budget spending was supplemented by five to six euros co-financing from EU funds national expenditure on items such as road and public building construction vocational education and training of unemployed science infrastructure development and healthcare was often replaced by Structural funds financing despite being in conflict with the EU funds additionality principle Clearly such large inflows of EU financing also generated substantial tax revenues in particular VAT at a time when private consumption was weak
The Latvian labour market demonstrated a high level of flexibility during the crisis thanks in part to a decentralised wage-setting system Significant public-sector wage cuts indirectly supported nominal wage reduction in the private sector in 2009 and 2010 when earnings per employee fell by a total of 19 over two years Employment levels fell sharply especially in the private sector as jobs were cut in construction and manufacturing The unemployment rate reached around 20 in early 2010 but had fallen back to 119 by 2013 due mainly to growth in employment with the participation rate also increasing significantly over this period The projection from the Commissionrsquos 2014 winter forecast shows wages in 2014-15 growing broadly in line with productivity although the labour market is tightening and structural problems in particular regional differences and skill mismatches could create pressures in the economy
(48) httpeuropean-councileuropaeumedia639235st00tscg26_en12pdf
(49) Source Directorate-General for Regional Policy Infoview
38 | Quarterly Report on the Euro Area
External cost competitiveness has improved noticeably since 2008 with labour costs falling significantly and labour productivity in particular in the tradable sector increasing In 2008 the real effective exchange rate (REER) adjusted for unit labour costs reached a peak of 64 above the 2000 level before falling by about 20 in 2009-10 since when it has remained broadly stable (see graph II32) This level of REER is considered sustainable as the country has been seen to be steadily gaining market share over recent years (including as measured by exports adjusted for the growth of markets) The percentage of the countryrsquos GDP attributable to exports rose to 60 in 2013 from 43 in 2007 with some 60 of exports destined for the EU and 12 for Russia
Graph II32 Effective exchange rates Latvia v 35 trading partners
(Jan 2007-Dec 2013 monthly avg 2007 = 100)
Source DG ECFIN
The social burden of economic adjustment has admittedly been high in Latvia despite the policy measures contained in the Memorandum of Understanding stipulating inter alia establishment of a comprehensive social safety net supporting local governments in providing social assistance and discounting social payments from overall budget targets High unemployment has led to a wave of emigration to richer EU countries which coupled with Latviarsquos low fertility and high death rates has seen the population decrease by 8-10 since 2008 Net emigration has now fallen substantially however since the peak of the crisis years The rates of poverty and social exclusion in Latvia are among the highest in the EU families with children unemployed people people with disabilities and people living in rural areas are particularly at risk The countryrsquos spending on
social protection and healthcare as a percentage of GDP is among the lowest in the EU Furthermore the social protection measures which do exist to reduce poverty tend to be ineffective highlighting the importance of a robust social safety net It appears however that with the improved economic situation and increasing levels of general social awareness the authorities are finally starting to address the challenges of poverty and social exclusion with greater determination In recent years for example taxation of low-income earners has been cut slightly and child poverty has been reduced thanks to increases in various child-related benefits Proposals for reforms to social assistance in line with 2013 World Banks study are being gradually implemented Better targeted more effective policies relating to the active labour market mostly financed by the European Social Fund are helping unemployed people in particular the long-term unemployed and young people to find work or to obtain relevant training
As part of the BoP programme and in the context of the assessment of Latviarsquos readiness to join the euro area financial supervision has been tightened and EU resources for supervision and monitoring increased in particular for monitoring the growing non-resident banking sector Additional liquidity and capital adequacy requirements for non-resident banks were introduced in 2013 regular on- and off-site checks of these banks are being performed the deposit guarantee fund has been further strengthened and monitoring has been stepped up in relation to pledged assets and the origin of funds in bank recapitalizations This strengthened regulatory policy has been introduced partly as a result of lessons learnt at significant cost in the past five years most notably with the Parex and Krajbanka failures
Latvia has implemented a series of ambitious reforms to the business environment in recent years with the aim of reducing start-up costs simplifying procedures for property registration construction permits and tax collection and introducing out-of-court settlement of insolvencies In doing so Latvia has brought its regulatory framework a significant step closer to what is regarded as best practice In the World Bankrsquos 2014 Doing Business report Latvia was ranked 25th out of 185 countries with only four euro-area members faring better
II Special topics on the euro area economy
Volume 13 No 1 | 39
Conclusion
The origins of Latviarsquos years of boom and bust can be traced back to the domestic regional and global circumstances at that time globally excess liquidity and hot money flowing into vulnerable countries regionally unrealistic expectations of income convergence in central and eastern Europe and domestically undue optimism about growth in personal incomes and mispricing of risk by commercial banks amplified by the behaviour of both policymakers and individuals
A broad range of country-specific and general economic factors have contributed to the successful economic adjustment seen in Latvia since the height of the crisis Ambitious front-loaded and largely expenditure-based fiscal consolidation helped to contain the budget deficit whilst the confidence generated by the introduction of a credible programme itself aided the economic recovery The flexibility of the labour market meanwhile helped companies to restore competitiveness by means of wage reductions and job cuts Competitiveness was also improved by steps taken to shift the tax burden from labour to consumption and property The recovery in Latvia was very much export-driven with the growth in exports made possible by the openness of the economy and the faster-than-expected economic growth experienced by major trading partners A number of structural reforms including bank restructuring and measures improving the use of EU funds have contributed to the development of a more favourable business environment A generous allocation from the European structural funds meanwhile helped to boost public investment and supported financing and reforms in many important sectors Above all the success of the recovery measures implemented in Latvia proved that for a tough internal economic adjustment to be effective there needs to be both a determined political will to carry out unpopular reforms and also a fully-developed comprehensive social safety net to protect more vulnerable groups
in society during difficult times In addition Latvia benefited from the fact that those looking for work were able to migrate to other EU countries which helped to alleviate the social tension created by the effects of the crisis Some of the lessons above are clearly applicable to other Member States undergoing challenging economic adjustment while others are more Latvia-specific
While Latviarsquos current level of economic growth is regarded as sustainable (50) and the adoption of the euro is recognised as a significant and hard-earned achievement it is not the end of the road The current robust economic situation should be used to advance reforms and improve Latvias long-term growth potential rather than lead to complacency and relaxation of reform efforts Sustainable convergence of the economy in the longer term will require inter alia ongoing commitment to prudent fiscal policies (there are some recent signs of less prudent fiscal decision-making) a continuous use of macro-prudential tools to reduce risks from growing non-resident financial flows especially in view of recent Ukraine events and the implementation of reforms in a number of vested-interest-heavy areas These include higher education and science state owned enterprise management electricity and gas market liberalization and the judiciary including insolvency framework But above all and in order to ensure economic and social sustainability for years to come high rates of poverty social exclusion and dismal demographic trends need to be addressed boldly These and other structural challenges are being addressed by the Commission under the European Semester and the Post Program Surveillance frameworks Also Latvia has joined a euro area that is very different from what it was just a few years ago the euro area economic governance framework has been greatly strengthened entailing stricter obligations
(50) The Commissionrsquos alert mechanism reports issued under the Macroeconomic Imbalance Procedure have not identified economic imbalances in Latvia requiring further in-depth investigation for possible policy action
httpeceuropaeueurope2020pdf2014amr2014_enpdf
40 | Quarterly Report on the Euro Area
II4 Corporate balance sheet adjustment in the euro area and the United States (51)
This section compares balance sheet adjustment in the non-financial corporate sector in the euro area and the United States It shows that the adjustment since the crisis has been faster in the latter Despite similar steep rises in corporate debt in pre-crisis years US corporations have cut debt more than those in the euro area Shifts from loans to bonds and extensions of debt maturity have also been more pronounced in the United States Much of the difference in balance sheet consolidation can be traced back to more positive profitability trends providing US firms with the internal funds necessary to adjust balance sheets Differences in dividend distribution strategies and in corporations physical investment behaviours also played a role Profitability differences reflect differences both in cyclical conditions and labour market adjustment Comparatively slow progress in balance sheet consolidation is likely to weigh on investment recovery in the euro area
-----------------------
Introduction
Both the euro area and the United States experienced a surge in corporate indebtedness in the years preceding the global financial crisis and in its early stages The ratio of debt to gross value added by non-financial corporations (NFCs) rose by about 40 pp between 2005 and 2009 Deteriorating growth prospects and changing attitudes to risk have prompted NFCs in both economies to adjust their balance sheets As previously argued in the Quarterly Report balance sheet adjustment can have a substantial effect on economic activity and it is important to monitor regularly the ongoing adjustment in the euro area (52) This section contributes to the monitoring by comparing progress in corporate deleveraging in the euro area and in the United States two regions where firms entered the crisis with excessive debt
(51) Section prepared by Plamen Nikolov (52) See European Commission (2010) Focus Balance sheet
adjustment in the corporate sector Quarterly Report on the Euro Area Vol9 (3) pp 9-19 A more detailed overview of the literature on the impact of balance sheet adjustment can be found in Cuerpo C I Drumond J Lendvai P Pontuch and R Raciborski (2013) Indebtedness deleveraging dynamics and macroeconomic adjustment European Economy Economic Papers 477
Firms consolidate their balance sheets primarily by raising their net lendingborrowing (NLB) ie the cash obtained from their production activity and available for financial operations (53) A rise in NLB is achieved either by increasing savings or cuttingpostponing physical investment Firms increase savings by raising profits and reducing the dividends distributed to shareholders In firmsrsquo financial accounts a rise in corporate NLB is associated with a rise in financial assets andor a cut in financial liabilities The section reviews recent developments in euro area and US profitability savings and NLB and looks at the instruments that the corporate sector has used to consolidate its balance sheet on both the asset and the liability side
Corporate profits have disappointed in the euro area hellip
National account data show that corporate profitability in the euro area reached a pre-crisis peak in 2007Q3 ie later than in the United States where it had already started to decline in 2007 (54)
Graph II41 NFC profitability euro area and US
(2000Q1-2013Q3 of GVA)
20
25
30
35
40
45
00Q1 01Q3 03Q1 04Q3 06Q1 07Q3 09Q1 10Q3 12Q1 13Q3
Euro area (1)
US
(1)Excluding Latvia Source Eurostat US Bureau of Economic Analysis DG ECFIN calculations
(53) Firms can also consolidate their balance sheets by raising equity (54) Profitability like the other national account variables for the
corporate sector presented in this section is measured as a proportion of corporate sector activity represented by gross value added (GVA) It is calculated as the gross operating surplus plus financial revenues and subsidies and minus financial and tax expenses Financial expenses do not include earnings distributed to shareholders
II Special topics on the euro area economy
Volume 13 No 1 | 41
The 2008-09 recession brought a sharp drop in corporate profitability in the euro area Profitability recovered briefly in 2010 to reach a new peak in 2011 but has declined again since then (Graph II41) In the United States the impact of the crisis was rather muted with profits recovering vigorously after 2008 As a ratio to gross value added (GVA) US corporate profits had already passed their pre-crisis level in 2009 before flattening out in the past two years Overall by 2013 profitability in the euro area was still about 2 pp below its pre-crisis peak while in the United States it stood around 3 pp above
hellip mostly due to weak operating surplus
The disappointing profit performance in the euro area relative to the United States is largely due to differing developments in gross operating surplus Looking at the breakdown of the contribution to the cumulative change in corporate profitability since the start of the crisis there is a marked difference between firms in the euro area and those in the United States (Graphs II42 and II43) (55)
Graph II42 Profitability breakdown of NFCs euro area (1)
(cumulative change in from 2007Q3 peak to 2013Q3)
35
36
37
38
39
40
41
42
-100
-80
-60
-40
-20
0
20
40
60
80
100
07Q4 08Q4 09Q4 10Q4 11Q4 12Q4
Taxes (lhs)
Other net current transfers received (lhs)
Net property income received excl dividends paid (lhs)
Operating surplus (lhs)
Profits(rhs)(2)
(1)Excluding Latvia(2)Profits in of GVA Source Eurostat DG ECFIN calculations
In the euro area a fall in the ratio of operating surplus to GVA dragged overall profitability down after 2008 Despite an improvement in 2011 in
(55) The illustration of the contributions to the cumulative change in profitability only serves to depict the relative importance of the various components of the change in profits since the crisis The starting point for the cumulative change should not be interpreted as a reference point for a desirable profit recovery
2013 operating surplus was still contributing negatively to the cumulative change in profitability since the pre-crisis peak In contrast operating surplus in the United States responded to the crisis earlier than in the euro area but its contribution to the change in profits remained positive
Graph II43 Profitability breakdown of NFCs US
(cumulative change in from 2005Q3 peak to 2013Q3)
24
25
26
27
28
29
30
31
-100
-80
-60
-40
-20
0
20
40
60
80
100
05Q4 06Q4 07Q4 08Q4 09Q4 10Q4 11Q4 12Q4
Taxes (lhs)Other net current transfers received (lhs)Net property income received excl dividends paid (lhs)Operating surplus (lhs)Profits(rhs)(2)
(1) Profits in of GVA Source Federal Reserve Board US Bureau of Economic Analysis DG ECFIN calculations
Unlike operating surplus income tax payments and net income from non-operational activities did not differ significantly between the euro area and the United States (56) In both economies lower corporate tax payments resulting from lower profits generated by NFCs naturally had a positive impact on the cumulative change in profits from the pre-crisis peak
Differences in labour market developments are at the root of differences in profitability
Differences in operating surplus and profitability between the United States and the euro area can be attributed partly to differences in the business cycle In 2011Q1 NFCsrsquo gross value added was still 12 below its pre-crisis peak in the euro area but 11 above in the United States The main channel through which cyclical developments can affect operating surplus is the labour market
(56) In fact the ratio of profit tax payments to profits (a crude measure of an aggregate tax rate) in the euro area and the United States has been almost the same since the start of the crisis falling substantially in 2008-09 indicating that tax policy was not more favourable for profits in one economy than in the other
42 | Quarterly Report on the Euro Area
The cyclicality of operating surplus depends on the impact of the cycle on labour productivity as well as on wages The worse performance of operating surplus in the euro area since 2008 as compared with that in the United States reflects a stronger deterioration in labour productivity accompanied by unfavourable developments in wages per employee
Labour productivity growth in the euro area turned sharply negative in 2009 opening a big gap with the positive (albeit modest) wage growth (Graph II44) In the United States on the other hand labour productivity growth became negative earlier but to a lesser extent and some downward wage adjustment took place in 2009
Graph II44 Labour productivity and wages euro area and US
(2001Q4-2013Q3 y-o-y change)
-4
-3
-2
-1
0
1
2
3
4
5
01Q4 03Q2 04Q4 06Q2 07Q4 09Q2 10Q4 12Q2
Average wage per employee euro area (1) (2)Average wage per employee US (1)Labour productivity euro area (2) (3)Labour productivity US (3)
(1)Real wages calculated by the GDP deflator(2)Euro area excluding Latvia(3)In terms of total employment (thousands) Source Eurostat US Bureau of Economic Analysis US Bureau of Labour Statistics DG ECFIN calculations
There are a number of reasons for the different labour adjustments in the euro area and the United States In the former apart from a higher level of employment protection short-term work schemes were put in place in the early stages of the crisis (57) In addition as labour force adjustment tends to be more costly in the euro area some firms (particularly small firms and those with highly qualified employees) preferred to retain their
(57) According to the OECD Public short-term work schemes have
played an important role in preserving jobs during the crisis in a number of countries although significant hours reductions were also achieved via lower overtime hours hours averaging arrangements and employer initiatives see OECD Employment Outlook 2010 ndash Moving Beyond the Job Crisis
labour force (58) Because of a lack of wage flexibility the higher degree of lsquolabour hoardingrsquo in the euro area came at the expense of lower operating surplus and profits and consequently put a downward pressure on the capacity accumulate internal funds to deleverage
Corporate savings are much lower in the euro area
Negative developments in euro area corporate profitability were reflected in corporate savings which together with physical investment determines the internal funds available for balance sheet adjustment In 2009-10 there was a sharp drop in euro area savings because profits acted as shock absorbers and fell more rapidly than dividend payments leaving less spare cash available In contrast savings by US NFCs increased substantially on rising profits after an early-crisis low point and reached a historically high level of around 23 of GVA in 2010Q3 (Graph II45)
Graph II45 Savings of NFCs (2000Q1- 2013Q3 of GVA)
15
16
17
18
19
20
21
22
23
24
00Q1 01Q3 03Q1 04Q3 06Q1 07Q3 09Q1 10Q3 12Q1 13Q3
Euro area (1)
US
(1)Euro area excluding Latvia Source Eurostat Bureau of Economic Analysis DG ECFIN calculations
The impression that US corporate behaviour has been more geared towards accumulating savings than that in the euro area is reinforced when one looks at dividend distribution Dividends paid by euro area NFCs have been on a declining trend since the start of the crisis but those paid by US firms have also decreased This is remarkable given (58) See Box 12 Labour hoarding across different types of firms in
OECD Employment Outlook 2010 ndash Moving Beyond the Job Crisis
II Special topics on the euro area economy
Volume 13 No 1 | 43
the positive profit developments in the United States (Graph II46) A drop in dividends alongside profit growth suggests that after 2008 US companies preferred to direct a bigger proportion of the profit recovery to corporate savings and thereby balance sheet adjustment The ratio of dividends to profits in the United States has fallen from about one third before the crisis to one quarter now This ratio also dropped in the euro area although by less (59)
Graph II46 Dividends paid of NFCs (2000Q1-2013Q3 of GVA)
0
5
10
15
20
25
00Q1 01Q3 03Q1 04Q3 06Q1 07Q3 09Q1 10Q3 12Q1 13Q3
Euro area (1)
US
(1)Euro area excluding Latvia Source Eurostat Federal Reserve Board DG ECFIN calculations
Disappointing physical investment in the euro area and the United States
Cutting investment in physical assets is another way of reducing excessive indebtedness Corporate investment as a proportion of activity dropped sharply both in the euro area and in the United States in the early stages of the crisis (Graph II47)
After a modest recovery in 2010-11 the investment rate decreased again in the euro area The investment recovery was more solid in the United States but has lost momentum since the end of 2012 and the investment rate remains below its pre-crisis peak Overall it seems that euro area corporations partly compensated for less supportive savings developments than in the US by
(59) Dividend payments are not the only way of distributing profits to shareholders Equity buybacks can also be used for this purpose and firms that choose this option will tend to have higher savings and lower dividends paid
curbing physical investment more than their US counterparts
Graph II47 Investment of NFCs (2000Q1- 2013Q3 of GVA)
15
16
17
18
19
20
21
22
23
24
00Q1 01Q3 03Q1 04Q3 06Q1 07Q3 09Q1 10Q3 12Q1 13Q3
Euro area (1)
US
(1)Excluding Latvia Source Eurostat US Bureau of Economic Analysis DG ECFIN calculations
A more modest increase in net lending in the euro area than in the US
Since 2013 firmsrsquo net lending in the euro area has been in positive territory but substantially less so than that in the United States (Graph II48) Positive NLB in the euro area unlike that in the United States is mostly due to a low investment rate alone rather than low investment combined with high savings The combination of disappointing investment and high savings has translated into historically high and sustained NLB for US firms
This persistent net lending position in the United States is atypical as firms usually invest more than they save It suggests that US firms have been adjusting their balance sheets significantly since the beginning of the crisis via their internal funds while euro area firms seem to have opted for much slower balance sheet adjustment
44 | Quarterly Report on the Euro Area
Graph II48 Net lendingborrowing of NFCs
(2000Q1- 2013Q3 of GVA)
-10
-8
-6
-4
-2
0
2
4
6
8
00Q1 01Q3 03Q1 04Q3 06Q1 07Q3 09Q1 10Q3 12Q1 13Q3
Euro area (1)
US
(1)Excluding Latvia Source Eurostat US Bureau of Economic Analysis DG ECFIN calculations
Debt deleveraging has been more pronounced in the US than in the euro area
The faster pace of adjustment of balance sheets in the United States is confirmed by the corporate debt data (Graph II49) (60) (61) While both the euro area and the United States entered the crisis with swiftly rising and historically high levels of debt deleveraging has progressed more rapidly in the latter since the crisis By the beginning of 2012 US corporate debt had fallen by approximately 15 pp as a proportion of activity while euro area debt had dropped by 7 pp (62)
(60) Non-financial corporate debt consists of loans and securities
other than shares (corporate bonds) both can be classified as short- or long-term depending on whether their original maturity is less or more than one year
(61) This section analyses developments in non-consolidated financial flows and stocks in the euro area and in the United States for two reasons it is important to have a sense of financial positions within the institutional sector eg loans between NFCs are an important part of intra-firm relationships as head offices use them to finance subsidiaries for example perhaps for tax reasons This is relatively more important in the euro area than in the United States Consolidated financial asset and flow data eliminate these intra-sector positions and different approaches may be taken to consolidation as in the euro area there is the additional issue of cross-border consolidation between Member States while there is no need for flows and positions between firms in different US states to be treated separately
(62) The debt-to-equity ratio is another measure of corporate leverage widely followed by investors Faster stock market recovery helped US firms reduce this ratio more than those in the euro area
Graph II49 Debt levels of NFCs(1) (1999Q1-2013Q3 of GVA)
100
120
140
160
180
200
220
99Q1 00Q3 02Q1 03Q3 05Q1 06Q3 08Q1 09Q3 11Q1 12Q3
Euro area (2)
US
(1)Securities other than shares and loans(2)Excluding Latvia Source Eurostat US Bureau of Economic Analysis DG ECFIN calculations
Firms in the euro area and the United States entered the crisis with almost the same level of short-term debt as a proportion of total debt Since the crisis the adjustment away from short-term debt has been significantly more pronounced in the United States suggesting more active balance sheet restructuring
Graph II410 Debt flows of NFCs(1) (1999Q1- 2013Q3 of GVA)
-15
-10
-5
0
5
10
15
20
99Q1 01Q1 03Q1 05Q1 07Q1 09Q1 11Q1 13Q1
Euro area bonds (2)
US bonds
Euro area loans (2)
US loans
(1)Securities other than shares and loans (2)Excluding Latvia Source Eurostat US Bureau of Economic Analysis DG ECFIN calculations
Due to differences in the structure of corporate finance loans (as opposed to bonds) tend to form a bigger proportion of debt in the euro area than in the United States An important element of the
II Special topics on the euro area economy
Volume 13 No 1 | 45
corporate balance sheet adjustment process in both economies has been a movement away from an excessive reliance on loans (Graph II410) and towards bond financing This trend has been substantially more pronounced in the United States presumably reflecting the fact that bond markets are more developed in that country
Developments in non-financial corporate debt were also influenced by developments in financial intermediation in particular in the banking sector Financial accounts show NFCsrsquo debt exposure but do not indicate whether the debt holder is a bank According to bank balance sheet statistics the nominal growth of loans vis-agrave-vis NFCs has been mostly negative in the euro area since 2009Q4 (Graph II411) Coupled with the positive loan inflows seen in the national accounts between 2010Q3 and 2012Q3 (Graph II410) this shows a degree of substitution in corporate loan liability ownership between banks and other financial firms and sectors (including other NFCs) in this period According to the counterparty breakdown of NFC domestic loans published by the ECB corporate borrowings from other NFCs represented 29 of all loans by 2013Q3 (up from 26 in 2008Q1) while the proportion of borrowings from monetary financial institutions (MFIs) had dropped (from 60 in 2008Q1) to an all-time low of 53 The proportion of loans from other non-bank financial intermediaries also increased There is less evidence of a shift from banks to other loan providers in the United States where loans between NFCs are much more limited
Graph II411 Bank loans to NFCs (1999Q1- 2013Q3 y-o-y change)
-20
-15
-10
-5
0
5
10
15
20
25
99Q1 00Q3 02Q1 03Q3 05Q1 06Q3 08Q1 09Q3 11Q1 12Q3
Euro area bank loans to NFCs (1)US bank loans to NFCs
(1)Excluding Latvia Source ECB US Federal Reserve Board DG ECFIN calculations
Positive NLB has been used to acquire safe financial assets in both regions
In both the euro area and the United States the positive NLB has been used to deleverage but also to invest in safe financial assets At the beginning of the crisis much of the positive corporate NLB in the United States was invested in money market mutual funds which is essentially investment in short-term low-risk assets (Graph II412) (63)
Currency and deposits (another type of safe asset) have increased substantially in the euro area in recent years as a proportion of total firm activity (Graph II413) This rise was driven almost exclusively by a rapid increase in firmsrsquo savings deposits To some extent a similar trend is observable in the United States In particular US cash balances (a sub-component of currency and deposits) approached 12 of GVA by the end of 2013 a level not seen since the early 1990s On the other hand savings deposits have grown more modestly resulting in a moderately positive overall trend in currency and deposits
Graph II412 Mutual fund shares of NFCs (1999Q1- 2013Q3 of GVA)
0
2
4
6
8
10
12
14
99Q1 01Q1 03Q1 05Q1 07Q1 09Q1 11Q1 13Q1
Euro area (1)
US (2)
(1)Excluding Latvia(2)In the USA these asset series can be broken down into investment in money market mutual funds and investment in other mutual funds The 2009-11 increase is fully attributable to the former Source Eurostat US Bureau of Economic Analysis DG ECFIN calculations
Overall these two aspects of corporate financial investment behaviour signify considerable liquidity concerns on the part of firms in both the euro area
(63) Euro area financial accounts only show firmsrsquo investment in mutual funds overall and do not distinguish between types of mutual funds
46 | Quarterly Report on the Euro Area
and the United States They also represent a drive towards lower-risk assets perhaps indicating increased risk aversion by corporations or a tendency to postpone physical investment in a context of perceived high uncertainty
Graph II413 Currency and deposits ndash NFCs
(1999Q1- 2013Q3 of GVA)
0
5
10
15
20
25
30
35
40
45
99Q1 00Q3 02Q1 03Q3 05Q1 06Q3 08Q1 09Q3 11Q1 12Q3
Euro area (1)
US
(1)Excluding Latvia Source Eurostat US Bureau of Economic Analysis DG ECFIN calculations
Conclusion
Although both regions saw similar steep rises in corporate debt in the pre-crisis years balance sheet adjustment since the crisis has been significantly slower in the euro area than in the United States The more rapid adjustment in the United States can be explained by a stronger cyclical recovery more supportive profitability developments and reduced dividend payment ratios In the euro area profitability has been hindered by a combination of lower flexibility in the labour markets and slow wage adjustment
The slower balance sheet adjustment in the euro area corporate sector is visible in a slower fall in indebtedness but also a slower adjustment of the structure of balance sheets In particular the shift from loans to bonds and the extension of debt maturity have been more pronounced in the United States In both regions firms have used their positive NLB to accelerate the accumulation of safe and liquid financial assets This could reflect continuing uncertainty regarding future demand and growth prospects
Overall the evidence discussed in this section shows that euro area firms are lagging significantly behind their US counterparts in terms of balance sheet consolidation Given that investment rates remain disappointing even in the more advanced US corporate sector a degree of caution appears warranted when assessing short-term prospects for corporate investment in the euro area
III Recent DG ECFIN publications
Volume 13 No 1 | 47
1 Occasional Papers
European Economy Occasional Papers 170 January 2014 Financial Assistance Programme for the Recapitalisation of Financial Institutions in Spain Fifth Review ndash Winter 2014 httpeceuropaeueconomy_financepublicationsoccasional_paper2014pdfocp170_enpdf
European Economy Occasional Papers 169 December 2013 The Economic Adjustment Programme for Cyprus Second Review ndash Autumn 2013 httpeceuropaeueconomy_financepublicationsoccasional_paper2013pdfocp169_enpdf
European Economy Occasional Papers 168 December 2013 Fiscal frameworks in the European Union ommission services country factsheets for the Autumn 2013 Peer Review httpeceuropaeueconomy_financepublicationsoccasional_paper2013pdfocp168_enpdf
European Economy Occasional Papers 167 December 2013 Economic Adjustment Programme for Ireland - Autumn 2013 Review httpeceuropaeueconomy_financepublicationsoccasional_paper2013pdfocp167_enpdf
European Economy Occasional Papers 166 December 2013 Progress towards meeting the economic criteria for EU accession the EU Commissionrsquos 2013 assessments httpeceuropaeueconomy_financepublicationsoccasional_paper2013pdfocp166_enpdf
European Economy Occasional Papers 165 November 2013 Romania Balance-of-Payments Assistance Programme 2013-2015 httpeceuropaeueconomy_financepublicationsoccasional_paper2013pdfocp165_enpdf
European Economy Occasional Papers 164 November 2013 The Economic Adjustment Programme for Portugal Eighth and Ninth Review httpeceuropaeueconomy_financepublicationsoccasional_paper2013pdfocp164_enpdf
European Economy Occasional Papers 163 November 2013 Financial Assistance Programme for the Recapitalisation of Financial Institutions in Spain Fourth Review ndash Autumn 2013 httpeceuropaeueconomy_financepublicationsoccasional_paper2013pdfocp163_enpdf
European Economy Occasional Papers 162 October 2013 Economic Adjustment Programme for Ireland Summer 2013 Review httpeceuropaeueconomy_financepublicationsoccasional_paper2013pdfocp162_enpdf
2 Economic papers
European Economy Economic Papers 514 February 2014 Martin Larch Kristin Magnusson Bernard Balint Tatar Hard work and More How to successfully conduct adjustment with official assistance httpeceuropaeueconomy_financepublicationseconomic_paper2014pdfecp514_enpdf
European Economy Economic Papers 513 February 2014 Florian Woumlhlbier Caterina Astarita Gilles Mourre Consolidation on the revenue side and growth-friendly tax structures an indicator based approach httpeceuropaeueconomy_financepublicationseconomic_paper2014pdfecp513_enpdf
48 | Quarterly Report on the Euro Area
European Economy Economic Papers 512 December 2013 Alexander Schwan Etienne Sail Assessing the economic and budgetary impact of linking retirement ages and pension benefits to increases in longevity httpeceuropaeueconomy_financepublicationseconomic_paper2013pdfecp512_enpdf 3 Other publications
Winter forecast 2014 - EU economy recovery gaining ground httpeceuropaeueconomy_financepublicationseuropean_economy2014pdfee2_enpdf 4 Regular publications
Business and Consumer Surveys (harmonised surveys for different sectors of the economies in the European Union (EU) and the applicant countries) httpeceuropaeueconomy_financedb_indicatorssurveysindex_enhtm Business Climate Indicator for the euro area (monthly indicator designed to deliver a clear and early assessment of the cyclical situation) httpeceuropaeueconomy_financedb_indicatorssurveysdocuments2013bci_2013_11_enpdf Key indicators for the euro area (presents the most relevant economic statistics concerning the euro area) httpeceuropaeueconomy_financedb_indicatorskey_indicatorsindex_enhtm Monthly and quarterly notes on the euro-denominated bond markets (looks at the volumes of debt issued the maturity structures and the conditions in the market) httpeceuropaeueconomy_financepublicationsbond_marketindex_enhtm Price and Cost Competitiveness httpeceuropaeueconomy_financedb_indicatorscompetitivenessindex_enhtm
50 | Quarterly Report on the Euro Area
Editor-in-Chief Elena Flores
Overall coordination Eric Ruscher
Data assistance Christos Zavos
Comments on the report would be gratefully received and should be sent to
Elena Flores Director ndash Policy Strategy and Coordination Directorate-General for Economic and Financial Affairs Office CHAR 1566
B-1049 Brussels
Email elenafloreseceuropaeu
or
Eric Ruscher Head of Unit ndash Macroeconomy of the euro area Directorate-General for Economic and Financial Affairs Office CHAR 15248
B-1049 Brussels
Email ericruschereceuropaeu
HOW TO OBTAIN EU PUBLICATIONS Free publications bull one copy
via EU Bookshop (httpbookshopeuropaeu) bull more than one copy or postersmaps
from the European Unionrsquos representations (httpeceuropaeurepresent_enhtm) from the delegations in non-EU countries (httpeeaseuropaeudelegationsindex_enhtm) by contacting the Europe Direct service (httpeuropaeueuropedirectindex_enhtm) or calling 00 800 6 7 8 9 10 11 (freephone number from anywhere in the EU) () () The information given is free as are most calls (though some operators phone boxes or hotels may charge you)
Priced publications bull via EU Bookshop (httpbookshopeuropaeu) Priced subscriptions bull via one of the sales agents of the Publications Office of the European Union
(httppublicationseuropaeuothersagentsindex_enhtm)
KC-AK-14-001-en-n
- Blank Page
- Blank Page
- Blank Page
- Blank Page
-

II Special topics on the euro area economy
Volume 13 No 1 | 21
II1 New estimates of Phillips curves and structural unemployment in the euro area (15)
The Phillips curve can be used to estimate the non-cyclical part of unemployment In such models this estimate is commonly referred to as the lsquonon-accelerating wage rate of unemploymentrsquo (NAWRU)(16) The Phillips curve can be specified in various ways reflecting different assumptions regarding the formation of expectations DG ECFIN has recently extended its framework to cover rational expectations This section looks at the sensitivity of the results to alternative expectation assumptions reporting NAWRU estimates based on Phillips curves produced using rational expectations and those (as used to date) allowing only for static or adaptive expectations
Our findings show that for the euro area as a whole the alternative expectation assumptions yield similar NAWRU estimates In particular the NAWRU appears to have increased recently suggesting a deterioration of labour market performance beyond what could be considered merely cyclical For Spain however the results vary more depending on the assumptions used The Phillips curve based on rational expectations points to a more moderate NAWRU increase than that used by DG ECFIN to date However all estimates point to a substantial post-crisis increase in the NAWRU for Spain
In interpreting the rise in the NAWRU it is important to bear in mind that both structural and non-structural factors are driving developments Analysis shows that in the presence of rigidities crisis-related events can have temporary but long-lasting effects on labour market performance Structural factors can play a role too as illustrated by the steady decline in the NAWRU in Germany which appears to be related to structural effects brought about by the Hartz reforms
-------------------------------
(15) Section prepared by Fabrice Orlandi (16) The Phillips curve features a relationship between the
unemployment gap and an inflation or labour-cost variable In the case of the former the non-cyclical unemployment estimate obtained is usually referred to as the lsquonon-accelerating inflation rate of unemploymentrsquo (NAIRU) while with the latter it is referred to as the lsquonon-accelerating wage rate of unemploymentrsquo (NAWRU)
Introduction
Unemployment rates increased sharply in the euro area in the wake of the crisis and the surge has proved particularly persistent Assessing this development is of paramount importance to policy-makersrsquo efforts to find adequate responses to the effects of the crisis
The non-cyclical part of unemployment play a key role in this assessment as it identifies the proportion of the deterioration that is likely to last beyond the business cycle In the EU context this indicator is particularly important as it is a factor to be fed into the potential output calculations used to compute cyclically-adjusted fiscal figures important benchmarks for country surveillance under the EUrsquos fiscal framework(17)
The non-cyclical part of unemployment is not an observable variable however and has to be estimated which means that it is subject to uncertainty In part the uncertainty stems from the fact that different estimation models are available The Phillips curve is commonly used as a key element in estimation models(18) but can itself be specified in various ways most notably reflecting alternative assumptions as to the formation of expectations(19)
This section sets out DG ECFINrsquos approach to estimating the non-cyclical part of unemployment in particular in its use of the Phillips curve We also investigate the sensitivity of the results to alternative expectation assumptions highlighting the results obtained for the case of rational expectations the case recently incorporated in DG ECFINrsquos estimation framework
The results presented here focus on the euro area but results are also reported for Spain and Germany two countries that have witnessed starkly different non-cyclical unemployment developments
(17) For details on the EUrsquos SGP framework see Vademecum on the Stability and Growth Pact European Economy mdash Occasional Paper No 151 DG ECFIN European Commission May 2013
(18) For an illustration of structural unemployment analysis based on an alternative concept see eg Unemployment dynamics during recessions and recoveries Okunrsquos law and beyond IMF WEO April 2010
(19) For details on the Phillips curve see Fuhrer J YK Kodrzycki GP Olivei and J Sneddon Little Understanding inflation and the implication for monetary policy mdash a Phillips curve retrospective MIT Press 2009
22 | Quarterly Report on the Euro Area
in the recent past We use long time series usually starting in 1965 to capture medium-term cycles The latest DG ECFIN forecasts are also included in the dataset
Alternative NAWRU models
Non-cyclical unemployment is estimated on the basis of models that pin-down its statistical and economic properties DG ECFINrsquos approach relies on an lsquounobserved componentrsquo model which features a Phillips curve The curve links cyclical unemployment (ie the unemployment gap) to labour cost developments while non-cyclical unemployment is assumed not to be affected by labour cost developments In this setting non-cyclical unemployment estimates are commonly referred to as the lsquonon-accelerating wage rate of unemploymentrsquo (NAWRU)(20)
The specification of the Phillips curve reflects particular assumptions made regarding inflation expectations In the past DG ECFINrsquos considered only static and adaptive expectations More recently the case of rational expectations has been added providing a more comprehensive framework (see Box II11)
More specifically the so-called traditional Keynesian Phillips (TKP) curve based on static or adaptive expectation assumptions a positive unemployment gap ( minus lowast) with a fall in the change of the growth rate of nominal unit labour cost (∆ ) (and vice versa) ∆ = minus ( minus lowast) The new Keynesian Phillips (NKP) curve based on rational expectations implies that a positive unemployment gap ( minus lowast) is associated with a fall in the growth rate of real unit labour cost (∆ ) Lagged effects are also relevant because some wage-setters may use ad hoc rules and not fully optimise = ∆ minus ( minus lowast)+ ( minus lowast ) (20) For further details on the DG ECFIN approach see DrsquoAuria F
C Denis K Havik K Mc Morrow C Planas R Raciborski W Roumlger and A Rossi (2010) The production function methodology for calculating potential growth rates and output gaps European Economy mdash Economic Paper No 420 DG ECFIN European Commission July 2010
These alternative Phillips curves thus rely on different labour cost indicators to determine the unemployment gap (and thus also the NAWRU) namely ∆ and ∆ As explained in Box II11 this does not mean that the models are fundamentally different Instead it illustrates the impact of assumptions as to expectation formation on the specification of the Phillips curve
NAWRU developments
For the euro area as a whole NAWRU estimates based on the TKP and the NKP show a similar pattern (see Graph II11)(21) The similarity suggests that for most countries in the euro area results are not overly sensitive to the specification of the Phillips curve (ie to assumptions as regards expectation formation) In practice it also suggests that alternative labour cost indicators (ie change in unit labour cost (ULC) growth and real unit labour cost (RULC) growth) underwent broadly similar developments in the euro area this is confirmed by the top chart in Graph II12
Graph II11 shows that non-cyclical unemployment in the euro area posted a steady increase up to the mid-90s followed by an improvement that was then halted by the recent crisis The recent rise in the NAWRU suggests that the increases in unemployment seen in the aftermath of the crisis are to some extent likely to last beyond the cyclical upturn
Graph II11 also shows NAWRU developments for Spain and Germany illustrating the diversity within the euro area Spain has witnessed developments that have been similar to though more dramatic than those in the euro area as a whole Germany posted a starkly different profile with its NAWRU falling steadily (from 2002 according to the NKP or 2004 according to the TKP)
As regards sensitivity the NAWRU estimates for Spain vary considerably depending on the specification With the NKP the recent increase is more moderate with the NAWRU reaching 220 by 2015 while the estimated level with the TKP is 264 Recent results for Germany are less sensitive to assumptions regarding expectations (21) NAWRUs referred to in this section are those computed for the
Commissionrsquos 2014 winter forecast Latest available NAWRUs can be downloaded from the AMECO database httpeceuropaeueconomy_financeameco
II Special topics on the euro area economy
Volume 13 No 1 | 23
with the two Phillips curve specifications producing similar NAWRUs However around
Graph II11 Alternative NAWRU estimates euro area Germany and Spain (1)
(1965-2015 in )
(1)GDP weighted average of euro-area countries for which alternative NAWRUs have been computed (ie AT BE DE EL ES FI FR IE IT NL and PT) For AT both NAWRUs are based on the backward-looking model as the forward-looking model yields econometrically unsatisfactory results (2)Component of the NAWRU explained only by structural determinants (see Orlandi (2012) op cit) Source DG ECFIN calculations based on Eurostat data
2005 some difference across the two specifications is observed for Germany with the NKP producing a relatively less volatile NAWRU Given that the current NAWRU estimates for Germany based on the TKP and NKP specifications do not diverge greatly and taking into account the stability considerations in moving to a new specification Germany continues to use the TKP specification
NAWRU differences for Spain depending on the curve specification stem from corresponding differences between the labour cost indicators used Graph II12 shows that recently RULC growth posted greater and more persistent moderation in Spain than change in nominal ULC growth For Germany the indicators have followed more similar paths over recent years (as they have in the euro area as a whole) More fundamentally in times of heightened economic volatility andor big labour market adjustments (eg recent crisis Hartz reforms) the TKP model is likely to yield NAWRUs that are more pro-cyclical as it does not take full account of the price rigidities that play an important role in the adjustment process of the labour market These rigidities are better reflected in the NKP model
To sum up except in the case of Spain recent NAWRU estimates for the euro area do not appear to be sensitive to assumptions as regards expectations with alternative Phillips curve specifications yielding similar results Overall results point to a recent increase in the NAWRU across the euro area with the notable exception of Germany A rise in the NAWRU points to persistent deterioration in labour market performance Identifying the causes of the deterioration calls for cautious interpretation however
NAWRU versus Structural Unemployment
Understanding the sharp and protracted rise in unemployment in the wake of the crisis is of paramount importance from a policy perspective What caused the rise Is it a sign of structural deterioration Or is it purely cyclical reflecting the prolonged slowdown These questions are the subject of lively debate with views ranging from lsquoitrsquos all demandrsquo(22) to lsquoitrsquos allmostly structuralrsquo(23)
(22) See eg Krugman P (2010) Debunking the structural unemployment myth New York Times 28 September 2010
24 | Quarterly Report on the Euro Area
(23) See eg Kocherlakota N (2010) Inside the FOMC speech at
Marquette Michigan 17 August 2010
(Continued on the next page)
II Special topics on the euro area economy
Volume 13 No 1 | 25
In particular changes in the NAWRU are sometimes interpreted as a sign of a structural change Careful analysis of developments in the NAWRUs produced by DG ECFIN shows that they can be driven by both structural and non-structural factors(24)
In particular crisis-related shocks (eg unwinding of unsustainable developments) especially boom-bust episodes in the housing market that can trigger a lengthy process of deleveraging in the construction sector have a statistically significant impact on the NAWRU The real interest rate and Total Factor Productivity (TFP) growth which controls more generally for the presence of such shocks also play a part in driving NAWRU develpoments
At a theoretical level adding various rigidities (eg real wage rigidity cyclical price mark-ups or sluggish adjustment of the reservation wage) to the traditional labour market model can be shown to yield a NAWRU that is not solely determined by structural factors
Despite uncertainties the NAWRU remains a useful policy indicator It is a well-defined concept that provides useful information on the nature of unemployment rate developments In particular it identifies risks of persistent labour market deteriorations that may not always be caused by structural phenomena(25)
In this context it appears useful to distinguish between the NAWRU and a narrowly defined notion of structural unemployment affected only by structural factors as shown in Graph II11 by
(24) For further details see Orlandi F (2012) Structural unemployment and its determinants in the EU countries European Economy mdash Economic Paper No 455 DG ECFIN European Commission May 2012
(25) For further details see Cyclical and structural unemployment in the euro area in Labour Market Developments in Europe 2013 European Commission
the lsquostructural unemploymentrsquo series The latter represents the portion of the NAWRU that according to econometric results appears to be explained by structural features of the labour market As can be seen the series has remained broadly stable during the crisis Except for a notable decline due to structural labour market reforms in Germany change in the NAWRU in the euro area is not related to structural change This is also the case in Spain where structural unemployment has remained broadly stable
Recent increases in the euro-area NAWRU should therefore not be interpreted as a sign of big structural change at the current juncture Rather in most countries the increases reflect the effects of shocks that in the presence of various rigidities have a long-lasting impact on unemployment rates
To sum up the decline in the NAWRU at euro-area level and in countries like Spain in the run-up to the crisis appears mostly attributable to non-structural factors such as unsustainable developments in the housing sector The build-up and subsequent unwinding of imbalances has caused large economic shocks (eg need for sectoral reallocation) which have a persistent effect on the performance of the labour market However in some countries structural factors have also played a role in driving NAWRU developments In Germany for example the decline in the NAWRU seems related to some aspects of the Hartz reforms (eg the change in the period of eligibility for unemployment benefit appears to have contributed to a decline of the NAWRU over recent years) This suggests that large-scale reforms as currently being enacted in some countries will tend to translate into a gradual lowering of the NAWRU over coming years For example recent efforts in Ireland to bring down the labour tax wedge appear to be contributing to more favourable NAWRU developments A number of countries (eg France) have failed to
Box (continued)
26 | Quarterly Report on the Euro Area
post similar improvements in their underlying labour market structures
Graph II12 Alternative labour cost signals for the euro area Germany and Spain (1)
(1965-2014)
(1)GDP-weighted average of euro-area countries for which alternative NAWRUs have been computed (ie AT BE DE EL ES FI FR IE IT NL and PT) (2)Private consumption deflated ULC Source DG ECFIN calculations based on Eurostat data
Conclusions
Alternative Phillips curve specifications based on different assumptions regarding expectation formation point to broadly similar NAWRU results for the euro area Estimates point to a recent rise in the NAWRU suggesting that post-crisis unemployment increases are to some extent persistent
In the case of Spain alternative Phillips curve specifications yield somewhat different NAWRU results pointing to the current importance for that country of theoretical considerations regarding expectations The NKP which uses rational expectations and relies on RULC growth to identify the unemployment gap yields a more moderate NAWRU increase over recent years than the TKP (hitherto used by DG ECFIN) which allows only for static or adaptive expectations and relies on the signal provided by the change in nominal ULC growth While this sensitivity in the results underlines the need for caution in interpreting NAWRU estimates it should also be borne in mind that all specifications point to an important increase in the NAWRU for Spain at this juncture
The deterioration in the NAWRU signals difficulties that are likely to last beyond the cyclical upturn In interpreting those developments it is important to recognise that changes in the NAWRU can be caused by both structural and non-structural factors While the improvement in the NAWRU in Germany seems to be caused by structural factors the deterioration in Spain seems to be caused more by crisis-related events that have persistent effects due to the presence of various rigidities that tend to slow down the adjustment process
II Special topics on the euro area economy
Volume 13 No 1 | 27
II2 The relationship between government and export sector wages and implications for competitiveness (26)
In 2012 the general government sector employed on average about 15 of the labour force in the euro area Since most countries in the euro area are now trying to consolidate public finances whilst also trying to boost competitiveness for external rebalancing and to reduce unemployment it is crucial to assess whether there is any wage spillover from the public to the export sector in particular under conditions of fiscal stress This section shows that there has been a link between government and manufacturing wages over the long-run which is much closer when the government employs a large share of the labour force Government size dimension is especially important during fiscal consolidation If the government wage bill is inflated due to unjustified wage premia for example limiting government wage growth is a fiscal strategy that may among other effects deliver competitiveness gains that contribute to external rebalancing and help boost employment in the tradable sector
-----------------------
Introduction
General government employment accounts for a considerable share of the labour force in the euro area It stood at about 15 in 2012 with but some cross-country variation The evolution of government wages is likely to have an impact not only on fiscal variables and on the sustainability of public finances but also on the labour market on cost competitiveness and on external rebalancing within the euro area This section looks at the relationship between public and private sector wages at a time when most euro area countries are trying to consolidate their public finances improve competitiveness to support external rebalancing whilst also having to tackle high unemployment levels (27)
Changes in general government compensations may spill over into the private sector through both
(26) Section prepared by Benedicta Marzinotto and Alessandro Turrini
(27) Throughout the section the public sector is referred to alongside general government which refers to public offices at all levels of government non-market public owned hospitals schools and social security organizations Thus the term public is used as a synonym for general government
market-based and institutional channels For example excessive government wages may crowd out private sector employment inflating cost conditions and leading to competitiveness losses (28) There are channels of transmission also in the opposite direction from the private to the government sector Wage growth linked to productivity improvements in the private sector can spill over into the public if there is labour mobility across sectors This can affect governments capacity to keep wage expenditure growth under control
Against this background this section analyses the relationship between general government and manufacturing wages in order to assess the potential for and conditions of a wage spillover from the insulated government sector to the export sector The relationship is analysed by looking at a sample of EU countries over the period 1980-2013 in a co-integration framework that makes it possible to distinguish between long-run and short-run effects The relationship between the two wages is also assessed for different fiscal scenarios differentiating between normal periods and periods of fiscal adjustment
The various forms the relationship takes
The relationship between public and private wages takes many forms It may be influenced by market forces andor by institutional features of the wage setting system in each country Changes in private wages can affect government wage growth in the following ways
bull Wage bargaining in the private sector has ademonstration effect on public wage-settersPerez and Sanchez (2011) find evidence ofsignalling by the private sector in thenegotiation phase in France and Germanybefore the EMU period (29) Signalling may bemotivated by envy effects that reflect thestrength of the wage-bargaining position (30) or
(28) See for example Alesina A and R Perotti (1997) The welfare state and competitiveness American Economic Review Vol 87 pp 921-939 Alesina A Ardagna S Perotti R and Schiantarelli F (2002) Fiscal policy profits and investment American Economic Review Vol 92(3) pp 571-589 Ardagna S (2004) Fiscal stabilizations when do they work and why European Economic Review Vol 48 pp 1047-1074
(29) Perez JJ and AJ Sanchez (2011) Is there a signalling role for public wages Evidence of the euro area based on macro data Empirical Economics Vol 41(2) pp 421-445
(30) Maffezzoli M (2001) Non-Walrasian labor markets and real business cycles Review of Economic Dynamics Vol 4(4) pp 860-
28 | Quarterly Report on the Euro Area
by the fact that the same trade union negotiates wages for both sectors
bull Wage-bargaining practices may explicitly or implicitly grant wage leadership to the private sector Under the Scandinavian wage-setting model the private export sector typically takes the lead dictating bargaining outcomes to other sectors including the public sector (31)
bull There may also be established practices and institutional mechanisms that make public wages responsive to private wage settlements usually those of the export sector This is the case if for example there is a formal rule under which the growth rate of private wages is automatically applied to public sector wages (32)
It is of course a two-way street Changes in government wages affect private wage growth in a number of ways
bull Wage adjustment in the public sector causes cross-sector labour shifts and a change in the private sectors labour supply As the supply of labour changes so does the competitive private sectors equilibrium wage
bull Adjustments to government wages affect the outside option of unionised private sector bargainers putting pressures on the bargaining process (33) with for example private sector workers tempted to move to the general government sector due to large public wage increases
892 Ardagna S (2007) Fiscal policy in unionized labor markets Journal of Economic Dynamics and Control Vol 31(5) pp 1498-1534
(31) For a review see Lindquist J and R Vilhemsson (2006) Is the Swedish central government a wage leader Applied Economics Vol 38 pp 1617-1625 Friberg K (2007) Intersectoral wage linkages the case of Sweden Empirical Economics Vol 32 pp 161-184 Traxler F and B Brandl (2012) Collective bargaining inter-sectoral heterogeneity and competitiveness a cross-national comparison of macroeconomic performance British Journal of Industrial Relations Vol 50(1) pp 73-98 Ramskloger P (2012) Is there a European wage leader Wage spillovers in the European Monetary Union Cambridge Journal of Economics Vol 36(4) pp 941-962 and (2013) The nationalndashtransnational wage-setting nexus in Europe What have we learned from the early years of monetary integration Journal of Common Market Studies Vol 51(5) pp 916-930
(32) For evidence on the Netherlands see Hartog J and H Oosterbeek (1993) Public and private sector wages in the Netherlands European Economic Review Vol 37(1) pp 97-114
(33) Afonso A and P Gomes (2008) Interactions between private and public sector wages ECB Working Paper No 971
bull Changes in public wages may be fully compensated in government budgets by changes in labour taxation that alter labour costs in the private sector (34) and might also affect union behaviour (35)
Co-movements between government and private wages may also take place in the absence of direct links when driven by factors common to both sectors For example public wages may be pro-cyclical and change in a manner similar to private wages over the cycle (36) Co-movements in aggregate wage series could be linked to developments common to both factors relating to the composition of the labour force
Testing the relationship between government and manufacturing wages
To analyse more systematically the long- and short-term effects of government wages on the export sector a cointegration approach is used linking manufacturing compensations to a number of determinants including compensation in the government sector The long-term relationship is analysed in terms of levels while the Error Correction Mechanism (ECM) equation makes it possible to estimate the short-term relation between export sector wage growth shocks in explanatory variables and their deviation from the long-term relationship The long-term relationship in also analysed in terms of levels using a dynamic ordinary least squares (DOLS) model and the results incorporated in an ECM model
Estimates were made on a sample of 17 EU countries for which data are available over the period 1980-2013 This has not only has the advantage of gaining degrees of freedom and reinforcing the results It also makes it possible to
(34) Holmlund B (1993) Wage setting in private and public sectors
in a model with endogenous government behaviour European Journal of Political Economy Vol 9(2) pp 149-162
(35) The spillover from the public to the private sector is likely to be mediated by the structure of wage-setting systems Alesina and Perotti (1997) find that increases in labour taxation do not necessarily lead to higher wage demands by unions in highly centralised bargaining systems as large wage setters would internalise the consequences from higher labour costs on employment
(36) For instance Lane (2003) and Lamo et al (2007) find that public wages are pro-cyclical because of discretionary fiscal expansion in good times Lane P (2003) The cyclical behaviour of fiscal policy evidence from the OECD in Journal of Public Economics Vol 87 pp 2661-2675 Lamo A Perez JJ Schuknecht L (2007) The cyclicality of consumption wages and employment of the public sector in the euro area ECB Working Paper No 757
II Special topics on the euro area economy
Volume 13 No 1 | 29
investigate the role of framework conditions in bringing the impact of general government to bear on manufacturing wages by means of appropriate sample splits Box II21 shows the estimation methodology and the results
Much of the variance in manufacturing wages is explained by variables usually used when estimating wage equations (ie the price level labour productivity and the unemployment rate) and by general government wage levels Both the long- and short-term elasticity of manufacturing wages with respect to government wages is estimated to be around 03-04 This tallies with the results of similar studies (eg Afonso and Gomes 2008) It works both ways general government wages also react to manufacturing wages They have a long-term elasticity of 08 and a short-term elasticity of 04 (37) This is consistent with the fact that it is more usual for the private sector than for the government to take the lead in terms of wages as the available literature also shows (38) The DOLS cointegration estimation delivers qualitatively identical results The results are still valid when the sample is restricted to just the euro area (39) The relationship tested on real wages is symmetrical because manufacturing wages respond to government wages whether they are increased or reduced
One hypothesis tested here is whether the size of the government sector determines the extent to which changes to government wages affect average conditions on the private market if for example there is cross-sector mobility In order to test how this market-based channel works the same EU sample is split into two groups of countries those in which the average share of government to total employment is above the whole EU samplersquos median and countries in which it is below the median Results show that in the long-run the impact of public on manufacturing wages is considerably higher in the case of large public sectors This divide disappears in the short-run In the opposite direction going from manufacturing to public wages the split does not produce differentiated results This confirms that government size matters when it comes to the public sectors long-term impact on the labour
(37) The results are not shown (38) Perez JJ and AJ Sanchez (2011) (39) Still it should be noted that the sample used excludes some key
countries in the euro area
market The DOLS methodology confirms these results (40)
Another hypothesis that is tested is whether the way wages are set in the public sector increases the chances of manufacturing wages reacting to government wages Broadly speaking two wage-setting systems may be identified
bull This first is that wages are mainly set on thebasis of collective bargaining
bull The second is that wages are set on the basis ofunilateral decision by the government (41)
The results show that the way wages are set does not fundamentally alter the relation between government and manufacturing wages in the long- or the short-term It is however interesting to note that across all methodologies used the relationship between manufacturing wages and labour productivity is weaker in countries characterised by a unilateral decision wage-setting system This is probably because in such a case the spillover from public to private wages is such that private wages tend to be misaligned with sectoral productivity This is not the case when government wages are set through a collective bargaining wage-setting system possibly because bargaining processes even in a particular type of insulated sector such as the public one reflect market forces more than a unilateral government decision
The relationship between government and manufacturing wages under fiscal stress
Most countries in the euro area have recently been trying to cut government wage bills by freezing wages cutting or retrenching specific indemnities or benefits (including bonuses andor holidays) or blocking turnover As a result the share of government compensations in total government spending has fallen Between 2008 and 2012 this fall was particularly sharp for Latvia Portugal and Romania followed by Hungary Spain Denmark and Estonia (Graph II21)
(40) The results from the DOLS are not shown (41) For a classification of EU wage-setting systems in the government
sector see European Commission Directorate for Economic and Financial Affairs (2014) Government wages and labour market outcomes Occasional Paper forthcoming
30 | Quarterly Report on the Euro Area
(Continued on the next page)
II Special topics on the euro area economy
Volume 13 No 1 | 31
Box (continued)
(Continued on the next page)
32 | Quarterly Report on the Euro Area
Box (continued)
II Special topics on the euro area economy
Volume 13 No 1 | 33
The recent crisis marked a watershed in the evolution of public compensations Between 1999 and 2007 relative government wage growth did not vary from cold-shower periods (or periods of more gradual fiscal consolidation) to periods of non-consolidation (42)
Graph II21 Change in the share of general government compensations to
total spending (2008-2012 in pp)
Source DG ECFIN calculations based on AMECO
Conversely starting with the 2008-2009 crisis compensations per employee in the government sector grew more slowly compared with those in the manufacturing sector and more clearly so during fiscal consolidation (Graph II22)
It is possible that under conditions of fiscal stress the relationship between government and export sector wages differs from that of normal periods This aspect has been neglected in previous analyses To shed some light on it Table II21 shows the correlation between government wage growth and manufacturing wage growth under alternative fiscal conditions (consolidation and non-consolidation) differentiating between countries with large and small public sectors The evidence shows that the two wages are closely related in periods of fiscal stress only if the government employs a large share of the labour forces This suggests that the possibility of
(42) By convention episodes of fiscal consolidation are defined as those during which the structural primary balance improves by at least 15 per cent of GDP in one year or at least 3 per cent in three years with a minimum improvement of 05 per cent in each year Such a definition makes it possible to distinguish between cases of cold-shower consolidation episodes and more gradual consolidation episodes
expenditure-based fiscal consolidation having the type of supply-side effects described in Alesina and Perotti (1997) Alesina et al (2002) and Ardagna (2004) may be a consequence of the size of the public sector among other things
Graph II22 Government and manufacturing compensations under
alternative fiscal conditions EU countries (1999-2007 and 2008-2012 avg annual change)
Source DG ECFIN calculations based on OECD
Table II21 Correlation between government and manufacturing
compensations growth under alternative fiscal conditions EU (1)
(1) Pearson correlation coefficients Sample EU countries (excluding AT BG CY DE EL LT LV MT RO SI) over 1980-2012 (1995-2012 in the case of CZ EE HU SK) Source DG ECFIN calculations based on OECD
Concluding remarks
Spillovers which are the result of high wages in the general government sector have been mentioned as one of the drivers of competitiveness losses in
34 | Quarterly Report on the Euro Area
some countries in the euro area before the crisis (43)
The results presented here speak to this debate and may be summarised as follows Government wage levels have a long-term impact on wages in the manufacturing sector even more so in countries in which the government sector employs a relatively large share of the labour force That said their short-term impact remains unaffected by the size of the public sector Looking at it the other way round manufacturing wages usually have a greater impact on government wages regardless of size This is arguably because private sector wage leadership is more common than public sector wage leadership
(43) Blanchard O (2007) Adjustment within the euro The difficult
case of Portugal in Portuguese Economic Journal 61 1-21
The way government wages are set also plays a role In collective bargaining systems not only are government and manufacturing wages related in both the long- and the short-term (as they are also when the government sets wages by unilateral decision) Also most importantly wages in the tradable sector are better aligned with labour productivity The evidence provided here indicates that if the government wage bill is inflated for example due to unjustified wage premia limiting public wage growth would spill over into the private export sector reducing labour costs and helping boost competitiveness and employment in the sector Whilst structural reforms including skill upgrading in manufacturing are an important and necessary ingredient for achieving non-reversible gains in competitiveness the adjustment of competitiveness through fiscal policy remains a complementary tool to deliver sustained external rebalancing
II Special topics on the euro area economy
Volume 13 No 1 | 35
II3 Latvia maintaining sustainable growth after the boom-bust years (44)
Latvia had been keen to join the euro area at the earliest opportunity with entry in January 2008 the clear target As the economy overheated however significant macro-economic imbalances accumulated which deferred these plans Between 2005 and 2007 unsustainable GDP growth went hand in hand with a mounting current account deficit and a housing market spiralling out of control When credit flows then abruptly reversed the countryrsquos GDP contracted dramatically Latvia was placed in the EUIMF-led financial assistance programme and was forced to carry out ambitious fiscal consolidation and structural reforms Reallocating resources to the tradable sector was the first important step on the road to an export-driven recovery Under the burden of deleveraging and consolidation the revival of domestic demand was slow at first From 2011 however supported by favourable labour market developments growth in demand has accelerated Latvia has reclaimed its position as the fastest-growing EU economy however the current level of growth is lower than the unstainable rates recorded in the boom years and it is now seen as sustainable Thanks to this balanced growth Latvia has not been subject to the MIP since its launch in 2012 Despite the financial assistance-supported measures to preserve equity the social burden of economic adjustment as evidenced by poverty social exclusion and emigration rates has been high but measures are being taken by the authorities to counter these effects Continued commitment to prudent fiscal policies will be critical for the countryrsquos economic future The use of macro-prudential tools to reduce the risks posed by large non-resident financial flows and the implementation of ambitious structural reforms will also play an important role
-----------------------
Introduction
To welcome Latvias recent adoption of the euro this section reviews the countrys recent boom-bust experience and discusses the challenges ahead
Five years ago it would have been difficult to imagine that Latvia would be able to fulfil the conditions for adopting the euro and enter the euro
(44) Section prepared by Gatis Eglitis and Christian Weise
area in January 2014 After EU accession in May 2004 significant macro-economic imbalances had started to accumulate on the back of an overheating economy and by autumn 2008 the country was on the brink of bankruptcy A painful and seemingly impossible economic adjustment to be achieved by means of internal devaluation lay ahead This would require unprecedented fiscal consolidation huge redundancies and difficult structural reforms threatening political and social stability Yet despite pronounced scepticism from the outset and particularly at the height of the crisis in mid-2009 the economy has moved back to growth The measures implemented took some time to take effect with the economy continuing to decline at first before picking up as seen in the lsquoVrsquo-shaped recovery but a protracted recession was avoided Latviarsquos GDP growth has exceeded expectations reaching levels of 54 in 2011 52 in 2012 and around 4 in 2013 The two factors that were critical to the countryrsquos economic recovery were a return to international competitiveness and the rapid correction of external imbalances The budget deficit decreased significantly and is expected to reach a balanced position in the near future The level of government debt is projected to stay around 40-42 of GDP in 2013-2014 and to decline to 33 of GDP in 2015 as the repayments to the EU take effect and sizable cash buffers will be reduced The financial assistance programme was successfully completed in January 2012 Financial support had not been necessary since October 2010 however and the government had re-entered international bond markets in June 2011 well ahead of schedule (45) As of 2013 GDP per capita in constant prices has returned to the level reached at its peak in 2007 Due to the decline in the population however the absolute value of GDP in constant prices was still about 9 below 2007 levels with current projections suggesting that a full recovery to the pre-crisis peak will be achieved in 2015
Overheating imbalances and a big bust
Latvia joined the EU in seemingly good macroeconomic health and having pegged its currency to the Special Drawing Right (SDR) in
(45) Occasional Paper 120 issued by the European Commission Directorate-General for Economic and Financial Affairs EU Balance of Payments assistance for Latvia foundations of success httpseceuropaeueconomy_financepublicationsoccasional_paper2012op120_enhtm
36 | Quarterly Report on the Euro Area
1994 and then to the euro in 2005 was keen to join the euro area in January 2008 Upon entering the Exchange Rate Mechanism II (ERM II) on 2 May 2005 the authorities unilaterally committed to maintaining a smaller fluctuation margin of plusmn1 around the central rate ndash seen as a sign of the countryrsquos determination to join the euro area The Latvian economy was the fastest growing in the EU between 2000 and 2007 and between 2005 and 2007 real GDP growth reached a yearly average of over 10 Following accession to the EU in 2004 Latvia along with other EU countries witnessed a rapid credit expansion Loans to residents grew at an average annual rate of close to 50 between 2004 and 2008 a reflection of the excess liquidity at that time and of the resulting hot money inflows into central and eastern European economies which were rapidly converging with their western European counterparts Foreign investment exploded driven by commercial banksrsquo mispricing of risk and over-optimistic expectations of convergence A number of privatisation deals and most importantly a burgeoning real-estate market characterised by soaring prices also served to attract foreign investors The tradable sector was meanwhile largely neglected By way of illustration foreign direct investment (FDI) reached relatively high levels of 84 and 81 of GDP in 2006 and 2007 respectively but most of this was directed towards the real-estate market while the proportion of total FDI relating to manufacturing was only 12 in 2013 Significant imbalances were accumulating as indicated by a current account deficit that reached around 22 of GDP in 2006 and 2007 and by labour market tightening Nominal wages doubled between 2004 and 2007 increasing much faster than productivity and thus damaging international competitiveness
By early 2008 more cautious bank lending had caused economic growth to slow significantly By autumn of the same year this slowdown had developed into a strong contraction reflecting the wider global economic situation The global economy fell into recession commodity prices reached record highs and the general risk aversion seen in global markets following the collapse of Lehman Brothers cut off Latviarsquos access to financial markets The second largest domestic bank Parex had to be rescued Latvia ultimately experienced the most severe GDP contraction of all EU countries at close to 18 in 2009 The government deficit threatened to spiral out of control Having been at 03 of GDP in 2007 and 42 in 2008 in spring 2009 it was projected to
reach levels well above 15 of GDP by the end of year in the absence of a significant consolidation package
Faced with an economic crisis of this order Latvia agreed a medium-term financial assistance programme the balance of payments programme (BoP) with the EU and the IMF in December 2008 (46) The aim of this was to preserve the existing exchange-rate arrangement The assistance offered to Latvia was made subject to a number of policy conditions relating to fiscal consolidation financial sector stabilisation and the introduction of a wide range of structural reforms including a significant acceleration in the absorption of EU structural funds The Latvian government also undertook to strengthen the social safety net so as to protect the most vulnerable from the effects of the crisis
Brave measures in difficult times
Given that the exchange rate was at that time pegged to the euro some economists suggested devaluation as the only way out of the crisis The national authorities and international partners did not see that as a viable option however because its effectiveness would have been severely limited by the degree to which imports were used in the manufacture of exports and the high proportion of foreign liabilities Furthermore it would have brought with it the risk of mass bankruptcy and a partial collapse of the domestic banking system at a time when the judicial system was clearly not capable of coping with such a fall-out In addition devaluation would have provided no incentive to solve Latviarsquos structural problems including weak fiscal governance the unsustainability of pension expenditure loss-making state-owned banks a lack of competitiveness and weak institutions
Between 2009 and 2011 the Latvian government carried out an ambitious programme of fiscal adjustment designed to correct the previously loose fiscal policy the weaknesses of which had been hidden by the countryrsquos strong economic growth This difficult adjustment restored Latviarsquos public finances to better health and established a
(46) Funds available from EU countries IMF World Bank EBRD
and Norway amounted to euro 75 billion of which Latvia used euro 45 billion (60) with euro 29 billion lent by the European Commission on behalf of the EU The first tranche of EUR 1 billion (13 of the total) was repaid by Latvia on 25 March 2014
II Special topics on the euro area economy
Volume 13 No 1 | 37
framework which would be sustainable in the long term The nominal balance improved with the deficit being cut from 98 of GDP in 2009 to 13 of GDP in 2012 and 2013 (see graph II31) The structural deficit also fell from its peak of 55 of GDP in 2008 to around 025 of GDP in 2012 and 2013 beating Latviarsquos medium-term objective of -05 of GDP as set in the convergence programmes
Latviarsquos fiscal consolidation measures were undoubtedly bold with fiscal savings equivalent to around 17 of GDP implemented within three years The measures were frontloaded and half of these savings were implemented in the first year alone The measures were on the whole expenditure-oriented with over half of the savings coming from cuts to health education and public administration budgets The most notable measure relating to revenue was an increase in VAT from 18 to 22 The consolidation strategy was eventually successful in containing the adverse effects of the budget deficit on the economy In fact it even appears to have triggered lsquonon-Keynesianrsquo effects on demand by restoring confidence and stimulating demand and investment at the point when it was most needed (47)
Graph II31 Latviarsquos government budget balance and debt (2008-15 of GDP)
Source DG ECFIN Commissionrsquos spring 2013 forecast
The fiscal framework was also strengthened significantly by the law on fiscal discipline coming into force in March 2013 and the creation of a fiscal council in January 2014 The signing of the
(47) Ibid see Chapter 4 Fiscal consolidation in the midst of the crisis
Treaty on Stability Coordination and Governance in the EMU (48) in March 2012 provided further EU-level support for the national fiscal framework
An additional factor that was critical to the success of the consolidation strategy but is often overlooked was the availability of significant EU funds (particularly from around 2009 onwards) which acted as a much-needed demand trigger in sectors affected by the decline in economic activity Between 2007 and 2013 Latvia benefited from the third highest allocation of EU funds after Hungary and Lithuania receiving a yearly average equivalent to around 28 of GDP or 70 of gross fixed capital formation(49) As on average every euro of national budget spending was supplemented by five to six euros co-financing from EU funds national expenditure on items such as road and public building construction vocational education and training of unemployed science infrastructure development and healthcare was often replaced by Structural funds financing despite being in conflict with the EU funds additionality principle Clearly such large inflows of EU financing also generated substantial tax revenues in particular VAT at a time when private consumption was weak
The Latvian labour market demonstrated a high level of flexibility during the crisis thanks in part to a decentralised wage-setting system Significant public-sector wage cuts indirectly supported nominal wage reduction in the private sector in 2009 and 2010 when earnings per employee fell by a total of 19 over two years Employment levels fell sharply especially in the private sector as jobs were cut in construction and manufacturing The unemployment rate reached around 20 in early 2010 but had fallen back to 119 by 2013 due mainly to growth in employment with the participation rate also increasing significantly over this period The projection from the Commissionrsquos 2014 winter forecast shows wages in 2014-15 growing broadly in line with productivity although the labour market is tightening and structural problems in particular regional differences and skill mismatches could create pressures in the economy
(48) httpeuropean-councileuropaeumedia639235st00tscg26_en12pdf
(49) Source Directorate-General for Regional Policy Infoview
38 | Quarterly Report on the Euro Area
External cost competitiveness has improved noticeably since 2008 with labour costs falling significantly and labour productivity in particular in the tradable sector increasing In 2008 the real effective exchange rate (REER) adjusted for unit labour costs reached a peak of 64 above the 2000 level before falling by about 20 in 2009-10 since when it has remained broadly stable (see graph II32) This level of REER is considered sustainable as the country has been seen to be steadily gaining market share over recent years (including as measured by exports adjusted for the growth of markets) The percentage of the countryrsquos GDP attributable to exports rose to 60 in 2013 from 43 in 2007 with some 60 of exports destined for the EU and 12 for Russia
Graph II32 Effective exchange rates Latvia v 35 trading partners
(Jan 2007-Dec 2013 monthly avg 2007 = 100)
Source DG ECFIN
The social burden of economic adjustment has admittedly been high in Latvia despite the policy measures contained in the Memorandum of Understanding stipulating inter alia establishment of a comprehensive social safety net supporting local governments in providing social assistance and discounting social payments from overall budget targets High unemployment has led to a wave of emigration to richer EU countries which coupled with Latviarsquos low fertility and high death rates has seen the population decrease by 8-10 since 2008 Net emigration has now fallen substantially however since the peak of the crisis years The rates of poverty and social exclusion in Latvia are among the highest in the EU families with children unemployed people people with disabilities and people living in rural areas are particularly at risk The countryrsquos spending on
social protection and healthcare as a percentage of GDP is among the lowest in the EU Furthermore the social protection measures which do exist to reduce poverty tend to be ineffective highlighting the importance of a robust social safety net It appears however that with the improved economic situation and increasing levels of general social awareness the authorities are finally starting to address the challenges of poverty and social exclusion with greater determination In recent years for example taxation of low-income earners has been cut slightly and child poverty has been reduced thanks to increases in various child-related benefits Proposals for reforms to social assistance in line with 2013 World Banks study are being gradually implemented Better targeted more effective policies relating to the active labour market mostly financed by the European Social Fund are helping unemployed people in particular the long-term unemployed and young people to find work or to obtain relevant training
As part of the BoP programme and in the context of the assessment of Latviarsquos readiness to join the euro area financial supervision has been tightened and EU resources for supervision and monitoring increased in particular for monitoring the growing non-resident banking sector Additional liquidity and capital adequacy requirements for non-resident banks were introduced in 2013 regular on- and off-site checks of these banks are being performed the deposit guarantee fund has been further strengthened and monitoring has been stepped up in relation to pledged assets and the origin of funds in bank recapitalizations This strengthened regulatory policy has been introduced partly as a result of lessons learnt at significant cost in the past five years most notably with the Parex and Krajbanka failures
Latvia has implemented a series of ambitious reforms to the business environment in recent years with the aim of reducing start-up costs simplifying procedures for property registration construction permits and tax collection and introducing out-of-court settlement of insolvencies In doing so Latvia has brought its regulatory framework a significant step closer to what is regarded as best practice In the World Bankrsquos 2014 Doing Business report Latvia was ranked 25th out of 185 countries with only four euro-area members faring better
II Special topics on the euro area economy
Volume 13 No 1 | 39
Conclusion
The origins of Latviarsquos years of boom and bust can be traced back to the domestic regional and global circumstances at that time globally excess liquidity and hot money flowing into vulnerable countries regionally unrealistic expectations of income convergence in central and eastern Europe and domestically undue optimism about growth in personal incomes and mispricing of risk by commercial banks amplified by the behaviour of both policymakers and individuals
A broad range of country-specific and general economic factors have contributed to the successful economic adjustment seen in Latvia since the height of the crisis Ambitious front-loaded and largely expenditure-based fiscal consolidation helped to contain the budget deficit whilst the confidence generated by the introduction of a credible programme itself aided the economic recovery The flexibility of the labour market meanwhile helped companies to restore competitiveness by means of wage reductions and job cuts Competitiveness was also improved by steps taken to shift the tax burden from labour to consumption and property The recovery in Latvia was very much export-driven with the growth in exports made possible by the openness of the economy and the faster-than-expected economic growth experienced by major trading partners A number of structural reforms including bank restructuring and measures improving the use of EU funds have contributed to the development of a more favourable business environment A generous allocation from the European structural funds meanwhile helped to boost public investment and supported financing and reforms in many important sectors Above all the success of the recovery measures implemented in Latvia proved that for a tough internal economic adjustment to be effective there needs to be both a determined political will to carry out unpopular reforms and also a fully-developed comprehensive social safety net to protect more vulnerable groups
in society during difficult times In addition Latvia benefited from the fact that those looking for work were able to migrate to other EU countries which helped to alleviate the social tension created by the effects of the crisis Some of the lessons above are clearly applicable to other Member States undergoing challenging economic adjustment while others are more Latvia-specific
While Latviarsquos current level of economic growth is regarded as sustainable (50) and the adoption of the euro is recognised as a significant and hard-earned achievement it is not the end of the road The current robust economic situation should be used to advance reforms and improve Latvias long-term growth potential rather than lead to complacency and relaxation of reform efforts Sustainable convergence of the economy in the longer term will require inter alia ongoing commitment to prudent fiscal policies (there are some recent signs of less prudent fiscal decision-making) a continuous use of macro-prudential tools to reduce risks from growing non-resident financial flows especially in view of recent Ukraine events and the implementation of reforms in a number of vested-interest-heavy areas These include higher education and science state owned enterprise management electricity and gas market liberalization and the judiciary including insolvency framework But above all and in order to ensure economic and social sustainability for years to come high rates of poverty social exclusion and dismal demographic trends need to be addressed boldly These and other structural challenges are being addressed by the Commission under the European Semester and the Post Program Surveillance frameworks Also Latvia has joined a euro area that is very different from what it was just a few years ago the euro area economic governance framework has been greatly strengthened entailing stricter obligations
(50) The Commissionrsquos alert mechanism reports issued under the Macroeconomic Imbalance Procedure have not identified economic imbalances in Latvia requiring further in-depth investigation for possible policy action
httpeceuropaeueurope2020pdf2014amr2014_enpdf
40 | Quarterly Report on the Euro Area
II4 Corporate balance sheet adjustment in the euro area and the United States (51)
This section compares balance sheet adjustment in the non-financial corporate sector in the euro area and the United States It shows that the adjustment since the crisis has been faster in the latter Despite similar steep rises in corporate debt in pre-crisis years US corporations have cut debt more than those in the euro area Shifts from loans to bonds and extensions of debt maturity have also been more pronounced in the United States Much of the difference in balance sheet consolidation can be traced back to more positive profitability trends providing US firms with the internal funds necessary to adjust balance sheets Differences in dividend distribution strategies and in corporations physical investment behaviours also played a role Profitability differences reflect differences both in cyclical conditions and labour market adjustment Comparatively slow progress in balance sheet consolidation is likely to weigh on investment recovery in the euro area
-----------------------
Introduction
Both the euro area and the United States experienced a surge in corporate indebtedness in the years preceding the global financial crisis and in its early stages The ratio of debt to gross value added by non-financial corporations (NFCs) rose by about 40 pp between 2005 and 2009 Deteriorating growth prospects and changing attitudes to risk have prompted NFCs in both economies to adjust their balance sheets As previously argued in the Quarterly Report balance sheet adjustment can have a substantial effect on economic activity and it is important to monitor regularly the ongoing adjustment in the euro area (52) This section contributes to the monitoring by comparing progress in corporate deleveraging in the euro area and in the United States two regions where firms entered the crisis with excessive debt
(51) Section prepared by Plamen Nikolov (52) See European Commission (2010) Focus Balance sheet
adjustment in the corporate sector Quarterly Report on the Euro Area Vol9 (3) pp 9-19 A more detailed overview of the literature on the impact of balance sheet adjustment can be found in Cuerpo C I Drumond J Lendvai P Pontuch and R Raciborski (2013) Indebtedness deleveraging dynamics and macroeconomic adjustment European Economy Economic Papers 477
Firms consolidate their balance sheets primarily by raising their net lendingborrowing (NLB) ie the cash obtained from their production activity and available for financial operations (53) A rise in NLB is achieved either by increasing savings or cuttingpostponing physical investment Firms increase savings by raising profits and reducing the dividends distributed to shareholders In firmsrsquo financial accounts a rise in corporate NLB is associated with a rise in financial assets andor a cut in financial liabilities The section reviews recent developments in euro area and US profitability savings and NLB and looks at the instruments that the corporate sector has used to consolidate its balance sheet on both the asset and the liability side
Corporate profits have disappointed in the euro area hellip
National account data show that corporate profitability in the euro area reached a pre-crisis peak in 2007Q3 ie later than in the United States where it had already started to decline in 2007 (54)
Graph II41 NFC profitability euro area and US
(2000Q1-2013Q3 of GVA)
20
25
30
35
40
45
00Q1 01Q3 03Q1 04Q3 06Q1 07Q3 09Q1 10Q3 12Q1 13Q3
Euro area (1)
US
(1)Excluding Latvia Source Eurostat US Bureau of Economic Analysis DG ECFIN calculations
(53) Firms can also consolidate their balance sheets by raising equity (54) Profitability like the other national account variables for the
corporate sector presented in this section is measured as a proportion of corporate sector activity represented by gross value added (GVA) It is calculated as the gross operating surplus plus financial revenues and subsidies and minus financial and tax expenses Financial expenses do not include earnings distributed to shareholders
II Special topics on the euro area economy
Volume 13 No 1 | 41
The 2008-09 recession brought a sharp drop in corporate profitability in the euro area Profitability recovered briefly in 2010 to reach a new peak in 2011 but has declined again since then (Graph II41) In the United States the impact of the crisis was rather muted with profits recovering vigorously after 2008 As a ratio to gross value added (GVA) US corporate profits had already passed their pre-crisis level in 2009 before flattening out in the past two years Overall by 2013 profitability in the euro area was still about 2 pp below its pre-crisis peak while in the United States it stood around 3 pp above
hellip mostly due to weak operating surplus
The disappointing profit performance in the euro area relative to the United States is largely due to differing developments in gross operating surplus Looking at the breakdown of the contribution to the cumulative change in corporate profitability since the start of the crisis there is a marked difference between firms in the euro area and those in the United States (Graphs II42 and II43) (55)
Graph II42 Profitability breakdown of NFCs euro area (1)
(cumulative change in from 2007Q3 peak to 2013Q3)
35
36
37
38
39
40
41
42
-100
-80
-60
-40
-20
0
20
40
60
80
100
07Q4 08Q4 09Q4 10Q4 11Q4 12Q4
Taxes (lhs)
Other net current transfers received (lhs)
Net property income received excl dividends paid (lhs)
Operating surplus (lhs)
Profits(rhs)(2)
(1)Excluding Latvia(2)Profits in of GVA Source Eurostat DG ECFIN calculations
In the euro area a fall in the ratio of operating surplus to GVA dragged overall profitability down after 2008 Despite an improvement in 2011 in
(55) The illustration of the contributions to the cumulative change in profitability only serves to depict the relative importance of the various components of the change in profits since the crisis The starting point for the cumulative change should not be interpreted as a reference point for a desirable profit recovery
2013 operating surplus was still contributing negatively to the cumulative change in profitability since the pre-crisis peak In contrast operating surplus in the United States responded to the crisis earlier than in the euro area but its contribution to the change in profits remained positive
Graph II43 Profitability breakdown of NFCs US
(cumulative change in from 2005Q3 peak to 2013Q3)
24
25
26
27
28
29
30
31
-100
-80
-60
-40
-20
0
20
40
60
80
100
05Q4 06Q4 07Q4 08Q4 09Q4 10Q4 11Q4 12Q4
Taxes (lhs)Other net current transfers received (lhs)Net property income received excl dividends paid (lhs)Operating surplus (lhs)Profits(rhs)(2)
(1) Profits in of GVA Source Federal Reserve Board US Bureau of Economic Analysis DG ECFIN calculations
Unlike operating surplus income tax payments and net income from non-operational activities did not differ significantly between the euro area and the United States (56) In both economies lower corporate tax payments resulting from lower profits generated by NFCs naturally had a positive impact on the cumulative change in profits from the pre-crisis peak
Differences in labour market developments are at the root of differences in profitability
Differences in operating surplus and profitability between the United States and the euro area can be attributed partly to differences in the business cycle In 2011Q1 NFCsrsquo gross value added was still 12 below its pre-crisis peak in the euro area but 11 above in the United States The main channel through which cyclical developments can affect operating surplus is the labour market
(56) In fact the ratio of profit tax payments to profits (a crude measure of an aggregate tax rate) in the euro area and the United States has been almost the same since the start of the crisis falling substantially in 2008-09 indicating that tax policy was not more favourable for profits in one economy than in the other
42 | Quarterly Report on the Euro Area
The cyclicality of operating surplus depends on the impact of the cycle on labour productivity as well as on wages The worse performance of operating surplus in the euro area since 2008 as compared with that in the United States reflects a stronger deterioration in labour productivity accompanied by unfavourable developments in wages per employee
Labour productivity growth in the euro area turned sharply negative in 2009 opening a big gap with the positive (albeit modest) wage growth (Graph II44) In the United States on the other hand labour productivity growth became negative earlier but to a lesser extent and some downward wage adjustment took place in 2009
Graph II44 Labour productivity and wages euro area and US
(2001Q4-2013Q3 y-o-y change)
-4
-3
-2
-1
0
1
2
3
4
5
01Q4 03Q2 04Q4 06Q2 07Q4 09Q2 10Q4 12Q2
Average wage per employee euro area (1) (2)Average wage per employee US (1)Labour productivity euro area (2) (3)Labour productivity US (3)
(1)Real wages calculated by the GDP deflator(2)Euro area excluding Latvia(3)In terms of total employment (thousands) Source Eurostat US Bureau of Economic Analysis US Bureau of Labour Statistics DG ECFIN calculations
There are a number of reasons for the different labour adjustments in the euro area and the United States In the former apart from a higher level of employment protection short-term work schemes were put in place in the early stages of the crisis (57) In addition as labour force adjustment tends to be more costly in the euro area some firms (particularly small firms and those with highly qualified employees) preferred to retain their
(57) According to the OECD Public short-term work schemes have
played an important role in preserving jobs during the crisis in a number of countries although significant hours reductions were also achieved via lower overtime hours hours averaging arrangements and employer initiatives see OECD Employment Outlook 2010 ndash Moving Beyond the Job Crisis
labour force (58) Because of a lack of wage flexibility the higher degree of lsquolabour hoardingrsquo in the euro area came at the expense of lower operating surplus and profits and consequently put a downward pressure on the capacity accumulate internal funds to deleverage
Corporate savings are much lower in the euro area
Negative developments in euro area corporate profitability were reflected in corporate savings which together with physical investment determines the internal funds available for balance sheet adjustment In 2009-10 there was a sharp drop in euro area savings because profits acted as shock absorbers and fell more rapidly than dividend payments leaving less spare cash available In contrast savings by US NFCs increased substantially on rising profits after an early-crisis low point and reached a historically high level of around 23 of GVA in 2010Q3 (Graph II45)
Graph II45 Savings of NFCs (2000Q1- 2013Q3 of GVA)
15
16
17
18
19
20
21
22
23
24
00Q1 01Q3 03Q1 04Q3 06Q1 07Q3 09Q1 10Q3 12Q1 13Q3
Euro area (1)
US
(1)Euro area excluding Latvia Source Eurostat Bureau of Economic Analysis DG ECFIN calculations
The impression that US corporate behaviour has been more geared towards accumulating savings than that in the euro area is reinforced when one looks at dividend distribution Dividends paid by euro area NFCs have been on a declining trend since the start of the crisis but those paid by US firms have also decreased This is remarkable given (58) See Box 12 Labour hoarding across different types of firms in
OECD Employment Outlook 2010 ndash Moving Beyond the Job Crisis
II Special topics on the euro area economy
Volume 13 No 1 | 43
the positive profit developments in the United States (Graph II46) A drop in dividends alongside profit growth suggests that after 2008 US companies preferred to direct a bigger proportion of the profit recovery to corporate savings and thereby balance sheet adjustment The ratio of dividends to profits in the United States has fallen from about one third before the crisis to one quarter now This ratio also dropped in the euro area although by less (59)
Graph II46 Dividends paid of NFCs (2000Q1-2013Q3 of GVA)
0
5
10
15
20
25
00Q1 01Q3 03Q1 04Q3 06Q1 07Q3 09Q1 10Q3 12Q1 13Q3
Euro area (1)
US
(1)Euro area excluding Latvia Source Eurostat Federal Reserve Board DG ECFIN calculations
Disappointing physical investment in the euro area and the United States
Cutting investment in physical assets is another way of reducing excessive indebtedness Corporate investment as a proportion of activity dropped sharply both in the euro area and in the United States in the early stages of the crisis (Graph II47)
After a modest recovery in 2010-11 the investment rate decreased again in the euro area The investment recovery was more solid in the United States but has lost momentum since the end of 2012 and the investment rate remains below its pre-crisis peak Overall it seems that euro area corporations partly compensated for less supportive savings developments than in the US by
(59) Dividend payments are not the only way of distributing profits to shareholders Equity buybacks can also be used for this purpose and firms that choose this option will tend to have higher savings and lower dividends paid
curbing physical investment more than their US counterparts
Graph II47 Investment of NFCs (2000Q1- 2013Q3 of GVA)
15
16
17
18
19
20
21
22
23
24
00Q1 01Q3 03Q1 04Q3 06Q1 07Q3 09Q1 10Q3 12Q1 13Q3
Euro area (1)
US
(1)Excluding Latvia Source Eurostat US Bureau of Economic Analysis DG ECFIN calculations
A more modest increase in net lending in the euro area than in the US
Since 2013 firmsrsquo net lending in the euro area has been in positive territory but substantially less so than that in the United States (Graph II48) Positive NLB in the euro area unlike that in the United States is mostly due to a low investment rate alone rather than low investment combined with high savings The combination of disappointing investment and high savings has translated into historically high and sustained NLB for US firms
This persistent net lending position in the United States is atypical as firms usually invest more than they save It suggests that US firms have been adjusting their balance sheets significantly since the beginning of the crisis via their internal funds while euro area firms seem to have opted for much slower balance sheet adjustment
44 | Quarterly Report on the Euro Area
Graph II48 Net lendingborrowing of NFCs
(2000Q1- 2013Q3 of GVA)
-10
-8
-6
-4
-2
0
2
4
6
8
00Q1 01Q3 03Q1 04Q3 06Q1 07Q3 09Q1 10Q3 12Q1 13Q3
Euro area (1)
US
(1)Excluding Latvia Source Eurostat US Bureau of Economic Analysis DG ECFIN calculations
Debt deleveraging has been more pronounced in the US than in the euro area
The faster pace of adjustment of balance sheets in the United States is confirmed by the corporate debt data (Graph II49) (60) (61) While both the euro area and the United States entered the crisis with swiftly rising and historically high levels of debt deleveraging has progressed more rapidly in the latter since the crisis By the beginning of 2012 US corporate debt had fallen by approximately 15 pp as a proportion of activity while euro area debt had dropped by 7 pp (62)
(60) Non-financial corporate debt consists of loans and securities
other than shares (corporate bonds) both can be classified as short- or long-term depending on whether their original maturity is less or more than one year
(61) This section analyses developments in non-consolidated financial flows and stocks in the euro area and in the United States for two reasons it is important to have a sense of financial positions within the institutional sector eg loans between NFCs are an important part of intra-firm relationships as head offices use them to finance subsidiaries for example perhaps for tax reasons This is relatively more important in the euro area than in the United States Consolidated financial asset and flow data eliminate these intra-sector positions and different approaches may be taken to consolidation as in the euro area there is the additional issue of cross-border consolidation between Member States while there is no need for flows and positions between firms in different US states to be treated separately
(62) The debt-to-equity ratio is another measure of corporate leverage widely followed by investors Faster stock market recovery helped US firms reduce this ratio more than those in the euro area
Graph II49 Debt levels of NFCs(1) (1999Q1-2013Q3 of GVA)
100
120
140
160
180
200
220
99Q1 00Q3 02Q1 03Q3 05Q1 06Q3 08Q1 09Q3 11Q1 12Q3
Euro area (2)
US
(1)Securities other than shares and loans(2)Excluding Latvia Source Eurostat US Bureau of Economic Analysis DG ECFIN calculations
Firms in the euro area and the United States entered the crisis with almost the same level of short-term debt as a proportion of total debt Since the crisis the adjustment away from short-term debt has been significantly more pronounced in the United States suggesting more active balance sheet restructuring
Graph II410 Debt flows of NFCs(1) (1999Q1- 2013Q3 of GVA)
-15
-10
-5
0
5
10
15
20
99Q1 01Q1 03Q1 05Q1 07Q1 09Q1 11Q1 13Q1
Euro area bonds (2)
US bonds
Euro area loans (2)
US loans
(1)Securities other than shares and loans (2)Excluding Latvia Source Eurostat US Bureau of Economic Analysis DG ECFIN calculations
Due to differences in the structure of corporate finance loans (as opposed to bonds) tend to form a bigger proportion of debt in the euro area than in the United States An important element of the
II Special topics on the euro area economy
Volume 13 No 1 | 45
corporate balance sheet adjustment process in both economies has been a movement away from an excessive reliance on loans (Graph II410) and towards bond financing This trend has been substantially more pronounced in the United States presumably reflecting the fact that bond markets are more developed in that country
Developments in non-financial corporate debt were also influenced by developments in financial intermediation in particular in the banking sector Financial accounts show NFCsrsquo debt exposure but do not indicate whether the debt holder is a bank According to bank balance sheet statistics the nominal growth of loans vis-agrave-vis NFCs has been mostly negative in the euro area since 2009Q4 (Graph II411) Coupled with the positive loan inflows seen in the national accounts between 2010Q3 and 2012Q3 (Graph II410) this shows a degree of substitution in corporate loan liability ownership between banks and other financial firms and sectors (including other NFCs) in this period According to the counterparty breakdown of NFC domestic loans published by the ECB corporate borrowings from other NFCs represented 29 of all loans by 2013Q3 (up from 26 in 2008Q1) while the proportion of borrowings from monetary financial institutions (MFIs) had dropped (from 60 in 2008Q1) to an all-time low of 53 The proportion of loans from other non-bank financial intermediaries also increased There is less evidence of a shift from banks to other loan providers in the United States where loans between NFCs are much more limited
Graph II411 Bank loans to NFCs (1999Q1- 2013Q3 y-o-y change)
-20
-15
-10
-5
0
5
10
15
20
25
99Q1 00Q3 02Q1 03Q3 05Q1 06Q3 08Q1 09Q3 11Q1 12Q3
Euro area bank loans to NFCs (1)US bank loans to NFCs
(1)Excluding Latvia Source ECB US Federal Reserve Board DG ECFIN calculations
Positive NLB has been used to acquire safe financial assets in both regions
In both the euro area and the United States the positive NLB has been used to deleverage but also to invest in safe financial assets At the beginning of the crisis much of the positive corporate NLB in the United States was invested in money market mutual funds which is essentially investment in short-term low-risk assets (Graph II412) (63)
Currency and deposits (another type of safe asset) have increased substantially in the euro area in recent years as a proportion of total firm activity (Graph II413) This rise was driven almost exclusively by a rapid increase in firmsrsquo savings deposits To some extent a similar trend is observable in the United States In particular US cash balances (a sub-component of currency and deposits) approached 12 of GVA by the end of 2013 a level not seen since the early 1990s On the other hand savings deposits have grown more modestly resulting in a moderately positive overall trend in currency and deposits
Graph II412 Mutual fund shares of NFCs (1999Q1- 2013Q3 of GVA)
0
2
4
6
8
10
12
14
99Q1 01Q1 03Q1 05Q1 07Q1 09Q1 11Q1 13Q1
Euro area (1)
US (2)
(1)Excluding Latvia(2)In the USA these asset series can be broken down into investment in money market mutual funds and investment in other mutual funds The 2009-11 increase is fully attributable to the former Source Eurostat US Bureau of Economic Analysis DG ECFIN calculations
Overall these two aspects of corporate financial investment behaviour signify considerable liquidity concerns on the part of firms in both the euro area
(63) Euro area financial accounts only show firmsrsquo investment in mutual funds overall and do not distinguish between types of mutual funds
46 | Quarterly Report on the Euro Area
and the United States They also represent a drive towards lower-risk assets perhaps indicating increased risk aversion by corporations or a tendency to postpone physical investment in a context of perceived high uncertainty
Graph II413 Currency and deposits ndash NFCs
(1999Q1- 2013Q3 of GVA)
0
5
10
15
20
25
30
35
40
45
99Q1 00Q3 02Q1 03Q3 05Q1 06Q3 08Q1 09Q3 11Q1 12Q3
Euro area (1)
US
(1)Excluding Latvia Source Eurostat US Bureau of Economic Analysis DG ECFIN calculations
Conclusion
Although both regions saw similar steep rises in corporate debt in the pre-crisis years balance sheet adjustment since the crisis has been significantly slower in the euro area than in the United States The more rapid adjustment in the United States can be explained by a stronger cyclical recovery more supportive profitability developments and reduced dividend payment ratios In the euro area profitability has been hindered by a combination of lower flexibility in the labour markets and slow wage adjustment
The slower balance sheet adjustment in the euro area corporate sector is visible in a slower fall in indebtedness but also a slower adjustment of the structure of balance sheets In particular the shift from loans to bonds and the extension of debt maturity have been more pronounced in the United States In both regions firms have used their positive NLB to accelerate the accumulation of safe and liquid financial assets This could reflect continuing uncertainty regarding future demand and growth prospects
Overall the evidence discussed in this section shows that euro area firms are lagging significantly behind their US counterparts in terms of balance sheet consolidation Given that investment rates remain disappointing even in the more advanced US corporate sector a degree of caution appears warranted when assessing short-term prospects for corporate investment in the euro area
III Recent DG ECFIN publications
Volume 13 No 1 | 47
1 Occasional Papers
European Economy Occasional Papers 170 January 2014 Financial Assistance Programme for the Recapitalisation of Financial Institutions in Spain Fifth Review ndash Winter 2014 httpeceuropaeueconomy_financepublicationsoccasional_paper2014pdfocp170_enpdf
European Economy Occasional Papers 169 December 2013 The Economic Adjustment Programme for Cyprus Second Review ndash Autumn 2013 httpeceuropaeueconomy_financepublicationsoccasional_paper2013pdfocp169_enpdf
European Economy Occasional Papers 168 December 2013 Fiscal frameworks in the European Union ommission services country factsheets for the Autumn 2013 Peer Review httpeceuropaeueconomy_financepublicationsoccasional_paper2013pdfocp168_enpdf
European Economy Occasional Papers 167 December 2013 Economic Adjustment Programme for Ireland - Autumn 2013 Review httpeceuropaeueconomy_financepublicationsoccasional_paper2013pdfocp167_enpdf
European Economy Occasional Papers 166 December 2013 Progress towards meeting the economic criteria for EU accession the EU Commissionrsquos 2013 assessments httpeceuropaeueconomy_financepublicationsoccasional_paper2013pdfocp166_enpdf
European Economy Occasional Papers 165 November 2013 Romania Balance-of-Payments Assistance Programme 2013-2015 httpeceuropaeueconomy_financepublicationsoccasional_paper2013pdfocp165_enpdf
European Economy Occasional Papers 164 November 2013 The Economic Adjustment Programme for Portugal Eighth and Ninth Review httpeceuropaeueconomy_financepublicationsoccasional_paper2013pdfocp164_enpdf
European Economy Occasional Papers 163 November 2013 Financial Assistance Programme for the Recapitalisation of Financial Institutions in Spain Fourth Review ndash Autumn 2013 httpeceuropaeueconomy_financepublicationsoccasional_paper2013pdfocp163_enpdf
European Economy Occasional Papers 162 October 2013 Economic Adjustment Programme for Ireland Summer 2013 Review httpeceuropaeueconomy_financepublicationsoccasional_paper2013pdfocp162_enpdf
2 Economic papers
European Economy Economic Papers 514 February 2014 Martin Larch Kristin Magnusson Bernard Balint Tatar Hard work and More How to successfully conduct adjustment with official assistance httpeceuropaeueconomy_financepublicationseconomic_paper2014pdfecp514_enpdf
European Economy Economic Papers 513 February 2014 Florian Woumlhlbier Caterina Astarita Gilles Mourre Consolidation on the revenue side and growth-friendly tax structures an indicator based approach httpeceuropaeueconomy_financepublicationseconomic_paper2014pdfecp513_enpdf
48 | Quarterly Report on the Euro Area
European Economy Economic Papers 512 December 2013 Alexander Schwan Etienne Sail Assessing the economic and budgetary impact of linking retirement ages and pension benefits to increases in longevity httpeceuropaeueconomy_financepublicationseconomic_paper2013pdfecp512_enpdf 3 Other publications
Winter forecast 2014 - EU economy recovery gaining ground httpeceuropaeueconomy_financepublicationseuropean_economy2014pdfee2_enpdf 4 Regular publications
Business and Consumer Surveys (harmonised surveys for different sectors of the economies in the European Union (EU) and the applicant countries) httpeceuropaeueconomy_financedb_indicatorssurveysindex_enhtm Business Climate Indicator for the euro area (monthly indicator designed to deliver a clear and early assessment of the cyclical situation) httpeceuropaeueconomy_financedb_indicatorssurveysdocuments2013bci_2013_11_enpdf Key indicators for the euro area (presents the most relevant economic statistics concerning the euro area) httpeceuropaeueconomy_financedb_indicatorskey_indicatorsindex_enhtm Monthly and quarterly notes on the euro-denominated bond markets (looks at the volumes of debt issued the maturity structures and the conditions in the market) httpeceuropaeueconomy_financepublicationsbond_marketindex_enhtm Price and Cost Competitiveness httpeceuropaeueconomy_financedb_indicatorscompetitivenessindex_enhtm
50 | Quarterly Report on the Euro Area
Editor-in-Chief Elena Flores
Overall coordination Eric Ruscher
Data assistance Christos Zavos
Comments on the report would be gratefully received and should be sent to
Elena Flores Director ndash Policy Strategy and Coordination Directorate-General for Economic and Financial Affairs Office CHAR 1566
B-1049 Brussels
Email elenafloreseceuropaeu
or
Eric Ruscher Head of Unit ndash Macroeconomy of the euro area Directorate-General for Economic and Financial Affairs Office CHAR 15248
B-1049 Brussels
Email ericruschereceuropaeu
HOW TO OBTAIN EU PUBLICATIONS Free publications bull one copy
via EU Bookshop (httpbookshopeuropaeu) bull more than one copy or postersmaps
from the European Unionrsquos representations (httpeceuropaeurepresent_enhtm) from the delegations in non-EU countries (httpeeaseuropaeudelegationsindex_enhtm) by contacting the Europe Direct service (httpeuropaeueuropedirectindex_enhtm) or calling 00 800 6 7 8 9 10 11 (freephone number from anywhere in the EU) () () The information given is free as are most calls (though some operators phone boxes or hotels may charge you)
Priced publications bull via EU Bookshop (httpbookshopeuropaeu) Priced subscriptions bull via one of the sales agents of the Publications Office of the European Union
(httppublicationseuropaeuothersagentsindex_enhtm)
KC-AK-14-001-en-n
- Blank Page
- Blank Page
- Blank Page
- Blank Page
-

II Special topics on the euro area economy
Volume 13 No 1 | 23
with the two Phillips curve specifications producing similar NAWRUs However around
Graph II11 Alternative NAWRU estimates euro area Germany and Spain (1)
(1965-2015 in )
(1)GDP weighted average of euro-area countries for which alternative NAWRUs have been computed (ie AT BE DE EL ES FI FR IE IT NL and PT) For AT both NAWRUs are based on the backward-looking model as the forward-looking model yields econometrically unsatisfactory results (2)Component of the NAWRU explained only by structural determinants (see Orlandi (2012) op cit) Source DG ECFIN calculations based on Eurostat data
2005 some difference across the two specifications is observed for Germany with the NKP producing a relatively less volatile NAWRU Given that the current NAWRU estimates for Germany based on the TKP and NKP specifications do not diverge greatly and taking into account the stability considerations in moving to a new specification Germany continues to use the TKP specification
NAWRU differences for Spain depending on the curve specification stem from corresponding differences between the labour cost indicators used Graph II12 shows that recently RULC growth posted greater and more persistent moderation in Spain than change in nominal ULC growth For Germany the indicators have followed more similar paths over recent years (as they have in the euro area as a whole) More fundamentally in times of heightened economic volatility andor big labour market adjustments (eg recent crisis Hartz reforms) the TKP model is likely to yield NAWRUs that are more pro-cyclical as it does not take full account of the price rigidities that play an important role in the adjustment process of the labour market These rigidities are better reflected in the NKP model
To sum up except in the case of Spain recent NAWRU estimates for the euro area do not appear to be sensitive to assumptions as regards expectations with alternative Phillips curve specifications yielding similar results Overall results point to a recent increase in the NAWRU across the euro area with the notable exception of Germany A rise in the NAWRU points to persistent deterioration in labour market performance Identifying the causes of the deterioration calls for cautious interpretation however
NAWRU versus Structural Unemployment
Understanding the sharp and protracted rise in unemployment in the wake of the crisis is of paramount importance from a policy perspective What caused the rise Is it a sign of structural deterioration Or is it purely cyclical reflecting the prolonged slowdown These questions are the subject of lively debate with views ranging from lsquoitrsquos all demandrsquo(22) to lsquoitrsquos allmostly structuralrsquo(23)
(22) See eg Krugman P (2010) Debunking the structural unemployment myth New York Times 28 September 2010
24 | Quarterly Report on the Euro Area
(23) See eg Kocherlakota N (2010) Inside the FOMC speech at
Marquette Michigan 17 August 2010
(Continued on the next page)
II Special topics on the euro area economy
Volume 13 No 1 | 25
In particular changes in the NAWRU are sometimes interpreted as a sign of a structural change Careful analysis of developments in the NAWRUs produced by DG ECFIN shows that they can be driven by both structural and non-structural factors(24)
In particular crisis-related shocks (eg unwinding of unsustainable developments) especially boom-bust episodes in the housing market that can trigger a lengthy process of deleveraging in the construction sector have a statistically significant impact on the NAWRU The real interest rate and Total Factor Productivity (TFP) growth which controls more generally for the presence of such shocks also play a part in driving NAWRU develpoments
At a theoretical level adding various rigidities (eg real wage rigidity cyclical price mark-ups or sluggish adjustment of the reservation wage) to the traditional labour market model can be shown to yield a NAWRU that is not solely determined by structural factors
Despite uncertainties the NAWRU remains a useful policy indicator It is a well-defined concept that provides useful information on the nature of unemployment rate developments In particular it identifies risks of persistent labour market deteriorations that may not always be caused by structural phenomena(25)
In this context it appears useful to distinguish between the NAWRU and a narrowly defined notion of structural unemployment affected only by structural factors as shown in Graph II11 by
(24) For further details see Orlandi F (2012) Structural unemployment and its determinants in the EU countries European Economy mdash Economic Paper No 455 DG ECFIN European Commission May 2012
(25) For further details see Cyclical and structural unemployment in the euro area in Labour Market Developments in Europe 2013 European Commission
the lsquostructural unemploymentrsquo series The latter represents the portion of the NAWRU that according to econometric results appears to be explained by structural features of the labour market As can be seen the series has remained broadly stable during the crisis Except for a notable decline due to structural labour market reforms in Germany change in the NAWRU in the euro area is not related to structural change This is also the case in Spain where structural unemployment has remained broadly stable
Recent increases in the euro-area NAWRU should therefore not be interpreted as a sign of big structural change at the current juncture Rather in most countries the increases reflect the effects of shocks that in the presence of various rigidities have a long-lasting impact on unemployment rates
To sum up the decline in the NAWRU at euro-area level and in countries like Spain in the run-up to the crisis appears mostly attributable to non-structural factors such as unsustainable developments in the housing sector The build-up and subsequent unwinding of imbalances has caused large economic shocks (eg need for sectoral reallocation) which have a persistent effect on the performance of the labour market However in some countries structural factors have also played a role in driving NAWRU developments In Germany for example the decline in the NAWRU seems related to some aspects of the Hartz reforms (eg the change in the period of eligibility for unemployment benefit appears to have contributed to a decline of the NAWRU over recent years) This suggests that large-scale reforms as currently being enacted in some countries will tend to translate into a gradual lowering of the NAWRU over coming years For example recent efforts in Ireland to bring down the labour tax wedge appear to be contributing to more favourable NAWRU developments A number of countries (eg France) have failed to
Box (continued)
26 | Quarterly Report on the Euro Area
post similar improvements in their underlying labour market structures
Graph II12 Alternative labour cost signals for the euro area Germany and Spain (1)
(1965-2014)
(1)GDP-weighted average of euro-area countries for which alternative NAWRUs have been computed (ie AT BE DE EL ES FI FR IE IT NL and PT) (2)Private consumption deflated ULC Source DG ECFIN calculations based on Eurostat data
Conclusions
Alternative Phillips curve specifications based on different assumptions regarding expectation formation point to broadly similar NAWRU results for the euro area Estimates point to a recent rise in the NAWRU suggesting that post-crisis unemployment increases are to some extent persistent
In the case of Spain alternative Phillips curve specifications yield somewhat different NAWRU results pointing to the current importance for that country of theoretical considerations regarding expectations The NKP which uses rational expectations and relies on RULC growth to identify the unemployment gap yields a more moderate NAWRU increase over recent years than the TKP (hitherto used by DG ECFIN) which allows only for static or adaptive expectations and relies on the signal provided by the change in nominal ULC growth While this sensitivity in the results underlines the need for caution in interpreting NAWRU estimates it should also be borne in mind that all specifications point to an important increase in the NAWRU for Spain at this juncture
The deterioration in the NAWRU signals difficulties that are likely to last beyond the cyclical upturn In interpreting those developments it is important to recognise that changes in the NAWRU can be caused by both structural and non-structural factors While the improvement in the NAWRU in Germany seems to be caused by structural factors the deterioration in Spain seems to be caused more by crisis-related events that have persistent effects due to the presence of various rigidities that tend to slow down the adjustment process
II Special topics on the euro area economy
Volume 13 No 1 | 27
II2 The relationship between government and export sector wages and implications for competitiveness (26)
In 2012 the general government sector employed on average about 15 of the labour force in the euro area Since most countries in the euro area are now trying to consolidate public finances whilst also trying to boost competitiveness for external rebalancing and to reduce unemployment it is crucial to assess whether there is any wage spillover from the public to the export sector in particular under conditions of fiscal stress This section shows that there has been a link between government and manufacturing wages over the long-run which is much closer when the government employs a large share of the labour force Government size dimension is especially important during fiscal consolidation If the government wage bill is inflated due to unjustified wage premia for example limiting government wage growth is a fiscal strategy that may among other effects deliver competitiveness gains that contribute to external rebalancing and help boost employment in the tradable sector
-----------------------
Introduction
General government employment accounts for a considerable share of the labour force in the euro area It stood at about 15 in 2012 with but some cross-country variation The evolution of government wages is likely to have an impact not only on fiscal variables and on the sustainability of public finances but also on the labour market on cost competitiveness and on external rebalancing within the euro area This section looks at the relationship between public and private sector wages at a time when most euro area countries are trying to consolidate their public finances improve competitiveness to support external rebalancing whilst also having to tackle high unemployment levels (27)
Changes in general government compensations may spill over into the private sector through both
(26) Section prepared by Benedicta Marzinotto and Alessandro Turrini
(27) Throughout the section the public sector is referred to alongside general government which refers to public offices at all levels of government non-market public owned hospitals schools and social security organizations Thus the term public is used as a synonym for general government
market-based and institutional channels For example excessive government wages may crowd out private sector employment inflating cost conditions and leading to competitiveness losses (28) There are channels of transmission also in the opposite direction from the private to the government sector Wage growth linked to productivity improvements in the private sector can spill over into the public if there is labour mobility across sectors This can affect governments capacity to keep wage expenditure growth under control
Against this background this section analyses the relationship between general government and manufacturing wages in order to assess the potential for and conditions of a wage spillover from the insulated government sector to the export sector The relationship is analysed by looking at a sample of EU countries over the period 1980-2013 in a co-integration framework that makes it possible to distinguish between long-run and short-run effects The relationship between the two wages is also assessed for different fiscal scenarios differentiating between normal periods and periods of fiscal adjustment
The various forms the relationship takes
The relationship between public and private wages takes many forms It may be influenced by market forces andor by institutional features of the wage setting system in each country Changes in private wages can affect government wage growth in the following ways
bull Wage bargaining in the private sector has ademonstration effect on public wage-settersPerez and Sanchez (2011) find evidence ofsignalling by the private sector in thenegotiation phase in France and Germanybefore the EMU period (29) Signalling may bemotivated by envy effects that reflect thestrength of the wage-bargaining position (30) or
(28) See for example Alesina A and R Perotti (1997) The welfare state and competitiveness American Economic Review Vol 87 pp 921-939 Alesina A Ardagna S Perotti R and Schiantarelli F (2002) Fiscal policy profits and investment American Economic Review Vol 92(3) pp 571-589 Ardagna S (2004) Fiscal stabilizations when do they work and why European Economic Review Vol 48 pp 1047-1074
(29) Perez JJ and AJ Sanchez (2011) Is there a signalling role for public wages Evidence of the euro area based on macro data Empirical Economics Vol 41(2) pp 421-445
(30) Maffezzoli M (2001) Non-Walrasian labor markets and real business cycles Review of Economic Dynamics Vol 4(4) pp 860-
28 | Quarterly Report on the Euro Area
by the fact that the same trade union negotiates wages for both sectors
bull Wage-bargaining practices may explicitly or implicitly grant wage leadership to the private sector Under the Scandinavian wage-setting model the private export sector typically takes the lead dictating bargaining outcomes to other sectors including the public sector (31)
bull There may also be established practices and institutional mechanisms that make public wages responsive to private wage settlements usually those of the export sector This is the case if for example there is a formal rule under which the growth rate of private wages is automatically applied to public sector wages (32)
It is of course a two-way street Changes in government wages affect private wage growth in a number of ways
bull Wage adjustment in the public sector causes cross-sector labour shifts and a change in the private sectors labour supply As the supply of labour changes so does the competitive private sectors equilibrium wage
bull Adjustments to government wages affect the outside option of unionised private sector bargainers putting pressures on the bargaining process (33) with for example private sector workers tempted to move to the general government sector due to large public wage increases
892 Ardagna S (2007) Fiscal policy in unionized labor markets Journal of Economic Dynamics and Control Vol 31(5) pp 1498-1534
(31) For a review see Lindquist J and R Vilhemsson (2006) Is the Swedish central government a wage leader Applied Economics Vol 38 pp 1617-1625 Friberg K (2007) Intersectoral wage linkages the case of Sweden Empirical Economics Vol 32 pp 161-184 Traxler F and B Brandl (2012) Collective bargaining inter-sectoral heterogeneity and competitiveness a cross-national comparison of macroeconomic performance British Journal of Industrial Relations Vol 50(1) pp 73-98 Ramskloger P (2012) Is there a European wage leader Wage spillovers in the European Monetary Union Cambridge Journal of Economics Vol 36(4) pp 941-962 and (2013) The nationalndashtransnational wage-setting nexus in Europe What have we learned from the early years of monetary integration Journal of Common Market Studies Vol 51(5) pp 916-930
(32) For evidence on the Netherlands see Hartog J and H Oosterbeek (1993) Public and private sector wages in the Netherlands European Economic Review Vol 37(1) pp 97-114
(33) Afonso A and P Gomes (2008) Interactions between private and public sector wages ECB Working Paper No 971
bull Changes in public wages may be fully compensated in government budgets by changes in labour taxation that alter labour costs in the private sector (34) and might also affect union behaviour (35)
Co-movements between government and private wages may also take place in the absence of direct links when driven by factors common to both sectors For example public wages may be pro-cyclical and change in a manner similar to private wages over the cycle (36) Co-movements in aggregate wage series could be linked to developments common to both factors relating to the composition of the labour force
Testing the relationship between government and manufacturing wages
To analyse more systematically the long- and short-term effects of government wages on the export sector a cointegration approach is used linking manufacturing compensations to a number of determinants including compensation in the government sector The long-term relationship is analysed in terms of levels while the Error Correction Mechanism (ECM) equation makes it possible to estimate the short-term relation between export sector wage growth shocks in explanatory variables and their deviation from the long-term relationship The long-term relationship in also analysed in terms of levels using a dynamic ordinary least squares (DOLS) model and the results incorporated in an ECM model
Estimates were made on a sample of 17 EU countries for which data are available over the period 1980-2013 This has not only has the advantage of gaining degrees of freedom and reinforcing the results It also makes it possible to
(34) Holmlund B (1993) Wage setting in private and public sectors
in a model with endogenous government behaviour European Journal of Political Economy Vol 9(2) pp 149-162
(35) The spillover from the public to the private sector is likely to be mediated by the structure of wage-setting systems Alesina and Perotti (1997) find that increases in labour taxation do not necessarily lead to higher wage demands by unions in highly centralised bargaining systems as large wage setters would internalise the consequences from higher labour costs on employment
(36) For instance Lane (2003) and Lamo et al (2007) find that public wages are pro-cyclical because of discretionary fiscal expansion in good times Lane P (2003) The cyclical behaviour of fiscal policy evidence from the OECD in Journal of Public Economics Vol 87 pp 2661-2675 Lamo A Perez JJ Schuknecht L (2007) The cyclicality of consumption wages and employment of the public sector in the euro area ECB Working Paper No 757
II Special topics on the euro area economy
Volume 13 No 1 | 29
investigate the role of framework conditions in bringing the impact of general government to bear on manufacturing wages by means of appropriate sample splits Box II21 shows the estimation methodology and the results
Much of the variance in manufacturing wages is explained by variables usually used when estimating wage equations (ie the price level labour productivity and the unemployment rate) and by general government wage levels Both the long- and short-term elasticity of manufacturing wages with respect to government wages is estimated to be around 03-04 This tallies with the results of similar studies (eg Afonso and Gomes 2008) It works both ways general government wages also react to manufacturing wages They have a long-term elasticity of 08 and a short-term elasticity of 04 (37) This is consistent with the fact that it is more usual for the private sector than for the government to take the lead in terms of wages as the available literature also shows (38) The DOLS cointegration estimation delivers qualitatively identical results The results are still valid when the sample is restricted to just the euro area (39) The relationship tested on real wages is symmetrical because manufacturing wages respond to government wages whether they are increased or reduced
One hypothesis tested here is whether the size of the government sector determines the extent to which changes to government wages affect average conditions on the private market if for example there is cross-sector mobility In order to test how this market-based channel works the same EU sample is split into two groups of countries those in which the average share of government to total employment is above the whole EU samplersquos median and countries in which it is below the median Results show that in the long-run the impact of public on manufacturing wages is considerably higher in the case of large public sectors This divide disappears in the short-run In the opposite direction going from manufacturing to public wages the split does not produce differentiated results This confirms that government size matters when it comes to the public sectors long-term impact on the labour
(37) The results are not shown (38) Perez JJ and AJ Sanchez (2011) (39) Still it should be noted that the sample used excludes some key
countries in the euro area
market The DOLS methodology confirms these results (40)
Another hypothesis that is tested is whether the way wages are set in the public sector increases the chances of manufacturing wages reacting to government wages Broadly speaking two wage-setting systems may be identified
bull This first is that wages are mainly set on thebasis of collective bargaining
bull The second is that wages are set on the basis ofunilateral decision by the government (41)
The results show that the way wages are set does not fundamentally alter the relation between government and manufacturing wages in the long- or the short-term It is however interesting to note that across all methodologies used the relationship between manufacturing wages and labour productivity is weaker in countries characterised by a unilateral decision wage-setting system This is probably because in such a case the spillover from public to private wages is such that private wages tend to be misaligned with sectoral productivity This is not the case when government wages are set through a collective bargaining wage-setting system possibly because bargaining processes even in a particular type of insulated sector such as the public one reflect market forces more than a unilateral government decision
The relationship between government and manufacturing wages under fiscal stress
Most countries in the euro area have recently been trying to cut government wage bills by freezing wages cutting or retrenching specific indemnities or benefits (including bonuses andor holidays) or blocking turnover As a result the share of government compensations in total government spending has fallen Between 2008 and 2012 this fall was particularly sharp for Latvia Portugal and Romania followed by Hungary Spain Denmark and Estonia (Graph II21)
(40) The results from the DOLS are not shown (41) For a classification of EU wage-setting systems in the government
sector see European Commission Directorate for Economic and Financial Affairs (2014) Government wages and labour market outcomes Occasional Paper forthcoming
30 | Quarterly Report on the Euro Area
(Continued on the next page)
II Special topics on the euro area economy
Volume 13 No 1 | 31
Box (continued)
(Continued on the next page)
32 | Quarterly Report on the Euro Area
Box (continued)
II Special topics on the euro area economy
Volume 13 No 1 | 33
The recent crisis marked a watershed in the evolution of public compensations Between 1999 and 2007 relative government wage growth did not vary from cold-shower periods (or periods of more gradual fiscal consolidation) to periods of non-consolidation (42)
Graph II21 Change in the share of general government compensations to
total spending (2008-2012 in pp)
Source DG ECFIN calculations based on AMECO
Conversely starting with the 2008-2009 crisis compensations per employee in the government sector grew more slowly compared with those in the manufacturing sector and more clearly so during fiscal consolidation (Graph II22)
It is possible that under conditions of fiscal stress the relationship between government and export sector wages differs from that of normal periods This aspect has been neglected in previous analyses To shed some light on it Table II21 shows the correlation between government wage growth and manufacturing wage growth under alternative fiscal conditions (consolidation and non-consolidation) differentiating between countries with large and small public sectors The evidence shows that the two wages are closely related in periods of fiscal stress only if the government employs a large share of the labour forces This suggests that the possibility of
(42) By convention episodes of fiscal consolidation are defined as those during which the structural primary balance improves by at least 15 per cent of GDP in one year or at least 3 per cent in three years with a minimum improvement of 05 per cent in each year Such a definition makes it possible to distinguish between cases of cold-shower consolidation episodes and more gradual consolidation episodes
expenditure-based fiscal consolidation having the type of supply-side effects described in Alesina and Perotti (1997) Alesina et al (2002) and Ardagna (2004) may be a consequence of the size of the public sector among other things
Graph II22 Government and manufacturing compensations under
alternative fiscal conditions EU countries (1999-2007 and 2008-2012 avg annual change)
Source DG ECFIN calculations based on OECD
Table II21 Correlation between government and manufacturing
compensations growth under alternative fiscal conditions EU (1)
(1) Pearson correlation coefficients Sample EU countries (excluding AT BG CY DE EL LT LV MT RO SI) over 1980-2012 (1995-2012 in the case of CZ EE HU SK) Source DG ECFIN calculations based on OECD
Concluding remarks
Spillovers which are the result of high wages in the general government sector have been mentioned as one of the drivers of competitiveness losses in
34 | Quarterly Report on the Euro Area
some countries in the euro area before the crisis (43)
The results presented here speak to this debate and may be summarised as follows Government wage levels have a long-term impact on wages in the manufacturing sector even more so in countries in which the government sector employs a relatively large share of the labour force That said their short-term impact remains unaffected by the size of the public sector Looking at it the other way round manufacturing wages usually have a greater impact on government wages regardless of size This is arguably because private sector wage leadership is more common than public sector wage leadership
(43) Blanchard O (2007) Adjustment within the euro The difficult
case of Portugal in Portuguese Economic Journal 61 1-21
The way government wages are set also plays a role In collective bargaining systems not only are government and manufacturing wages related in both the long- and the short-term (as they are also when the government sets wages by unilateral decision) Also most importantly wages in the tradable sector are better aligned with labour productivity The evidence provided here indicates that if the government wage bill is inflated for example due to unjustified wage premia limiting public wage growth would spill over into the private export sector reducing labour costs and helping boost competitiveness and employment in the sector Whilst structural reforms including skill upgrading in manufacturing are an important and necessary ingredient for achieving non-reversible gains in competitiveness the adjustment of competitiveness through fiscal policy remains a complementary tool to deliver sustained external rebalancing
II Special topics on the euro area economy
Volume 13 No 1 | 35
II3 Latvia maintaining sustainable growth after the boom-bust years (44)
Latvia had been keen to join the euro area at the earliest opportunity with entry in January 2008 the clear target As the economy overheated however significant macro-economic imbalances accumulated which deferred these plans Between 2005 and 2007 unsustainable GDP growth went hand in hand with a mounting current account deficit and a housing market spiralling out of control When credit flows then abruptly reversed the countryrsquos GDP contracted dramatically Latvia was placed in the EUIMF-led financial assistance programme and was forced to carry out ambitious fiscal consolidation and structural reforms Reallocating resources to the tradable sector was the first important step on the road to an export-driven recovery Under the burden of deleveraging and consolidation the revival of domestic demand was slow at first From 2011 however supported by favourable labour market developments growth in demand has accelerated Latvia has reclaimed its position as the fastest-growing EU economy however the current level of growth is lower than the unstainable rates recorded in the boom years and it is now seen as sustainable Thanks to this balanced growth Latvia has not been subject to the MIP since its launch in 2012 Despite the financial assistance-supported measures to preserve equity the social burden of economic adjustment as evidenced by poverty social exclusion and emigration rates has been high but measures are being taken by the authorities to counter these effects Continued commitment to prudent fiscal policies will be critical for the countryrsquos economic future The use of macro-prudential tools to reduce the risks posed by large non-resident financial flows and the implementation of ambitious structural reforms will also play an important role
-----------------------
Introduction
To welcome Latvias recent adoption of the euro this section reviews the countrys recent boom-bust experience and discusses the challenges ahead
Five years ago it would have been difficult to imagine that Latvia would be able to fulfil the conditions for adopting the euro and enter the euro
(44) Section prepared by Gatis Eglitis and Christian Weise
area in January 2014 After EU accession in May 2004 significant macro-economic imbalances had started to accumulate on the back of an overheating economy and by autumn 2008 the country was on the brink of bankruptcy A painful and seemingly impossible economic adjustment to be achieved by means of internal devaluation lay ahead This would require unprecedented fiscal consolidation huge redundancies and difficult structural reforms threatening political and social stability Yet despite pronounced scepticism from the outset and particularly at the height of the crisis in mid-2009 the economy has moved back to growth The measures implemented took some time to take effect with the economy continuing to decline at first before picking up as seen in the lsquoVrsquo-shaped recovery but a protracted recession was avoided Latviarsquos GDP growth has exceeded expectations reaching levels of 54 in 2011 52 in 2012 and around 4 in 2013 The two factors that were critical to the countryrsquos economic recovery were a return to international competitiveness and the rapid correction of external imbalances The budget deficit decreased significantly and is expected to reach a balanced position in the near future The level of government debt is projected to stay around 40-42 of GDP in 2013-2014 and to decline to 33 of GDP in 2015 as the repayments to the EU take effect and sizable cash buffers will be reduced The financial assistance programme was successfully completed in January 2012 Financial support had not been necessary since October 2010 however and the government had re-entered international bond markets in June 2011 well ahead of schedule (45) As of 2013 GDP per capita in constant prices has returned to the level reached at its peak in 2007 Due to the decline in the population however the absolute value of GDP in constant prices was still about 9 below 2007 levels with current projections suggesting that a full recovery to the pre-crisis peak will be achieved in 2015
Overheating imbalances and a big bust
Latvia joined the EU in seemingly good macroeconomic health and having pegged its currency to the Special Drawing Right (SDR) in
(45) Occasional Paper 120 issued by the European Commission Directorate-General for Economic and Financial Affairs EU Balance of Payments assistance for Latvia foundations of success httpseceuropaeueconomy_financepublicationsoccasional_paper2012op120_enhtm
36 | Quarterly Report on the Euro Area
1994 and then to the euro in 2005 was keen to join the euro area in January 2008 Upon entering the Exchange Rate Mechanism II (ERM II) on 2 May 2005 the authorities unilaterally committed to maintaining a smaller fluctuation margin of plusmn1 around the central rate ndash seen as a sign of the countryrsquos determination to join the euro area The Latvian economy was the fastest growing in the EU between 2000 and 2007 and between 2005 and 2007 real GDP growth reached a yearly average of over 10 Following accession to the EU in 2004 Latvia along with other EU countries witnessed a rapid credit expansion Loans to residents grew at an average annual rate of close to 50 between 2004 and 2008 a reflection of the excess liquidity at that time and of the resulting hot money inflows into central and eastern European economies which were rapidly converging with their western European counterparts Foreign investment exploded driven by commercial banksrsquo mispricing of risk and over-optimistic expectations of convergence A number of privatisation deals and most importantly a burgeoning real-estate market characterised by soaring prices also served to attract foreign investors The tradable sector was meanwhile largely neglected By way of illustration foreign direct investment (FDI) reached relatively high levels of 84 and 81 of GDP in 2006 and 2007 respectively but most of this was directed towards the real-estate market while the proportion of total FDI relating to manufacturing was only 12 in 2013 Significant imbalances were accumulating as indicated by a current account deficit that reached around 22 of GDP in 2006 and 2007 and by labour market tightening Nominal wages doubled between 2004 and 2007 increasing much faster than productivity and thus damaging international competitiveness
By early 2008 more cautious bank lending had caused economic growth to slow significantly By autumn of the same year this slowdown had developed into a strong contraction reflecting the wider global economic situation The global economy fell into recession commodity prices reached record highs and the general risk aversion seen in global markets following the collapse of Lehman Brothers cut off Latviarsquos access to financial markets The second largest domestic bank Parex had to be rescued Latvia ultimately experienced the most severe GDP contraction of all EU countries at close to 18 in 2009 The government deficit threatened to spiral out of control Having been at 03 of GDP in 2007 and 42 in 2008 in spring 2009 it was projected to
reach levels well above 15 of GDP by the end of year in the absence of a significant consolidation package
Faced with an economic crisis of this order Latvia agreed a medium-term financial assistance programme the balance of payments programme (BoP) with the EU and the IMF in December 2008 (46) The aim of this was to preserve the existing exchange-rate arrangement The assistance offered to Latvia was made subject to a number of policy conditions relating to fiscal consolidation financial sector stabilisation and the introduction of a wide range of structural reforms including a significant acceleration in the absorption of EU structural funds The Latvian government also undertook to strengthen the social safety net so as to protect the most vulnerable from the effects of the crisis
Brave measures in difficult times
Given that the exchange rate was at that time pegged to the euro some economists suggested devaluation as the only way out of the crisis The national authorities and international partners did not see that as a viable option however because its effectiveness would have been severely limited by the degree to which imports were used in the manufacture of exports and the high proportion of foreign liabilities Furthermore it would have brought with it the risk of mass bankruptcy and a partial collapse of the domestic banking system at a time when the judicial system was clearly not capable of coping with such a fall-out In addition devaluation would have provided no incentive to solve Latviarsquos structural problems including weak fiscal governance the unsustainability of pension expenditure loss-making state-owned banks a lack of competitiveness and weak institutions
Between 2009 and 2011 the Latvian government carried out an ambitious programme of fiscal adjustment designed to correct the previously loose fiscal policy the weaknesses of which had been hidden by the countryrsquos strong economic growth This difficult adjustment restored Latviarsquos public finances to better health and established a
(46) Funds available from EU countries IMF World Bank EBRD
and Norway amounted to euro 75 billion of which Latvia used euro 45 billion (60) with euro 29 billion lent by the European Commission on behalf of the EU The first tranche of EUR 1 billion (13 of the total) was repaid by Latvia on 25 March 2014
II Special topics on the euro area economy
Volume 13 No 1 | 37
framework which would be sustainable in the long term The nominal balance improved with the deficit being cut from 98 of GDP in 2009 to 13 of GDP in 2012 and 2013 (see graph II31) The structural deficit also fell from its peak of 55 of GDP in 2008 to around 025 of GDP in 2012 and 2013 beating Latviarsquos medium-term objective of -05 of GDP as set in the convergence programmes
Latviarsquos fiscal consolidation measures were undoubtedly bold with fiscal savings equivalent to around 17 of GDP implemented within three years The measures were frontloaded and half of these savings were implemented in the first year alone The measures were on the whole expenditure-oriented with over half of the savings coming from cuts to health education and public administration budgets The most notable measure relating to revenue was an increase in VAT from 18 to 22 The consolidation strategy was eventually successful in containing the adverse effects of the budget deficit on the economy In fact it even appears to have triggered lsquonon-Keynesianrsquo effects on demand by restoring confidence and stimulating demand and investment at the point when it was most needed (47)
Graph II31 Latviarsquos government budget balance and debt (2008-15 of GDP)
Source DG ECFIN Commissionrsquos spring 2013 forecast
The fiscal framework was also strengthened significantly by the law on fiscal discipline coming into force in March 2013 and the creation of a fiscal council in January 2014 The signing of the
(47) Ibid see Chapter 4 Fiscal consolidation in the midst of the crisis
Treaty on Stability Coordination and Governance in the EMU (48) in March 2012 provided further EU-level support for the national fiscal framework
An additional factor that was critical to the success of the consolidation strategy but is often overlooked was the availability of significant EU funds (particularly from around 2009 onwards) which acted as a much-needed demand trigger in sectors affected by the decline in economic activity Between 2007 and 2013 Latvia benefited from the third highest allocation of EU funds after Hungary and Lithuania receiving a yearly average equivalent to around 28 of GDP or 70 of gross fixed capital formation(49) As on average every euro of national budget spending was supplemented by five to six euros co-financing from EU funds national expenditure on items such as road and public building construction vocational education and training of unemployed science infrastructure development and healthcare was often replaced by Structural funds financing despite being in conflict with the EU funds additionality principle Clearly such large inflows of EU financing also generated substantial tax revenues in particular VAT at a time when private consumption was weak
The Latvian labour market demonstrated a high level of flexibility during the crisis thanks in part to a decentralised wage-setting system Significant public-sector wage cuts indirectly supported nominal wage reduction in the private sector in 2009 and 2010 when earnings per employee fell by a total of 19 over two years Employment levels fell sharply especially in the private sector as jobs were cut in construction and manufacturing The unemployment rate reached around 20 in early 2010 but had fallen back to 119 by 2013 due mainly to growth in employment with the participation rate also increasing significantly over this period The projection from the Commissionrsquos 2014 winter forecast shows wages in 2014-15 growing broadly in line with productivity although the labour market is tightening and structural problems in particular regional differences and skill mismatches could create pressures in the economy
(48) httpeuropean-councileuropaeumedia639235st00tscg26_en12pdf
(49) Source Directorate-General for Regional Policy Infoview
38 | Quarterly Report on the Euro Area
External cost competitiveness has improved noticeably since 2008 with labour costs falling significantly and labour productivity in particular in the tradable sector increasing In 2008 the real effective exchange rate (REER) adjusted for unit labour costs reached a peak of 64 above the 2000 level before falling by about 20 in 2009-10 since when it has remained broadly stable (see graph II32) This level of REER is considered sustainable as the country has been seen to be steadily gaining market share over recent years (including as measured by exports adjusted for the growth of markets) The percentage of the countryrsquos GDP attributable to exports rose to 60 in 2013 from 43 in 2007 with some 60 of exports destined for the EU and 12 for Russia
Graph II32 Effective exchange rates Latvia v 35 trading partners
(Jan 2007-Dec 2013 monthly avg 2007 = 100)
Source DG ECFIN
The social burden of economic adjustment has admittedly been high in Latvia despite the policy measures contained in the Memorandum of Understanding stipulating inter alia establishment of a comprehensive social safety net supporting local governments in providing social assistance and discounting social payments from overall budget targets High unemployment has led to a wave of emigration to richer EU countries which coupled with Latviarsquos low fertility and high death rates has seen the population decrease by 8-10 since 2008 Net emigration has now fallen substantially however since the peak of the crisis years The rates of poverty and social exclusion in Latvia are among the highest in the EU families with children unemployed people people with disabilities and people living in rural areas are particularly at risk The countryrsquos spending on
social protection and healthcare as a percentage of GDP is among the lowest in the EU Furthermore the social protection measures which do exist to reduce poverty tend to be ineffective highlighting the importance of a robust social safety net It appears however that with the improved economic situation and increasing levels of general social awareness the authorities are finally starting to address the challenges of poverty and social exclusion with greater determination In recent years for example taxation of low-income earners has been cut slightly and child poverty has been reduced thanks to increases in various child-related benefits Proposals for reforms to social assistance in line with 2013 World Banks study are being gradually implemented Better targeted more effective policies relating to the active labour market mostly financed by the European Social Fund are helping unemployed people in particular the long-term unemployed and young people to find work or to obtain relevant training
As part of the BoP programme and in the context of the assessment of Latviarsquos readiness to join the euro area financial supervision has been tightened and EU resources for supervision and monitoring increased in particular for monitoring the growing non-resident banking sector Additional liquidity and capital adequacy requirements for non-resident banks were introduced in 2013 regular on- and off-site checks of these banks are being performed the deposit guarantee fund has been further strengthened and monitoring has been stepped up in relation to pledged assets and the origin of funds in bank recapitalizations This strengthened regulatory policy has been introduced partly as a result of lessons learnt at significant cost in the past five years most notably with the Parex and Krajbanka failures
Latvia has implemented a series of ambitious reforms to the business environment in recent years with the aim of reducing start-up costs simplifying procedures for property registration construction permits and tax collection and introducing out-of-court settlement of insolvencies In doing so Latvia has brought its regulatory framework a significant step closer to what is regarded as best practice In the World Bankrsquos 2014 Doing Business report Latvia was ranked 25th out of 185 countries with only four euro-area members faring better
II Special topics on the euro area economy
Volume 13 No 1 | 39
Conclusion
The origins of Latviarsquos years of boom and bust can be traced back to the domestic regional and global circumstances at that time globally excess liquidity and hot money flowing into vulnerable countries regionally unrealistic expectations of income convergence in central and eastern Europe and domestically undue optimism about growth in personal incomes and mispricing of risk by commercial banks amplified by the behaviour of both policymakers and individuals
A broad range of country-specific and general economic factors have contributed to the successful economic adjustment seen in Latvia since the height of the crisis Ambitious front-loaded and largely expenditure-based fiscal consolidation helped to contain the budget deficit whilst the confidence generated by the introduction of a credible programme itself aided the economic recovery The flexibility of the labour market meanwhile helped companies to restore competitiveness by means of wage reductions and job cuts Competitiveness was also improved by steps taken to shift the tax burden from labour to consumption and property The recovery in Latvia was very much export-driven with the growth in exports made possible by the openness of the economy and the faster-than-expected economic growth experienced by major trading partners A number of structural reforms including bank restructuring and measures improving the use of EU funds have contributed to the development of a more favourable business environment A generous allocation from the European structural funds meanwhile helped to boost public investment and supported financing and reforms in many important sectors Above all the success of the recovery measures implemented in Latvia proved that for a tough internal economic adjustment to be effective there needs to be both a determined political will to carry out unpopular reforms and also a fully-developed comprehensive social safety net to protect more vulnerable groups
in society during difficult times In addition Latvia benefited from the fact that those looking for work were able to migrate to other EU countries which helped to alleviate the social tension created by the effects of the crisis Some of the lessons above are clearly applicable to other Member States undergoing challenging economic adjustment while others are more Latvia-specific
While Latviarsquos current level of economic growth is regarded as sustainable (50) and the adoption of the euro is recognised as a significant and hard-earned achievement it is not the end of the road The current robust economic situation should be used to advance reforms and improve Latvias long-term growth potential rather than lead to complacency and relaxation of reform efforts Sustainable convergence of the economy in the longer term will require inter alia ongoing commitment to prudent fiscal policies (there are some recent signs of less prudent fiscal decision-making) a continuous use of macro-prudential tools to reduce risks from growing non-resident financial flows especially in view of recent Ukraine events and the implementation of reforms in a number of vested-interest-heavy areas These include higher education and science state owned enterprise management electricity and gas market liberalization and the judiciary including insolvency framework But above all and in order to ensure economic and social sustainability for years to come high rates of poverty social exclusion and dismal demographic trends need to be addressed boldly These and other structural challenges are being addressed by the Commission under the European Semester and the Post Program Surveillance frameworks Also Latvia has joined a euro area that is very different from what it was just a few years ago the euro area economic governance framework has been greatly strengthened entailing stricter obligations
(50) The Commissionrsquos alert mechanism reports issued under the Macroeconomic Imbalance Procedure have not identified economic imbalances in Latvia requiring further in-depth investigation for possible policy action
httpeceuropaeueurope2020pdf2014amr2014_enpdf
40 | Quarterly Report on the Euro Area
II4 Corporate balance sheet adjustment in the euro area and the United States (51)
This section compares balance sheet adjustment in the non-financial corporate sector in the euro area and the United States It shows that the adjustment since the crisis has been faster in the latter Despite similar steep rises in corporate debt in pre-crisis years US corporations have cut debt more than those in the euro area Shifts from loans to bonds and extensions of debt maturity have also been more pronounced in the United States Much of the difference in balance sheet consolidation can be traced back to more positive profitability trends providing US firms with the internal funds necessary to adjust balance sheets Differences in dividend distribution strategies and in corporations physical investment behaviours also played a role Profitability differences reflect differences both in cyclical conditions and labour market adjustment Comparatively slow progress in balance sheet consolidation is likely to weigh on investment recovery in the euro area
-----------------------
Introduction
Both the euro area and the United States experienced a surge in corporate indebtedness in the years preceding the global financial crisis and in its early stages The ratio of debt to gross value added by non-financial corporations (NFCs) rose by about 40 pp between 2005 and 2009 Deteriorating growth prospects and changing attitudes to risk have prompted NFCs in both economies to adjust their balance sheets As previously argued in the Quarterly Report balance sheet adjustment can have a substantial effect on economic activity and it is important to monitor regularly the ongoing adjustment in the euro area (52) This section contributes to the monitoring by comparing progress in corporate deleveraging in the euro area and in the United States two regions where firms entered the crisis with excessive debt
(51) Section prepared by Plamen Nikolov (52) See European Commission (2010) Focus Balance sheet
adjustment in the corporate sector Quarterly Report on the Euro Area Vol9 (3) pp 9-19 A more detailed overview of the literature on the impact of balance sheet adjustment can be found in Cuerpo C I Drumond J Lendvai P Pontuch and R Raciborski (2013) Indebtedness deleveraging dynamics and macroeconomic adjustment European Economy Economic Papers 477
Firms consolidate their balance sheets primarily by raising their net lendingborrowing (NLB) ie the cash obtained from their production activity and available for financial operations (53) A rise in NLB is achieved either by increasing savings or cuttingpostponing physical investment Firms increase savings by raising profits and reducing the dividends distributed to shareholders In firmsrsquo financial accounts a rise in corporate NLB is associated with a rise in financial assets andor a cut in financial liabilities The section reviews recent developments in euro area and US profitability savings and NLB and looks at the instruments that the corporate sector has used to consolidate its balance sheet on both the asset and the liability side
Corporate profits have disappointed in the euro area hellip
National account data show that corporate profitability in the euro area reached a pre-crisis peak in 2007Q3 ie later than in the United States where it had already started to decline in 2007 (54)
Graph II41 NFC profitability euro area and US
(2000Q1-2013Q3 of GVA)
20
25
30
35
40
45
00Q1 01Q3 03Q1 04Q3 06Q1 07Q3 09Q1 10Q3 12Q1 13Q3
Euro area (1)
US
(1)Excluding Latvia Source Eurostat US Bureau of Economic Analysis DG ECFIN calculations
(53) Firms can also consolidate their balance sheets by raising equity (54) Profitability like the other national account variables for the
corporate sector presented in this section is measured as a proportion of corporate sector activity represented by gross value added (GVA) It is calculated as the gross operating surplus plus financial revenues and subsidies and minus financial and tax expenses Financial expenses do not include earnings distributed to shareholders
II Special topics on the euro area economy
Volume 13 No 1 | 41
The 2008-09 recession brought a sharp drop in corporate profitability in the euro area Profitability recovered briefly in 2010 to reach a new peak in 2011 but has declined again since then (Graph II41) In the United States the impact of the crisis was rather muted with profits recovering vigorously after 2008 As a ratio to gross value added (GVA) US corporate profits had already passed their pre-crisis level in 2009 before flattening out in the past two years Overall by 2013 profitability in the euro area was still about 2 pp below its pre-crisis peak while in the United States it stood around 3 pp above
hellip mostly due to weak operating surplus
The disappointing profit performance in the euro area relative to the United States is largely due to differing developments in gross operating surplus Looking at the breakdown of the contribution to the cumulative change in corporate profitability since the start of the crisis there is a marked difference between firms in the euro area and those in the United States (Graphs II42 and II43) (55)
Graph II42 Profitability breakdown of NFCs euro area (1)
(cumulative change in from 2007Q3 peak to 2013Q3)
35
36
37
38
39
40
41
42
-100
-80
-60
-40
-20
0
20
40
60
80
100
07Q4 08Q4 09Q4 10Q4 11Q4 12Q4
Taxes (lhs)
Other net current transfers received (lhs)
Net property income received excl dividends paid (lhs)
Operating surplus (lhs)
Profits(rhs)(2)
(1)Excluding Latvia(2)Profits in of GVA Source Eurostat DG ECFIN calculations
In the euro area a fall in the ratio of operating surplus to GVA dragged overall profitability down after 2008 Despite an improvement in 2011 in
(55) The illustration of the contributions to the cumulative change in profitability only serves to depict the relative importance of the various components of the change in profits since the crisis The starting point for the cumulative change should not be interpreted as a reference point for a desirable profit recovery
2013 operating surplus was still contributing negatively to the cumulative change in profitability since the pre-crisis peak In contrast operating surplus in the United States responded to the crisis earlier than in the euro area but its contribution to the change in profits remained positive
Graph II43 Profitability breakdown of NFCs US
(cumulative change in from 2005Q3 peak to 2013Q3)
24
25
26
27
28
29
30
31
-100
-80
-60
-40
-20
0
20
40
60
80
100
05Q4 06Q4 07Q4 08Q4 09Q4 10Q4 11Q4 12Q4
Taxes (lhs)Other net current transfers received (lhs)Net property income received excl dividends paid (lhs)Operating surplus (lhs)Profits(rhs)(2)
(1) Profits in of GVA Source Federal Reserve Board US Bureau of Economic Analysis DG ECFIN calculations
Unlike operating surplus income tax payments and net income from non-operational activities did not differ significantly between the euro area and the United States (56) In both economies lower corporate tax payments resulting from lower profits generated by NFCs naturally had a positive impact on the cumulative change in profits from the pre-crisis peak
Differences in labour market developments are at the root of differences in profitability
Differences in operating surplus and profitability between the United States and the euro area can be attributed partly to differences in the business cycle In 2011Q1 NFCsrsquo gross value added was still 12 below its pre-crisis peak in the euro area but 11 above in the United States The main channel through which cyclical developments can affect operating surplus is the labour market
(56) In fact the ratio of profit tax payments to profits (a crude measure of an aggregate tax rate) in the euro area and the United States has been almost the same since the start of the crisis falling substantially in 2008-09 indicating that tax policy was not more favourable for profits in one economy than in the other
42 | Quarterly Report on the Euro Area
The cyclicality of operating surplus depends on the impact of the cycle on labour productivity as well as on wages The worse performance of operating surplus in the euro area since 2008 as compared with that in the United States reflects a stronger deterioration in labour productivity accompanied by unfavourable developments in wages per employee
Labour productivity growth in the euro area turned sharply negative in 2009 opening a big gap with the positive (albeit modest) wage growth (Graph II44) In the United States on the other hand labour productivity growth became negative earlier but to a lesser extent and some downward wage adjustment took place in 2009
Graph II44 Labour productivity and wages euro area and US
(2001Q4-2013Q3 y-o-y change)
-4
-3
-2
-1
0
1
2
3
4
5
01Q4 03Q2 04Q4 06Q2 07Q4 09Q2 10Q4 12Q2
Average wage per employee euro area (1) (2)Average wage per employee US (1)Labour productivity euro area (2) (3)Labour productivity US (3)
(1)Real wages calculated by the GDP deflator(2)Euro area excluding Latvia(3)In terms of total employment (thousands) Source Eurostat US Bureau of Economic Analysis US Bureau of Labour Statistics DG ECFIN calculations
There are a number of reasons for the different labour adjustments in the euro area and the United States In the former apart from a higher level of employment protection short-term work schemes were put in place in the early stages of the crisis (57) In addition as labour force adjustment tends to be more costly in the euro area some firms (particularly small firms and those with highly qualified employees) preferred to retain their
(57) According to the OECD Public short-term work schemes have
played an important role in preserving jobs during the crisis in a number of countries although significant hours reductions were also achieved via lower overtime hours hours averaging arrangements and employer initiatives see OECD Employment Outlook 2010 ndash Moving Beyond the Job Crisis
labour force (58) Because of a lack of wage flexibility the higher degree of lsquolabour hoardingrsquo in the euro area came at the expense of lower operating surplus and profits and consequently put a downward pressure on the capacity accumulate internal funds to deleverage
Corporate savings are much lower in the euro area
Negative developments in euro area corporate profitability were reflected in corporate savings which together with physical investment determines the internal funds available for balance sheet adjustment In 2009-10 there was a sharp drop in euro area savings because profits acted as shock absorbers and fell more rapidly than dividend payments leaving less spare cash available In contrast savings by US NFCs increased substantially on rising profits after an early-crisis low point and reached a historically high level of around 23 of GVA in 2010Q3 (Graph II45)
Graph II45 Savings of NFCs (2000Q1- 2013Q3 of GVA)
15
16
17
18
19
20
21
22
23
24
00Q1 01Q3 03Q1 04Q3 06Q1 07Q3 09Q1 10Q3 12Q1 13Q3
Euro area (1)
US
(1)Euro area excluding Latvia Source Eurostat Bureau of Economic Analysis DG ECFIN calculations
The impression that US corporate behaviour has been more geared towards accumulating savings than that in the euro area is reinforced when one looks at dividend distribution Dividends paid by euro area NFCs have been on a declining trend since the start of the crisis but those paid by US firms have also decreased This is remarkable given (58) See Box 12 Labour hoarding across different types of firms in
OECD Employment Outlook 2010 ndash Moving Beyond the Job Crisis
II Special topics on the euro area economy
Volume 13 No 1 | 43
the positive profit developments in the United States (Graph II46) A drop in dividends alongside profit growth suggests that after 2008 US companies preferred to direct a bigger proportion of the profit recovery to corporate savings and thereby balance sheet adjustment The ratio of dividends to profits in the United States has fallen from about one third before the crisis to one quarter now This ratio also dropped in the euro area although by less (59)
Graph II46 Dividends paid of NFCs (2000Q1-2013Q3 of GVA)
0
5
10
15
20
25
00Q1 01Q3 03Q1 04Q3 06Q1 07Q3 09Q1 10Q3 12Q1 13Q3
Euro area (1)
US
(1)Euro area excluding Latvia Source Eurostat Federal Reserve Board DG ECFIN calculations
Disappointing physical investment in the euro area and the United States
Cutting investment in physical assets is another way of reducing excessive indebtedness Corporate investment as a proportion of activity dropped sharply both in the euro area and in the United States in the early stages of the crisis (Graph II47)
After a modest recovery in 2010-11 the investment rate decreased again in the euro area The investment recovery was more solid in the United States but has lost momentum since the end of 2012 and the investment rate remains below its pre-crisis peak Overall it seems that euro area corporations partly compensated for less supportive savings developments than in the US by
(59) Dividend payments are not the only way of distributing profits to shareholders Equity buybacks can also be used for this purpose and firms that choose this option will tend to have higher savings and lower dividends paid
curbing physical investment more than their US counterparts
Graph II47 Investment of NFCs (2000Q1- 2013Q3 of GVA)
15
16
17
18
19
20
21
22
23
24
00Q1 01Q3 03Q1 04Q3 06Q1 07Q3 09Q1 10Q3 12Q1 13Q3
Euro area (1)
US
(1)Excluding Latvia Source Eurostat US Bureau of Economic Analysis DG ECFIN calculations
A more modest increase in net lending in the euro area than in the US
Since 2013 firmsrsquo net lending in the euro area has been in positive territory but substantially less so than that in the United States (Graph II48) Positive NLB in the euro area unlike that in the United States is mostly due to a low investment rate alone rather than low investment combined with high savings The combination of disappointing investment and high savings has translated into historically high and sustained NLB for US firms
This persistent net lending position in the United States is atypical as firms usually invest more than they save It suggests that US firms have been adjusting their balance sheets significantly since the beginning of the crisis via their internal funds while euro area firms seem to have opted for much slower balance sheet adjustment
44 | Quarterly Report on the Euro Area
Graph II48 Net lendingborrowing of NFCs
(2000Q1- 2013Q3 of GVA)
-10
-8
-6
-4
-2
0
2
4
6
8
00Q1 01Q3 03Q1 04Q3 06Q1 07Q3 09Q1 10Q3 12Q1 13Q3
Euro area (1)
US
(1)Excluding Latvia Source Eurostat US Bureau of Economic Analysis DG ECFIN calculations
Debt deleveraging has been more pronounced in the US than in the euro area
The faster pace of adjustment of balance sheets in the United States is confirmed by the corporate debt data (Graph II49) (60) (61) While both the euro area and the United States entered the crisis with swiftly rising and historically high levels of debt deleveraging has progressed more rapidly in the latter since the crisis By the beginning of 2012 US corporate debt had fallen by approximately 15 pp as a proportion of activity while euro area debt had dropped by 7 pp (62)
(60) Non-financial corporate debt consists of loans and securities
other than shares (corporate bonds) both can be classified as short- or long-term depending on whether their original maturity is less or more than one year
(61) This section analyses developments in non-consolidated financial flows and stocks in the euro area and in the United States for two reasons it is important to have a sense of financial positions within the institutional sector eg loans between NFCs are an important part of intra-firm relationships as head offices use them to finance subsidiaries for example perhaps for tax reasons This is relatively more important in the euro area than in the United States Consolidated financial asset and flow data eliminate these intra-sector positions and different approaches may be taken to consolidation as in the euro area there is the additional issue of cross-border consolidation between Member States while there is no need for flows and positions between firms in different US states to be treated separately
(62) The debt-to-equity ratio is another measure of corporate leverage widely followed by investors Faster stock market recovery helped US firms reduce this ratio more than those in the euro area
Graph II49 Debt levels of NFCs(1) (1999Q1-2013Q3 of GVA)
100
120
140
160
180
200
220
99Q1 00Q3 02Q1 03Q3 05Q1 06Q3 08Q1 09Q3 11Q1 12Q3
Euro area (2)
US
(1)Securities other than shares and loans(2)Excluding Latvia Source Eurostat US Bureau of Economic Analysis DG ECFIN calculations
Firms in the euro area and the United States entered the crisis with almost the same level of short-term debt as a proportion of total debt Since the crisis the adjustment away from short-term debt has been significantly more pronounced in the United States suggesting more active balance sheet restructuring
Graph II410 Debt flows of NFCs(1) (1999Q1- 2013Q3 of GVA)
-15
-10
-5
0
5
10
15
20
99Q1 01Q1 03Q1 05Q1 07Q1 09Q1 11Q1 13Q1
Euro area bonds (2)
US bonds
Euro area loans (2)
US loans
(1)Securities other than shares and loans (2)Excluding Latvia Source Eurostat US Bureau of Economic Analysis DG ECFIN calculations
Due to differences in the structure of corporate finance loans (as opposed to bonds) tend to form a bigger proportion of debt in the euro area than in the United States An important element of the
II Special topics on the euro area economy
Volume 13 No 1 | 45
corporate balance sheet adjustment process in both economies has been a movement away from an excessive reliance on loans (Graph II410) and towards bond financing This trend has been substantially more pronounced in the United States presumably reflecting the fact that bond markets are more developed in that country
Developments in non-financial corporate debt were also influenced by developments in financial intermediation in particular in the banking sector Financial accounts show NFCsrsquo debt exposure but do not indicate whether the debt holder is a bank According to bank balance sheet statistics the nominal growth of loans vis-agrave-vis NFCs has been mostly negative in the euro area since 2009Q4 (Graph II411) Coupled with the positive loan inflows seen in the national accounts between 2010Q3 and 2012Q3 (Graph II410) this shows a degree of substitution in corporate loan liability ownership between banks and other financial firms and sectors (including other NFCs) in this period According to the counterparty breakdown of NFC domestic loans published by the ECB corporate borrowings from other NFCs represented 29 of all loans by 2013Q3 (up from 26 in 2008Q1) while the proportion of borrowings from monetary financial institutions (MFIs) had dropped (from 60 in 2008Q1) to an all-time low of 53 The proportion of loans from other non-bank financial intermediaries also increased There is less evidence of a shift from banks to other loan providers in the United States where loans between NFCs are much more limited
Graph II411 Bank loans to NFCs (1999Q1- 2013Q3 y-o-y change)
-20
-15
-10
-5
0
5
10
15
20
25
99Q1 00Q3 02Q1 03Q3 05Q1 06Q3 08Q1 09Q3 11Q1 12Q3
Euro area bank loans to NFCs (1)US bank loans to NFCs
(1)Excluding Latvia Source ECB US Federal Reserve Board DG ECFIN calculations
Positive NLB has been used to acquire safe financial assets in both regions
In both the euro area and the United States the positive NLB has been used to deleverage but also to invest in safe financial assets At the beginning of the crisis much of the positive corporate NLB in the United States was invested in money market mutual funds which is essentially investment in short-term low-risk assets (Graph II412) (63)
Currency and deposits (another type of safe asset) have increased substantially in the euro area in recent years as a proportion of total firm activity (Graph II413) This rise was driven almost exclusively by a rapid increase in firmsrsquo savings deposits To some extent a similar trend is observable in the United States In particular US cash balances (a sub-component of currency and deposits) approached 12 of GVA by the end of 2013 a level not seen since the early 1990s On the other hand savings deposits have grown more modestly resulting in a moderately positive overall trend in currency and deposits
Graph II412 Mutual fund shares of NFCs (1999Q1- 2013Q3 of GVA)
0
2
4
6
8
10
12
14
99Q1 01Q1 03Q1 05Q1 07Q1 09Q1 11Q1 13Q1
Euro area (1)
US (2)
(1)Excluding Latvia(2)In the USA these asset series can be broken down into investment in money market mutual funds and investment in other mutual funds The 2009-11 increase is fully attributable to the former Source Eurostat US Bureau of Economic Analysis DG ECFIN calculations
Overall these two aspects of corporate financial investment behaviour signify considerable liquidity concerns on the part of firms in both the euro area
(63) Euro area financial accounts only show firmsrsquo investment in mutual funds overall and do not distinguish between types of mutual funds
46 | Quarterly Report on the Euro Area
and the United States They also represent a drive towards lower-risk assets perhaps indicating increased risk aversion by corporations or a tendency to postpone physical investment in a context of perceived high uncertainty
Graph II413 Currency and deposits ndash NFCs
(1999Q1- 2013Q3 of GVA)
0
5
10
15
20
25
30
35
40
45
99Q1 00Q3 02Q1 03Q3 05Q1 06Q3 08Q1 09Q3 11Q1 12Q3
Euro area (1)
US
(1)Excluding Latvia Source Eurostat US Bureau of Economic Analysis DG ECFIN calculations
Conclusion
Although both regions saw similar steep rises in corporate debt in the pre-crisis years balance sheet adjustment since the crisis has been significantly slower in the euro area than in the United States The more rapid adjustment in the United States can be explained by a stronger cyclical recovery more supportive profitability developments and reduced dividend payment ratios In the euro area profitability has been hindered by a combination of lower flexibility in the labour markets and slow wage adjustment
The slower balance sheet adjustment in the euro area corporate sector is visible in a slower fall in indebtedness but also a slower adjustment of the structure of balance sheets In particular the shift from loans to bonds and the extension of debt maturity have been more pronounced in the United States In both regions firms have used their positive NLB to accelerate the accumulation of safe and liquid financial assets This could reflect continuing uncertainty regarding future demand and growth prospects
Overall the evidence discussed in this section shows that euro area firms are lagging significantly behind their US counterparts in terms of balance sheet consolidation Given that investment rates remain disappointing even in the more advanced US corporate sector a degree of caution appears warranted when assessing short-term prospects for corporate investment in the euro area
III Recent DG ECFIN publications
Volume 13 No 1 | 47
1 Occasional Papers
European Economy Occasional Papers 170 January 2014 Financial Assistance Programme for the Recapitalisation of Financial Institutions in Spain Fifth Review ndash Winter 2014 httpeceuropaeueconomy_financepublicationsoccasional_paper2014pdfocp170_enpdf
European Economy Occasional Papers 169 December 2013 The Economic Adjustment Programme for Cyprus Second Review ndash Autumn 2013 httpeceuropaeueconomy_financepublicationsoccasional_paper2013pdfocp169_enpdf
European Economy Occasional Papers 168 December 2013 Fiscal frameworks in the European Union ommission services country factsheets for the Autumn 2013 Peer Review httpeceuropaeueconomy_financepublicationsoccasional_paper2013pdfocp168_enpdf
European Economy Occasional Papers 167 December 2013 Economic Adjustment Programme for Ireland - Autumn 2013 Review httpeceuropaeueconomy_financepublicationsoccasional_paper2013pdfocp167_enpdf
European Economy Occasional Papers 166 December 2013 Progress towards meeting the economic criteria for EU accession the EU Commissionrsquos 2013 assessments httpeceuropaeueconomy_financepublicationsoccasional_paper2013pdfocp166_enpdf
European Economy Occasional Papers 165 November 2013 Romania Balance-of-Payments Assistance Programme 2013-2015 httpeceuropaeueconomy_financepublicationsoccasional_paper2013pdfocp165_enpdf
European Economy Occasional Papers 164 November 2013 The Economic Adjustment Programme for Portugal Eighth and Ninth Review httpeceuropaeueconomy_financepublicationsoccasional_paper2013pdfocp164_enpdf
European Economy Occasional Papers 163 November 2013 Financial Assistance Programme for the Recapitalisation of Financial Institutions in Spain Fourth Review ndash Autumn 2013 httpeceuropaeueconomy_financepublicationsoccasional_paper2013pdfocp163_enpdf
European Economy Occasional Papers 162 October 2013 Economic Adjustment Programme for Ireland Summer 2013 Review httpeceuropaeueconomy_financepublicationsoccasional_paper2013pdfocp162_enpdf
2 Economic papers
European Economy Economic Papers 514 February 2014 Martin Larch Kristin Magnusson Bernard Balint Tatar Hard work and More How to successfully conduct adjustment with official assistance httpeceuropaeueconomy_financepublicationseconomic_paper2014pdfecp514_enpdf
European Economy Economic Papers 513 February 2014 Florian Woumlhlbier Caterina Astarita Gilles Mourre Consolidation on the revenue side and growth-friendly tax structures an indicator based approach httpeceuropaeueconomy_financepublicationseconomic_paper2014pdfecp513_enpdf
48 | Quarterly Report on the Euro Area
European Economy Economic Papers 512 December 2013 Alexander Schwan Etienne Sail Assessing the economic and budgetary impact of linking retirement ages and pension benefits to increases in longevity httpeceuropaeueconomy_financepublicationseconomic_paper2013pdfecp512_enpdf 3 Other publications
Winter forecast 2014 - EU economy recovery gaining ground httpeceuropaeueconomy_financepublicationseuropean_economy2014pdfee2_enpdf 4 Regular publications
Business and Consumer Surveys (harmonised surveys for different sectors of the economies in the European Union (EU) and the applicant countries) httpeceuropaeueconomy_financedb_indicatorssurveysindex_enhtm Business Climate Indicator for the euro area (monthly indicator designed to deliver a clear and early assessment of the cyclical situation) httpeceuropaeueconomy_financedb_indicatorssurveysdocuments2013bci_2013_11_enpdf Key indicators for the euro area (presents the most relevant economic statistics concerning the euro area) httpeceuropaeueconomy_financedb_indicatorskey_indicatorsindex_enhtm Monthly and quarterly notes on the euro-denominated bond markets (looks at the volumes of debt issued the maturity structures and the conditions in the market) httpeceuropaeueconomy_financepublicationsbond_marketindex_enhtm Price and Cost Competitiveness httpeceuropaeueconomy_financedb_indicatorscompetitivenessindex_enhtm
50 | Quarterly Report on the Euro Area
Editor-in-Chief Elena Flores
Overall coordination Eric Ruscher
Data assistance Christos Zavos
Comments on the report would be gratefully received and should be sent to
Elena Flores Director ndash Policy Strategy and Coordination Directorate-General for Economic and Financial Affairs Office CHAR 1566
B-1049 Brussels
Email elenafloreseceuropaeu
or
Eric Ruscher Head of Unit ndash Macroeconomy of the euro area Directorate-General for Economic and Financial Affairs Office CHAR 15248
B-1049 Brussels
Email ericruschereceuropaeu
HOW TO OBTAIN EU PUBLICATIONS Free publications bull one copy
via EU Bookshop (httpbookshopeuropaeu) bull more than one copy or postersmaps
from the European Unionrsquos representations (httpeceuropaeurepresent_enhtm) from the delegations in non-EU countries (httpeeaseuropaeudelegationsindex_enhtm) by contacting the Europe Direct service (httpeuropaeueuropedirectindex_enhtm) or calling 00 800 6 7 8 9 10 11 (freephone number from anywhere in the EU) () () The information given is free as are most calls (though some operators phone boxes or hotels may charge you)
Priced publications bull via EU Bookshop (httpbookshopeuropaeu) Priced subscriptions bull via one of the sales agents of the Publications Office of the European Union
(httppublicationseuropaeuothersagentsindex_enhtm)
KC-AK-14-001-en-n
- Blank Page
- Blank Page
- Blank Page
- Blank Page
-

II Special topics on the euro area economy
Volume 13 No 1 | 25
In particular changes in the NAWRU are sometimes interpreted as a sign of a structural change Careful analysis of developments in the NAWRUs produced by DG ECFIN shows that they can be driven by both structural and non-structural factors(24)
In particular crisis-related shocks (eg unwinding of unsustainable developments) especially boom-bust episodes in the housing market that can trigger a lengthy process of deleveraging in the construction sector have a statistically significant impact on the NAWRU The real interest rate and Total Factor Productivity (TFP) growth which controls more generally for the presence of such shocks also play a part in driving NAWRU develpoments
At a theoretical level adding various rigidities (eg real wage rigidity cyclical price mark-ups or sluggish adjustment of the reservation wage) to the traditional labour market model can be shown to yield a NAWRU that is not solely determined by structural factors
Despite uncertainties the NAWRU remains a useful policy indicator It is a well-defined concept that provides useful information on the nature of unemployment rate developments In particular it identifies risks of persistent labour market deteriorations that may not always be caused by structural phenomena(25)
In this context it appears useful to distinguish between the NAWRU and a narrowly defined notion of structural unemployment affected only by structural factors as shown in Graph II11 by
(24) For further details see Orlandi F (2012) Structural unemployment and its determinants in the EU countries European Economy mdash Economic Paper No 455 DG ECFIN European Commission May 2012
(25) For further details see Cyclical and structural unemployment in the euro area in Labour Market Developments in Europe 2013 European Commission
the lsquostructural unemploymentrsquo series The latter represents the portion of the NAWRU that according to econometric results appears to be explained by structural features of the labour market As can be seen the series has remained broadly stable during the crisis Except for a notable decline due to structural labour market reforms in Germany change in the NAWRU in the euro area is not related to structural change This is also the case in Spain where structural unemployment has remained broadly stable
Recent increases in the euro-area NAWRU should therefore not be interpreted as a sign of big structural change at the current juncture Rather in most countries the increases reflect the effects of shocks that in the presence of various rigidities have a long-lasting impact on unemployment rates
To sum up the decline in the NAWRU at euro-area level and in countries like Spain in the run-up to the crisis appears mostly attributable to non-structural factors such as unsustainable developments in the housing sector The build-up and subsequent unwinding of imbalances has caused large economic shocks (eg need for sectoral reallocation) which have a persistent effect on the performance of the labour market However in some countries structural factors have also played a role in driving NAWRU developments In Germany for example the decline in the NAWRU seems related to some aspects of the Hartz reforms (eg the change in the period of eligibility for unemployment benefit appears to have contributed to a decline of the NAWRU over recent years) This suggests that large-scale reforms as currently being enacted in some countries will tend to translate into a gradual lowering of the NAWRU over coming years For example recent efforts in Ireland to bring down the labour tax wedge appear to be contributing to more favourable NAWRU developments A number of countries (eg France) have failed to
Box (continued)
26 | Quarterly Report on the Euro Area
post similar improvements in their underlying labour market structures
Graph II12 Alternative labour cost signals for the euro area Germany and Spain (1)
(1965-2014)
(1)GDP-weighted average of euro-area countries for which alternative NAWRUs have been computed (ie AT BE DE EL ES FI FR IE IT NL and PT) (2)Private consumption deflated ULC Source DG ECFIN calculations based on Eurostat data
Conclusions
Alternative Phillips curve specifications based on different assumptions regarding expectation formation point to broadly similar NAWRU results for the euro area Estimates point to a recent rise in the NAWRU suggesting that post-crisis unemployment increases are to some extent persistent
In the case of Spain alternative Phillips curve specifications yield somewhat different NAWRU results pointing to the current importance for that country of theoretical considerations regarding expectations The NKP which uses rational expectations and relies on RULC growth to identify the unemployment gap yields a more moderate NAWRU increase over recent years than the TKP (hitherto used by DG ECFIN) which allows only for static or adaptive expectations and relies on the signal provided by the change in nominal ULC growth While this sensitivity in the results underlines the need for caution in interpreting NAWRU estimates it should also be borne in mind that all specifications point to an important increase in the NAWRU for Spain at this juncture
The deterioration in the NAWRU signals difficulties that are likely to last beyond the cyclical upturn In interpreting those developments it is important to recognise that changes in the NAWRU can be caused by both structural and non-structural factors While the improvement in the NAWRU in Germany seems to be caused by structural factors the deterioration in Spain seems to be caused more by crisis-related events that have persistent effects due to the presence of various rigidities that tend to slow down the adjustment process
II Special topics on the euro area economy
Volume 13 No 1 | 27
II2 The relationship between government and export sector wages and implications for competitiveness (26)
In 2012 the general government sector employed on average about 15 of the labour force in the euro area Since most countries in the euro area are now trying to consolidate public finances whilst also trying to boost competitiveness for external rebalancing and to reduce unemployment it is crucial to assess whether there is any wage spillover from the public to the export sector in particular under conditions of fiscal stress This section shows that there has been a link between government and manufacturing wages over the long-run which is much closer when the government employs a large share of the labour force Government size dimension is especially important during fiscal consolidation If the government wage bill is inflated due to unjustified wage premia for example limiting government wage growth is a fiscal strategy that may among other effects deliver competitiveness gains that contribute to external rebalancing and help boost employment in the tradable sector
-----------------------
Introduction
General government employment accounts for a considerable share of the labour force in the euro area It stood at about 15 in 2012 with but some cross-country variation The evolution of government wages is likely to have an impact not only on fiscal variables and on the sustainability of public finances but also on the labour market on cost competitiveness and on external rebalancing within the euro area This section looks at the relationship between public and private sector wages at a time when most euro area countries are trying to consolidate their public finances improve competitiveness to support external rebalancing whilst also having to tackle high unemployment levels (27)
Changes in general government compensations may spill over into the private sector through both
(26) Section prepared by Benedicta Marzinotto and Alessandro Turrini
(27) Throughout the section the public sector is referred to alongside general government which refers to public offices at all levels of government non-market public owned hospitals schools and social security organizations Thus the term public is used as a synonym for general government
market-based and institutional channels For example excessive government wages may crowd out private sector employment inflating cost conditions and leading to competitiveness losses (28) There are channels of transmission also in the opposite direction from the private to the government sector Wage growth linked to productivity improvements in the private sector can spill over into the public if there is labour mobility across sectors This can affect governments capacity to keep wage expenditure growth under control
Against this background this section analyses the relationship between general government and manufacturing wages in order to assess the potential for and conditions of a wage spillover from the insulated government sector to the export sector The relationship is analysed by looking at a sample of EU countries over the period 1980-2013 in a co-integration framework that makes it possible to distinguish between long-run and short-run effects The relationship between the two wages is also assessed for different fiscal scenarios differentiating between normal periods and periods of fiscal adjustment
The various forms the relationship takes
The relationship between public and private wages takes many forms It may be influenced by market forces andor by institutional features of the wage setting system in each country Changes in private wages can affect government wage growth in the following ways
bull Wage bargaining in the private sector has ademonstration effect on public wage-settersPerez and Sanchez (2011) find evidence ofsignalling by the private sector in thenegotiation phase in France and Germanybefore the EMU period (29) Signalling may bemotivated by envy effects that reflect thestrength of the wage-bargaining position (30) or
(28) See for example Alesina A and R Perotti (1997) The welfare state and competitiveness American Economic Review Vol 87 pp 921-939 Alesina A Ardagna S Perotti R and Schiantarelli F (2002) Fiscal policy profits and investment American Economic Review Vol 92(3) pp 571-589 Ardagna S (2004) Fiscal stabilizations when do they work and why European Economic Review Vol 48 pp 1047-1074
(29) Perez JJ and AJ Sanchez (2011) Is there a signalling role for public wages Evidence of the euro area based on macro data Empirical Economics Vol 41(2) pp 421-445
(30) Maffezzoli M (2001) Non-Walrasian labor markets and real business cycles Review of Economic Dynamics Vol 4(4) pp 860-
28 | Quarterly Report on the Euro Area
by the fact that the same trade union negotiates wages for both sectors
bull Wage-bargaining practices may explicitly or implicitly grant wage leadership to the private sector Under the Scandinavian wage-setting model the private export sector typically takes the lead dictating bargaining outcomes to other sectors including the public sector (31)
bull There may also be established practices and institutional mechanisms that make public wages responsive to private wage settlements usually those of the export sector This is the case if for example there is a formal rule under which the growth rate of private wages is automatically applied to public sector wages (32)
It is of course a two-way street Changes in government wages affect private wage growth in a number of ways
bull Wage adjustment in the public sector causes cross-sector labour shifts and a change in the private sectors labour supply As the supply of labour changes so does the competitive private sectors equilibrium wage
bull Adjustments to government wages affect the outside option of unionised private sector bargainers putting pressures on the bargaining process (33) with for example private sector workers tempted to move to the general government sector due to large public wage increases
892 Ardagna S (2007) Fiscal policy in unionized labor markets Journal of Economic Dynamics and Control Vol 31(5) pp 1498-1534
(31) For a review see Lindquist J and R Vilhemsson (2006) Is the Swedish central government a wage leader Applied Economics Vol 38 pp 1617-1625 Friberg K (2007) Intersectoral wage linkages the case of Sweden Empirical Economics Vol 32 pp 161-184 Traxler F and B Brandl (2012) Collective bargaining inter-sectoral heterogeneity and competitiveness a cross-national comparison of macroeconomic performance British Journal of Industrial Relations Vol 50(1) pp 73-98 Ramskloger P (2012) Is there a European wage leader Wage spillovers in the European Monetary Union Cambridge Journal of Economics Vol 36(4) pp 941-962 and (2013) The nationalndashtransnational wage-setting nexus in Europe What have we learned from the early years of monetary integration Journal of Common Market Studies Vol 51(5) pp 916-930
(32) For evidence on the Netherlands see Hartog J and H Oosterbeek (1993) Public and private sector wages in the Netherlands European Economic Review Vol 37(1) pp 97-114
(33) Afonso A and P Gomes (2008) Interactions between private and public sector wages ECB Working Paper No 971
bull Changes in public wages may be fully compensated in government budgets by changes in labour taxation that alter labour costs in the private sector (34) and might also affect union behaviour (35)
Co-movements between government and private wages may also take place in the absence of direct links when driven by factors common to both sectors For example public wages may be pro-cyclical and change in a manner similar to private wages over the cycle (36) Co-movements in aggregate wage series could be linked to developments common to both factors relating to the composition of the labour force
Testing the relationship between government and manufacturing wages
To analyse more systematically the long- and short-term effects of government wages on the export sector a cointegration approach is used linking manufacturing compensations to a number of determinants including compensation in the government sector The long-term relationship is analysed in terms of levels while the Error Correction Mechanism (ECM) equation makes it possible to estimate the short-term relation between export sector wage growth shocks in explanatory variables and their deviation from the long-term relationship The long-term relationship in also analysed in terms of levels using a dynamic ordinary least squares (DOLS) model and the results incorporated in an ECM model
Estimates were made on a sample of 17 EU countries for which data are available over the period 1980-2013 This has not only has the advantage of gaining degrees of freedom and reinforcing the results It also makes it possible to
(34) Holmlund B (1993) Wage setting in private and public sectors
in a model with endogenous government behaviour European Journal of Political Economy Vol 9(2) pp 149-162
(35) The spillover from the public to the private sector is likely to be mediated by the structure of wage-setting systems Alesina and Perotti (1997) find that increases in labour taxation do not necessarily lead to higher wage demands by unions in highly centralised bargaining systems as large wage setters would internalise the consequences from higher labour costs on employment
(36) For instance Lane (2003) and Lamo et al (2007) find that public wages are pro-cyclical because of discretionary fiscal expansion in good times Lane P (2003) The cyclical behaviour of fiscal policy evidence from the OECD in Journal of Public Economics Vol 87 pp 2661-2675 Lamo A Perez JJ Schuknecht L (2007) The cyclicality of consumption wages and employment of the public sector in the euro area ECB Working Paper No 757
II Special topics on the euro area economy
Volume 13 No 1 | 29
investigate the role of framework conditions in bringing the impact of general government to bear on manufacturing wages by means of appropriate sample splits Box II21 shows the estimation methodology and the results
Much of the variance in manufacturing wages is explained by variables usually used when estimating wage equations (ie the price level labour productivity and the unemployment rate) and by general government wage levels Both the long- and short-term elasticity of manufacturing wages with respect to government wages is estimated to be around 03-04 This tallies with the results of similar studies (eg Afonso and Gomes 2008) It works both ways general government wages also react to manufacturing wages They have a long-term elasticity of 08 and a short-term elasticity of 04 (37) This is consistent with the fact that it is more usual for the private sector than for the government to take the lead in terms of wages as the available literature also shows (38) The DOLS cointegration estimation delivers qualitatively identical results The results are still valid when the sample is restricted to just the euro area (39) The relationship tested on real wages is symmetrical because manufacturing wages respond to government wages whether they are increased or reduced
One hypothesis tested here is whether the size of the government sector determines the extent to which changes to government wages affect average conditions on the private market if for example there is cross-sector mobility In order to test how this market-based channel works the same EU sample is split into two groups of countries those in which the average share of government to total employment is above the whole EU samplersquos median and countries in which it is below the median Results show that in the long-run the impact of public on manufacturing wages is considerably higher in the case of large public sectors This divide disappears in the short-run In the opposite direction going from manufacturing to public wages the split does not produce differentiated results This confirms that government size matters when it comes to the public sectors long-term impact on the labour
(37) The results are not shown (38) Perez JJ and AJ Sanchez (2011) (39) Still it should be noted that the sample used excludes some key
countries in the euro area
market The DOLS methodology confirms these results (40)
Another hypothesis that is tested is whether the way wages are set in the public sector increases the chances of manufacturing wages reacting to government wages Broadly speaking two wage-setting systems may be identified
bull This first is that wages are mainly set on thebasis of collective bargaining
bull The second is that wages are set on the basis ofunilateral decision by the government (41)
The results show that the way wages are set does not fundamentally alter the relation between government and manufacturing wages in the long- or the short-term It is however interesting to note that across all methodologies used the relationship between manufacturing wages and labour productivity is weaker in countries characterised by a unilateral decision wage-setting system This is probably because in such a case the spillover from public to private wages is such that private wages tend to be misaligned with sectoral productivity This is not the case when government wages are set through a collective bargaining wage-setting system possibly because bargaining processes even in a particular type of insulated sector such as the public one reflect market forces more than a unilateral government decision
The relationship between government and manufacturing wages under fiscal stress
Most countries in the euro area have recently been trying to cut government wage bills by freezing wages cutting or retrenching specific indemnities or benefits (including bonuses andor holidays) or blocking turnover As a result the share of government compensations in total government spending has fallen Between 2008 and 2012 this fall was particularly sharp for Latvia Portugal and Romania followed by Hungary Spain Denmark and Estonia (Graph II21)
(40) The results from the DOLS are not shown (41) For a classification of EU wage-setting systems in the government
sector see European Commission Directorate for Economic and Financial Affairs (2014) Government wages and labour market outcomes Occasional Paper forthcoming
30 | Quarterly Report on the Euro Area
(Continued on the next page)
II Special topics on the euro area economy
Volume 13 No 1 | 31
Box (continued)
(Continued on the next page)
32 | Quarterly Report on the Euro Area
Box (continued)
II Special topics on the euro area economy
Volume 13 No 1 | 33
The recent crisis marked a watershed in the evolution of public compensations Between 1999 and 2007 relative government wage growth did not vary from cold-shower periods (or periods of more gradual fiscal consolidation) to periods of non-consolidation (42)
Graph II21 Change in the share of general government compensations to
total spending (2008-2012 in pp)
Source DG ECFIN calculations based on AMECO
Conversely starting with the 2008-2009 crisis compensations per employee in the government sector grew more slowly compared with those in the manufacturing sector and more clearly so during fiscal consolidation (Graph II22)
It is possible that under conditions of fiscal stress the relationship between government and export sector wages differs from that of normal periods This aspect has been neglected in previous analyses To shed some light on it Table II21 shows the correlation between government wage growth and manufacturing wage growth under alternative fiscal conditions (consolidation and non-consolidation) differentiating between countries with large and small public sectors The evidence shows that the two wages are closely related in periods of fiscal stress only if the government employs a large share of the labour forces This suggests that the possibility of
(42) By convention episodes of fiscal consolidation are defined as those during which the structural primary balance improves by at least 15 per cent of GDP in one year or at least 3 per cent in three years with a minimum improvement of 05 per cent in each year Such a definition makes it possible to distinguish between cases of cold-shower consolidation episodes and more gradual consolidation episodes
expenditure-based fiscal consolidation having the type of supply-side effects described in Alesina and Perotti (1997) Alesina et al (2002) and Ardagna (2004) may be a consequence of the size of the public sector among other things
Graph II22 Government and manufacturing compensations under
alternative fiscal conditions EU countries (1999-2007 and 2008-2012 avg annual change)
Source DG ECFIN calculations based on OECD
Table II21 Correlation between government and manufacturing
compensations growth under alternative fiscal conditions EU (1)
(1) Pearson correlation coefficients Sample EU countries (excluding AT BG CY DE EL LT LV MT RO SI) over 1980-2012 (1995-2012 in the case of CZ EE HU SK) Source DG ECFIN calculations based on OECD
Concluding remarks
Spillovers which are the result of high wages in the general government sector have been mentioned as one of the drivers of competitiveness losses in
34 | Quarterly Report on the Euro Area
some countries in the euro area before the crisis (43)
The results presented here speak to this debate and may be summarised as follows Government wage levels have a long-term impact on wages in the manufacturing sector even more so in countries in which the government sector employs a relatively large share of the labour force That said their short-term impact remains unaffected by the size of the public sector Looking at it the other way round manufacturing wages usually have a greater impact on government wages regardless of size This is arguably because private sector wage leadership is more common than public sector wage leadership
(43) Blanchard O (2007) Adjustment within the euro The difficult
case of Portugal in Portuguese Economic Journal 61 1-21
The way government wages are set also plays a role In collective bargaining systems not only are government and manufacturing wages related in both the long- and the short-term (as they are also when the government sets wages by unilateral decision) Also most importantly wages in the tradable sector are better aligned with labour productivity The evidence provided here indicates that if the government wage bill is inflated for example due to unjustified wage premia limiting public wage growth would spill over into the private export sector reducing labour costs and helping boost competitiveness and employment in the sector Whilst structural reforms including skill upgrading in manufacturing are an important and necessary ingredient for achieving non-reversible gains in competitiveness the adjustment of competitiveness through fiscal policy remains a complementary tool to deliver sustained external rebalancing
II Special topics on the euro area economy
Volume 13 No 1 | 35
II3 Latvia maintaining sustainable growth after the boom-bust years (44)
Latvia had been keen to join the euro area at the earliest opportunity with entry in January 2008 the clear target As the economy overheated however significant macro-economic imbalances accumulated which deferred these plans Between 2005 and 2007 unsustainable GDP growth went hand in hand with a mounting current account deficit and a housing market spiralling out of control When credit flows then abruptly reversed the countryrsquos GDP contracted dramatically Latvia was placed in the EUIMF-led financial assistance programme and was forced to carry out ambitious fiscal consolidation and structural reforms Reallocating resources to the tradable sector was the first important step on the road to an export-driven recovery Under the burden of deleveraging and consolidation the revival of domestic demand was slow at first From 2011 however supported by favourable labour market developments growth in demand has accelerated Latvia has reclaimed its position as the fastest-growing EU economy however the current level of growth is lower than the unstainable rates recorded in the boom years and it is now seen as sustainable Thanks to this balanced growth Latvia has not been subject to the MIP since its launch in 2012 Despite the financial assistance-supported measures to preserve equity the social burden of economic adjustment as evidenced by poverty social exclusion and emigration rates has been high but measures are being taken by the authorities to counter these effects Continued commitment to prudent fiscal policies will be critical for the countryrsquos economic future The use of macro-prudential tools to reduce the risks posed by large non-resident financial flows and the implementation of ambitious structural reforms will also play an important role
-----------------------
Introduction
To welcome Latvias recent adoption of the euro this section reviews the countrys recent boom-bust experience and discusses the challenges ahead
Five years ago it would have been difficult to imagine that Latvia would be able to fulfil the conditions for adopting the euro and enter the euro
(44) Section prepared by Gatis Eglitis and Christian Weise
area in January 2014 After EU accession in May 2004 significant macro-economic imbalances had started to accumulate on the back of an overheating economy and by autumn 2008 the country was on the brink of bankruptcy A painful and seemingly impossible economic adjustment to be achieved by means of internal devaluation lay ahead This would require unprecedented fiscal consolidation huge redundancies and difficult structural reforms threatening political and social stability Yet despite pronounced scepticism from the outset and particularly at the height of the crisis in mid-2009 the economy has moved back to growth The measures implemented took some time to take effect with the economy continuing to decline at first before picking up as seen in the lsquoVrsquo-shaped recovery but a protracted recession was avoided Latviarsquos GDP growth has exceeded expectations reaching levels of 54 in 2011 52 in 2012 and around 4 in 2013 The two factors that were critical to the countryrsquos economic recovery were a return to international competitiveness and the rapid correction of external imbalances The budget deficit decreased significantly and is expected to reach a balanced position in the near future The level of government debt is projected to stay around 40-42 of GDP in 2013-2014 and to decline to 33 of GDP in 2015 as the repayments to the EU take effect and sizable cash buffers will be reduced The financial assistance programme was successfully completed in January 2012 Financial support had not been necessary since October 2010 however and the government had re-entered international bond markets in June 2011 well ahead of schedule (45) As of 2013 GDP per capita in constant prices has returned to the level reached at its peak in 2007 Due to the decline in the population however the absolute value of GDP in constant prices was still about 9 below 2007 levels with current projections suggesting that a full recovery to the pre-crisis peak will be achieved in 2015
Overheating imbalances and a big bust
Latvia joined the EU in seemingly good macroeconomic health and having pegged its currency to the Special Drawing Right (SDR) in
(45) Occasional Paper 120 issued by the European Commission Directorate-General for Economic and Financial Affairs EU Balance of Payments assistance for Latvia foundations of success httpseceuropaeueconomy_financepublicationsoccasional_paper2012op120_enhtm
36 | Quarterly Report on the Euro Area
1994 and then to the euro in 2005 was keen to join the euro area in January 2008 Upon entering the Exchange Rate Mechanism II (ERM II) on 2 May 2005 the authorities unilaterally committed to maintaining a smaller fluctuation margin of plusmn1 around the central rate ndash seen as a sign of the countryrsquos determination to join the euro area The Latvian economy was the fastest growing in the EU between 2000 and 2007 and between 2005 and 2007 real GDP growth reached a yearly average of over 10 Following accession to the EU in 2004 Latvia along with other EU countries witnessed a rapid credit expansion Loans to residents grew at an average annual rate of close to 50 between 2004 and 2008 a reflection of the excess liquidity at that time and of the resulting hot money inflows into central and eastern European economies which were rapidly converging with their western European counterparts Foreign investment exploded driven by commercial banksrsquo mispricing of risk and over-optimistic expectations of convergence A number of privatisation deals and most importantly a burgeoning real-estate market characterised by soaring prices also served to attract foreign investors The tradable sector was meanwhile largely neglected By way of illustration foreign direct investment (FDI) reached relatively high levels of 84 and 81 of GDP in 2006 and 2007 respectively but most of this was directed towards the real-estate market while the proportion of total FDI relating to manufacturing was only 12 in 2013 Significant imbalances were accumulating as indicated by a current account deficit that reached around 22 of GDP in 2006 and 2007 and by labour market tightening Nominal wages doubled between 2004 and 2007 increasing much faster than productivity and thus damaging international competitiveness
By early 2008 more cautious bank lending had caused economic growth to slow significantly By autumn of the same year this slowdown had developed into a strong contraction reflecting the wider global economic situation The global economy fell into recession commodity prices reached record highs and the general risk aversion seen in global markets following the collapse of Lehman Brothers cut off Latviarsquos access to financial markets The second largest domestic bank Parex had to be rescued Latvia ultimately experienced the most severe GDP contraction of all EU countries at close to 18 in 2009 The government deficit threatened to spiral out of control Having been at 03 of GDP in 2007 and 42 in 2008 in spring 2009 it was projected to
reach levels well above 15 of GDP by the end of year in the absence of a significant consolidation package
Faced with an economic crisis of this order Latvia agreed a medium-term financial assistance programme the balance of payments programme (BoP) with the EU and the IMF in December 2008 (46) The aim of this was to preserve the existing exchange-rate arrangement The assistance offered to Latvia was made subject to a number of policy conditions relating to fiscal consolidation financial sector stabilisation and the introduction of a wide range of structural reforms including a significant acceleration in the absorption of EU structural funds The Latvian government also undertook to strengthen the social safety net so as to protect the most vulnerable from the effects of the crisis
Brave measures in difficult times
Given that the exchange rate was at that time pegged to the euro some economists suggested devaluation as the only way out of the crisis The national authorities and international partners did not see that as a viable option however because its effectiveness would have been severely limited by the degree to which imports were used in the manufacture of exports and the high proportion of foreign liabilities Furthermore it would have brought with it the risk of mass bankruptcy and a partial collapse of the domestic banking system at a time when the judicial system was clearly not capable of coping with such a fall-out In addition devaluation would have provided no incentive to solve Latviarsquos structural problems including weak fiscal governance the unsustainability of pension expenditure loss-making state-owned banks a lack of competitiveness and weak institutions
Between 2009 and 2011 the Latvian government carried out an ambitious programme of fiscal adjustment designed to correct the previously loose fiscal policy the weaknesses of which had been hidden by the countryrsquos strong economic growth This difficult adjustment restored Latviarsquos public finances to better health and established a
(46) Funds available from EU countries IMF World Bank EBRD
and Norway amounted to euro 75 billion of which Latvia used euro 45 billion (60) with euro 29 billion lent by the European Commission on behalf of the EU The first tranche of EUR 1 billion (13 of the total) was repaid by Latvia on 25 March 2014
II Special topics on the euro area economy
Volume 13 No 1 | 37
framework which would be sustainable in the long term The nominal balance improved with the deficit being cut from 98 of GDP in 2009 to 13 of GDP in 2012 and 2013 (see graph II31) The structural deficit also fell from its peak of 55 of GDP in 2008 to around 025 of GDP in 2012 and 2013 beating Latviarsquos medium-term objective of -05 of GDP as set in the convergence programmes
Latviarsquos fiscal consolidation measures were undoubtedly bold with fiscal savings equivalent to around 17 of GDP implemented within three years The measures were frontloaded and half of these savings were implemented in the first year alone The measures were on the whole expenditure-oriented with over half of the savings coming from cuts to health education and public administration budgets The most notable measure relating to revenue was an increase in VAT from 18 to 22 The consolidation strategy was eventually successful in containing the adverse effects of the budget deficit on the economy In fact it even appears to have triggered lsquonon-Keynesianrsquo effects on demand by restoring confidence and stimulating demand and investment at the point when it was most needed (47)
Graph II31 Latviarsquos government budget balance and debt (2008-15 of GDP)
Source DG ECFIN Commissionrsquos spring 2013 forecast
The fiscal framework was also strengthened significantly by the law on fiscal discipline coming into force in March 2013 and the creation of a fiscal council in January 2014 The signing of the
(47) Ibid see Chapter 4 Fiscal consolidation in the midst of the crisis
Treaty on Stability Coordination and Governance in the EMU (48) in March 2012 provided further EU-level support for the national fiscal framework
An additional factor that was critical to the success of the consolidation strategy but is often overlooked was the availability of significant EU funds (particularly from around 2009 onwards) which acted as a much-needed demand trigger in sectors affected by the decline in economic activity Between 2007 and 2013 Latvia benefited from the third highest allocation of EU funds after Hungary and Lithuania receiving a yearly average equivalent to around 28 of GDP or 70 of gross fixed capital formation(49) As on average every euro of national budget spending was supplemented by five to six euros co-financing from EU funds national expenditure on items such as road and public building construction vocational education and training of unemployed science infrastructure development and healthcare was often replaced by Structural funds financing despite being in conflict with the EU funds additionality principle Clearly such large inflows of EU financing also generated substantial tax revenues in particular VAT at a time when private consumption was weak
The Latvian labour market demonstrated a high level of flexibility during the crisis thanks in part to a decentralised wage-setting system Significant public-sector wage cuts indirectly supported nominal wage reduction in the private sector in 2009 and 2010 when earnings per employee fell by a total of 19 over two years Employment levels fell sharply especially in the private sector as jobs were cut in construction and manufacturing The unemployment rate reached around 20 in early 2010 but had fallen back to 119 by 2013 due mainly to growth in employment with the participation rate also increasing significantly over this period The projection from the Commissionrsquos 2014 winter forecast shows wages in 2014-15 growing broadly in line with productivity although the labour market is tightening and structural problems in particular regional differences and skill mismatches could create pressures in the economy
(48) httpeuropean-councileuropaeumedia639235st00tscg26_en12pdf
(49) Source Directorate-General for Regional Policy Infoview
38 | Quarterly Report on the Euro Area
External cost competitiveness has improved noticeably since 2008 with labour costs falling significantly and labour productivity in particular in the tradable sector increasing In 2008 the real effective exchange rate (REER) adjusted for unit labour costs reached a peak of 64 above the 2000 level before falling by about 20 in 2009-10 since when it has remained broadly stable (see graph II32) This level of REER is considered sustainable as the country has been seen to be steadily gaining market share over recent years (including as measured by exports adjusted for the growth of markets) The percentage of the countryrsquos GDP attributable to exports rose to 60 in 2013 from 43 in 2007 with some 60 of exports destined for the EU and 12 for Russia
Graph II32 Effective exchange rates Latvia v 35 trading partners
(Jan 2007-Dec 2013 monthly avg 2007 = 100)
Source DG ECFIN
The social burden of economic adjustment has admittedly been high in Latvia despite the policy measures contained in the Memorandum of Understanding stipulating inter alia establishment of a comprehensive social safety net supporting local governments in providing social assistance and discounting social payments from overall budget targets High unemployment has led to a wave of emigration to richer EU countries which coupled with Latviarsquos low fertility and high death rates has seen the population decrease by 8-10 since 2008 Net emigration has now fallen substantially however since the peak of the crisis years The rates of poverty and social exclusion in Latvia are among the highest in the EU families with children unemployed people people with disabilities and people living in rural areas are particularly at risk The countryrsquos spending on
social protection and healthcare as a percentage of GDP is among the lowest in the EU Furthermore the social protection measures which do exist to reduce poverty tend to be ineffective highlighting the importance of a robust social safety net It appears however that with the improved economic situation and increasing levels of general social awareness the authorities are finally starting to address the challenges of poverty and social exclusion with greater determination In recent years for example taxation of low-income earners has been cut slightly and child poverty has been reduced thanks to increases in various child-related benefits Proposals for reforms to social assistance in line with 2013 World Banks study are being gradually implemented Better targeted more effective policies relating to the active labour market mostly financed by the European Social Fund are helping unemployed people in particular the long-term unemployed and young people to find work or to obtain relevant training
As part of the BoP programme and in the context of the assessment of Latviarsquos readiness to join the euro area financial supervision has been tightened and EU resources for supervision and monitoring increased in particular for monitoring the growing non-resident banking sector Additional liquidity and capital adequacy requirements for non-resident banks were introduced in 2013 regular on- and off-site checks of these banks are being performed the deposit guarantee fund has been further strengthened and monitoring has been stepped up in relation to pledged assets and the origin of funds in bank recapitalizations This strengthened regulatory policy has been introduced partly as a result of lessons learnt at significant cost in the past five years most notably with the Parex and Krajbanka failures
Latvia has implemented a series of ambitious reforms to the business environment in recent years with the aim of reducing start-up costs simplifying procedures for property registration construction permits and tax collection and introducing out-of-court settlement of insolvencies In doing so Latvia has brought its regulatory framework a significant step closer to what is regarded as best practice In the World Bankrsquos 2014 Doing Business report Latvia was ranked 25th out of 185 countries with only four euro-area members faring better
II Special topics on the euro area economy
Volume 13 No 1 | 39
Conclusion
The origins of Latviarsquos years of boom and bust can be traced back to the domestic regional and global circumstances at that time globally excess liquidity and hot money flowing into vulnerable countries regionally unrealistic expectations of income convergence in central and eastern Europe and domestically undue optimism about growth in personal incomes and mispricing of risk by commercial banks amplified by the behaviour of both policymakers and individuals
A broad range of country-specific and general economic factors have contributed to the successful economic adjustment seen in Latvia since the height of the crisis Ambitious front-loaded and largely expenditure-based fiscal consolidation helped to contain the budget deficit whilst the confidence generated by the introduction of a credible programme itself aided the economic recovery The flexibility of the labour market meanwhile helped companies to restore competitiveness by means of wage reductions and job cuts Competitiveness was also improved by steps taken to shift the tax burden from labour to consumption and property The recovery in Latvia was very much export-driven with the growth in exports made possible by the openness of the economy and the faster-than-expected economic growth experienced by major trading partners A number of structural reforms including bank restructuring and measures improving the use of EU funds have contributed to the development of a more favourable business environment A generous allocation from the European structural funds meanwhile helped to boost public investment and supported financing and reforms in many important sectors Above all the success of the recovery measures implemented in Latvia proved that for a tough internal economic adjustment to be effective there needs to be both a determined political will to carry out unpopular reforms and also a fully-developed comprehensive social safety net to protect more vulnerable groups
in society during difficult times In addition Latvia benefited from the fact that those looking for work were able to migrate to other EU countries which helped to alleviate the social tension created by the effects of the crisis Some of the lessons above are clearly applicable to other Member States undergoing challenging economic adjustment while others are more Latvia-specific
While Latviarsquos current level of economic growth is regarded as sustainable (50) and the adoption of the euro is recognised as a significant and hard-earned achievement it is not the end of the road The current robust economic situation should be used to advance reforms and improve Latvias long-term growth potential rather than lead to complacency and relaxation of reform efforts Sustainable convergence of the economy in the longer term will require inter alia ongoing commitment to prudent fiscal policies (there are some recent signs of less prudent fiscal decision-making) a continuous use of macro-prudential tools to reduce risks from growing non-resident financial flows especially in view of recent Ukraine events and the implementation of reforms in a number of vested-interest-heavy areas These include higher education and science state owned enterprise management electricity and gas market liberalization and the judiciary including insolvency framework But above all and in order to ensure economic and social sustainability for years to come high rates of poverty social exclusion and dismal demographic trends need to be addressed boldly These and other structural challenges are being addressed by the Commission under the European Semester and the Post Program Surveillance frameworks Also Latvia has joined a euro area that is very different from what it was just a few years ago the euro area economic governance framework has been greatly strengthened entailing stricter obligations
(50) The Commissionrsquos alert mechanism reports issued under the Macroeconomic Imbalance Procedure have not identified economic imbalances in Latvia requiring further in-depth investigation for possible policy action
httpeceuropaeueurope2020pdf2014amr2014_enpdf
40 | Quarterly Report on the Euro Area
II4 Corporate balance sheet adjustment in the euro area and the United States (51)
This section compares balance sheet adjustment in the non-financial corporate sector in the euro area and the United States It shows that the adjustment since the crisis has been faster in the latter Despite similar steep rises in corporate debt in pre-crisis years US corporations have cut debt more than those in the euro area Shifts from loans to bonds and extensions of debt maturity have also been more pronounced in the United States Much of the difference in balance sheet consolidation can be traced back to more positive profitability trends providing US firms with the internal funds necessary to adjust balance sheets Differences in dividend distribution strategies and in corporations physical investment behaviours also played a role Profitability differences reflect differences both in cyclical conditions and labour market adjustment Comparatively slow progress in balance sheet consolidation is likely to weigh on investment recovery in the euro area
-----------------------
Introduction
Both the euro area and the United States experienced a surge in corporate indebtedness in the years preceding the global financial crisis and in its early stages The ratio of debt to gross value added by non-financial corporations (NFCs) rose by about 40 pp between 2005 and 2009 Deteriorating growth prospects and changing attitudes to risk have prompted NFCs in both economies to adjust their balance sheets As previously argued in the Quarterly Report balance sheet adjustment can have a substantial effect on economic activity and it is important to monitor regularly the ongoing adjustment in the euro area (52) This section contributes to the monitoring by comparing progress in corporate deleveraging in the euro area and in the United States two regions where firms entered the crisis with excessive debt
(51) Section prepared by Plamen Nikolov (52) See European Commission (2010) Focus Balance sheet
adjustment in the corporate sector Quarterly Report on the Euro Area Vol9 (3) pp 9-19 A more detailed overview of the literature on the impact of balance sheet adjustment can be found in Cuerpo C I Drumond J Lendvai P Pontuch and R Raciborski (2013) Indebtedness deleveraging dynamics and macroeconomic adjustment European Economy Economic Papers 477
Firms consolidate their balance sheets primarily by raising their net lendingborrowing (NLB) ie the cash obtained from their production activity and available for financial operations (53) A rise in NLB is achieved either by increasing savings or cuttingpostponing physical investment Firms increase savings by raising profits and reducing the dividends distributed to shareholders In firmsrsquo financial accounts a rise in corporate NLB is associated with a rise in financial assets andor a cut in financial liabilities The section reviews recent developments in euro area and US profitability savings and NLB and looks at the instruments that the corporate sector has used to consolidate its balance sheet on both the asset and the liability side
Corporate profits have disappointed in the euro area hellip
National account data show that corporate profitability in the euro area reached a pre-crisis peak in 2007Q3 ie later than in the United States where it had already started to decline in 2007 (54)
Graph II41 NFC profitability euro area and US
(2000Q1-2013Q3 of GVA)
20
25
30
35
40
45
00Q1 01Q3 03Q1 04Q3 06Q1 07Q3 09Q1 10Q3 12Q1 13Q3
Euro area (1)
US
(1)Excluding Latvia Source Eurostat US Bureau of Economic Analysis DG ECFIN calculations
(53) Firms can also consolidate their balance sheets by raising equity (54) Profitability like the other national account variables for the
corporate sector presented in this section is measured as a proportion of corporate sector activity represented by gross value added (GVA) It is calculated as the gross operating surplus plus financial revenues and subsidies and minus financial and tax expenses Financial expenses do not include earnings distributed to shareholders
II Special topics on the euro area economy
Volume 13 No 1 | 41
The 2008-09 recession brought a sharp drop in corporate profitability in the euro area Profitability recovered briefly in 2010 to reach a new peak in 2011 but has declined again since then (Graph II41) In the United States the impact of the crisis was rather muted with profits recovering vigorously after 2008 As a ratio to gross value added (GVA) US corporate profits had already passed their pre-crisis level in 2009 before flattening out in the past two years Overall by 2013 profitability in the euro area was still about 2 pp below its pre-crisis peak while in the United States it stood around 3 pp above
hellip mostly due to weak operating surplus
The disappointing profit performance in the euro area relative to the United States is largely due to differing developments in gross operating surplus Looking at the breakdown of the contribution to the cumulative change in corporate profitability since the start of the crisis there is a marked difference between firms in the euro area and those in the United States (Graphs II42 and II43) (55)
Graph II42 Profitability breakdown of NFCs euro area (1)
(cumulative change in from 2007Q3 peak to 2013Q3)
35
36
37
38
39
40
41
42
-100
-80
-60
-40
-20
0
20
40
60
80
100
07Q4 08Q4 09Q4 10Q4 11Q4 12Q4
Taxes (lhs)
Other net current transfers received (lhs)
Net property income received excl dividends paid (lhs)
Operating surplus (lhs)
Profits(rhs)(2)
(1)Excluding Latvia(2)Profits in of GVA Source Eurostat DG ECFIN calculations
In the euro area a fall in the ratio of operating surplus to GVA dragged overall profitability down after 2008 Despite an improvement in 2011 in
(55) The illustration of the contributions to the cumulative change in profitability only serves to depict the relative importance of the various components of the change in profits since the crisis The starting point for the cumulative change should not be interpreted as a reference point for a desirable profit recovery
2013 operating surplus was still contributing negatively to the cumulative change in profitability since the pre-crisis peak In contrast operating surplus in the United States responded to the crisis earlier than in the euro area but its contribution to the change in profits remained positive
Graph II43 Profitability breakdown of NFCs US
(cumulative change in from 2005Q3 peak to 2013Q3)
24
25
26
27
28
29
30
31
-100
-80
-60
-40
-20
0
20
40
60
80
100
05Q4 06Q4 07Q4 08Q4 09Q4 10Q4 11Q4 12Q4
Taxes (lhs)Other net current transfers received (lhs)Net property income received excl dividends paid (lhs)Operating surplus (lhs)Profits(rhs)(2)
(1) Profits in of GVA Source Federal Reserve Board US Bureau of Economic Analysis DG ECFIN calculations
Unlike operating surplus income tax payments and net income from non-operational activities did not differ significantly between the euro area and the United States (56) In both economies lower corporate tax payments resulting from lower profits generated by NFCs naturally had a positive impact on the cumulative change in profits from the pre-crisis peak
Differences in labour market developments are at the root of differences in profitability
Differences in operating surplus and profitability between the United States and the euro area can be attributed partly to differences in the business cycle In 2011Q1 NFCsrsquo gross value added was still 12 below its pre-crisis peak in the euro area but 11 above in the United States The main channel through which cyclical developments can affect operating surplus is the labour market
(56) In fact the ratio of profit tax payments to profits (a crude measure of an aggregate tax rate) in the euro area and the United States has been almost the same since the start of the crisis falling substantially in 2008-09 indicating that tax policy was not more favourable for profits in one economy than in the other
42 | Quarterly Report on the Euro Area
The cyclicality of operating surplus depends on the impact of the cycle on labour productivity as well as on wages The worse performance of operating surplus in the euro area since 2008 as compared with that in the United States reflects a stronger deterioration in labour productivity accompanied by unfavourable developments in wages per employee
Labour productivity growth in the euro area turned sharply negative in 2009 opening a big gap with the positive (albeit modest) wage growth (Graph II44) In the United States on the other hand labour productivity growth became negative earlier but to a lesser extent and some downward wage adjustment took place in 2009
Graph II44 Labour productivity and wages euro area and US
(2001Q4-2013Q3 y-o-y change)
-4
-3
-2
-1
0
1
2
3
4
5
01Q4 03Q2 04Q4 06Q2 07Q4 09Q2 10Q4 12Q2
Average wage per employee euro area (1) (2)Average wage per employee US (1)Labour productivity euro area (2) (3)Labour productivity US (3)
(1)Real wages calculated by the GDP deflator(2)Euro area excluding Latvia(3)In terms of total employment (thousands) Source Eurostat US Bureau of Economic Analysis US Bureau of Labour Statistics DG ECFIN calculations
There are a number of reasons for the different labour adjustments in the euro area and the United States In the former apart from a higher level of employment protection short-term work schemes were put in place in the early stages of the crisis (57) In addition as labour force adjustment tends to be more costly in the euro area some firms (particularly small firms and those with highly qualified employees) preferred to retain their
(57) According to the OECD Public short-term work schemes have
played an important role in preserving jobs during the crisis in a number of countries although significant hours reductions were also achieved via lower overtime hours hours averaging arrangements and employer initiatives see OECD Employment Outlook 2010 ndash Moving Beyond the Job Crisis
labour force (58) Because of a lack of wage flexibility the higher degree of lsquolabour hoardingrsquo in the euro area came at the expense of lower operating surplus and profits and consequently put a downward pressure on the capacity accumulate internal funds to deleverage
Corporate savings are much lower in the euro area
Negative developments in euro area corporate profitability were reflected in corporate savings which together with physical investment determines the internal funds available for balance sheet adjustment In 2009-10 there was a sharp drop in euro area savings because profits acted as shock absorbers and fell more rapidly than dividend payments leaving less spare cash available In contrast savings by US NFCs increased substantially on rising profits after an early-crisis low point and reached a historically high level of around 23 of GVA in 2010Q3 (Graph II45)
Graph II45 Savings of NFCs (2000Q1- 2013Q3 of GVA)
15
16
17
18
19
20
21
22
23
24
00Q1 01Q3 03Q1 04Q3 06Q1 07Q3 09Q1 10Q3 12Q1 13Q3
Euro area (1)
US
(1)Euro area excluding Latvia Source Eurostat Bureau of Economic Analysis DG ECFIN calculations
The impression that US corporate behaviour has been more geared towards accumulating savings than that in the euro area is reinforced when one looks at dividend distribution Dividends paid by euro area NFCs have been on a declining trend since the start of the crisis but those paid by US firms have also decreased This is remarkable given (58) See Box 12 Labour hoarding across different types of firms in
OECD Employment Outlook 2010 ndash Moving Beyond the Job Crisis
II Special topics on the euro area economy
Volume 13 No 1 | 43
the positive profit developments in the United States (Graph II46) A drop in dividends alongside profit growth suggests that after 2008 US companies preferred to direct a bigger proportion of the profit recovery to corporate savings and thereby balance sheet adjustment The ratio of dividends to profits in the United States has fallen from about one third before the crisis to one quarter now This ratio also dropped in the euro area although by less (59)
Graph II46 Dividends paid of NFCs (2000Q1-2013Q3 of GVA)
0
5
10
15
20
25
00Q1 01Q3 03Q1 04Q3 06Q1 07Q3 09Q1 10Q3 12Q1 13Q3
Euro area (1)
US
(1)Euro area excluding Latvia Source Eurostat Federal Reserve Board DG ECFIN calculations
Disappointing physical investment in the euro area and the United States
Cutting investment in physical assets is another way of reducing excessive indebtedness Corporate investment as a proportion of activity dropped sharply both in the euro area and in the United States in the early stages of the crisis (Graph II47)
After a modest recovery in 2010-11 the investment rate decreased again in the euro area The investment recovery was more solid in the United States but has lost momentum since the end of 2012 and the investment rate remains below its pre-crisis peak Overall it seems that euro area corporations partly compensated for less supportive savings developments than in the US by
(59) Dividend payments are not the only way of distributing profits to shareholders Equity buybacks can also be used for this purpose and firms that choose this option will tend to have higher savings and lower dividends paid
curbing physical investment more than their US counterparts
Graph II47 Investment of NFCs (2000Q1- 2013Q3 of GVA)
15
16
17
18
19
20
21
22
23
24
00Q1 01Q3 03Q1 04Q3 06Q1 07Q3 09Q1 10Q3 12Q1 13Q3
Euro area (1)
US
(1)Excluding Latvia Source Eurostat US Bureau of Economic Analysis DG ECFIN calculations
A more modest increase in net lending in the euro area than in the US
Since 2013 firmsrsquo net lending in the euro area has been in positive territory but substantially less so than that in the United States (Graph II48) Positive NLB in the euro area unlike that in the United States is mostly due to a low investment rate alone rather than low investment combined with high savings The combination of disappointing investment and high savings has translated into historically high and sustained NLB for US firms
This persistent net lending position in the United States is atypical as firms usually invest more than they save It suggests that US firms have been adjusting their balance sheets significantly since the beginning of the crisis via their internal funds while euro area firms seem to have opted for much slower balance sheet adjustment
44 | Quarterly Report on the Euro Area
Graph II48 Net lendingborrowing of NFCs
(2000Q1- 2013Q3 of GVA)
-10
-8
-6
-4
-2
0
2
4
6
8
00Q1 01Q3 03Q1 04Q3 06Q1 07Q3 09Q1 10Q3 12Q1 13Q3
Euro area (1)
US
(1)Excluding Latvia Source Eurostat US Bureau of Economic Analysis DG ECFIN calculations
Debt deleveraging has been more pronounced in the US than in the euro area
The faster pace of adjustment of balance sheets in the United States is confirmed by the corporate debt data (Graph II49) (60) (61) While both the euro area and the United States entered the crisis with swiftly rising and historically high levels of debt deleveraging has progressed more rapidly in the latter since the crisis By the beginning of 2012 US corporate debt had fallen by approximately 15 pp as a proportion of activity while euro area debt had dropped by 7 pp (62)
(60) Non-financial corporate debt consists of loans and securities
other than shares (corporate bonds) both can be classified as short- or long-term depending on whether their original maturity is less or more than one year
(61) This section analyses developments in non-consolidated financial flows and stocks in the euro area and in the United States for two reasons it is important to have a sense of financial positions within the institutional sector eg loans between NFCs are an important part of intra-firm relationships as head offices use them to finance subsidiaries for example perhaps for tax reasons This is relatively more important in the euro area than in the United States Consolidated financial asset and flow data eliminate these intra-sector positions and different approaches may be taken to consolidation as in the euro area there is the additional issue of cross-border consolidation between Member States while there is no need for flows and positions between firms in different US states to be treated separately
(62) The debt-to-equity ratio is another measure of corporate leverage widely followed by investors Faster stock market recovery helped US firms reduce this ratio more than those in the euro area
Graph II49 Debt levels of NFCs(1) (1999Q1-2013Q3 of GVA)
100
120
140
160
180
200
220
99Q1 00Q3 02Q1 03Q3 05Q1 06Q3 08Q1 09Q3 11Q1 12Q3
Euro area (2)
US
(1)Securities other than shares and loans(2)Excluding Latvia Source Eurostat US Bureau of Economic Analysis DG ECFIN calculations
Firms in the euro area and the United States entered the crisis with almost the same level of short-term debt as a proportion of total debt Since the crisis the adjustment away from short-term debt has been significantly more pronounced in the United States suggesting more active balance sheet restructuring
Graph II410 Debt flows of NFCs(1) (1999Q1- 2013Q3 of GVA)
-15
-10
-5
0
5
10
15
20
99Q1 01Q1 03Q1 05Q1 07Q1 09Q1 11Q1 13Q1
Euro area bonds (2)
US bonds
Euro area loans (2)
US loans
(1)Securities other than shares and loans (2)Excluding Latvia Source Eurostat US Bureau of Economic Analysis DG ECFIN calculations
Due to differences in the structure of corporate finance loans (as opposed to bonds) tend to form a bigger proportion of debt in the euro area than in the United States An important element of the
II Special topics on the euro area economy
Volume 13 No 1 | 45
corporate balance sheet adjustment process in both economies has been a movement away from an excessive reliance on loans (Graph II410) and towards bond financing This trend has been substantially more pronounced in the United States presumably reflecting the fact that bond markets are more developed in that country
Developments in non-financial corporate debt were also influenced by developments in financial intermediation in particular in the banking sector Financial accounts show NFCsrsquo debt exposure but do not indicate whether the debt holder is a bank According to bank balance sheet statistics the nominal growth of loans vis-agrave-vis NFCs has been mostly negative in the euro area since 2009Q4 (Graph II411) Coupled with the positive loan inflows seen in the national accounts between 2010Q3 and 2012Q3 (Graph II410) this shows a degree of substitution in corporate loan liability ownership between banks and other financial firms and sectors (including other NFCs) in this period According to the counterparty breakdown of NFC domestic loans published by the ECB corporate borrowings from other NFCs represented 29 of all loans by 2013Q3 (up from 26 in 2008Q1) while the proportion of borrowings from monetary financial institutions (MFIs) had dropped (from 60 in 2008Q1) to an all-time low of 53 The proportion of loans from other non-bank financial intermediaries also increased There is less evidence of a shift from banks to other loan providers in the United States where loans between NFCs are much more limited
Graph II411 Bank loans to NFCs (1999Q1- 2013Q3 y-o-y change)
-20
-15
-10
-5
0
5
10
15
20
25
99Q1 00Q3 02Q1 03Q3 05Q1 06Q3 08Q1 09Q3 11Q1 12Q3
Euro area bank loans to NFCs (1)US bank loans to NFCs
(1)Excluding Latvia Source ECB US Federal Reserve Board DG ECFIN calculations
Positive NLB has been used to acquire safe financial assets in both regions
In both the euro area and the United States the positive NLB has been used to deleverage but also to invest in safe financial assets At the beginning of the crisis much of the positive corporate NLB in the United States was invested in money market mutual funds which is essentially investment in short-term low-risk assets (Graph II412) (63)
Currency and deposits (another type of safe asset) have increased substantially in the euro area in recent years as a proportion of total firm activity (Graph II413) This rise was driven almost exclusively by a rapid increase in firmsrsquo savings deposits To some extent a similar trend is observable in the United States In particular US cash balances (a sub-component of currency and deposits) approached 12 of GVA by the end of 2013 a level not seen since the early 1990s On the other hand savings deposits have grown more modestly resulting in a moderately positive overall trend in currency and deposits
Graph II412 Mutual fund shares of NFCs (1999Q1- 2013Q3 of GVA)
0
2
4
6
8
10
12
14
99Q1 01Q1 03Q1 05Q1 07Q1 09Q1 11Q1 13Q1
Euro area (1)
US (2)
(1)Excluding Latvia(2)In the USA these asset series can be broken down into investment in money market mutual funds and investment in other mutual funds The 2009-11 increase is fully attributable to the former Source Eurostat US Bureau of Economic Analysis DG ECFIN calculations
Overall these two aspects of corporate financial investment behaviour signify considerable liquidity concerns on the part of firms in both the euro area
(63) Euro area financial accounts only show firmsrsquo investment in mutual funds overall and do not distinguish between types of mutual funds
46 | Quarterly Report on the Euro Area
and the United States They also represent a drive towards lower-risk assets perhaps indicating increased risk aversion by corporations or a tendency to postpone physical investment in a context of perceived high uncertainty
Graph II413 Currency and deposits ndash NFCs
(1999Q1- 2013Q3 of GVA)
0
5
10
15
20
25
30
35
40
45
99Q1 00Q3 02Q1 03Q3 05Q1 06Q3 08Q1 09Q3 11Q1 12Q3
Euro area (1)
US
(1)Excluding Latvia Source Eurostat US Bureau of Economic Analysis DG ECFIN calculations
Conclusion
Although both regions saw similar steep rises in corporate debt in the pre-crisis years balance sheet adjustment since the crisis has been significantly slower in the euro area than in the United States The more rapid adjustment in the United States can be explained by a stronger cyclical recovery more supportive profitability developments and reduced dividend payment ratios In the euro area profitability has been hindered by a combination of lower flexibility in the labour markets and slow wage adjustment
The slower balance sheet adjustment in the euro area corporate sector is visible in a slower fall in indebtedness but also a slower adjustment of the structure of balance sheets In particular the shift from loans to bonds and the extension of debt maturity have been more pronounced in the United States In both regions firms have used their positive NLB to accelerate the accumulation of safe and liquid financial assets This could reflect continuing uncertainty regarding future demand and growth prospects
Overall the evidence discussed in this section shows that euro area firms are lagging significantly behind their US counterparts in terms of balance sheet consolidation Given that investment rates remain disappointing even in the more advanced US corporate sector a degree of caution appears warranted when assessing short-term prospects for corporate investment in the euro area
III Recent DG ECFIN publications
Volume 13 No 1 | 47
1 Occasional Papers
European Economy Occasional Papers 170 January 2014 Financial Assistance Programme for the Recapitalisation of Financial Institutions in Spain Fifth Review ndash Winter 2014 httpeceuropaeueconomy_financepublicationsoccasional_paper2014pdfocp170_enpdf
European Economy Occasional Papers 169 December 2013 The Economic Adjustment Programme for Cyprus Second Review ndash Autumn 2013 httpeceuropaeueconomy_financepublicationsoccasional_paper2013pdfocp169_enpdf
European Economy Occasional Papers 168 December 2013 Fiscal frameworks in the European Union ommission services country factsheets for the Autumn 2013 Peer Review httpeceuropaeueconomy_financepublicationsoccasional_paper2013pdfocp168_enpdf
European Economy Occasional Papers 167 December 2013 Economic Adjustment Programme for Ireland - Autumn 2013 Review httpeceuropaeueconomy_financepublicationsoccasional_paper2013pdfocp167_enpdf
European Economy Occasional Papers 166 December 2013 Progress towards meeting the economic criteria for EU accession the EU Commissionrsquos 2013 assessments httpeceuropaeueconomy_financepublicationsoccasional_paper2013pdfocp166_enpdf
European Economy Occasional Papers 165 November 2013 Romania Balance-of-Payments Assistance Programme 2013-2015 httpeceuropaeueconomy_financepublicationsoccasional_paper2013pdfocp165_enpdf
European Economy Occasional Papers 164 November 2013 The Economic Adjustment Programme for Portugal Eighth and Ninth Review httpeceuropaeueconomy_financepublicationsoccasional_paper2013pdfocp164_enpdf
European Economy Occasional Papers 163 November 2013 Financial Assistance Programme for the Recapitalisation of Financial Institutions in Spain Fourth Review ndash Autumn 2013 httpeceuropaeueconomy_financepublicationsoccasional_paper2013pdfocp163_enpdf
European Economy Occasional Papers 162 October 2013 Economic Adjustment Programme for Ireland Summer 2013 Review httpeceuropaeueconomy_financepublicationsoccasional_paper2013pdfocp162_enpdf
2 Economic papers
European Economy Economic Papers 514 February 2014 Martin Larch Kristin Magnusson Bernard Balint Tatar Hard work and More How to successfully conduct adjustment with official assistance httpeceuropaeueconomy_financepublicationseconomic_paper2014pdfecp514_enpdf
European Economy Economic Papers 513 February 2014 Florian Woumlhlbier Caterina Astarita Gilles Mourre Consolidation on the revenue side and growth-friendly tax structures an indicator based approach httpeceuropaeueconomy_financepublicationseconomic_paper2014pdfecp513_enpdf
48 | Quarterly Report on the Euro Area
European Economy Economic Papers 512 December 2013 Alexander Schwan Etienne Sail Assessing the economic and budgetary impact of linking retirement ages and pension benefits to increases in longevity httpeceuropaeueconomy_financepublicationseconomic_paper2013pdfecp512_enpdf 3 Other publications
Winter forecast 2014 - EU economy recovery gaining ground httpeceuropaeueconomy_financepublicationseuropean_economy2014pdfee2_enpdf 4 Regular publications
Business and Consumer Surveys (harmonised surveys for different sectors of the economies in the European Union (EU) and the applicant countries) httpeceuropaeueconomy_financedb_indicatorssurveysindex_enhtm Business Climate Indicator for the euro area (monthly indicator designed to deliver a clear and early assessment of the cyclical situation) httpeceuropaeueconomy_financedb_indicatorssurveysdocuments2013bci_2013_11_enpdf Key indicators for the euro area (presents the most relevant economic statistics concerning the euro area) httpeceuropaeueconomy_financedb_indicatorskey_indicatorsindex_enhtm Monthly and quarterly notes on the euro-denominated bond markets (looks at the volumes of debt issued the maturity structures and the conditions in the market) httpeceuropaeueconomy_financepublicationsbond_marketindex_enhtm Price and Cost Competitiveness httpeceuropaeueconomy_financedb_indicatorscompetitivenessindex_enhtm
50 | Quarterly Report on the Euro Area
Editor-in-Chief Elena Flores
Overall coordination Eric Ruscher
Data assistance Christos Zavos
Comments on the report would be gratefully received and should be sent to
Elena Flores Director ndash Policy Strategy and Coordination Directorate-General for Economic and Financial Affairs Office CHAR 1566
B-1049 Brussels
Email elenafloreseceuropaeu
or
Eric Ruscher Head of Unit ndash Macroeconomy of the euro area Directorate-General for Economic and Financial Affairs Office CHAR 15248
B-1049 Brussels
Email ericruschereceuropaeu
HOW TO OBTAIN EU PUBLICATIONS Free publications bull one copy
via EU Bookshop (httpbookshopeuropaeu) bull more than one copy or postersmaps
from the European Unionrsquos representations (httpeceuropaeurepresent_enhtm) from the delegations in non-EU countries (httpeeaseuropaeudelegationsindex_enhtm) by contacting the Europe Direct service (httpeuropaeueuropedirectindex_enhtm) or calling 00 800 6 7 8 9 10 11 (freephone number from anywhere in the EU) () () The information given is free as are most calls (though some operators phone boxes or hotels may charge you)
Priced publications bull via EU Bookshop (httpbookshopeuropaeu) Priced subscriptions bull via one of the sales agents of the Publications Office of the European Union
(httppublicationseuropaeuothersagentsindex_enhtm)
KC-AK-14-001-en-n
- Blank Page
- Blank Page
- Blank Page
- Blank Page
-

II Special topics on the euro area economy
Volume 13 No 1 | 27
II2 The relationship between government and export sector wages and implications for competitiveness (26)
In 2012 the general government sector employed on average about 15 of the labour force in the euro area Since most countries in the euro area are now trying to consolidate public finances whilst also trying to boost competitiveness for external rebalancing and to reduce unemployment it is crucial to assess whether there is any wage spillover from the public to the export sector in particular under conditions of fiscal stress This section shows that there has been a link between government and manufacturing wages over the long-run which is much closer when the government employs a large share of the labour force Government size dimension is especially important during fiscal consolidation If the government wage bill is inflated due to unjustified wage premia for example limiting government wage growth is a fiscal strategy that may among other effects deliver competitiveness gains that contribute to external rebalancing and help boost employment in the tradable sector
-----------------------
Introduction
General government employment accounts for a considerable share of the labour force in the euro area It stood at about 15 in 2012 with but some cross-country variation The evolution of government wages is likely to have an impact not only on fiscal variables and on the sustainability of public finances but also on the labour market on cost competitiveness and on external rebalancing within the euro area This section looks at the relationship between public and private sector wages at a time when most euro area countries are trying to consolidate their public finances improve competitiveness to support external rebalancing whilst also having to tackle high unemployment levels (27)
Changes in general government compensations may spill over into the private sector through both
(26) Section prepared by Benedicta Marzinotto and Alessandro Turrini
(27) Throughout the section the public sector is referred to alongside general government which refers to public offices at all levels of government non-market public owned hospitals schools and social security organizations Thus the term public is used as a synonym for general government
market-based and institutional channels For example excessive government wages may crowd out private sector employment inflating cost conditions and leading to competitiveness losses (28) There are channels of transmission also in the opposite direction from the private to the government sector Wage growth linked to productivity improvements in the private sector can spill over into the public if there is labour mobility across sectors This can affect governments capacity to keep wage expenditure growth under control
Against this background this section analyses the relationship between general government and manufacturing wages in order to assess the potential for and conditions of a wage spillover from the insulated government sector to the export sector The relationship is analysed by looking at a sample of EU countries over the period 1980-2013 in a co-integration framework that makes it possible to distinguish between long-run and short-run effects The relationship between the two wages is also assessed for different fiscal scenarios differentiating between normal periods and periods of fiscal adjustment
The various forms the relationship takes
The relationship between public and private wages takes many forms It may be influenced by market forces andor by institutional features of the wage setting system in each country Changes in private wages can affect government wage growth in the following ways
bull Wage bargaining in the private sector has ademonstration effect on public wage-settersPerez and Sanchez (2011) find evidence ofsignalling by the private sector in thenegotiation phase in France and Germanybefore the EMU period (29) Signalling may bemotivated by envy effects that reflect thestrength of the wage-bargaining position (30) or
(28) See for example Alesina A and R Perotti (1997) The welfare state and competitiveness American Economic Review Vol 87 pp 921-939 Alesina A Ardagna S Perotti R and Schiantarelli F (2002) Fiscal policy profits and investment American Economic Review Vol 92(3) pp 571-589 Ardagna S (2004) Fiscal stabilizations when do they work and why European Economic Review Vol 48 pp 1047-1074
(29) Perez JJ and AJ Sanchez (2011) Is there a signalling role for public wages Evidence of the euro area based on macro data Empirical Economics Vol 41(2) pp 421-445
(30) Maffezzoli M (2001) Non-Walrasian labor markets and real business cycles Review of Economic Dynamics Vol 4(4) pp 860-
28 | Quarterly Report on the Euro Area
by the fact that the same trade union negotiates wages for both sectors
bull Wage-bargaining practices may explicitly or implicitly grant wage leadership to the private sector Under the Scandinavian wage-setting model the private export sector typically takes the lead dictating bargaining outcomes to other sectors including the public sector (31)
bull There may also be established practices and institutional mechanisms that make public wages responsive to private wage settlements usually those of the export sector This is the case if for example there is a formal rule under which the growth rate of private wages is automatically applied to public sector wages (32)
It is of course a two-way street Changes in government wages affect private wage growth in a number of ways
bull Wage adjustment in the public sector causes cross-sector labour shifts and a change in the private sectors labour supply As the supply of labour changes so does the competitive private sectors equilibrium wage
bull Adjustments to government wages affect the outside option of unionised private sector bargainers putting pressures on the bargaining process (33) with for example private sector workers tempted to move to the general government sector due to large public wage increases
892 Ardagna S (2007) Fiscal policy in unionized labor markets Journal of Economic Dynamics and Control Vol 31(5) pp 1498-1534
(31) For a review see Lindquist J and R Vilhemsson (2006) Is the Swedish central government a wage leader Applied Economics Vol 38 pp 1617-1625 Friberg K (2007) Intersectoral wage linkages the case of Sweden Empirical Economics Vol 32 pp 161-184 Traxler F and B Brandl (2012) Collective bargaining inter-sectoral heterogeneity and competitiveness a cross-national comparison of macroeconomic performance British Journal of Industrial Relations Vol 50(1) pp 73-98 Ramskloger P (2012) Is there a European wage leader Wage spillovers in the European Monetary Union Cambridge Journal of Economics Vol 36(4) pp 941-962 and (2013) The nationalndashtransnational wage-setting nexus in Europe What have we learned from the early years of monetary integration Journal of Common Market Studies Vol 51(5) pp 916-930
(32) For evidence on the Netherlands see Hartog J and H Oosterbeek (1993) Public and private sector wages in the Netherlands European Economic Review Vol 37(1) pp 97-114
(33) Afonso A and P Gomes (2008) Interactions between private and public sector wages ECB Working Paper No 971
bull Changes in public wages may be fully compensated in government budgets by changes in labour taxation that alter labour costs in the private sector (34) and might also affect union behaviour (35)
Co-movements between government and private wages may also take place in the absence of direct links when driven by factors common to both sectors For example public wages may be pro-cyclical and change in a manner similar to private wages over the cycle (36) Co-movements in aggregate wage series could be linked to developments common to both factors relating to the composition of the labour force
Testing the relationship between government and manufacturing wages
To analyse more systematically the long- and short-term effects of government wages on the export sector a cointegration approach is used linking manufacturing compensations to a number of determinants including compensation in the government sector The long-term relationship is analysed in terms of levels while the Error Correction Mechanism (ECM) equation makes it possible to estimate the short-term relation between export sector wage growth shocks in explanatory variables and their deviation from the long-term relationship The long-term relationship in also analysed in terms of levels using a dynamic ordinary least squares (DOLS) model and the results incorporated in an ECM model
Estimates were made on a sample of 17 EU countries for which data are available over the period 1980-2013 This has not only has the advantage of gaining degrees of freedom and reinforcing the results It also makes it possible to
(34) Holmlund B (1993) Wage setting in private and public sectors
in a model with endogenous government behaviour European Journal of Political Economy Vol 9(2) pp 149-162
(35) The spillover from the public to the private sector is likely to be mediated by the structure of wage-setting systems Alesina and Perotti (1997) find that increases in labour taxation do not necessarily lead to higher wage demands by unions in highly centralised bargaining systems as large wage setters would internalise the consequences from higher labour costs on employment
(36) For instance Lane (2003) and Lamo et al (2007) find that public wages are pro-cyclical because of discretionary fiscal expansion in good times Lane P (2003) The cyclical behaviour of fiscal policy evidence from the OECD in Journal of Public Economics Vol 87 pp 2661-2675 Lamo A Perez JJ Schuknecht L (2007) The cyclicality of consumption wages and employment of the public sector in the euro area ECB Working Paper No 757
II Special topics on the euro area economy
Volume 13 No 1 | 29
investigate the role of framework conditions in bringing the impact of general government to bear on manufacturing wages by means of appropriate sample splits Box II21 shows the estimation methodology and the results
Much of the variance in manufacturing wages is explained by variables usually used when estimating wage equations (ie the price level labour productivity and the unemployment rate) and by general government wage levels Both the long- and short-term elasticity of manufacturing wages with respect to government wages is estimated to be around 03-04 This tallies with the results of similar studies (eg Afonso and Gomes 2008) It works both ways general government wages also react to manufacturing wages They have a long-term elasticity of 08 and a short-term elasticity of 04 (37) This is consistent with the fact that it is more usual for the private sector than for the government to take the lead in terms of wages as the available literature also shows (38) The DOLS cointegration estimation delivers qualitatively identical results The results are still valid when the sample is restricted to just the euro area (39) The relationship tested on real wages is symmetrical because manufacturing wages respond to government wages whether they are increased or reduced
One hypothesis tested here is whether the size of the government sector determines the extent to which changes to government wages affect average conditions on the private market if for example there is cross-sector mobility In order to test how this market-based channel works the same EU sample is split into two groups of countries those in which the average share of government to total employment is above the whole EU samplersquos median and countries in which it is below the median Results show that in the long-run the impact of public on manufacturing wages is considerably higher in the case of large public sectors This divide disappears in the short-run In the opposite direction going from manufacturing to public wages the split does not produce differentiated results This confirms that government size matters when it comes to the public sectors long-term impact on the labour
(37) The results are not shown (38) Perez JJ and AJ Sanchez (2011) (39) Still it should be noted that the sample used excludes some key
countries in the euro area
market The DOLS methodology confirms these results (40)
Another hypothesis that is tested is whether the way wages are set in the public sector increases the chances of manufacturing wages reacting to government wages Broadly speaking two wage-setting systems may be identified
bull This first is that wages are mainly set on thebasis of collective bargaining
bull The second is that wages are set on the basis ofunilateral decision by the government (41)
The results show that the way wages are set does not fundamentally alter the relation between government and manufacturing wages in the long- or the short-term It is however interesting to note that across all methodologies used the relationship between manufacturing wages and labour productivity is weaker in countries characterised by a unilateral decision wage-setting system This is probably because in such a case the spillover from public to private wages is such that private wages tend to be misaligned with sectoral productivity This is not the case when government wages are set through a collective bargaining wage-setting system possibly because bargaining processes even in a particular type of insulated sector such as the public one reflect market forces more than a unilateral government decision
The relationship between government and manufacturing wages under fiscal stress
Most countries in the euro area have recently been trying to cut government wage bills by freezing wages cutting or retrenching specific indemnities or benefits (including bonuses andor holidays) or blocking turnover As a result the share of government compensations in total government spending has fallen Between 2008 and 2012 this fall was particularly sharp for Latvia Portugal and Romania followed by Hungary Spain Denmark and Estonia (Graph II21)
(40) The results from the DOLS are not shown (41) For a classification of EU wage-setting systems in the government
sector see European Commission Directorate for Economic and Financial Affairs (2014) Government wages and labour market outcomes Occasional Paper forthcoming
30 | Quarterly Report on the Euro Area
(Continued on the next page)
II Special topics on the euro area economy
Volume 13 No 1 | 31
Box (continued)
(Continued on the next page)
32 | Quarterly Report on the Euro Area
Box (continued)
II Special topics on the euro area economy
Volume 13 No 1 | 33
The recent crisis marked a watershed in the evolution of public compensations Between 1999 and 2007 relative government wage growth did not vary from cold-shower periods (or periods of more gradual fiscal consolidation) to periods of non-consolidation (42)
Graph II21 Change in the share of general government compensations to
total spending (2008-2012 in pp)
Source DG ECFIN calculations based on AMECO
Conversely starting with the 2008-2009 crisis compensations per employee in the government sector grew more slowly compared with those in the manufacturing sector and more clearly so during fiscal consolidation (Graph II22)
It is possible that under conditions of fiscal stress the relationship between government and export sector wages differs from that of normal periods This aspect has been neglected in previous analyses To shed some light on it Table II21 shows the correlation between government wage growth and manufacturing wage growth under alternative fiscal conditions (consolidation and non-consolidation) differentiating between countries with large and small public sectors The evidence shows that the two wages are closely related in periods of fiscal stress only if the government employs a large share of the labour forces This suggests that the possibility of
(42) By convention episodes of fiscal consolidation are defined as those during which the structural primary balance improves by at least 15 per cent of GDP in one year or at least 3 per cent in three years with a minimum improvement of 05 per cent in each year Such a definition makes it possible to distinguish between cases of cold-shower consolidation episodes and more gradual consolidation episodes
expenditure-based fiscal consolidation having the type of supply-side effects described in Alesina and Perotti (1997) Alesina et al (2002) and Ardagna (2004) may be a consequence of the size of the public sector among other things
Graph II22 Government and manufacturing compensations under
alternative fiscal conditions EU countries (1999-2007 and 2008-2012 avg annual change)
Source DG ECFIN calculations based on OECD
Table II21 Correlation between government and manufacturing
compensations growth under alternative fiscal conditions EU (1)
(1) Pearson correlation coefficients Sample EU countries (excluding AT BG CY DE EL LT LV MT RO SI) over 1980-2012 (1995-2012 in the case of CZ EE HU SK) Source DG ECFIN calculations based on OECD
Concluding remarks
Spillovers which are the result of high wages in the general government sector have been mentioned as one of the drivers of competitiveness losses in
34 | Quarterly Report on the Euro Area
some countries in the euro area before the crisis (43)
The results presented here speak to this debate and may be summarised as follows Government wage levels have a long-term impact on wages in the manufacturing sector even more so in countries in which the government sector employs a relatively large share of the labour force That said their short-term impact remains unaffected by the size of the public sector Looking at it the other way round manufacturing wages usually have a greater impact on government wages regardless of size This is arguably because private sector wage leadership is more common than public sector wage leadership
(43) Blanchard O (2007) Adjustment within the euro The difficult
case of Portugal in Portuguese Economic Journal 61 1-21
The way government wages are set also plays a role In collective bargaining systems not only are government and manufacturing wages related in both the long- and the short-term (as they are also when the government sets wages by unilateral decision) Also most importantly wages in the tradable sector are better aligned with labour productivity The evidence provided here indicates that if the government wage bill is inflated for example due to unjustified wage premia limiting public wage growth would spill over into the private export sector reducing labour costs and helping boost competitiveness and employment in the sector Whilst structural reforms including skill upgrading in manufacturing are an important and necessary ingredient for achieving non-reversible gains in competitiveness the adjustment of competitiveness through fiscal policy remains a complementary tool to deliver sustained external rebalancing
II Special topics on the euro area economy
Volume 13 No 1 | 35
II3 Latvia maintaining sustainable growth after the boom-bust years (44)
Latvia had been keen to join the euro area at the earliest opportunity with entry in January 2008 the clear target As the economy overheated however significant macro-economic imbalances accumulated which deferred these plans Between 2005 and 2007 unsustainable GDP growth went hand in hand with a mounting current account deficit and a housing market spiralling out of control When credit flows then abruptly reversed the countryrsquos GDP contracted dramatically Latvia was placed in the EUIMF-led financial assistance programme and was forced to carry out ambitious fiscal consolidation and structural reforms Reallocating resources to the tradable sector was the first important step on the road to an export-driven recovery Under the burden of deleveraging and consolidation the revival of domestic demand was slow at first From 2011 however supported by favourable labour market developments growth in demand has accelerated Latvia has reclaimed its position as the fastest-growing EU economy however the current level of growth is lower than the unstainable rates recorded in the boom years and it is now seen as sustainable Thanks to this balanced growth Latvia has not been subject to the MIP since its launch in 2012 Despite the financial assistance-supported measures to preserve equity the social burden of economic adjustment as evidenced by poverty social exclusion and emigration rates has been high but measures are being taken by the authorities to counter these effects Continued commitment to prudent fiscal policies will be critical for the countryrsquos economic future The use of macro-prudential tools to reduce the risks posed by large non-resident financial flows and the implementation of ambitious structural reforms will also play an important role
-----------------------
Introduction
To welcome Latvias recent adoption of the euro this section reviews the countrys recent boom-bust experience and discusses the challenges ahead
Five years ago it would have been difficult to imagine that Latvia would be able to fulfil the conditions for adopting the euro and enter the euro
(44) Section prepared by Gatis Eglitis and Christian Weise
area in January 2014 After EU accession in May 2004 significant macro-economic imbalances had started to accumulate on the back of an overheating economy and by autumn 2008 the country was on the brink of bankruptcy A painful and seemingly impossible economic adjustment to be achieved by means of internal devaluation lay ahead This would require unprecedented fiscal consolidation huge redundancies and difficult structural reforms threatening political and social stability Yet despite pronounced scepticism from the outset and particularly at the height of the crisis in mid-2009 the economy has moved back to growth The measures implemented took some time to take effect with the economy continuing to decline at first before picking up as seen in the lsquoVrsquo-shaped recovery but a protracted recession was avoided Latviarsquos GDP growth has exceeded expectations reaching levels of 54 in 2011 52 in 2012 and around 4 in 2013 The two factors that were critical to the countryrsquos economic recovery were a return to international competitiveness and the rapid correction of external imbalances The budget deficit decreased significantly and is expected to reach a balanced position in the near future The level of government debt is projected to stay around 40-42 of GDP in 2013-2014 and to decline to 33 of GDP in 2015 as the repayments to the EU take effect and sizable cash buffers will be reduced The financial assistance programme was successfully completed in January 2012 Financial support had not been necessary since October 2010 however and the government had re-entered international bond markets in June 2011 well ahead of schedule (45) As of 2013 GDP per capita in constant prices has returned to the level reached at its peak in 2007 Due to the decline in the population however the absolute value of GDP in constant prices was still about 9 below 2007 levels with current projections suggesting that a full recovery to the pre-crisis peak will be achieved in 2015
Overheating imbalances and a big bust
Latvia joined the EU in seemingly good macroeconomic health and having pegged its currency to the Special Drawing Right (SDR) in
(45) Occasional Paper 120 issued by the European Commission Directorate-General for Economic and Financial Affairs EU Balance of Payments assistance for Latvia foundations of success httpseceuropaeueconomy_financepublicationsoccasional_paper2012op120_enhtm
36 | Quarterly Report on the Euro Area
1994 and then to the euro in 2005 was keen to join the euro area in January 2008 Upon entering the Exchange Rate Mechanism II (ERM II) on 2 May 2005 the authorities unilaterally committed to maintaining a smaller fluctuation margin of plusmn1 around the central rate ndash seen as a sign of the countryrsquos determination to join the euro area The Latvian economy was the fastest growing in the EU between 2000 and 2007 and between 2005 and 2007 real GDP growth reached a yearly average of over 10 Following accession to the EU in 2004 Latvia along with other EU countries witnessed a rapid credit expansion Loans to residents grew at an average annual rate of close to 50 between 2004 and 2008 a reflection of the excess liquidity at that time and of the resulting hot money inflows into central and eastern European economies which were rapidly converging with their western European counterparts Foreign investment exploded driven by commercial banksrsquo mispricing of risk and over-optimistic expectations of convergence A number of privatisation deals and most importantly a burgeoning real-estate market characterised by soaring prices also served to attract foreign investors The tradable sector was meanwhile largely neglected By way of illustration foreign direct investment (FDI) reached relatively high levels of 84 and 81 of GDP in 2006 and 2007 respectively but most of this was directed towards the real-estate market while the proportion of total FDI relating to manufacturing was only 12 in 2013 Significant imbalances were accumulating as indicated by a current account deficit that reached around 22 of GDP in 2006 and 2007 and by labour market tightening Nominal wages doubled between 2004 and 2007 increasing much faster than productivity and thus damaging international competitiveness
By early 2008 more cautious bank lending had caused economic growth to slow significantly By autumn of the same year this slowdown had developed into a strong contraction reflecting the wider global economic situation The global economy fell into recession commodity prices reached record highs and the general risk aversion seen in global markets following the collapse of Lehman Brothers cut off Latviarsquos access to financial markets The second largest domestic bank Parex had to be rescued Latvia ultimately experienced the most severe GDP contraction of all EU countries at close to 18 in 2009 The government deficit threatened to spiral out of control Having been at 03 of GDP in 2007 and 42 in 2008 in spring 2009 it was projected to
reach levels well above 15 of GDP by the end of year in the absence of a significant consolidation package
Faced with an economic crisis of this order Latvia agreed a medium-term financial assistance programme the balance of payments programme (BoP) with the EU and the IMF in December 2008 (46) The aim of this was to preserve the existing exchange-rate arrangement The assistance offered to Latvia was made subject to a number of policy conditions relating to fiscal consolidation financial sector stabilisation and the introduction of a wide range of structural reforms including a significant acceleration in the absorption of EU structural funds The Latvian government also undertook to strengthen the social safety net so as to protect the most vulnerable from the effects of the crisis
Brave measures in difficult times
Given that the exchange rate was at that time pegged to the euro some economists suggested devaluation as the only way out of the crisis The national authorities and international partners did not see that as a viable option however because its effectiveness would have been severely limited by the degree to which imports were used in the manufacture of exports and the high proportion of foreign liabilities Furthermore it would have brought with it the risk of mass bankruptcy and a partial collapse of the domestic banking system at a time when the judicial system was clearly not capable of coping with such a fall-out In addition devaluation would have provided no incentive to solve Latviarsquos structural problems including weak fiscal governance the unsustainability of pension expenditure loss-making state-owned banks a lack of competitiveness and weak institutions
Between 2009 and 2011 the Latvian government carried out an ambitious programme of fiscal adjustment designed to correct the previously loose fiscal policy the weaknesses of which had been hidden by the countryrsquos strong economic growth This difficult adjustment restored Latviarsquos public finances to better health and established a
(46) Funds available from EU countries IMF World Bank EBRD
and Norway amounted to euro 75 billion of which Latvia used euro 45 billion (60) with euro 29 billion lent by the European Commission on behalf of the EU The first tranche of EUR 1 billion (13 of the total) was repaid by Latvia on 25 March 2014
II Special topics on the euro area economy
Volume 13 No 1 | 37
framework which would be sustainable in the long term The nominal balance improved with the deficit being cut from 98 of GDP in 2009 to 13 of GDP in 2012 and 2013 (see graph II31) The structural deficit also fell from its peak of 55 of GDP in 2008 to around 025 of GDP in 2012 and 2013 beating Latviarsquos medium-term objective of -05 of GDP as set in the convergence programmes
Latviarsquos fiscal consolidation measures were undoubtedly bold with fiscal savings equivalent to around 17 of GDP implemented within three years The measures were frontloaded and half of these savings were implemented in the first year alone The measures were on the whole expenditure-oriented with over half of the savings coming from cuts to health education and public administration budgets The most notable measure relating to revenue was an increase in VAT from 18 to 22 The consolidation strategy was eventually successful in containing the adverse effects of the budget deficit on the economy In fact it even appears to have triggered lsquonon-Keynesianrsquo effects on demand by restoring confidence and stimulating demand and investment at the point when it was most needed (47)
Graph II31 Latviarsquos government budget balance and debt (2008-15 of GDP)
Source DG ECFIN Commissionrsquos spring 2013 forecast
The fiscal framework was also strengthened significantly by the law on fiscal discipline coming into force in March 2013 and the creation of a fiscal council in January 2014 The signing of the
(47) Ibid see Chapter 4 Fiscal consolidation in the midst of the crisis
Treaty on Stability Coordination and Governance in the EMU (48) in March 2012 provided further EU-level support for the national fiscal framework
An additional factor that was critical to the success of the consolidation strategy but is often overlooked was the availability of significant EU funds (particularly from around 2009 onwards) which acted as a much-needed demand trigger in sectors affected by the decline in economic activity Between 2007 and 2013 Latvia benefited from the third highest allocation of EU funds after Hungary and Lithuania receiving a yearly average equivalent to around 28 of GDP or 70 of gross fixed capital formation(49) As on average every euro of national budget spending was supplemented by five to six euros co-financing from EU funds national expenditure on items such as road and public building construction vocational education and training of unemployed science infrastructure development and healthcare was often replaced by Structural funds financing despite being in conflict with the EU funds additionality principle Clearly such large inflows of EU financing also generated substantial tax revenues in particular VAT at a time when private consumption was weak
The Latvian labour market demonstrated a high level of flexibility during the crisis thanks in part to a decentralised wage-setting system Significant public-sector wage cuts indirectly supported nominal wage reduction in the private sector in 2009 and 2010 when earnings per employee fell by a total of 19 over two years Employment levels fell sharply especially in the private sector as jobs were cut in construction and manufacturing The unemployment rate reached around 20 in early 2010 but had fallen back to 119 by 2013 due mainly to growth in employment with the participation rate also increasing significantly over this period The projection from the Commissionrsquos 2014 winter forecast shows wages in 2014-15 growing broadly in line with productivity although the labour market is tightening and structural problems in particular regional differences and skill mismatches could create pressures in the economy
(48) httpeuropean-councileuropaeumedia639235st00tscg26_en12pdf
(49) Source Directorate-General for Regional Policy Infoview
38 | Quarterly Report on the Euro Area
External cost competitiveness has improved noticeably since 2008 with labour costs falling significantly and labour productivity in particular in the tradable sector increasing In 2008 the real effective exchange rate (REER) adjusted for unit labour costs reached a peak of 64 above the 2000 level before falling by about 20 in 2009-10 since when it has remained broadly stable (see graph II32) This level of REER is considered sustainable as the country has been seen to be steadily gaining market share over recent years (including as measured by exports adjusted for the growth of markets) The percentage of the countryrsquos GDP attributable to exports rose to 60 in 2013 from 43 in 2007 with some 60 of exports destined for the EU and 12 for Russia
Graph II32 Effective exchange rates Latvia v 35 trading partners
(Jan 2007-Dec 2013 monthly avg 2007 = 100)
Source DG ECFIN
The social burden of economic adjustment has admittedly been high in Latvia despite the policy measures contained in the Memorandum of Understanding stipulating inter alia establishment of a comprehensive social safety net supporting local governments in providing social assistance and discounting social payments from overall budget targets High unemployment has led to a wave of emigration to richer EU countries which coupled with Latviarsquos low fertility and high death rates has seen the population decrease by 8-10 since 2008 Net emigration has now fallen substantially however since the peak of the crisis years The rates of poverty and social exclusion in Latvia are among the highest in the EU families with children unemployed people people with disabilities and people living in rural areas are particularly at risk The countryrsquos spending on
social protection and healthcare as a percentage of GDP is among the lowest in the EU Furthermore the social protection measures which do exist to reduce poverty tend to be ineffective highlighting the importance of a robust social safety net It appears however that with the improved economic situation and increasing levels of general social awareness the authorities are finally starting to address the challenges of poverty and social exclusion with greater determination In recent years for example taxation of low-income earners has been cut slightly and child poverty has been reduced thanks to increases in various child-related benefits Proposals for reforms to social assistance in line with 2013 World Banks study are being gradually implemented Better targeted more effective policies relating to the active labour market mostly financed by the European Social Fund are helping unemployed people in particular the long-term unemployed and young people to find work or to obtain relevant training
As part of the BoP programme and in the context of the assessment of Latviarsquos readiness to join the euro area financial supervision has been tightened and EU resources for supervision and monitoring increased in particular for monitoring the growing non-resident banking sector Additional liquidity and capital adequacy requirements for non-resident banks were introduced in 2013 regular on- and off-site checks of these banks are being performed the deposit guarantee fund has been further strengthened and monitoring has been stepped up in relation to pledged assets and the origin of funds in bank recapitalizations This strengthened regulatory policy has been introduced partly as a result of lessons learnt at significant cost in the past five years most notably with the Parex and Krajbanka failures
Latvia has implemented a series of ambitious reforms to the business environment in recent years with the aim of reducing start-up costs simplifying procedures for property registration construction permits and tax collection and introducing out-of-court settlement of insolvencies In doing so Latvia has brought its regulatory framework a significant step closer to what is regarded as best practice In the World Bankrsquos 2014 Doing Business report Latvia was ranked 25th out of 185 countries with only four euro-area members faring better
II Special topics on the euro area economy
Volume 13 No 1 | 39
Conclusion
The origins of Latviarsquos years of boom and bust can be traced back to the domestic regional and global circumstances at that time globally excess liquidity and hot money flowing into vulnerable countries regionally unrealistic expectations of income convergence in central and eastern Europe and domestically undue optimism about growth in personal incomes and mispricing of risk by commercial banks amplified by the behaviour of both policymakers and individuals
A broad range of country-specific and general economic factors have contributed to the successful economic adjustment seen in Latvia since the height of the crisis Ambitious front-loaded and largely expenditure-based fiscal consolidation helped to contain the budget deficit whilst the confidence generated by the introduction of a credible programme itself aided the economic recovery The flexibility of the labour market meanwhile helped companies to restore competitiveness by means of wage reductions and job cuts Competitiveness was also improved by steps taken to shift the tax burden from labour to consumption and property The recovery in Latvia was very much export-driven with the growth in exports made possible by the openness of the economy and the faster-than-expected economic growth experienced by major trading partners A number of structural reforms including bank restructuring and measures improving the use of EU funds have contributed to the development of a more favourable business environment A generous allocation from the European structural funds meanwhile helped to boost public investment and supported financing and reforms in many important sectors Above all the success of the recovery measures implemented in Latvia proved that for a tough internal economic adjustment to be effective there needs to be both a determined political will to carry out unpopular reforms and also a fully-developed comprehensive social safety net to protect more vulnerable groups
in society during difficult times In addition Latvia benefited from the fact that those looking for work were able to migrate to other EU countries which helped to alleviate the social tension created by the effects of the crisis Some of the lessons above are clearly applicable to other Member States undergoing challenging economic adjustment while others are more Latvia-specific
While Latviarsquos current level of economic growth is regarded as sustainable (50) and the adoption of the euro is recognised as a significant and hard-earned achievement it is not the end of the road The current robust economic situation should be used to advance reforms and improve Latvias long-term growth potential rather than lead to complacency and relaxation of reform efforts Sustainable convergence of the economy in the longer term will require inter alia ongoing commitment to prudent fiscal policies (there are some recent signs of less prudent fiscal decision-making) a continuous use of macro-prudential tools to reduce risks from growing non-resident financial flows especially in view of recent Ukraine events and the implementation of reforms in a number of vested-interest-heavy areas These include higher education and science state owned enterprise management electricity and gas market liberalization and the judiciary including insolvency framework But above all and in order to ensure economic and social sustainability for years to come high rates of poverty social exclusion and dismal demographic trends need to be addressed boldly These and other structural challenges are being addressed by the Commission under the European Semester and the Post Program Surveillance frameworks Also Latvia has joined a euro area that is very different from what it was just a few years ago the euro area economic governance framework has been greatly strengthened entailing stricter obligations
(50) The Commissionrsquos alert mechanism reports issued under the Macroeconomic Imbalance Procedure have not identified economic imbalances in Latvia requiring further in-depth investigation for possible policy action
httpeceuropaeueurope2020pdf2014amr2014_enpdf
40 | Quarterly Report on the Euro Area
II4 Corporate balance sheet adjustment in the euro area and the United States (51)
This section compares balance sheet adjustment in the non-financial corporate sector in the euro area and the United States It shows that the adjustment since the crisis has been faster in the latter Despite similar steep rises in corporate debt in pre-crisis years US corporations have cut debt more than those in the euro area Shifts from loans to bonds and extensions of debt maturity have also been more pronounced in the United States Much of the difference in balance sheet consolidation can be traced back to more positive profitability trends providing US firms with the internal funds necessary to adjust balance sheets Differences in dividend distribution strategies and in corporations physical investment behaviours also played a role Profitability differences reflect differences both in cyclical conditions and labour market adjustment Comparatively slow progress in balance sheet consolidation is likely to weigh on investment recovery in the euro area
-----------------------
Introduction
Both the euro area and the United States experienced a surge in corporate indebtedness in the years preceding the global financial crisis and in its early stages The ratio of debt to gross value added by non-financial corporations (NFCs) rose by about 40 pp between 2005 and 2009 Deteriorating growth prospects and changing attitudes to risk have prompted NFCs in both economies to adjust their balance sheets As previously argued in the Quarterly Report balance sheet adjustment can have a substantial effect on economic activity and it is important to monitor regularly the ongoing adjustment in the euro area (52) This section contributes to the monitoring by comparing progress in corporate deleveraging in the euro area and in the United States two regions where firms entered the crisis with excessive debt
(51) Section prepared by Plamen Nikolov (52) See European Commission (2010) Focus Balance sheet
adjustment in the corporate sector Quarterly Report on the Euro Area Vol9 (3) pp 9-19 A more detailed overview of the literature on the impact of balance sheet adjustment can be found in Cuerpo C I Drumond J Lendvai P Pontuch and R Raciborski (2013) Indebtedness deleveraging dynamics and macroeconomic adjustment European Economy Economic Papers 477
Firms consolidate their balance sheets primarily by raising their net lendingborrowing (NLB) ie the cash obtained from their production activity and available for financial operations (53) A rise in NLB is achieved either by increasing savings or cuttingpostponing physical investment Firms increase savings by raising profits and reducing the dividends distributed to shareholders In firmsrsquo financial accounts a rise in corporate NLB is associated with a rise in financial assets andor a cut in financial liabilities The section reviews recent developments in euro area and US profitability savings and NLB and looks at the instruments that the corporate sector has used to consolidate its balance sheet on both the asset and the liability side
Corporate profits have disappointed in the euro area hellip
National account data show that corporate profitability in the euro area reached a pre-crisis peak in 2007Q3 ie later than in the United States where it had already started to decline in 2007 (54)
Graph II41 NFC profitability euro area and US
(2000Q1-2013Q3 of GVA)
20
25
30
35
40
45
00Q1 01Q3 03Q1 04Q3 06Q1 07Q3 09Q1 10Q3 12Q1 13Q3
Euro area (1)
US
(1)Excluding Latvia Source Eurostat US Bureau of Economic Analysis DG ECFIN calculations
(53) Firms can also consolidate their balance sheets by raising equity (54) Profitability like the other national account variables for the
corporate sector presented in this section is measured as a proportion of corporate sector activity represented by gross value added (GVA) It is calculated as the gross operating surplus plus financial revenues and subsidies and minus financial and tax expenses Financial expenses do not include earnings distributed to shareholders
II Special topics on the euro area economy
Volume 13 No 1 | 41
The 2008-09 recession brought a sharp drop in corporate profitability in the euro area Profitability recovered briefly in 2010 to reach a new peak in 2011 but has declined again since then (Graph II41) In the United States the impact of the crisis was rather muted with profits recovering vigorously after 2008 As a ratio to gross value added (GVA) US corporate profits had already passed their pre-crisis level in 2009 before flattening out in the past two years Overall by 2013 profitability in the euro area was still about 2 pp below its pre-crisis peak while in the United States it stood around 3 pp above
hellip mostly due to weak operating surplus
The disappointing profit performance in the euro area relative to the United States is largely due to differing developments in gross operating surplus Looking at the breakdown of the contribution to the cumulative change in corporate profitability since the start of the crisis there is a marked difference between firms in the euro area and those in the United States (Graphs II42 and II43) (55)
Graph II42 Profitability breakdown of NFCs euro area (1)
(cumulative change in from 2007Q3 peak to 2013Q3)
35
36
37
38
39
40
41
42
-100
-80
-60
-40
-20
0
20
40
60
80
100
07Q4 08Q4 09Q4 10Q4 11Q4 12Q4
Taxes (lhs)
Other net current transfers received (lhs)
Net property income received excl dividends paid (lhs)
Operating surplus (lhs)
Profits(rhs)(2)
(1)Excluding Latvia(2)Profits in of GVA Source Eurostat DG ECFIN calculations
In the euro area a fall in the ratio of operating surplus to GVA dragged overall profitability down after 2008 Despite an improvement in 2011 in
(55) The illustration of the contributions to the cumulative change in profitability only serves to depict the relative importance of the various components of the change in profits since the crisis The starting point for the cumulative change should not be interpreted as a reference point for a desirable profit recovery
2013 operating surplus was still contributing negatively to the cumulative change in profitability since the pre-crisis peak In contrast operating surplus in the United States responded to the crisis earlier than in the euro area but its contribution to the change in profits remained positive
Graph II43 Profitability breakdown of NFCs US
(cumulative change in from 2005Q3 peak to 2013Q3)
24
25
26
27
28
29
30
31
-100
-80
-60
-40
-20
0
20
40
60
80
100
05Q4 06Q4 07Q4 08Q4 09Q4 10Q4 11Q4 12Q4
Taxes (lhs)Other net current transfers received (lhs)Net property income received excl dividends paid (lhs)Operating surplus (lhs)Profits(rhs)(2)
(1) Profits in of GVA Source Federal Reserve Board US Bureau of Economic Analysis DG ECFIN calculations
Unlike operating surplus income tax payments and net income from non-operational activities did not differ significantly between the euro area and the United States (56) In both economies lower corporate tax payments resulting from lower profits generated by NFCs naturally had a positive impact on the cumulative change in profits from the pre-crisis peak
Differences in labour market developments are at the root of differences in profitability
Differences in operating surplus and profitability between the United States and the euro area can be attributed partly to differences in the business cycle In 2011Q1 NFCsrsquo gross value added was still 12 below its pre-crisis peak in the euro area but 11 above in the United States The main channel through which cyclical developments can affect operating surplus is the labour market
(56) In fact the ratio of profit tax payments to profits (a crude measure of an aggregate tax rate) in the euro area and the United States has been almost the same since the start of the crisis falling substantially in 2008-09 indicating that tax policy was not more favourable for profits in one economy than in the other
42 | Quarterly Report on the Euro Area
The cyclicality of operating surplus depends on the impact of the cycle on labour productivity as well as on wages The worse performance of operating surplus in the euro area since 2008 as compared with that in the United States reflects a stronger deterioration in labour productivity accompanied by unfavourable developments in wages per employee
Labour productivity growth in the euro area turned sharply negative in 2009 opening a big gap with the positive (albeit modest) wage growth (Graph II44) In the United States on the other hand labour productivity growth became negative earlier but to a lesser extent and some downward wage adjustment took place in 2009
Graph II44 Labour productivity and wages euro area and US
(2001Q4-2013Q3 y-o-y change)
-4
-3
-2
-1
0
1
2
3
4
5
01Q4 03Q2 04Q4 06Q2 07Q4 09Q2 10Q4 12Q2
Average wage per employee euro area (1) (2)Average wage per employee US (1)Labour productivity euro area (2) (3)Labour productivity US (3)
(1)Real wages calculated by the GDP deflator(2)Euro area excluding Latvia(3)In terms of total employment (thousands) Source Eurostat US Bureau of Economic Analysis US Bureau of Labour Statistics DG ECFIN calculations
There are a number of reasons for the different labour adjustments in the euro area and the United States In the former apart from a higher level of employment protection short-term work schemes were put in place in the early stages of the crisis (57) In addition as labour force adjustment tends to be more costly in the euro area some firms (particularly small firms and those with highly qualified employees) preferred to retain their
(57) According to the OECD Public short-term work schemes have
played an important role in preserving jobs during the crisis in a number of countries although significant hours reductions were also achieved via lower overtime hours hours averaging arrangements and employer initiatives see OECD Employment Outlook 2010 ndash Moving Beyond the Job Crisis
labour force (58) Because of a lack of wage flexibility the higher degree of lsquolabour hoardingrsquo in the euro area came at the expense of lower operating surplus and profits and consequently put a downward pressure on the capacity accumulate internal funds to deleverage
Corporate savings are much lower in the euro area
Negative developments in euro area corporate profitability were reflected in corporate savings which together with physical investment determines the internal funds available for balance sheet adjustment In 2009-10 there was a sharp drop in euro area savings because profits acted as shock absorbers and fell more rapidly than dividend payments leaving less spare cash available In contrast savings by US NFCs increased substantially on rising profits after an early-crisis low point and reached a historically high level of around 23 of GVA in 2010Q3 (Graph II45)
Graph II45 Savings of NFCs (2000Q1- 2013Q3 of GVA)
15
16
17
18
19
20
21
22
23
24
00Q1 01Q3 03Q1 04Q3 06Q1 07Q3 09Q1 10Q3 12Q1 13Q3
Euro area (1)
US
(1)Euro area excluding Latvia Source Eurostat Bureau of Economic Analysis DG ECFIN calculations
The impression that US corporate behaviour has been more geared towards accumulating savings than that in the euro area is reinforced when one looks at dividend distribution Dividends paid by euro area NFCs have been on a declining trend since the start of the crisis but those paid by US firms have also decreased This is remarkable given (58) See Box 12 Labour hoarding across different types of firms in
OECD Employment Outlook 2010 ndash Moving Beyond the Job Crisis
II Special topics on the euro area economy
Volume 13 No 1 | 43
the positive profit developments in the United States (Graph II46) A drop in dividends alongside profit growth suggests that after 2008 US companies preferred to direct a bigger proportion of the profit recovery to corporate savings and thereby balance sheet adjustment The ratio of dividends to profits in the United States has fallen from about one third before the crisis to one quarter now This ratio also dropped in the euro area although by less (59)
Graph II46 Dividends paid of NFCs (2000Q1-2013Q3 of GVA)
0
5
10
15
20
25
00Q1 01Q3 03Q1 04Q3 06Q1 07Q3 09Q1 10Q3 12Q1 13Q3
Euro area (1)
US
(1)Euro area excluding Latvia Source Eurostat Federal Reserve Board DG ECFIN calculations
Disappointing physical investment in the euro area and the United States
Cutting investment in physical assets is another way of reducing excessive indebtedness Corporate investment as a proportion of activity dropped sharply both in the euro area and in the United States in the early stages of the crisis (Graph II47)
After a modest recovery in 2010-11 the investment rate decreased again in the euro area The investment recovery was more solid in the United States but has lost momentum since the end of 2012 and the investment rate remains below its pre-crisis peak Overall it seems that euro area corporations partly compensated for less supportive savings developments than in the US by
(59) Dividend payments are not the only way of distributing profits to shareholders Equity buybacks can also be used for this purpose and firms that choose this option will tend to have higher savings and lower dividends paid
curbing physical investment more than their US counterparts
Graph II47 Investment of NFCs (2000Q1- 2013Q3 of GVA)
15
16
17
18
19
20
21
22
23
24
00Q1 01Q3 03Q1 04Q3 06Q1 07Q3 09Q1 10Q3 12Q1 13Q3
Euro area (1)
US
(1)Excluding Latvia Source Eurostat US Bureau of Economic Analysis DG ECFIN calculations
A more modest increase in net lending in the euro area than in the US
Since 2013 firmsrsquo net lending in the euro area has been in positive territory but substantially less so than that in the United States (Graph II48) Positive NLB in the euro area unlike that in the United States is mostly due to a low investment rate alone rather than low investment combined with high savings The combination of disappointing investment and high savings has translated into historically high and sustained NLB for US firms
This persistent net lending position in the United States is atypical as firms usually invest more than they save It suggests that US firms have been adjusting their balance sheets significantly since the beginning of the crisis via their internal funds while euro area firms seem to have opted for much slower balance sheet adjustment
44 | Quarterly Report on the Euro Area
Graph II48 Net lendingborrowing of NFCs
(2000Q1- 2013Q3 of GVA)
-10
-8
-6
-4
-2
0
2
4
6
8
00Q1 01Q3 03Q1 04Q3 06Q1 07Q3 09Q1 10Q3 12Q1 13Q3
Euro area (1)
US
(1)Excluding Latvia Source Eurostat US Bureau of Economic Analysis DG ECFIN calculations
Debt deleveraging has been more pronounced in the US than in the euro area
The faster pace of adjustment of balance sheets in the United States is confirmed by the corporate debt data (Graph II49) (60) (61) While both the euro area and the United States entered the crisis with swiftly rising and historically high levels of debt deleveraging has progressed more rapidly in the latter since the crisis By the beginning of 2012 US corporate debt had fallen by approximately 15 pp as a proportion of activity while euro area debt had dropped by 7 pp (62)
(60) Non-financial corporate debt consists of loans and securities
other than shares (corporate bonds) both can be classified as short- or long-term depending on whether their original maturity is less or more than one year
(61) This section analyses developments in non-consolidated financial flows and stocks in the euro area and in the United States for two reasons it is important to have a sense of financial positions within the institutional sector eg loans between NFCs are an important part of intra-firm relationships as head offices use them to finance subsidiaries for example perhaps for tax reasons This is relatively more important in the euro area than in the United States Consolidated financial asset and flow data eliminate these intra-sector positions and different approaches may be taken to consolidation as in the euro area there is the additional issue of cross-border consolidation between Member States while there is no need for flows and positions between firms in different US states to be treated separately
(62) The debt-to-equity ratio is another measure of corporate leverage widely followed by investors Faster stock market recovery helped US firms reduce this ratio more than those in the euro area
Graph II49 Debt levels of NFCs(1) (1999Q1-2013Q3 of GVA)
100
120
140
160
180
200
220
99Q1 00Q3 02Q1 03Q3 05Q1 06Q3 08Q1 09Q3 11Q1 12Q3
Euro area (2)
US
(1)Securities other than shares and loans(2)Excluding Latvia Source Eurostat US Bureau of Economic Analysis DG ECFIN calculations
Firms in the euro area and the United States entered the crisis with almost the same level of short-term debt as a proportion of total debt Since the crisis the adjustment away from short-term debt has been significantly more pronounced in the United States suggesting more active balance sheet restructuring
Graph II410 Debt flows of NFCs(1) (1999Q1- 2013Q3 of GVA)
-15
-10
-5
0
5
10
15
20
99Q1 01Q1 03Q1 05Q1 07Q1 09Q1 11Q1 13Q1
Euro area bonds (2)
US bonds
Euro area loans (2)
US loans
(1)Securities other than shares and loans (2)Excluding Latvia Source Eurostat US Bureau of Economic Analysis DG ECFIN calculations
Due to differences in the structure of corporate finance loans (as opposed to bonds) tend to form a bigger proportion of debt in the euro area than in the United States An important element of the
II Special topics on the euro area economy
Volume 13 No 1 | 45
corporate balance sheet adjustment process in both economies has been a movement away from an excessive reliance on loans (Graph II410) and towards bond financing This trend has been substantially more pronounced in the United States presumably reflecting the fact that bond markets are more developed in that country
Developments in non-financial corporate debt were also influenced by developments in financial intermediation in particular in the banking sector Financial accounts show NFCsrsquo debt exposure but do not indicate whether the debt holder is a bank According to bank balance sheet statistics the nominal growth of loans vis-agrave-vis NFCs has been mostly negative in the euro area since 2009Q4 (Graph II411) Coupled with the positive loan inflows seen in the national accounts between 2010Q3 and 2012Q3 (Graph II410) this shows a degree of substitution in corporate loan liability ownership between banks and other financial firms and sectors (including other NFCs) in this period According to the counterparty breakdown of NFC domestic loans published by the ECB corporate borrowings from other NFCs represented 29 of all loans by 2013Q3 (up from 26 in 2008Q1) while the proportion of borrowings from monetary financial institutions (MFIs) had dropped (from 60 in 2008Q1) to an all-time low of 53 The proportion of loans from other non-bank financial intermediaries also increased There is less evidence of a shift from banks to other loan providers in the United States where loans between NFCs are much more limited
Graph II411 Bank loans to NFCs (1999Q1- 2013Q3 y-o-y change)
-20
-15
-10
-5
0
5
10
15
20
25
99Q1 00Q3 02Q1 03Q3 05Q1 06Q3 08Q1 09Q3 11Q1 12Q3
Euro area bank loans to NFCs (1)US bank loans to NFCs
(1)Excluding Latvia Source ECB US Federal Reserve Board DG ECFIN calculations
Positive NLB has been used to acquire safe financial assets in both regions
In both the euro area and the United States the positive NLB has been used to deleverage but also to invest in safe financial assets At the beginning of the crisis much of the positive corporate NLB in the United States was invested in money market mutual funds which is essentially investment in short-term low-risk assets (Graph II412) (63)
Currency and deposits (another type of safe asset) have increased substantially in the euro area in recent years as a proportion of total firm activity (Graph II413) This rise was driven almost exclusively by a rapid increase in firmsrsquo savings deposits To some extent a similar trend is observable in the United States In particular US cash balances (a sub-component of currency and deposits) approached 12 of GVA by the end of 2013 a level not seen since the early 1990s On the other hand savings deposits have grown more modestly resulting in a moderately positive overall trend in currency and deposits
Graph II412 Mutual fund shares of NFCs (1999Q1- 2013Q3 of GVA)
0
2
4
6
8
10
12
14
99Q1 01Q1 03Q1 05Q1 07Q1 09Q1 11Q1 13Q1
Euro area (1)
US (2)
(1)Excluding Latvia(2)In the USA these asset series can be broken down into investment in money market mutual funds and investment in other mutual funds The 2009-11 increase is fully attributable to the former Source Eurostat US Bureau of Economic Analysis DG ECFIN calculations
Overall these two aspects of corporate financial investment behaviour signify considerable liquidity concerns on the part of firms in both the euro area
(63) Euro area financial accounts only show firmsrsquo investment in mutual funds overall and do not distinguish between types of mutual funds
46 | Quarterly Report on the Euro Area
and the United States They also represent a drive towards lower-risk assets perhaps indicating increased risk aversion by corporations or a tendency to postpone physical investment in a context of perceived high uncertainty
Graph II413 Currency and deposits ndash NFCs
(1999Q1- 2013Q3 of GVA)
0
5
10
15
20
25
30
35
40
45
99Q1 00Q3 02Q1 03Q3 05Q1 06Q3 08Q1 09Q3 11Q1 12Q3
Euro area (1)
US
(1)Excluding Latvia Source Eurostat US Bureau of Economic Analysis DG ECFIN calculations
Conclusion
Although both regions saw similar steep rises in corporate debt in the pre-crisis years balance sheet adjustment since the crisis has been significantly slower in the euro area than in the United States The more rapid adjustment in the United States can be explained by a stronger cyclical recovery more supportive profitability developments and reduced dividend payment ratios In the euro area profitability has been hindered by a combination of lower flexibility in the labour markets and slow wage adjustment
The slower balance sheet adjustment in the euro area corporate sector is visible in a slower fall in indebtedness but also a slower adjustment of the structure of balance sheets In particular the shift from loans to bonds and the extension of debt maturity have been more pronounced in the United States In both regions firms have used their positive NLB to accelerate the accumulation of safe and liquid financial assets This could reflect continuing uncertainty regarding future demand and growth prospects
Overall the evidence discussed in this section shows that euro area firms are lagging significantly behind their US counterparts in terms of balance sheet consolidation Given that investment rates remain disappointing even in the more advanced US corporate sector a degree of caution appears warranted when assessing short-term prospects for corporate investment in the euro area
III Recent DG ECFIN publications
Volume 13 No 1 | 47
1 Occasional Papers
European Economy Occasional Papers 170 January 2014 Financial Assistance Programme for the Recapitalisation of Financial Institutions in Spain Fifth Review ndash Winter 2014 httpeceuropaeueconomy_financepublicationsoccasional_paper2014pdfocp170_enpdf
European Economy Occasional Papers 169 December 2013 The Economic Adjustment Programme for Cyprus Second Review ndash Autumn 2013 httpeceuropaeueconomy_financepublicationsoccasional_paper2013pdfocp169_enpdf
European Economy Occasional Papers 168 December 2013 Fiscal frameworks in the European Union ommission services country factsheets for the Autumn 2013 Peer Review httpeceuropaeueconomy_financepublicationsoccasional_paper2013pdfocp168_enpdf
European Economy Occasional Papers 167 December 2013 Economic Adjustment Programme for Ireland - Autumn 2013 Review httpeceuropaeueconomy_financepublicationsoccasional_paper2013pdfocp167_enpdf
European Economy Occasional Papers 166 December 2013 Progress towards meeting the economic criteria for EU accession the EU Commissionrsquos 2013 assessments httpeceuropaeueconomy_financepublicationsoccasional_paper2013pdfocp166_enpdf
European Economy Occasional Papers 165 November 2013 Romania Balance-of-Payments Assistance Programme 2013-2015 httpeceuropaeueconomy_financepublicationsoccasional_paper2013pdfocp165_enpdf
European Economy Occasional Papers 164 November 2013 The Economic Adjustment Programme for Portugal Eighth and Ninth Review httpeceuropaeueconomy_financepublicationsoccasional_paper2013pdfocp164_enpdf
European Economy Occasional Papers 163 November 2013 Financial Assistance Programme for the Recapitalisation of Financial Institutions in Spain Fourth Review ndash Autumn 2013 httpeceuropaeueconomy_financepublicationsoccasional_paper2013pdfocp163_enpdf
European Economy Occasional Papers 162 October 2013 Economic Adjustment Programme for Ireland Summer 2013 Review httpeceuropaeueconomy_financepublicationsoccasional_paper2013pdfocp162_enpdf
2 Economic papers
European Economy Economic Papers 514 February 2014 Martin Larch Kristin Magnusson Bernard Balint Tatar Hard work and More How to successfully conduct adjustment with official assistance httpeceuropaeueconomy_financepublicationseconomic_paper2014pdfecp514_enpdf
European Economy Economic Papers 513 February 2014 Florian Woumlhlbier Caterina Astarita Gilles Mourre Consolidation on the revenue side and growth-friendly tax structures an indicator based approach httpeceuropaeueconomy_financepublicationseconomic_paper2014pdfecp513_enpdf
48 | Quarterly Report on the Euro Area
European Economy Economic Papers 512 December 2013 Alexander Schwan Etienne Sail Assessing the economic and budgetary impact of linking retirement ages and pension benefits to increases in longevity httpeceuropaeueconomy_financepublicationseconomic_paper2013pdfecp512_enpdf 3 Other publications
Winter forecast 2014 - EU economy recovery gaining ground httpeceuropaeueconomy_financepublicationseuropean_economy2014pdfee2_enpdf 4 Regular publications
Business and Consumer Surveys (harmonised surveys for different sectors of the economies in the European Union (EU) and the applicant countries) httpeceuropaeueconomy_financedb_indicatorssurveysindex_enhtm Business Climate Indicator for the euro area (monthly indicator designed to deliver a clear and early assessment of the cyclical situation) httpeceuropaeueconomy_financedb_indicatorssurveysdocuments2013bci_2013_11_enpdf Key indicators for the euro area (presents the most relevant economic statistics concerning the euro area) httpeceuropaeueconomy_financedb_indicatorskey_indicatorsindex_enhtm Monthly and quarterly notes on the euro-denominated bond markets (looks at the volumes of debt issued the maturity structures and the conditions in the market) httpeceuropaeueconomy_financepublicationsbond_marketindex_enhtm Price and Cost Competitiveness httpeceuropaeueconomy_financedb_indicatorscompetitivenessindex_enhtm
50 | Quarterly Report on the Euro Area
Editor-in-Chief Elena Flores
Overall coordination Eric Ruscher
Data assistance Christos Zavos
Comments on the report would be gratefully received and should be sent to
Elena Flores Director ndash Policy Strategy and Coordination Directorate-General for Economic and Financial Affairs Office CHAR 1566
B-1049 Brussels
Email elenafloreseceuropaeu
or
Eric Ruscher Head of Unit ndash Macroeconomy of the euro area Directorate-General for Economic and Financial Affairs Office CHAR 15248
B-1049 Brussels
Email ericruschereceuropaeu
HOW TO OBTAIN EU PUBLICATIONS Free publications bull one copy
via EU Bookshop (httpbookshopeuropaeu) bull more than one copy or postersmaps
from the European Unionrsquos representations (httpeceuropaeurepresent_enhtm) from the delegations in non-EU countries (httpeeaseuropaeudelegationsindex_enhtm) by contacting the Europe Direct service (httpeuropaeueuropedirectindex_enhtm) or calling 00 800 6 7 8 9 10 11 (freephone number from anywhere in the EU) () () The information given is free as are most calls (though some operators phone boxes or hotels may charge you)
Priced publications bull via EU Bookshop (httpbookshopeuropaeu) Priced subscriptions bull via one of the sales agents of the Publications Office of the European Union
(httppublicationseuropaeuothersagentsindex_enhtm)
KC-AK-14-001-en-n
- Blank Page
- Blank Page
- Blank Page
- Blank Page
-

II Special topics on the euro area economy
Volume 13 No 1 | 29
investigate the role of framework conditions in bringing the impact of general government to bear on manufacturing wages by means of appropriate sample splits Box II21 shows the estimation methodology and the results
Much of the variance in manufacturing wages is explained by variables usually used when estimating wage equations (ie the price level labour productivity and the unemployment rate) and by general government wage levels Both the long- and short-term elasticity of manufacturing wages with respect to government wages is estimated to be around 03-04 This tallies with the results of similar studies (eg Afonso and Gomes 2008) It works both ways general government wages also react to manufacturing wages They have a long-term elasticity of 08 and a short-term elasticity of 04 (37) This is consistent with the fact that it is more usual for the private sector than for the government to take the lead in terms of wages as the available literature also shows (38) The DOLS cointegration estimation delivers qualitatively identical results The results are still valid when the sample is restricted to just the euro area (39) The relationship tested on real wages is symmetrical because manufacturing wages respond to government wages whether they are increased or reduced
One hypothesis tested here is whether the size of the government sector determines the extent to which changes to government wages affect average conditions on the private market if for example there is cross-sector mobility In order to test how this market-based channel works the same EU sample is split into two groups of countries those in which the average share of government to total employment is above the whole EU samplersquos median and countries in which it is below the median Results show that in the long-run the impact of public on manufacturing wages is considerably higher in the case of large public sectors This divide disappears in the short-run In the opposite direction going from manufacturing to public wages the split does not produce differentiated results This confirms that government size matters when it comes to the public sectors long-term impact on the labour
(37) The results are not shown (38) Perez JJ and AJ Sanchez (2011) (39) Still it should be noted that the sample used excludes some key
countries in the euro area
market The DOLS methodology confirms these results (40)
Another hypothesis that is tested is whether the way wages are set in the public sector increases the chances of manufacturing wages reacting to government wages Broadly speaking two wage-setting systems may be identified
bull This first is that wages are mainly set on thebasis of collective bargaining
bull The second is that wages are set on the basis ofunilateral decision by the government (41)
The results show that the way wages are set does not fundamentally alter the relation between government and manufacturing wages in the long- or the short-term It is however interesting to note that across all methodologies used the relationship between manufacturing wages and labour productivity is weaker in countries characterised by a unilateral decision wage-setting system This is probably because in such a case the spillover from public to private wages is such that private wages tend to be misaligned with sectoral productivity This is not the case when government wages are set through a collective bargaining wage-setting system possibly because bargaining processes even in a particular type of insulated sector such as the public one reflect market forces more than a unilateral government decision
The relationship between government and manufacturing wages under fiscal stress
Most countries in the euro area have recently been trying to cut government wage bills by freezing wages cutting or retrenching specific indemnities or benefits (including bonuses andor holidays) or blocking turnover As a result the share of government compensations in total government spending has fallen Between 2008 and 2012 this fall was particularly sharp for Latvia Portugal and Romania followed by Hungary Spain Denmark and Estonia (Graph II21)
(40) The results from the DOLS are not shown (41) For a classification of EU wage-setting systems in the government
sector see European Commission Directorate for Economic and Financial Affairs (2014) Government wages and labour market outcomes Occasional Paper forthcoming
30 | Quarterly Report on the Euro Area
(Continued on the next page)
II Special topics on the euro area economy
Volume 13 No 1 | 31
Box (continued)
(Continued on the next page)
32 | Quarterly Report on the Euro Area
Box (continued)
II Special topics on the euro area economy
Volume 13 No 1 | 33
The recent crisis marked a watershed in the evolution of public compensations Between 1999 and 2007 relative government wage growth did not vary from cold-shower periods (or periods of more gradual fiscal consolidation) to periods of non-consolidation (42)
Graph II21 Change in the share of general government compensations to
total spending (2008-2012 in pp)
Source DG ECFIN calculations based on AMECO
Conversely starting with the 2008-2009 crisis compensations per employee in the government sector grew more slowly compared with those in the manufacturing sector and more clearly so during fiscal consolidation (Graph II22)
It is possible that under conditions of fiscal stress the relationship between government and export sector wages differs from that of normal periods This aspect has been neglected in previous analyses To shed some light on it Table II21 shows the correlation between government wage growth and manufacturing wage growth under alternative fiscal conditions (consolidation and non-consolidation) differentiating between countries with large and small public sectors The evidence shows that the two wages are closely related in periods of fiscal stress only if the government employs a large share of the labour forces This suggests that the possibility of
(42) By convention episodes of fiscal consolidation are defined as those during which the structural primary balance improves by at least 15 per cent of GDP in one year or at least 3 per cent in three years with a minimum improvement of 05 per cent in each year Such a definition makes it possible to distinguish between cases of cold-shower consolidation episodes and more gradual consolidation episodes
expenditure-based fiscal consolidation having the type of supply-side effects described in Alesina and Perotti (1997) Alesina et al (2002) and Ardagna (2004) may be a consequence of the size of the public sector among other things
Graph II22 Government and manufacturing compensations under
alternative fiscal conditions EU countries (1999-2007 and 2008-2012 avg annual change)
Source DG ECFIN calculations based on OECD
Table II21 Correlation between government and manufacturing
compensations growth under alternative fiscal conditions EU (1)
(1) Pearson correlation coefficients Sample EU countries (excluding AT BG CY DE EL LT LV MT RO SI) over 1980-2012 (1995-2012 in the case of CZ EE HU SK) Source DG ECFIN calculations based on OECD
Concluding remarks
Spillovers which are the result of high wages in the general government sector have been mentioned as one of the drivers of competitiveness losses in
34 | Quarterly Report on the Euro Area
some countries in the euro area before the crisis (43)
The results presented here speak to this debate and may be summarised as follows Government wage levels have a long-term impact on wages in the manufacturing sector even more so in countries in which the government sector employs a relatively large share of the labour force That said their short-term impact remains unaffected by the size of the public sector Looking at it the other way round manufacturing wages usually have a greater impact on government wages regardless of size This is arguably because private sector wage leadership is more common than public sector wage leadership
(43) Blanchard O (2007) Adjustment within the euro The difficult
case of Portugal in Portuguese Economic Journal 61 1-21
The way government wages are set also plays a role In collective bargaining systems not only are government and manufacturing wages related in both the long- and the short-term (as they are also when the government sets wages by unilateral decision) Also most importantly wages in the tradable sector are better aligned with labour productivity The evidence provided here indicates that if the government wage bill is inflated for example due to unjustified wage premia limiting public wage growth would spill over into the private export sector reducing labour costs and helping boost competitiveness and employment in the sector Whilst structural reforms including skill upgrading in manufacturing are an important and necessary ingredient for achieving non-reversible gains in competitiveness the adjustment of competitiveness through fiscal policy remains a complementary tool to deliver sustained external rebalancing
II Special topics on the euro area economy
Volume 13 No 1 | 35
II3 Latvia maintaining sustainable growth after the boom-bust years (44)
Latvia had been keen to join the euro area at the earliest opportunity with entry in January 2008 the clear target As the economy overheated however significant macro-economic imbalances accumulated which deferred these plans Between 2005 and 2007 unsustainable GDP growth went hand in hand with a mounting current account deficit and a housing market spiralling out of control When credit flows then abruptly reversed the countryrsquos GDP contracted dramatically Latvia was placed in the EUIMF-led financial assistance programme and was forced to carry out ambitious fiscal consolidation and structural reforms Reallocating resources to the tradable sector was the first important step on the road to an export-driven recovery Under the burden of deleveraging and consolidation the revival of domestic demand was slow at first From 2011 however supported by favourable labour market developments growth in demand has accelerated Latvia has reclaimed its position as the fastest-growing EU economy however the current level of growth is lower than the unstainable rates recorded in the boom years and it is now seen as sustainable Thanks to this balanced growth Latvia has not been subject to the MIP since its launch in 2012 Despite the financial assistance-supported measures to preserve equity the social burden of economic adjustment as evidenced by poverty social exclusion and emigration rates has been high but measures are being taken by the authorities to counter these effects Continued commitment to prudent fiscal policies will be critical for the countryrsquos economic future The use of macro-prudential tools to reduce the risks posed by large non-resident financial flows and the implementation of ambitious structural reforms will also play an important role
-----------------------
Introduction
To welcome Latvias recent adoption of the euro this section reviews the countrys recent boom-bust experience and discusses the challenges ahead
Five years ago it would have been difficult to imagine that Latvia would be able to fulfil the conditions for adopting the euro and enter the euro
(44) Section prepared by Gatis Eglitis and Christian Weise
area in January 2014 After EU accession in May 2004 significant macro-economic imbalances had started to accumulate on the back of an overheating economy and by autumn 2008 the country was on the brink of bankruptcy A painful and seemingly impossible economic adjustment to be achieved by means of internal devaluation lay ahead This would require unprecedented fiscal consolidation huge redundancies and difficult structural reforms threatening political and social stability Yet despite pronounced scepticism from the outset and particularly at the height of the crisis in mid-2009 the economy has moved back to growth The measures implemented took some time to take effect with the economy continuing to decline at first before picking up as seen in the lsquoVrsquo-shaped recovery but a protracted recession was avoided Latviarsquos GDP growth has exceeded expectations reaching levels of 54 in 2011 52 in 2012 and around 4 in 2013 The two factors that were critical to the countryrsquos economic recovery were a return to international competitiveness and the rapid correction of external imbalances The budget deficit decreased significantly and is expected to reach a balanced position in the near future The level of government debt is projected to stay around 40-42 of GDP in 2013-2014 and to decline to 33 of GDP in 2015 as the repayments to the EU take effect and sizable cash buffers will be reduced The financial assistance programme was successfully completed in January 2012 Financial support had not been necessary since October 2010 however and the government had re-entered international bond markets in June 2011 well ahead of schedule (45) As of 2013 GDP per capita in constant prices has returned to the level reached at its peak in 2007 Due to the decline in the population however the absolute value of GDP in constant prices was still about 9 below 2007 levels with current projections suggesting that a full recovery to the pre-crisis peak will be achieved in 2015
Overheating imbalances and a big bust
Latvia joined the EU in seemingly good macroeconomic health and having pegged its currency to the Special Drawing Right (SDR) in
(45) Occasional Paper 120 issued by the European Commission Directorate-General for Economic and Financial Affairs EU Balance of Payments assistance for Latvia foundations of success httpseceuropaeueconomy_financepublicationsoccasional_paper2012op120_enhtm
36 | Quarterly Report on the Euro Area
1994 and then to the euro in 2005 was keen to join the euro area in January 2008 Upon entering the Exchange Rate Mechanism II (ERM II) on 2 May 2005 the authorities unilaterally committed to maintaining a smaller fluctuation margin of plusmn1 around the central rate ndash seen as a sign of the countryrsquos determination to join the euro area The Latvian economy was the fastest growing in the EU between 2000 and 2007 and between 2005 and 2007 real GDP growth reached a yearly average of over 10 Following accession to the EU in 2004 Latvia along with other EU countries witnessed a rapid credit expansion Loans to residents grew at an average annual rate of close to 50 between 2004 and 2008 a reflection of the excess liquidity at that time and of the resulting hot money inflows into central and eastern European economies which were rapidly converging with their western European counterparts Foreign investment exploded driven by commercial banksrsquo mispricing of risk and over-optimistic expectations of convergence A number of privatisation deals and most importantly a burgeoning real-estate market characterised by soaring prices also served to attract foreign investors The tradable sector was meanwhile largely neglected By way of illustration foreign direct investment (FDI) reached relatively high levels of 84 and 81 of GDP in 2006 and 2007 respectively but most of this was directed towards the real-estate market while the proportion of total FDI relating to manufacturing was only 12 in 2013 Significant imbalances were accumulating as indicated by a current account deficit that reached around 22 of GDP in 2006 and 2007 and by labour market tightening Nominal wages doubled between 2004 and 2007 increasing much faster than productivity and thus damaging international competitiveness
By early 2008 more cautious bank lending had caused economic growth to slow significantly By autumn of the same year this slowdown had developed into a strong contraction reflecting the wider global economic situation The global economy fell into recession commodity prices reached record highs and the general risk aversion seen in global markets following the collapse of Lehman Brothers cut off Latviarsquos access to financial markets The second largest domestic bank Parex had to be rescued Latvia ultimately experienced the most severe GDP contraction of all EU countries at close to 18 in 2009 The government deficit threatened to spiral out of control Having been at 03 of GDP in 2007 and 42 in 2008 in spring 2009 it was projected to
reach levels well above 15 of GDP by the end of year in the absence of a significant consolidation package
Faced with an economic crisis of this order Latvia agreed a medium-term financial assistance programme the balance of payments programme (BoP) with the EU and the IMF in December 2008 (46) The aim of this was to preserve the existing exchange-rate arrangement The assistance offered to Latvia was made subject to a number of policy conditions relating to fiscal consolidation financial sector stabilisation and the introduction of a wide range of structural reforms including a significant acceleration in the absorption of EU structural funds The Latvian government also undertook to strengthen the social safety net so as to protect the most vulnerable from the effects of the crisis
Brave measures in difficult times
Given that the exchange rate was at that time pegged to the euro some economists suggested devaluation as the only way out of the crisis The national authorities and international partners did not see that as a viable option however because its effectiveness would have been severely limited by the degree to which imports were used in the manufacture of exports and the high proportion of foreign liabilities Furthermore it would have brought with it the risk of mass bankruptcy and a partial collapse of the domestic banking system at a time when the judicial system was clearly not capable of coping with such a fall-out In addition devaluation would have provided no incentive to solve Latviarsquos structural problems including weak fiscal governance the unsustainability of pension expenditure loss-making state-owned banks a lack of competitiveness and weak institutions
Between 2009 and 2011 the Latvian government carried out an ambitious programme of fiscal adjustment designed to correct the previously loose fiscal policy the weaknesses of which had been hidden by the countryrsquos strong economic growth This difficult adjustment restored Latviarsquos public finances to better health and established a
(46) Funds available from EU countries IMF World Bank EBRD
and Norway amounted to euro 75 billion of which Latvia used euro 45 billion (60) with euro 29 billion lent by the European Commission on behalf of the EU The first tranche of EUR 1 billion (13 of the total) was repaid by Latvia on 25 March 2014
II Special topics on the euro area economy
Volume 13 No 1 | 37
framework which would be sustainable in the long term The nominal balance improved with the deficit being cut from 98 of GDP in 2009 to 13 of GDP in 2012 and 2013 (see graph II31) The structural deficit also fell from its peak of 55 of GDP in 2008 to around 025 of GDP in 2012 and 2013 beating Latviarsquos medium-term objective of -05 of GDP as set in the convergence programmes
Latviarsquos fiscal consolidation measures were undoubtedly bold with fiscal savings equivalent to around 17 of GDP implemented within three years The measures were frontloaded and half of these savings were implemented in the first year alone The measures were on the whole expenditure-oriented with over half of the savings coming from cuts to health education and public administration budgets The most notable measure relating to revenue was an increase in VAT from 18 to 22 The consolidation strategy was eventually successful in containing the adverse effects of the budget deficit on the economy In fact it even appears to have triggered lsquonon-Keynesianrsquo effects on demand by restoring confidence and stimulating demand and investment at the point when it was most needed (47)
Graph II31 Latviarsquos government budget balance and debt (2008-15 of GDP)
Source DG ECFIN Commissionrsquos spring 2013 forecast
The fiscal framework was also strengthened significantly by the law on fiscal discipline coming into force in March 2013 and the creation of a fiscal council in January 2014 The signing of the
(47) Ibid see Chapter 4 Fiscal consolidation in the midst of the crisis
Treaty on Stability Coordination and Governance in the EMU (48) in March 2012 provided further EU-level support for the national fiscal framework
An additional factor that was critical to the success of the consolidation strategy but is often overlooked was the availability of significant EU funds (particularly from around 2009 onwards) which acted as a much-needed demand trigger in sectors affected by the decline in economic activity Between 2007 and 2013 Latvia benefited from the third highest allocation of EU funds after Hungary and Lithuania receiving a yearly average equivalent to around 28 of GDP or 70 of gross fixed capital formation(49) As on average every euro of national budget spending was supplemented by five to six euros co-financing from EU funds national expenditure on items such as road and public building construction vocational education and training of unemployed science infrastructure development and healthcare was often replaced by Structural funds financing despite being in conflict with the EU funds additionality principle Clearly such large inflows of EU financing also generated substantial tax revenues in particular VAT at a time when private consumption was weak
The Latvian labour market demonstrated a high level of flexibility during the crisis thanks in part to a decentralised wage-setting system Significant public-sector wage cuts indirectly supported nominal wage reduction in the private sector in 2009 and 2010 when earnings per employee fell by a total of 19 over two years Employment levels fell sharply especially in the private sector as jobs were cut in construction and manufacturing The unemployment rate reached around 20 in early 2010 but had fallen back to 119 by 2013 due mainly to growth in employment with the participation rate also increasing significantly over this period The projection from the Commissionrsquos 2014 winter forecast shows wages in 2014-15 growing broadly in line with productivity although the labour market is tightening and structural problems in particular regional differences and skill mismatches could create pressures in the economy
(48) httpeuropean-councileuropaeumedia639235st00tscg26_en12pdf
(49) Source Directorate-General for Regional Policy Infoview
38 | Quarterly Report on the Euro Area
External cost competitiveness has improved noticeably since 2008 with labour costs falling significantly and labour productivity in particular in the tradable sector increasing In 2008 the real effective exchange rate (REER) adjusted for unit labour costs reached a peak of 64 above the 2000 level before falling by about 20 in 2009-10 since when it has remained broadly stable (see graph II32) This level of REER is considered sustainable as the country has been seen to be steadily gaining market share over recent years (including as measured by exports adjusted for the growth of markets) The percentage of the countryrsquos GDP attributable to exports rose to 60 in 2013 from 43 in 2007 with some 60 of exports destined for the EU and 12 for Russia
Graph II32 Effective exchange rates Latvia v 35 trading partners
(Jan 2007-Dec 2013 monthly avg 2007 = 100)
Source DG ECFIN
The social burden of economic adjustment has admittedly been high in Latvia despite the policy measures contained in the Memorandum of Understanding stipulating inter alia establishment of a comprehensive social safety net supporting local governments in providing social assistance and discounting social payments from overall budget targets High unemployment has led to a wave of emigration to richer EU countries which coupled with Latviarsquos low fertility and high death rates has seen the population decrease by 8-10 since 2008 Net emigration has now fallen substantially however since the peak of the crisis years The rates of poverty and social exclusion in Latvia are among the highest in the EU families with children unemployed people people with disabilities and people living in rural areas are particularly at risk The countryrsquos spending on
social protection and healthcare as a percentage of GDP is among the lowest in the EU Furthermore the social protection measures which do exist to reduce poverty tend to be ineffective highlighting the importance of a robust social safety net It appears however that with the improved economic situation and increasing levels of general social awareness the authorities are finally starting to address the challenges of poverty and social exclusion with greater determination In recent years for example taxation of low-income earners has been cut slightly and child poverty has been reduced thanks to increases in various child-related benefits Proposals for reforms to social assistance in line with 2013 World Banks study are being gradually implemented Better targeted more effective policies relating to the active labour market mostly financed by the European Social Fund are helping unemployed people in particular the long-term unemployed and young people to find work or to obtain relevant training
As part of the BoP programme and in the context of the assessment of Latviarsquos readiness to join the euro area financial supervision has been tightened and EU resources for supervision and monitoring increased in particular for monitoring the growing non-resident banking sector Additional liquidity and capital adequacy requirements for non-resident banks were introduced in 2013 regular on- and off-site checks of these banks are being performed the deposit guarantee fund has been further strengthened and monitoring has been stepped up in relation to pledged assets and the origin of funds in bank recapitalizations This strengthened regulatory policy has been introduced partly as a result of lessons learnt at significant cost in the past five years most notably with the Parex and Krajbanka failures
Latvia has implemented a series of ambitious reforms to the business environment in recent years with the aim of reducing start-up costs simplifying procedures for property registration construction permits and tax collection and introducing out-of-court settlement of insolvencies In doing so Latvia has brought its regulatory framework a significant step closer to what is regarded as best practice In the World Bankrsquos 2014 Doing Business report Latvia was ranked 25th out of 185 countries with only four euro-area members faring better
II Special topics on the euro area economy
Volume 13 No 1 | 39
Conclusion
The origins of Latviarsquos years of boom and bust can be traced back to the domestic regional and global circumstances at that time globally excess liquidity and hot money flowing into vulnerable countries regionally unrealistic expectations of income convergence in central and eastern Europe and domestically undue optimism about growth in personal incomes and mispricing of risk by commercial banks amplified by the behaviour of both policymakers and individuals
A broad range of country-specific and general economic factors have contributed to the successful economic adjustment seen in Latvia since the height of the crisis Ambitious front-loaded and largely expenditure-based fiscal consolidation helped to contain the budget deficit whilst the confidence generated by the introduction of a credible programme itself aided the economic recovery The flexibility of the labour market meanwhile helped companies to restore competitiveness by means of wage reductions and job cuts Competitiveness was also improved by steps taken to shift the tax burden from labour to consumption and property The recovery in Latvia was very much export-driven with the growth in exports made possible by the openness of the economy and the faster-than-expected economic growth experienced by major trading partners A number of structural reforms including bank restructuring and measures improving the use of EU funds have contributed to the development of a more favourable business environment A generous allocation from the European structural funds meanwhile helped to boost public investment and supported financing and reforms in many important sectors Above all the success of the recovery measures implemented in Latvia proved that for a tough internal economic adjustment to be effective there needs to be both a determined political will to carry out unpopular reforms and also a fully-developed comprehensive social safety net to protect more vulnerable groups
in society during difficult times In addition Latvia benefited from the fact that those looking for work were able to migrate to other EU countries which helped to alleviate the social tension created by the effects of the crisis Some of the lessons above are clearly applicable to other Member States undergoing challenging economic adjustment while others are more Latvia-specific
While Latviarsquos current level of economic growth is regarded as sustainable (50) and the adoption of the euro is recognised as a significant and hard-earned achievement it is not the end of the road The current robust economic situation should be used to advance reforms and improve Latvias long-term growth potential rather than lead to complacency and relaxation of reform efforts Sustainable convergence of the economy in the longer term will require inter alia ongoing commitment to prudent fiscal policies (there are some recent signs of less prudent fiscal decision-making) a continuous use of macro-prudential tools to reduce risks from growing non-resident financial flows especially in view of recent Ukraine events and the implementation of reforms in a number of vested-interest-heavy areas These include higher education and science state owned enterprise management electricity and gas market liberalization and the judiciary including insolvency framework But above all and in order to ensure economic and social sustainability for years to come high rates of poverty social exclusion and dismal demographic trends need to be addressed boldly These and other structural challenges are being addressed by the Commission under the European Semester and the Post Program Surveillance frameworks Also Latvia has joined a euro area that is very different from what it was just a few years ago the euro area economic governance framework has been greatly strengthened entailing stricter obligations
(50) The Commissionrsquos alert mechanism reports issued under the Macroeconomic Imbalance Procedure have not identified economic imbalances in Latvia requiring further in-depth investigation for possible policy action
httpeceuropaeueurope2020pdf2014amr2014_enpdf
40 | Quarterly Report on the Euro Area
II4 Corporate balance sheet adjustment in the euro area and the United States (51)
This section compares balance sheet adjustment in the non-financial corporate sector in the euro area and the United States It shows that the adjustment since the crisis has been faster in the latter Despite similar steep rises in corporate debt in pre-crisis years US corporations have cut debt more than those in the euro area Shifts from loans to bonds and extensions of debt maturity have also been more pronounced in the United States Much of the difference in balance sheet consolidation can be traced back to more positive profitability trends providing US firms with the internal funds necessary to adjust balance sheets Differences in dividend distribution strategies and in corporations physical investment behaviours also played a role Profitability differences reflect differences both in cyclical conditions and labour market adjustment Comparatively slow progress in balance sheet consolidation is likely to weigh on investment recovery in the euro area
-----------------------
Introduction
Both the euro area and the United States experienced a surge in corporate indebtedness in the years preceding the global financial crisis and in its early stages The ratio of debt to gross value added by non-financial corporations (NFCs) rose by about 40 pp between 2005 and 2009 Deteriorating growth prospects and changing attitudes to risk have prompted NFCs in both economies to adjust their balance sheets As previously argued in the Quarterly Report balance sheet adjustment can have a substantial effect on economic activity and it is important to monitor regularly the ongoing adjustment in the euro area (52) This section contributes to the monitoring by comparing progress in corporate deleveraging in the euro area and in the United States two regions where firms entered the crisis with excessive debt
(51) Section prepared by Plamen Nikolov (52) See European Commission (2010) Focus Balance sheet
adjustment in the corporate sector Quarterly Report on the Euro Area Vol9 (3) pp 9-19 A more detailed overview of the literature on the impact of balance sheet adjustment can be found in Cuerpo C I Drumond J Lendvai P Pontuch and R Raciborski (2013) Indebtedness deleveraging dynamics and macroeconomic adjustment European Economy Economic Papers 477
Firms consolidate their balance sheets primarily by raising their net lendingborrowing (NLB) ie the cash obtained from their production activity and available for financial operations (53) A rise in NLB is achieved either by increasing savings or cuttingpostponing physical investment Firms increase savings by raising profits and reducing the dividends distributed to shareholders In firmsrsquo financial accounts a rise in corporate NLB is associated with a rise in financial assets andor a cut in financial liabilities The section reviews recent developments in euro area and US profitability savings and NLB and looks at the instruments that the corporate sector has used to consolidate its balance sheet on both the asset and the liability side
Corporate profits have disappointed in the euro area hellip
National account data show that corporate profitability in the euro area reached a pre-crisis peak in 2007Q3 ie later than in the United States where it had already started to decline in 2007 (54)
Graph II41 NFC profitability euro area and US
(2000Q1-2013Q3 of GVA)
20
25
30
35
40
45
00Q1 01Q3 03Q1 04Q3 06Q1 07Q3 09Q1 10Q3 12Q1 13Q3
Euro area (1)
US
(1)Excluding Latvia Source Eurostat US Bureau of Economic Analysis DG ECFIN calculations
(53) Firms can also consolidate their balance sheets by raising equity (54) Profitability like the other national account variables for the
corporate sector presented in this section is measured as a proportion of corporate sector activity represented by gross value added (GVA) It is calculated as the gross operating surplus plus financial revenues and subsidies and minus financial and tax expenses Financial expenses do not include earnings distributed to shareholders
II Special topics on the euro area economy
Volume 13 No 1 | 41
The 2008-09 recession brought a sharp drop in corporate profitability in the euro area Profitability recovered briefly in 2010 to reach a new peak in 2011 but has declined again since then (Graph II41) In the United States the impact of the crisis was rather muted with profits recovering vigorously after 2008 As a ratio to gross value added (GVA) US corporate profits had already passed their pre-crisis level in 2009 before flattening out in the past two years Overall by 2013 profitability in the euro area was still about 2 pp below its pre-crisis peak while in the United States it stood around 3 pp above
hellip mostly due to weak operating surplus
The disappointing profit performance in the euro area relative to the United States is largely due to differing developments in gross operating surplus Looking at the breakdown of the contribution to the cumulative change in corporate profitability since the start of the crisis there is a marked difference between firms in the euro area and those in the United States (Graphs II42 and II43) (55)
Graph II42 Profitability breakdown of NFCs euro area (1)
(cumulative change in from 2007Q3 peak to 2013Q3)
35
36
37
38
39
40
41
42
-100
-80
-60
-40
-20
0
20
40
60
80
100
07Q4 08Q4 09Q4 10Q4 11Q4 12Q4
Taxes (lhs)
Other net current transfers received (lhs)
Net property income received excl dividends paid (lhs)
Operating surplus (lhs)
Profits(rhs)(2)
(1)Excluding Latvia(2)Profits in of GVA Source Eurostat DG ECFIN calculations
In the euro area a fall in the ratio of operating surplus to GVA dragged overall profitability down after 2008 Despite an improvement in 2011 in
(55) The illustration of the contributions to the cumulative change in profitability only serves to depict the relative importance of the various components of the change in profits since the crisis The starting point for the cumulative change should not be interpreted as a reference point for a desirable profit recovery
2013 operating surplus was still contributing negatively to the cumulative change in profitability since the pre-crisis peak In contrast operating surplus in the United States responded to the crisis earlier than in the euro area but its contribution to the change in profits remained positive
Graph II43 Profitability breakdown of NFCs US
(cumulative change in from 2005Q3 peak to 2013Q3)
24
25
26
27
28
29
30
31
-100
-80
-60
-40
-20
0
20
40
60
80
100
05Q4 06Q4 07Q4 08Q4 09Q4 10Q4 11Q4 12Q4
Taxes (lhs)Other net current transfers received (lhs)Net property income received excl dividends paid (lhs)Operating surplus (lhs)Profits(rhs)(2)
(1) Profits in of GVA Source Federal Reserve Board US Bureau of Economic Analysis DG ECFIN calculations
Unlike operating surplus income tax payments and net income from non-operational activities did not differ significantly between the euro area and the United States (56) In both economies lower corporate tax payments resulting from lower profits generated by NFCs naturally had a positive impact on the cumulative change in profits from the pre-crisis peak
Differences in labour market developments are at the root of differences in profitability
Differences in operating surplus and profitability between the United States and the euro area can be attributed partly to differences in the business cycle In 2011Q1 NFCsrsquo gross value added was still 12 below its pre-crisis peak in the euro area but 11 above in the United States The main channel through which cyclical developments can affect operating surplus is the labour market
(56) In fact the ratio of profit tax payments to profits (a crude measure of an aggregate tax rate) in the euro area and the United States has been almost the same since the start of the crisis falling substantially in 2008-09 indicating that tax policy was not more favourable for profits in one economy than in the other
42 | Quarterly Report on the Euro Area
The cyclicality of operating surplus depends on the impact of the cycle on labour productivity as well as on wages The worse performance of operating surplus in the euro area since 2008 as compared with that in the United States reflects a stronger deterioration in labour productivity accompanied by unfavourable developments in wages per employee
Labour productivity growth in the euro area turned sharply negative in 2009 opening a big gap with the positive (albeit modest) wage growth (Graph II44) In the United States on the other hand labour productivity growth became negative earlier but to a lesser extent and some downward wage adjustment took place in 2009
Graph II44 Labour productivity and wages euro area and US
(2001Q4-2013Q3 y-o-y change)
-4
-3
-2
-1
0
1
2
3
4
5
01Q4 03Q2 04Q4 06Q2 07Q4 09Q2 10Q4 12Q2
Average wage per employee euro area (1) (2)Average wage per employee US (1)Labour productivity euro area (2) (3)Labour productivity US (3)
(1)Real wages calculated by the GDP deflator(2)Euro area excluding Latvia(3)In terms of total employment (thousands) Source Eurostat US Bureau of Economic Analysis US Bureau of Labour Statistics DG ECFIN calculations
There are a number of reasons for the different labour adjustments in the euro area and the United States In the former apart from a higher level of employment protection short-term work schemes were put in place in the early stages of the crisis (57) In addition as labour force adjustment tends to be more costly in the euro area some firms (particularly small firms and those with highly qualified employees) preferred to retain their
(57) According to the OECD Public short-term work schemes have
played an important role in preserving jobs during the crisis in a number of countries although significant hours reductions were also achieved via lower overtime hours hours averaging arrangements and employer initiatives see OECD Employment Outlook 2010 ndash Moving Beyond the Job Crisis
labour force (58) Because of a lack of wage flexibility the higher degree of lsquolabour hoardingrsquo in the euro area came at the expense of lower operating surplus and profits and consequently put a downward pressure on the capacity accumulate internal funds to deleverage
Corporate savings are much lower in the euro area
Negative developments in euro area corporate profitability were reflected in corporate savings which together with physical investment determines the internal funds available for balance sheet adjustment In 2009-10 there was a sharp drop in euro area savings because profits acted as shock absorbers and fell more rapidly than dividend payments leaving less spare cash available In contrast savings by US NFCs increased substantially on rising profits after an early-crisis low point and reached a historically high level of around 23 of GVA in 2010Q3 (Graph II45)
Graph II45 Savings of NFCs (2000Q1- 2013Q3 of GVA)
15
16
17
18
19
20
21
22
23
24
00Q1 01Q3 03Q1 04Q3 06Q1 07Q3 09Q1 10Q3 12Q1 13Q3
Euro area (1)
US
(1)Euro area excluding Latvia Source Eurostat Bureau of Economic Analysis DG ECFIN calculations
The impression that US corporate behaviour has been more geared towards accumulating savings than that in the euro area is reinforced when one looks at dividend distribution Dividends paid by euro area NFCs have been on a declining trend since the start of the crisis but those paid by US firms have also decreased This is remarkable given (58) See Box 12 Labour hoarding across different types of firms in
OECD Employment Outlook 2010 ndash Moving Beyond the Job Crisis
II Special topics on the euro area economy
Volume 13 No 1 | 43
the positive profit developments in the United States (Graph II46) A drop in dividends alongside profit growth suggests that after 2008 US companies preferred to direct a bigger proportion of the profit recovery to corporate savings and thereby balance sheet adjustment The ratio of dividends to profits in the United States has fallen from about one third before the crisis to one quarter now This ratio also dropped in the euro area although by less (59)
Graph II46 Dividends paid of NFCs (2000Q1-2013Q3 of GVA)
0
5
10
15
20
25
00Q1 01Q3 03Q1 04Q3 06Q1 07Q3 09Q1 10Q3 12Q1 13Q3
Euro area (1)
US
(1)Euro area excluding Latvia Source Eurostat Federal Reserve Board DG ECFIN calculations
Disappointing physical investment in the euro area and the United States
Cutting investment in physical assets is another way of reducing excessive indebtedness Corporate investment as a proportion of activity dropped sharply both in the euro area and in the United States in the early stages of the crisis (Graph II47)
After a modest recovery in 2010-11 the investment rate decreased again in the euro area The investment recovery was more solid in the United States but has lost momentum since the end of 2012 and the investment rate remains below its pre-crisis peak Overall it seems that euro area corporations partly compensated for less supportive savings developments than in the US by
(59) Dividend payments are not the only way of distributing profits to shareholders Equity buybacks can also be used for this purpose and firms that choose this option will tend to have higher savings and lower dividends paid
curbing physical investment more than their US counterparts
Graph II47 Investment of NFCs (2000Q1- 2013Q3 of GVA)
15
16
17
18
19
20
21
22
23
24
00Q1 01Q3 03Q1 04Q3 06Q1 07Q3 09Q1 10Q3 12Q1 13Q3
Euro area (1)
US
(1)Excluding Latvia Source Eurostat US Bureau of Economic Analysis DG ECFIN calculations
A more modest increase in net lending in the euro area than in the US
Since 2013 firmsrsquo net lending in the euro area has been in positive territory but substantially less so than that in the United States (Graph II48) Positive NLB in the euro area unlike that in the United States is mostly due to a low investment rate alone rather than low investment combined with high savings The combination of disappointing investment and high savings has translated into historically high and sustained NLB for US firms
This persistent net lending position in the United States is atypical as firms usually invest more than they save It suggests that US firms have been adjusting their balance sheets significantly since the beginning of the crisis via their internal funds while euro area firms seem to have opted for much slower balance sheet adjustment
44 | Quarterly Report on the Euro Area
Graph II48 Net lendingborrowing of NFCs
(2000Q1- 2013Q3 of GVA)
-10
-8
-6
-4
-2
0
2
4
6
8
00Q1 01Q3 03Q1 04Q3 06Q1 07Q3 09Q1 10Q3 12Q1 13Q3
Euro area (1)
US
(1)Excluding Latvia Source Eurostat US Bureau of Economic Analysis DG ECFIN calculations
Debt deleveraging has been more pronounced in the US than in the euro area
The faster pace of adjustment of balance sheets in the United States is confirmed by the corporate debt data (Graph II49) (60) (61) While both the euro area and the United States entered the crisis with swiftly rising and historically high levels of debt deleveraging has progressed more rapidly in the latter since the crisis By the beginning of 2012 US corporate debt had fallen by approximately 15 pp as a proportion of activity while euro area debt had dropped by 7 pp (62)
(60) Non-financial corporate debt consists of loans and securities
other than shares (corporate bonds) both can be classified as short- or long-term depending on whether their original maturity is less or more than one year
(61) This section analyses developments in non-consolidated financial flows and stocks in the euro area and in the United States for two reasons it is important to have a sense of financial positions within the institutional sector eg loans between NFCs are an important part of intra-firm relationships as head offices use them to finance subsidiaries for example perhaps for tax reasons This is relatively more important in the euro area than in the United States Consolidated financial asset and flow data eliminate these intra-sector positions and different approaches may be taken to consolidation as in the euro area there is the additional issue of cross-border consolidation between Member States while there is no need for flows and positions between firms in different US states to be treated separately
(62) The debt-to-equity ratio is another measure of corporate leverage widely followed by investors Faster stock market recovery helped US firms reduce this ratio more than those in the euro area
Graph II49 Debt levels of NFCs(1) (1999Q1-2013Q3 of GVA)
100
120
140
160
180
200
220
99Q1 00Q3 02Q1 03Q3 05Q1 06Q3 08Q1 09Q3 11Q1 12Q3
Euro area (2)
US
(1)Securities other than shares and loans(2)Excluding Latvia Source Eurostat US Bureau of Economic Analysis DG ECFIN calculations
Firms in the euro area and the United States entered the crisis with almost the same level of short-term debt as a proportion of total debt Since the crisis the adjustment away from short-term debt has been significantly more pronounced in the United States suggesting more active balance sheet restructuring
Graph II410 Debt flows of NFCs(1) (1999Q1- 2013Q3 of GVA)
-15
-10
-5
0
5
10
15
20
99Q1 01Q1 03Q1 05Q1 07Q1 09Q1 11Q1 13Q1
Euro area bonds (2)
US bonds
Euro area loans (2)
US loans
(1)Securities other than shares and loans (2)Excluding Latvia Source Eurostat US Bureau of Economic Analysis DG ECFIN calculations
Due to differences in the structure of corporate finance loans (as opposed to bonds) tend to form a bigger proportion of debt in the euro area than in the United States An important element of the
II Special topics on the euro area economy
Volume 13 No 1 | 45
corporate balance sheet adjustment process in both economies has been a movement away from an excessive reliance on loans (Graph II410) and towards bond financing This trend has been substantially more pronounced in the United States presumably reflecting the fact that bond markets are more developed in that country
Developments in non-financial corporate debt were also influenced by developments in financial intermediation in particular in the banking sector Financial accounts show NFCsrsquo debt exposure but do not indicate whether the debt holder is a bank According to bank balance sheet statistics the nominal growth of loans vis-agrave-vis NFCs has been mostly negative in the euro area since 2009Q4 (Graph II411) Coupled with the positive loan inflows seen in the national accounts between 2010Q3 and 2012Q3 (Graph II410) this shows a degree of substitution in corporate loan liability ownership between banks and other financial firms and sectors (including other NFCs) in this period According to the counterparty breakdown of NFC domestic loans published by the ECB corporate borrowings from other NFCs represented 29 of all loans by 2013Q3 (up from 26 in 2008Q1) while the proportion of borrowings from monetary financial institutions (MFIs) had dropped (from 60 in 2008Q1) to an all-time low of 53 The proportion of loans from other non-bank financial intermediaries also increased There is less evidence of a shift from banks to other loan providers in the United States where loans between NFCs are much more limited
Graph II411 Bank loans to NFCs (1999Q1- 2013Q3 y-o-y change)
-20
-15
-10
-5
0
5
10
15
20
25
99Q1 00Q3 02Q1 03Q3 05Q1 06Q3 08Q1 09Q3 11Q1 12Q3
Euro area bank loans to NFCs (1)US bank loans to NFCs
(1)Excluding Latvia Source ECB US Federal Reserve Board DG ECFIN calculations
Positive NLB has been used to acquire safe financial assets in both regions
In both the euro area and the United States the positive NLB has been used to deleverage but also to invest in safe financial assets At the beginning of the crisis much of the positive corporate NLB in the United States was invested in money market mutual funds which is essentially investment in short-term low-risk assets (Graph II412) (63)
Currency and deposits (another type of safe asset) have increased substantially in the euro area in recent years as a proportion of total firm activity (Graph II413) This rise was driven almost exclusively by a rapid increase in firmsrsquo savings deposits To some extent a similar trend is observable in the United States In particular US cash balances (a sub-component of currency and deposits) approached 12 of GVA by the end of 2013 a level not seen since the early 1990s On the other hand savings deposits have grown more modestly resulting in a moderately positive overall trend in currency and deposits
Graph II412 Mutual fund shares of NFCs (1999Q1- 2013Q3 of GVA)
0
2
4
6
8
10
12
14
99Q1 01Q1 03Q1 05Q1 07Q1 09Q1 11Q1 13Q1
Euro area (1)
US (2)
(1)Excluding Latvia(2)In the USA these asset series can be broken down into investment in money market mutual funds and investment in other mutual funds The 2009-11 increase is fully attributable to the former Source Eurostat US Bureau of Economic Analysis DG ECFIN calculations
Overall these two aspects of corporate financial investment behaviour signify considerable liquidity concerns on the part of firms in both the euro area
(63) Euro area financial accounts only show firmsrsquo investment in mutual funds overall and do not distinguish between types of mutual funds
46 | Quarterly Report on the Euro Area
and the United States They also represent a drive towards lower-risk assets perhaps indicating increased risk aversion by corporations or a tendency to postpone physical investment in a context of perceived high uncertainty
Graph II413 Currency and deposits ndash NFCs
(1999Q1- 2013Q3 of GVA)
0
5
10
15
20
25
30
35
40
45
99Q1 00Q3 02Q1 03Q3 05Q1 06Q3 08Q1 09Q3 11Q1 12Q3
Euro area (1)
US
(1)Excluding Latvia Source Eurostat US Bureau of Economic Analysis DG ECFIN calculations
Conclusion
Although both regions saw similar steep rises in corporate debt in the pre-crisis years balance sheet adjustment since the crisis has been significantly slower in the euro area than in the United States The more rapid adjustment in the United States can be explained by a stronger cyclical recovery more supportive profitability developments and reduced dividend payment ratios In the euro area profitability has been hindered by a combination of lower flexibility in the labour markets and slow wage adjustment
The slower balance sheet adjustment in the euro area corporate sector is visible in a slower fall in indebtedness but also a slower adjustment of the structure of balance sheets In particular the shift from loans to bonds and the extension of debt maturity have been more pronounced in the United States In both regions firms have used their positive NLB to accelerate the accumulation of safe and liquid financial assets This could reflect continuing uncertainty regarding future demand and growth prospects
Overall the evidence discussed in this section shows that euro area firms are lagging significantly behind their US counterparts in terms of balance sheet consolidation Given that investment rates remain disappointing even in the more advanced US corporate sector a degree of caution appears warranted when assessing short-term prospects for corporate investment in the euro area
III Recent DG ECFIN publications
Volume 13 No 1 | 47
1 Occasional Papers
European Economy Occasional Papers 170 January 2014 Financial Assistance Programme for the Recapitalisation of Financial Institutions in Spain Fifth Review ndash Winter 2014 httpeceuropaeueconomy_financepublicationsoccasional_paper2014pdfocp170_enpdf
European Economy Occasional Papers 169 December 2013 The Economic Adjustment Programme for Cyprus Second Review ndash Autumn 2013 httpeceuropaeueconomy_financepublicationsoccasional_paper2013pdfocp169_enpdf
European Economy Occasional Papers 168 December 2013 Fiscal frameworks in the European Union ommission services country factsheets for the Autumn 2013 Peer Review httpeceuropaeueconomy_financepublicationsoccasional_paper2013pdfocp168_enpdf
European Economy Occasional Papers 167 December 2013 Economic Adjustment Programme for Ireland - Autumn 2013 Review httpeceuropaeueconomy_financepublicationsoccasional_paper2013pdfocp167_enpdf
European Economy Occasional Papers 166 December 2013 Progress towards meeting the economic criteria for EU accession the EU Commissionrsquos 2013 assessments httpeceuropaeueconomy_financepublicationsoccasional_paper2013pdfocp166_enpdf
European Economy Occasional Papers 165 November 2013 Romania Balance-of-Payments Assistance Programme 2013-2015 httpeceuropaeueconomy_financepublicationsoccasional_paper2013pdfocp165_enpdf
European Economy Occasional Papers 164 November 2013 The Economic Adjustment Programme for Portugal Eighth and Ninth Review httpeceuropaeueconomy_financepublicationsoccasional_paper2013pdfocp164_enpdf
European Economy Occasional Papers 163 November 2013 Financial Assistance Programme for the Recapitalisation of Financial Institutions in Spain Fourth Review ndash Autumn 2013 httpeceuropaeueconomy_financepublicationsoccasional_paper2013pdfocp163_enpdf
European Economy Occasional Papers 162 October 2013 Economic Adjustment Programme for Ireland Summer 2013 Review httpeceuropaeueconomy_financepublicationsoccasional_paper2013pdfocp162_enpdf
2 Economic papers
European Economy Economic Papers 514 February 2014 Martin Larch Kristin Magnusson Bernard Balint Tatar Hard work and More How to successfully conduct adjustment with official assistance httpeceuropaeueconomy_financepublicationseconomic_paper2014pdfecp514_enpdf
European Economy Economic Papers 513 February 2014 Florian Woumlhlbier Caterina Astarita Gilles Mourre Consolidation on the revenue side and growth-friendly tax structures an indicator based approach httpeceuropaeueconomy_financepublicationseconomic_paper2014pdfecp513_enpdf
48 | Quarterly Report on the Euro Area
European Economy Economic Papers 512 December 2013 Alexander Schwan Etienne Sail Assessing the economic and budgetary impact of linking retirement ages and pension benefits to increases in longevity httpeceuropaeueconomy_financepublicationseconomic_paper2013pdfecp512_enpdf 3 Other publications
Winter forecast 2014 - EU economy recovery gaining ground httpeceuropaeueconomy_financepublicationseuropean_economy2014pdfee2_enpdf 4 Regular publications
Business and Consumer Surveys (harmonised surveys for different sectors of the economies in the European Union (EU) and the applicant countries) httpeceuropaeueconomy_financedb_indicatorssurveysindex_enhtm Business Climate Indicator for the euro area (monthly indicator designed to deliver a clear and early assessment of the cyclical situation) httpeceuropaeueconomy_financedb_indicatorssurveysdocuments2013bci_2013_11_enpdf Key indicators for the euro area (presents the most relevant economic statistics concerning the euro area) httpeceuropaeueconomy_financedb_indicatorskey_indicatorsindex_enhtm Monthly and quarterly notes on the euro-denominated bond markets (looks at the volumes of debt issued the maturity structures and the conditions in the market) httpeceuropaeueconomy_financepublicationsbond_marketindex_enhtm Price and Cost Competitiveness httpeceuropaeueconomy_financedb_indicatorscompetitivenessindex_enhtm
50 | Quarterly Report on the Euro Area
Editor-in-Chief Elena Flores
Overall coordination Eric Ruscher
Data assistance Christos Zavos
Comments on the report would be gratefully received and should be sent to
Elena Flores Director ndash Policy Strategy and Coordination Directorate-General for Economic and Financial Affairs Office CHAR 1566
B-1049 Brussels
Email elenafloreseceuropaeu
or
Eric Ruscher Head of Unit ndash Macroeconomy of the euro area Directorate-General for Economic and Financial Affairs Office CHAR 15248
B-1049 Brussels
Email ericruschereceuropaeu
HOW TO OBTAIN EU PUBLICATIONS Free publications bull one copy
via EU Bookshop (httpbookshopeuropaeu) bull more than one copy or postersmaps
from the European Unionrsquos representations (httpeceuropaeurepresent_enhtm) from the delegations in non-EU countries (httpeeaseuropaeudelegationsindex_enhtm) by contacting the Europe Direct service (httpeuropaeueuropedirectindex_enhtm) or calling 00 800 6 7 8 9 10 11 (freephone number from anywhere in the EU) () () The information given is free as are most calls (though some operators phone boxes or hotels may charge you)
Priced publications bull via EU Bookshop (httpbookshopeuropaeu) Priced subscriptions bull via one of the sales agents of the Publications Office of the European Union
(httppublicationseuropaeuothersagentsindex_enhtm)
KC-AK-14-001-en-n
- Blank Page
- Blank Page
- Blank Page
- Blank Page
-

II Special topics on the euro area economy
Volume 13 No 1 | 31
Box (continued)
(Continued on the next page)
32 | Quarterly Report on the Euro Area
Box (continued)
II Special topics on the euro area economy
Volume 13 No 1 | 33
The recent crisis marked a watershed in the evolution of public compensations Between 1999 and 2007 relative government wage growth did not vary from cold-shower periods (or periods of more gradual fiscal consolidation) to periods of non-consolidation (42)
Graph II21 Change in the share of general government compensations to
total spending (2008-2012 in pp)
Source DG ECFIN calculations based on AMECO
Conversely starting with the 2008-2009 crisis compensations per employee in the government sector grew more slowly compared with those in the manufacturing sector and more clearly so during fiscal consolidation (Graph II22)
It is possible that under conditions of fiscal stress the relationship between government and export sector wages differs from that of normal periods This aspect has been neglected in previous analyses To shed some light on it Table II21 shows the correlation between government wage growth and manufacturing wage growth under alternative fiscal conditions (consolidation and non-consolidation) differentiating between countries with large and small public sectors The evidence shows that the two wages are closely related in periods of fiscal stress only if the government employs a large share of the labour forces This suggests that the possibility of
(42) By convention episodes of fiscal consolidation are defined as those during which the structural primary balance improves by at least 15 per cent of GDP in one year or at least 3 per cent in three years with a minimum improvement of 05 per cent in each year Such a definition makes it possible to distinguish between cases of cold-shower consolidation episodes and more gradual consolidation episodes
expenditure-based fiscal consolidation having the type of supply-side effects described in Alesina and Perotti (1997) Alesina et al (2002) and Ardagna (2004) may be a consequence of the size of the public sector among other things
Graph II22 Government and manufacturing compensations under
alternative fiscal conditions EU countries (1999-2007 and 2008-2012 avg annual change)
Source DG ECFIN calculations based on OECD
Table II21 Correlation between government and manufacturing
compensations growth under alternative fiscal conditions EU (1)
(1) Pearson correlation coefficients Sample EU countries (excluding AT BG CY DE EL LT LV MT RO SI) over 1980-2012 (1995-2012 in the case of CZ EE HU SK) Source DG ECFIN calculations based on OECD
Concluding remarks
Spillovers which are the result of high wages in the general government sector have been mentioned as one of the drivers of competitiveness losses in
34 | Quarterly Report on the Euro Area
some countries in the euro area before the crisis (43)
The results presented here speak to this debate and may be summarised as follows Government wage levels have a long-term impact on wages in the manufacturing sector even more so in countries in which the government sector employs a relatively large share of the labour force That said their short-term impact remains unaffected by the size of the public sector Looking at it the other way round manufacturing wages usually have a greater impact on government wages regardless of size This is arguably because private sector wage leadership is more common than public sector wage leadership
(43) Blanchard O (2007) Adjustment within the euro The difficult
case of Portugal in Portuguese Economic Journal 61 1-21
The way government wages are set also plays a role In collective bargaining systems not only are government and manufacturing wages related in both the long- and the short-term (as they are also when the government sets wages by unilateral decision) Also most importantly wages in the tradable sector are better aligned with labour productivity The evidence provided here indicates that if the government wage bill is inflated for example due to unjustified wage premia limiting public wage growth would spill over into the private export sector reducing labour costs and helping boost competitiveness and employment in the sector Whilst structural reforms including skill upgrading in manufacturing are an important and necessary ingredient for achieving non-reversible gains in competitiveness the adjustment of competitiveness through fiscal policy remains a complementary tool to deliver sustained external rebalancing
II Special topics on the euro area economy
Volume 13 No 1 | 35
II3 Latvia maintaining sustainable growth after the boom-bust years (44)
Latvia had been keen to join the euro area at the earliest opportunity with entry in January 2008 the clear target As the economy overheated however significant macro-economic imbalances accumulated which deferred these plans Between 2005 and 2007 unsustainable GDP growth went hand in hand with a mounting current account deficit and a housing market spiralling out of control When credit flows then abruptly reversed the countryrsquos GDP contracted dramatically Latvia was placed in the EUIMF-led financial assistance programme and was forced to carry out ambitious fiscal consolidation and structural reforms Reallocating resources to the tradable sector was the first important step on the road to an export-driven recovery Under the burden of deleveraging and consolidation the revival of domestic demand was slow at first From 2011 however supported by favourable labour market developments growth in demand has accelerated Latvia has reclaimed its position as the fastest-growing EU economy however the current level of growth is lower than the unstainable rates recorded in the boom years and it is now seen as sustainable Thanks to this balanced growth Latvia has not been subject to the MIP since its launch in 2012 Despite the financial assistance-supported measures to preserve equity the social burden of economic adjustment as evidenced by poverty social exclusion and emigration rates has been high but measures are being taken by the authorities to counter these effects Continued commitment to prudent fiscal policies will be critical for the countryrsquos economic future The use of macro-prudential tools to reduce the risks posed by large non-resident financial flows and the implementation of ambitious structural reforms will also play an important role
-----------------------
Introduction
To welcome Latvias recent adoption of the euro this section reviews the countrys recent boom-bust experience and discusses the challenges ahead
Five years ago it would have been difficult to imagine that Latvia would be able to fulfil the conditions for adopting the euro and enter the euro
(44) Section prepared by Gatis Eglitis and Christian Weise
area in January 2014 After EU accession in May 2004 significant macro-economic imbalances had started to accumulate on the back of an overheating economy and by autumn 2008 the country was on the brink of bankruptcy A painful and seemingly impossible economic adjustment to be achieved by means of internal devaluation lay ahead This would require unprecedented fiscal consolidation huge redundancies and difficult structural reforms threatening political and social stability Yet despite pronounced scepticism from the outset and particularly at the height of the crisis in mid-2009 the economy has moved back to growth The measures implemented took some time to take effect with the economy continuing to decline at first before picking up as seen in the lsquoVrsquo-shaped recovery but a protracted recession was avoided Latviarsquos GDP growth has exceeded expectations reaching levels of 54 in 2011 52 in 2012 and around 4 in 2013 The two factors that were critical to the countryrsquos economic recovery were a return to international competitiveness and the rapid correction of external imbalances The budget deficit decreased significantly and is expected to reach a balanced position in the near future The level of government debt is projected to stay around 40-42 of GDP in 2013-2014 and to decline to 33 of GDP in 2015 as the repayments to the EU take effect and sizable cash buffers will be reduced The financial assistance programme was successfully completed in January 2012 Financial support had not been necessary since October 2010 however and the government had re-entered international bond markets in June 2011 well ahead of schedule (45) As of 2013 GDP per capita in constant prices has returned to the level reached at its peak in 2007 Due to the decline in the population however the absolute value of GDP in constant prices was still about 9 below 2007 levels with current projections suggesting that a full recovery to the pre-crisis peak will be achieved in 2015
Overheating imbalances and a big bust
Latvia joined the EU in seemingly good macroeconomic health and having pegged its currency to the Special Drawing Right (SDR) in
(45) Occasional Paper 120 issued by the European Commission Directorate-General for Economic and Financial Affairs EU Balance of Payments assistance for Latvia foundations of success httpseceuropaeueconomy_financepublicationsoccasional_paper2012op120_enhtm
36 | Quarterly Report on the Euro Area
1994 and then to the euro in 2005 was keen to join the euro area in January 2008 Upon entering the Exchange Rate Mechanism II (ERM II) on 2 May 2005 the authorities unilaterally committed to maintaining a smaller fluctuation margin of plusmn1 around the central rate ndash seen as a sign of the countryrsquos determination to join the euro area The Latvian economy was the fastest growing in the EU between 2000 and 2007 and between 2005 and 2007 real GDP growth reached a yearly average of over 10 Following accession to the EU in 2004 Latvia along with other EU countries witnessed a rapid credit expansion Loans to residents grew at an average annual rate of close to 50 between 2004 and 2008 a reflection of the excess liquidity at that time and of the resulting hot money inflows into central and eastern European economies which were rapidly converging with their western European counterparts Foreign investment exploded driven by commercial banksrsquo mispricing of risk and over-optimistic expectations of convergence A number of privatisation deals and most importantly a burgeoning real-estate market characterised by soaring prices also served to attract foreign investors The tradable sector was meanwhile largely neglected By way of illustration foreign direct investment (FDI) reached relatively high levels of 84 and 81 of GDP in 2006 and 2007 respectively but most of this was directed towards the real-estate market while the proportion of total FDI relating to manufacturing was only 12 in 2013 Significant imbalances were accumulating as indicated by a current account deficit that reached around 22 of GDP in 2006 and 2007 and by labour market tightening Nominal wages doubled between 2004 and 2007 increasing much faster than productivity and thus damaging international competitiveness
By early 2008 more cautious bank lending had caused economic growth to slow significantly By autumn of the same year this slowdown had developed into a strong contraction reflecting the wider global economic situation The global economy fell into recession commodity prices reached record highs and the general risk aversion seen in global markets following the collapse of Lehman Brothers cut off Latviarsquos access to financial markets The second largest domestic bank Parex had to be rescued Latvia ultimately experienced the most severe GDP contraction of all EU countries at close to 18 in 2009 The government deficit threatened to spiral out of control Having been at 03 of GDP in 2007 and 42 in 2008 in spring 2009 it was projected to
reach levels well above 15 of GDP by the end of year in the absence of a significant consolidation package
Faced with an economic crisis of this order Latvia agreed a medium-term financial assistance programme the balance of payments programme (BoP) with the EU and the IMF in December 2008 (46) The aim of this was to preserve the existing exchange-rate arrangement The assistance offered to Latvia was made subject to a number of policy conditions relating to fiscal consolidation financial sector stabilisation and the introduction of a wide range of structural reforms including a significant acceleration in the absorption of EU structural funds The Latvian government also undertook to strengthen the social safety net so as to protect the most vulnerable from the effects of the crisis
Brave measures in difficult times
Given that the exchange rate was at that time pegged to the euro some economists suggested devaluation as the only way out of the crisis The national authorities and international partners did not see that as a viable option however because its effectiveness would have been severely limited by the degree to which imports were used in the manufacture of exports and the high proportion of foreign liabilities Furthermore it would have brought with it the risk of mass bankruptcy and a partial collapse of the domestic banking system at a time when the judicial system was clearly not capable of coping with such a fall-out In addition devaluation would have provided no incentive to solve Latviarsquos structural problems including weak fiscal governance the unsustainability of pension expenditure loss-making state-owned banks a lack of competitiveness and weak institutions
Between 2009 and 2011 the Latvian government carried out an ambitious programme of fiscal adjustment designed to correct the previously loose fiscal policy the weaknesses of which had been hidden by the countryrsquos strong economic growth This difficult adjustment restored Latviarsquos public finances to better health and established a
(46) Funds available from EU countries IMF World Bank EBRD
and Norway amounted to euro 75 billion of which Latvia used euro 45 billion (60) with euro 29 billion lent by the European Commission on behalf of the EU The first tranche of EUR 1 billion (13 of the total) was repaid by Latvia on 25 March 2014
II Special topics on the euro area economy
Volume 13 No 1 | 37
framework which would be sustainable in the long term The nominal balance improved with the deficit being cut from 98 of GDP in 2009 to 13 of GDP in 2012 and 2013 (see graph II31) The structural deficit also fell from its peak of 55 of GDP in 2008 to around 025 of GDP in 2012 and 2013 beating Latviarsquos medium-term objective of -05 of GDP as set in the convergence programmes
Latviarsquos fiscal consolidation measures were undoubtedly bold with fiscal savings equivalent to around 17 of GDP implemented within three years The measures were frontloaded and half of these savings were implemented in the first year alone The measures were on the whole expenditure-oriented with over half of the savings coming from cuts to health education and public administration budgets The most notable measure relating to revenue was an increase in VAT from 18 to 22 The consolidation strategy was eventually successful in containing the adverse effects of the budget deficit on the economy In fact it even appears to have triggered lsquonon-Keynesianrsquo effects on demand by restoring confidence and stimulating demand and investment at the point when it was most needed (47)
Graph II31 Latviarsquos government budget balance and debt (2008-15 of GDP)
Source DG ECFIN Commissionrsquos spring 2013 forecast
The fiscal framework was also strengthened significantly by the law on fiscal discipline coming into force in March 2013 and the creation of a fiscal council in January 2014 The signing of the
(47) Ibid see Chapter 4 Fiscal consolidation in the midst of the crisis
Treaty on Stability Coordination and Governance in the EMU (48) in March 2012 provided further EU-level support for the national fiscal framework
An additional factor that was critical to the success of the consolidation strategy but is often overlooked was the availability of significant EU funds (particularly from around 2009 onwards) which acted as a much-needed demand trigger in sectors affected by the decline in economic activity Between 2007 and 2013 Latvia benefited from the third highest allocation of EU funds after Hungary and Lithuania receiving a yearly average equivalent to around 28 of GDP or 70 of gross fixed capital formation(49) As on average every euro of national budget spending was supplemented by five to six euros co-financing from EU funds national expenditure on items such as road and public building construction vocational education and training of unemployed science infrastructure development and healthcare was often replaced by Structural funds financing despite being in conflict with the EU funds additionality principle Clearly such large inflows of EU financing also generated substantial tax revenues in particular VAT at a time when private consumption was weak
The Latvian labour market demonstrated a high level of flexibility during the crisis thanks in part to a decentralised wage-setting system Significant public-sector wage cuts indirectly supported nominal wage reduction in the private sector in 2009 and 2010 when earnings per employee fell by a total of 19 over two years Employment levels fell sharply especially in the private sector as jobs were cut in construction and manufacturing The unemployment rate reached around 20 in early 2010 but had fallen back to 119 by 2013 due mainly to growth in employment with the participation rate also increasing significantly over this period The projection from the Commissionrsquos 2014 winter forecast shows wages in 2014-15 growing broadly in line with productivity although the labour market is tightening and structural problems in particular regional differences and skill mismatches could create pressures in the economy
(48) httpeuropean-councileuropaeumedia639235st00tscg26_en12pdf
(49) Source Directorate-General for Regional Policy Infoview
38 | Quarterly Report on the Euro Area
External cost competitiveness has improved noticeably since 2008 with labour costs falling significantly and labour productivity in particular in the tradable sector increasing In 2008 the real effective exchange rate (REER) adjusted for unit labour costs reached a peak of 64 above the 2000 level before falling by about 20 in 2009-10 since when it has remained broadly stable (see graph II32) This level of REER is considered sustainable as the country has been seen to be steadily gaining market share over recent years (including as measured by exports adjusted for the growth of markets) The percentage of the countryrsquos GDP attributable to exports rose to 60 in 2013 from 43 in 2007 with some 60 of exports destined for the EU and 12 for Russia
Graph II32 Effective exchange rates Latvia v 35 trading partners
(Jan 2007-Dec 2013 monthly avg 2007 = 100)
Source DG ECFIN
The social burden of economic adjustment has admittedly been high in Latvia despite the policy measures contained in the Memorandum of Understanding stipulating inter alia establishment of a comprehensive social safety net supporting local governments in providing social assistance and discounting social payments from overall budget targets High unemployment has led to a wave of emigration to richer EU countries which coupled with Latviarsquos low fertility and high death rates has seen the population decrease by 8-10 since 2008 Net emigration has now fallen substantially however since the peak of the crisis years The rates of poverty and social exclusion in Latvia are among the highest in the EU families with children unemployed people people with disabilities and people living in rural areas are particularly at risk The countryrsquos spending on
social protection and healthcare as a percentage of GDP is among the lowest in the EU Furthermore the social protection measures which do exist to reduce poverty tend to be ineffective highlighting the importance of a robust social safety net It appears however that with the improved economic situation and increasing levels of general social awareness the authorities are finally starting to address the challenges of poverty and social exclusion with greater determination In recent years for example taxation of low-income earners has been cut slightly and child poverty has been reduced thanks to increases in various child-related benefits Proposals for reforms to social assistance in line with 2013 World Banks study are being gradually implemented Better targeted more effective policies relating to the active labour market mostly financed by the European Social Fund are helping unemployed people in particular the long-term unemployed and young people to find work or to obtain relevant training
As part of the BoP programme and in the context of the assessment of Latviarsquos readiness to join the euro area financial supervision has been tightened and EU resources for supervision and monitoring increased in particular for monitoring the growing non-resident banking sector Additional liquidity and capital adequacy requirements for non-resident banks were introduced in 2013 regular on- and off-site checks of these banks are being performed the deposit guarantee fund has been further strengthened and monitoring has been stepped up in relation to pledged assets and the origin of funds in bank recapitalizations This strengthened regulatory policy has been introduced partly as a result of lessons learnt at significant cost in the past five years most notably with the Parex and Krajbanka failures
Latvia has implemented a series of ambitious reforms to the business environment in recent years with the aim of reducing start-up costs simplifying procedures for property registration construction permits and tax collection and introducing out-of-court settlement of insolvencies In doing so Latvia has brought its regulatory framework a significant step closer to what is regarded as best practice In the World Bankrsquos 2014 Doing Business report Latvia was ranked 25th out of 185 countries with only four euro-area members faring better
II Special topics on the euro area economy
Volume 13 No 1 | 39
Conclusion
The origins of Latviarsquos years of boom and bust can be traced back to the domestic regional and global circumstances at that time globally excess liquidity and hot money flowing into vulnerable countries regionally unrealistic expectations of income convergence in central and eastern Europe and domestically undue optimism about growth in personal incomes and mispricing of risk by commercial banks amplified by the behaviour of both policymakers and individuals
A broad range of country-specific and general economic factors have contributed to the successful economic adjustment seen in Latvia since the height of the crisis Ambitious front-loaded and largely expenditure-based fiscal consolidation helped to contain the budget deficit whilst the confidence generated by the introduction of a credible programme itself aided the economic recovery The flexibility of the labour market meanwhile helped companies to restore competitiveness by means of wage reductions and job cuts Competitiveness was also improved by steps taken to shift the tax burden from labour to consumption and property The recovery in Latvia was very much export-driven with the growth in exports made possible by the openness of the economy and the faster-than-expected economic growth experienced by major trading partners A number of structural reforms including bank restructuring and measures improving the use of EU funds have contributed to the development of a more favourable business environment A generous allocation from the European structural funds meanwhile helped to boost public investment and supported financing and reforms in many important sectors Above all the success of the recovery measures implemented in Latvia proved that for a tough internal economic adjustment to be effective there needs to be both a determined political will to carry out unpopular reforms and also a fully-developed comprehensive social safety net to protect more vulnerable groups
in society during difficult times In addition Latvia benefited from the fact that those looking for work were able to migrate to other EU countries which helped to alleviate the social tension created by the effects of the crisis Some of the lessons above are clearly applicable to other Member States undergoing challenging economic adjustment while others are more Latvia-specific
While Latviarsquos current level of economic growth is regarded as sustainable (50) and the adoption of the euro is recognised as a significant and hard-earned achievement it is not the end of the road The current robust economic situation should be used to advance reforms and improve Latvias long-term growth potential rather than lead to complacency and relaxation of reform efforts Sustainable convergence of the economy in the longer term will require inter alia ongoing commitment to prudent fiscal policies (there are some recent signs of less prudent fiscal decision-making) a continuous use of macro-prudential tools to reduce risks from growing non-resident financial flows especially in view of recent Ukraine events and the implementation of reforms in a number of vested-interest-heavy areas These include higher education and science state owned enterprise management electricity and gas market liberalization and the judiciary including insolvency framework But above all and in order to ensure economic and social sustainability for years to come high rates of poverty social exclusion and dismal demographic trends need to be addressed boldly These and other structural challenges are being addressed by the Commission under the European Semester and the Post Program Surveillance frameworks Also Latvia has joined a euro area that is very different from what it was just a few years ago the euro area economic governance framework has been greatly strengthened entailing stricter obligations
(50) The Commissionrsquos alert mechanism reports issued under the Macroeconomic Imbalance Procedure have not identified economic imbalances in Latvia requiring further in-depth investigation for possible policy action
httpeceuropaeueurope2020pdf2014amr2014_enpdf
40 | Quarterly Report on the Euro Area
II4 Corporate balance sheet adjustment in the euro area and the United States (51)
This section compares balance sheet adjustment in the non-financial corporate sector in the euro area and the United States It shows that the adjustment since the crisis has been faster in the latter Despite similar steep rises in corporate debt in pre-crisis years US corporations have cut debt more than those in the euro area Shifts from loans to bonds and extensions of debt maturity have also been more pronounced in the United States Much of the difference in balance sheet consolidation can be traced back to more positive profitability trends providing US firms with the internal funds necessary to adjust balance sheets Differences in dividend distribution strategies and in corporations physical investment behaviours also played a role Profitability differences reflect differences both in cyclical conditions and labour market adjustment Comparatively slow progress in balance sheet consolidation is likely to weigh on investment recovery in the euro area
-----------------------
Introduction
Both the euro area and the United States experienced a surge in corporate indebtedness in the years preceding the global financial crisis and in its early stages The ratio of debt to gross value added by non-financial corporations (NFCs) rose by about 40 pp between 2005 and 2009 Deteriorating growth prospects and changing attitudes to risk have prompted NFCs in both economies to adjust their balance sheets As previously argued in the Quarterly Report balance sheet adjustment can have a substantial effect on economic activity and it is important to monitor regularly the ongoing adjustment in the euro area (52) This section contributes to the monitoring by comparing progress in corporate deleveraging in the euro area and in the United States two regions where firms entered the crisis with excessive debt
(51) Section prepared by Plamen Nikolov (52) See European Commission (2010) Focus Balance sheet
adjustment in the corporate sector Quarterly Report on the Euro Area Vol9 (3) pp 9-19 A more detailed overview of the literature on the impact of balance sheet adjustment can be found in Cuerpo C I Drumond J Lendvai P Pontuch and R Raciborski (2013) Indebtedness deleveraging dynamics and macroeconomic adjustment European Economy Economic Papers 477
Firms consolidate their balance sheets primarily by raising their net lendingborrowing (NLB) ie the cash obtained from their production activity and available for financial operations (53) A rise in NLB is achieved either by increasing savings or cuttingpostponing physical investment Firms increase savings by raising profits and reducing the dividends distributed to shareholders In firmsrsquo financial accounts a rise in corporate NLB is associated with a rise in financial assets andor a cut in financial liabilities The section reviews recent developments in euro area and US profitability savings and NLB and looks at the instruments that the corporate sector has used to consolidate its balance sheet on both the asset and the liability side
Corporate profits have disappointed in the euro area hellip
National account data show that corporate profitability in the euro area reached a pre-crisis peak in 2007Q3 ie later than in the United States where it had already started to decline in 2007 (54)
Graph II41 NFC profitability euro area and US
(2000Q1-2013Q3 of GVA)
20
25
30
35
40
45
00Q1 01Q3 03Q1 04Q3 06Q1 07Q3 09Q1 10Q3 12Q1 13Q3
Euro area (1)
US
(1)Excluding Latvia Source Eurostat US Bureau of Economic Analysis DG ECFIN calculations
(53) Firms can also consolidate their balance sheets by raising equity (54) Profitability like the other national account variables for the
corporate sector presented in this section is measured as a proportion of corporate sector activity represented by gross value added (GVA) It is calculated as the gross operating surplus plus financial revenues and subsidies and minus financial and tax expenses Financial expenses do not include earnings distributed to shareholders
II Special topics on the euro area economy
Volume 13 No 1 | 41
The 2008-09 recession brought a sharp drop in corporate profitability in the euro area Profitability recovered briefly in 2010 to reach a new peak in 2011 but has declined again since then (Graph II41) In the United States the impact of the crisis was rather muted with profits recovering vigorously after 2008 As a ratio to gross value added (GVA) US corporate profits had already passed their pre-crisis level in 2009 before flattening out in the past two years Overall by 2013 profitability in the euro area was still about 2 pp below its pre-crisis peak while in the United States it stood around 3 pp above
hellip mostly due to weak operating surplus
The disappointing profit performance in the euro area relative to the United States is largely due to differing developments in gross operating surplus Looking at the breakdown of the contribution to the cumulative change in corporate profitability since the start of the crisis there is a marked difference between firms in the euro area and those in the United States (Graphs II42 and II43) (55)
Graph II42 Profitability breakdown of NFCs euro area (1)
(cumulative change in from 2007Q3 peak to 2013Q3)
35
36
37
38
39
40
41
42
-100
-80
-60
-40
-20
0
20
40
60
80
100
07Q4 08Q4 09Q4 10Q4 11Q4 12Q4
Taxes (lhs)
Other net current transfers received (lhs)
Net property income received excl dividends paid (lhs)
Operating surplus (lhs)
Profits(rhs)(2)
(1)Excluding Latvia(2)Profits in of GVA Source Eurostat DG ECFIN calculations
In the euro area a fall in the ratio of operating surplus to GVA dragged overall profitability down after 2008 Despite an improvement in 2011 in
(55) The illustration of the contributions to the cumulative change in profitability only serves to depict the relative importance of the various components of the change in profits since the crisis The starting point for the cumulative change should not be interpreted as a reference point for a desirable profit recovery
2013 operating surplus was still contributing negatively to the cumulative change in profitability since the pre-crisis peak In contrast operating surplus in the United States responded to the crisis earlier than in the euro area but its contribution to the change in profits remained positive
Graph II43 Profitability breakdown of NFCs US
(cumulative change in from 2005Q3 peak to 2013Q3)
24
25
26
27
28
29
30
31
-100
-80
-60
-40
-20
0
20
40
60
80
100
05Q4 06Q4 07Q4 08Q4 09Q4 10Q4 11Q4 12Q4
Taxes (lhs)Other net current transfers received (lhs)Net property income received excl dividends paid (lhs)Operating surplus (lhs)Profits(rhs)(2)
(1) Profits in of GVA Source Federal Reserve Board US Bureau of Economic Analysis DG ECFIN calculations
Unlike operating surplus income tax payments and net income from non-operational activities did not differ significantly between the euro area and the United States (56) In both economies lower corporate tax payments resulting from lower profits generated by NFCs naturally had a positive impact on the cumulative change in profits from the pre-crisis peak
Differences in labour market developments are at the root of differences in profitability
Differences in operating surplus and profitability between the United States and the euro area can be attributed partly to differences in the business cycle In 2011Q1 NFCsrsquo gross value added was still 12 below its pre-crisis peak in the euro area but 11 above in the United States The main channel through which cyclical developments can affect operating surplus is the labour market
(56) In fact the ratio of profit tax payments to profits (a crude measure of an aggregate tax rate) in the euro area and the United States has been almost the same since the start of the crisis falling substantially in 2008-09 indicating that tax policy was not more favourable for profits in one economy than in the other
42 | Quarterly Report on the Euro Area
The cyclicality of operating surplus depends on the impact of the cycle on labour productivity as well as on wages The worse performance of operating surplus in the euro area since 2008 as compared with that in the United States reflects a stronger deterioration in labour productivity accompanied by unfavourable developments in wages per employee
Labour productivity growth in the euro area turned sharply negative in 2009 opening a big gap with the positive (albeit modest) wage growth (Graph II44) In the United States on the other hand labour productivity growth became negative earlier but to a lesser extent and some downward wage adjustment took place in 2009
Graph II44 Labour productivity and wages euro area and US
(2001Q4-2013Q3 y-o-y change)
-4
-3
-2
-1
0
1
2
3
4
5
01Q4 03Q2 04Q4 06Q2 07Q4 09Q2 10Q4 12Q2
Average wage per employee euro area (1) (2)Average wage per employee US (1)Labour productivity euro area (2) (3)Labour productivity US (3)
(1)Real wages calculated by the GDP deflator(2)Euro area excluding Latvia(3)In terms of total employment (thousands) Source Eurostat US Bureau of Economic Analysis US Bureau of Labour Statistics DG ECFIN calculations
There are a number of reasons for the different labour adjustments in the euro area and the United States In the former apart from a higher level of employment protection short-term work schemes were put in place in the early stages of the crisis (57) In addition as labour force adjustment tends to be more costly in the euro area some firms (particularly small firms and those with highly qualified employees) preferred to retain their
(57) According to the OECD Public short-term work schemes have
played an important role in preserving jobs during the crisis in a number of countries although significant hours reductions were also achieved via lower overtime hours hours averaging arrangements and employer initiatives see OECD Employment Outlook 2010 ndash Moving Beyond the Job Crisis
labour force (58) Because of a lack of wage flexibility the higher degree of lsquolabour hoardingrsquo in the euro area came at the expense of lower operating surplus and profits and consequently put a downward pressure on the capacity accumulate internal funds to deleverage
Corporate savings are much lower in the euro area
Negative developments in euro area corporate profitability were reflected in corporate savings which together with physical investment determines the internal funds available for balance sheet adjustment In 2009-10 there was a sharp drop in euro area savings because profits acted as shock absorbers and fell more rapidly than dividend payments leaving less spare cash available In contrast savings by US NFCs increased substantially on rising profits after an early-crisis low point and reached a historically high level of around 23 of GVA in 2010Q3 (Graph II45)
Graph II45 Savings of NFCs (2000Q1- 2013Q3 of GVA)
15
16
17
18
19
20
21
22
23
24
00Q1 01Q3 03Q1 04Q3 06Q1 07Q3 09Q1 10Q3 12Q1 13Q3
Euro area (1)
US
(1)Euro area excluding Latvia Source Eurostat Bureau of Economic Analysis DG ECFIN calculations
The impression that US corporate behaviour has been more geared towards accumulating savings than that in the euro area is reinforced when one looks at dividend distribution Dividends paid by euro area NFCs have been on a declining trend since the start of the crisis but those paid by US firms have also decreased This is remarkable given (58) See Box 12 Labour hoarding across different types of firms in
OECD Employment Outlook 2010 ndash Moving Beyond the Job Crisis
II Special topics on the euro area economy
Volume 13 No 1 | 43
the positive profit developments in the United States (Graph II46) A drop in dividends alongside profit growth suggests that after 2008 US companies preferred to direct a bigger proportion of the profit recovery to corporate savings and thereby balance sheet adjustment The ratio of dividends to profits in the United States has fallen from about one third before the crisis to one quarter now This ratio also dropped in the euro area although by less (59)
Graph II46 Dividends paid of NFCs (2000Q1-2013Q3 of GVA)
0
5
10
15
20
25
00Q1 01Q3 03Q1 04Q3 06Q1 07Q3 09Q1 10Q3 12Q1 13Q3
Euro area (1)
US
(1)Euro area excluding Latvia Source Eurostat Federal Reserve Board DG ECFIN calculations
Disappointing physical investment in the euro area and the United States
Cutting investment in physical assets is another way of reducing excessive indebtedness Corporate investment as a proportion of activity dropped sharply both in the euro area and in the United States in the early stages of the crisis (Graph II47)
After a modest recovery in 2010-11 the investment rate decreased again in the euro area The investment recovery was more solid in the United States but has lost momentum since the end of 2012 and the investment rate remains below its pre-crisis peak Overall it seems that euro area corporations partly compensated for less supportive savings developments than in the US by
(59) Dividend payments are not the only way of distributing profits to shareholders Equity buybacks can also be used for this purpose and firms that choose this option will tend to have higher savings and lower dividends paid
curbing physical investment more than their US counterparts
Graph II47 Investment of NFCs (2000Q1- 2013Q3 of GVA)
15
16
17
18
19
20
21
22
23
24
00Q1 01Q3 03Q1 04Q3 06Q1 07Q3 09Q1 10Q3 12Q1 13Q3
Euro area (1)
US
(1)Excluding Latvia Source Eurostat US Bureau of Economic Analysis DG ECFIN calculations
A more modest increase in net lending in the euro area than in the US
Since 2013 firmsrsquo net lending in the euro area has been in positive territory but substantially less so than that in the United States (Graph II48) Positive NLB in the euro area unlike that in the United States is mostly due to a low investment rate alone rather than low investment combined with high savings The combination of disappointing investment and high savings has translated into historically high and sustained NLB for US firms
This persistent net lending position in the United States is atypical as firms usually invest more than they save It suggests that US firms have been adjusting their balance sheets significantly since the beginning of the crisis via their internal funds while euro area firms seem to have opted for much slower balance sheet adjustment
44 | Quarterly Report on the Euro Area
Graph II48 Net lendingborrowing of NFCs
(2000Q1- 2013Q3 of GVA)
-10
-8
-6
-4
-2
0
2
4
6
8
00Q1 01Q3 03Q1 04Q3 06Q1 07Q3 09Q1 10Q3 12Q1 13Q3
Euro area (1)
US
(1)Excluding Latvia Source Eurostat US Bureau of Economic Analysis DG ECFIN calculations
Debt deleveraging has been more pronounced in the US than in the euro area
The faster pace of adjustment of balance sheets in the United States is confirmed by the corporate debt data (Graph II49) (60) (61) While both the euro area and the United States entered the crisis with swiftly rising and historically high levels of debt deleveraging has progressed more rapidly in the latter since the crisis By the beginning of 2012 US corporate debt had fallen by approximately 15 pp as a proportion of activity while euro area debt had dropped by 7 pp (62)
(60) Non-financial corporate debt consists of loans and securities
other than shares (corporate bonds) both can be classified as short- or long-term depending on whether their original maturity is less or more than one year
(61) This section analyses developments in non-consolidated financial flows and stocks in the euro area and in the United States for two reasons it is important to have a sense of financial positions within the institutional sector eg loans between NFCs are an important part of intra-firm relationships as head offices use them to finance subsidiaries for example perhaps for tax reasons This is relatively more important in the euro area than in the United States Consolidated financial asset and flow data eliminate these intra-sector positions and different approaches may be taken to consolidation as in the euro area there is the additional issue of cross-border consolidation between Member States while there is no need for flows and positions between firms in different US states to be treated separately
(62) The debt-to-equity ratio is another measure of corporate leverage widely followed by investors Faster stock market recovery helped US firms reduce this ratio more than those in the euro area
Graph II49 Debt levels of NFCs(1) (1999Q1-2013Q3 of GVA)
100
120
140
160
180
200
220
99Q1 00Q3 02Q1 03Q3 05Q1 06Q3 08Q1 09Q3 11Q1 12Q3
Euro area (2)
US
(1)Securities other than shares and loans(2)Excluding Latvia Source Eurostat US Bureau of Economic Analysis DG ECFIN calculations
Firms in the euro area and the United States entered the crisis with almost the same level of short-term debt as a proportion of total debt Since the crisis the adjustment away from short-term debt has been significantly more pronounced in the United States suggesting more active balance sheet restructuring
Graph II410 Debt flows of NFCs(1) (1999Q1- 2013Q3 of GVA)
-15
-10
-5
0
5
10
15
20
99Q1 01Q1 03Q1 05Q1 07Q1 09Q1 11Q1 13Q1
Euro area bonds (2)
US bonds
Euro area loans (2)
US loans
(1)Securities other than shares and loans (2)Excluding Latvia Source Eurostat US Bureau of Economic Analysis DG ECFIN calculations
Due to differences in the structure of corporate finance loans (as opposed to bonds) tend to form a bigger proportion of debt in the euro area than in the United States An important element of the
II Special topics on the euro area economy
Volume 13 No 1 | 45
corporate balance sheet adjustment process in both economies has been a movement away from an excessive reliance on loans (Graph II410) and towards bond financing This trend has been substantially more pronounced in the United States presumably reflecting the fact that bond markets are more developed in that country
Developments in non-financial corporate debt were also influenced by developments in financial intermediation in particular in the banking sector Financial accounts show NFCsrsquo debt exposure but do not indicate whether the debt holder is a bank According to bank balance sheet statistics the nominal growth of loans vis-agrave-vis NFCs has been mostly negative in the euro area since 2009Q4 (Graph II411) Coupled with the positive loan inflows seen in the national accounts between 2010Q3 and 2012Q3 (Graph II410) this shows a degree of substitution in corporate loan liability ownership between banks and other financial firms and sectors (including other NFCs) in this period According to the counterparty breakdown of NFC domestic loans published by the ECB corporate borrowings from other NFCs represented 29 of all loans by 2013Q3 (up from 26 in 2008Q1) while the proportion of borrowings from monetary financial institutions (MFIs) had dropped (from 60 in 2008Q1) to an all-time low of 53 The proportion of loans from other non-bank financial intermediaries also increased There is less evidence of a shift from banks to other loan providers in the United States where loans between NFCs are much more limited
Graph II411 Bank loans to NFCs (1999Q1- 2013Q3 y-o-y change)
-20
-15
-10
-5
0
5
10
15
20
25
99Q1 00Q3 02Q1 03Q3 05Q1 06Q3 08Q1 09Q3 11Q1 12Q3
Euro area bank loans to NFCs (1)US bank loans to NFCs
(1)Excluding Latvia Source ECB US Federal Reserve Board DG ECFIN calculations
Positive NLB has been used to acquire safe financial assets in both regions
In both the euro area and the United States the positive NLB has been used to deleverage but also to invest in safe financial assets At the beginning of the crisis much of the positive corporate NLB in the United States was invested in money market mutual funds which is essentially investment in short-term low-risk assets (Graph II412) (63)
Currency and deposits (another type of safe asset) have increased substantially in the euro area in recent years as a proportion of total firm activity (Graph II413) This rise was driven almost exclusively by a rapid increase in firmsrsquo savings deposits To some extent a similar trend is observable in the United States In particular US cash balances (a sub-component of currency and deposits) approached 12 of GVA by the end of 2013 a level not seen since the early 1990s On the other hand savings deposits have grown more modestly resulting in a moderately positive overall trend in currency and deposits
Graph II412 Mutual fund shares of NFCs (1999Q1- 2013Q3 of GVA)
0
2
4
6
8
10
12
14
99Q1 01Q1 03Q1 05Q1 07Q1 09Q1 11Q1 13Q1
Euro area (1)
US (2)
(1)Excluding Latvia(2)In the USA these asset series can be broken down into investment in money market mutual funds and investment in other mutual funds The 2009-11 increase is fully attributable to the former Source Eurostat US Bureau of Economic Analysis DG ECFIN calculations
Overall these two aspects of corporate financial investment behaviour signify considerable liquidity concerns on the part of firms in both the euro area
(63) Euro area financial accounts only show firmsrsquo investment in mutual funds overall and do not distinguish between types of mutual funds
46 | Quarterly Report on the Euro Area
and the United States They also represent a drive towards lower-risk assets perhaps indicating increased risk aversion by corporations or a tendency to postpone physical investment in a context of perceived high uncertainty
Graph II413 Currency and deposits ndash NFCs
(1999Q1- 2013Q3 of GVA)
0
5
10
15
20
25
30
35
40
45
99Q1 00Q3 02Q1 03Q3 05Q1 06Q3 08Q1 09Q3 11Q1 12Q3
Euro area (1)
US
(1)Excluding Latvia Source Eurostat US Bureau of Economic Analysis DG ECFIN calculations
Conclusion
Although both regions saw similar steep rises in corporate debt in the pre-crisis years balance sheet adjustment since the crisis has been significantly slower in the euro area than in the United States The more rapid adjustment in the United States can be explained by a stronger cyclical recovery more supportive profitability developments and reduced dividend payment ratios In the euro area profitability has been hindered by a combination of lower flexibility in the labour markets and slow wage adjustment
The slower balance sheet adjustment in the euro area corporate sector is visible in a slower fall in indebtedness but also a slower adjustment of the structure of balance sheets In particular the shift from loans to bonds and the extension of debt maturity have been more pronounced in the United States In both regions firms have used their positive NLB to accelerate the accumulation of safe and liquid financial assets This could reflect continuing uncertainty regarding future demand and growth prospects
Overall the evidence discussed in this section shows that euro area firms are lagging significantly behind their US counterparts in terms of balance sheet consolidation Given that investment rates remain disappointing even in the more advanced US corporate sector a degree of caution appears warranted when assessing short-term prospects for corporate investment in the euro area
III Recent DG ECFIN publications
Volume 13 No 1 | 47
1 Occasional Papers
European Economy Occasional Papers 170 January 2014 Financial Assistance Programme for the Recapitalisation of Financial Institutions in Spain Fifth Review ndash Winter 2014 httpeceuropaeueconomy_financepublicationsoccasional_paper2014pdfocp170_enpdf
European Economy Occasional Papers 169 December 2013 The Economic Adjustment Programme for Cyprus Second Review ndash Autumn 2013 httpeceuropaeueconomy_financepublicationsoccasional_paper2013pdfocp169_enpdf
European Economy Occasional Papers 168 December 2013 Fiscal frameworks in the European Union ommission services country factsheets for the Autumn 2013 Peer Review httpeceuropaeueconomy_financepublicationsoccasional_paper2013pdfocp168_enpdf
European Economy Occasional Papers 167 December 2013 Economic Adjustment Programme for Ireland - Autumn 2013 Review httpeceuropaeueconomy_financepublicationsoccasional_paper2013pdfocp167_enpdf
European Economy Occasional Papers 166 December 2013 Progress towards meeting the economic criteria for EU accession the EU Commissionrsquos 2013 assessments httpeceuropaeueconomy_financepublicationsoccasional_paper2013pdfocp166_enpdf
European Economy Occasional Papers 165 November 2013 Romania Balance-of-Payments Assistance Programme 2013-2015 httpeceuropaeueconomy_financepublicationsoccasional_paper2013pdfocp165_enpdf
European Economy Occasional Papers 164 November 2013 The Economic Adjustment Programme for Portugal Eighth and Ninth Review httpeceuropaeueconomy_financepublicationsoccasional_paper2013pdfocp164_enpdf
European Economy Occasional Papers 163 November 2013 Financial Assistance Programme for the Recapitalisation of Financial Institutions in Spain Fourth Review ndash Autumn 2013 httpeceuropaeueconomy_financepublicationsoccasional_paper2013pdfocp163_enpdf
European Economy Occasional Papers 162 October 2013 Economic Adjustment Programme for Ireland Summer 2013 Review httpeceuropaeueconomy_financepublicationsoccasional_paper2013pdfocp162_enpdf
2 Economic papers
European Economy Economic Papers 514 February 2014 Martin Larch Kristin Magnusson Bernard Balint Tatar Hard work and More How to successfully conduct adjustment with official assistance httpeceuropaeueconomy_financepublicationseconomic_paper2014pdfecp514_enpdf
European Economy Economic Papers 513 February 2014 Florian Woumlhlbier Caterina Astarita Gilles Mourre Consolidation on the revenue side and growth-friendly tax structures an indicator based approach httpeceuropaeueconomy_financepublicationseconomic_paper2014pdfecp513_enpdf
48 | Quarterly Report on the Euro Area
European Economy Economic Papers 512 December 2013 Alexander Schwan Etienne Sail Assessing the economic and budgetary impact of linking retirement ages and pension benefits to increases in longevity httpeceuropaeueconomy_financepublicationseconomic_paper2013pdfecp512_enpdf 3 Other publications
Winter forecast 2014 - EU economy recovery gaining ground httpeceuropaeueconomy_financepublicationseuropean_economy2014pdfee2_enpdf 4 Regular publications
Business and Consumer Surveys (harmonised surveys for different sectors of the economies in the European Union (EU) and the applicant countries) httpeceuropaeueconomy_financedb_indicatorssurveysindex_enhtm Business Climate Indicator for the euro area (monthly indicator designed to deliver a clear and early assessment of the cyclical situation) httpeceuropaeueconomy_financedb_indicatorssurveysdocuments2013bci_2013_11_enpdf Key indicators for the euro area (presents the most relevant economic statistics concerning the euro area) httpeceuropaeueconomy_financedb_indicatorskey_indicatorsindex_enhtm Monthly and quarterly notes on the euro-denominated bond markets (looks at the volumes of debt issued the maturity structures and the conditions in the market) httpeceuropaeueconomy_financepublicationsbond_marketindex_enhtm Price and Cost Competitiveness httpeceuropaeueconomy_financedb_indicatorscompetitivenessindex_enhtm
50 | Quarterly Report on the Euro Area
Editor-in-Chief Elena Flores
Overall coordination Eric Ruscher
Data assistance Christos Zavos
Comments on the report would be gratefully received and should be sent to
Elena Flores Director ndash Policy Strategy and Coordination Directorate-General for Economic and Financial Affairs Office CHAR 1566
B-1049 Brussels
Email elenafloreseceuropaeu
or
Eric Ruscher Head of Unit ndash Macroeconomy of the euro area Directorate-General for Economic and Financial Affairs Office CHAR 15248
B-1049 Brussels
Email ericruschereceuropaeu
HOW TO OBTAIN EU PUBLICATIONS Free publications bull one copy
via EU Bookshop (httpbookshopeuropaeu) bull more than one copy or postersmaps
from the European Unionrsquos representations (httpeceuropaeurepresent_enhtm) from the delegations in non-EU countries (httpeeaseuropaeudelegationsindex_enhtm) by contacting the Europe Direct service (httpeuropaeueuropedirectindex_enhtm) or calling 00 800 6 7 8 9 10 11 (freephone number from anywhere in the EU) () () The information given is free as are most calls (though some operators phone boxes or hotels may charge you)
Priced publications bull via EU Bookshop (httpbookshopeuropaeu) Priced subscriptions bull via one of the sales agents of the Publications Office of the European Union
(httppublicationseuropaeuothersagentsindex_enhtm)
KC-AK-14-001-en-n
- Blank Page
- Blank Page
- Blank Page
- Blank Page
-

II Special topics on the euro area economy
Volume 13 No 1 | 33
The recent crisis marked a watershed in the evolution of public compensations Between 1999 and 2007 relative government wage growth did not vary from cold-shower periods (or periods of more gradual fiscal consolidation) to periods of non-consolidation (42)
Graph II21 Change in the share of general government compensations to
total spending (2008-2012 in pp)
Source DG ECFIN calculations based on AMECO
Conversely starting with the 2008-2009 crisis compensations per employee in the government sector grew more slowly compared with those in the manufacturing sector and more clearly so during fiscal consolidation (Graph II22)
It is possible that under conditions of fiscal stress the relationship between government and export sector wages differs from that of normal periods This aspect has been neglected in previous analyses To shed some light on it Table II21 shows the correlation between government wage growth and manufacturing wage growth under alternative fiscal conditions (consolidation and non-consolidation) differentiating between countries with large and small public sectors The evidence shows that the two wages are closely related in periods of fiscal stress only if the government employs a large share of the labour forces This suggests that the possibility of
(42) By convention episodes of fiscal consolidation are defined as those during which the structural primary balance improves by at least 15 per cent of GDP in one year or at least 3 per cent in three years with a minimum improvement of 05 per cent in each year Such a definition makes it possible to distinguish between cases of cold-shower consolidation episodes and more gradual consolidation episodes
expenditure-based fiscal consolidation having the type of supply-side effects described in Alesina and Perotti (1997) Alesina et al (2002) and Ardagna (2004) may be a consequence of the size of the public sector among other things
Graph II22 Government and manufacturing compensations under
alternative fiscal conditions EU countries (1999-2007 and 2008-2012 avg annual change)
Source DG ECFIN calculations based on OECD
Table II21 Correlation between government and manufacturing
compensations growth under alternative fiscal conditions EU (1)
(1) Pearson correlation coefficients Sample EU countries (excluding AT BG CY DE EL LT LV MT RO SI) over 1980-2012 (1995-2012 in the case of CZ EE HU SK) Source DG ECFIN calculations based on OECD
Concluding remarks
Spillovers which are the result of high wages in the general government sector have been mentioned as one of the drivers of competitiveness losses in
34 | Quarterly Report on the Euro Area
some countries in the euro area before the crisis (43)
The results presented here speak to this debate and may be summarised as follows Government wage levels have a long-term impact on wages in the manufacturing sector even more so in countries in which the government sector employs a relatively large share of the labour force That said their short-term impact remains unaffected by the size of the public sector Looking at it the other way round manufacturing wages usually have a greater impact on government wages regardless of size This is arguably because private sector wage leadership is more common than public sector wage leadership
(43) Blanchard O (2007) Adjustment within the euro The difficult
case of Portugal in Portuguese Economic Journal 61 1-21
The way government wages are set also plays a role In collective bargaining systems not only are government and manufacturing wages related in both the long- and the short-term (as they are also when the government sets wages by unilateral decision) Also most importantly wages in the tradable sector are better aligned with labour productivity The evidence provided here indicates that if the government wage bill is inflated for example due to unjustified wage premia limiting public wage growth would spill over into the private export sector reducing labour costs and helping boost competitiveness and employment in the sector Whilst structural reforms including skill upgrading in manufacturing are an important and necessary ingredient for achieving non-reversible gains in competitiveness the adjustment of competitiveness through fiscal policy remains a complementary tool to deliver sustained external rebalancing
II Special topics on the euro area economy
Volume 13 No 1 | 35
II3 Latvia maintaining sustainable growth after the boom-bust years (44)
Latvia had been keen to join the euro area at the earliest opportunity with entry in January 2008 the clear target As the economy overheated however significant macro-economic imbalances accumulated which deferred these plans Between 2005 and 2007 unsustainable GDP growth went hand in hand with a mounting current account deficit and a housing market spiralling out of control When credit flows then abruptly reversed the countryrsquos GDP contracted dramatically Latvia was placed in the EUIMF-led financial assistance programme and was forced to carry out ambitious fiscal consolidation and structural reforms Reallocating resources to the tradable sector was the first important step on the road to an export-driven recovery Under the burden of deleveraging and consolidation the revival of domestic demand was slow at first From 2011 however supported by favourable labour market developments growth in demand has accelerated Latvia has reclaimed its position as the fastest-growing EU economy however the current level of growth is lower than the unstainable rates recorded in the boom years and it is now seen as sustainable Thanks to this balanced growth Latvia has not been subject to the MIP since its launch in 2012 Despite the financial assistance-supported measures to preserve equity the social burden of economic adjustment as evidenced by poverty social exclusion and emigration rates has been high but measures are being taken by the authorities to counter these effects Continued commitment to prudent fiscal policies will be critical for the countryrsquos economic future The use of macro-prudential tools to reduce the risks posed by large non-resident financial flows and the implementation of ambitious structural reforms will also play an important role
-----------------------
Introduction
To welcome Latvias recent adoption of the euro this section reviews the countrys recent boom-bust experience and discusses the challenges ahead
Five years ago it would have been difficult to imagine that Latvia would be able to fulfil the conditions for adopting the euro and enter the euro
(44) Section prepared by Gatis Eglitis and Christian Weise
area in January 2014 After EU accession in May 2004 significant macro-economic imbalances had started to accumulate on the back of an overheating economy and by autumn 2008 the country was on the brink of bankruptcy A painful and seemingly impossible economic adjustment to be achieved by means of internal devaluation lay ahead This would require unprecedented fiscal consolidation huge redundancies and difficult structural reforms threatening political and social stability Yet despite pronounced scepticism from the outset and particularly at the height of the crisis in mid-2009 the economy has moved back to growth The measures implemented took some time to take effect with the economy continuing to decline at first before picking up as seen in the lsquoVrsquo-shaped recovery but a protracted recession was avoided Latviarsquos GDP growth has exceeded expectations reaching levels of 54 in 2011 52 in 2012 and around 4 in 2013 The two factors that were critical to the countryrsquos economic recovery were a return to international competitiveness and the rapid correction of external imbalances The budget deficit decreased significantly and is expected to reach a balanced position in the near future The level of government debt is projected to stay around 40-42 of GDP in 2013-2014 and to decline to 33 of GDP in 2015 as the repayments to the EU take effect and sizable cash buffers will be reduced The financial assistance programme was successfully completed in January 2012 Financial support had not been necessary since October 2010 however and the government had re-entered international bond markets in June 2011 well ahead of schedule (45) As of 2013 GDP per capita in constant prices has returned to the level reached at its peak in 2007 Due to the decline in the population however the absolute value of GDP in constant prices was still about 9 below 2007 levels with current projections suggesting that a full recovery to the pre-crisis peak will be achieved in 2015
Overheating imbalances and a big bust
Latvia joined the EU in seemingly good macroeconomic health and having pegged its currency to the Special Drawing Right (SDR) in
(45) Occasional Paper 120 issued by the European Commission Directorate-General for Economic and Financial Affairs EU Balance of Payments assistance for Latvia foundations of success httpseceuropaeueconomy_financepublicationsoccasional_paper2012op120_enhtm
36 | Quarterly Report on the Euro Area
1994 and then to the euro in 2005 was keen to join the euro area in January 2008 Upon entering the Exchange Rate Mechanism II (ERM II) on 2 May 2005 the authorities unilaterally committed to maintaining a smaller fluctuation margin of plusmn1 around the central rate ndash seen as a sign of the countryrsquos determination to join the euro area The Latvian economy was the fastest growing in the EU between 2000 and 2007 and between 2005 and 2007 real GDP growth reached a yearly average of over 10 Following accession to the EU in 2004 Latvia along with other EU countries witnessed a rapid credit expansion Loans to residents grew at an average annual rate of close to 50 between 2004 and 2008 a reflection of the excess liquidity at that time and of the resulting hot money inflows into central and eastern European economies which were rapidly converging with their western European counterparts Foreign investment exploded driven by commercial banksrsquo mispricing of risk and over-optimistic expectations of convergence A number of privatisation deals and most importantly a burgeoning real-estate market characterised by soaring prices also served to attract foreign investors The tradable sector was meanwhile largely neglected By way of illustration foreign direct investment (FDI) reached relatively high levels of 84 and 81 of GDP in 2006 and 2007 respectively but most of this was directed towards the real-estate market while the proportion of total FDI relating to manufacturing was only 12 in 2013 Significant imbalances were accumulating as indicated by a current account deficit that reached around 22 of GDP in 2006 and 2007 and by labour market tightening Nominal wages doubled between 2004 and 2007 increasing much faster than productivity and thus damaging international competitiveness
By early 2008 more cautious bank lending had caused economic growth to slow significantly By autumn of the same year this slowdown had developed into a strong contraction reflecting the wider global economic situation The global economy fell into recession commodity prices reached record highs and the general risk aversion seen in global markets following the collapse of Lehman Brothers cut off Latviarsquos access to financial markets The second largest domestic bank Parex had to be rescued Latvia ultimately experienced the most severe GDP contraction of all EU countries at close to 18 in 2009 The government deficit threatened to spiral out of control Having been at 03 of GDP in 2007 and 42 in 2008 in spring 2009 it was projected to
reach levels well above 15 of GDP by the end of year in the absence of a significant consolidation package
Faced with an economic crisis of this order Latvia agreed a medium-term financial assistance programme the balance of payments programme (BoP) with the EU and the IMF in December 2008 (46) The aim of this was to preserve the existing exchange-rate arrangement The assistance offered to Latvia was made subject to a number of policy conditions relating to fiscal consolidation financial sector stabilisation and the introduction of a wide range of structural reforms including a significant acceleration in the absorption of EU structural funds The Latvian government also undertook to strengthen the social safety net so as to protect the most vulnerable from the effects of the crisis
Brave measures in difficult times
Given that the exchange rate was at that time pegged to the euro some economists suggested devaluation as the only way out of the crisis The national authorities and international partners did not see that as a viable option however because its effectiveness would have been severely limited by the degree to which imports were used in the manufacture of exports and the high proportion of foreign liabilities Furthermore it would have brought with it the risk of mass bankruptcy and a partial collapse of the domestic banking system at a time when the judicial system was clearly not capable of coping with such a fall-out In addition devaluation would have provided no incentive to solve Latviarsquos structural problems including weak fiscal governance the unsustainability of pension expenditure loss-making state-owned banks a lack of competitiveness and weak institutions
Between 2009 and 2011 the Latvian government carried out an ambitious programme of fiscal adjustment designed to correct the previously loose fiscal policy the weaknesses of which had been hidden by the countryrsquos strong economic growth This difficult adjustment restored Latviarsquos public finances to better health and established a
(46) Funds available from EU countries IMF World Bank EBRD
and Norway amounted to euro 75 billion of which Latvia used euro 45 billion (60) with euro 29 billion lent by the European Commission on behalf of the EU The first tranche of EUR 1 billion (13 of the total) was repaid by Latvia on 25 March 2014
II Special topics on the euro area economy
Volume 13 No 1 | 37
framework which would be sustainable in the long term The nominal balance improved with the deficit being cut from 98 of GDP in 2009 to 13 of GDP in 2012 and 2013 (see graph II31) The structural deficit also fell from its peak of 55 of GDP in 2008 to around 025 of GDP in 2012 and 2013 beating Latviarsquos medium-term objective of -05 of GDP as set in the convergence programmes
Latviarsquos fiscal consolidation measures were undoubtedly bold with fiscal savings equivalent to around 17 of GDP implemented within three years The measures were frontloaded and half of these savings were implemented in the first year alone The measures were on the whole expenditure-oriented with over half of the savings coming from cuts to health education and public administration budgets The most notable measure relating to revenue was an increase in VAT from 18 to 22 The consolidation strategy was eventually successful in containing the adverse effects of the budget deficit on the economy In fact it even appears to have triggered lsquonon-Keynesianrsquo effects on demand by restoring confidence and stimulating demand and investment at the point when it was most needed (47)
Graph II31 Latviarsquos government budget balance and debt (2008-15 of GDP)
Source DG ECFIN Commissionrsquos spring 2013 forecast
The fiscal framework was also strengthened significantly by the law on fiscal discipline coming into force in March 2013 and the creation of a fiscal council in January 2014 The signing of the
(47) Ibid see Chapter 4 Fiscal consolidation in the midst of the crisis
Treaty on Stability Coordination and Governance in the EMU (48) in March 2012 provided further EU-level support for the national fiscal framework
An additional factor that was critical to the success of the consolidation strategy but is often overlooked was the availability of significant EU funds (particularly from around 2009 onwards) which acted as a much-needed demand trigger in sectors affected by the decline in economic activity Between 2007 and 2013 Latvia benefited from the third highest allocation of EU funds after Hungary and Lithuania receiving a yearly average equivalent to around 28 of GDP or 70 of gross fixed capital formation(49) As on average every euro of national budget spending was supplemented by five to six euros co-financing from EU funds national expenditure on items such as road and public building construction vocational education and training of unemployed science infrastructure development and healthcare was often replaced by Structural funds financing despite being in conflict with the EU funds additionality principle Clearly such large inflows of EU financing also generated substantial tax revenues in particular VAT at a time when private consumption was weak
The Latvian labour market demonstrated a high level of flexibility during the crisis thanks in part to a decentralised wage-setting system Significant public-sector wage cuts indirectly supported nominal wage reduction in the private sector in 2009 and 2010 when earnings per employee fell by a total of 19 over two years Employment levels fell sharply especially in the private sector as jobs were cut in construction and manufacturing The unemployment rate reached around 20 in early 2010 but had fallen back to 119 by 2013 due mainly to growth in employment with the participation rate also increasing significantly over this period The projection from the Commissionrsquos 2014 winter forecast shows wages in 2014-15 growing broadly in line with productivity although the labour market is tightening and structural problems in particular regional differences and skill mismatches could create pressures in the economy
(48) httpeuropean-councileuropaeumedia639235st00tscg26_en12pdf
(49) Source Directorate-General for Regional Policy Infoview
38 | Quarterly Report on the Euro Area
External cost competitiveness has improved noticeably since 2008 with labour costs falling significantly and labour productivity in particular in the tradable sector increasing In 2008 the real effective exchange rate (REER) adjusted for unit labour costs reached a peak of 64 above the 2000 level before falling by about 20 in 2009-10 since when it has remained broadly stable (see graph II32) This level of REER is considered sustainable as the country has been seen to be steadily gaining market share over recent years (including as measured by exports adjusted for the growth of markets) The percentage of the countryrsquos GDP attributable to exports rose to 60 in 2013 from 43 in 2007 with some 60 of exports destined for the EU and 12 for Russia
Graph II32 Effective exchange rates Latvia v 35 trading partners
(Jan 2007-Dec 2013 monthly avg 2007 = 100)
Source DG ECFIN
The social burden of economic adjustment has admittedly been high in Latvia despite the policy measures contained in the Memorandum of Understanding stipulating inter alia establishment of a comprehensive social safety net supporting local governments in providing social assistance and discounting social payments from overall budget targets High unemployment has led to a wave of emigration to richer EU countries which coupled with Latviarsquos low fertility and high death rates has seen the population decrease by 8-10 since 2008 Net emigration has now fallen substantially however since the peak of the crisis years The rates of poverty and social exclusion in Latvia are among the highest in the EU families with children unemployed people people with disabilities and people living in rural areas are particularly at risk The countryrsquos spending on
social protection and healthcare as a percentage of GDP is among the lowest in the EU Furthermore the social protection measures which do exist to reduce poverty tend to be ineffective highlighting the importance of a robust social safety net It appears however that with the improved economic situation and increasing levels of general social awareness the authorities are finally starting to address the challenges of poverty and social exclusion with greater determination In recent years for example taxation of low-income earners has been cut slightly and child poverty has been reduced thanks to increases in various child-related benefits Proposals for reforms to social assistance in line with 2013 World Banks study are being gradually implemented Better targeted more effective policies relating to the active labour market mostly financed by the European Social Fund are helping unemployed people in particular the long-term unemployed and young people to find work or to obtain relevant training
As part of the BoP programme and in the context of the assessment of Latviarsquos readiness to join the euro area financial supervision has been tightened and EU resources for supervision and monitoring increased in particular for monitoring the growing non-resident banking sector Additional liquidity and capital adequacy requirements for non-resident banks were introduced in 2013 regular on- and off-site checks of these banks are being performed the deposit guarantee fund has been further strengthened and monitoring has been stepped up in relation to pledged assets and the origin of funds in bank recapitalizations This strengthened regulatory policy has been introduced partly as a result of lessons learnt at significant cost in the past five years most notably with the Parex and Krajbanka failures
Latvia has implemented a series of ambitious reforms to the business environment in recent years with the aim of reducing start-up costs simplifying procedures for property registration construction permits and tax collection and introducing out-of-court settlement of insolvencies In doing so Latvia has brought its regulatory framework a significant step closer to what is regarded as best practice In the World Bankrsquos 2014 Doing Business report Latvia was ranked 25th out of 185 countries with only four euro-area members faring better
II Special topics on the euro area economy
Volume 13 No 1 | 39
Conclusion
The origins of Latviarsquos years of boom and bust can be traced back to the domestic regional and global circumstances at that time globally excess liquidity and hot money flowing into vulnerable countries regionally unrealistic expectations of income convergence in central and eastern Europe and domestically undue optimism about growth in personal incomes and mispricing of risk by commercial banks amplified by the behaviour of both policymakers and individuals
A broad range of country-specific and general economic factors have contributed to the successful economic adjustment seen in Latvia since the height of the crisis Ambitious front-loaded and largely expenditure-based fiscal consolidation helped to contain the budget deficit whilst the confidence generated by the introduction of a credible programme itself aided the economic recovery The flexibility of the labour market meanwhile helped companies to restore competitiveness by means of wage reductions and job cuts Competitiveness was also improved by steps taken to shift the tax burden from labour to consumption and property The recovery in Latvia was very much export-driven with the growth in exports made possible by the openness of the economy and the faster-than-expected economic growth experienced by major trading partners A number of structural reforms including bank restructuring and measures improving the use of EU funds have contributed to the development of a more favourable business environment A generous allocation from the European structural funds meanwhile helped to boost public investment and supported financing and reforms in many important sectors Above all the success of the recovery measures implemented in Latvia proved that for a tough internal economic adjustment to be effective there needs to be both a determined political will to carry out unpopular reforms and also a fully-developed comprehensive social safety net to protect more vulnerable groups
in society during difficult times In addition Latvia benefited from the fact that those looking for work were able to migrate to other EU countries which helped to alleviate the social tension created by the effects of the crisis Some of the lessons above are clearly applicable to other Member States undergoing challenging economic adjustment while others are more Latvia-specific
While Latviarsquos current level of economic growth is regarded as sustainable (50) and the adoption of the euro is recognised as a significant and hard-earned achievement it is not the end of the road The current robust economic situation should be used to advance reforms and improve Latvias long-term growth potential rather than lead to complacency and relaxation of reform efforts Sustainable convergence of the economy in the longer term will require inter alia ongoing commitment to prudent fiscal policies (there are some recent signs of less prudent fiscal decision-making) a continuous use of macro-prudential tools to reduce risks from growing non-resident financial flows especially in view of recent Ukraine events and the implementation of reforms in a number of vested-interest-heavy areas These include higher education and science state owned enterprise management electricity and gas market liberalization and the judiciary including insolvency framework But above all and in order to ensure economic and social sustainability for years to come high rates of poverty social exclusion and dismal demographic trends need to be addressed boldly These and other structural challenges are being addressed by the Commission under the European Semester and the Post Program Surveillance frameworks Also Latvia has joined a euro area that is very different from what it was just a few years ago the euro area economic governance framework has been greatly strengthened entailing stricter obligations
(50) The Commissionrsquos alert mechanism reports issued under the Macroeconomic Imbalance Procedure have not identified economic imbalances in Latvia requiring further in-depth investigation for possible policy action
httpeceuropaeueurope2020pdf2014amr2014_enpdf
40 | Quarterly Report on the Euro Area
II4 Corporate balance sheet adjustment in the euro area and the United States (51)
This section compares balance sheet adjustment in the non-financial corporate sector in the euro area and the United States It shows that the adjustment since the crisis has been faster in the latter Despite similar steep rises in corporate debt in pre-crisis years US corporations have cut debt more than those in the euro area Shifts from loans to bonds and extensions of debt maturity have also been more pronounced in the United States Much of the difference in balance sheet consolidation can be traced back to more positive profitability trends providing US firms with the internal funds necessary to adjust balance sheets Differences in dividend distribution strategies and in corporations physical investment behaviours also played a role Profitability differences reflect differences both in cyclical conditions and labour market adjustment Comparatively slow progress in balance sheet consolidation is likely to weigh on investment recovery in the euro area
-----------------------
Introduction
Both the euro area and the United States experienced a surge in corporate indebtedness in the years preceding the global financial crisis and in its early stages The ratio of debt to gross value added by non-financial corporations (NFCs) rose by about 40 pp between 2005 and 2009 Deteriorating growth prospects and changing attitudes to risk have prompted NFCs in both economies to adjust their balance sheets As previously argued in the Quarterly Report balance sheet adjustment can have a substantial effect on economic activity and it is important to monitor regularly the ongoing adjustment in the euro area (52) This section contributes to the monitoring by comparing progress in corporate deleveraging in the euro area and in the United States two regions where firms entered the crisis with excessive debt
(51) Section prepared by Plamen Nikolov (52) See European Commission (2010) Focus Balance sheet
adjustment in the corporate sector Quarterly Report on the Euro Area Vol9 (3) pp 9-19 A more detailed overview of the literature on the impact of balance sheet adjustment can be found in Cuerpo C I Drumond J Lendvai P Pontuch and R Raciborski (2013) Indebtedness deleveraging dynamics and macroeconomic adjustment European Economy Economic Papers 477
Firms consolidate their balance sheets primarily by raising their net lendingborrowing (NLB) ie the cash obtained from their production activity and available for financial operations (53) A rise in NLB is achieved either by increasing savings or cuttingpostponing physical investment Firms increase savings by raising profits and reducing the dividends distributed to shareholders In firmsrsquo financial accounts a rise in corporate NLB is associated with a rise in financial assets andor a cut in financial liabilities The section reviews recent developments in euro area and US profitability savings and NLB and looks at the instruments that the corporate sector has used to consolidate its balance sheet on both the asset and the liability side
Corporate profits have disappointed in the euro area hellip
National account data show that corporate profitability in the euro area reached a pre-crisis peak in 2007Q3 ie later than in the United States where it had already started to decline in 2007 (54)
Graph II41 NFC profitability euro area and US
(2000Q1-2013Q3 of GVA)
20
25
30
35
40
45
00Q1 01Q3 03Q1 04Q3 06Q1 07Q3 09Q1 10Q3 12Q1 13Q3
Euro area (1)
US
(1)Excluding Latvia Source Eurostat US Bureau of Economic Analysis DG ECFIN calculations
(53) Firms can also consolidate their balance sheets by raising equity (54) Profitability like the other national account variables for the
corporate sector presented in this section is measured as a proportion of corporate sector activity represented by gross value added (GVA) It is calculated as the gross operating surplus plus financial revenues and subsidies and minus financial and tax expenses Financial expenses do not include earnings distributed to shareholders
II Special topics on the euro area economy
Volume 13 No 1 | 41
The 2008-09 recession brought a sharp drop in corporate profitability in the euro area Profitability recovered briefly in 2010 to reach a new peak in 2011 but has declined again since then (Graph II41) In the United States the impact of the crisis was rather muted with profits recovering vigorously after 2008 As a ratio to gross value added (GVA) US corporate profits had already passed their pre-crisis level in 2009 before flattening out in the past two years Overall by 2013 profitability in the euro area was still about 2 pp below its pre-crisis peak while in the United States it stood around 3 pp above
hellip mostly due to weak operating surplus
The disappointing profit performance in the euro area relative to the United States is largely due to differing developments in gross operating surplus Looking at the breakdown of the contribution to the cumulative change in corporate profitability since the start of the crisis there is a marked difference between firms in the euro area and those in the United States (Graphs II42 and II43) (55)
Graph II42 Profitability breakdown of NFCs euro area (1)
(cumulative change in from 2007Q3 peak to 2013Q3)
35
36
37
38
39
40
41
42
-100
-80
-60
-40
-20
0
20
40
60
80
100
07Q4 08Q4 09Q4 10Q4 11Q4 12Q4
Taxes (lhs)
Other net current transfers received (lhs)
Net property income received excl dividends paid (lhs)
Operating surplus (lhs)
Profits(rhs)(2)
(1)Excluding Latvia(2)Profits in of GVA Source Eurostat DG ECFIN calculations
In the euro area a fall in the ratio of operating surplus to GVA dragged overall profitability down after 2008 Despite an improvement in 2011 in
(55) The illustration of the contributions to the cumulative change in profitability only serves to depict the relative importance of the various components of the change in profits since the crisis The starting point for the cumulative change should not be interpreted as a reference point for a desirable profit recovery
2013 operating surplus was still contributing negatively to the cumulative change in profitability since the pre-crisis peak In contrast operating surplus in the United States responded to the crisis earlier than in the euro area but its contribution to the change in profits remained positive
Graph II43 Profitability breakdown of NFCs US
(cumulative change in from 2005Q3 peak to 2013Q3)
24
25
26
27
28
29
30
31
-100
-80
-60
-40
-20
0
20
40
60
80
100
05Q4 06Q4 07Q4 08Q4 09Q4 10Q4 11Q4 12Q4
Taxes (lhs)Other net current transfers received (lhs)Net property income received excl dividends paid (lhs)Operating surplus (lhs)Profits(rhs)(2)
(1) Profits in of GVA Source Federal Reserve Board US Bureau of Economic Analysis DG ECFIN calculations
Unlike operating surplus income tax payments and net income from non-operational activities did not differ significantly between the euro area and the United States (56) In both economies lower corporate tax payments resulting from lower profits generated by NFCs naturally had a positive impact on the cumulative change in profits from the pre-crisis peak
Differences in labour market developments are at the root of differences in profitability
Differences in operating surplus and profitability between the United States and the euro area can be attributed partly to differences in the business cycle In 2011Q1 NFCsrsquo gross value added was still 12 below its pre-crisis peak in the euro area but 11 above in the United States The main channel through which cyclical developments can affect operating surplus is the labour market
(56) In fact the ratio of profit tax payments to profits (a crude measure of an aggregate tax rate) in the euro area and the United States has been almost the same since the start of the crisis falling substantially in 2008-09 indicating that tax policy was not more favourable for profits in one economy than in the other
42 | Quarterly Report on the Euro Area
The cyclicality of operating surplus depends on the impact of the cycle on labour productivity as well as on wages The worse performance of operating surplus in the euro area since 2008 as compared with that in the United States reflects a stronger deterioration in labour productivity accompanied by unfavourable developments in wages per employee
Labour productivity growth in the euro area turned sharply negative in 2009 opening a big gap with the positive (albeit modest) wage growth (Graph II44) In the United States on the other hand labour productivity growth became negative earlier but to a lesser extent and some downward wage adjustment took place in 2009
Graph II44 Labour productivity and wages euro area and US
(2001Q4-2013Q3 y-o-y change)
-4
-3
-2
-1
0
1
2
3
4
5
01Q4 03Q2 04Q4 06Q2 07Q4 09Q2 10Q4 12Q2
Average wage per employee euro area (1) (2)Average wage per employee US (1)Labour productivity euro area (2) (3)Labour productivity US (3)
(1)Real wages calculated by the GDP deflator(2)Euro area excluding Latvia(3)In terms of total employment (thousands) Source Eurostat US Bureau of Economic Analysis US Bureau of Labour Statistics DG ECFIN calculations
There are a number of reasons for the different labour adjustments in the euro area and the United States In the former apart from a higher level of employment protection short-term work schemes were put in place in the early stages of the crisis (57) In addition as labour force adjustment tends to be more costly in the euro area some firms (particularly small firms and those with highly qualified employees) preferred to retain their
(57) According to the OECD Public short-term work schemes have
played an important role in preserving jobs during the crisis in a number of countries although significant hours reductions were also achieved via lower overtime hours hours averaging arrangements and employer initiatives see OECD Employment Outlook 2010 ndash Moving Beyond the Job Crisis
labour force (58) Because of a lack of wage flexibility the higher degree of lsquolabour hoardingrsquo in the euro area came at the expense of lower operating surplus and profits and consequently put a downward pressure on the capacity accumulate internal funds to deleverage
Corporate savings are much lower in the euro area
Negative developments in euro area corporate profitability were reflected in corporate savings which together with physical investment determines the internal funds available for balance sheet adjustment In 2009-10 there was a sharp drop in euro area savings because profits acted as shock absorbers and fell more rapidly than dividend payments leaving less spare cash available In contrast savings by US NFCs increased substantially on rising profits after an early-crisis low point and reached a historically high level of around 23 of GVA in 2010Q3 (Graph II45)
Graph II45 Savings of NFCs (2000Q1- 2013Q3 of GVA)
15
16
17
18
19
20
21
22
23
24
00Q1 01Q3 03Q1 04Q3 06Q1 07Q3 09Q1 10Q3 12Q1 13Q3
Euro area (1)
US
(1)Euro area excluding Latvia Source Eurostat Bureau of Economic Analysis DG ECFIN calculations
The impression that US corporate behaviour has been more geared towards accumulating savings than that in the euro area is reinforced when one looks at dividend distribution Dividends paid by euro area NFCs have been on a declining trend since the start of the crisis but those paid by US firms have also decreased This is remarkable given (58) See Box 12 Labour hoarding across different types of firms in
OECD Employment Outlook 2010 ndash Moving Beyond the Job Crisis
II Special topics on the euro area economy
Volume 13 No 1 | 43
the positive profit developments in the United States (Graph II46) A drop in dividends alongside profit growth suggests that after 2008 US companies preferred to direct a bigger proportion of the profit recovery to corporate savings and thereby balance sheet adjustment The ratio of dividends to profits in the United States has fallen from about one third before the crisis to one quarter now This ratio also dropped in the euro area although by less (59)
Graph II46 Dividends paid of NFCs (2000Q1-2013Q3 of GVA)
0
5
10
15
20
25
00Q1 01Q3 03Q1 04Q3 06Q1 07Q3 09Q1 10Q3 12Q1 13Q3
Euro area (1)
US
(1)Euro area excluding Latvia Source Eurostat Federal Reserve Board DG ECFIN calculations
Disappointing physical investment in the euro area and the United States
Cutting investment in physical assets is another way of reducing excessive indebtedness Corporate investment as a proportion of activity dropped sharply both in the euro area and in the United States in the early stages of the crisis (Graph II47)
After a modest recovery in 2010-11 the investment rate decreased again in the euro area The investment recovery was more solid in the United States but has lost momentum since the end of 2012 and the investment rate remains below its pre-crisis peak Overall it seems that euro area corporations partly compensated for less supportive savings developments than in the US by
(59) Dividend payments are not the only way of distributing profits to shareholders Equity buybacks can also be used for this purpose and firms that choose this option will tend to have higher savings and lower dividends paid
curbing physical investment more than their US counterparts
Graph II47 Investment of NFCs (2000Q1- 2013Q3 of GVA)
15
16
17
18
19
20
21
22
23
24
00Q1 01Q3 03Q1 04Q3 06Q1 07Q3 09Q1 10Q3 12Q1 13Q3
Euro area (1)
US
(1)Excluding Latvia Source Eurostat US Bureau of Economic Analysis DG ECFIN calculations
A more modest increase in net lending in the euro area than in the US
Since 2013 firmsrsquo net lending in the euro area has been in positive territory but substantially less so than that in the United States (Graph II48) Positive NLB in the euro area unlike that in the United States is mostly due to a low investment rate alone rather than low investment combined with high savings The combination of disappointing investment and high savings has translated into historically high and sustained NLB for US firms
This persistent net lending position in the United States is atypical as firms usually invest more than they save It suggests that US firms have been adjusting their balance sheets significantly since the beginning of the crisis via their internal funds while euro area firms seem to have opted for much slower balance sheet adjustment
44 | Quarterly Report on the Euro Area
Graph II48 Net lendingborrowing of NFCs
(2000Q1- 2013Q3 of GVA)
-10
-8
-6
-4
-2
0
2
4
6
8
00Q1 01Q3 03Q1 04Q3 06Q1 07Q3 09Q1 10Q3 12Q1 13Q3
Euro area (1)
US
(1)Excluding Latvia Source Eurostat US Bureau of Economic Analysis DG ECFIN calculations
Debt deleveraging has been more pronounced in the US than in the euro area
The faster pace of adjustment of balance sheets in the United States is confirmed by the corporate debt data (Graph II49) (60) (61) While both the euro area and the United States entered the crisis with swiftly rising and historically high levels of debt deleveraging has progressed more rapidly in the latter since the crisis By the beginning of 2012 US corporate debt had fallen by approximately 15 pp as a proportion of activity while euro area debt had dropped by 7 pp (62)
(60) Non-financial corporate debt consists of loans and securities
other than shares (corporate bonds) both can be classified as short- or long-term depending on whether their original maturity is less or more than one year
(61) This section analyses developments in non-consolidated financial flows and stocks in the euro area and in the United States for two reasons it is important to have a sense of financial positions within the institutional sector eg loans between NFCs are an important part of intra-firm relationships as head offices use them to finance subsidiaries for example perhaps for tax reasons This is relatively more important in the euro area than in the United States Consolidated financial asset and flow data eliminate these intra-sector positions and different approaches may be taken to consolidation as in the euro area there is the additional issue of cross-border consolidation between Member States while there is no need for flows and positions between firms in different US states to be treated separately
(62) The debt-to-equity ratio is another measure of corporate leverage widely followed by investors Faster stock market recovery helped US firms reduce this ratio more than those in the euro area
Graph II49 Debt levels of NFCs(1) (1999Q1-2013Q3 of GVA)
100
120
140
160
180
200
220
99Q1 00Q3 02Q1 03Q3 05Q1 06Q3 08Q1 09Q3 11Q1 12Q3
Euro area (2)
US
(1)Securities other than shares and loans(2)Excluding Latvia Source Eurostat US Bureau of Economic Analysis DG ECFIN calculations
Firms in the euro area and the United States entered the crisis with almost the same level of short-term debt as a proportion of total debt Since the crisis the adjustment away from short-term debt has been significantly more pronounced in the United States suggesting more active balance sheet restructuring
Graph II410 Debt flows of NFCs(1) (1999Q1- 2013Q3 of GVA)
-15
-10
-5
0
5
10
15
20
99Q1 01Q1 03Q1 05Q1 07Q1 09Q1 11Q1 13Q1
Euro area bonds (2)
US bonds
Euro area loans (2)
US loans
(1)Securities other than shares and loans (2)Excluding Latvia Source Eurostat US Bureau of Economic Analysis DG ECFIN calculations
Due to differences in the structure of corporate finance loans (as opposed to bonds) tend to form a bigger proportion of debt in the euro area than in the United States An important element of the
II Special topics on the euro area economy
Volume 13 No 1 | 45
corporate balance sheet adjustment process in both economies has been a movement away from an excessive reliance on loans (Graph II410) and towards bond financing This trend has been substantially more pronounced in the United States presumably reflecting the fact that bond markets are more developed in that country
Developments in non-financial corporate debt were also influenced by developments in financial intermediation in particular in the banking sector Financial accounts show NFCsrsquo debt exposure but do not indicate whether the debt holder is a bank According to bank balance sheet statistics the nominal growth of loans vis-agrave-vis NFCs has been mostly negative in the euro area since 2009Q4 (Graph II411) Coupled with the positive loan inflows seen in the national accounts between 2010Q3 and 2012Q3 (Graph II410) this shows a degree of substitution in corporate loan liability ownership between banks and other financial firms and sectors (including other NFCs) in this period According to the counterparty breakdown of NFC domestic loans published by the ECB corporate borrowings from other NFCs represented 29 of all loans by 2013Q3 (up from 26 in 2008Q1) while the proportion of borrowings from monetary financial institutions (MFIs) had dropped (from 60 in 2008Q1) to an all-time low of 53 The proportion of loans from other non-bank financial intermediaries also increased There is less evidence of a shift from banks to other loan providers in the United States where loans between NFCs are much more limited
Graph II411 Bank loans to NFCs (1999Q1- 2013Q3 y-o-y change)
-20
-15
-10
-5
0
5
10
15
20
25
99Q1 00Q3 02Q1 03Q3 05Q1 06Q3 08Q1 09Q3 11Q1 12Q3
Euro area bank loans to NFCs (1)US bank loans to NFCs
(1)Excluding Latvia Source ECB US Federal Reserve Board DG ECFIN calculations
Positive NLB has been used to acquire safe financial assets in both regions
In both the euro area and the United States the positive NLB has been used to deleverage but also to invest in safe financial assets At the beginning of the crisis much of the positive corporate NLB in the United States was invested in money market mutual funds which is essentially investment in short-term low-risk assets (Graph II412) (63)
Currency and deposits (another type of safe asset) have increased substantially in the euro area in recent years as a proportion of total firm activity (Graph II413) This rise was driven almost exclusively by a rapid increase in firmsrsquo savings deposits To some extent a similar trend is observable in the United States In particular US cash balances (a sub-component of currency and deposits) approached 12 of GVA by the end of 2013 a level not seen since the early 1990s On the other hand savings deposits have grown more modestly resulting in a moderately positive overall trend in currency and deposits
Graph II412 Mutual fund shares of NFCs (1999Q1- 2013Q3 of GVA)
0
2
4
6
8
10
12
14
99Q1 01Q1 03Q1 05Q1 07Q1 09Q1 11Q1 13Q1
Euro area (1)
US (2)
(1)Excluding Latvia(2)In the USA these asset series can be broken down into investment in money market mutual funds and investment in other mutual funds The 2009-11 increase is fully attributable to the former Source Eurostat US Bureau of Economic Analysis DG ECFIN calculations
Overall these two aspects of corporate financial investment behaviour signify considerable liquidity concerns on the part of firms in both the euro area
(63) Euro area financial accounts only show firmsrsquo investment in mutual funds overall and do not distinguish between types of mutual funds
46 | Quarterly Report on the Euro Area
and the United States They also represent a drive towards lower-risk assets perhaps indicating increased risk aversion by corporations or a tendency to postpone physical investment in a context of perceived high uncertainty
Graph II413 Currency and deposits ndash NFCs
(1999Q1- 2013Q3 of GVA)
0
5
10
15
20
25
30
35
40
45
99Q1 00Q3 02Q1 03Q3 05Q1 06Q3 08Q1 09Q3 11Q1 12Q3
Euro area (1)
US
(1)Excluding Latvia Source Eurostat US Bureau of Economic Analysis DG ECFIN calculations
Conclusion
Although both regions saw similar steep rises in corporate debt in the pre-crisis years balance sheet adjustment since the crisis has been significantly slower in the euro area than in the United States The more rapid adjustment in the United States can be explained by a stronger cyclical recovery more supportive profitability developments and reduced dividend payment ratios In the euro area profitability has been hindered by a combination of lower flexibility in the labour markets and slow wage adjustment
The slower balance sheet adjustment in the euro area corporate sector is visible in a slower fall in indebtedness but also a slower adjustment of the structure of balance sheets In particular the shift from loans to bonds and the extension of debt maturity have been more pronounced in the United States In both regions firms have used their positive NLB to accelerate the accumulation of safe and liquid financial assets This could reflect continuing uncertainty regarding future demand and growth prospects
Overall the evidence discussed in this section shows that euro area firms are lagging significantly behind their US counterparts in terms of balance sheet consolidation Given that investment rates remain disappointing even in the more advanced US corporate sector a degree of caution appears warranted when assessing short-term prospects for corporate investment in the euro area
III Recent DG ECFIN publications
Volume 13 No 1 | 47
1 Occasional Papers
European Economy Occasional Papers 170 January 2014 Financial Assistance Programme for the Recapitalisation of Financial Institutions in Spain Fifth Review ndash Winter 2014 httpeceuropaeueconomy_financepublicationsoccasional_paper2014pdfocp170_enpdf
European Economy Occasional Papers 169 December 2013 The Economic Adjustment Programme for Cyprus Second Review ndash Autumn 2013 httpeceuropaeueconomy_financepublicationsoccasional_paper2013pdfocp169_enpdf
European Economy Occasional Papers 168 December 2013 Fiscal frameworks in the European Union ommission services country factsheets for the Autumn 2013 Peer Review httpeceuropaeueconomy_financepublicationsoccasional_paper2013pdfocp168_enpdf
European Economy Occasional Papers 167 December 2013 Economic Adjustment Programme for Ireland - Autumn 2013 Review httpeceuropaeueconomy_financepublicationsoccasional_paper2013pdfocp167_enpdf
European Economy Occasional Papers 166 December 2013 Progress towards meeting the economic criteria for EU accession the EU Commissionrsquos 2013 assessments httpeceuropaeueconomy_financepublicationsoccasional_paper2013pdfocp166_enpdf
European Economy Occasional Papers 165 November 2013 Romania Balance-of-Payments Assistance Programme 2013-2015 httpeceuropaeueconomy_financepublicationsoccasional_paper2013pdfocp165_enpdf
European Economy Occasional Papers 164 November 2013 The Economic Adjustment Programme for Portugal Eighth and Ninth Review httpeceuropaeueconomy_financepublicationsoccasional_paper2013pdfocp164_enpdf
European Economy Occasional Papers 163 November 2013 Financial Assistance Programme for the Recapitalisation of Financial Institutions in Spain Fourth Review ndash Autumn 2013 httpeceuropaeueconomy_financepublicationsoccasional_paper2013pdfocp163_enpdf
European Economy Occasional Papers 162 October 2013 Economic Adjustment Programme for Ireland Summer 2013 Review httpeceuropaeueconomy_financepublicationsoccasional_paper2013pdfocp162_enpdf
2 Economic papers
European Economy Economic Papers 514 February 2014 Martin Larch Kristin Magnusson Bernard Balint Tatar Hard work and More How to successfully conduct adjustment with official assistance httpeceuropaeueconomy_financepublicationseconomic_paper2014pdfecp514_enpdf
European Economy Economic Papers 513 February 2014 Florian Woumlhlbier Caterina Astarita Gilles Mourre Consolidation on the revenue side and growth-friendly tax structures an indicator based approach httpeceuropaeueconomy_financepublicationseconomic_paper2014pdfecp513_enpdf
48 | Quarterly Report on the Euro Area
European Economy Economic Papers 512 December 2013 Alexander Schwan Etienne Sail Assessing the economic and budgetary impact of linking retirement ages and pension benefits to increases in longevity httpeceuropaeueconomy_financepublicationseconomic_paper2013pdfecp512_enpdf 3 Other publications
Winter forecast 2014 - EU economy recovery gaining ground httpeceuropaeueconomy_financepublicationseuropean_economy2014pdfee2_enpdf 4 Regular publications
Business and Consumer Surveys (harmonised surveys for different sectors of the economies in the European Union (EU) and the applicant countries) httpeceuropaeueconomy_financedb_indicatorssurveysindex_enhtm Business Climate Indicator for the euro area (monthly indicator designed to deliver a clear and early assessment of the cyclical situation) httpeceuropaeueconomy_financedb_indicatorssurveysdocuments2013bci_2013_11_enpdf Key indicators for the euro area (presents the most relevant economic statistics concerning the euro area) httpeceuropaeueconomy_financedb_indicatorskey_indicatorsindex_enhtm Monthly and quarterly notes on the euro-denominated bond markets (looks at the volumes of debt issued the maturity structures and the conditions in the market) httpeceuropaeueconomy_financepublicationsbond_marketindex_enhtm Price and Cost Competitiveness httpeceuropaeueconomy_financedb_indicatorscompetitivenessindex_enhtm
50 | Quarterly Report on the Euro Area
Editor-in-Chief Elena Flores
Overall coordination Eric Ruscher
Data assistance Christos Zavos
Comments on the report would be gratefully received and should be sent to
Elena Flores Director ndash Policy Strategy and Coordination Directorate-General for Economic and Financial Affairs Office CHAR 1566
B-1049 Brussels
Email elenafloreseceuropaeu
or
Eric Ruscher Head of Unit ndash Macroeconomy of the euro area Directorate-General for Economic and Financial Affairs Office CHAR 15248
B-1049 Brussels
Email ericruschereceuropaeu
HOW TO OBTAIN EU PUBLICATIONS Free publications bull one copy
via EU Bookshop (httpbookshopeuropaeu) bull more than one copy or postersmaps
from the European Unionrsquos representations (httpeceuropaeurepresent_enhtm) from the delegations in non-EU countries (httpeeaseuropaeudelegationsindex_enhtm) by contacting the Europe Direct service (httpeuropaeueuropedirectindex_enhtm) or calling 00 800 6 7 8 9 10 11 (freephone number from anywhere in the EU) () () The information given is free as are most calls (though some operators phone boxes or hotels may charge you)
Priced publications bull via EU Bookshop (httpbookshopeuropaeu) Priced subscriptions bull via one of the sales agents of the Publications Office of the European Union
(httppublicationseuropaeuothersagentsindex_enhtm)
KC-AK-14-001-en-n
- Blank Page
- Blank Page
- Blank Page
- Blank Page
-

II Special topics on the euro area economy
Volume 13 No 1 | 35
II3 Latvia maintaining sustainable growth after the boom-bust years (44)
Latvia had been keen to join the euro area at the earliest opportunity with entry in January 2008 the clear target As the economy overheated however significant macro-economic imbalances accumulated which deferred these plans Between 2005 and 2007 unsustainable GDP growth went hand in hand with a mounting current account deficit and a housing market spiralling out of control When credit flows then abruptly reversed the countryrsquos GDP contracted dramatically Latvia was placed in the EUIMF-led financial assistance programme and was forced to carry out ambitious fiscal consolidation and structural reforms Reallocating resources to the tradable sector was the first important step on the road to an export-driven recovery Under the burden of deleveraging and consolidation the revival of domestic demand was slow at first From 2011 however supported by favourable labour market developments growth in demand has accelerated Latvia has reclaimed its position as the fastest-growing EU economy however the current level of growth is lower than the unstainable rates recorded in the boom years and it is now seen as sustainable Thanks to this balanced growth Latvia has not been subject to the MIP since its launch in 2012 Despite the financial assistance-supported measures to preserve equity the social burden of economic adjustment as evidenced by poverty social exclusion and emigration rates has been high but measures are being taken by the authorities to counter these effects Continued commitment to prudent fiscal policies will be critical for the countryrsquos economic future The use of macro-prudential tools to reduce the risks posed by large non-resident financial flows and the implementation of ambitious structural reforms will also play an important role
-----------------------
Introduction
To welcome Latvias recent adoption of the euro this section reviews the countrys recent boom-bust experience and discusses the challenges ahead
Five years ago it would have been difficult to imagine that Latvia would be able to fulfil the conditions for adopting the euro and enter the euro
(44) Section prepared by Gatis Eglitis and Christian Weise
area in January 2014 After EU accession in May 2004 significant macro-economic imbalances had started to accumulate on the back of an overheating economy and by autumn 2008 the country was on the brink of bankruptcy A painful and seemingly impossible economic adjustment to be achieved by means of internal devaluation lay ahead This would require unprecedented fiscal consolidation huge redundancies and difficult structural reforms threatening political and social stability Yet despite pronounced scepticism from the outset and particularly at the height of the crisis in mid-2009 the economy has moved back to growth The measures implemented took some time to take effect with the economy continuing to decline at first before picking up as seen in the lsquoVrsquo-shaped recovery but a protracted recession was avoided Latviarsquos GDP growth has exceeded expectations reaching levels of 54 in 2011 52 in 2012 and around 4 in 2013 The two factors that were critical to the countryrsquos economic recovery were a return to international competitiveness and the rapid correction of external imbalances The budget deficit decreased significantly and is expected to reach a balanced position in the near future The level of government debt is projected to stay around 40-42 of GDP in 2013-2014 and to decline to 33 of GDP in 2015 as the repayments to the EU take effect and sizable cash buffers will be reduced The financial assistance programme was successfully completed in January 2012 Financial support had not been necessary since October 2010 however and the government had re-entered international bond markets in June 2011 well ahead of schedule (45) As of 2013 GDP per capita in constant prices has returned to the level reached at its peak in 2007 Due to the decline in the population however the absolute value of GDP in constant prices was still about 9 below 2007 levels with current projections suggesting that a full recovery to the pre-crisis peak will be achieved in 2015
Overheating imbalances and a big bust
Latvia joined the EU in seemingly good macroeconomic health and having pegged its currency to the Special Drawing Right (SDR) in
(45) Occasional Paper 120 issued by the European Commission Directorate-General for Economic and Financial Affairs EU Balance of Payments assistance for Latvia foundations of success httpseceuropaeueconomy_financepublicationsoccasional_paper2012op120_enhtm
36 | Quarterly Report on the Euro Area
1994 and then to the euro in 2005 was keen to join the euro area in January 2008 Upon entering the Exchange Rate Mechanism II (ERM II) on 2 May 2005 the authorities unilaterally committed to maintaining a smaller fluctuation margin of plusmn1 around the central rate ndash seen as a sign of the countryrsquos determination to join the euro area The Latvian economy was the fastest growing in the EU between 2000 and 2007 and between 2005 and 2007 real GDP growth reached a yearly average of over 10 Following accession to the EU in 2004 Latvia along with other EU countries witnessed a rapid credit expansion Loans to residents grew at an average annual rate of close to 50 between 2004 and 2008 a reflection of the excess liquidity at that time and of the resulting hot money inflows into central and eastern European economies which were rapidly converging with their western European counterparts Foreign investment exploded driven by commercial banksrsquo mispricing of risk and over-optimistic expectations of convergence A number of privatisation deals and most importantly a burgeoning real-estate market characterised by soaring prices also served to attract foreign investors The tradable sector was meanwhile largely neglected By way of illustration foreign direct investment (FDI) reached relatively high levels of 84 and 81 of GDP in 2006 and 2007 respectively but most of this was directed towards the real-estate market while the proportion of total FDI relating to manufacturing was only 12 in 2013 Significant imbalances were accumulating as indicated by a current account deficit that reached around 22 of GDP in 2006 and 2007 and by labour market tightening Nominal wages doubled between 2004 and 2007 increasing much faster than productivity and thus damaging international competitiveness
By early 2008 more cautious bank lending had caused economic growth to slow significantly By autumn of the same year this slowdown had developed into a strong contraction reflecting the wider global economic situation The global economy fell into recession commodity prices reached record highs and the general risk aversion seen in global markets following the collapse of Lehman Brothers cut off Latviarsquos access to financial markets The second largest domestic bank Parex had to be rescued Latvia ultimately experienced the most severe GDP contraction of all EU countries at close to 18 in 2009 The government deficit threatened to spiral out of control Having been at 03 of GDP in 2007 and 42 in 2008 in spring 2009 it was projected to
reach levels well above 15 of GDP by the end of year in the absence of a significant consolidation package
Faced with an economic crisis of this order Latvia agreed a medium-term financial assistance programme the balance of payments programme (BoP) with the EU and the IMF in December 2008 (46) The aim of this was to preserve the existing exchange-rate arrangement The assistance offered to Latvia was made subject to a number of policy conditions relating to fiscal consolidation financial sector stabilisation and the introduction of a wide range of structural reforms including a significant acceleration in the absorption of EU structural funds The Latvian government also undertook to strengthen the social safety net so as to protect the most vulnerable from the effects of the crisis
Brave measures in difficult times
Given that the exchange rate was at that time pegged to the euro some economists suggested devaluation as the only way out of the crisis The national authorities and international partners did not see that as a viable option however because its effectiveness would have been severely limited by the degree to which imports were used in the manufacture of exports and the high proportion of foreign liabilities Furthermore it would have brought with it the risk of mass bankruptcy and a partial collapse of the domestic banking system at a time when the judicial system was clearly not capable of coping with such a fall-out In addition devaluation would have provided no incentive to solve Latviarsquos structural problems including weak fiscal governance the unsustainability of pension expenditure loss-making state-owned banks a lack of competitiveness and weak institutions
Between 2009 and 2011 the Latvian government carried out an ambitious programme of fiscal adjustment designed to correct the previously loose fiscal policy the weaknesses of which had been hidden by the countryrsquos strong economic growth This difficult adjustment restored Latviarsquos public finances to better health and established a
(46) Funds available from EU countries IMF World Bank EBRD
and Norway amounted to euro 75 billion of which Latvia used euro 45 billion (60) with euro 29 billion lent by the European Commission on behalf of the EU The first tranche of EUR 1 billion (13 of the total) was repaid by Latvia on 25 March 2014
II Special topics on the euro area economy
Volume 13 No 1 | 37
framework which would be sustainable in the long term The nominal balance improved with the deficit being cut from 98 of GDP in 2009 to 13 of GDP in 2012 and 2013 (see graph II31) The structural deficit also fell from its peak of 55 of GDP in 2008 to around 025 of GDP in 2012 and 2013 beating Latviarsquos medium-term objective of -05 of GDP as set in the convergence programmes
Latviarsquos fiscal consolidation measures were undoubtedly bold with fiscal savings equivalent to around 17 of GDP implemented within three years The measures were frontloaded and half of these savings were implemented in the first year alone The measures were on the whole expenditure-oriented with over half of the savings coming from cuts to health education and public administration budgets The most notable measure relating to revenue was an increase in VAT from 18 to 22 The consolidation strategy was eventually successful in containing the adverse effects of the budget deficit on the economy In fact it even appears to have triggered lsquonon-Keynesianrsquo effects on demand by restoring confidence and stimulating demand and investment at the point when it was most needed (47)
Graph II31 Latviarsquos government budget balance and debt (2008-15 of GDP)
Source DG ECFIN Commissionrsquos spring 2013 forecast
The fiscal framework was also strengthened significantly by the law on fiscal discipline coming into force in March 2013 and the creation of a fiscal council in January 2014 The signing of the
(47) Ibid see Chapter 4 Fiscal consolidation in the midst of the crisis
Treaty on Stability Coordination and Governance in the EMU (48) in March 2012 provided further EU-level support for the national fiscal framework
An additional factor that was critical to the success of the consolidation strategy but is often overlooked was the availability of significant EU funds (particularly from around 2009 onwards) which acted as a much-needed demand trigger in sectors affected by the decline in economic activity Between 2007 and 2013 Latvia benefited from the third highest allocation of EU funds after Hungary and Lithuania receiving a yearly average equivalent to around 28 of GDP or 70 of gross fixed capital formation(49) As on average every euro of national budget spending was supplemented by five to six euros co-financing from EU funds national expenditure on items such as road and public building construction vocational education and training of unemployed science infrastructure development and healthcare was often replaced by Structural funds financing despite being in conflict with the EU funds additionality principle Clearly such large inflows of EU financing also generated substantial tax revenues in particular VAT at a time when private consumption was weak
The Latvian labour market demonstrated a high level of flexibility during the crisis thanks in part to a decentralised wage-setting system Significant public-sector wage cuts indirectly supported nominal wage reduction in the private sector in 2009 and 2010 when earnings per employee fell by a total of 19 over two years Employment levels fell sharply especially in the private sector as jobs were cut in construction and manufacturing The unemployment rate reached around 20 in early 2010 but had fallen back to 119 by 2013 due mainly to growth in employment with the participation rate also increasing significantly over this period The projection from the Commissionrsquos 2014 winter forecast shows wages in 2014-15 growing broadly in line with productivity although the labour market is tightening and structural problems in particular regional differences and skill mismatches could create pressures in the economy
(48) httpeuropean-councileuropaeumedia639235st00tscg26_en12pdf
(49) Source Directorate-General for Regional Policy Infoview
38 | Quarterly Report on the Euro Area
External cost competitiveness has improved noticeably since 2008 with labour costs falling significantly and labour productivity in particular in the tradable sector increasing In 2008 the real effective exchange rate (REER) adjusted for unit labour costs reached a peak of 64 above the 2000 level before falling by about 20 in 2009-10 since when it has remained broadly stable (see graph II32) This level of REER is considered sustainable as the country has been seen to be steadily gaining market share over recent years (including as measured by exports adjusted for the growth of markets) The percentage of the countryrsquos GDP attributable to exports rose to 60 in 2013 from 43 in 2007 with some 60 of exports destined for the EU and 12 for Russia
Graph II32 Effective exchange rates Latvia v 35 trading partners
(Jan 2007-Dec 2013 monthly avg 2007 = 100)
Source DG ECFIN
The social burden of economic adjustment has admittedly been high in Latvia despite the policy measures contained in the Memorandum of Understanding stipulating inter alia establishment of a comprehensive social safety net supporting local governments in providing social assistance and discounting social payments from overall budget targets High unemployment has led to a wave of emigration to richer EU countries which coupled with Latviarsquos low fertility and high death rates has seen the population decrease by 8-10 since 2008 Net emigration has now fallen substantially however since the peak of the crisis years The rates of poverty and social exclusion in Latvia are among the highest in the EU families with children unemployed people people with disabilities and people living in rural areas are particularly at risk The countryrsquos spending on
social protection and healthcare as a percentage of GDP is among the lowest in the EU Furthermore the social protection measures which do exist to reduce poverty tend to be ineffective highlighting the importance of a robust social safety net It appears however that with the improved economic situation and increasing levels of general social awareness the authorities are finally starting to address the challenges of poverty and social exclusion with greater determination In recent years for example taxation of low-income earners has been cut slightly and child poverty has been reduced thanks to increases in various child-related benefits Proposals for reforms to social assistance in line with 2013 World Banks study are being gradually implemented Better targeted more effective policies relating to the active labour market mostly financed by the European Social Fund are helping unemployed people in particular the long-term unemployed and young people to find work or to obtain relevant training
As part of the BoP programme and in the context of the assessment of Latviarsquos readiness to join the euro area financial supervision has been tightened and EU resources for supervision and monitoring increased in particular for monitoring the growing non-resident banking sector Additional liquidity and capital adequacy requirements for non-resident banks were introduced in 2013 regular on- and off-site checks of these banks are being performed the deposit guarantee fund has been further strengthened and monitoring has been stepped up in relation to pledged assets and the origin of funds in bank recapitalizations This strengthened regulatory policy has been introduced partly as a result of lessons learnt at significant cost in the past five years most notably with the Parex and Krajbanka failures
Latvia has implemented a series of ambitious reforms to the business environment in recent years with the aim of reducing start-up costs simplifying procedures for property registration construction permits and tax collection and introducing out-of-court settlement of insolvencies In doing so Latvia has brought its regulatory framework a significant step closer to what is regarded as best practice In the World Bankrsquos 2014 Doing Business report Latvia was ranked 25th out of 185 countries with only four euro-area members faring better
II Special topics on the euro area economy
Volume 13 No 1 | 39
Conclusion
The origins of Latviarsquos years of boom and bust can be traced back to the domestic regional and global circumstances at that time globally excess liquidity and hot money flowing into vulnerable countries regionally unrealistic expectations of income convergence in central and eastern Europe and domestically undue optimism about growth in personal incomes and mispricing of risk by commercial banks amplified by the behaviour of both policymakers and individuals
A broad range of country-specific and general economic factors have contributed to the successful economic adjustment seen in Latvia since the height of the crisis Ambitious front-loaded and largely expenditure-based fiscal consolidation helped to contain the budget deficit whilst the confidence generated by the introduction of a credible programme itself aided the economic recovery The flexibility of the labour market meanwhile helped companies to restore competitiveness by means of wage reductions and job cuts Competitiveness was also improved by steps taken to shift the tax burden from labour to consumption and property The recovery in Latvia was very much export-driven with the growth in exports made possible by the openness of the economy and the faster-than-expected economic growth experienced by major trading partners A number of structural reforms including bank restructuring and measures improving the use of EU funds have contributed to the development of a more favourable business environment A generous allocation from the European structural funds meanwhile helped to boost public investment and supported financing and reforms in many important sectors Above all the success of the recovery measures implemented in Latvia proved that for a tough internal economic adjustment to be effective there needs to be both a determined political will to carry out unpopular reforms and also a fully-developed comprehensive social safety net to protect more vulnerable groups
in society during difficult times In addition Latvia benefited from the fact that those looking for work were able to migrate to other EU countries which helped to alleviate the social tension created by the effects of the crisis Some of the lessons above are clearly applicable to other Member States undergoing challenging economic adjustment while others are more Latvia-specific
While Latviarsquos current level of economic growth is regarded as sustainable (50) and the adoption of the euro is recognised as a significant and hard-earned achievement it is not the end of the road The current robust economic situation should be used to advance reforms and improve Latvias long-term growth potential rather than lead to complacency and relaxation of reform efforts Sustainable convergence of the economy in the longer term will require inter alia ongoing commitment to prudent fiscal policies (there are some recent signs of less prudent fiscal decision-making) a continuous use of macro-prudential tools to reduce risks from growing non-resident financial flows especially in view of recent Ukraine events and the implementation of reforms in a number of vested-interest-heavy areas These include higher education and science state owned enterprise management electricity and gas market liberalization and the judiciary including insolvency framework But above all and in order to ensure economic and social sustainability for years to come high rates of poverty social exclusion and dismal demographic trends need to be addressed boldly These and other structural challenges are being addressed by the Commission under the European Semester and the Post Program Surveillance frameworks Also Latvia has joined a euro area that is very different from what it was just a few years ago the euro area economic governance framework has been greatly strengthened entailing stricter obligations
(50) The Commissionrsquos alert mechanism reports issued under the Macroeconomic Imbalance Procedure have not identified economic imbalances in Latvia requiring further in-depth investigation for possible policy action
httpeceuropaeueurope2020pdf2014amr2014_enpdf
40 | Quarterly Report on the Euro Area
II4 Corporate balance sheet adjustment in the euro area and the United States (51)
This section compares balance sheet adjustment in the non-financial corporate sector in the euro area and the United States It shows that the adjustment since the crisis has been faster in the latter Despite similar steep rises in corporate debt in pre-crisis years US corporations have cut debt more than those in the euro area Shifts from loans to bonds and extensions of debt maturity have also been more pronounced in the United States Much of the difference in balance sheet consolidation can be traced back to more positive profitability trends providing US firms with the internal funds necessary to adjust balance sheets Differences in dividend distribution strategies and in corporations physical investment behaviours also played a role Profitability differences reflect differences both in cyclical conditions and labour market adjustment Comparatively slow progress in balance sheet consolidation is likely to weigh on investment recovery in the euro area
-----------------------
Introduction
Both the euro area and the United States experienced a surge in corporate indebtedness in the years preceding the global financial crisis and in its early stages The ratio of debt to gross value added by non-financial corporations (NFCs) rose by about 40 pp between 2005 and 2009 Deteriorating growth prospects and changing attitudes to risk have prompted NFCs in both economies to adjust their balance sheets As previously argued in the Quarterly Report balance sheet adjustment can have a substantial effect on economic activity and it is important to monitor regularly the ongoing adjustment in the euro area (52) This section contributes to the monitoring by comparing progress in corporate deleveraging in the euro area and in the United States two regions where firms entered the crisis with excessive debt
(51) Section prepared by Plamen Nikolov (52) See European Commission (2010) Focus Balance sheet
adjustment in the corporate sector Quarterly Report on the Euro Area Vol9 (3) pp 9-19 A more detailed overview of the literature on the impact of balance sheet adjustment can be found in Cuerpo C I Drumond J Lendvai P Pontuch and R Raciborski (2013) Indebtedness deleveraging dynamics and macroeconomic adjustment European Economy Economic Papers 477
Firms consolidate their balance sheets primarily by raising their net lendingborrowing (NLB) ie the cash obtained from their production activity and available for financial operations (53) A rise in NLB is achieved either by increasing savings or cuttingpostponing physical investment Firms increase savings by raising profits and reducing the dividends distributed to shareholders In firmsrsquo financial accounts a rise in corporate NLB is associated with a rise in financial assets andor a cut in financial liabilities The section reviews recent developments in euro area and US profitability savings and NLB and looks at the instruments that the corporate sector has used to consolidate its balance sheet on both the asset and the liability side
Corporate profits have disappointed in the euro area hellip
National account data show that corporate profitability in the euro area reached a pre-crisis peak in 2007Q3 ie later than in the United States where it had already started to decline in 2007 (54)
Graph II41 NFC profitability euro area and US
(2000Q1-2013Q3 of GVA)
20
25
30
35
40
45
00Q1 01Q3 03Q1 04Q3 06Q1 07Q3 09Q1 10Q3 12Q1 13Q3
Euro area (1)
US
(1)Excluding Latvia Source Eurostat US Bureau of Economic Analysis DG ECFIN calculations
(53) Firms can also consolidate their balance sheets by raising equity (54) Profitability like the other national account variables for the
corporate sector presented in this section is measured as a proportion of corporate sector activity represented by gross value added (GVA) It is calculated as the gross operating surplus plus financial revenues and subsidies and minus financial and tax expenses Financial expenses do not include earnings distributed to shareholders
II Special topics on the euro area economy
Volume 13 No 1 | 41
The 2008-09 recession brought a sharp drop in corporate profitability in the euro area Profitability recovered briefly in 2010 to reach a new peak in 2011 but has declined again since then (Graph II41) In the United States the impact of the crisis was rather muted with profits recovering vigorously after 2008 As a ratio to gross value added (GVA) US corporate profits had already passed their pre-crisis level in 2009 before flattening out in the past two years Overall by 2013 profitability in the euro area was still about 2 pp below its pre-crisis peak while in the United States it stood around 3 pp above
hellip mostly due to weak operating surplus
The disappointing profit performance in the euro area relative to the United States is largely due to differing developments in gross operating surplus Looking at the breakdown of the contribution to the cumulative change in corporate profitability since the start of the crisis there is a marked difference between firms in the euro area and those in the United States (Graphs II42 and II43) (55)
Graph II42 Profitability breakdown of NFCs euro area (1)
(cumulative change in from 2007Q3 peak to 2013Q3)
35
36
37
38
39
40
41
42
-100
-80
-60
-40
-20
0
20
40
60
80
100
07Q4 08Q4 09Q4 10Q4 11Q4 12Q4
Taxes (lhs)
Other net current transfers received (lhs)
Net property income received excl dividends paid (lhs)
Operating surplus (lhs)
Profits(rhs)(2)
(1)Excluding Latvia(2)Profits in of GVA Source Eurostat DG ECFIN calculations
In the euro area a fall in the ratio of operating surplus to GVA dragged overall profitability down after 2008 Despite an improvement in 2011 in
(55) The illustration of the contributions to the cumulative change in profitability only serves to depict the relative importance of the various components of the change in profits since the crisis The starting point for the cumulative change should not be interpreted as a reference point for a desirable profit recovery
2013 operating surplus was still contributing negatively to the cumulative change in profitability since the pre-crisis peak In contrast operating surplus in the United States responded to the crisis earlier than in the euro area but its contribution to the change in profits remained positive
Graph II43 Profitability breakdown of NFCs US
(cumulative change in from 2005Q3 peak to 2013Q3)
24
25
26
27
28
29
30
31
-100
-80
-60
-40
-20
0
20
40
60
80
100
05Q4 06Q4 07Q4 08Q4 09Q4 10Q4 11Q4 12Q4
Taxes (lhs)Other net current transfers received (lhs)Net property income received excl dividends paid (lhs)Operating surplus (lhs)Profits(rhs)(2)
(1) Profits in of GVA Source Federal Reserve Board US Bureau of Economic Analysis DG ECFIN calculations
Unlike operating surplus income tax payments and net income from non-operational activities did not differ significantly between the euro area and the United States (56) In both economies lower corporate tax payments resulting from lower profits generated by NFCs naturally had a positive impact on the cumulative change in profits from the pre-crisis peak
Differences in labour market developments are at the root of differences in profitability
Differences in operating surplus and profitability between the United States and the euro area can be attributed partly to differences in the business cycle In 2011Q1 NFCsrsquo gross value added was still 12 below its pre-crisis peak in the euro area but 11 above in the United States The main channel through which cyclical developments can affect operating surplus is the labour market
(56) In fact the ratio of profit tax payments to profits (a crude measure of an aggregate tax rate) in the euro area and the United States has been almost the same since the start of the crisis falling substantially in 2008-09 indicating that tax policy was not more favourable for profits in one economy than in the other
42 | Quarterly Report on the Euro Area
The cyclicality of operating surplus depends on the impact of the cycle on labour productivity as well as on wages The worse performance of operating surplus in the euro area since 2008 as compared with that in the United States reflects a stronger deterioration in labour productivity accompanied by unfavourable developments in wages per employee
Labour productivity growth in the euro area turned sharply negative in 2009 opening a big gap with the positive (albeit modest) wage growth (Graph II44) In the United States on the other hand labour productivity growth became negative earlier but to a lesser extent and some downward wage adjustment took place in 2009
Graph II44 Labour productivity and wages euro area and US
(2001Q4-2013Q3 y-o-y change)
-4
-3
-2
-1
0
1
2
3
4
5
01Q4 03Q2 04Q4 06Q2 07Q4 09Q2 10Q4 12Q2
Average wage per employee euro area (1) (2)Average wage per employee US (1)Labour productivity euro area (2) (3)Labour productivity US (3)
(1)Real wages calculated by the GDP deflator(2)Euro area excluding Latvia(3)In terms of total employment (thousands) Source Eurostat US Bureau of Economic Analysis US Bureau of Labour Statistics DG ECFIN calculations
There are a number of reasons for the different labour adjustments in the euro area and the United States In the former apart from a higher level of employment protection short-term work schemes were put in place in the early stages of the crisis (57) In addition as labour force adjustment tends to be more costly in the euro area some firms (particularly small firms and those with highly qualified employees) preferred to retain their
(57) According to the OECD Public short-term work schemes have
played an important role in preserving jobs during the crisis in a number of countries although significant hours reductions were also achieved via lower overtime hours hours averaging arrangements and employer initiatives see OECD Employment Outlook 2010 ndash Moving Beyond the Job Crisis
labour force (58) Because of a lack of wage flexibility the higher degree of lsquolabour hoardingrsquo in the euro area came at the expense of lower operating surplus and profits and consequently put a downward pressure on the capacity accumulate internal funds to deleverage
Corporate savings are much lower in the euro area
Negative developments in euro area corporate profitability were reflected in corporate savings which together with physical investment determines the internal funds available for balance sheet adjustment In 2009-10 there was a sharp drop in euro area savings because profits acted as shock absorbers and fell more rapidly than dividend payments leaving less spare cash available In contrast savings by US NFCs increased substantially on rising profits after an early-crisis low point and reached a historically high level of around 23 of GVA in 2010Q3 (Graph II45)
Graph II45 Savings of NFCs (2000Q1- 2013Q3 of GVA)
15
16
17
18
19
20
21
22
23
24
00Q1 01Q3 03Q1 04Q3 06Q1 07Q3 09Q1 10Q3 12Q1 13Q3
Euro area (1)
US
(1)Euro area excluding Latvia Source Eurostat Bureau of Economic Analysis DG ECFIN calculations
The impression that US corporate behaviour has been more geared towards accumulating savings than that in the euro area is reinforced when one looks at dividend distribution Dividends paid by euro area NFCs have been on a declining trend since the start of the crisis but those paid by US firms have also decreased This is remarkable given (58) See Box 12 Labour hoarding across different types of firms in
OECD Employment Outlook 2010 ndash Moving Beyond the Job Crisis
II Special topics on the euro area economy
Volume 13 No 1 | 43
the positive profit developments in the United States (Graph II46) A drop in dividends alongside profit growth suggests that after 2008 US companies preferred to direct a bigger proportion of the profit recovery to corporate savings and thereby balance sheet adjustment The ratio of dividends to profits in the United States has fallen from about one third before the crisis to one quarter now This ratio also dropped in the euro area although by less (59)
Graph II46 Dividends paid of NFCs (2000Q1-2013Q3 of GVA)
0
5
10
15
20
25
00Q1 01Q3 03Q1 04Q3 06Q1 07Q3 09Q1 10Q3 12Q1 13Q3
Euro area (1)
US
(1)Euro area excluding Latvia Source Eurostat Federal Reserve Board DG ECFIN calculations
Disappointing physical investment in the euro area and the United States
Cutting investment in physical assets is another way of reducing excessive indebtedness Corporate investment as a proportion of activity dropped sharply both in the euro area and in the United States in the early stages of the crisis (Graph II47)
After a modest recovery in 2010-11 the investment rate decreased again in the euro area The investment recovery was more solid in the United States but has lost momentum since the end of 2012 and the investment rate remains below its pre-crisis peak Overall it seems that euro area corporations partly compensated for less supportive savings developments than in the US by
(59) Dividend payments are not the only way of distributing profits to shareholders Equity buybacks can also be used for this purpose and firms that choose this option will tend to have higher savings and lower dividends paid
curbing physical investment more than their US counterparts
Graph II47 Investment of NFCs (2000Q1- 2013Q3 of GVA)
15
16
17
18
19
20
21
22
23
24
00Q1 01Q3 03Q1 04Q3 06Q1 07Q3 09Q1 10Q3 12Q1 13Q3
Euro area (1)
US
(1)Excluding Latvia Source Eurostat US Bureau of Economic Analysis DG ECFIN calculations
A more modest increase in net lending in the euro area than in the US
Since 2013 firmsrsquo net lending in the euro area has been in positive territory but substantially less so than that in the United States (Graph II48) Positive NLB in the euro area unlike that in the United States is mostly due to a low investment rate alone rather than low investment combined with high savings The combination of disappointing investment and high savings has translated into historically high and sustained NLB for US firms
This persistent net lending position in the United States is atypical as firms usually invest more than they save It suggests that US firms have been adjusting their balance sheets significantly since the beginning of the crisis via their internal funds while euro area firms seem to have opted for much slower balance sheet adjustment
44 | Quarterly Report on the Euro Area
Graph II48 Net lendingborrowing of NFCs
(2000Q1- 2013Q3 of GVA)
-10
-8
-6
-4
-2
0
2
4
6
8
00Q1 01Q3 03Q1 04Q3 06Q1 07Q3 09Q1 10Q3 12Q1 13Q3
Euro area (1)
US
(1)Excluding Latvia Source Eurostat US Bureau of Economic Analysis DG ECFIN calculations
Debt deleveraging has been more pronounced in the US than in the euro area
The faster pace of adjustment of balance sheets in the United States is confirmed by the corporate debt data (Graph II49) (60) (61) While both the euro area and the United States entered the crisis with swiftly rising and historically high levels of debt deleveraging has progressed more rapidly in the latter since the crisis By the beginning of 2012 US corporate debt had fallen by approximately 15 pp as a proportion of activity while euro area debt had dropped by 7 pp (62)
(60) Non-financial corporate debt consists of loans and securities
other than shares (corporate bonds) both can be classified as short- or long-term depending on whether their original maturity is less or more than one year
(61) This section analyses developments in non-consolidated financial flows and stocks in the euro area and in the United States for two reasons it is important to have a sense of financial positions within the institutional sector eg loans between NFCs are an important part of intra-firm relationships as head offices use them to finance subsidiaries for example perhaps for tax reasons This is relatively more important in the euro area than in the United States Consolidated financial asset and flow data eliminate these intra-sector positions and different approaches may be taken to consolidation as in the euro area there is the additional issue of cross-border consolidation between Member States while there is no need for flows and positions between firms in different US states to be treated separately
(62) The debt-to-equity ratio is another measure of corporate leverage widely followed by investors Faster stock market recovery helped US firms reduce this ratio more than those in the euro area
Graph II49 Debt levels of NFCs(1) (1999Q1-2013Q3 of GVA)
100
120
140
160
180
200
220
99Q1 00Q3 02Q1 03Q3 05Q1 06Q3 08Q1 09Q3 11Q1 12Q3
Euro area (2)
US
(1)Securities other than shares and loans(2)Excluding Latvia Source Eurostat US Bureau of Economic Analysis DG ECFIN calculations
Firms in the euro area and the United States entered the crisis with almost the same level of short-term debt as a proportion of total debt Since the crisis the adjustment away from short-term debt has been significantly more pronounced in the United States suggesting more active balance sheet restructuring
Graph II410 Debt flows of NFCs(1) (1999Q1- 2013Q3 of GVA)
-15
-10
-5
0
5
10
15
20
99Q1 01Q1 03Q1 05Q1 07Q1 09Q1 11Q1 13Q1
Euro area bonds (2)
US bonds
Euro area loans (2)
US loans
(1)Securities other than shares and loans (2)Excluding Latvia Source Eurostat US Bureau of Economic Analysis DG ECFIN calculations
Due to differences in the structure of corporate finance loans (as opposed to bonds) tend to form a bigger proportion of debt in the euro area than in the United States An important element of the
II Special topics on the euro area economy
Volume 13 No 1 | 45
corporate balance sheet adjustment process in both economies has been a movement away from an excessive reliance on loans (Graph II410) and towards bond financing This trend has been substantially more pronounced in the United States presumably reflecting the fact that bond markets are more developed in that country
Developments in non-financial corporate debt were also influenced by developments in financial intermediation in particular in the banking sector Financial accounts show NFCsrsquo debt exposure but do not indicate whether the debt holder is a bank According to bank balance sheet statistics the nominal growth of loans vis-agrave-vis NFCs has been mostly negative in the euro area since 2009Q4 (Graph II411) Coupled with the positive loan inflows seen in the national accounts between 2010Q3 and 2012Q3 (Graph II410) this shows a degree of substitution in corporate loan liability ownership between banks and other financial firms and sectors (including other NFCs) in this period According to the counterparty breakdown of NFC domestic loans published by the ECB corporate borrowings from other NFCs represented 29 of all loans by 2013Q3 (up from 26 in 2008Q1) while the proportion of borrowings from monetary financial institutions (MFIs) had dropped (from 60 in 2008Q1) to an all-time low of 53 The proportion of loans from other non-bank financial intermediaries also increased There is less evidence of a shift from banks to other loan providers in the United States where loans between NFCs are much more limited
Graph II411 Bank loans to NFCs (1999Q1- 2013Q3 y-o-y change)
-20
-15
-10
-5
0
5
10
15
20
25
99Q1 00Q3 02Q1 03Q3 05Q1 06Q3 08Q1 09Q3 11Q1 12Q3
Euro area bank loans to NFCs (1)US bank loans to NFCs
(1)Excluding Latvia Source ECB US Federal Reserve Board DG ECFIN calculations
Positive NLB has been used to acquire safe financial assets in both regions
In both the euro area and the United States the positive NLB has been used to deleverage but also to invest in safe financial assets At the beginning of the crisis much of the positive corporate NLB in the United States was invested in money market mutual funds which is essentially investment in short-term low-risk assets (Graph II412) (63)
Currency and deposits (another type of safe asset) have increased substantially in the euro area in recent years as a proportion of total firm activity (Graph II413) This rise was driven almost exclusively by a rapid increase in firmsrsquo savings deposits To some extent a similar trend is observable in the United States In particular US cash balances (a sub-component of currency and deposits) approached 12 of GVA by the end of 2013 a level not seen since the early 1990s On the other hand savings deposits have grown more modestly resulting in a moderately positive overall trend in currency and deposits
Graph II412 Mutual fund shares of NFCs (1999Q1- 2013Q3 of GVA)
0
2
4
6
8
10
12
14
99Q1 01Q1 03Q1 05Q1 07Q1 09Q1 11Q1 13Q1
Euro area (1)
US (2)
(1)Excluding Latvia(2)In the USA these asset series can be broken down into investment in money market mutual funds and investment in other mutual funds The 2009-11 increase is fully attributable to the former Source Eurostat US Bureau of Economic Analysis DG ECFIN calculations
Overall these two aspects of corporate financial investment behaviour signify considerable liquidity concerns on the part of firms in both the euro area
(63) Euro area financial accounts only show firmsrsquo investment in mutual funds overall and do not distinguish between types of mutual funds
46 | Quarterly Report on the Euro Area
and the United States They also represent a drive towards lower-risk assets perhaps indicating increased risk aversion by corporations or a tendency to postpone physical investment in a context of perceived high uncertainty
Graph II413 Currency and deposits ndash NFCs
(1999Q1- 2013Q3 of GVA)
0
5
10
15
20
25
30
35
40
45
99Q1 00Q3 02Q1 03Q3 05Q1 06Q3 08Q1 09Q3 11Q1 12Q3
Euro area (1)
US
(1)Excluding Latvia Source Eurostat US Bureau of Economic Analysis DG ECFIN calculations
Conclusion
Although both regions saw similar steep rises in corporate debt in the pre-crisis years balance sheet adjustment since the crisis has been significantly slower in the euro area than in the United States The more rapid adjustment in the United States can be explained by a stronger cyclical recovery more supportive profitability developments and reduced dividend payment ratios In the euro area profitability has been hindered by a combination of lower flexibility in the labour markets and slow wage adjustment
The slower balance sheet adjustment in the euro area corporate sector is visible in a slower fall in indebtedness but also a slower adjustment of the structure of balance sheets In particular the shift from loans to bonds and the extension of debt maturity have been more pronounced in the United States In both regions firms have used their positive NLB to accelerate the accumulation of safe and liquid financial assets This could reflect continuing uncertainty regarding future demand and growth prospects
Overall the evidence discussed in this section shows that euro area firms are lagging significantly behind their US counterparts in terms of balance sheet consolidation Given that investment rates remain disappointing even in the more advanced US corporate sector a degree of caution appears warranted when assessing short-term prospects for corporate investment in the euro area
III Recent DG ECFIN publications
Volume 13 No 1 | 47
1 Occasional Papers
European Economy Occasional Papers 170 January 2014 Financial Assistance Programme for the Recapitalisation of Financial Institutions in Spain Fifth Review ndash Winter 2014 httpeceuropaeueconomy_financepublicationsoccasional_paper2014pdfocp170_enpdf
European Economy Occasional Papers 169 December 2013 The Economic Adjustment Programme for Cyprus Second Review ndash Autumn 2013 httpeceuropaeueconomy_financepublicationsoccasional_paper2013pdfocp169_enpdf
European Economy Occasional Papers 168 December 2013 Fiscal frameworks in the European Union ommission services country factsheets for the Autumn 2013 Peer Review httpeceuropaeueconomy_financepublicationsoccasional_paper2013pdfocp168_enpdf
European Economy Occasional Papers 167 December 2013 Economic Adjustment Programme for Ireland - Autumn 2013 Review httpeceuropaeueconomy_financepublicationsoccasional_paper2013pdfocp167_enpdf
European Economy Occasional Papers 166 December 2013 Progress towards meeting the economic criteria for EU accession the EU Commissionrsquos 2013 assessments httpeceuropaeueconomy_financepublicationsoccasional_paper2013pdfocp166_enpdf
European Economy Occasional Papers 165 November 2013 Romania Balance-of-Payments Assistance Programme 2013-2015 httpeceuropaeueconomy_financepublicationsoccasional_paper2013pdfocp165_enpdf
European Economy Occasional Papers 164 November 2013 The Economic Adjustment Programme for Portugal Eighth and Ninth Review httpeceuropaeueconomy_financepublicationsoccasional_paper2013pdfocp164_enpdf
European Economy Occasional Papers 163 November 2013 Financial Assistance Programme for the Recapitalisation of Financial Institutions in Spain Fourth Review ndash Autumn 2013 httpeceuropaeueconomy_financepublicationsoccasional_paper2013pdfocp163_enpdf
European Economy Occasional Papers 162 October 2013 Economic Adjustment Programme for Ireland Summer 2013 Review httpeceuropaeueconomy_financepublicationsoccasional_paper2013pdfocp162_enpdf
2 Economic papers
European Economy Economic Papers 514 February 2014 Martin Larch Kristin Magnusson Bernard Balint Tatar Hard work and More How to successfully conduct adjustment with official assistance httpeceuropaeueconomy_financepublicationseconomic_paper2014pdfecp514_enpdf
European Economy Economic Papers 513 February 2014 Florian Woumlhlbier Caterina Astarita Gilles Mourre Consolidation on the revenue side and growth-friendly tax structures an indicator based approach httpeceuropaeueconomy_financepublicationseconomic_paper2014pdfecp513_enpdf
48 | Quarterly Report on the Euro Area
European Economy Economic Papers 512 December 2013 Alexander Schwan Etienne Sail Assessing the economic and budgetary impact of linking retirement ages and pension benefits to increases in longevity httpeceuropaeueconomy_financepublicationseconomic_paper2013pdfecp512_enpdf 3 Other publications
Winter forecast 2014 - EU economy recovery gaining ground httpeceuropaeueconomy_financepublicationseuropean_economy2014pdfee2_enpdf 4 Regular publications
Business and Consumer Surveys (harmonised surveys for different sectors of the economies in the European Union (EU) and the applicant countries) httpeceuropaeueconomy_financedb_indicatorssurveysindex_enhtm Business Climate Indicator for the euro area (monthly indicator designed to deliver a clear and early assessment of the cyclical situation) httpeceuropaeueconomy_financedb_indicatorssurveysdocuments2013bci_2013_11_enpdf Key indicators for the euro area (presents the most relevant economic statistics concerning the euro area) httpeceuropaeueconomy_financedb_indicatorskey_indicatorsindex_enhtm Monthly and quarterly notes on the euro-denominated bond markets (looks at the volumes of debt issued the maturity structures and the conditions in the market) httpeceuropaeueconomy_financepublicationsbond_marketindex_enhtm Price and Cost Competitiveness httpeceuropaeueconomy_financedb_indicatorscompetitivenessindex_enhtm
50 | Quarterly Report on the Euro Area
Editor-in-Chief Elena Flores
Overall coordination Eric Ruscher
Data assistance Christos Zavos
Comments on the report would be gratefully received and should be sent to
Elena Flores Director ndash Policy Strategy and Coordination Directorate-General for Economic and Financial Affairs Office CHAR 1566
B-1049 Brussels
Email elenafloreseceuropaeu
or
Eric Ruscher Head of Unit ndash Macroeconomy of the euro area Directorate-General for Economic and Financial Affairs Office CHAR 15248
B-1049 Brussels
Email ericruschereceuropaeu
HOW TO OBTAIN EU PUBLICATIONS Free publications bull one copy
via EU Bookshop (httpbookshopeuropaeu) bull more than one copy or postersmaps
from the European Unionrsquos representations (httpeceuropaeurepresent_enhtm) from the delegations in non-EU countries (httpeeaseuropaeudelegationsindex_enhtm) by contacting the Europe Direct service (httpeuropaeueuropedirectindex_enhtm) or calling 00 800 6 7 8 9 10 11 (freephone number from anywhere in the EU) () () The information given is free as are most calls (though some operators phone boxes or hotels may charge you)
Priced publications bull via EU Bookshop (httpbookshopeuropaeu) Priced subscriptions bull via one of the sales agents of the Publications Office of the European Union
(httppublicationseuropaeuothersagentsindex_enhtm)
KC-AK-14-001-en-n
- Blank Page
- Blank Page
- Blank Page
- Blank Page
-
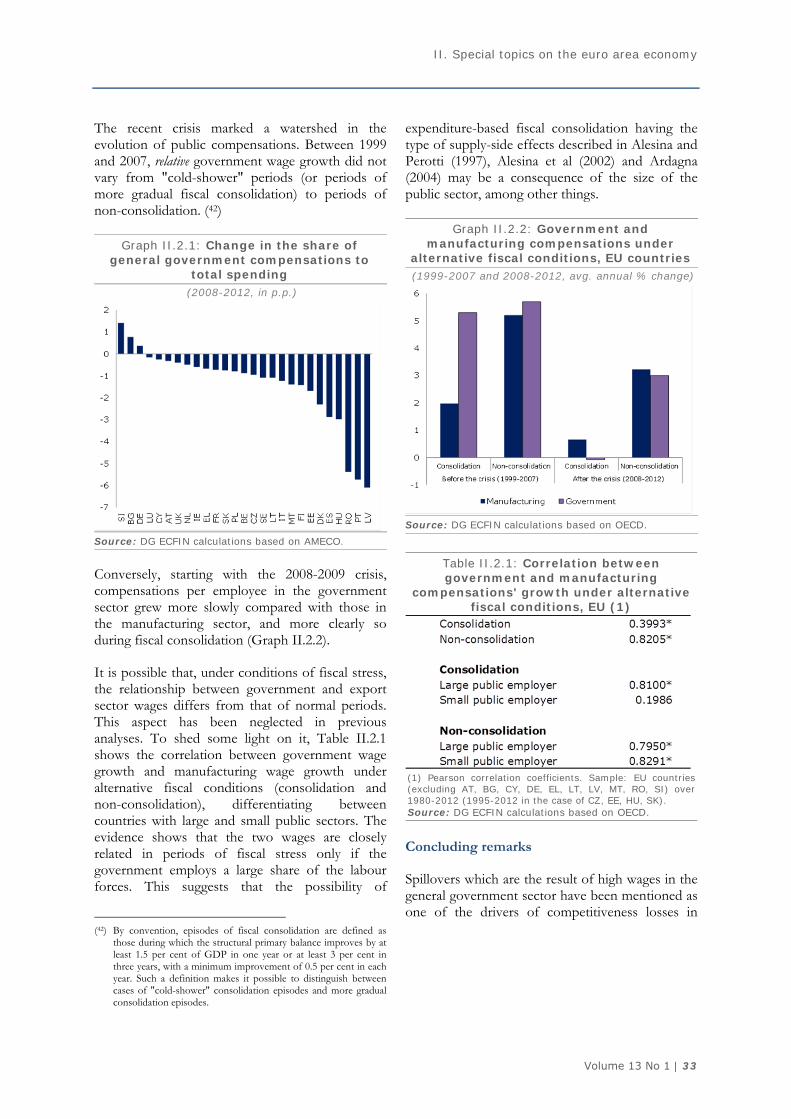
II Special topics on the euro area economy
Volume 13 No 1 | 37
framework which would be sustainable in the long term The nominal balance improved with the deficit being cut from 98 of GDP in 2009 to 13 of GDP in 2012 and 2013 (see graph II31) The structural deficit also fell from its peak of 55 of GDP in 2008 to around 025 of GDP in 2012 and 2013 beating Latviarsquos medium-term objective of -05 of GDP as set in the convergence programmes
Latviarsquos fiscal consolidation measures were undoubtedly bold with fiscal savings equivalent to around 17 of GDP implemented within three years The measures were frontloaded and half of these savings were implemented in the first year alone The measures were on the whole expenditure-oriented with over half of the savings coming from cuts to health education and public administration budgets The most notable measure relating to revenue was an increase in VAT from 18 to 22 The consolidation strategy was eventually successful in containing the adverse effects of the budget deficit on the economy In fact it even appears to have triggered lsquonon-Keynesianrsquo effects on demand by restoring confidence and stimulating demand and investment at the point when it was most needed (47)
Graph II31 Latviarsquos government budget balance and debt (2008-15 of GDP)
Source DG ECFIN Commissionrsquos spring 2013 forecast
The fiscal framework was also strengthened significantly by the law on fiscal discipline coming into force in March 2013 and the creation of a fiscal council in January 2014 The signing of the
(47) Ibid see Chapter 4 Fiscal consolidation in the midst of the crisis
Treaty on Stability Coordination and Governance in the EMU (48) in March 2012 provided further EU-level support for the national fiscal framework
An additional factor that was critical to the success of the consolidation strategy but is often overlooked was the availability of significant EU funds (particularly from around 2009 onwards) which acted as a much-needed demand trigger in sectors affected by the decline in economic activity Between 2007 and 2013 Latvia benefited from the third highest allocation of EU funds after Hungary and Lithuania receiving a yearly average equivalent to around 28 of GDP or 70 of gross fixed capital formation(49) As on average every euro of national budget spending was supplemented by five to six euros co-financing from EU funds national expenditure on items such as road and public building construction vocational education and training of unemployed science infrastructure development and healthcare was often replaced by Structural funds financing despite being in conflict with the EU funds additionality principle Clearly such large inflows of EU financing also generated substantial tax revenues in particular VAT at a time when private consumption was weak
The Latvian labour market demonstrated a high level of flexibility during the crisis thanks in part to a decentralised wage-setting system Significant public-sector wage cuts indirectly supported nominal wage reduction in the private sector in 2009 and 2010 when earnings per employee fell by a total of 19 over two years Employment levels fell sharply especially in the private sector as jobs were cut in construction and manufacturing The unemployment rate reached around 20 in early 2010 but had fallen back to 119 by 2013 due mainly to growth in employment with the participation rate also increasing significantly over this period The projection from the Commissionrsquos 2014 winter forecast shows wages in 2014-15 growing broadly in line with productivity although the labour market is tightening and structural problems in particular regional differences and skill mismatches could create pressures in the economy
(48) httpeuropean-councileuropaeumedia639235st00tscg26_en12pdf
(49) Source Directorate-General for Regional Policy Infoview
38 | Quarterly Report on the Euro Area
External cost competitiveness has improved noticeably since 2008 with labour costs falling significantly and labour productivity in particular in the tradable sector increasing In 2008 the real effective exchange rate (REER) adjusted for unit labour costs reached a peak of 64 above the 2000 level before falling by about 20 in 2009-10 since when it has remained broadly stable (see graph II32) This level of REER is considered sustainable as the country has been seen to be steadily gaining market share over recent years (including as measured by exports adjusted for the growth of markets) The percentage of the countryrsquos GDP attributable to exports rose to 60 in 2013 from 43 in 2007 with some 60 of exports destined for the EU and 12 for Russia
Graph II32 Effective exchange rates Latvia v 35 trading partners
(Jan 2007-Dec 2013 monthly avg 2007 = 100)
Source DG ECFIN
The social burden of economic adjustment has admittedly been high in Latvia despite the policy measures contained in the Memorandum of Understanding stipulating inter alia establishment of a comprehensive social safety net supporting local governments in providing social assistance and discounting social payments from overall budget targets High unemployment has led to a wave of emigration to richer EU countries which coupled with Latviarsquos low fertility and high death rates has seen the population decrease by 8-10 since 2008 Net emigration has now fallen substantially however since the peak of the crisis years The rates of poverty and social exclusion in Latvia are among the highest in the EU families with children unemployed people people with disabilities and people living in rural areas are particularly at risk The countryrsquos spending on
social protection and healthcare as a percentage of GDP is among the lowest in the EU Furthermore the social protection measures which do exist to reduce poverty tend to be ineffective highlighting the importance of a robust social safety net It appears however that with the improved economic situation and increasing levels of general social awareness the authorities are finally starting to address the challenges of poverty and social exclusion with greater determination In recent years for example taxation of low-income earners has been cut slightly and child poverty has been reduced thanks to increases in various child-related benefits Proposals for reforms to social assistance in line with 2013 World Banks study are being gradually implemented Better targeted more effective policies relating to the active labour market mostly financed by the European Social Fund are helping unemployed people in particular the long-term unemployed and young people to find work or to obtain relevant training
As part of the BoP programme and in the context of the assessment of Latviarsquos readiness to join the euro area financial supervision has been tightened and EU resources for supervision and monitoring increased in particular for monitoring the growing non-resident banking sector Additional liquidity and capital adequacy requirements for non-resident banks were introduced in 2013 regular on- and off-site checks of these banks are being performed the deposit guarantee fund has been further strengthened and monitoring has been stepped up in relation to pledged assets and the origin of funds in bank recapitalizations This strengthened regulatory policy has been introduced partly as a result of lessons learnt at significant cost in the past five years most notably with the Parex and Krajbanka failures
Latvia has implemented a series of ambitious reforms to the business environment in recent years with the aim of reducing start-up costs simplifying procedures for property registration construction permits and tax collection and introducing out-of-court settlement of insolvencies In doing so Latvia has brought its regulatory framework a significant step closer to what is regarded as best practice In the World Bankrsquos 2014 Doing Business report Latvia was ranked 25th out of 185 countries with only four euro-area members faring better
II Special topics on the euro area economy
Volume 13 No 1 | 39
Conclusion
The origins of Latviarsquos years of boom and bust can be traced back to the domestic regional and global circumstances at that time globally excess liquidity and hot money flowing into vulnerable countries regionally unrealistic expectations of income convergence in central and eastern Europe and domestically undue optimism about growth in personal incomes and mispricing of risk by commercial banks amplified by the behaviour of both policymakers and individuals
A broad range of country-specific and general economic factors have contributed to the successful economic adjustment seen in Latvia since the height of the crisis Ambitious front-loaded and largely expenditure-based fiscal consolidation helped to contain the budget deficit whilst the confidence generated by the introduction of a credible programme itself aided the economic recovery The flexibility of the labour market meanwhile helped companies to restore competitiveness by means of wage reductions and job cuts Competitiveness was also improved by steps taken to shift the tax burden from labour to consumption and property The recovery in Latvia was very much export-driven with the growth in exports made possible by the openness of the economy and the faster-than-expected economic growth experienced by major trading partners A number of structural reforms including bank restructuring and measures improving the use of EU funds have contributed to the development of a more favourable business environment A generous allocation from the European structural funds meanwhile helped to boost public investment and supported financing and reforms in many important sectors Above all the success of the recovery measures implemented in Latvia proved that for a tough internal economic adjustment to be effective there needs to be both a determined political will to carry out unpopular reforms and also a fully-developed comprehensive social safety net to protect more vulnerable groups
in society during difficult times In addition Latvia benefited from the fact that those looking for work were able to migrate to other EU countries which helped to alleviate the social tension created by the effects of the crisis Some of the lessons above are clearly applicable to other Member States undergoing challenging economic adjustment while others are more Latvia-specific
While Latviarsquos current level of economic growth is regarded as sustainable (50) and the adoption of the euro is recognised as a significant and hard-earned achievement it is not the end of the road The current robust economic situation should be used to advance reforms and improve Latvias long-term growth potential rather than lead to complacency and relaxation of reform efforts Sustainable convergence of the economy in the longer term will require inter alia ongoing commitment to prudent fiscal policies (there are some recent signs of less prudent fiscal decision-making) a continuous use of macro-prudential tools to reduce risks from growing non-resident financial flows especially in view of recent Ukraine events and the implementation of reforms in a number of vested-interest-heavy areas These include higher education and science state owned enterprise management electricity and gas market liberalization and the judiciary including insolvency framework But above all and in order to ensure economic and social sustainability for years to come high rates of poverty social exclusion and dismal demographic trends need to be addressed boldly These and other structural challenges are being addressed by the Commission under the European Semester and the Post Program Surveillance frameworks Also Latvia has joined a euro area that is very different from what it was just a few years ago the euro area economic governance framework has been greatly strengthened entailing stricter obligations
(50) The Commissionrsquos alert mechanism reports issued under the Macroeconomic Imbalance Procedure have not identified economic imbalances in Latvia requiring further in-depth investigation for possible policy action
httpeceuropaeueurope2020pdf2014amr2014_enpdf
40 | Quarterly Report on the Euro Area
II4 Corporate balance sheet adjustment in the euro area and the United States (51)
This section compares balance sheet adjustment in the non-financial corporate sector in the euro area and the United States It shows that the adjustment since the crisis has been faster in the latter Despite similar steep rises in corporate debt in pre-crisis years US corporations have cut debt more than those in the euro area Shifts from loans to bonds and extensions of debt maturity have also been more pronounced in the United States Much of the difference in balance sheet consolidation can be traced back to more positive profitability trends providing US firms with the internal funds necessary to adjust balance sheets Differences in dividend distribution strategies and in corporations physical investment behaviours also played a role Profitability differences reflect differences both in cyclical conditions and labour market adjustment Comparatively slow progress in balance sheet consolidation is likely to weigh on investment recovery in the euro area
-----------------------
Introduction
Both the euro area and the United States experienced a surge in corporate indebtedness in the years preceding the global financial crisis and in its early stages The ratio of debt to gross value added by non-financial corporations (NFCs) rose by about 40 pp between 2005 and 2009 Deteriorating growth prospects and changing attitudes to risk have prompted NFCs in both economies to adjust their balance sheets As previously argued in the Quarterly Report balance sheet adjustment can have a substantial effect on economic activity and it is important to monitor regularly the ongoing adjustment in the euro area (52) This section contributes to the monitoring by comparing progress in corporate deleveraging in the euro area and in the United States two regions where firms entered the crisis with excessive debt
(51) Section prepared by Plamen Nikolov (52) See European Commission (2010) Focus Balance sheet
adjustment in the corporate sector Quarterly Report on the Euro Area Vol9 (3) pp 9-19 A more detailed overview of the literature on the impact of balance sheet adjustment can be found in Cuerpo C I Drumond J Lendvai P Pontuch and R Raciborski (2013) Indebtedness deleveraging dynamics and macroeconomic adjustment European Economy Economic Papers 477
Firms consolidate their balance sheets primarily by raising their net lendingborrowing (NLB) ie the cash obtained from their production activity and available for financial operations (53) A rise in NLB is achieved either by increasing savings or cuttingpostponing physical investment Firms increase savings by raising profits and reducing the dividends distributed to shareholders In firmsrsquo financial accounts a rise in corporate NLB is associated with a rise in financial assets andor a cut in financial liabilities The section reviews recent developments in euro area and US profitability savings and NLB and looks at the instruments that the corporate sector has used to consolidate its balance sheet on both the asset and the liability side
Corporate profits have disappointed in the euro area hellip
National account data show that corporate profitability in the euro area reached a pre-crisis peak in 2007Q3 ie later than in the United States where it had already started to decline in 2007 (54)
Graph II41 NFC profitability euro area and US
(2000Q1-2013Q3 of GVA)
20
25
30
35
40
45
00Q1 01Q3 03Q1 04Q3 06Q1 07Q3 09Q1 10Q3 12Q1 13Q3
Euro area (1)
US
(1)Excluding Latvia Source Eurostat US Bureau of Economic Analysis DG ECFIN calculations
(53) Firms can also consolidate their balance sheets by raising equity (54) Profitability like the other national account variables for the
corporate sector presented in this section is measured as a proportion of corporate sector activity represented by gross value added (GVA) It is calculated as the gross operating surplus plus financial revenues and subsidies and minus financial and tax expenses Financial expenses do not include earnings distributed to shareholders
II Special topics on the euro area economy
Volume 13 No 1 | 41
The 2008-09 recession brought a sharp drop in corporate profitability in the euro area Profitability recovered briefly in 2010 to reach a new peak in 2011 but has declined again since then (Graph II41) In the United States the impact of the crisis was rather muted with profits recovering vigorously after 2008 As a ratio to gross value added (GVA) US corporate profits had already passed their pre-crisis level in 2009 before flattening out in the past two years Overall by 2013 profitability in the euro area was still about 2 pp below its pre-crisis peak while in the United States it stood around 3 pp above
hellip mostly due to weak operating surplus
The disappointing profit performance in the euro area relative to the United States is largely due to differing developments in gross operating surplus Looking at the breakdown of the contribution to the cumulative change in corporate profitability since the start of the crisis there is a marked difference between firms in the euro area and those in the United States (Graphs II42 and II43) (55)
Graph II42 Profitability breakdown of NFCs euro area (1)
(cumulative change in from 2007Q3 peak to 2013Q3)
35
36
37
38
39
40
41
42
-100
-80
-60
-40
-20
0
20
40
60
80
100
07Q4 08Q4 09Q4 10Q4 11Q4 12Q4
Taxes (lhs)
Other net current transfers received (lhs)
Net property income received excl dividends paid (lhs)
Operating surplus (lhs)
Profits(rhs)(2)
(1)Excluding Latvia(2)Profits in of GVA Source Eurostat DG ECFIN calculations
In the euro area a fall in the ratio of operating surplus to GVA dragged overall profitability down after 2008 Despite an improvement in 2011 in
(55) The illustration of the contributions to the cumulative change in profitability only serves to depict the relative importance of the various components of the change in profits since the crisis The starting point for the cumulative change should not be interpreted as a reference point for a desirable profit recovery
2013 operating surplus was still contributing negatively to the cumulative change in profitability since the pre-crisis peak In contrast operating surplus in the United States responded to the crisis earlier than in the euro area but its contribution to the change in profits remained positive
Graph II43 Profitability breakdown of NFCs US
(cumulative change in from 2005Q3 peak to 2013Q3)
24
25
26
27
28
29
30
31
-100
-80
-60
-40
-20
0
20
40
60
80
100
05Q4 06Q4 07Q4 08Q4 09Q4 10Q4 11Q4 12Q4
Taxes (lhs)Other net current transfers received (lhs)Net property income received excl dividends paid (lhs)Operating surplus (lhs)Profits(rhs)(2)
(1) Profits in of GVA Source Federal Reserve Board US Bureau of Economic Analysis DG ECFIN calculations
Unlike operating surplus income tax payments and net income from non-operational activities did not differ significantly between the euro area and the United States (56) In both economies lower corporate tax payments resulting from lower profits generated by NFCs naturally had a positive impact on the cumulative change in profits from the pre-crisis peak
Differences in labour market developments are at the root of differences in profitability
Differences in operating surplus and profitability between the United States and the euro area can be attributed partly to differences in the business cycle In 2011Q1 NFCsrsquo gross value added was still 12 below its pre-crisis peak in the euro area but 11 above in the United States The main channel through which cyclical developments can affect operating surplus is the labour market
(56) In fact the ratio of profit tax payments to profits (a crude measure of an aggregate tax rate) in the euro area and the United States has been almost the same since the start of the crisis falling substantially in 2008-09 indicating that tax policy was not more favourable for profits in one economy than in the other
42 | Quarterly Report on the Euro Area
The cyclicality of operating surplus depends on the impact of the cycle on labour productivity as well as on wages The worse performance of operating surplus in the euro area since 2008 as compared with that in the United States reflects a stronger deterioration in labour productivity accompanied by unfavourable developments in wages per employee
Labour productivity growth in the euro area turned sharply negative in 2009 opening a big gap with the positive (albeit modest) wage growth (Graph II44) In the United States on the other hand labour productivity growth became negative earlier but to a lesser extent and some downward wage adjustment took place in 2009
Graph II44 Labour productivity and wages euro area and US
(2001Q4-2013Q3 y-o-y change)
-4
-3
-2
-1
0
1
2
3
4
5
01Q4 03Q2 04Q4 06Q2 07Q4 09Q2 10Q4 12Q2
Average wage per employee euro area (1) (2)Average wage per employee US (1)Labour productivity euro area (2) (3)Labour productivity US (3)
(1)Real wages calculated by the GDP deflator(2)Euro area excluding Latvia(3)In terms of total employment (thousands) Source Eurostat US Bureau of Economic Analysis US Bureau of Labour Statistics DG ECFIN calculations
There are a number of reasons for the different labour adjustments in the euro area and the United States In the former apart from a higher level of employment protection short-term work schemes were put in place in the early stages of the crisis (57) In addition as labour force adjustment tends to be more costly in the euro area some firms (particularly small firms and those with highly qualified employees) preferred to retain their
(57) According to the OECD Public short-term work schemes have
played an important role in preserving jobs during the crisis in a number of countries although significant hours reductions were also achieved via lower overtime hours hours averaging arrangements and employer initiatives see OECD Employment Outlook 2010 ndash Moving Beyond the Job Crisis
labour force (58) Because of a lack of wage flexibility the higher degree of lsquolabour hoardingrsquo in the euro area came at the expense of lower operating surplus and profits and consequently put a downward pressure on the capacity accumulate internal funds to deleverage
Corporate savings are much lower in the euro area
Negative developments in euro area corporate profitability were reflected in corporate savings which together with physical investment determines the internal funds available for balance sheet adjustment In 2009-10 there was a sharp drop in euro area savings because profits acted as shock absorbers and fell more rapidly than dividend payments leaving less spare cash available In contrast savings by US NFCs increased substantially on rising profits after an early-crisis low point and reached a historically high level of around 23 of GVA in 2010Q3 (Graph II45)
Graph II45 Savings of NFCs (2000Q1- 2013Q3 of GVA)
15
16
17
18
19
20
21
22
23
24
00Q1 01Q3 03Q1 04Q3 06Q1 07Q3 09Q1 10Q3 12Q1 13Q3
Euro area (1)
US
(1)Euro area excluding Latvia Source Eurostat Bureau of Economic Analysis DG ECFIN calculations
The impression that US corporate behaviour has been more geared towards accumulating savings than that in the euro area is reinforced when one looks at dividend distribution Dividends paid by euro area NFCs have been on a declining trend since the start of the crisis but those paid by US firms have also decreased This is remarkable given (58) See Box 12 Labour hoarding across different types of firms in
OECD Employment Outlook 2010 ndash Moving Beyond the Job Crisis
II Special topics on the euro area economy
Volume 13 No 1 | 43
the positive profit developments in the United States (Graph II46) A drop in dividends alongside profit growth suggests that after 2008 US companies preferred to direct a bigger proportion of the profit recovery to corporate savings and thereby balance sheet adjustment The ratio of dividends to profits in the United States has fallen from about one third before the crisis to one quarter now This ratio also dropped in the euro area although by less (59)
Graph II46 Dividends paid of NFCs (2000Q1-2013Q3 of GVA)
0
5
10
15
20
25
00Q1 01Q3 03Q1 04Q3 06Q1 07Q3 09Q1 10Q3 12Q1 13Q3
Euro area (1)
US
(1)Euro area excluding Latvia Source Eurostat Federal Reserve Board DG ECFIN calculations
Disappointing physical investment in the euro area and the United States
Cutting investment in physical assets is another way of reducing excessive indebtedness Corporate investment as a proportion of activity dropped sharply both in the euro area and in the United States in the early stages of the crisis (Graph II47)
After a modest recovery in 2010-11 the investment rate decreased again in the euro area The investment recovery was more solid in the United States but has lost momentum since the end of 2012 and the investment rate remains below its pre-crisis peak Overall it seems that euro area corporations partly compensated for less supportive savings developments than in the US by
(59) Dividend payments are not the only way of distributing profits to shareholders Equity buybacks can also be used for this purpose and firms that choose this option will tend to have higher savings and lower dividends paid
curbing physical investment more than their US counterparts
Graph II47 Investment of NFCs (2000Q1- 2013Q3 of GVA)
15
16
17
18
19
20
21
22
23
24
00Q1 01Q3 03Q1 04Q3 06Q1 07Q3 09Q1 10Q3 12Q1 13Q3
Euro area (1)
US
(1)Excluding Latvia Source Eurostat US Bureau of Economic Analysis DG ECFIN calculations
A more modest increase in net lending in the euro area than in the US
Since 2013 firmsrsquo net lending in the euro area has been in positive territory but substantially less so than that in the United States (Graph II48) Positive NLB in the euro area unlike that in the United States is mostly due to a low investment rate alone rather than low investment combined with high savings The combination of disappointing investment and high savings has translated into historically high and sustained NLB for US firms
This persistent net lending position in the United States is atypical as firms usually invest more than they save It suggests that US firms have been adjusting their balance sheets significantly since the beginning of the crisis via their internal funds while euro area firms seem to have opted for much slower balance sheet adjustment
44 | Quarterly Report on the Euro Area
Graph II48 Net lendingborrowing of NFCs
(2000Q1- 2013Q3 of GVA)
-10
-8
-6
-4
-2
0
2
4
6
8
00Q1 01Q3 03Q1 04Q3 06Q1 07Q3 09Q1 10Q3 12Q1 13Q3
Euro area (1)
US
(1)Excluding Latvia Source Eurostat US Bureau of Economic Analysis DG ECFIN calculations
Debt deleveraging has been more pronounced in the US than in the euro area
The faster pace of adjustment of balance sheets in the United States is confirmed by the corporate debt data (Graph II49) (60) (61) While both the euro area and the United States entered the crisis with swiftly rising and historically high levels of debt deleveraging has progressed more rapidly in the latter since the crisis By the beginning of 2012 US corporate debt had fallen by approximately 15 pp as a proportion of activity while euro area debt had dropped by 7 pp (62)
(60) Non-financial corporate debt consists of loans and securities
other than shares (corporate bonds) both can be classified as short- or long-term depending on whether their original maturity is less or more than one year
(61) This section analyses developments in non-consolidated financial flows and stocks in the euro area and in the United States for two reasons it is important to have a sense of financial positions within the institutional sector eg loans between NFCs are an important part of intra-firm relationships as head offices use them to finance subsidiaries for example perhaps for tax reasons This is relatively more important in the euro area than in the United States Consolidated financial asset and flow data eliminate these intra-sector positions and different approaches may be taken to consolidation as in the euro area there is the additional issue of cross-border consolidation between Member States while there is no need for flows and positions between firms in different US states to be treated separately
(62) The debt-to-equity ratio is another measure of corporate leverage widely followed by investors Faster stock market recovery helped US firms reduce this ratio more than those in the euro area
Graph II49 Debt levels of NFCs(1) (1999Q1-2013Q3 of GVA)
100
120
140
160
180
200
220
99Q1 00Q3 02Q1 03Q3 05Q1 06Q3 08Q1 09Q3 11Q1 12Q3
Euro area (2)
US
(1)Securities other than shares and loans(2)Excluding Latvia Source Eurostat US Bureau of Economic Analysis DG ECFIN calculations
Firms in the euro area and the United States entered the crisis with almost the same level of short-term debt as a proportion of total debt Since the crisis the adjustment away from short-term debt has been significantly more pronounced in the United States suggesting more active balance sheet restructuring
Graph II410 Debt flows of NFCs(1) (1999Q1- 2013Q3 of GVA)
-15
-10
-5
0
5
10
15
20
99Q1 01Q1 03Q1 05Q1 07Q1 09Q1 11Q1 13Q1
Euro area bonds (2)
US bonds
Euro area loans (2)
US loans
(1)Securities other than shares and loans (2)Excluding Latvia Source Eurostat US Bureau of Economic Analysis DG ECFIN calculations
Due to differences in the structure of corporate finance loans (as opposed to bonds) tend to form a bigger proportion of debt in the euro area than in the United States An important element of the
II Special topics on the euro area economy
Volume 13 No 1 | 45
corporate balance sheet adjustment process in both economies has been a movement away from an excessive reliance on loans (Graph II410) and towards bond financing This trend has been substantially more pronounced in the United States presumably reflecting the fact that bond markets are more developed in that country
Developments in non-financial corporate debt were also influenced by developments in financial intermediation in particular in the banking sector Financial accounts show NFCsrsquo debt exposure but do not indicate whether the debt holder is a bank According to bank balance sheet statistics the nominal growth of loans vis-agrave-vis NFCs has been mostly negative in the euro area since 2009Q4 (Graph II411) Coupled with the positive loan inflows seen in the national accounts between 2010Q3 and 2012Q3 (Graph II410) this shows a degree of substitution in corporate loan liability ownership between banks and other financial firms and sectors (including other NFCs) in this period According to the counterparty breakdown of NFC domestic loans published by the ECB corporate borrowings from other NFCs represented 29 of all loans by 2013Q3 (up from 26 in 2008Q1) while the proportion of borrowings from monetary financial institutions (MFIs) had dropped (from 60 in 2008Q1) to an all-time low of 53 The proportion of loans from other non-bank financial intermediaries also increased There is less evidence of a shift from banks to other loan providers in the United States where loans between NFCs are much more limited
Graph II411 Bank loans to NFCs (1999Q1- 2013Q3 y-o-y change)
-20
-15
-10
-5
0
5
10
15
20
25
99Q1 00Q3 02Q1 03Q3 05Q1 06Q3 08Q1 09Q3 11Q1 12Q3
Euro area bank loans to NFCs (1)US bank loans to NFCs
(1)Excluding Latvia Source ECB US Federal Reserve Board DG ECFIN calculations
Positive NLB has been used to acquire safe financial assets in both regions
In both the euro area and the United States the positive NLB has been used to deleverage but also to invest in safe financial assets At the beginning of the crisis much of the positive corporate NLB in the United States was invested in money market mutual funds which is essentially investment in short-term low-risk assets (Graph II412) (63)
Currency and deposits (another type of safe asset) have increased substantially in the euro area in recent years as a proportion of total firm activity (Graph II413) This rise was driven almost exclusively by a rapid increase in firmsrsquo savings deposits To some extent a similar trend is observable in the United States In particular US cash balances (a sub-component of currency and deposits) approached 12 of GVA by the end of 2013 a level not seen since the early 1990s On the other hand savings deposits have grown more modestly resulting in a moderately positive overall trend in currency and deposits
Graph II412 Mutual fund shares of NFCs (1999Q1- 2013Q3 of GVA)
0
2
4
6
8
10
12
14
99Q1 01Q1 03Q1 05Q1 07Q1 09Q1 11Q1 13Q1
Euro area (1)
US (2)
(1)Excluding Latvia(2)In the USA these asset series can be broken down into investment in money market mutual funds and investment in other mutual funds The 2009-11 increase is fully attributable to the former Source Eurostat US Bureau of Economic Analysis DG ECFIN calculations
Overall these two aspects of corporate financial investment behaviour signify considerable liquidity concerns on the part of firms in both the euro area
(63) Euro area financial accounts only show firmsrsquo investment in mutual funds overall and do not distinguish between types of mutual funds
46 | Quarterly Report on the Euro Area
and the United States They also represent a drive towards lower-risk assets perhaps indicating increased risk aversion by corporations or a tendency to postpone physical investment in a context of perceived high uncertainty
Graph II413 Currency and deposits ndash NFCs
(1999Q1- 2013Q3 of GVA)
0
5
10
15
20
25
30
35
40
45
99Q1 00Q3 02Q1 03Q3 05Q1 06Q3 08Q1 09Q3 11Q1 12Q3
Euro area (1)
US
(1)Excluding Latvia Source Eurostat US Bureau of Economic Analysis DG ECFIN calculations
Conclusion
Although both regions saw similar steep rises in corporate debt in the pre-crisis years balance sheet adjustment since the crisis has been significantly slower in the euro area than in the United States The more rapid adjustment in the United States can be explained by a stronger cyclical recovery more supportive profitability developments and reduced dividend payment ratios In the euro area profitability has been hindered by a combination of lower flexibility in the labour markets and slow wage adjustment
The slower balance sheet adjustment in the euro area corporate sector is visible in a slower fall in indebtedness but also a slower adjustment of the structure of balance sheets In particular the shift from loans to bonds and the extension of debt maturity have been more pronounced in the United States In both regions firms have used their positive NLB to accelerate the accumulation of safe and liquid financial assets This could reflect continuing uncertainty regarding future demand and growth prospects
Overall the evidence discussed in this section shows that euro area firms are lagging significantly behind their US counterparts in terms of balance sheet consolidation Given that investment rates remain disappointing even in the more advanced US corporate sector a degree of caution appears warranted when assessing short-term prospects for corporate investment in the euro area
III Recent DG ECFIN publications
Volume 13 No 1 | 47
1 Occasional Papers
European Economy Occasional Papers 170 January 2014 Financial Assistance Programme for the Recapitalisation of Financial Institutions in Spain Fifth Review ndash Winter 2014 httpeceuropaeueconomy_financepublicationsoccasional_paper2014pdfocp170_enpdf
European Economy Occasional Papers 169 December 2013 The Economic Adjustment Programme for Cyprus Second Review ndash Autumn 2013 httpeceuropaeueconomy_financepublicationsoccasional_paper2013pdfocp169_enpdf
European Economy Occasional Papers 168 December 2013 Fiscal frameworks in the European Union ommission services country factsheets for the Autumn 2013 Peer Review httpeceuropaeueconomy_financepublicationsoccasional_paper2013pdfocp168_enpdf
European Economy Occasional Papers 167 December 2013 Economic Adjustment Programme for Ireland - Autumn 2013 Review httpeceuropaeueconomy_financepublicationsoccasional_paper2013pdfocp167_enpdf
European Economy Occasional Papers 166 December 2013 Progress towards meeting the economic criteria for EU accession the EU Commissionrsquos 2013 assessments httpeceuropaeueconomy_financepublicationsoccasional_paper2013pdfocp166_enpdf
European Economy Occasional Papers 165 November 2013 Romania Balance-of-Payments Assistance Programme 2013-2015 httpeceuropaeueconomy_financepublicationsoccasional_paper2013pdfocp165_enpdf
European Economy Occasional Papers 164 November 2013 The Economic Adjustment Programme for Portugal Eighth and Ninth Review httpeceuropaeueconomy_financepublicationsoccasional_paper2013pdfocp164_enpdf
European Economy Occasional Papers 163 November 2013 Financial Assistance Programme for the Recapitalisation of Financial Institutions in Spain Fourth Review ndash Autumn 2013 httpeceuropaeueconomy_financepublicationsoccasional_paper2013pdfocp163_enpdf
European Economy Occasional Papers 162 October 2013 Economic Adjustment Programme for Ireland Summer 2013 Review httpeceuropaeueconomy_financepublicationsoccasional_paper2013pdfocp162_enpdf
2 Economic papers
European Economy Economic Papers 514 February 2014 Martin Larch Kristin Magnusson Bernard Balint Tatar Hard work and More How to successfully conduct adjustment with official assistance httpeceuropaeueconomy_financepublicationseconomic_paper2014pdfecp514_enpdf
European Economy Economic Papers 513 February 2014 Florian Woumlhlbier Caterina Astarita Gilles Mourre Consolidation on the revenue side and growth-friendly tax structures an indicator based approach httpeceuropaeueconomy_financepublicationseconomic_paper2014pdfecp513_enpdf
48 | Quarterly Report on the Euro Area
European Economy Economic Papers 512 December 2013 Alexander Schwan Etienne Sail Assessing the economic and budgetary impact of linking retirement ages and pension benefits to increases in longevity httpeceuropaeueconomy_financepublicationseconomic_paper2013pdfecp512_enpdf 3 Other publications
Winter forecast 2014 - EU economy recovery gaining ground httpeceuropaeueconomy_financepublicationseuropean_economy2014pdfee2_enpdf 4 Regular publications
Business and Consumer Surveys (harmonised surveys for different sectors of the economies in the European Union (EU) and the applicant countries) httpeceuropaeueconomy_financedb_indicatorssurveysindex_enhtm Business Climate Indicator for the euro area (monthly indicator designed to deliver a clear and early assessment of the cyclical situation) httpeceuropaeueconomy_financedb_indicatorssurveysdocuments2013bci_2013_11_enpdf Key indicators for the euro area (presents the most relevant economic statistics concerning the euro area) httpeceuropaeueconomy_financedb_indicatorskey_indicatorsindex_enhtm Monthly and quarterly notes on the euro-denominated bond markets (looks at the volumes of debt issued the maturity structures and the conditions in the market) httpeceuropaeueconomy_financepublicationsbond_marketindex_enhtm Price and Cost Competitiveness httpeceuropaeueconomy_financedb_indicatorscompetitivenessindex_enhtm
50 | Quarterly Report on the Euro Area
Editor-in-Chief Elena Flores
Overall coordination Eric Ruscher
Data assistance Christos Zavos
Comments on the report would be gratefully received and should be sent to
Elena Flores Director ndash Policy Strategy and Coordination Directorate-General for Economic and Financial Affairs Office CHAR 1566
B-1049 Brussels
Email elenafloreseceuropaeu
or
Eric Ruscher Head of Unit ndash Macroeconomy of the euro area Directorate-General for Economic and Financial Affairs Office CHAR 15248
B-1049 Brussels
Email ericruschereceuropaeu
HOW TO OBTAIN EU PUBLICATIONS Free publications bull one copy
via EU Bookshop (httpbookshopeuropaeu) bull more than one copy or postersmaps
from the European Unionrsquos representations (httpeceuropaeurepresent_enhtm) from the delegations in non-EU countries (httpeeaseuropaeudelegationsindex_enhtm) by contacting the Europe Direct service (httpeuropaeueuropedirectindex_enhtm) or calling 00 800 6 7 8 9 10 11 (freephone number from anywhere in the EU) () () The information given is free as are most calls (though some operators phone boxes or hotels may charge you)
Priced publications bull via EU Bookshop (httpbookshopeuropaeu) Priced subscriptions bull via one of the sales agents of the Publications Office of the European Union
(httppublicationseuropaeuothersagentsindex_enhtm)
KC-AK-14-001-en-n
- Blank Page
- Blank Page
- Blank Page
- Blank Page
-

II Special topics on the euro area economy
Volume 13 No 1 | 39
Conclusion
The origins of Latviarsquos years of boom and bust can be traced back to the domestic regional and global circumstances at that time globally excess liquidity and hot money flowing into vulnerable countries regionally unrealistic expectations of income convergence in central and eastern Europe and domestically undue optimism about growth in personal incomes and mispricing of risk by commercial banks amplified by the behaviour of both policymakers and individuals
A broad range of country-specific and general economic factors have contributed to the successful economic adjustment seen in Latvia since the height of the crisis Ambitious front-loaded and largely expenditure-based fiscal consolidation helped to contain the budget deficit whilst the confidence generated by the introduction of a credible programme itself aided the economic recovery The flexibility of the labour market meanwhile helped companies to restore competitiveness by means of wage reductions and job cuts Competitiveness was also improved by steps taken to shift the tax burden from labour to consumption and property The recovery in Latvia was very much export-driven with the growth in exports made possible by the openness of the economy and the faster-than-expected economic growth experienced by major trading partners A number of structural reforms including bank restructuring and measures improving the use of EU funds have contributed to the development of a more favourable business environment A generous allocation from the European structural funds meanwhile helped to boost public investment and supported financing and reforms in many important sectors Above all the success of the recovery measures implemented in Latvia proved that for a tough internal economic adjustment to be effective there needs to be both a determined political will to carry out unpopular reforms and also a fully-developed comprehensive social safety net to protect more vulnerable groups
in society during difficult times In addition Latvia benefited from the fact that those looking for work were able to migrate to other EU countries which helped to alleviate the social tension created by the effects of the crisis Some of the lessons above are clearly applicable to other Member States undergoing challenging economic adjustment while others are more Latvia-specific
While Latviarsquos current level of economic growth is regarded as sustainable (50) and the adoption of the euro is recognised as a significant and hard-earned achievement it is not the end of the road The current robust economic situation should be used to advance reforms and improve Latvias long-term growth potential rather than lead to complacency and relaxation of reform efforts Sustainable convergence of the economy in the longer term will require inter alia ongoing commitment to prudent fiscal policies (there are some recent signs of less prudent fiscal decision-making) a continuous use of macro-prudential tools to reduce risks from growing non-resident financial flows especially in view of recent Ukraine events and the implementation of reforms in a number of vested-interest-heavy areas These include higher education and science state owned enterprise management electricity and gas market liberalization and the judiciary including insolvency framework But above all and in order to ensure economic and social sustainability for years to come high rates of poverty social exclusion and dismal demographic trends need to be addressed boldly These and other structural challenges are being addressed by the Commission under the European Semester and the Post Program Surveillance frameworks Also Latvia has joined a euro area that is very different from what it was just a few years ago the euro area economic governance framework has been greatly strengthened entailing stricter obligations
(50) The Commissionrsquos alert mechanism reports issued under the Macroeconomic Imbalance Procedure have not identified economic imbalances in Latvia requiring further in-depth investigation for possible policy action
httpeceuropaeueurope2020pdf2014amr2014_enpdf
40 | Quarterly Report on the Euro Area
II4 Corporate balance sheet adjustment in the euro area and the United States (51)
This section compares balance sheet adjustment in the non-financial corporate sector in the euro area and the United States It shows that the adjustment since the crisis has been faster in the latter Despite similar steep rises in corporate debt in pre-crisis years US corporations have cut debt more than those in the euro area Shifts from loans to bonds and extensions of debt maturity have also been more pronounced in the United States Much of the difference in balance sheet consolidation can be traced back to more positive profitability trends providing US firms with the internal funds necessary to adjust balance sheets Differences in dividend distribution strategies and in corporations physical investment behaviours also played a role Profitability differences reflect differences both in cyclical conditions and labour market adjustment Comparatively slow progress in balance sheet consolidation is likely to weigh on investment recovery in the euro area
-----------------------
Introduction
Both the euro area and the United States experienced a surge in corporate indebtedness in the years preceding the global financial crisis and in its early stages The ratio of debt to gross value added by non-financial corporations (NFCs) rose by about 40 pp between 2005 and 2009 Deteriorating growth prospects and changing attitudes to risk have prompted NFCs in both economies to adjust their balance sheets As previously argued in the Quarterly Report balance sheet adjustment can have a substantial effect on economic activity and it is important to monitor regularly the ongoing adjustment in the euro area (52) This section contributes to the monitoring by comparing progress in corporate deleveraging in the euro area and in the United States two regions where firms entered the crisis with excessive debt
(51) Section prepared by Plamen Nikolov (52) See European Commission (2010) Focus Balance sheet
adjustment in the corporate sector Quarterly Report on the Euro Area Vol9 (3) pp 9-19 A more detailed overview of the literature on the impact of balance sheet adjustment can be found in Cuerpo C I Drumond J Lendvai P Pontuch and R Raciborski (2013) Indebtedness deleveraging dynamics and macroeconomic adjustment European Economy Economic Papers 477
Firms consolidate their balance sheets primarily by raising their net lendingborrowing (NLB) ie the cash obtained from their production activity and available for financial operations (53) A rise in NLB is achieved either by increasing savings or cuttingpostponing physical investment Firms increase savings by raising profits and reducing the dividends distributed to shareholders In firmsrsquo financial accounts a rise in corporate NLB is associated with a rise in financial assets andor a cut in financial liabilities The section reviews recent developments in euro area and US profitability savings and NLB and looks at the instruments that the corporate sector has used to consolidate its balance sheet on both the asset and the liability side
Corporate profits have disappointed in the euro area hellip
National account data show that corporate profitability in the euro area reached a pre-crisis peak in 2007Q3 ie later than in the United States where it had already started to decline in 2007 (54)
Graph II41 NFC profitability euro area and US
(2000Q1-2013Q3 of GVA)
20
25
30
35
40
45
00Q1 01Q3 03Q1 04Q3 06Q1 07Q3 09Q1 10Q3 12Q1 13Q3
Euro area (1)
US
(1)Excluding Latvia Source Eurostat US Bureau of Economic Analysis DG ECFIN calculations
(53) Firms can also consolidate their balance sheets by raising equity (54) Profitability like the other national account variables for the
corporate sector presented in this section is measured as a proportion of corporate sector activity represented by gross value added (GVA) It is calculated as the gross operating surplus plus financial revenues and subsidies and minus financial and tax expenses Financial expenses do not include earnings distributed to shareholders
II Special topics on the euro area economy
Volume 13 No 1 | 41
The 2008-09 recession brought a sharp drop in corporate profitability in the euro area Profitability recovered briefly in 2010 to reach a new peak in 2011 but has declined again since then (Graph II41) In the United States the impact of the crisis was rather muted with profits recovering vigorously after 2008 As a ratio to gross value added (GVA) US corporate profits had already passed their pre-crisis level in 2009 before flattening out in the past two years Overall by 2013 profitability in the euro area was still about 2 pp below its pre-crisis peak while in the United States it stood around 3 pp above
hellip mostly due to weak operating surplus
The disappointing profit performance in the euro area relative to the United States is largely due to differing developments in gross operating surplus Looking at the breakdown of the contribution to the cumulative change in corporate profitability since the start of the crisis there is a marked difference between firms in the euro area and those in the United States (Graphs II42 and II43) (55)
Graph II42 Profitability breakdown of NFCs euro area (1)
(cumulative change in from 2007Q3 peak to 2013Q3)
35
36
37
38
39
40
41
42
-100
-80
-60
-40
-20
0
20
40
60
80
100
07Q4 08Q4 09Q4 10Q4 11Q4 12Q4
Taxes (lhs)
Other net current transfers received (lhs)
Net property income received excl dividends paid (lhs)
Operating surplus (lhs)
Profits(rhs)(2)
(1)Excluding Latvia(2)Profits in of GVA Source Eurostat DG ECFIN calculations
In the euro area a fall in the ratio of operating surplus to GVA dragged overall profitability down after 2008 Despite an improvement in 2011 in
(55) The illustration of the contributions to the cumulative change in profitability only serves to depict the relative importance of the various components of the change in profits since the crisis The starting point for the cumulative change should not be interpreted as a reference point for a desirable profit recovery
2013 operating surplus was still contributing negatively to the cumulative change in profitability since the pre-crisis peak In contrast operating surplus in the United States responded to the crisis earlier than in the euro area but its contribution to the change in profits remained positive
Graph II43 Profitability breakdown of NFCs US
(cumulative change in from 2005Q3 peak to 2013Q3)
24
25
26
27
28
29
30
31
-100
-80
-60
-40
-20
0
20
40
60
80
100
05Q4 06Q4 07Q4 08Q4 09Q4 10Q4 11Q4 12Q4
Taxes (lhs)Other net current transfers received (lhs)Net property income received excl dividends paid (lhs)Operating surplus (lhs)Profits(rhs)(2)
(1) Profits in of GVA Source Federal Reserve Board US Bureau of Economic Analysis DG ECFIN calculations
Unlike operating surplus income tax payments and net income from non-operational activities did not differ significantly between the euro area and the United States (56) In both economies lower corporate tax payments resulting from lower profits generated by NFCs naturally had a positive impact on the cumulative change in profits from the pre-crisis peak
Differences in labour market developments are at the root of differences in profitability
Differences in operating surplus and profitability between the United States and the euro area can be attributed partly to differences in the business cycle In 2011Q1 NFCsrsquo gross value added was still 12 below its pre-crisis peak in the euro area but 11 above in the United States The main channel through which cyclical developments can affect operating surplus is the labour market
(56) In fact the ratio of profit tax payments to profits (a crude measure of an aggregate tax rate) in the euro area and the United States has been almost the same since the start of the crisis falling substantially in 2008-09 indicating that tax policy was not more favourable for profits in one economy than in the other
42 | Quarterly Report on the Euro Area
The cyclicality of operating surplus depends on the impact of the cycle on labour productivity as well as on wages The worse performance of operating surplus in the euro area since 2008 as compared with that in the United States reflects a stronger deterioration in labour productivity accompanied by unfavourable developments in wages per employee
Labour productivity growth in the euro area turned sharply negative in 2009 opening a big gap with the positive (albeit modest) wage growth (Graph II44) In the United States on the other hand labour productivity growth became negative earlier but to a lesser extent and some downward wage adjustment took place in 2009
Graph II44 Labour productivity and wages euro area and US
(2001Q4-2013Q3 y-o-y change)
-4
-3
-2
-1
0
1
2
3
4
5
01Q4 03Q2 04Q4 06Q2 07Q4 09Q2 10Q4 12Q2
Average wage per employee euro area (1) (2)Average wage per employee US (1)Labour productivity euro area (2) (3)Labour productivity US (3)
(1)Real wages calculated by the GDP deflator(2)Euro area excluding Latvia(3)In terms of total employment (thousands) Source Eurostat US Bureau of Economic Analysis US Bureau of Labour Statistics DG ECFIN calculations
There are a number of reasons for the different labour adjustments in the euro area and the United States In the former apart from a higher level of employment protection short-term work schemes were put in place in the early stages of the crisis (57) In addition as labour force adjustment tends to be more costly in the euro area some firms (particularly small firms and those with highly qualified employees) preferred to retain their
(57) According to the OECD Public short-term work schemes have
played an important role in preserving jobs during the crisis in a number of countries although significant hours reductions were also achieved via lower overtime hours hours averaging arrangements and employer initiatives see OECD Employment Outlook 2010 ndash Moving Beyond the Job Crisis
labour force (58) Because of a lack of wage flexibility the higher degree of lsquolabour hoardingrsquo in the euro area came at the expense of lower operating surplus and profits and consequently put a downward pressure on the capacity accumulate internal funds to deleverage
Corporate savings are much lower in the euro area
Negative developments in euro area corporate profitability were reflected in corporate savings which together with physical investment determines the internal funds available for balance sheet adjustment In 2009-10 there was a sharp drop in euro area savings because profits acted as shock absorbers and fell more rapidly than dividend payments leaving less spare cash available In contrast savings by US NFCs increased substantially on rising profits after an early-crisis low point and reached a historically high level of around 23 of GVA in 2010Q3 (Graph II45)
Graph II45 Savings of NFCs (2000Q1- 2013Q3 of GVA)
15
16
17
18
19
20
21
22
23
24
00Q1 01Q3 03Q1 04Q3 06Q1 07Q3 09Q1 10Q3 12Q1 13Q3
Euro area (1)
US
(1)Euro area excluding Latvia Source Eurostat Bureau of Economic Analysis DG ECFIN calculations
The impression that US corporate behaviour has been more geared towards accumulating savings than that in the euro area is reinforced when one looks at dividend distribution Dividends paid by euro area NFCs have been on a declining trend since the start of the crisis but those paid by US firms have also decreased This is remarkable given (58) See Box 12 Labour hoarding across different types of firms in
OECD Employment Outlook 2010 ndash Moving Beyond the Job Crisis
II Special topics on the euro area economy
Volume 13 No 1 | 43
the positive profit developments in the United States (Graph II46) A drop in dividends alongside profit growth suggests that after 2008 US companies preferred to direct a bigger proportion of the profit recovery to corporate savings and thereby balance sheet adjustment The ratio of dividends to profits in the United States has fallen from about one third before the crisis to one quarter now This ratio also dropped in the euro area although by less (59)
Graph II46 Dividends paid of NFCs (2000Q1-2013Q3 of GVA)
0
5
10
15
20
25
00Q1 01Q3 03Q1 04Q3 06Q1 07Q3 09Q1 10Q3 12Q1 13Q3
Euro area (1)
US
(1)Euro area excluding Latvia Source Eurostat Federal Reserve Board DG ECFIN calculations
Disappointing physical investment in the euro area and the United States
Cutting investment in physical assets is another way of reducing excessive indebtedness Corporate investment as a proportion of activity dropped sharply both in the euro area and in the United States in the early stages of the crisis (Graph II47)
After a modest recovery in 2010-11 the investment rate decreased again in the euro area The investment recovery was more solid in the United States but has lost momentum since the end of 2012 and the investment rate remains below its pre-crisis peak Overall it seems that euro area corporations partly compensated for less supportive savings developments than in the US by
(59) Dividend payments are not the only way of distributing profits to shareholders Equity buybacks can also be used for this purpose and firms that choose this option will tend to have higher savings and lower dividends paid
curbing physical investment more than their US counterparts
Graph II47 Investment of NFCs (2000Q1- 2013Q3 of GVA)
15
16
17
18
19
20
21
22
23
24
00Q1 01Q3 03Q1 04Q3 06Q1 07Q3 09Q1 10Q3 12Q1 13Q3
Euro area (1)
US
(1)Excluding Latvia Source Eurostat US Bureau of Economic Analysis DG ECFIN calculations
A more modest increase in net lending in the euro area than in the US
Since 2013 firmsrsquo net lending in the euro area has been in positive territory but substantially less so than that in the United States (Graph II48) Positive NLB in the euro area unlike that in the United States is mostly due to a low investment rate alone rather than low investment combined with high savings The combination of disappointing investment and high savings has translated into historically high and sustained NLB for US firms
This persistent net lending position in the United States is atypical as firms usually invest more than they save It suggests that US firms have been adjusting their balance sheets significantly since the beginning of the crisis via their internal funds while euro area firms seem to have opted for much slower balance sheet adjustment
44 | Quarterly Report on the Euro Area
Graph II48 Net lendingborrowing of NFCs
(2000Q1- 2013Q3 of GVA)
-10
-8
-6
-4
-2
0
2
4
6
8
00Q1 01Q3 03Q1 04Q3 06Q1 07Q3 09Q1 10Q3 12Q1 13Q3
Euro area (1)
US
(1)Excluding Latvia Source Eurostat US Bureau of Economic Analysis DG ECFIN calculations
Debt deleveraging has been more pronounced in the US than in the euro area
The faster pace of adjustment of balance sheets in the United States is confirmed by the corporate debt data (Graph II49) (60) (61) While both the euro area and the United States entered the crisis with swiftly rising and historically high levels of debt deleveraging has progressed more rapidly in the latter since the crisis By the beginning of 2012 US corporate debt had fallen by approximately 15 pp as a proportion of activity while euro area debt had dropped by 7 pp (62)
(60) Non-financial corporate debt consists of loans and securities
other than shares (corporate bonds) both can be classified as short- or long-term depending on whether their original maturity is less or more than one year
(61) This section analyses developments in non-consolidated financial flows and stocks in the euro area and in the United States for two reasons it is important to have a sense of financial positions within the institutional sector eg loans between NFCs are an important part of intra-firm relationships as head offices use them to finance subsidiaries for example perhaps for tax reasons This is relatively more important in the euro area than in the United States Consolidated financial asset and flow data eliminate these intra-sector positions and different approaches may be taken to consolidation as in the euro area there is the additional issue of cross-border consolidation between Member States while there is no need for flows and positions between firms in different US states to be treated separately
(62) The debt-to-equity ratio is another measure of corporate leverage widely followed by investors Faster stock market recovery helped US firms reduce this ratio more than those in the euro area
Graph II49 Debt levels of NFCs(1) (1999Q1-2013Q3 of GVA)
100
120
140
160
180
200
220
99Q1 00Q3 02Q1 03Q3 05Q1 06Q3 08Q1 09Q3 11Q1 12Q3
Euro area (2)
US
(1)Securities other than shares and loans(2)Excluding Latvia Source Eurostat US Bureau of Economic Analysis DG ECFIN calculations
Firms in the euro area and the United States entered the crisis with almost the same level of short-term debt as a proportion of total debt Since the crisis the adjustment away from short-term debt has been significantly more pronounced in the United States suggesting more active balance sheet restructuring
Graph II410 Debt flows of NFCs(1) (1999Q1- 2013Q3 of GVA)
-15
-10
-5
0
5
10
15
20
99Q1 01Q1 03Q1 05Q1 07Q1 09Q1 11Q1 13Q1
Euro area bonds (2)
US bonds
Euro area loans (2)
US loans
(1)Securities other than shares and loans (2)Excluding Latvia Source Eurostat US Bureau of Economic Analysis DG ECFIN calculations
Due to differences in the structure of corporate finance loans (as opposed to bonds) tend to form a bigger proportion of debt in the euro area than in the United States An important element of the
II Special topics on the euro area economy
Volume 13 No 1 | 45
corporate balance sheet adjustment process in both economies has been a movement away from an excessive reliance on loans (Graph II410) and towards bond financing This trend has been substantially more pronounced in the United States presumably reflecting the fact that bond markets are more developed in that country
Developments in non-financial corporate debt were also influenced by developments in financial intermediation in particular in the banking sector Financial accounts show NFCsrsquo debt exposure but do not indicate whether the debt holder is a bank According to bank balance sheet statistics the nominal growth of loans vis-agrave-vis NFCs has been mostly negative in the euro area since 2009Q4 (Graph II411) Coupled with the positive loan inflows seen in the national accounts between 2010Q3 and 2012Q3 (Graph II410) this shows a degree of substitution in corporate loan liability ownership between banks and other financial firms and sectors (including other NFCs) in this period According to the counterparty breakdown of NFC domestic loans published by the ECB corporate borrowings from other NFCs represented 29 of all loans by 2013Q3 (up from 26 in 2008Q1) while the proportion of borrowings from monetary financial institutions (MFIs) had dropped (from 60 in 2008Q1) to an all-time low of 53 The proportion of loans from other non-bank financial intermediaries also increased There is less evidence of a shift from banks to other loan providers in the United States where loans between NFCs are much more limited
Graph II411 Bank loans to NFCs (1999Q1- 2013Q3 y-o-y change)
-20
-15
-10
-5
0
5
10
15
20
25
99Q1 00Q3 02Q1 03Q3 05Q1 06Q3 08Q1 09Q3 11Q1 12Q3
Euro area bank loans to NFCs (1)US bank loans to NFCs
(1)Excluding Latvia Source ECB US Federal Reserve Board DG ECFIN calculations
Positive NLB has been used to acquire safe financial assets in both regions
In both the euro area and the United States the positive NLB has been used to deleverage but also to invest in safe financial assets At the beginning of the crisis much of the positive corporate NLB in the United States was invested in money market mutual funds which is essentially investment in short-term low-risk assets (Graph II412) (63)
Currency and deposits (another type of safe asset) have increased substantially in the euro area in recent years as a proportion of total firm activity (Graph II413) This rise was driven almost exclusively by a rapid increase in firmsrsquo savings deposits To some extent a similar trend is observable in the United States In particular US cash balances (a sub-component of currency and deposits) approached 12 of GVA by the end of 2013 a level not seen since the early 1990s On the other hand savings deposits have grown more modestly resulting in a moderately positive overall trend in currency and deposits
Graph II412 Mutual fund shares of NFCs (1999Q1- 2013Q3 of GVA)
0
2
4
6
8
10
12
14
99Q1 01Q1 03Q1 05Q1 07Q1 09Q1 11Q1 13Q1
Euro area (1)
US (2)
(1)Excluding Latvia(2)In the USA these asset series can be broken down into investment in money market mutual funds and investment in other mutual funds The 2009-11 increase is fully attributable to the former Source Eurostat US Bureau of Economic Analysis DG ECFIN calculations
Overall these two aspects of corporate financial investment behaviour signify considerable liquidity concerns on the part of firms in both the euro area
(63) Euro area financial accounts only show firmsrsquo investment in mutual funds overall and do not distinguish between types of mutual funds
46 | Quarterly Report on the Euro Area
and the United States They also represent a drive towards lower-risk assets perhaps indicating increased risk aversion by corporations or a tendency to postpone physical investment in a context of perceived high uncertainty
Graph II413 Currency and deposits ndash NFCs
(1999Q1- 2013Q3 of GVA)
0
5
10
15
20
25
30
35
40
45
99Q1 00Q3 02Q1 03Q3 05Q1 06Q3 08Q1 09Q3 11Q1 12Q3
Euro area (1)
US
(1)Excluding Latvia Source Eurostat US Bureau of Economic Analysis DG ECFIN calculations
Conclusion
Although both regions saw similar steep rises in corporate debt in the pre-crisis years balance sheet adjustment since the crisis has been significantly slower in the euro area than in the United States The more rapid adjustment in the United States can be explained by a stronger cyclical recovery more supportive profitability developments and reduced dividend payment ratios In the euro area profitability has been hindered by a combination of lower flexibility in the labour markets and slow wage adjustment
The slower balance sheet adjustment in the euro area corporate sector is visible in a slower fall in indebtedness but also a slower adjustment of the structure of balance sheets In particular the shift from loans to bonds and the extension of debt maturity have been more pronounced in the United States In both regions firms have used their positive NLB to accelerate the accumulation of safe and liquid financial assets This could reflect continuing uncertainty regarding future demand and growth prospects
Overall the evidence discussed in this section shows that euro area firms are lagging significantly behind their US counterparts in terms of balance sheet consolidation Given that investment rates remain disappointing even in the more advanced US corporate sector a degree of caution appears warranted when assessing short-term prospects for corporate investment in the euro area
III Recent DG ECFIN publications
Volume 13 No 1 | 47
1 Occasional Papers
European Economy Occasional Papers 170 January 2014 Financial Assistance Programme for the Recapitalisation of Financial Institutions in Spain Fifth Review ndash Winter 2014 httpeceuropaeueconomy_financepublicationsoccasional_paper2014pdfocp170_enpdf
European Economy Occasional Papers 169 December 2013 The Economic Adjustment Programme for Cyprus Second Review ndash Autumn 2013 httpeceuropaeueconomy_financepublicationsoccasional_paper2013pdfocp169_enpdf
European Economy Occasional Papers 168 December 2013 Fiscal frameworks in the European Union ommission services country factsheets for the Autumn 2013 Peer Review httpeceuropaeueconomy_financepublicationsoccasional_paper2013pdfocp168_enpdf
European Economy Occasional Papers 167 December 2013 Economic Adjustment Programme for Ireland - Autumn 2013 Review httpeceuropaeueconomy_financepublicationsoccasional_paper2013pdfocp167_enpdf
European Economy Occasional Papers 166 December 2013 Progress towards meeting the economic criteria for EU accession the EU Commissionrsquos 2013 assessments httpeceuropaeueconomy_financepublicationsoccasional_paper2013pdfocp166_enpdf
European Economy Occasional Papers 165 November 2013 Romania Balance-of-Payments Assistance Programme 2013-2015 httpeceuropaeueconomy_financepublicationsoccasional_paper2013pdfocp165_enpdf
European Economy Occasional Papers 164 November 2013 The Economic Adjustment Programme for Portugal Eighth and Ninth Review httpeceuropaeueconomy_financepublicationsoccasional_paper2013pdfocp164_enpdf
European Economy Occasional Papers 163 November 2013 Financial Assistance Programme for the Recapitalisation of Financial Institutions in Spain Fourth Review ndash Autumn 2013 httpeceuropaeueconomy_financepublicationsoccasional_paper2013pdfocp163_enpdf
European Economy Occasional Papers 162 October 2013 Economic Adjustment Programme for Ireland Summer 2013 Review httpeceuropaeueconomy_financepublicationsoccasional_paper2013pdfocp162_enpdf
2 Economic papers
European Economy Economic Papers 514 February 2014 Martin Larch Kristin Magnusson Bernard Balint Tatar Hard work and More How to successfully conduct adjustment with official assistance httpeceuropaeueconomy_financepublicationseconomic_paper2014pdfecp514_enpdf
European Economy Economic Papers 513 February 2014 Florian Woumlhlbier Caterina Astarita Gilles Mourre Consolidation on the revenue side and growth-friendly tax structures an indicator based approach httpeceuropaeueconomy_financepublicationseconomic_paper2014pdfecp513_enpdf
48 | Quarterly Report on the Euro Area
European Economy Economic Papers 512 December 2013 Alexander Schwan Etienne Sail Assessing the economic and budgetary impact of linking retirement ages and pension benefits to increases in longevity httpeceuropaeueconomy_financepublicationseconomic_paper2013pdfecp512_enpdf 3 Other publications
Winter forecast 2014 - EU economy recovery gaining ground httpeceuropaeueconomy_financepublicationseuropean_economy2014pdfee2_enpdf 4 Regular publications
Business and Consumer Surveys (harmonised surveys for different sectors of the economies in the European Union (EU) and the applicant countries) httpeceuropaeueconomy_financedb_indicatorssurveysindex_enhtm Business Climate Indicator for the euro area (monthly indicator designed to deliver a clear and early assessment of the cyclical situation) httpeceuropaeueconomy_financedb_indicatorssurveysdocuments2013bci_2013_11_enpdf Key indicators for the euro area (presents the most relevant economic statistics concerning the euro area) httpeceuropaeueconomy_financedb_indicatorskey_indicatorsindex_enhtm Monthly and quarterly notes on the euro-denominated bond markets (looks at the volumes of debt issued the maturity structures and the conditions in the market) httpeceuropaeueconomy_financepublicationsbond_marketindex_enhtm Price and Cost Competitiveness httpeceuropaeueconomy_financedb_indicatorscompetitivenessindex_enhtm
50 | Quarterly Report on the Euro Area
Editor-in-Chief Elena Flores
Overall coordination Eric Ruscher
Data assistance Christos Zavos
Comments on the report would be gratefully received and should be sent to
Elena Flores Director ndash Policy Strategy and Coordination Directorate-General for Economic and Financial Affairs Office CHAR 1566
B-1049 Brussels
Email elenafloreseceuropaeu
or
Eric Ruscher Head of Unit ndash Macroeconomy of the euro area Directorate-General for Economic and Financial Affairs Office CHAR 15248
B-1049 Brussels
Email ericruschereceuropaeu
HOW TO OBTAIN EU PUBLICATIONS Free publications bull one copy
via EU Bookshop (httpbookshopeuropaeu) bull more than one copy or postersmaps
from the European Unionrsquos representations (httpeceuropaeurepresent_enhtm) from the delegations in non-EU countries (httpeeaseuropaeudelegationsindex_enhtm) by contacting the Europe Direct service (httpeuropaeueuropedirectindex_enhtm) or calling 00 800 6 7 8 9 10 11 (freephone number from anywhere in the EU) () () The information given is free as are most calls (though some operators phone boxes or hotels may charge you)
Priced publications bull via EU Bookshop (httpbookshopeuropaeu) Priced subscriptions bull via one of the sales agents of the Publications Office of the European Union
(httppublicationseuropaeuothersagentsindex_enhtm)
KC-AK-14-001-en-n
- Blank Page
- Blank Page
- Blank Page
- Blank Page
-

II Special topics on the euro area economy
Volume 13 No 1 | 41
The 2008-09 recession brought a sharp drop in corporate profitability in the euro area Profitability recovered briefly in 2010 to reach a new peak in 2011 but has declined again since then (Graph II41) In the United States the impact of the crisis was rather muted with profits recovering vigorously after 2008 As a ratio to gross value added (GVA) US corporate profits had already passed their pre-crisis level in 2009 before flattening out in the past two years Overall by 2013 profitability in the euro area was still about 2 pp below its pre-crisis peak while in the United States it stood around 3 pp above
hellip mostly due to weak operating surplus
The disappointing profit performance in the euro area relative to the United States is largely due to differing developments in gross operating surplus Looking at the breakdown of the contribution to the cumulative change in corporate profitability since the start of the crisis there is a marked difference between firms in the euro area and those in the United States (Graphs II42 and II43) (55)
Graph II42 Profitability breakdown of NFCs euro area (1)
(cumulative change in from 2007Q3 peak to 2013Q3)
35
36
37
38
39
40
41
42
-100
-80
-60
-40
-20
0
20
40
60
80
100
07Q4 08Q4 09Q4 10Q4 11Q4 12Q4
Taxes (lhs)
Other net current transfers received (lhs)
Net property income received excl dividends paid (lhs)
Operating surplus (lhs)
Profits(rhs)(2)
(1)Excluding Latvia(2)Profits in of GVA Source Eurostat DG ECFIN calculations
In the euro area a fall in the ratio of operating surplus to GVA dragged overall profitability down after 2008 Despite an improvement in 2011 in
(55) The illustration of the contributions to the cumulative change in profitability only serves to depict the relative importance of the various components of the change in profits since the crisis The starting point for the cumulative change should not be interpreted as a reference point for a desirable profit recovery
2013 operating surplus was still contributing negatively to the cumulative change in profitability since the pre-crisis peak In contrast operating surplus in the United States responded to the crisis earlier than in the euro area but its contribution to the change in profits remained positive
Graph II43 Profitability breakdown of NFCs US
(cumulative change in from 2005Q3 peak to 2013Q3)
24
25
26
27
28
29
30
31
-100
-80
-60
-40
-20
0
20
40
60
80
100
05Q4 06Q4 07Q4 08Q4 09Q4 10Q4 11Q4 12Q4
Taxes (lhs)Other net current transfers received (lhs)Net property income received excl dividends paid (lhs)Operating surplus (lhs)Profits(rhs)(2)
(1) Profits in of GVA Source Federal Reserve Board US Bureau of Economic Analysis DG ECFIN calculations
Unlike operating surplus income tax payments and net income from non-operational activities did not differ significantly between the euro area and the United States (56) In both economies lower corporate tax payments resulting from lower profits generated by NFCs naturally had a positive impact on the cumulative change in profits from the pre-crisis peak
Differences in labour market developments are at the root of differences in profitability
Differences in operating surplus and profitability between the United States and the euro area can be attributed partly to differences in the business cycle In 2011Q1 NFCsrsquo gross value added was still 12 below its pre-crisis peak in the euro area but 11 above in the United States The main channel through which cyclical developments can affect operating surplus is the labour market
(56) In fact the ratio of profit tax payments to profits (a crude measure of an aggregate tax rate) in the euro area and the United States has been almost the same since the start of the crisis falling substantially in 2008-09 indicating that tax policy was not more favourable for profits in one economy than in the other
42 | Quarterly Report on the Euro Area
The cyclicality of operating surplus depends on the impact of the cycle on labour productivity as well as on wages The worse performance of operating surplus in the euro area since 2008 as compared with that in the United States reflects a stronger deterioration in labour productivity accompanied by unfavourable developments in wages per employee
Labour productivity growth in the euro area turned sharply negative in 2009 opening a big gap with the positive (albeit modest) wage growth (Graph II44) In the United States on the other hand labour productivity growth became negative earlier but to a lesser extent and some downward wage adjustment took place in 2009
Graph II44 Labour productivity and wages euro area and US
(2001Q4-2013Q3 y-o-y change)
-4
-3
-2
-1
0
1
2
3
4
5
01Q4 03Q2 04Q4 06Q2 07Q4 09Q2 10Q4 12Q2
Average wage per employee euro area (1) (2)Average wage per employee US (1)Labour productivity euro area (2) (3)Labour productivity US (3)
(1)Real wages calculated by the GDP deflator(2)Euro area excluding Latvia(3)In terms of total employment (thousands) Source Eurostat US Bureau of Economic Analysis US Bureau of Labour Statistics DG ECFIN calculations
There are a number of reasons for the different labour adjustments in the euro area and the United States In the former apart from a higher level of employment protection short-term work schemes were put in place in the early stages of the crisis (57) In addition as labour force adjustment tends to be more costly in the euro area some firms (particularly small firms and those with highly qualified employees) preferred to retain their
(57) According to the OECD Public short-term work schemes have
played an important role in preserving jobs during the crisis in a number of countries although significant hours reductions were also achieved via lower overtime hours hours averaging arrangements and employer initiatives see OECD Employment Outlook 2010 ndash Moving Beyond the Job Crisis
labour force (58) Because of a lack of wage flexibility the higher degree of lsquolabour hoardingrsquo in the euro area came at the expense of lower operating surplus and profits and consequently put a downward pressure on the capacity accumulate internal funds to deleverage
Corporate savings are much lower in the euro area
Negative developments in euro area corporate profitability were reflected in corporate savings which together with physical investment determines the internal funds available for balance sheet adjustment In 2009-10 there was a sharp drop in euro area savings because profits acted as shock absorbers and fell more rapidly than dividend payments leaving less spare cash available In contrast savings by US NFCs increased substantially on rising profits after an early-crisis low point and reached a historically high level of around 23 of GVA in 2010Q3 (Graph II45)
Graph II45 Savings of NFCs (2000Q1- 2013Q3 of GVA)
15
16
17
18
19
20
21
22
23
24
00Q1 01Q3 03Q1 04Q3 06Q1 07Q3 09Q1 10Q3 12Q1 13Q3
Euro area (1)
US
(1)Euro area excluding Latvia Source Eurostat Bureau of Economic Analysis DG ECFIN calculations
The impression that US corporate behaviour has been more geared towards accumulating savings than that in the euro area is reinforced when one looks at dividend distribution Dividends paid by euro area NFCs have been on a declining trend since the start of the crisis but those paid by US firms have also decreased This is remarkable given (58) See Box 12 Labour hoarding across different types of firms in
OECD Employment Outlook 2010 ndash Moving Beyond the Job Crisis
II Special topics on the euro area economy
Volume 13 No 1 | 43
the positive profit developments in the United States (Graph II46) A drop in dividends alongside profit growth suggests that after 2008 US companies preferred to direct a bigger proportion of the profit recovery to corporate savings and thereby balance sheet adjustment The ratio of dividends to profits in the United States has fallen from about one third before the crisis to one quarter now This ratio also dropped in the euro area although by less (59)
Graph II46 Dividends paid of NFCs (2000Q1-2013Q3 of GVA)
0
5
10
15
20
25
00Q1 01Q3 03Q1 04Q3 06Q1 07Q3 09Q1 10Q3 12Q1 13Q3
Euro area (1)
US
(1)Euro area excluding Latvia Source Eurostat Federal Reserve Board DG ECFIN calculations
Disappointing physical investment in the euro area and the United States
Cutting investment in physical assets is another way of reducing excessive indebtedness Corporate investment as a proportion of activity dropped sharply both in the euro area and in the United States in the early stages of the crisis (Graph II47)
After a modest recovery in 2010-11 the investment rate decreased again in the euro area The investment recovery was more solid in the United States but has lost momentum since the end of 2012 and the investment rate remains below its pre-crisis peak Overall it seems that euro area corporations partly compensated for less supportive savings developments than in the US by
(59) Dividend payments are not the only way of distributing profits to shareholders Equity buybacks can also be used for this purpose and firms that choose this option will tend to have higher savings and lower dividends paid
curbing physical investment more than their US counterparts
Graph II47 Investment of NFCs (2000Q1- 2013Q3 of GVA)
15
16
17
18
19
20
21
22
23
24
00Q1 01Q3 03Q1 04Q3 06Q1 07Q3 09Q1 10Q3 12Q1 13Q3
Euro area (1)
US
(1)Excluding Latvia Source Eurostat US Bureau of Economic Analysis DG ECFIN calculations
A more modest increase in net lending in the euro area than in the US
Since 2013 firmsrsquo net lending in the euro area has been in positive territory but substantially less so than that in the United States (Graph II48) Positive NLB in the euro area unlike that in the United States is mostly due to a low investment rate alone rather than low investment combined with high savings The combination of disappointing investment and high savings has translated into historically high and sustained NLB for US firms
This persistent net lending position in the United States is atypical as firms usually invest more than they save It suggests that US firms have been adjusting their balance sheets significantly since the beginning of the crisis via their internal funds while euro area firms seem to have opted for much slower balance sheet adjustment
44 | Quarterly Report on the Euro Area
Graph II48 Net lendingborrowing of NFCs
(2000Q1- 2013Q3 of GVA)
-10
-8
-6
-4
-2
0
2
4
6
8
00Q1 01Q3 03Q1 04Q3 06Q1 07Q3 09Q1 10Q3 12Q1 13Q3
Euro area (1)
US
(1)Excluding Latvia Source Eurostat US Bureau of Economic Analysis DG ECFIN calculations
Debt deleveraging has been more pronounced in the US than in the euro area
The faster pace of adjustment of balance sheets in the United States is confirmed by the corporate debt data (Graph II49) (60) (61) While both the euro area and the United States entered the crisis with swiftly rising and historically high levels of debt deleveraging has progressed more rapidly in the latter since the crisis By the beginning of 2012 US corporate debt had fallen by approximately 15 pp as a proportion of activity while euro area debt had dropped by 7 pp (62)
(60) Non-financial corporate debt consists of loans and securities
other than shares (corporate bonds) both can be classified as short- or long-term depending on whether their original maturity is less or more than one year
(61) This section analyses developments in non-consolidated financial flows and stocks in the euro area and in the United States for two reasons it is important to have a sense of financial positions within the institutional sector eg loans between NFCs are an important part of intra-firm relationships as head offices use them to finance subsidiaries for example perhaps for tax reasons This is relatively more important in the euro area than in the United States Consolidated financial asset and flow data eliminate these intra-sector positions and different approaches may be taken to consolidation as in the euro area there is the additional issue of cross-border consolidation between Member States while there is no need for flows and positions between firms in different US states to be treated separately
(62) The debt-to-equity ratio is another measure of corporate leverage widely followed by investors Faster stock market recovery helped US firms reduce this ratio more than those in the euro area
Graph II49 Debt levels of NFCs(1) (1999Q1-2013Q3 of GVA)
100
120
140
160
180
200
220
99Q1 00Q3 02Q1 03Q3 05Q1 06Q3 08Q1 09Q3 11Q1 12Q3
Euro area (2)
US
(1)Securities other than shares and loans(2)Excluding Latvia Source Eurostat US Bureau of Economic Analysis DG ECFIN calculations
Firms in the euro area and the United States entered the crisis with almost the same level of short-term debt as a proportion of total debt Since the crisis the adjustment away from short-term debt has been significantly more pronounced in the United States suggesting more active balance sheet restructuring
Graph II410 Debt flows of NFCs(1) (1999Q1- 2013Q3 of GVA)
-15
-10
-5
0
5
10
15
20
99Q1 01Q1 03Q1 05Q1 07Q1 09Q1 11Q1 13Q1
Euro area bonds (2)
US bonds
Euro area loans (2)
US loans
(1)Securities other than shares and loans (2)Excluding Latvia Source Eurostat US Bureau of Economic Analysis DG ECFIN calculations
Due to differences in the structure of corporate finance loans (as opposed to bonds) tend to form a bigger proportion of debt in the euro area than in the United States An important element of the
II Special topics on the euro area economy
Volume 13 No 1 | 45
corporate balance sheet adjustment process in both economies has been a movement away from an excessive reliance on loans (Graph II410) and towards bond financing This trend has been substantially more pronounced in the United States presumably reflecting the fact that bond markets are more developed in that country
Developments in non-financial corporate debt were also influenced by developments in financial intermediation in particular in the banking sector Financial accounts show NFCsrsquo debt exposure but do not indicate whether the debt holder is a bank According to bank balance sheet statistics the nominal growth of loans vis-agrave-vis NFCs has been mostly negative in the euro area since 2009Q4 (Graph II411) Coupled with the positive loan inflows seen in the national accounts between 2010Q3 and 2012Q3 (Graph II410) this shows a degree of substitution in corporate loan liability ownership between banks and other financial firms and sectors (including other NFCs) in this period According to the counterparty breakdown of NFC domestic loans published by the ECB corporate borrowings from other NFCs represented 29 of all loans by 2013Q3 (up from 26 in 2008Q1) while the proportion of borrowings from monetary financial institutions (MFIs) had dropped (from 60 in 2008Q1) to an all-time low of 53 The proportion of loans from other non-bank financial intermediaries also increased There is less evidence of a shift from banks to other loan providers in the United States where loans between NFCs are much more limited
Graph II411 Bank loans to NFCs (1999Q1- 2013Q3 y-o-y change)
-20
-15
-10
-5
0
5
10
15
20
25
99Q1 00Q3 02Q1 03Q3 05Q1 06Q3 08Q1 09Q3 11Q1 12Q3
Euro area bank loans to NFCs (1)US bank loans to NFCs
(1)Excluding Latvia Source ECB US Federal Reserve Board DG ECFIN calculations
Positive NLB has been used to acquire safe financial assets in both regions
In both the euro area and the United States the positive NLB has been used to deleverage but also to invest in safe financial assets At the beginning of the crisis much of the positive corporate NLB in the United States was invested in money market mutual funds which is essentially investment in short-term low-risk assets (Graph II412) (63)
Currency and deposits (another type of safe asset) have increased substantially in the euro area in recent years as a proportion of total firm activity (Graph II413) This rise was driven almost exclusively by a rapid increase in firmsrsquo savings deposits To some extent a similar trend is observable in the United States In particular US cash balances (a sub-component of currency and deposits) approached 12 of GVA by the end of 2013 a level not seen since the early 1990s On the other hand savings deposits have grown more modestly resulting in a moderately positive overall trend in currency and deposits
Graph II412 Mutual fund shares of NFCs (1999Q1- 2013Q3 of GVA)
0
2
4
6
8
10
12
14
99Q1 01Q1 03Q1 05Q1 07Q1 09Q1 11Q1 13Q1
Euro area (1)
US (2)
(1)Excluding Latvia(2)In the USA these asset series can be broken down into investment in money market mutual funds and investment in other mutual funds The 2009-11 increase is fully attributable to the former Source Eurostat US Bureau of Economic Analysis DG ECFIN calculations
Overall these two aspects of corporate financial investment behaviour signify considerable liquidity concerns on the part of firms in both the euro area
(63) Euro area financial accounts only show firmsrsquo investment in mutual funds overall and do not distinguish between types of mutual funds
46 | Quarterly Report on the Euro Area
and the United States They also represent a drive towards lower-risk assets perhaps indicating increased risk aversion by corporations or a tendency to postpone physical investment in a context of perceived high uncertainty
Graph II413 Currency and deposits ndash NFCs
(1999Q1- 2013Q3 of GVA)
0
5
10
15
20
25
30
35
40
45
99Q1 00Q3 02Q1 03Q3 05Q1 06Q3 08Q1 09Q3 11Q1 12Q3
Euro area (1)
US
(1)Excluding Latvia Source Eurostat US Bureau of Economic Analysis DG ECFIN calculations
Conclusion
Although both regions saw similar steep rises in corporate debt in the pre-crisis years balance sheet adjustment since the crisis has been significantly slower in the euro area than in the United States The more rapid adjustment in the United States can be explained by a stronger cyclical recovery more supportive profitability developments and reduced dividend payment ratios In the euro area profitability has been hindered by a combination of lower flexibility in the labour markets and slow wage adjustment
The slower balance sheet adjustment in the euro area corporate sector is visible in a slower fall in indebtedness but also a slower adjustment of the structure of balance sheets In particular the shift from loans to bonds and the extension of debt maturity have been more pronounced in the United States In both regions firms have used their positive NLB to accelerate the accumulation of safe and liquid financial assets This could reflect continuing uncertainty regarding future demand and growth prospects
Overall the evidence discussed in this section shows that euro area firms are lagging significantly behind their US counterparts in terms of balance sheet consolidation Given that investment rates remain disappointing even in the more advanced US corporate sector a degree of caution appears warranted when assessing short-term prospects for corporate investment in the euro area
III Recent DG ECFIN publications
Volume 13 No 1 | 47
1 Occasional Papers
European Economy Occasional Papers 170 January 2014 Financial Assistance Programme for the Recapitalisation of Financial Institutions in Spain Fifth Review ndash Winter 2014 httpeceuropaeueconomy_financepublicationsoccasional_paper2014pdfocp170_enpdf
European Economy Occasional Papers 169 December 2013 The Economic Adjustment Programme for Cyprus Second Review ndash Autumn 2013 httpeceuropaeueconomy_financepublicationsoccasional_paper2013pdfocp169_enpdf
European Economy Occasional Papers 168 December 2013 Fiscal frameworks in the European Union ommission services country factsheets for the Autumn 2013 Peer Review httpeceuropaeueconomy_financepublicationsoccasional_paper2013pdfocp168_enpdf
European Economy Occasional Papers 167 December 2013 Economic Adjustment Programme for Ireland - Autumn 2013 Review httpeceuropaeueconomy_financepublicationsoccasional_paper2013pdfocp167_enpdf
European Economy Occasional Papers 166 December 2013 Progress towards meeting the economic criteria for EU accession the EU Commissionrsquos 2013 assessments httpeceuropaeueconomy_financepublicationsoccasional_paper2013pdfocp166_enpdf
European Economy Occasional Papers 165 November 2013 Romania Balance-of-Payments Assistance Programme 2013-2015 httpeceuropaeueconomy_financepublicationsoccasional_paper2013pdfocp165_enpdf
European Economy Occasional Papers 164 November 2013 The Economic Adjustment Programme for Portugal Eighth and Ninth Review httpeceuropaeueconomy_financepublicationsoccasional_paper2013pdfocp164_enpdf
European Economy Occasional Papers 163 November 2013 Financial Assistance Programme for the Recapitalisation of Financial Institutions in Spain Fourth Review ndash Autumn 2013 httpeceuropaeueconomy_financepublicationsoccasional_paper2013pdfocp163_enpdf
European Economy Occasional Papers 162 October 2013 Economic Adjustment Programme for Ireland Summer 2013 Review httpeceuropaeueconomy_financepublicationsoccasional_paper2013pdfocp162_enpdf
2 Economic papers
European Economy Economic Papers 514 February 2014 Martin Larch Kristin Magnusson Bernard Balint Tatar Hard work and More How to successfully conduct adjustment with official assistance httpeceuropaeueconomy_financepublicationseconomic_paper2014pdfecp514_enpdf
European Economy Economic Papers 513 February 2014 Florian Woumlhlbier Caterina Astarita Gilles Mourre Consolidation on the revenue side and growth-friendly tax structures an indicator based approach httpeceuropaeueconomy_financepublicationseconomic_paper2014pdfecp513_enpdf
48 | Quarterly Report on the Euro Area
European Economy Economic Papers 512 December 2013 Alexander Schwan Etienne Sail Assessing the economic and budgetary impact of linking retirement ages and pension benefits to increases in longevity httpeceuropaeueconomy_financepublicationseconomic_paper2013pdfecp512_enpdf 3 Other publications
Winter forecast 2014 - EU economy recovery gaining ground httpeceuropaeueconomy_financepublicationseuropean_economy2014pdfee2_enpdf 4 Regular publications
Business and Consumer Surveys (harmonised surveys for different sectors of the economies in the European Union (EU) and the applicant countries) httpeceuropaeueconomy_financedb_indicatorssurveysindex_enhtm Business Climate Indicator for the euro area (monthly indicator designed to deliver a clear and early assessment of the cyclical situation) httpeceuropaeueconomy_financedb_indicatorssurveysdocuments2013bci_2013_11_enpdf Key indicators for the euro area (presents the most relevant economic statistics concerning the euro area) httpeceuropaeueconomy_financedb_indicatorskey_indicatorsindex_enhtm Monthly and quarterly notes on the euro-denominated bond markets (looks at the volumes of debt issued the maturity structures and the conditions in the market) httpeceuropaeueconomy_financepublicationsbond_marketindex_enhtm Price and Cost Competitiveness httpeceuropaeueconomy_financedb_indicatorscompetitivenessindex_enhtm
50 | Quarterly Report on the Euro Area
Editor-in-Chief Elena Flores
Overall coordination Eric Ruscher
Data assistance Christos Zavos
Comments on the report would be gratefully received and should be sent to
Elena Flores Director ndash Policy Strategy and Coordination Directorate-General for Economic and Financial Affairs Office CHAR 1566
B-1049 Brussels
Email elenafloreseceuropaeu
or
Eric Ruscher Head of Unit ndash Macroeconomy of the euro area Directorate-General for Economic and Financial Affairs Office CHAR 15248
B-1049 Brussels
Email ericruschereceuropaeu
HOW TO OBTAIN EU PUBLICATIONS Free publications bull one copy
via EU Bookshop (httpbookshopeuropaeu) bull more than one copy or postersmaps
from the European Unionrsquos representations (httpeceuropaeurepresent_enhtm) from the delegations in non-EU countries (httpeeaseuropaeudelegationsindex_enhtm) by contacting the Europe Direct service (httpeuropaeueuropedirectindex_enhtm) or calling 00 800 6 7 8 9 10 11 (freephone number from anywhere in the EU) () () The information given is free as are most calls (though some operators phone boxes or hotels may charge you)
Priced publications bull via EU Bookshop (httpbookshopeuropaeu) Priced subscriptions bull via one of the sales agents of the Publications Office of the European Union
(httppublicationseuropaeuothersagentsindex_enhtm)
KC-AK-14-001-en-n
- Blank Page
- Blank Page
- Blank Page
- Blank Page
-
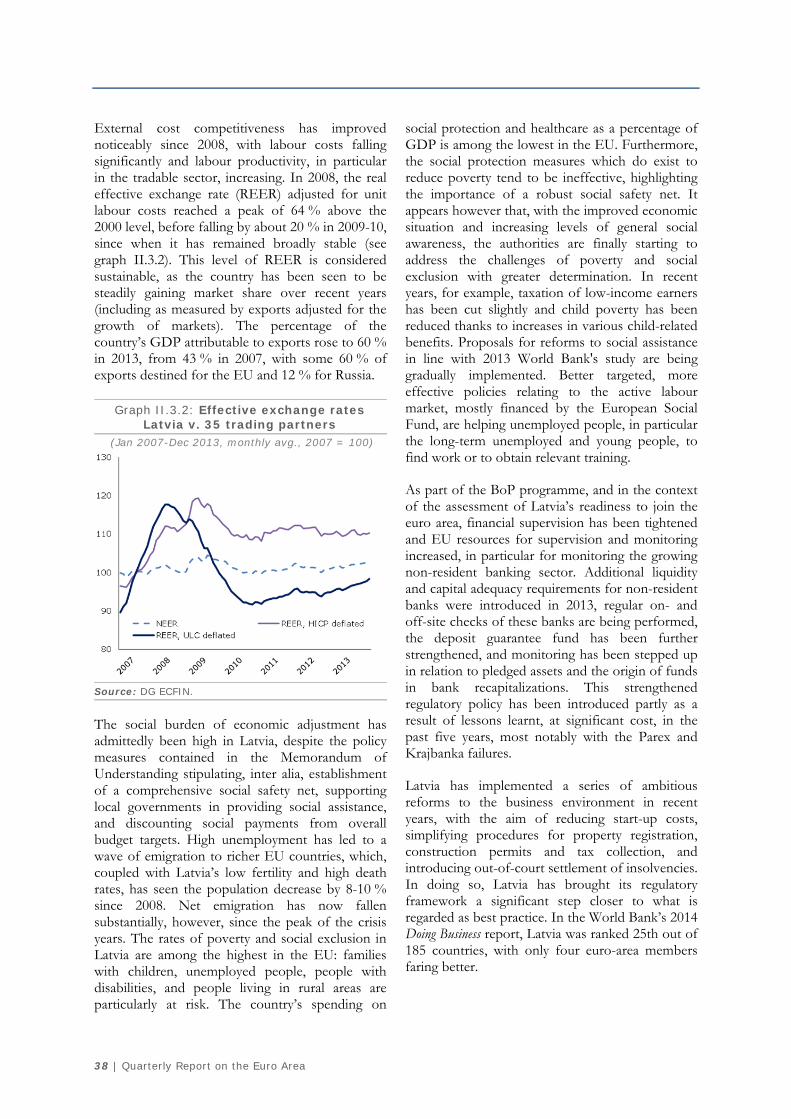

II Special topics on the euro area economy
Volume 13 No 1 | 43
the positive profit developments in the United States (Graph II46) A drop in dividends alongside profit growth suggests that after 2008 US companies preferred to direct a bigger proportion of the profit recovery to corporate savings and thereby balance sheet adjustment The ratio of dividends to profits in the United States has fallen from about one third before the crisis to one quarter now This ratio also dropped in the euro area although by less (59)
Graph II46 Dividends paid of NFCs (2000Q1-2013Q3 of GVA)
0
5
10
15
20
25
00Q1 01Q3 03Q1 04Q3 06Q1 07Q3 09Q1 10Q3 12Q1 13Q3
Euro area (1)
US
(1)Euro area excluding Latvia Source Eurostat Federal Reserve Board DG ECFIN calculations
Disappointing physical investment in the euro area and the United States
Cutting investment in physical assets is another way of reducing excessive indebtedness Corporate investment as a proportion of activity dropped sharply both in the euro area and in the United States in the early stages of the crisis (Graph II47)
After a modest recovery in 2010-11 the investment rate decreased again in the euro area The investment recovery was more solid in the United States but has lost momentum since the end of 2012 and the investment rate remains below its pre-crisis peak Overall it seems that euro area corporations partly compensated for less supportive savings developments than in the US by
(59) Dividend payments are not the only way of distributing profits to shareholders Equity buybacks can also be used for this purpose and firms that choose this option will tend to have higher savings and lower dividends paid
curbing physical investment more than their US counterparts
Graph II47 Investment of NFCs (2000Q1- 2013Q3 of GVA)
15
16
17
18
19
20
21
22
23
24
00Q1 01Q3 03Q1 04Q3 06Q1 07Q3 09Q1 10Q3 12Q1 13Q3
Euro area (1)
US
(1)Excluding Latvia Source Eurostat US Bureau of Economic Analysis DG ECFIN calculations
A more modest increase in net lending in the euro area than in the US
Since 2013 firmsrsquo net lending in the euro area has been in positive territory but substantially less so than that in the United States (Graph II48) Positive NLB in the euro area unlike that in the United States is mostly due to a low investment rate alone rather than low investment combined with high savings The combination of disappointing investment and high savings has translated into historically high and sustained NLB for US firms
This persistent net lending position in the United States is atypical as firms usually invest more than they save It suggests that US firms have been adjusting their balance sheets significantly since the beginning of the crisis via their internal funds while euro area firms seem to have opted for much slower balance sheet adjustment
44 | Quarterly Report on the Euro Area
Graph II48 Net lendingborrowing of NFCs
(2000Q1- 2013Q3 of GVA)
-10
-8
-6
-4
-2
0
2
4
6
8
00Q1 01Q3 03Q1 04Q3 06Q1 07Q3 09Q1 10Q3 12Q1 13Q3
Euro area (1)
US
(1)Excluding Latvia Source Eurostat US Bureau of Economic Analysis DG ECFIN calculations
Debt deleveraging has been more pronounced in the US than in the euro area
The faster pace of adjustment of balance sheets in the United States is confirmed by the corporate debt data (Graph II49) (60) (61) While both the euro area and the United States entered the crisis with swiftly rising and historically high levels of debt deleveraging has progressed more rapidly in the latter since the crisis By the beginning of 2012 US corporate debt had fallen by approximately 15 pp as a proportion of activity while euro area debt had dropped by 7 pp (62)
(60) Non-financial corporate debt consists of loans and securities
other than shares (corporate bonds) both can be classified as short- or long-term depending on whether their original maturity is less or more than one year
(61) This section analyses developments in non-consolidated financial flows and stocks in the euro area and in the United States for two reasons it is important to have a sense of financial positions within the institutional sector eg loans between NFCs are an important part of intra-firm relationships as head offices use them to finance subsidiaries for example perhaps for tax reasons This is relatively more important in the euro area than in the United States Consolidated financial asset and flow data eliminate these intra-sector positions and different approaches may be taken to consolidation as in the euro area there is the additional issue of cross-border consolidation between Member States while there is no need for flows and positions between firms in different US states to be treated separately
(62) The debt-to-equity ratio is another measure of corporate leverage widely followed by investors Faster stock market recovery helped US firms reduce this ratio more than those in the euro area
Graph II49 Debt levels of NFCs(1) (1999Q1-2013Q3 of GVA)
100
120
140
160
180
200
220
99Q1 00Q3 02Q1 03Q3 05Q1 06Q3 08Q1 09Q3 11Q1 12Q3
Euro area (2)
US
(1)Securities other than shares and loans(2)Excluding Latvia Source Eurostat US Bureau of Economic Analysis DG ECFIN calculations
Firms in the euro area and the United States entered the crisis with almost the same level of short-term debt as a proportion of total debt Since the crisis the adjustment away from short-term debt has been significantly more pronounced in the United States suggesting more active balance sheet restructuring
Graph II410 Debt flows of NFCs(1) (1999Q1- 2013Q3 of GVA)
-15
-10
-5
0
5
10
15
20
99Q1 01Q1 03Q1 05Q1 07Q1 09Q1 11Q1 13Q1
Euro area bonds (2)
US bonds
Euro area loans (2)
US loans
(1)Securities other than shares and loans (2)Excluding Latvia Source Eurostat US Bureau of Economic Analysis DG ECFIN calculations
Due to differences in the structure of corporate finance loans (as opposed to bonds) tend to form a bigger proportion of debt in the euro area than in the United States An important element of the
II Special topics on the euro area economy
Volume 13 No 1 | 45
corporate balance sheet adjustment process in both economies has been a movement away from an excessive reliance on loans (Graph II410) and towards bond financing This trend has been substantially more pronounced in the United States presumably reflecting the fact that bond markets are more developed in that country
Developments in non-financial corporate debt were also influenced by developments in financial intermediation in particular in the banking sector Financial accounts show NFCsrsquo debt exposure but do not indicate whether the debt holder is a bank According to bank balance sheet statistics the nominal growth of loans vis-agrave-vis NFCs has been mostly negative in the euro area since 2009Q4 (Graph II411) Coupled with the positive loan inflows seen in the national accounts between 2010Q3 and 2012Q3 (Graph II410) this shows a degree of substitution in corporate loan liability ownership between banks and other financial firms and sectors (including other NFCs) in this period According to the counterparty breakdown of NFC domestic loans published by the ECB corporate borrowings from other NFCs represented 29 of all loans by 2013Q3 (up from 26 in 2008Q1) while the proportion of borrowings from monetary financial institutions (MFIs) had dropped (from 60 in 2008Q1) to an all-time low of 53 The proportion of loans from other non-bank financial intermediaries also increased There is less evidence of a shift from banks to other loan providers in the United States where loans between NFCs are much more limited
Graph II411 Bank loans to NFCs (1999Q1- 2013Q3 y-o-y change)
-20
-15
-10
-5
0
5
10
15
20
25
99Q1 00Q3 02Q1 03Q3 05Q1 06Q3 08Q1 09Q3 11Q1 12Q3
Euro area bank loans to NFCs (1)US bank loans to NFCs
(1)Excluding Latvia Source ECB US Federal Reserve Board DG ECFIN calculations
Positive NLB has been used to acquire safe financial assets in both regions
In both the euro area and the United States the positive NLB has been used to deleverage but also to invest in safe financial assets At the beginning of the crisis much of the positive corporate NLB in the United States was invested in money market mutual funds which is essentially investment in short-term low-risk assets (Graph II412) (63)
Currency and deposits (another type of safe asset) have increased substantially in the euro area in recent years as a proportion of total firm activity (Graph II413) This rise was driven almost exclusively by a rapid increase in firmsrsquo savings deposits To some extent a similar trend is observable in the United States In particular US cash balances (a sub-component of currency and deposits) approached 12 of GVA by the end of 2013 a level not seen since the early 1990s On the other hand savings deposits have grown more modestly resulting in a moderately positive overall trend in currency and deposits
Graph II412 Mutual fund shares of NFCs (1999Q1- 2013Q3 of GVA)
0
2
4
6
8
10
12
14
99Q1 01Q1 03Q1 05Q1 07Q1 09Q1 11Q1 13Q1
Euro area (1)
US (2)
(1)Excluding Latvia(2)In the USA these asset series can be broken down into investment in money market mutual funds and investment in other mutual funds The 2009-11 increase is fully attributable to the former Source Eurostat US Bureau of Economic Analysis DG ECFIN calculations
Overall these two aspects of corporate financial investment behaviour signify considerable liquidity concerns on the part of firms in both the euro area
(63) Euro area financial accounts only show firmsrsquo investment in mutual funds overall and do not distinguish between types of mutual funds
46 | Quarterly Report on the Euro Area
and the United States They also represent a drive towards lower-risk assets perhaps indicating increased risk aversion by corporations or a tendency to postpone physical investment in a context of perceived high uncertainty
Graph II413 Currency and deposits ndash NFCs
(1999Q1- 2013Q3 of GVA)
0
5
10
15
20
25
30
35
40
45
99Q1 00Q3 02Q1 03Q3 05Q1 06Q3 08Q1 09Q3 11Q1 12Q3
Euro area (1)
US
(1)Excluding Latvia Source Eurostat US Bureau of Economic Analysis DG ECFIN calculations
Conclusion
Although both regions saw similar steep rises in corporate debt in the pre-crisis years balance sheet adjustment since the crisis has been significantly slower in the euro area than in the United States The more rapid adjustment in the United States can be explained by a stronger cyclical recovery more supportive profitability developments and reduced dividend payment ratios In the euro area profitability has been hindered by a combination of lower flexibility in the labour markets and slow wage adjustment
The slower balance sheet adjustment in the euro area corporate sector is visible in a slower fall in indebtedness but also a slower adjustment of the structure of balance sheets In particular the shift from loans to bonds and the extension of debt maturity have been more pronounced in the United States In both regions firms have used their positive NLB to accelerate the accumulation of safe and liquid financial assets This could reflect continuing uncertainty regarding future demand and growth prospects
Overall the evidence discussed in this section shows that euro area firms are lagging significantly behind their US counterparts in terms of balance sheet consolidation Given that investment rates remain disappointing even in the more advanced US corporate sector a degree of caution appears warranted when assessing short-term prospects for corporate investment in the euro area
III Recent DG ECFIN publications
Volume 13 No 1 | 47
1 Occasional Papers
European Economy Occasional Papers 170 January 2014 Financial Assistance Programme for the Recapitalisation of Financial Institutions in Spain Fifth Review ndash Winter 2014 httpeceuropaeueconomy_financepublicationsoccasional_paper2014pdfocp170_enpdf
European Economy Occasional Papers 169 December 2013 The Economic Adjustment Programme for Cyprus Second Review ndash Autumn 2013 httpeceuropaeueconomy_financepublicationsoccasional_paper2013pdfocp169_enpdf
European Economy Occasional Papers 168 December 2013 Fiscal frameworks in the European Union ommission services country factsheets for the Autumn 2013 Peer Review httpeceuropaeueconomy_financepublicationsoccasional_paper2013pdfocp168_enpdf
European Economy Occasional Papers 167 December 2013 Economic Adjustment Programme for Ireland - Autumn 2013 Review httpeceuropaeueconomy_financepublicationsoccasional_paper2013pdfocp167_enpdf
European Economy Occasional Papers 166 December 2013 Progress towards meeting the economic criteria for EU accession the EU Commissionrsquos 2013 assessments httpeceuropaeueconomy_financepublicationsoccasional_paper2013pdfocp166_enpdf
European Economy Occasional Papers 165 November 2013 Romania Balance-of-Payments Assistance Programme 2013-2015 httpeceuropaeueconomy_financepublicationsoccasional_paper2013pdfocp165_enpdf
European Economy Occasional Papers 164 November 2013 The Economic Adjustment Programme for Portugal Eighth and Ninth Review httpeceuropaeueconomy_financepublicationsoccasional_paper2013pdfocp164_enpdf
European Economy Occasional Papers 163 November 2013 Financial Assistance Programme for the Recapitalisation of Financial Institutions in Spain Fourth Review ndash Autumn 2013 httpeceuropaeueconomy_financepublicationsoccasional_paper2013pdfocp163_enpdf
European Economy Occasional Papers 162 October 2013 Economic Adjustment Programme for Ireland Summer 2013 Review httpeceuropaeueconomy_financepublicationsoccasional_paper2013pdfocp162_enpdf
2 Economic papers
European Economy Economic Papers 514 February 2014 Martin Larch Kristin Magnusson Bernard Balint Tatar Hard work and More How to successfully conduct adjustment with official assistance httpeceuropaeueconomy_financepublicationseconomic_paper2014pdfecp514_enpdf
European Economy Economic Papers 513 February 2014 Florian Woumlhlbier Caterina Astarita Gilles Mourre Consolidation on the revenue side and growth-friendly tax structures an indicator based approach httpeceuropaeueconomy_financepublicationseconomic_paper2014pdfecp513_enpdf
48 | Quarterly Report on the Euro Area
European Economy Economic Papers 512 December 2013 Alexander Schwan Etienne Sail Assessing the economic and budgetary impact of linking retirement ages and pension benefits to increases in longevity httpeceuropaeueconomy_financepublicationseconomic_paper2013pdfecp512_enpdf 3 Other publications
Winter forecast 2014 - EU economy recovery gaining ground httpeceuropaeueconomy_financepublicationseuropean_economy2014pdfee2_enpdf 4 Regular publications
Business and Consumer Surveys (harmonised surveys for different sectors of the economies in the European Union (EU) and the applicant countries) httpeceuropaeueconomy_financedb_indicatorssurveysindex_enhtm Business Climate Indicator for the euro area (monthly indicator designed to deliver a clear and early assessment of the cyclical situation) httpeceuropaeueconomy_financedb_indicatorssurveysdocuments2013bci_2013_11_enpdf Key indicators for the euro area (presents the most relevant economic statistics concerning the euro area) httpeceuropaeueconomy_financedb_indicatorskey_indicatorsindex_enhtm Monthly and quarterly notes on the euro-denominated bond markets (looks at the volumes of debt issued the maturity structures and the conditions in the market) httpeceuropaeueconomy_financepublicationsbond_marketindex_enhtm Price and Cost Competitiveness httpeceuropaeueconomy_financedb_indicatorscompetitivenessindex_enhtm
50 | Quarterly Report on the Euro Area
Editor-in-Chief Elena Flores
Overall coordination Eric Ruscher
Data assistance Christos Zavos
Comments on the report would be gratefully received and should be sent to
Elena Flores Director ndash Policy Strategy and Coordination Directorate-General for Economic and Financial Affairs Office CHAR 1566
B-1049 Brussels
Email elenafloreseceuropaeu
or
Eric Ruscher Head of Unit ndash Macroeconomy of the euro area Directorate-General for Economic and Financial Affairs Office CHAR 15248
B-1049 Brussels
Email ericruschereceuropaeu
HOW TO OBTAIN EU PUBLICATIONS Free publications bull one copy
via EU Bookshop (httpbookshopeuropaeu) bull more than one copy or postersmaps
from the European Unionrsquos representations (httpeceuropaeurepresent_enhtm) from the delegations in non-EU countries (httpeeaseuropaeudelegationsindex_enhtm) by contacting the Europe Direct service (httpeuropaeueuropedirectindex_enhtm) or calling 00 800 6 7 8 9 10 11 (freephone number from anywhere in the EU) () () The information given is free as are most calls (though some operators phone boxes or hotels may charge you)
Priced publications bull via EU Bookshop (httpbookshopeuropaeu) Priced subscriptions bull via one of the sales agents of the Publications Office of the European Union
(httppublicationseuropaeuothersagentsindex_enhtm)
KC-AK-14-001-en-n
- Blank Page
- Blank Page
- Blank Page
- Blank Page
-

KC-AK-14-001-en-n
- Blank Page
- Blank Page
- Blank Page
- Blank Page
-