Quarterly Report on Telecom Sector Indicators - TRA Oman · Telecom Market Indicators Report / Q2,...
31
Q1, 2013 Quarterly Report on Telecom Sector Indicators Q2, 2017 Competition and Tariffs Unit
Transcript of Quarterly Report on Telecom Sector Indicators - TRA Oman · Telecom Market Indicators Report / Q2,...

Q1, 2013
Quarterly Report on Telecom Sector
Indicators
Q2, 2017
Competition and Tariffs Unit

Telecom Market Indicators Report / Q2, 2017 Page 2
Table of Content
Topics Page
Introduction 3
Major Market Observations 5
Summary of Main Telecom Indicators 6
Fixed Telephone Line Service 7
Mobile Service 10
Internet Service 13
ARPUs 19
Quality of Service 20
Traffic 24
Type Approval 26
Tariffs & Promotions 28

Telecom Market Indicators Report / Q2, 2017 Page 3
Introduction
We are pleased to present Q2 2017 Report on the Indicators of Telecom
Sector of Oman. The TRA has been compiling and publishing this Report on
quarterly basis to provide brief market intelligence on Telecom Sector to all
interested parties including investors, consumers, and the licensees. The
Quarterly reports provide a brief update on the status of major telecom
services in the Sultanate of Oman. These reports cover voice and data
services for both fixed and mobile segments.
The quarterly reports are compiled collecting data from the telecom service
providers operating in Oman. The TRA would like to acknowledge and
appreciate the service providers’ cooperation and support for providing
data to TRA, which helped in preparing this report and disseminating the
information contained in it. Sometime the source data is delayed by the
licensees, which ultimately cause delays in publishing the report. We hope
the publication timing will improve in future with the cooperation of service
providers.
Comments and suggestions from the users of these reports are welcome for
improvement of the contents and structure of the reports.
TRA also publishes this report on its website (www.tra.gov.om).

Telecom Market Indicators Report / Q2, 2017 Page 4
Disclaimer
The TRA tries its best to ensure accuracy of the information provided in this
report. However, the users of any information contained in this report are
advised to perform their own due-diligence to assess accuracy and
relevance of the information and use it at their own risk and responsibility.
Since the data is provided by the licensees, the TRA shall not assume any
responsibility for any loss, damage, and cost or expense whether direct,
indirect, or consequential, suffered by any person using or relying on this
information whether caused by reason of any inaccuracy, error, omission
or misinterpretation.

Telecom Market Indicators Report / Q2, 2017 Page 5
7201 ,2QMarket Observations orMaj
- As per the Monthly Statistical Bulletin of June 2017 which was published by NCSI, the population of the Sultanate reached to 4,614,822 inhabitants .
- The total number of households are reported as 575,000 by end of 2015 as per the NCSI estimation.
The penetration of different services stood at the following levels at the second quarter of 2017:
- Fixed line: 10.08% of inhabitants
- Mobile subscriptions: 154.46% of inhabitants
- Fixed internet: 54.77% of households.
The Active Mobile Broadband Subscribers reached to 94% of inhabitants by the Q2/2017 with the total active subscribers of 4,330,108 .
The Blackberry Subscribers represent 0.22% of the total Mobile Subscribers base at the end of Q2/2017.
During the Q2/2017, the TRA received and approved:
- 56 new and revised Tariff Plans.
- 17 promotional tariff offers
TRA type approved 550 telecom equipments, and issued 35 authorizations forimporting equipments. In addition, TRA Issued 495 releases to customs forimporting telecom equipments during Q2/2017.
TRA carried out 38 inspections of dealers to check compliance of TRA regulations.

Telecom Market Indicators Report / Q2, 2017 Page 6
Summary of Main Telecommunications Indicators
7, 2012Q
Indicator Fixed Telephony
Service (other than Fixed
Internet)
Fixed Internet
Service
Mobile Service
Subscribers 464,989 314,921 7,128,135
Penetration
rate1
80.87%
of household
54.77%
of household
154.46%
of inhabitant
Revenue
(Mln.RO) 36.947 27.851 154.46%
International
Outgoing Voice
Minutes (mln),
6.263 NA 202.042
ARPU2 (RO) 4.4 29.4 6.84
Service
Providers
Omantel,
Ooredoo, Teo,
Connect Arabia
International
Omantel, Ooredoo,
Awasr
Oman Mobile,
Ooredoo, Friendi,
Renna, Teo
penetration rates 7/2012The Q 100 inhabitants/households. perPenetration rate is the number of subscriptions Note:1
are calculated based on the population (4,614,822), as per the latest bulletin published by NCSI – June 2017.
Households: 575,000 (as per the NCSI estimation for year 2015).
The Fixed ARPU is based on revenue for the fixed telephone lines ). per month (the average revenue per userARPU 2
(post-paid and prepaid).
3Household figure used is 575,000 as per NCSI estimation during the year 2015.
Q2/2017 Q1/2017 % Change
Population 4,614,822 4,586,941 0.60
Households3 575,000 575,000 -
Telecom Market Indicators Report / Q2, 2017 Page 7
Service Fixed Telephone
Type of Service Q2/2017 Q1/2017 % Change
Fixed Telephone Subscriptions:
1.1Analouge Fixed Telephone Lines:(Postpaid+ Prepaid) 306,399 302,660 1.2%
1.2 VoIP Subscription 105,055 97,437 7.8%
1.3 WLL Connections 1,636 1,609 1.67%
1.4 ISDN Channels (Equivalent DELs)* 45,098 44,633 1.04%
1.5 Public Telephone – Payphones 6,801 6,801 0.0%
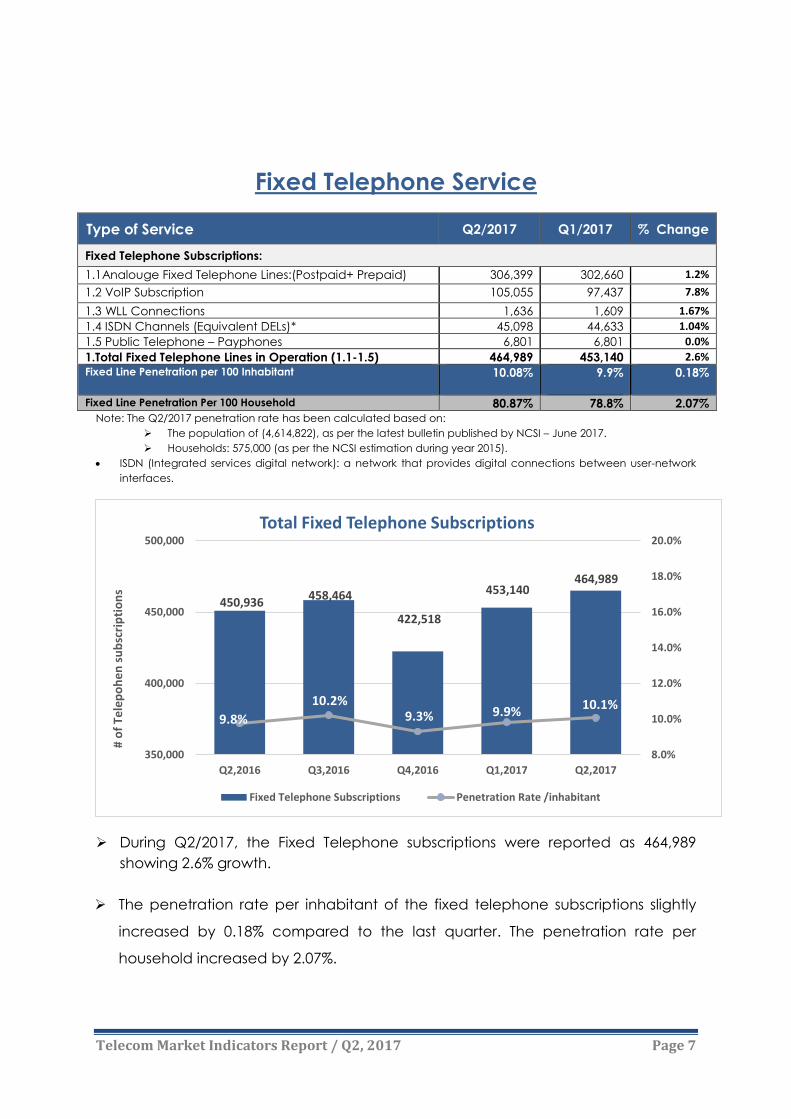
1.Total Fixed Telephone Lines in Operation (1.1-1.5) 464,989 453,140 2.6%
Fixed Line Penetration per 100 Inhabitant 10.08% 9.9% 0.18%
Fixed Line Penetration Per 100 Household 80.87% 78.8% 2.07%
Note: The Q2/2017 penetration rate has been calculated based on:
The population of (4,614,822), as per the latest bulletin published by NCSI – June 2017.
Households: 575,000 (as per the NCSI estimation during year 2015).
ISDN (Integrated services digital network): a network that provides digital connections between user-network
interfaces.
During Q2/2017, the Fixed Telephone subscriptions were reported as 464,989
showing 2.6% growth.
The penetration rate per inhabitant of the fixed telephone subscriptions slightly
increased by 0.18% compared to the last quarter. The penetration rate per
household increased by 2.07%.
450,936 458,464
422,518
453,140 464,989
9.8%
10.2%9.3% 9.9%
10.1%
8.0%
10.0%
12.0%
14.0%
16.0%
18.0%
20.0%
350,000
400,000
450,000
500,000
Q2,2016 Q3,2016 Q4,2016 Q1,2017 Q2,2017
# o
f Te
lep
oh
en
su
bsc
rip
tio
ns
Total Fixed Telephone Subscriptions
Fixed Telephone Subscriptions Penetration Rate /inhabitant

Telecom Market Indicators Report / Q2, 2017 Page 8
Total analogue postpaid and prepaid fixed telephone subscriptions increased during
Q2/2017 by 1.2%.
Public payphones remained unchanged since last year with the 6,801 pay phones in
service. These payphones are being kept as a license obligation.
403,402 412,517
297,094 302,660 306,399
-
50,000
100,000
150,000
200,000
250,000
300,000
350,000
400,000
450,000
Q2,2016 Q3,2016 Q4,2016 Q1,2017 Q2,2017
# o
f Li
ne
sTotal Analouge Fixed Telephones Subscriptions: (Post paid & Pre paid)
Total Analouge Fixed Telephone Subscriptions

Telecom Market Indicators Report / Q2, 2017 Page 9
The ISDN (Integrated services digital network): a network that provides digital
connections between user-network interfaces. During the Q2/2017, the ISDN equivalent
channels increased by 1.04% reaching 45,098 channels.
During the Q2/2017, the Business Fixed line subscriptions decreased slightly by 0.77%, while
residential fixed line subscribers increased by 3.48% as compared to the previous quarter.
The split between fixed residential and business lines stood at 70.8% and 29.2%
respectively in Q2/2017.

Telecom Market Indicators Report / Q2, 2017 Page 10
Service Mobile
Note: The Q2/2017penetration rates are calculated based on the population (4,614,822), as per the latest
bulletin published by NCSI – June 2017.
The total mobile subscribers increased by 2.46% during the Q2/2017 achieving a
total of 7,128,135 subscriber base. The mobile penetration increased by 2.46% in
Q2/2017.
Mobile Subscribers Q2/2017 Q1/2017 % change
1 Post Paid
1.1 Operators 636,856 628,073 1.39%
Total Postpaid Subscribers 636,856 628,073 1.39%
Prepaid
2.1 Operators 5,270,935 5,166,759 2.01%
1.2 Resellers 1,220,344 1,181,330 3.3%
Total Prepaid Subscribers 6,491,279 6,348,089 2.26%
Total Mobile Subscribers: (1+2) 7,128,135 6,976,162 2.18%
Mobile Penetration/100 Inhabitant 154.46% 152% 2.46%
BlackBerry Subscriptions
3.1 Post Paid 2,786 3,136 -11.16%
3.2 Pre-Paid 13,348 17,152 -22.18%
Total BlackBerry Subscribers (3.1+3.2) 16,134 20,288 -20.48%
% of BlackBerry Mobile Subscribers of total Base in Oman 0.22% 0.29% -0.07%

Telecom Market Indicators Report / Q2, 2017 Page 11
Post-paid mobile subscribers reached to the figure of 636,856 with 1.39% growth over
the previous quarter.
Prepaid mobile subscribers increased by 2.26% reaching to 6,491,279 subscribers.

Telecom Market Indicators Report / Q2, 2017 Page 12
Internet Services
Note: The Q2/2017 penetration rate has been calculated based on the population (4,614,822), as per the latest
bulletin published by NCSI – June 2017.
Households: 575,000 (as per the NCSI estimation for year 2015).
Type of Service Q2/2017 Q1/2017 % change
Fixed Narrowband
1.1Dial-up Fixed Internet Subscribers 2,507 2,521 -0.55%
1.2 Internet Leased Lines(Narrowband) 30 32 -6.25%
1. Total fixed Narrowband Subscriptions : (1.1+1.2) 2,537 2,553 -0.62%
SubscribersFixed Broadband
2. Total Fixed Broadband Subscribers 312,384 299,319 4.36%
Total Fixed Internet Subscribers (1+2) 314,921 301,872 4.32%
Fixed Internet Penetration /100 Household 54.77% 52.50% 2.27%
Fixed Broadband Subscribers Penetration/100 Household 54.33% 52.06% 2.27%
Active Mobile Broadband Subscribers
3.1 Dedicated mobile-broadband Subscribers 1,732,446 2,634,965 -34%
3.2 Standard mobile-broadband Subscribers 2,597,662 1,829,124 42%
Total Active Mobile Broadband Subscribers (3.1+3.2) 4,330,108 4,464,089 -3%
Active Mobile Broadband Penetration Rate /100
Inhabitant 94% 97% -3%

Telecom Market Indicators Report / Q2, 2017 Page 13
The total fixed internet subscriptions increased by 4.32% during the second quarter
2017 reaching 314,921 subscriptions.
During the reported quarter, the fixed internet penetration rate per household
reached 54.77%, which is 2.27% higher than the previous quarter.
During Q2/2017, fixed internet narrowband subscriptions decreased by 6.25% to
2,537subscriptions.
2,626
2,581
2,531
2,553
2,537
1,000
Q2,2016
Q3,2016
Q4,2016
Q1,2017
Q2,2017
Su
bsc
rib
ers
Fixed Internet Narrowband Subscriptions
Fixed Internet Narrowband (Dial up & Internet leased lines)
265,193
277,976 269,549
301,872 314,921
46.12%
48.34%49.29%
52.50%
54.77%
40.0%
42.0%
44.0%
46.0%
48.0%
50.0%
52.0%
54.0%
56.0%
240,000
250,000
260,000
270,000
280,000
290,000
300,000
310,000
320,000
Q2,2016 Q3,2016 Q4,2016 Q1,2017 Q2,2017
Pe
ne
tra
tio
n R
ate
s
Su
bsc
rib
ers
Fixed Internet Subscriptions (Dialup+Fixed Broadband)
Fixed Internet Penetration Rate/Household

Telecom Market Indicators Report / Q2, 2017 Page 14
During Q2/2017, Fixed Broadband subscriptions has experienced 4.36% growth over
the previous quarter. Fixed Broadband subscription reached to 312,384 subscribers
with penetration rate of 54.33% per household.
During the second quarter 2017, total active mobile broadband subscribers declined by
3% reaching to 4,330,108 from 4,464,089. Also, the penetration rate decreased by 3% from
97% to 94.4% per inhabitant.
262,556
275,395 249,352
299,319
312,384
45.66%
47.89% 48.85%
52.06%
54.33%
40%
42%
44%
46%
48%
50%
52%
54%
56%
230,000
240,000
250,000
260,000
270,000
280,000
290,000
300,000
310,000
320,000
Q2,2016 Q3,2016 Q4,2016 Q1,2017 Q2,2017
Pe
ne
tra
tio
n R
ate
s
Su
bsc
rib
ers
Fixed Broadband Subscriptions
Fixed Broadband Penetration Rate/Household
3,493,794 3,838,0893,937,861
4,464,0894,330,108
76.2%85.5% 86.5%
97.3% 94.4%
50%
60%
70%
80%
90%
100%
0.000
500,000.000
1,000,000.000
1,500,000.000
2,000,000.000
2,500,000.000
3,000,000.000
3,500,000.000
4,000,000.000
4,500,000.000
5,000,000.000
Q2,2016 Q3,2016 Q4,2016 Q1,2017 Q2,2017
Pe
ne
tra
tio
n R
ate
s
Su
bsc
rib
ers
Active Mobile Broadband Subscriptions
Mobile Broadband Penetration Rate/inhabitant

Telecom Market Indicators Report / Q2, 2017 Page 15
During Q2/2017,
2.23% of fixed Broadband subscribers had access speed of 256 Kbps to 2 Mbps.
77.70% of fixed Broadband subscribers had access speed of 2 Mbps to 10 Mbps.
20.01% of fixed Broadband subscribers had access speed of 10 Mbps to 100 Mbps.
0.06% of fixed Broadband subscribers had access speed of 100 Mbps to 1 Gbps.
0.006% of fixed Broadband subscribers had access speed of more than 1Gbps.

Telecom Market Indicators Report / Q2, 2017 Page 16
The residential broadband subscribers in the above chart show an increase of 4.7%
during Q2/2017. On the other hand, the residential dial up subscribers declined by
0.79% over the same period.
The below chart presents a growth in the business broadband subscriptions by 0.47%
while the business dial-up declined by 0.46% during the same period.
23,915 24,479
24,701 25,160
25,279
1,267 1,243
1,219
1,294
1,288
1,100
1,150
1,200
1,250
1,300
1,350
1,400
20,000
25,000
30,000
Q2,2016 Q3,2016 Q4,2016 Q1,2017 Q2,2017
Bu
sin
ess
Su
bsc
rib
ers
Business Internet Subscriptions
Broadband Dial-up

Telecom Market Indicators Report / Q2, 2017 Page 17
During the Q2/2017, the operators had 439,138 Mbps capacity for international
internet bandwidth as compared to the previous quarter when it was 389,138
Mbps.
Out of 439,138 Mbps capacity, on average 8.1% was utilized for the outgoing
and 42.1% for the incoming traffic.
9.33% 13.39% 9.66% 9.7% 8.1%
54.38%60.43%
58.38% 53.1%42.1%
0.00%
20.00%
40.00%
60.00%
80.00%
100.00%
120.00%
140.00%
160.00%
180.00%
200.00%
Q2,2016 Q3,2016 Q4,2016 Q1,2017 Q2,2017
# o
f Li
ne
s
International Internet Bandwidth -% Utilization
Incoming (Mbps) outgoing (Mbps)

Telecom Market Indicators Report / Q2, 2017 Page 18
ARPUs
(the average revenue per user)ARPU 1

Telecom Market Indicators Report / Q2, 2017 Page 19
Traffic
The Q2/2017 experienced increase in the outgoing international traffic by 2.49%,
while the Incoming traffic declined by 3.2% during the same period.
¹Note: The figures pertaining to Q1&Q2/2017 are provisional because Ooredoo is
upgrading its data warehouse and some issues remain un-resolved.
During the second quarter 2017, the domestic mobile traffic declined by 6.2% to
1,084 million minutes from the previous quarter traffic of 1,156 million minutes.

Telecom Market Indicators Report / Q2, 2017 Page 20
During Q2/2017, the mobile-to-mobile (On net)
traffic had the major share of 74% out of the
total domestic outgoing traffic, while the Off
net mobile domestic traffic has 23.8% share.
The Mobile to fixed Traffic represents only 2.2%
of the total mobile domestic traffic.
During Q2/2017, the domestic outgoing fixed
traffic carries 72.8% for fixed to mobile, 25.7%
for fixed to fixed (On-net), and 1.4% for fixed to
fixed (Off-net) traffic share.
Total outgoing SMS (short messages) Traffic
increased to reach 337 million messages by the
Q2/2017 from 302 million messages in the
previous.
The number of outgoing MMS (multimedia
massages) has been gradually decreasing
since the last year reaching 0.305 million MMS
by the end of Q2/2017.

Telecom Market Indicators Report / Q2, 2017 Page 21
Quality of Service
(QoS indicators are as measured and reported by the operators-unaudited
Mobile Services KPIs
Mobile Services KPIs Required KPI
(Quarterly) Q2,2017 Q1,2017
Oman
Mobile
%
Ooredoo
%
Oman
Mobile
%
Ooredoo
%
1. Percentage of
Calls Dropped
Less than 0.8% 0.24% 0.31% 0.30
0.30
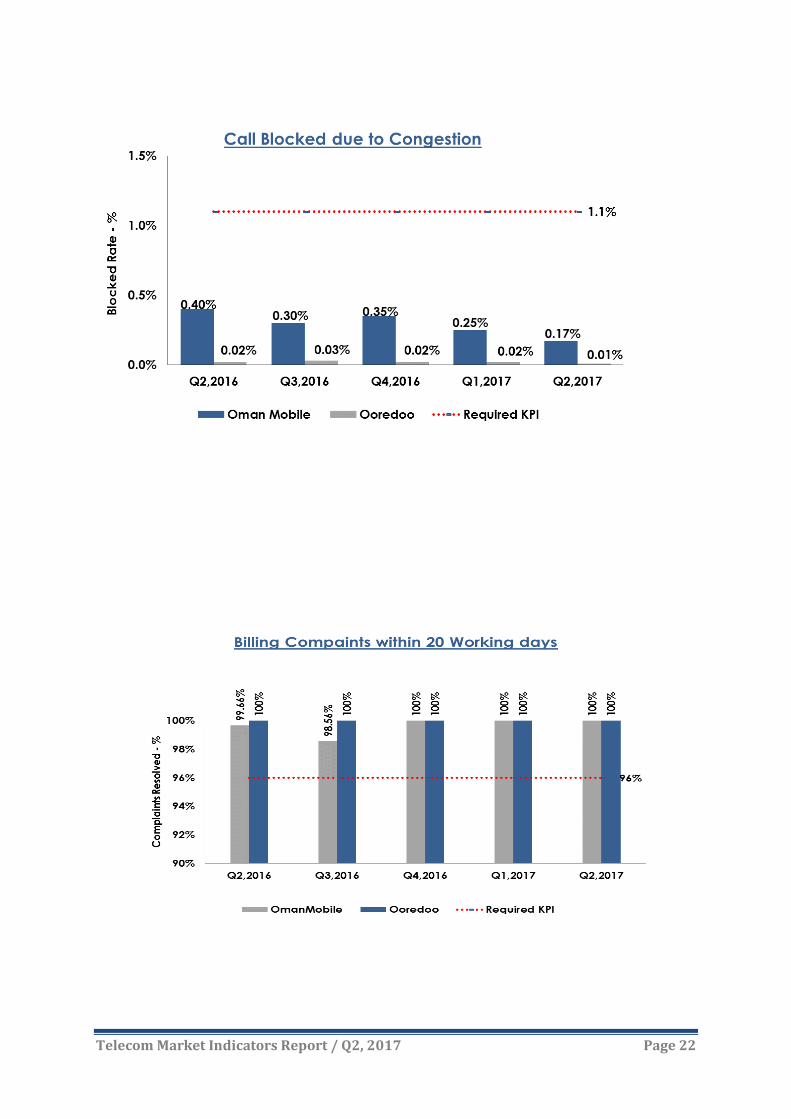
2. Percentage of
Calls Blocked due
to Congestion
Less than 1.1%
0.17% 0.01% 0.25 0.02
3. Percentage of
billing complaints
resolved within 20
working days
More than 96%
100% 100% 100% 100%
Telecom Market Indicators Report / Q2, 2017 Page 22

Telecom Market Indicators Report / Q2, 2017 Page 23
Fixed Services KPIs*
Fixed Services KPIs
Required KPI
(Quarterly)
Q2/2017 Q1/2017
Omantel
%
Ooredoo
%
Omantel
%
Ooredoo
%
1. Faults per 100 lines per quarter Less than 3 2.15 0.233 2.44 0.16
2. % of faults to be cleared within
24 hours More than 90% 97.34 99.43 97.05 99.3
3. Unsuccessful call Ratio for
local and national fixed calls
Less than
1% 0.004 0.130 0.01 0.14
4. Percentage of Orders for
access lines in the served
areas completed within 10
days
More than 90% 95.85 99.8 83.99 95.7
5. Billing complaints per 1000 Bills
Less than
1.5 0.26 0.66 2.44 0.262
6. Percentage of billing
complaints resolved within 20
working day
More than 96% 100 100 100 100
*(QoS indicators are as measured and reported by the operators, not audited or
verified figures by TRA)

Telecom Market Indicators Report / Q2, 2017 Page 24
T

Telecom Market Indicators Report / Q2, 2017 Page 25
Approval Type
:ATR, 7201Q2/During
Approved a total number of 550 (Previous Quarter 642) Telecom Equipment.
Issued 495 (Previous Quarter: 346) Releases to Customs for Import of Telecom equipment.
Inspected 38 (Previous Quarter: 86) dealerships.

Telecom Market Indicators Report / Q2, 2017 Page 26

Telecom Market Indicators Report / Q2, 2017 Page 27
ariffs & PromotionsT
Number of promotions/ new services and revisions segment wise
Number of new services, Tariffs and Revision approved
Mobile Fixed Mobile Fixed Mobile Fixed
Renna 0 0%
Friendi 3 1 1 5 29%
Teo 0 0%
Omantel 1 1 2 1 5 29%
Ooredoo 1 3 2 1 7 41%
Awasr 0 0%
Total 0 0 0 3 2 1 0 4 2 3 1 1
% 0.0% 0.0% 0.0% 17.6% 11.8% 5.9% 0.0% 23.5% 11.8% 0.0% 17.6% 5.9% 6%1.00
Number of new services, Tariffs and Revisions approved Q2, 2017
%
17
Voice Data
Services
Voice
International Leased
line/MPLSTotal
Miscella
nious
Top-Up
and
Bundled
services
Welcome Pack /
New Connections International
Mobile
Roaming
Vaue
Added
Services
Mobile Fixed MBB FBB Mobile Fixed
Renna 4 5 1 1 1 1 13 23%
Friendi 1 4 5 2 12 21%
Teo 0 0%
Omantel 2 3 2 1 1 5 4 1 19 34%
Ooredoo 1 2 2 1 1 3 1 11 20%
Awasr 1 1 2%
Total 2 0 8 12 3 9 0 3 7 10 0 2
% 3.6% 0.0% 14.3% 21.4% 5.4% 16.1% 0.0% 5.4% 12.5% 0.0% 17.9% 0.0% 4%
%
1.00
Number of Promotions approved Q2, 2017
Services
National Voice DataWelcome Pack /
New Connections International
Mobile
Roaming
InternationalVoic
e
Total
Top-Up
and
Bundled
services
Leased
line/MPLS
Miscella
nious
56.00
Vaue
Added
Services

Telecom Market Indicators Report / Q2, 2017 Page 28
Summary of Promotion’s Statistics for Q2/2017:
Mobile Fixed Mobile & Fixed Total
NO of Promotions 50 5 1 56
% 89% 9% 2% 100% NO of new
services and
revisions 13 3 1 17
% 76% 18% 6% 100%
Summary of the tariff activity in Q2,2017:
Majority of Promotions approved and filed were for the Mobile Broadband (21%),
Bundled Plans and recharge promotions 18%, Welcome Packs (16%) International
Calls 14% and Value Added Services 13%.
Most of services and revisions approved and filed dominated by International
Mobile Roaming Service 24%, MBB and Bundled Services 18% each and Fixed
Broadband services and Value Added Services 12% each.
Non-dominant licensees brought 46 % of the total promotions approved and filed
this quarter and 29% of the total Services and Revisions approved and filed for the
same period.
Residential CorporateResidential &
CorporateTotal
NO of Promotions 52 1 3 56
% 93% 2% 5% 100%
NO of new services
and revisions11 4 2 17
% 65% 24% 12% 100%
Prepaid Postpaid Pre & Postpaid Total
NO of Promotions 39 9 8 56
% 70% 16% 14% 100%
NO of new services
and revisions5 6 6 17
% 29% 35% 35% 100%

Telecom Market Indicators Report / Q2, 2017 Page 29
Number of promotions filed accounted for 55 % of the total promotions approved
and filed this quarter, and Number of new services and revisions filed this quarter
accounted for 35%, of total approvals and filings.
:omotions for the subject quarterPrMost Remarkable
1. This period witnessed launching of a number of promotions on the EID such as
Ooredoo Roam Like Home and Eid Recharge Promotion from Friendi.
2. Omantel launched the following promotions:
Fee WhatsApp Add-On for subscribers to Hayyak Your Way Plans.
Omantel Data Accelerator. Two months free OSN Package with Omantel Home Entertainment Plan. Omantel revamped Hayyak Internet+plans offering extended validity of 30 days.. Smartphone & Tablets promotion for Baqati subscribers.
3. Ooredoo launched the following promotions:
Shababiah Snapchat Promotion.
Ooredoo Surprises promotion for Mousbak customers.
Shahry Smartphone promotion offering discounts on Smartphones for
subscribers signing 24 Months contract with Mobile Shahry Plans.
Video-Only Data Plan marketed as Stream On.
4. Renna introduced a new International Roaming Data Plan for the first time.
The most important services and revisions approved this quarter are as follows:
1. Omantel launched IPTV service for corporate customers.
2. Ooredoo launched permanently the following:
Shahry Contracts for customers signing contracts to mobile shahry plans.
International Roaming Bundles: two Plans for GCC: Passport Daily and
Passport Weekly, one International Plan marketed Passport World.
3. Omantel revamped Internet Leased Line Tariffs.
4. Friendi launched new permanent Mobile Data Plans and Add-Ons.

Telecom Market Indicators Report / Q2, 2017 Page 30

Telecom Market Indicators Report / Q2, 2017 Page 31