QUARTERLY REPORT - London Stock Exchange
35
SOCIETATEA NAŢIONALĂ DE GAZE NATURALE ‘‘ ROMGAZ’’ SA QUARTERLY REPORT ON THE ECONOMIC-FINANCIAL ACTIVITY OF ROMGAZ GROUP ON MARCH 31, 2021 (January 01, 2021 - March 31, 2021)
Transcript of QUARTERLY REPORT - London Stock Exchange
SOCIETATEA NAŢIONALĂ DE GAZE NATURALE ‘‘ROMGAZ’’ SA
QUARTERLY REPORT ON THE ECONOMIC-FINANCIAL ACTIVITY OF
ROMGAZ GROUP
ON MARCH 31, 2021
(January 01, 2021 - March 31, 2021)
Report on the activity performed in Q1 2021 Page - 2 -
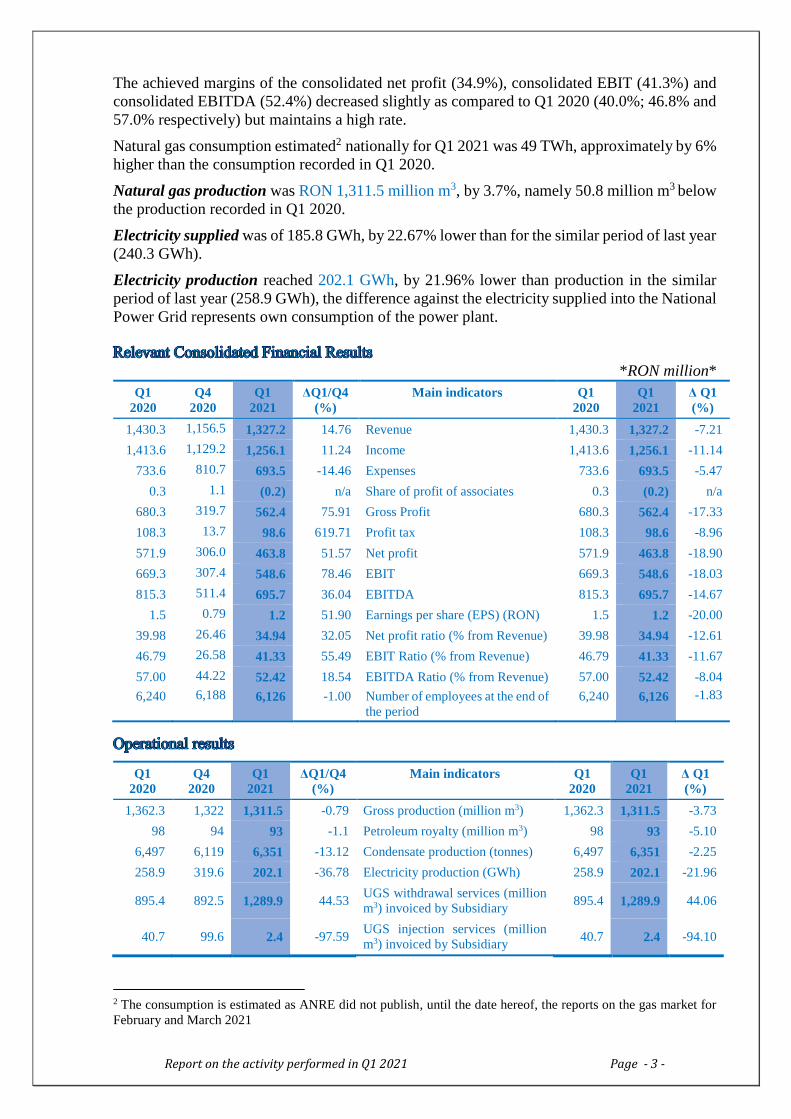
IDENTIFICATION DETAILS ON REPORT AND ISSUER
Report Basis Law no. 24/2017 on issuers of financial instruments and
market operations (Article 67) and ASF Regulation
no.5/2018 on issuers of financial instruments and
market operations (Annex 13) for the three-month
period ended on March 31, 2021
Report Date May 14, 2021
Name of the Company Societatea Naţională de Gaze Naturale “ROMGAZ” SA
Headquarters Medias 551130, 4 Constantin I. Motas Square, Sibiu
County
Telephone/Fax number 004 0374401020 / 004 0374474325
Web/E-mail www.romgaz.ro / [email protected]
Fiscal Code RO 14056826
Trade Registry No. J32/392/2001
Legal Entity Identifier (LEI) 2549009R7KJ38D9RW354
Subscribed and paid in share capital RON 385,422,400
Shares main characteristics 385,422,400 shares each with a nominal value of RON
1;
Nominative, ordinary, indivisible shares, issued
dematerialised and free tradable since November 12,
2013 as SNG – for shares and SNGR – for GDR’s
Regulated market where the
company’s shares are traded
Bucharest Stock Exchange (shares) and London Stock
Exchange (GDRs)
ROMGAZ1 GROUP PERFORMANCES
Romgaz Group recorded in Q1 2021 a revenue of RON 1,327.2 million, decreasing by 7.21%,
namely RON 103.1 million, as compared to the revenue recorded in Q1 2020. However,
Romgaz supplied in Q1 2021 gas quantities higher by 14.12% than in Q1 2020.
In 2021 Romgaz Group collected part of the receivables impaired at the end of 2020, that led
to a net gain from impairment adjustments of RON 31.6 million.
Expenses with windfall tax decreased as compared to Q1 2020 by RON 63.9 million.
The Group recorded in Q1 2021 an additional provision for purchase of greenhouse gas
emissions certificates of RON 67.3 million, due to the increase of certificate price as compared
to the estimation made in December 2020.
Net consolidated profit of RON 463.8 million was lower by 18.91%, namely RON 108.2
million, versus the similar period of the previous year.
Net consolidated earnings per share (EPS) was RON 1.2.
1 Romgaz Group consists of SNGN Romgaz SA („The Company”/„Romgaz”) as parent company, Filiala de
Înmagazinare Gaze Naturale Depogaz Ploiești SRL (“Depogaz”) the subsidiary 100% owned by Romgaz, and its
associates SC Depomureş SA (40% of the share capital) and SC Agri LNG Project Company SRL (25% of the
share capital).
Report on the activity performed in Q1 2021 Page - 3 -
The achieved margins of the consolidated net profit (34.9%), consolidated EBIT (41.3%) and
consolidated EBITDA (52.4%) decreased slightly as compared to Q1 2020 (40.0%; 46.8% and
57.0% respectively) but maintains a high rate.
Natural gas consumption estimated2 nationally for Q1 2021 was 49 TWh, approximately by 6%
higher than the consumption recorded in Q1 2020.
Natural gas production was RON 1,311.5 million m3, by 3.7%, namely 50.8 million m3 below
the production recorded in Q1 2020.
Electricity supplied was of 185.8 GWh, by 22.67% lower than for the similar period of last year
(240.3 GWh).
Electricity production reached 202.1 GWh, by 21.96% lower than production in the similar
period of last year (258.9 GWh), the difference against the electricity supplied into the National
Power Grid represents own consumption of the power plant.
*RON million*
Q1
2020
Q4
2020
Q1
2021
ΔQ1/Q4
(%)
Main indicators Q1
2020
Q1
2021
Δ Q1
(%)
1,430.3 1,156.5 1,327.2 14.76 Revenue 1,430.3 1,327.2 -7.21
1,413.6 1,129.2 1,256.1 11.24 Income 1,413.6 1,256.1 -11.14
733.6 810.7 693.5 -14.46 Expenses 733.6 693.5 -5.47
0.3 1.1 (0.2) n/a Share of profit of associates 0.3 (0.2) n/a
680.3 319.7 562.4 75.91 Gross Profit 680.3 562.4 -17.33
108.3 13.7 98.6 619.71 Profit tax 108.3 98.6 -8.96
571.9 306.0 463.8 51.57 Net profit 571.9 463.8 -18.90
669.3 307.4 548.6 78.46 EBIT 669.3 548.6 -18.03
815.3 511.4 695.7 36.04 EBITDA 815.3 695.7 -14.67
1.5 0.79 1.2 51.90 Earnings per share (EPS) (RON) 1.5 1.2 -20.00
39.98 26.46 34.94 32.05 Net profit ratio (% from Revenue) 39.98 34.94 -12.61
46.79 26.58 41.33 55.49 EBIT Ratio (% from Revenue) 46.79 41.33 -11.67
57.00 44.22 52.42 18.54 EBITDA Ratio (% from Revenue) 57.00 52.42 -8.04
6,240 6,188 6,126 -1.00 Number of employees at the end of
the period
6,240 6,126 -1.83
Q1
2020
Q4
2020
Q1
2021
ΔQ1/Q4
(%)
Main indicators Q1
2020
Q1
2021
Δ Q1
(%)
1,362.3 1,322 1,311.5 -0.79 Gross production (million m3) 1,362.3 1,311.5 -3.73
98 94 93 -1.1 Petroleum royalty (million m3) 98 93 -5.10
6,497 6,119 6,351 -13.12 Condensate production (tonnes) 6,497 6,351 -2.25
258.9 319.6 202.1 -36.78 Electricity production (GWh) 258.9 202.1 -21.96
895.4 892.5 1,289.9 44.53 UGS withdrawal services (million
m3) invoiced by Subsidiary 895.4 1,289.9 44.06
40.7 99.6 2.4 -97.59 UGS injection services (million
m3) invoiced by Subsidiary 40.7 2.4 -94.10
2 The consumption is estimated as ANRE did not publish, until the date hereof, the reports on the gas market for
February and March 2021
Report on the activity performed in Q1 2021 Page - 4 -
Natural gas production recorded in Q1 2021 was 1,311.5 million m3 by 3.7% lower than the
production of Q1 2020.
Bearing in mind that every hydrocarbon production company records a production decline, the
company recorded in Q1 2021 a relatively high production supported by:
Continuous rehabilitation projects for main mature gas fields, mitigating production
decline in such fields;
Performing recompletion operations in wells that led to reactivation of several wells
with important flow rates.
The conditions underlying these results were:
Gas imports for consumption were approximately 9.66 TWh, 6.7% higher than the
quantity of Q1 2020;
Withdrawals from Romgaz UGS’s were by 150% higher than in the similar period of
last year.
National gas consumption estimated for Q1 2021 was 49.13 TWh, by approx. 6% higher than
the consumption recorded in Q1 2020, out of which 9.66 TWh is covered by import gas and
the difference of 39.47 TWh by domestic gas. Romgaz contribution is 18.14 TWh, representing
36.92% from the national consumption, and 45.96% from the consumption supplied from
internal gas. Romgaz market share rose by 2.5% as compared to the market share recorded in
Q1 2020.
Report on the activity performed in Q1 2021 Page - 5 -
ROMGAZ GROUP – BRIEF OVERVIEW
are:
exploration and production of natural gas;
underground storage of natural gas;
supply of natural gas;
special well operations and services;
technological transport and maintenance services;
electricity production and supply;
natural gas distribution.
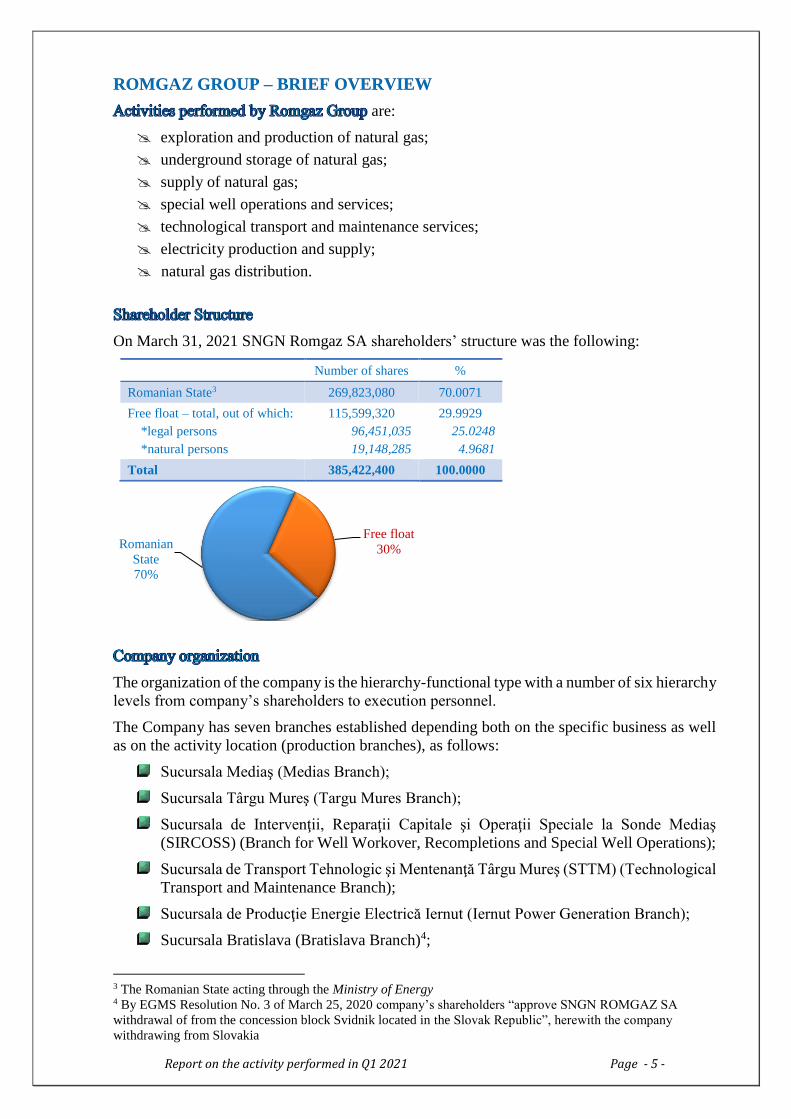
On March 31, 2021 SNGN Romgaz SA shareholders’ structure was the following:
Number of shares %
Romanian State3 269,823,080 70.0071
Free float – total, out of which:
*legal persons
*natural persons
115,599,320
96,451,035
19,148,285
29.9929
25.0248
4.9681
Total 385,422,400 100.0000
The organization of the company is the hierarchy-functional type with a number of six hierarchy
levels from company’s shareholders to execution personnel.
The Company has seven branches established depending both on the specific business as well
as on the activity location (production branches), as follows:
Sucursala Mediaş (Medias Branch);
Sucursala Târgu Mureş (Targu Mures Branch);
Sucursala de Intervenţii, Reparaţii Capitale şi Operaţii Speciale la Sonde Mediaş
(SIRCOSS) (Branch for Well Workover, Recompletions and Special Well Operations);
Sucursala de Transport Tehnologic şi Mentenanţă Târgu Mureş (STTM) (Technological
Transport and Maintenance Branch);
Sucursala de Producţie Energie Electrică Iernut (Iernut Power Generation Branch);
Sucursala Bratislava (Bratislava Branch)4;
3 The Romanian State acting through the Ministry of Energy 4 By EGMS Resolution No. 3 of March 25, 2020 company’s shareholders “approve SNGN ROMGAZ SA
withdrawal of from the concession block Svidnik located in the Slovak Republic”, herewith the company
withdrawing from Slovakia
Romanian
State
70%
Free float
30%
Report on the activity performed in Q1 2021 Page - 6 -
Sucursala Drobeta-Turnu Severin (Drobeta-Turnu Severin Branch).
As of April 1, 2018 the subsidiary managing the gas storage activity is operational under the
name of SNGN Romgaz SA – Filiala de Înmagazinare Gaze Naturale Depogaz Ploiești SRL.
Therefore, subject to EC Directive No. 73/2009 implemented by Electricity and Natural Gas
Law 123/2012 (art. 141), the storage activity is unbundled from SNGN Romgaz SA and
performed by a storage operator, a subsidiary where SNGN Romgaz SA is sole associate.
The subscribed and paid in share capital of the company is RON 66,056,160 divided in
6,605,616 shares, with a nominal value of RON 10/share, solely owned by Romgaz.
The Subsidiary took over the operation of the underground storages licensed by SNGN Romgaz
SA, the operation of assets that contribute to performing the storage activity and the entire
personnel performing storage activities.
Information about the Subsidiary can be found at: https://www.depogazploiesti.ro
On January 1, 2021, Romgaz Board of Directors consisted of:
Item
no.
Name Position in
the Board
Status*) Professional
Qualification
Institution of
Employment
1 Jude Aristotel Marius chairman non-executive
non-independent
MBA legal
adviser
SNGN Romgaz SA
2 Marin Marius-Dumitru member non-executive
independent
PhD engineer MDM Consultancy
Deva
3 Stan-Olteanu Manuela-
Petronela
member non-executive
non-independent
legal adviser General Secretariat of
the Government
4 Balazs Botond member non-executive
non-independent
legal adviser SNGN Romgaz SA
5 Simescu Nicolae
Bogdan
member non-executive
non-independent
engineer SNGN Romgaz SA
6 Ciobanu Romeo Cristian member non-executive
independent
PhD engineer Universitatea Tehnică
Iaşi
7 Jansen Petrus Antonius
Maria
member non-executive
independent
economist London School of
Business and Finance
Following the cumulative voting method, company shareholders elected by Resolution No.1 of
March 11, 2021 the following board members for a 4-months mandate:
Item
no.
Name Position in
the Board
Status*) Professional
Qualification
Institution of
Employment
1 Drăgan Dan Dragoş chairman non-executive
non-independent
economist Ministry of Energy
2 Jude Aristotel Marius member non-executive
non-independent
MBA legal
adviser
SNGN Romgaz SA
3 Simescu Nicolae
Bogdan
member non-executive
non-independent
engineer SNGN Romgaz SA
4 Stan-Olteanu Manuela-
Petronela
member non-executive
non-independent
legal adviser General Secretariat of
the Government
5 Niculescu Sergiu
George
member non-executive
non-independent
legal adviser Ministry of Energy
6 Balazs Botond member non-executive
non-independent
legal adviser SNGN Romgaz SA
7 Sorici Gheorghe Silivan member non-executive
non-independent
economist SC Sobis Solutions
SRL
Report on the activity performed in Q1 2021 Page - 7 -
*) - members of the Board of Directors submitted the independent statements in compliance with the provisions of
Romgaz Corporate Governance Code.
Chief Executive Officer (CEO)
By Resolution No.1 of January 13, 2021, Romgaz Board of Directors revoked Mr. Constantin
Adrian Volintiru from the position of Chief Executive Officer, terminating the contract of
mandate concluded with the company. Until appointment of a new chief executive officer,
Romgaz management and legal representation has been temporarily exercised by Mr. Daniel
Corneliu Pena, Romgaz Deputy Chief Executive Officer (by mandate).
Romgaz Board of Directors, convened on February 12, 2021, appointed by Resolution No.11
Mr. Aristotel Marius Jude as Chief Executive Officer of SNGN Romgaz SA, starting with
February 13, 2021, for a temporary mandate of 2 months.
Deputy Chief Executive Officer
The Board of Directors appointed Mr. Pena Daniel Corneliu as Deputy Chief Executive
Officer of the Company for 2 months (interim mandate) by Resolution No. 32 of August 26,
2020, his appointment being effective as of August 28, 2020.
By Resolution No. 41 of October 14, 2020 the Board of Directors approved the 120 days
extension of the interim mandate of Mr. Pena Daniel Corneliu as Deputy Director General (by
mandate), namely until February 24, 2021.
On February 15, 2021, the Board of Directors took note of Mr. Pena Daniel Corneliu resignation
as Deputy Chief Executive Officer (by mandate) and agreed to terminate his mandate as of the
same date.
Chief Financial Officer (CFO)
The Board of Directors appointed Mr. Popescu Razvan as interim Chief Financial Officer for
4 months starting with December 14, 2020, by Resolution No.50 of December 9, 2020.
The other persons holding management positions in Romgaz whom the Board of Directors did
not delegate managerial responsibilities can be found at: https://www.romgaz.ro/en/conducere.
On March 31, 2021, Romgaz Group had 6,126 employees while SNGN Romgaz SA 5,612
employees.
The table below shows the evolution of the employees’ number for January 1, 2020 – March
31, 2021:
Description 2020 GROUP March 31, 2021 March 31 December 31 GROUP Romgaz
Employees at the beginning of the period 6,251 6,251 6,188 5,673
Newly hired employees 46 198 59 51
Employees who terminated their labour relationship
with the company
57 261 121 112
Employees at the end of the period 6,240 6,188 6,126 5,612
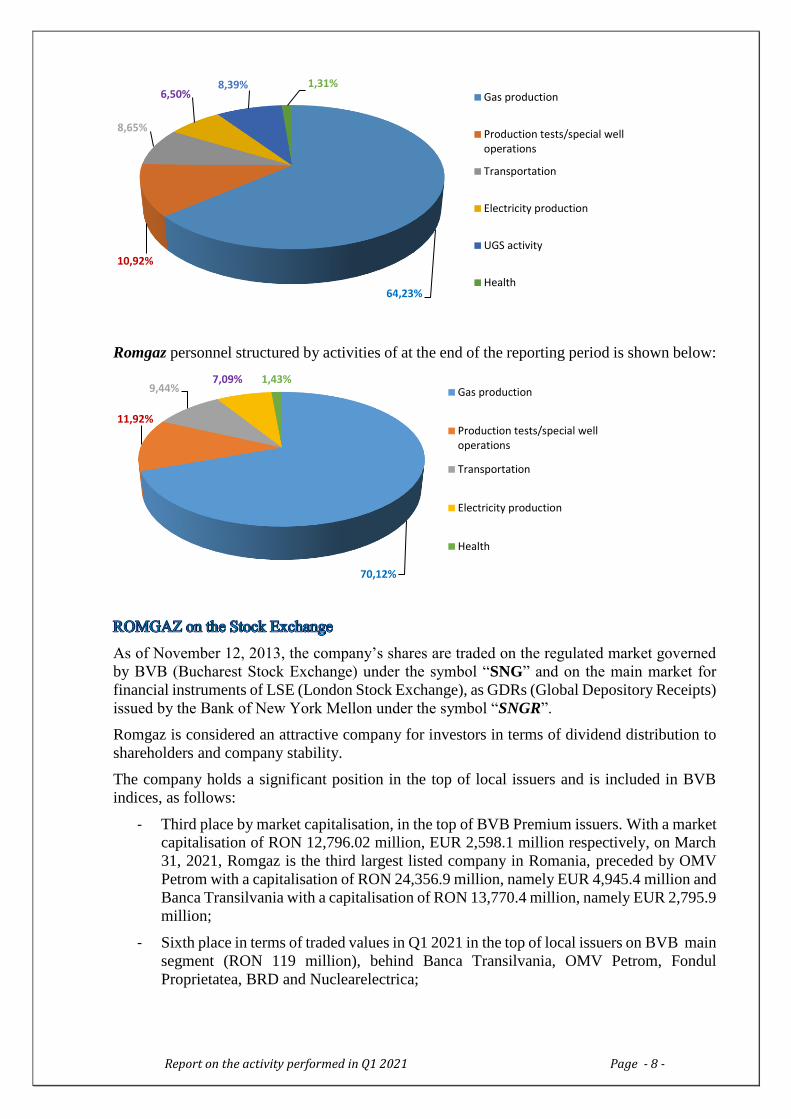
Romgaz Group personnel structured by activities at the end of the reporting period is shown in
the figure below:
Report on the activity performed in Q1 2021 Page - 8 -
Romgaz personnel structured by activities of at the end of the reporting period is shown below:
As of November 12, 2013, the company’s shares are traded on the regulated market governed
by BVB (Bucharest Stock Exchange) under the symbol “SNG” and on the main market for
financial instruments of LSE (London Stock Exchange), as GDRs (Global Depository Receipts)
issued by the Bank of New York Mellon under the symbol “SNGR”.
Romgaz is considered an attractive company for investors in terms of dividend distribution to
shareholders and company stability.
The company holds a significant position in the top of local issuers and is included in BVB
indices, as follows:
- Third place by market capitalisation, in the top of BVB Premium issuers. With a market
capitalisation of RON 12,796.02 million, EUR 2,598.1 million respectively, on March
31, 2021, Romgaz is the third largest listed company in Romania, preceded by OMV
Petrom with a capitalisation of RON 24,356.9 million, namely EUR 4,945.4 million and
Banca Transilvania with a capitalisation of RON 13,770.4 million, namely EUR 2,795.9
million;
- Sixth place in terms of traded values in Q1 2021 in the top of local issuers on BVB main
segment (RON 119 million), behind Banca Transilvania, OMV Petrom, Fondul
Proprietatea, BRD and Nuclearelectrica;
64,23%
10,92%
8,65%
6,50%8,39% 1,31%
Gas production
Production tests/special welloperations
Transportation
Electricity production
UGS activity
Health
70,12%
11,92%
9,44%7,09% 1,43%
Gas production
Production tests/special welloperations
Transportation
Electricity production
Health
Report on the activity performed in Q1 2021 Page - 9 -
- Weight of 9.01% and 8.73% in BET index (top 16 issuers) and BET-XT (top 25 issuers)
respectively, 26.02% in BET-NG index (energy and utilities) and 9.01% in BET-TR
index (BET Total Return).
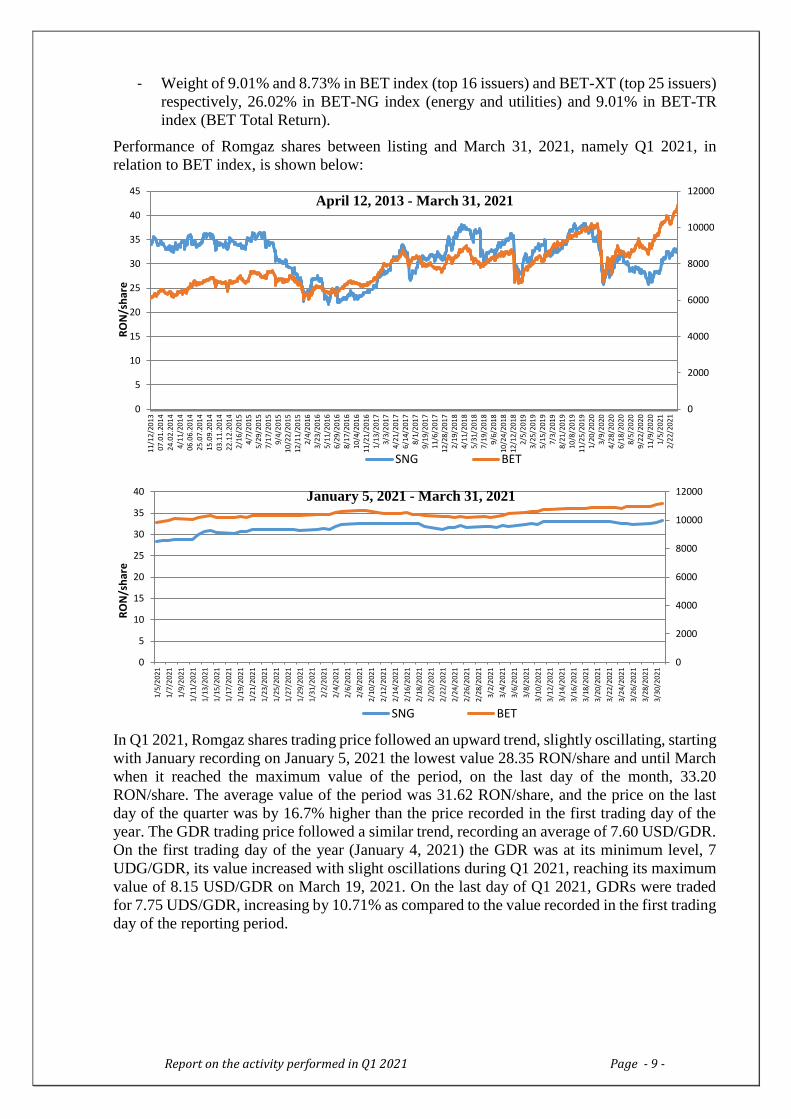
Performance of Romgaz shares between listing and March 31, 2021, namely Q1 2021, in
relation to BET index, is shown below:
In Q1 2021, Romgaz shares trading price followed an upward trend, slightly oscillating, starting
with January recording on January 5, 2021 the lowest value 28.35 RON/share and until March
when it reached the maximum value of the period, on the last day of the month, 33.20
RON/share. The average value of the period was 31.62 RON/share, and the price on the last
day of the quarter was by 16.7% higher than the price recorded in the first trading day of the
year. The GDR trading price followed a similar trend, recording an average of 7.60 USD/GDR.
On the first trading day of the year (January 4, 2021) the GDR was at its minimum level, 7
UDG/GDR, its value increased with slight oscillations during Q1 2021, reaching its maximum
value of 8.15 USD/GDR on March 19, 2021. On the last day of Q1 2021, GDRs were traded
for 7.75 UDS/GDR, increasing by 10.71% as compared to the value recorded in the first trading
day of the reporting period.
0
2000
4000
6000
8000
10000
12000
0
5
10
15
20
25
30
35
40
45
11/1
2/2
013
07.0
1.20
14
24.0
2.20
14
4/11
/201
406
.06.
201
425
.07.
201
415
.09.
201
403
.11.
201
422
.12.
201
42/
16/2
015
4/7
/201
55/
29/2
015
7/17
/201
59/
4/2
015
10/2
2/2
015
12/1
1/2
015
2/4
/201
63/
23/2
016
5/11
/201
66/
29/2
016
8/17
/201
610
/4/2
016
11/2
1/2
016
1/13
/201
73/
3/2
017
4/21
/201
76/
14/2
017
8/1
/201
79/
19/2
017
11/6
/201
712
/28
/20
172/
19/2
018
4/11
/201
85/
31/2
018
7/19
/201
89/
6/2
018
10/2
4/2
018
12/1
2/2
018
2/5
/201
93/
25/2
019
5/15
/201
97/
3/2
019
8/21
/201
910
/8/2
019
11/2
5/2
019
1/20
/202
03/
9/2
020
4/28
/202
06/
18/2
020
8/5
/202
09/
22/2
020
11/9
/202
01/
5/2
021
2/22
/202
1
RO
N/s
har
e
April 12, 2013 - March 31, 2021
SNG BET
0
2000
4000
6000
8000
10000
12000
0
5
10
15
20
25
30
35
40
1/5/
20
21
1/7/
20
21
1/9/
20
21
1/11
/202
1
1/13
/202
1
1/15
/202
1
1/17
/202
1
1/19
/202
1
1/21
/202
1
1/23
/202
1
1/25
/202
1
1/27
/202
1
1/29
/202
1
1/31
/202
1
2/2/
20
21
2/4/
20
21
2/6/
20
21
2/8/
20
21
2/10
/202
1
2/12
/202
1
2/14
/202
1
2/16
/202
1
2/18
/202
1
2/20
/202
1
2/22
/202
1
2/24
/202
1
2/26
/202
1
2/28
/202
1
3/2/
20
21
3/4/
20
21
3/6/
20
21
3/8/
20
21
3/10
/202
1
3/12
/202
1
3/14
/202
1
3/16
/202
1
3/18
/202
1
3/20
/202
1
3/22
/202
1
3/24
/202
1
3/26
/202
1
3/28
/202
1
3/30
/202
1
RO
N/s
har
e
January 5, 2021 - March 31, 2021
SNG BET
Report on the activity performed in Q1 2021 Page - 10 -
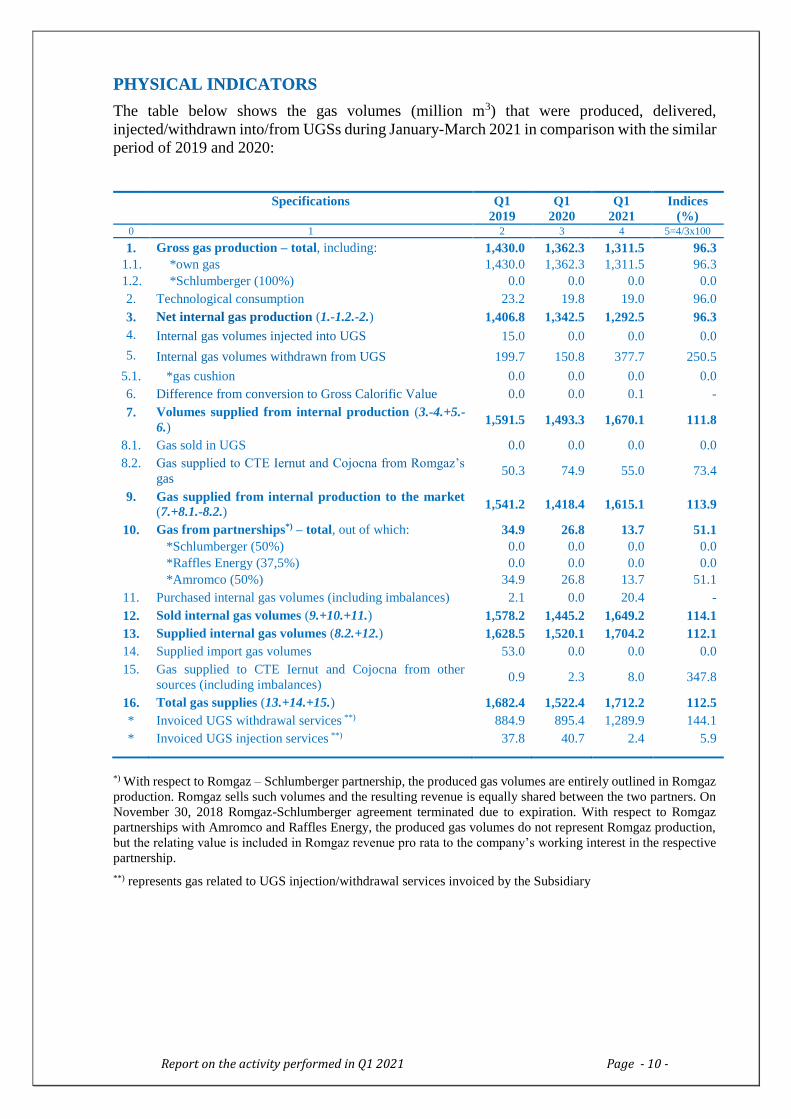
PHYSICAL INDICATORS
The table below shows the gas volumes (million m3) that were produced, delivered,
injected/withdrawn into/from UGSs during January-March 2021 in comparison with the similar
period of 2019 and 2020:
Specifications Q1
2019
Q1
2020
Q1
2021
Indices
(%) 0 1 2 3 4 5=4/3x100
1.
1.1.
1.2.
Gross gas production – total, including:
*own gas
*Schlumberger (100%)
1,430.0
1,430.0
0.0
1,362.3
1,362.3
0.0
1,311.5
1,311.5
0.0
96.3
96.3
0.0
2. Technological consumption 23.2 19.8 19.0 96.0
3. Net internal gas production (1.-1.2.-2.) 1,406.8 1,342.5 1,292.5 96.3
4. Internal gas volumes injected into UGS 15.0 0.0 0.0 0.0
5. Internal gas volumes withdrawn from UGS 199.7 150.8 377.7 250.5
5.1. *gas cushion 0.0 0.0 0.0 0.0
6. Difference from conversion to Gross Calorific Value 0.0 0.0 0.1 -
7. Volumes supplied from internal production (3.-4.+5.-
6.) 1,591.5 1,493.3 1,670.1 111.8
8.1. Gas sold in UGS 0.0 0.0 0.0 0.0
8.2. Gas supplied to CTE Iernut and Cojocna from Romgaz’s
gas 50.3 74.9 55.0 73.4
9. Gas supplied from internal production to the market (7.+8.1.-8.2.)
1,541.2 1,418.4 1,615.1 113.9
10. Gas from partnerships*) – total, out of which:
*Schlumberger (50%)
*Raffles Energy (37,5%)
*Amromco (50%)
34.9
0.0
0.0
34.9
26.8
0.0
0.0
26.8
13.7
0.0
0.0
13.7
51.1
0.0
0.0
51.1
11. Purchased internal gas volumes (including imbalances) 2.1 0.0 20.4 -
12. Sold internal gas volumes (9.+10.+11.) 1,578.2 1,445.2 1,649.2 114.1
13. Supplied internal gas volumes (8.2.+12.) 1,628.5 1,520.1 1,704.2 112.1
14. Supplied import gas volumes 53.0 0.0 0.0 0.0
15. Gas supplied to CTE Iernut and Cojocna from other
sources (including imbalances) 0.9 2.3 8.0 347.8
16. Total gas supplies (13.+14.+15.) 1,682.4 1,522.4 1,712.2 112.5
* Invoiced UGS withdrawal services **) 884.9 895.4 1,289.9 144.1
* Invoiced UGS injection services **) 37.8 40.7 2.4 5.9
*) With respect to Romgaz – Schlumberger partnership, the produced gas volumes are entirely outlined in Romgaz
production. Romgaz sells such volumes and the resulting revenue is equally shared between the two partners. On
November 30, 2018 Romgaz-Schlumberger agreement terminated due to expiration. With respect to Romgaz
partnerships with Amromco and Raffles Energy, the produced gas volumes do not represent Romgaz production,
but the relating value is included in Romgaz revenue pro rata to the company’s working interest in the respective
partnership.
**) represents gas related to UGS injection/withdrawal services invoiced by the Subsidiary
Report on the activity performed in Q1 2021 Page - 11 -
INVESTMENTS
Romgaz Group scheduled for the first 3 months of 2021 investments of RON 153.59 million
and made investments of RON 93.78 million, by 38.94% namely RON 59.81 million less than
scheduled.
On March 31, 2021, the Company carried out investments of RON 91.93 million, namely 7.11%
from Romgaz Annual Investment Program that amounts to RON 1,292.5 million.
Compared to the similar period of 2020, the investments decreased by 42.22%, RON 91.93
million in Q1 2021 as compared to RON 159 million in Q1 2020.
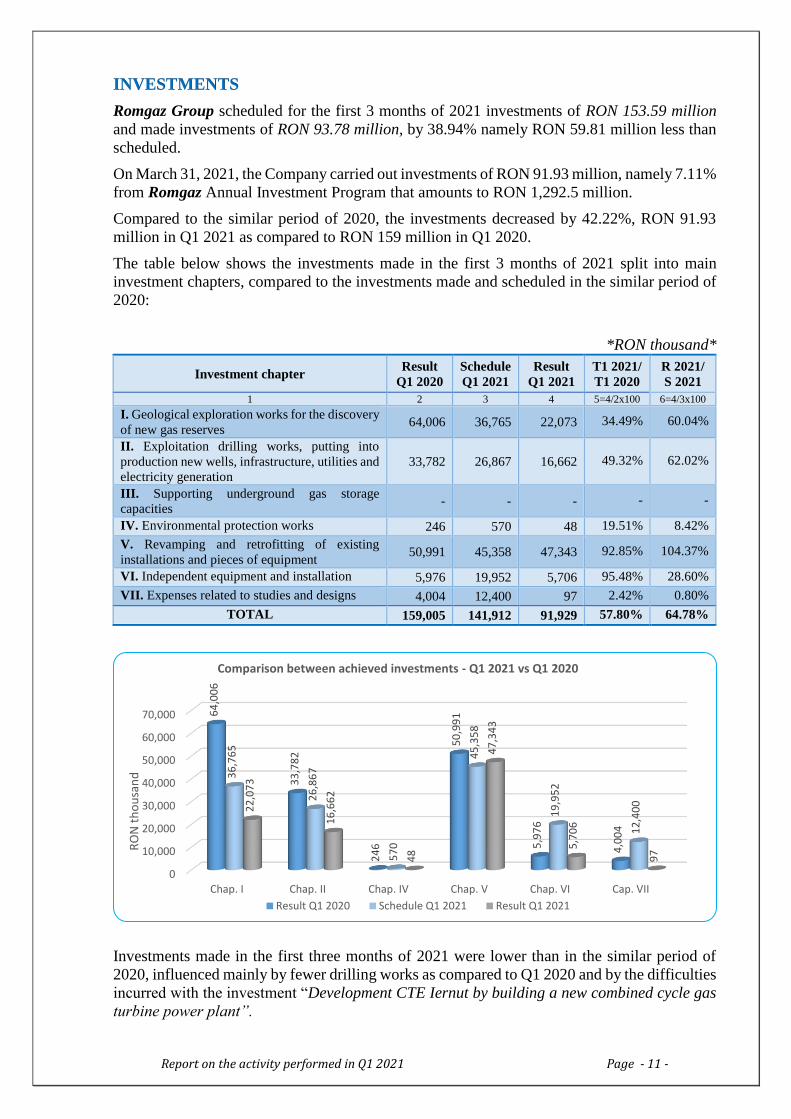
The table below shows the investments made in the first 3 months of 2021 split into main
investment chapters, compared to the investments made and scheduled in the similar period of
2020:
*RON thousand*
Investment chapter Result
Q1 2020
Schedule
Q1 2021
Result
Q1 2021
T1 2021/
T1 2020
R 2021/
S 2021
1 2 3 4 5=4/2x100 6=4/3x100
I. Geological exploration works for the discovery
of new gas reserves 64,006 36,765 22,073 34.49% 60.04%
II. Exploitation drilling works, putting into
production new wells, infrastructure, utilities and
electricity generation
33,782 26,867 16,662 49.32% 62.02%
III. Supporting underground gas storage
capacities - - - - -
IV. Environmental protection works 246 570 48 19.51% 8.42%
V. Revamping and retrofitting of existing
installations and pieces of equipment 50,991 45,358 47,343 92.85% 104.37%
VI. Independent equipment and installation 5,976 19,952 5,706 95.48% 28.60%
VII. Expenses related to studies and designs 4,004 12,400 97 2.42% 0.80%
TOTAL 159,005 141,912 91,929 57.80% 64.78%
Investments made in the first three months of 2021 were lower than in the similar period of
2020, influenced mainly by fewer drilling works as compared to Q1 2020 and by the difficulties
incurred with the investment “Development CTE Iernut by building a new combined cycle gas
turbine power plant”.
0
10,000
20,000
30,000
40,000
50,000
60,000
70,000
Chap. I Chap. II Chap. IV Chap. V Chap. VI Cap. VII
64
,00
6
33
,78
2
24
6
50
,99
1
5,9
76
4,0
04
36
,76
5
26
,86
7
57
0
45
,35
8
19
,95
2
12
,40
022
,07
3
16
,66
2
48
47
,34
3
5,7
06
97R
ON
th
ou
san
d
Comparison between achieved investments - Q1 2021 vs Q1 2020
Result Q1 2020 Schedule Q1 2021 Result Q1 2021
Report on the activity performed in Q1 2021 Page - 12 -
As regards successful achievements in Q1 2021 we mention: drilling works for 3 wells (2
exploration wells and a production well, total of 6118 m), finalising 2 wells (one exploration
and one production well), 2 surface facilities, intervention works performed at 28 wells
(recompletions, reactivation and repairs) – 15 wells belonging to Medias Branch and 13 wells
to Targu Mures Branch, acquisition of gas chromatographs, gas meters for metering-regulation
stations and 2 multifunctional excavators.
The value of fixed assets in place in the first three months of 2021 was RON 55.01 million.
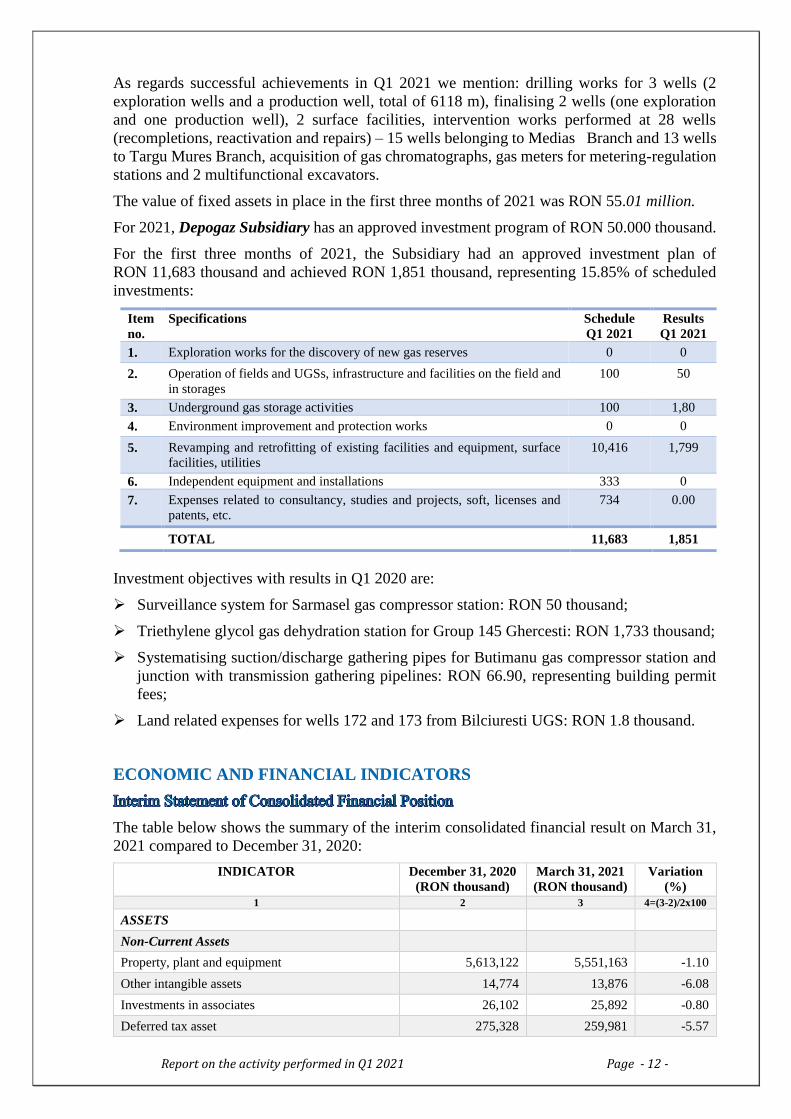
For 2021, Depogaz Subsidiary has an approved investment program of RON 50.000 thousand.
For the first three months of 2021, the Subsidiary had an approved investment plan of
RON 11,683 thousand and achieved RON 1,851 thousand, representing 15.85% of scheduled
investments:
Item
no.
Specifications Schedule
Q1 2021
Results
Q1 2021
1. Exploration works for the discovery of new gas reserves 0 0
2. Operation of fields and UGSs, infrastructure and facilities on the field and
in storages
100 50
3. Underground gas storage activities 100 1,80
4. Environment improvement and protection works 0 0
5. Revamping and retrofitting of existing facilities and equipment, surface
facilities, utilities
10,416 1,799
6. Independent equipment and installations 333 0
7. Expenses related to consultancy, studies and projects, soft, licenses and
patents, etc.
734 0.00
TOTAL 11,683 1,851
Investment objectives with results in Q1 2020 are:
Surveillance system for Sarmasel gas compressor station: RON 50 thousand;
Triethylene glycol gas dehydration station for Group 145 Ghercesti: RON 1,733 thousand;
Systematising suction/discharge gathering pipes for Butimanu gas compressor station and
junction with transmission gathering pipelines: RON 66.90, representing building permit
fees;
Land related expenses for wells 172 and 173 from Bilciuresti UGS: RON 1.8 thousand.
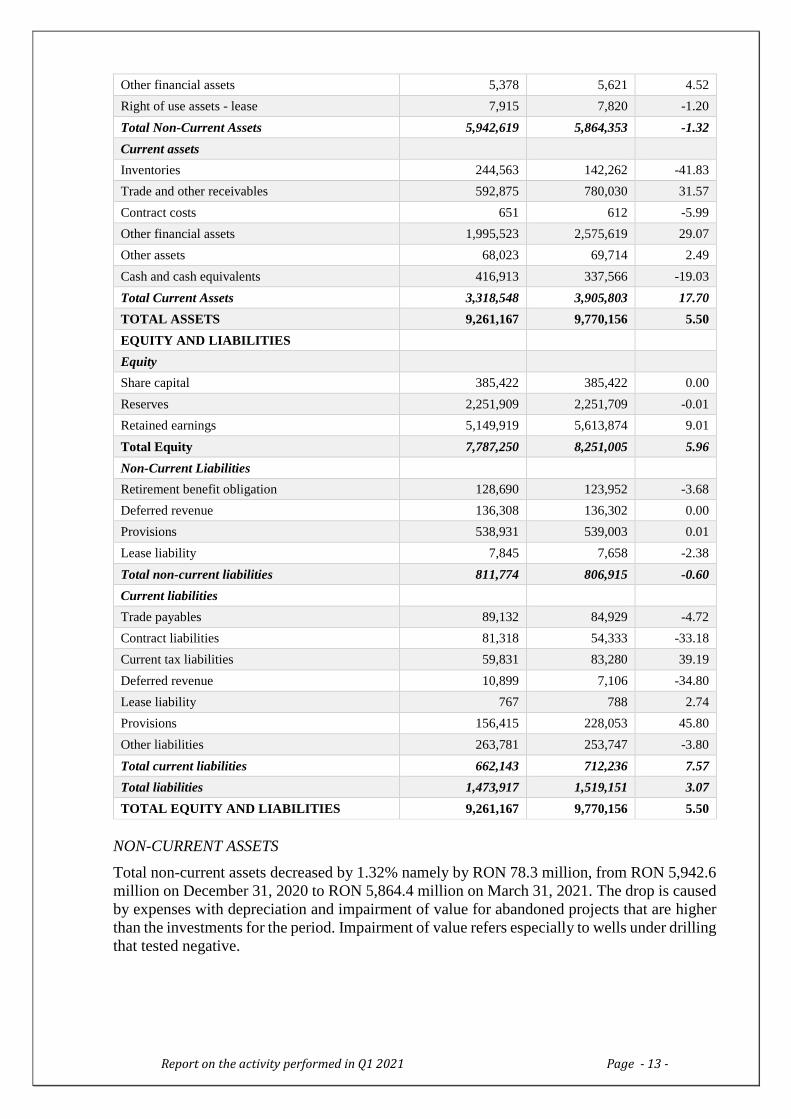
ECONOMIC AND FINANCIAL INDICATORS
The table below shows the summary of the interim consolidated financial result on March 31,
2021 compared to December 31, 2020:
INDICATOR December 31, 2020
(RON thousand)
March 31, 2021
(RON thousand)
Variation
(%)
1 2 3 4=(3-2)/2x100
ASSETS
Non-Current Assets
Property, plant and equipment 5,613,122 5,551,163 -1.10
Other intangible assets 14,774 13,876 -6.08
Investments in associates 26,102 25,892 -0.80
Deferred tax asset 275,328 259,981 -5.57
Report on the activity performed in Q1 2021 Page - 13 -
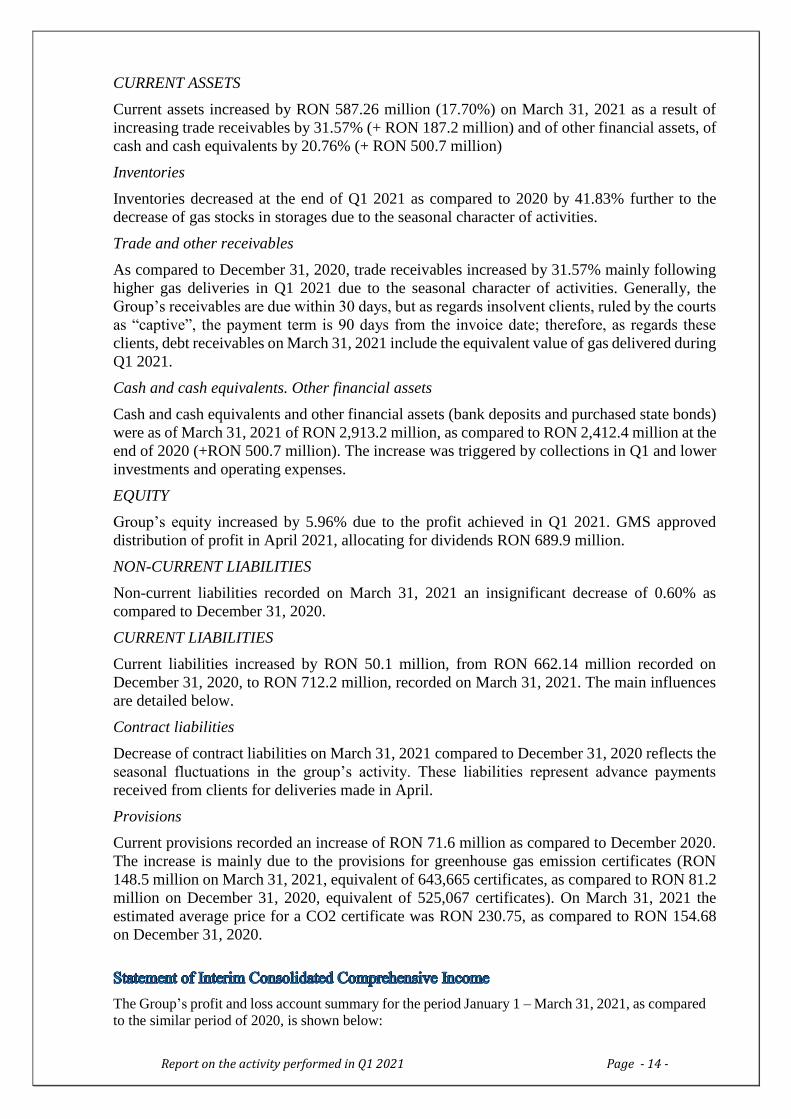
Other financial assets 5,378 5,621 4.52
Right of use assets - lease 7,915 7,820 -1.20
Total Non-Current Assets 5,942,619 5,864,353 -1.32
Current assets
Inventories 244,563 142,262 -41.83
Trade and other receivables 592,875 780,030 31.57
Contract costs 651 612 -5.99
Other financial assets 1,995,523 2,575,619 29.07
Other assets 68,023 69,714 2.49
Cash and cash equivalents 416,913 337,566 -19.03
Total Current Assets 3,318,548 3,905,803 17.70
TOTAL ASSETS 9,261,167 9,770,156 5.50
EQUITY AND LIABILITIES
Equity
Share capital 385,422 385,422 0.00
Reserves 2,251,909 2,251,709 -0.01
Retained earnings 5,149,919 5,613,874 9.01
Total Equity 7,787,250 8,251,005 5.96
Non-Current Liabilities
Retirement benefit obligation 128,690 123,952 -3.68
Deferred revenue 136,308 136,302 0.00
Provisions 538,931 539,003 0.01
Lease liability 7,845 7,658 -2.38
Total non-current liabilities 811,774 806,915 -0.60
Current liabilities
Trade payables 89,132 84,929 -4.72
Contract liabilities 81,318 54,333 -33.18
Current tax liabilities 59,831 83,280 39.19
Deferred revenue 10,899 7,106 -34.80
Lease liability 767 788 2.74
Provisions 156,415 228,053 45.80
Other liabilities 263,781 253,747 -3.80
Total current liabilities 662,143 712,236 7.57
Total liabilities 1,473,917 1,519,151 3.07
TOTAL EQUITY AND LIABILITIES 9,261,167 9,770,156 5.50
NON-CURRENT ASSETS
Total non-current assets decreased by 1.32% namely by RON 78.3 million, from RON 5,942.6
million on December 31, 2020 to RON 5,864.4 million on March 31, 2021. The drop is caused
by expenses with depreciation and impairment of value for abandoned projects that are higher
than the investments for the period. Impairment of value refers especially to wells under drilling
that tested negative.
Report on the activity performed in Q1 2021 Page - 14 -
CURRENT ASSETS
Current assets increased by RON 587.26 million (17.70%) on March 31, 2021 as a result of
increasing trade receivables by 31.57% (+ RON 187.2 million) and of other financial assets, of
cash and cash equivalents by 20.76% (+ RON 500.7 million)
Inventories
Inventories decreased at the end of Q1 2021 as compared to 2020 by 41.83% further to the
decrease of gas stocks in storages due to the seasonal character of activities.
Trade and other receivables
As compared to December 31, 2020, trade receivables increased by 31.57% mainly following
higher gas deliveries in Q1 2021 due to the seasonal character of activities. Generally, the
Group’s receivables are due within 30 days, but as regards insolvent clients, ruled by the courts
as “captive”, the payment term is 90 days from the invoice date; therefore, as regards these
clients, debt receivables on March 31, 2021 include the equivalent value of gas delivered during
Q1 2021.
Cash and cash equivalents. Other financial assets
Cash and cash equivalents and other financial assets (bank deposits and purchased state bonds)
were as of March 31, 2021 of RON 2,913.2 million, as compared to RON 2,412.4 million at the
end of 2020 (+RON 500.7 million). The increase was triggered by collections in Q1 and lower
investments and operating expenses.
EQUITY
Group’s equity increased by 5.96% due to the profit achieved in Q1 2021. GMS approved
distribution of profit in April 2021, allocating for dividends RON 689.9 million.
NON-CURRENT LIABILITIES
Non-current liabilities recorded on March 31, 2021 an insignificant decrease of 0.60% as
compared to December 31, 2020.
CURRENT LIABILITIES
Current liabilities increased by RON 50.1 million, from RON 662.14 million recorded on
December 31, 2020, to RON 712.2 million, recorded on March 31, 2021. The main influences
are detailed below.
Contract liabilities
Decrease of contract liabilities on March 31, 2021 compared to December 31, 2020 reflects the
seasonal fluctuations in the group’s activity. These liabilities represent advance payments
received from clients for deliveries made in April.
Provisions
Current provisions recorded an increase of RON 71.6 million as compared to December 2020.
The increase is mainly due to the provisions for greenhouse gas emission certificates (RON
148.5 million on March 31, 2021, equivalent of 643,665 certificates, as compared to RON 81.2
million on December 31, 2020, equivalent of 525,067 certificates). On March 31, 2021 the
estimated average price for a CO2 certificate was RON 230.75, as compared to RON 154.68
on December 31, 2020.
The Group’s profit and loss account summary for the period January 1 – March 31, 2021, as compared
to the similar period of 2020, is shown below:
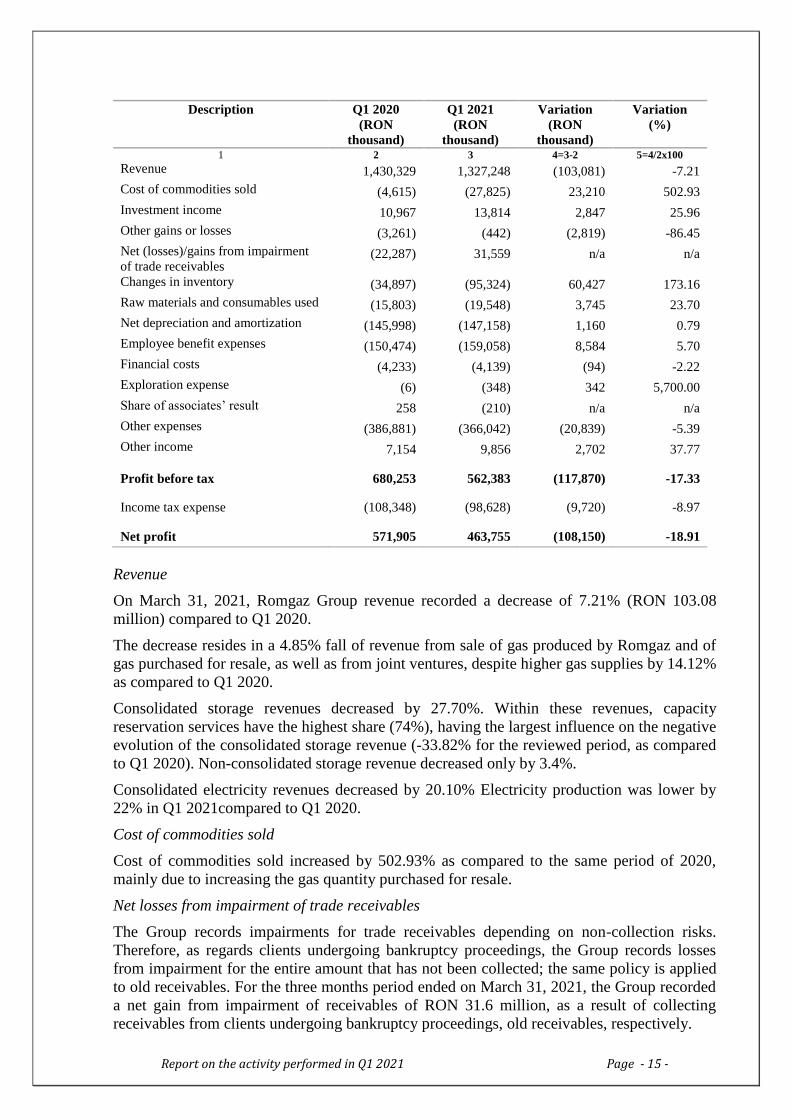
Report on the activity performed in Q1 2021 Page - 15 -
Description Q1 2020
(RON
thousand)
Q1 2021
(RON
thousand)
Variation
(RON
thousand)
Variation
(%)
1 2 3 4=3-2 5=4/2x100
Revenue 1,430,329 1,327,248 (103,081) -7.21
Cost of commodities sold (4,615) (27,825) 23,210 502.93
Investment income 10,967 13,814 2,847 25.96
Other gains or losses (3,261) (442) (2,819) -86.45
Net (losses)/gains from impairment
of trade receivables (22,287) 31,559 n/a n/a
Changes in inventory (34,897) (95,324) 60,427 173.16
Raw materials and consumables used (15,803) (19,548) 3,745 23.70
Net depreciation and amortization (145,998) (147,158) 1,160 0.79
Employee benefit expenses (150,474) (159,058) 8,584 5.70
Financial costs (4,233) (4,139) (94) -2.22
Exploration expense (6) (348) 342 5,700.00
Share of associates’ result 258 (210) n/a n/a
Other expenses (386,881) (366,042) (20,839) -5.39
Other income 7,154 9,856 2,702 37.77
Profit before tax 680,253 562,383 (117,870) -17.33
Income tax expense (108,348) (98,628) (9,720) -8.97
Net profit 571,905 463,755 (108,150) -18.91
Revenue
On March 31, 2021, Romgaz Group revenue recorded a decrease of 7.21% (RON 103.08
million) compared to Q1 2020.
The decrease resides in a 4.85% fall of revenue from sale of gas produced by Romgaz and of
gas purchased for resale, as well as from joint ventures, despite higher gas supplies by 14.12%
as compared to Q1 2020.
Consolidated storage revenues decreased by 27.70%. Within these revenues, capacity
reservation services have the highest share (74%), having the largest influence on the negative
evolution of the consolidated storage revenue (-33.82% for the reviewed period, as compared
to Q1 2020). Non-consolidated storage revenue decreased only by 3.4%.
Consolidated electricity revenues decreased by 20.10% Electricity production was lower by
22% in Q1 2021compared to Q1 2020.
Cost of commodities sold
Cost of commodities sold increased by 502.93% as compared to the same period of 2020,
mainly due to increasing the gas quantity purchased for resale.
Net losses from impairment of trade receivables
The Group records impairments for trade receivables depending on non-collection risks.
Therefore, as regards clients undergoing bankruptcy proceedings, the Group records losses
from impairment for the entire amount that has not been collected; the same policy is applied
to old receivables. For the three months period ended on March 31, 2021, the Group recorded
a net gain from impairment of receivables of RON 31.6 million, as a result of collecting
receivables from clients undergoing bankruptcy proceedings, old receivables, respectively.
Report on the activity performed in Q1 2021 Page - 16 -
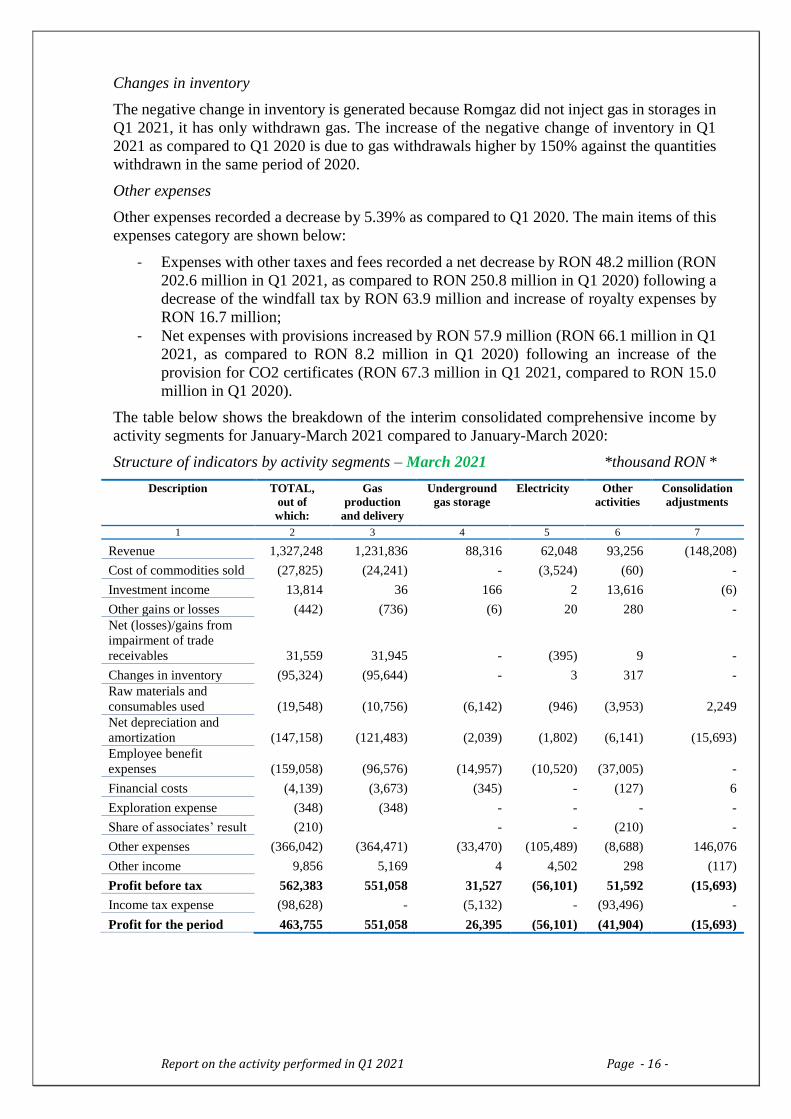
Changes in inventory
The negative change in inventory is generated because Romgaz did not inject gas in storages in
Q1 2021, it has only withdrawn gas. The increase of the negative change of inventory in Q1
2021 as compared to Q1 2020 is due to gas withdrawals higher by 150% against the quantities
withdrawn in the same period of 2020.
Other expenses
Other expenses recorded a decrease by 5.39% as compared to Q1 2020. The main items of this
expenses category are shown below:
- Expenses with other taxes and fees recorded a net decrease by RON 48.2 million (RON
202.6 million in Q1 2021, as compared to RON 250.8 million in Q1 2020) following a
decrease of the windfall tax by RON 63.9 million and increase of royalty expenses by
RON 16.7 million;
- Net expenses with provisions increased by RON 57.9 million (RON 66.1 million in Q1
2021, as compared to RON 8.2 million in Q1 2020) following an increase of the
provision for CO2 certificates (RON 67.3 million in Q1 2021, compared to RON 15.0
million in Q1 2020).
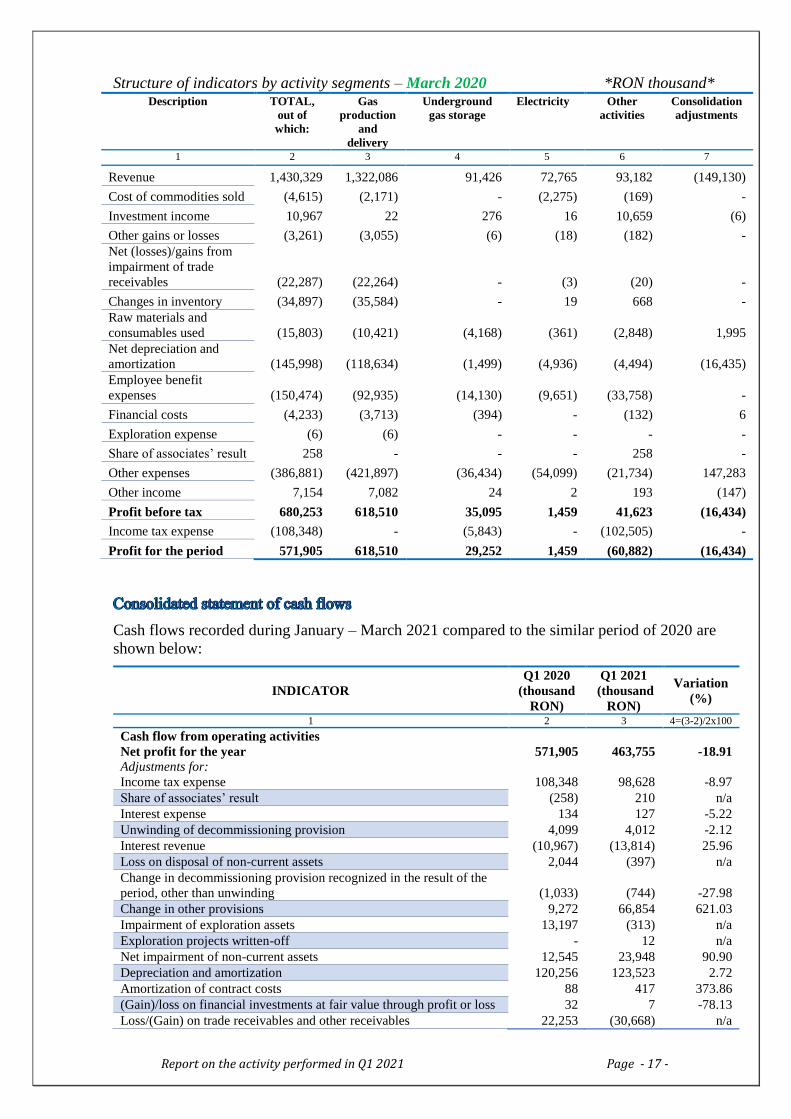
The table below shows the breakdown of the interim consolidated comprehensive income by
activity segments for January-March 2021 compared to January-March 2020:
Structure of indicators by activity segments – March 2021 *thousand RON *
Description TOTAL,
out of
which:
Gas
production
and delivery
Underground
gas storage
Electricity Other
activities
Consolidation
adjustments
1 2 3 4 5 6 7
Revenue 1,327,248 1,231,836 88,316 62,048 93,256 (148,208)
Cost of commodities sold (27,825) (24,241) - (3,524) (60) -
Investment income 13,814 36 166 2 13,616 (6)
Other gains or losses (442) (736) (6) 20 280 -
Net (losses)/gains from
impairment of trade
receivables 31,559 31,945 - (395) 9 -
Changes in inventory (95,324) (95,644) - 3 317 -
Raw materials and
consumables used (19,548) (10,756) (6,142) (946) (3,953) 2,249
Net depreciation and
amortization (147,158) (121,483) (2,039) (1,802) (6,141) (15,693)
Employee benefit
expenses (159,058) (96,576) (14,957) (10,520) (37,005) -
Financial costs (4,139) (3,673) (345) - (127) 6
Exploration expense (348) (348) - - - -
Share of associates’ result (210) - - (210) -
Other expenses (366,042) (364,471) (33,470) (105,489) (8,688) 146,076
Other income 9,856 5,169 4 4,502 298 (117)
Profit before tax 562,383 551,058 31,527 (56,101) 51,592 (15,693)
Income tax expense (98,628) - (5,132) - (93,496) -
Profit for the period 463,755 551,058 26,395 (56,101) (41,904) (15,693)
Report on the activity performed in Q1 2021 Page - 17 -
Structure of indicators by activity segments – March 2020 *RON thousand* Description TOTAL,
out of
which:
Gas
production
and
delivery
Underground
gas storage
Electricity Other
activities
Consolidation
adjustments
1 2 3 4 5 6 7
Revenue 1,430,329 1,322,086 91,426 72,765 93,182 (149,130)
Cost of commodities sold (4,615) (2,171) - (2,275) (169) -
Investment income 10,967 22 276 16 10,659 (6)
Other gains or losses (3,261) (3,055) (6) (18) (182) -
Net (losses)/gains from
impairment of trade
receivables (22,287) (22,264) - (3) (20) -
Changes in inventory (34,897) (35,584) - 19 668 -
Raw materials and
consumables used (15,803) (10,421) (4,168) (361) (2,848) 1,995
Net depreciation and
amortization (145,998) (118,634) (1,499) (4,936) (4,494) (16,435)
Employee benefit
expenses (150,474) (92,935) (14,130) (9,651) (33,758) -
Financial costs (4,233) (3,713) (394) - (132) 6
Exploration expense (6) (6) - - - -
Share of associates’ result 258 - - - 258 -
Other expenses (386,881) (421,897) (36,434) (54,099) (21,734) 147,283
Other income 7,154 7,082 24 2 193 (147)
Profit before tax 680,253 618,510 35,095 1,459 41,623 (16,434)
Income tax expense (108,348) - (5,843) - (102,505) -
Profit for the period 571,905 618,510 29,252 1,459 (60,882) (16,434)
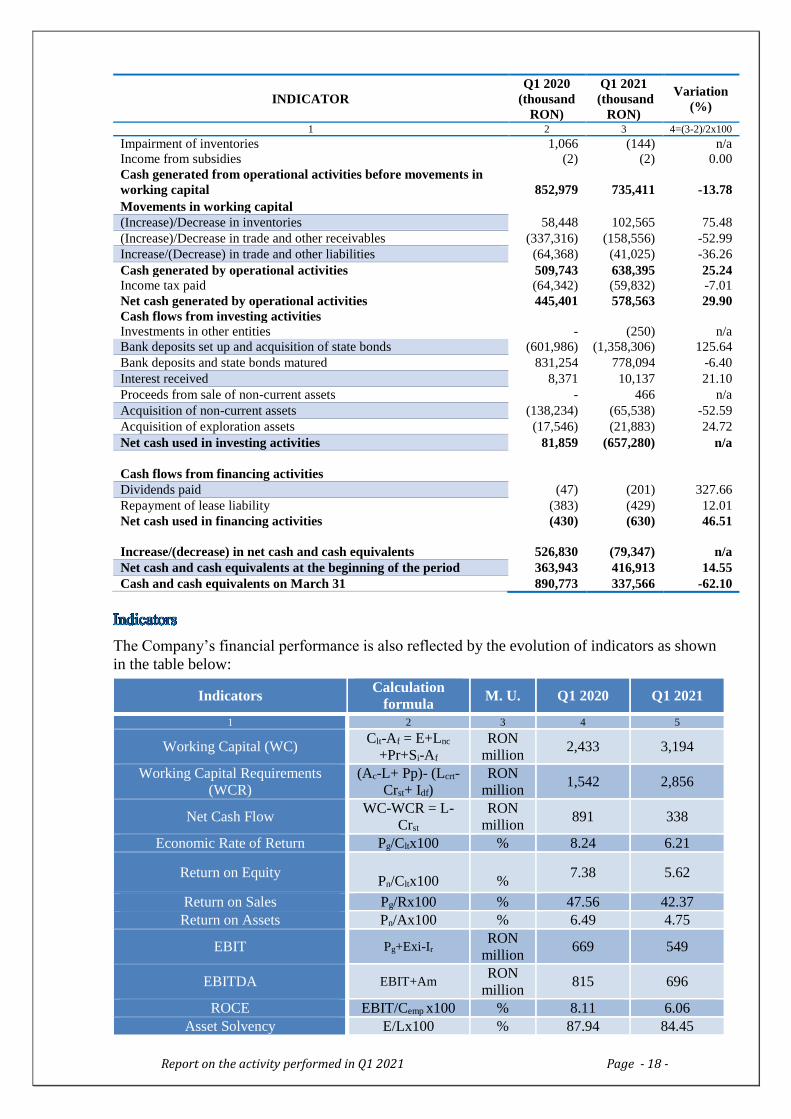
Cash flows recorded during January – March 2021 compared to the similar period of 2020 are
shown below:
INDICATOR
Q1 2020
(thousand
RON)
Q1 2021
(thousand
RON)
Variation
(%)
1 2 3 4=(3-2)/2x100
Cash flow from operating activities
Net profit for the year 571,905 463,755 -18.91
Adjustments for:
Income tax expense 108,348 98,628 -8.97
Share of associates’ result (258) 210 n/a
Interest expense 134 127 -5.22
Unwinding of decommissioning provision 4,099 4,012 -2.12
Interest revenue (10,967) (13,814) 25.96
Loss on disposal of non-current assets 2,044 (397) n/a
Change in decommissioning provision recognized in the result of the
period, other than unwinding (1,033) (744) -27.98
Change in other provisions 9,272 66,854 621.03
Impairment of exploration assets 13,197 (313) n/a
Exploration projects written-off - 12 n/a
Net impairment of non-current assets 12,545 23,948 90.90
Depreciation and amortization 120,256 123,523 2.72
Amortization of contract costs 88 417 373.86
(Gain)/loss on financial investments at fair value through profit or loss 32 7 -78.13
Loss/(Gain) on trade receivables and other receivables 22,253 (30,668) n/a
Report on the activity performed in Q1 2021 Page - 18 -
INDICATOR
Q1 2020
(thousand
RON)
Q1 2021
(thousand
RON)
Variation
(%)
1 2 3 4=(3-2)/2x100
Impairment of inventories 1,066 (144) n/a
Income from subsidies (2) (2) 0.00
Cash generated from operational activities before movements in
working capital 852,979 735,411 -13.78
Movements in working capital (Increase)/Decrease in inventories 58,448 102,565 75.48
(Increase)/Decrease in trade and other receivables (337,316) (158,556) -52.99
Increase/(Decrease) in trade and other liabilities (64,368) (41,025) -36.26
Cash generated by operational activities 509,743 638,395 25.24
Income tax paid (64,342) (59,832) -7.01
Net cash generated by operational activities 445,401 578,563 29.90
Cash flows from investing activities
Investments in other entities - (250) n/a
Bank deposits set up and acquisition of state bonds (601,986) (1,358,306) 125.64
Bank deposits and state bonds matured 831,254 778,094 -6.40
Interest received 8,371 10,137 21.10
Proceeds from sale of non-current assets - 466 n/a
Acquisition of non-current assets (138,234) (65,538) -52.59
Acquisition of exploration assets (17,546) (21,883) 24.72
Net cash used in investing activities 81,859 (657,280) n/a
Cash flows from financing activities
Dividends paid (47) (201) 327.66
Repayment of lease liability (383) (429) 12.01
Net cash used in financing activities (430) (630) 46.51
Increase/(decrease) in net cash and cash equivalents 526,830 (79,347) n/a
Net cash and cash equivalents at the beginning of the period 363,943 416,913 14.55
Cash and cash equivalents on March 31 890,773 337,566 -62.10
The Company’s financial performance is also reflected by the evolution of indicators as shown
in the table below:
Indicators Calculation
formula M. U. Q1 2020 Q1 2021
1 2 3 4 5
Working Capital (WC) Clt-Af = E+Lnc
+Pr+Si-Af
RON
million 2,433 3,194
Working Capital Requirements
(WCR)
(Ac-L+ Pp)- (Lcrt-
Crst+ Idf)
RON
million 1,542 2,856
Net Cash Flow WC-WCR = L-
Crst
RON
million 891 338
Economic Rate of Return Pg/Cltx100 % 8.24 6.21
Return on Equity
Pn/Cltx100
% 7.38 5.62
Return on Sales Pg/Rx100 % 47.56 42.37
Return on Assets Pn/Ax100 % 6.49 4.75
EBIT Pg+Exi-Ir RON
million 669 549
EBITDA EBIT+Am RON
million 815 696
ROCE EBIT/Cemp x100 % 8.11 6.06
Asset Solvency E/Lx100 % 87.94 84.45
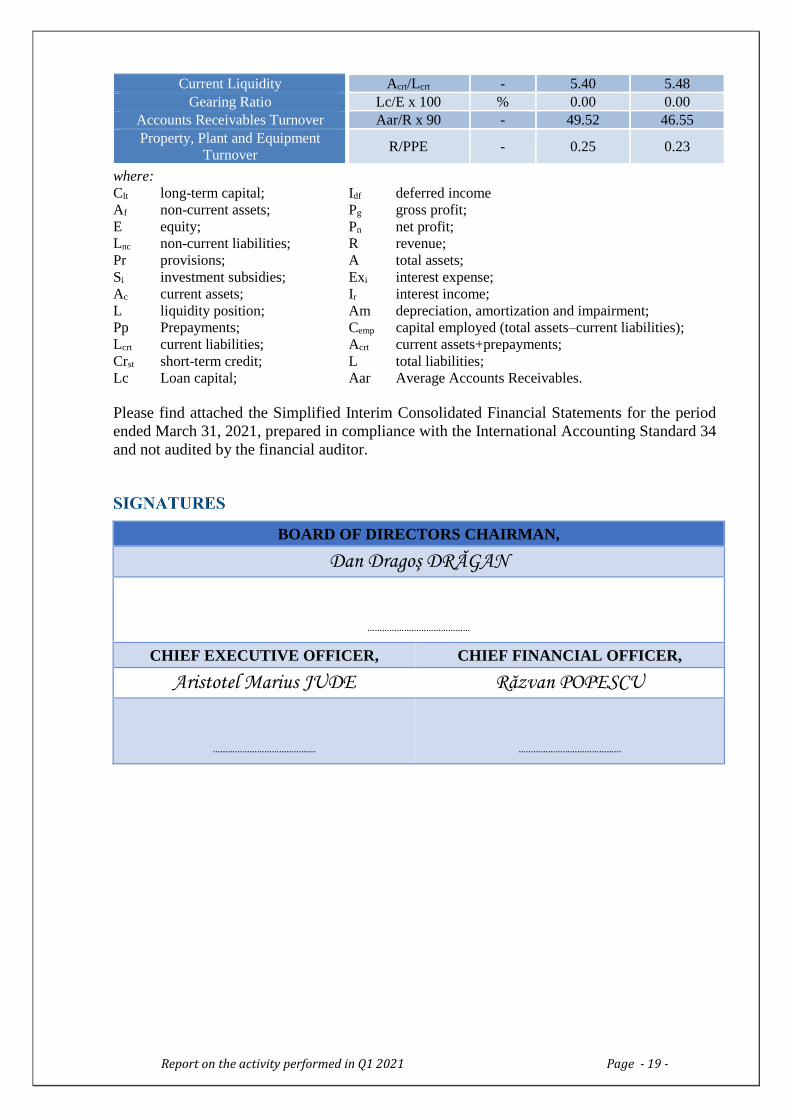
Report on the activity performed in Q1 2021 Page - 19 -
Current Liquidity Acrt/Lcrt - 5.40 5.48
Gearing Ratio Lc/E x 100 % 0.00 0.00
Accounts Receivables Turnover Aar/R x 90 - 49.52 46.55
Property, Plant and Equipment
Turnover R/PPE - 0.25 0.23
where:
Clt long-term capital; Idf deferred income
Af non-current assets; Pg gross profit;
E equity; Pn net profit;
Lnc non-current liabilities; R revenue;
Pr provisions; A total assets;
Si investment subsidies; Exi interest expense;
Ac current assets; Ir interest income;
L liquidity position; Am depreciation, amortization and impairment;
Pp Prepayments; Cemp capital employed (total assets–current liabilities);
Lcrt current liabilities; Acrt current assets+prepayments;
Crst short-term credit; L total liabilities;
Lc Loan capital; Aar Average Accounts Receivables.
Please find attached the Simplified Interim Consolidated Financial Statements for the period
ended March 31, 2021, prepared in compliance with the International Accounting Standard 34
and not audited by the financial auditor.
BOARD OF DIRECTORS CHAIRMAN,
Dan Dragoş DRĂGAN
……………………………………
CHIEF EXECUTIVE OFFICER, CHIEF FINANCIAL OFFICER,
Aristotel Marius JUDE Răzvan POPESCU
……………………………………
……………………………………
S.N.G.N. ROMGAZ S.A. GROUP
CONSOLIDATED CONDENSED INTERIM FINANCIAL STATEMENTS FOR THE THREE-MONTH PERIOD ENDED MARCH 31, 2021
(UNAUDITED)
PREPARED IN ACCORDANCE WITH INTERNATIONAL ACCOUNTING STANDARD 34
CONTENTS: PAGE:
Condensed statement of consolidated interim comprehensive income for the three-month
period ended March 31, 2021 1
Condensed statement of consolidated interim financial position as of March 31, 2021 2 Condensed statement of consolidated interim changes in equity for the three-month period
ended March 31, 2021 4 Condensed statement of consolidated interim cash flow for the three-month period ended
March 31, 2021 5 Notes to the condensed consolidated interim financial statements for the three-month
period ended March 31, 2021 7
1. Background and general business 7
2. Significant accounting policies 7
3. Revenue and other income 9
4. Cost of commodities sold, raw materials and consumables 9
5. Other gains and losses 10
6. Depreciation, amortization and impairment expenses 10
7. Income tax 10
8. Employee benefit expense 10
9. Other expenses 11
10. Accounts receivable 11
11. Provisions 12
12. Related party transactions and balances 12
13. Segment information 13
14. Commitments undertaken 14
15. Events after the balance sheet date 14
16. Approval of financial statements 14
S.N.G.N. ROMGAZ S.A. GROUP
CONDENSED STATEMENT OF CONSOLIDATED INTERIM COMPREHENSIVE INCOME FOR THE THREE-MONTH PERIOD ENDED MARCH 31, 2021
The accompanying notes form an integrant part of these financial statements. This is a free translation of the original Romanian version.
1
Note
Three months ended March 31, 2021
Three months ended March 31, 2020
'000 RON '000 RON
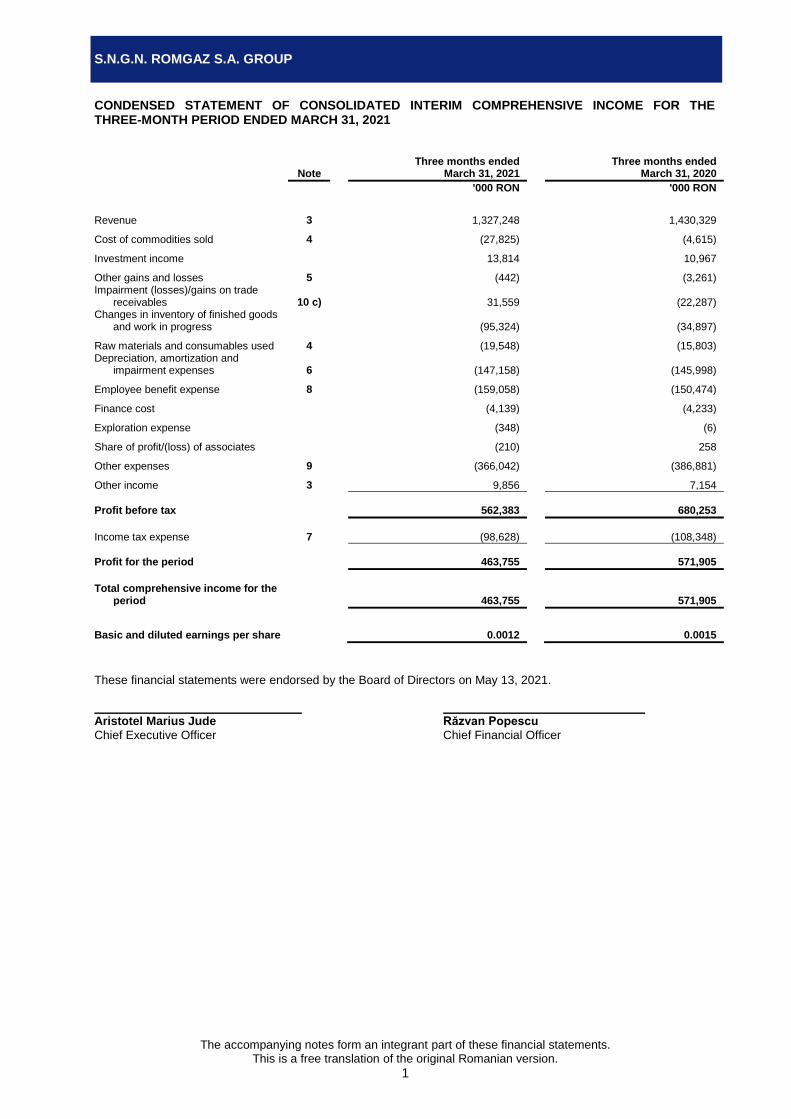
Revenue 3 1,327,248 1,430,329
Cost of commodities sold 4 (27,825) (4,615)
Investment income
13,814 10,967
Other gains and losses 5 (442) (3,261) Impairment (losses)/gains on trade
receivables 10 c) 31,559 (22,287) Changes in inventory of finished goods
and work in progress
(95,324) (34,897)
Raw materials and consumables used 4 (19,548) (15,803) Depreciation, amortization and
impairment expenses 6 (147,158) (145,998)
Employee benefit expense 8 (159,058) (150,474)
Finance cost (4,139) (4,233)
Exploration expense (348) (6)
Share of profit/(loss) of associates (210) 258
Other expenses 9 (366,042) (386,881)
Other income 3 9,856 7,154
Profit before tax
562,383 680,253
Income tax expense 7 (98,628) (108,348)
Profit for the period
463,755 571,905
Total comprehensive income for the period 463,755 571,905
Basic and diluted earnings per share 0.0012 0.0015
These financial statements were endorsed by the Board of Directors on May 13, 2021. Aristotel Marius Jude Răzvan Popescu
Chief Executive Officer Chief Financial Officer
S.N.G.N. ROMGAZ S.A. GROUP
CONDENSED STATEMENT OF CONSOLIDATED INTERIM FINANCIAL POSITION AS OF MARCH 31, 2021
The accompanying notes form an integrant part of these financial statements. This is a free translation of the original Romanian version.
2
Note March 31, 2021 December 31, 2020
'000 RON '000 RON
ASSETS
Non-current assets
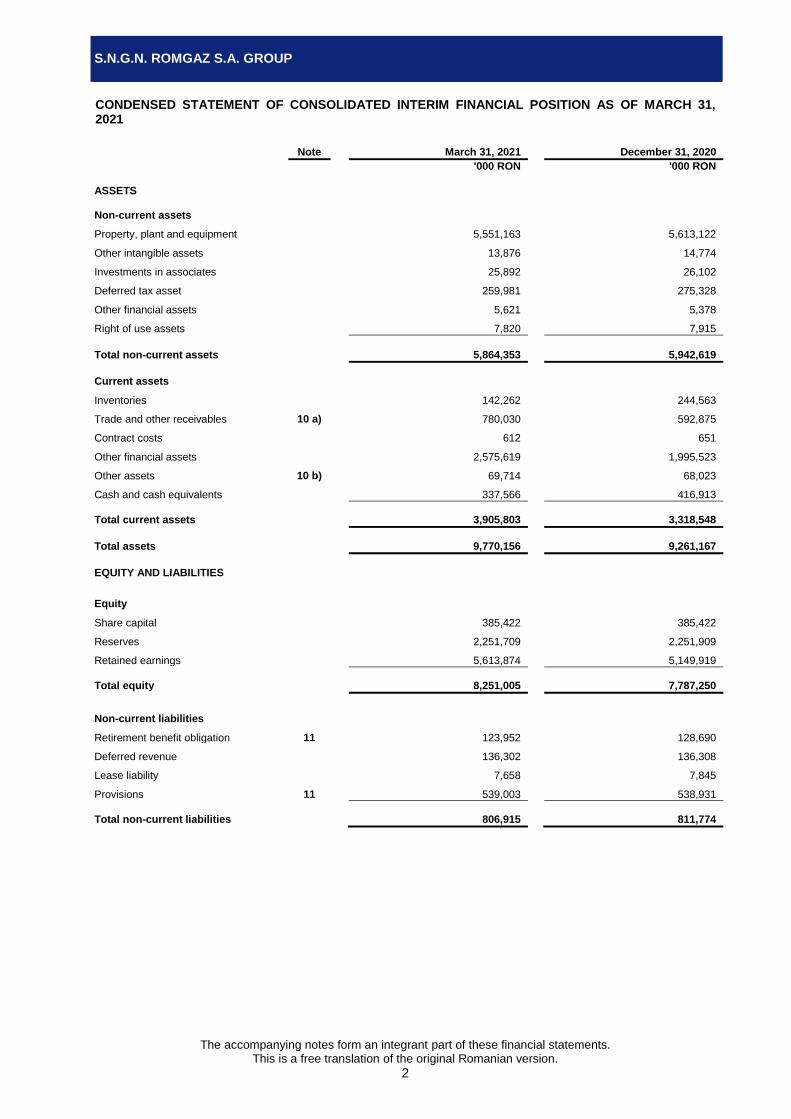
Property, plant and equipment 5,551,163 5,613,122
Other intangible assets 13,876 14,774
Investments in associates 25,892 26,102
Deferred tax asset 259,981 275,328
Other financial assets 5,621 5,378
Right of use assets 7,820 7,915
Total non-current assets
5,864,353 5,942,619
Current assets
Inventories
142,262 244,563
Trade and other receivables 10 a) 780,030 592,875
Contract costs 612 651
Other financial assets 2,575,619 1,995,523
Other assets 10 b) 69,714 68,023
Cash and cash equivalents
337,566 416,913
Total current assets
3,905,803 3,318,548
Total assets
9,770,156 9,261,167
EQUITY AND LIABILITIES
Equity
Share capital 385,422 385,422
Reserves 2,251,709 2,251,909
Retained earnings
5,613,874 5,149,919
Total equity
8,251,005 7,787,250
Non-current liabilities
Retirement benefit obligation 11 123,952 128,690
Deferred revenue 136,302 136,308
Lease liability 7,658 7,845
Provisions 11 539,003 538,931
Total non-current liabilities
806,915 811,774
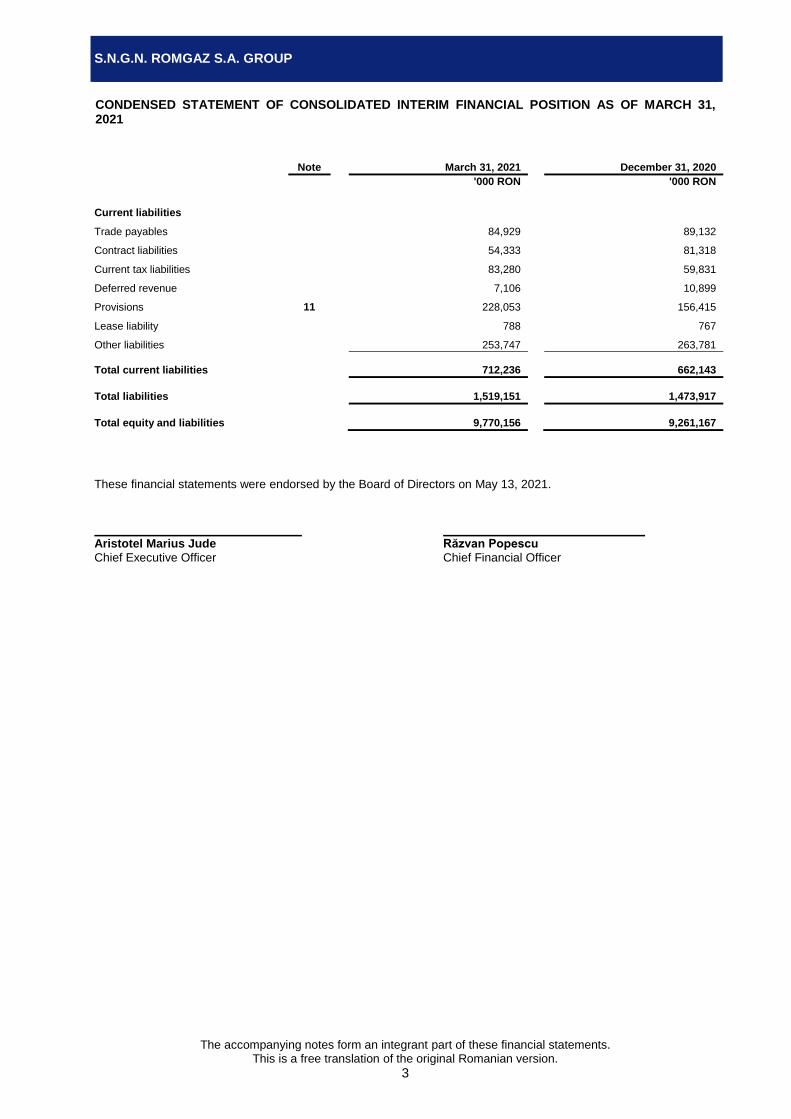
S.N.G.N. ROMGAZ S.A. GROUP
CONDENSED STATEMENT OF CONSOLIDATED INTERIM FINANCIAL POSITION AS OF MARCH 31, 2021
The accompanying notes form an integrant part of these financial statements. This is a free translation of the original Romanian version.
3
Note
March 31, 2021 December 31, 2020
'000 RON '000 RON
Current liabilities
Trade payables
84,929 89,132
Contract liabilities
54,333 81,318
Current tax liabilities
83,280 59,831
Deferred revenue
7,106 10,899
Provisions 11
228,053 156,415
Lease liability
788 767
Other liabilities
253,747 263,781
Total current liabilities
712,236 662,143
Total liabilities
1,519,151 1,473,917
Total equity and liabilities
9,770,156 9,261,167
These financial statements were endorsed by the Board of Directors on May 13, 2021.
Aristotel Marius Jude Răzvan Popescu
Chief Executive Officer Chief Financial Officer
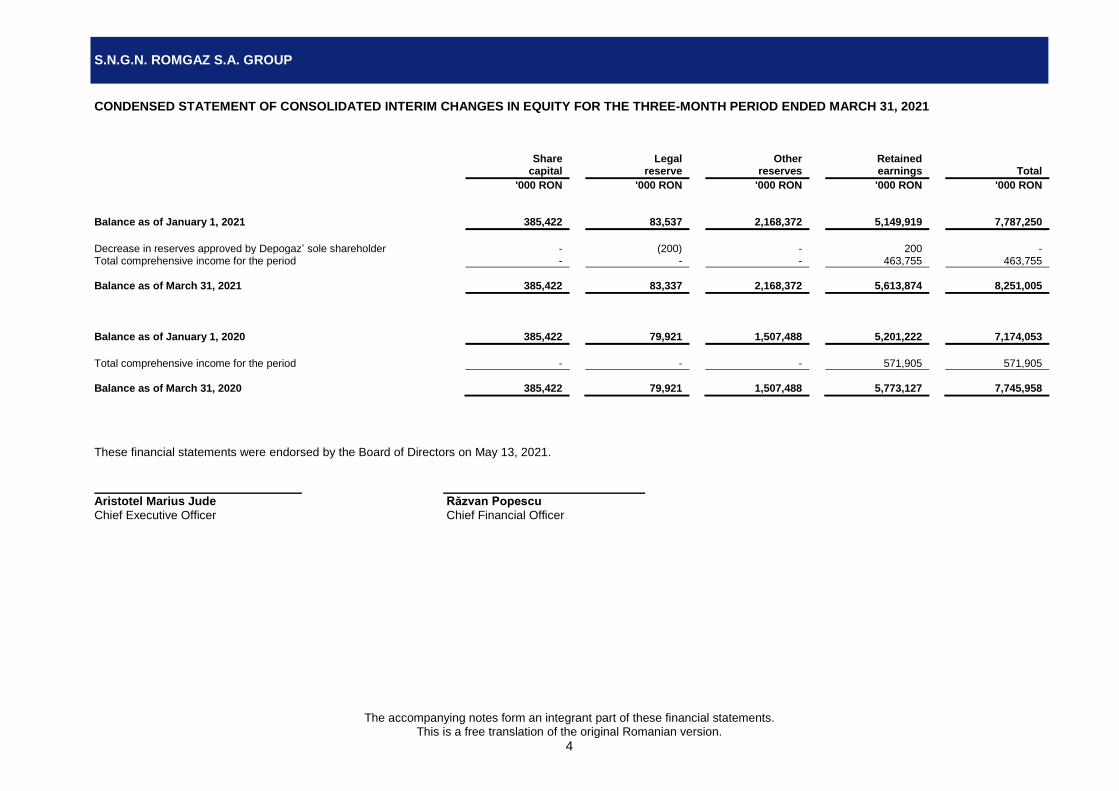
S.N.G.N. ROMGAZ S.A. GROUP
CONDENSED STATEMENT OF CONSOLIDATED INTERIM CHANGES IN EQUITY FOR THE THREE-MONTH PERIOD ENDED MARCH 31, 2021
The accompanying notes form an integrant part of these financial statements. This is a free translation of the original Romanian version.
4
Share capital
Legal reserve
Other reserves
Retained earnings Total
'000 RON
'000 RON
'000 RON
'000 RON '000 RON Balance as of January 1, 2021 385,422 83,537 2,168,372 5,149,919 7,787,250
Decrease in reserves approved by Depogaz’ sole shareholder - (200) - 200 - Total comprehensive income for the period - - - 463,755 463,755
Balance as of March 31, 2021 385,422 83,337 2,168,372 5,613,874 8,251,005 Balance as of January 1, 2020 385,422 79,921 1,507,488 5,201,222 7,174,053
Total comprehensive income for the period - - - 571,905 571,905
Balance as of March 31, 2020 385,422 79,921 1,507,488 5,773,127 7,745,958
These financial statements were endorsed by the Board of Directors on May 13, 2021.
Aristotel Marius Jude Răzvan Popescu
Chief Executive Officer Chief Financial Officer
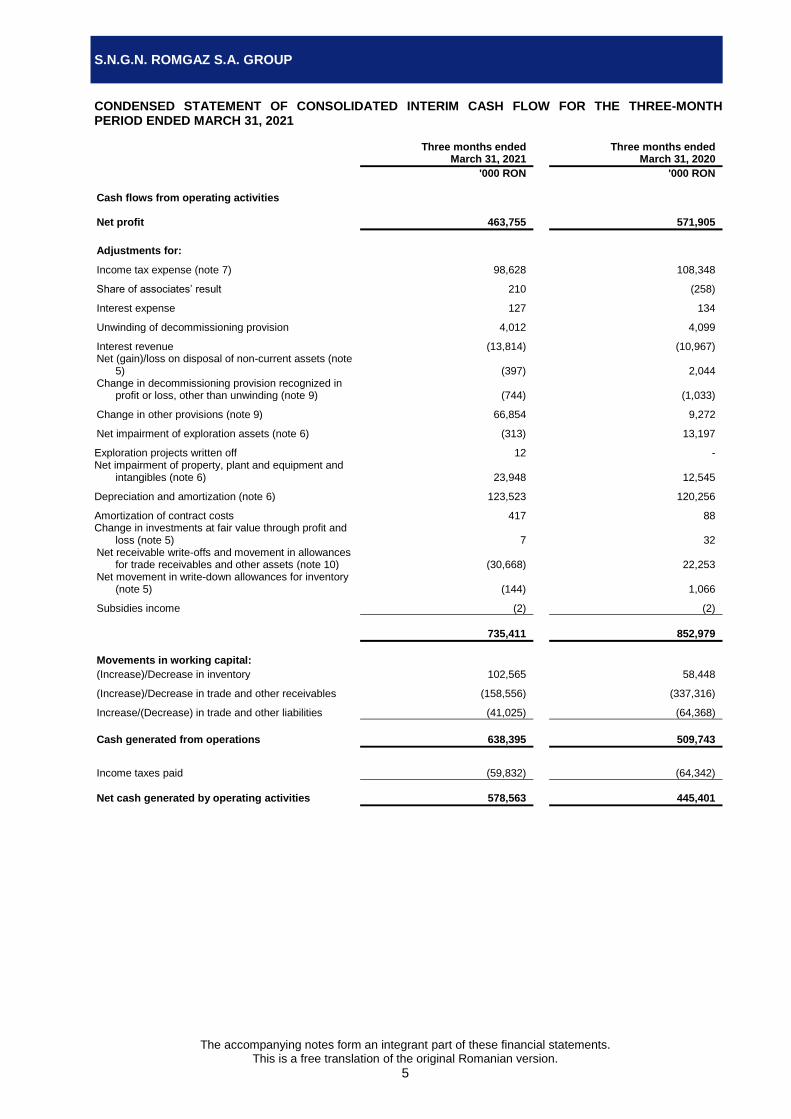
S.N.G.N. ROMGAZ S.A. GROUP
CONDENSED STATEMENT OF CONSOLIDATED INTERIM CASH FLOW FOR THE THREE-MONTH PERIOD ENDED MARCH 31, 2021
The accompanying notes form an integrant part of these financial statements. This is a free translation of the original Romanian version.
5
Three months ended March 31, 2021
Three months ended March 31, 2020
'000 RON '000 RON
Cash flows from operating activities Net profit 463,755 571,905
Adjustments for:
Income tax expense (note 7) 98,628 108,348
Share of associates’ result 210 (258)
Interest expense 127 134
Unwinding of decommissioning provision 4,012 4,099
Interest revenue (13,814) (10,967) Net (gain)/loss on disposal of non-current assets (note
5) (397) 2,044 Change in decommissioning provision recognized in
profit or loss, other than unwinding (note 9) (744) (1,033)
Change in other provisions (note 9) 66,854 9,272
Net impairment of exploration assets (note 6) (313) 13,197
Exploration projects written off 12 - Net impairment of property, plant and equipment and
intangibles (note 6) 23,948 12,545
Depreciation and amortization (note 6) 123,523 120,256
Amortization of contract costs 417 88 Change in investments at fair value through profit and
loss (note 5) 7 32 Net receivable write-offs and movement in allowances
for trade receivables and other assets (note 10) (30,668) 22,253 Net movement in write-down allowances for inventory
(note 5) (144) 1,066
Subsidies income (2) (2)
735,411 852,979
Movements in working capital:
(Increase)/Decrease in inventory 102,565 58,448
(Increase)/Decrease in trade and other receivables (158,556) (337,316)
Increase/(Decrease) in trade and other liabilities (41,025) (64,368)
Cash generated from operations 638,395 509,743
Income taxes paid (59,832) (64,342)
Net cash generated by operating activities 578,563 445,401
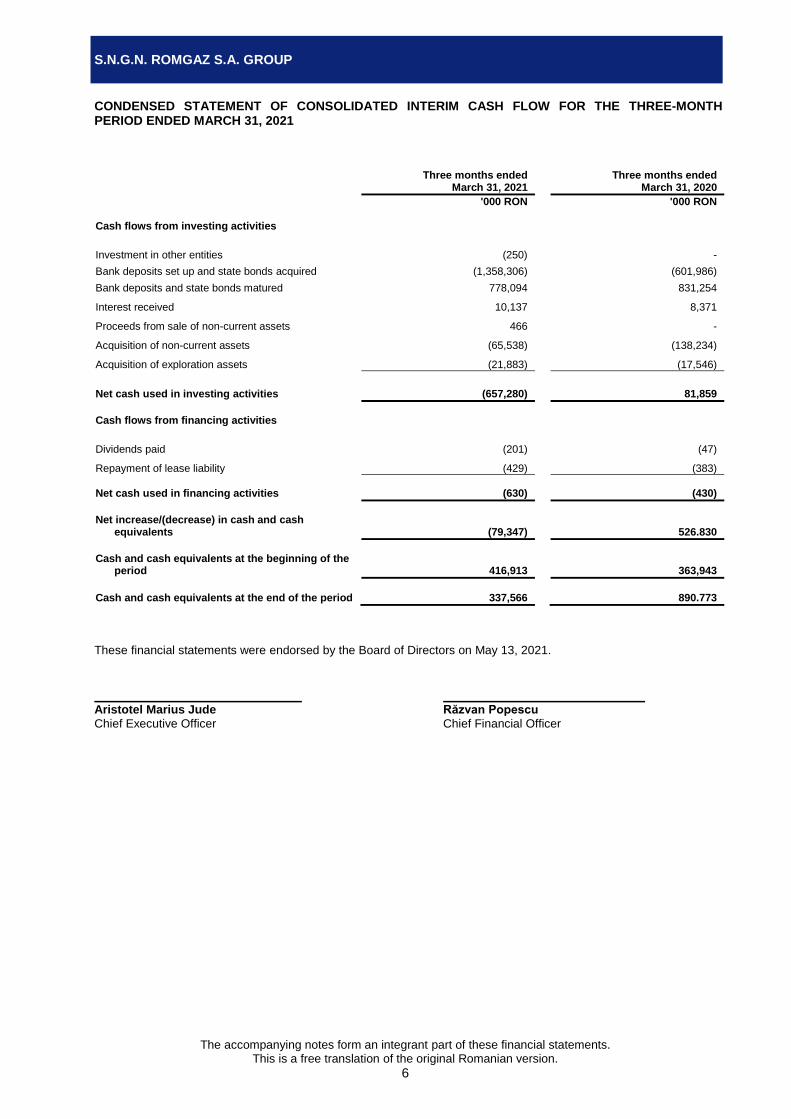
S.N.G.N. ROMGAZ S.A. GROUP
CONDENSED STATEMENT OF CONSOLIDATED INTERIM CASH FLOW FOR THE THREE-MONTH PERIOD ENDED MARCH 31, 2021
The accompanying notes form an integrant part of these financial statements. This is a free translation of the original Romanian version.
6
Three months ended March 31, 2021
Three months ended March 31, 2020
'000 RON '000 RON
Cash flows from investing activities
Investment in other entities (250) -
Bank deposits set up and state bonds acquired (1,358,306) (601,986)
Bank deposits and state bonds matured 778,094 831,254
Interest received 10,137 8,371
Proceeds from sale of non-current assets 466 -
Acquisition of non-current assets (65,538) (138,234)
Acquisition of exploration assets (21,883) (17,546)
Net cash used in investing activities (657,280) 81,859
Cash flows from financing activities
Dividends paid (201) (47)
Repayment of lease liability (429) (383)
Net cash used in financing activities (630) (430)
Net increase/(decrease) in cash and cash
equivalents (79,347) 526.830
Cash and cash equivalents at the beginning of the period 416,913 363,943
Cash and cash equivalents at the end of the period 337,566 890.773
These financial statements were endorsed by the Board of Directors on May 13, 2021.
Aristotel Marius Jude Răzvan Popescu
Chief Executive Officer Chief Financial Officer
S.N.G.N. ROMGAZ S.A. GROUP
NOTES TO THE CONDENSED CONSOLIDATED INTERIM FINANCIAL STATEMENTS FOR THE THREE-MONTH PERIOD ENDED MARCH 31, 2021
The accompanying notes form an integrant part of these financial statements. This is a free translation of the original Romanian version.
7
1. BACKGROUND AND GENERAL BUSINESS
Information regarding S.N.G.N. Romgaz S.A. Group (the “Group”)
The Group is formed of S.N.G.N. Romgaz S.A. (”the Company”/"Romgaz"), as parent company, its fully owned subsidiary S.N.G.N. ROMGAZ S.A. - Filiala de Înmagazinare Gaze Naturale DEPOGAZ Ploiești S.R.L. (“Depogaz”) and its associates – S.C. Depomures S.A. (40% of the share capital) and S.C. Agri LNG Project Company S.R.L. (25% of the share capital).
Romgaz is a joint stock company, incorporated in accordance with the Romanian legislation.
The Company’s headquarter is in Mediaş, 4 Constantin I. Motaş Square, 551130, Sibiu County.
The Romanian State, through the Ministry of Energy, is the majority shareholder of S.N.G.N. Romgaz S.A. together with other legal and physical persons.
The Group has as main activity:
1. geological research for the discovery of natural gas, crude oil and condensed reserves;
2. operation, production and usage, including trading, of mineral resources;
3. natural gas production for:
ensuring the storage flow continuity;
technological consumption;
delivery in the transportation system.
4. underground storage of natural gas;
5. commissioning, interventions, capital repairs for wells equipping the deposits, as well as the natural gas resources extraction wells, for its own activity and for third parties;
6. electricity production and distribution.
2. SIGNIFICANT ACCOUNTING POLICIES
Statement of compliance
The condensed consolidated interim financial statements (“financial statements”) of the Group have been prepared in accordance with the provisions of the International Accounting Standard 34 “Interim Reporting”. For the purpose of the preparation of these financial statements, the functional currency of the Group is deemed to be the Romanian Leu (RON). IFRS as adopted by the EU differ in certain respects from IFRS as issued by the International Accounting Standards Board (IASB), however, the differences have no material impact on the Group’s financial statements for the periods presented.
Basis of preparation
The financial statements have been prepared on a going concern basis. The principal accounting policies are set out below.
Accounting is kept in Romanian and in the national currency. Items included in these financial statements are denominated in Romanian lei. Unless otherwise stated, the amounts are presented in thousand lei (thousand RON).
These financial statements are prepared for general purposes, for users familiar with the IFRS as adopted by EU; these are not special purpose financial statements. Consequently, these financial statements must not be used as sole source of information by a potential investor or other users interested in a specific transaction.
Basis for consolidation
Subsidiaries
The Company controls an entity when it is exposed, or has rights, to variable returns from its involvement with the investee and has the ability to affect those returns through its power over the investee.
Consolidation of a subsidiary begins when the Company obtains control over the subsidiary and ceases when it loses control of that subsidiary.
Where necessary, adjustments are made to the financial statements of subsidiaries to bring their accounting policies in line with those used by the Group. All intra-group assets and liabilities, income and expenses relating to transactions between members of the Group are eliminated in full on consolidation.
S.N.G.N. ROMGAZ S.A. GROUP
NOTES TO THE CONDENSED CONSOLIDATED INTERIM FINANCIAL STATEMENTS FOR THE THREE-MONTH PERIOD ENDED MARCH 31, 2021
The accompanying notes form an integrant part of these financial statements. This is a free translation of the original Romanian version.
8
Associated entities
An associate is a company over which the Company exercises significant influence through participation in decision making on financial and operational policies of the entity invested in. Investments in associates are recorded using the equity method of accounting. By this method, the investment is initially recognized at cost and adjusted thereafter for the post-acquisition change in the Group’s share of the investee’s net assets. The Group’s profit or loss includes its share of the investee’s profit or loss and the Group’s other comprehensive income includes its share of the investee’s other comprehensive income.
Standards and interpretations valid for the current period
The following standards and amendments or improvements to existing standards issued by the IASB and adopted by the EU have entered into force for the current period:
Amendments to IFRS 9, IAS 39, IFRS 7, IFRS 4 and IFRS 16 Interest Rate Benchmark Reform – Phase 2 (effective for annual periods beginning on or after January 1, 2021);
Amendments to IFRS 4 Insurance Contracts – deferral of IFRS 9 (effective for annual periods beginning on or after January 1, 2021).
The adoption of these amendments, interpretations or improvements to existing standards did not lead to changes in the Group's accounting policies.
Standards and interpretations issued by IASB but not yet adopted by the EU
At present, IFRS as adopted by the EU do not significantly differ from IFRS adopted by the IASB except from the following standards, amendments or improvements to the existing standards and interpretations, which were not endorsed for use in EU as at date of publication of financial statements:
IFRS 17 Insurance Contracts including Amendments to IFRS 17 (effective for annual periods beginning on or after January 1, 2023);
Amendments to IAS 1 Presentation of Financial Statements: Classification of Liabilities as Current or Non-current and Classification of Liabilities as Current or Non-current - Deferral of Effective Date (effective for annual periods beginning on or after January 1, 2023);
Amendments to IFRS 3 Business Combinations (effective for annual periods beginning on or after January 1, 2022);
Amendments to IAS 16 Property, Plant and Equipment (effective for annual periods beginning on or after January 1, 2022);
Amendments to IAS 37 Provisions, Contingent Liabilities and Contingent Assets (effective for annual periods beginning on or after January 1, 2022);
Annual Improvements 2018-2020 (effective for annual periods beginning on or after January 1, 2022);
Amendments to IAS 1 Presentation of Financial Statements and IFRS Practice Statement 2: Disclosure of Accounting policies (effective for annual periods beginning on or after January 1, 2023);
Amendments to IAS 8 Accounting policies, Changes in Accounting Estimates and Errors: Definition of Accounting Estimates (effective for annual periods beginning on or after January 1, 2023).
The Group is currently evaluating the effect that the adoption of these standards, amendments or improvements to the existing standards and interpretations will have on the financial statements of the Group in the period of initial application.
Seasonality and cyclicality
Natural gas and electricity consumption is seasonal and affected by weather conditions. Natural gas consumption is highest in winter time. Electricity consumption also depends on climatic conditions, being impacted both by cold weather, as it can be used to produce heat, but also by high temperatures, as air conditioning systems rely on it. Consequently, the results of the Group may vary according to the seasonal character of the demand for natural gas and electricity.
Regarding the gas storage activity, injection normally happens during the period April-October, while gas is usually being extracted during the period October-April.
S.N.G.N. ROMGAZ S.A. GROUP
NOTES TO THE CONDENSED CONSOLIDATED INTERIM FINANCIAL STATEMENTS FOR THE THREE-MONTH PERIOD ENDED MARCH 31, 2021
The accompanying notes form an integrant part of these financial statements. This is a free translation of the original Romanian version.
9
Comparative information
For each item of the statement of financial position, the statement of comprehensive income and, where is the case, for the statement of changes in equity and for the statement of cash flows, for comparative information purposes is presented the value of the corresponding item for the previous period ended, unless the changes are insignificant. In addition, the Group presents an additional statement of financial position at the beginning of the earliest period presented when there is a retrospective application of an accounting policy, a retrospective restatement, or a reclassification of items in the financial statements, which has a material impact on the Group.
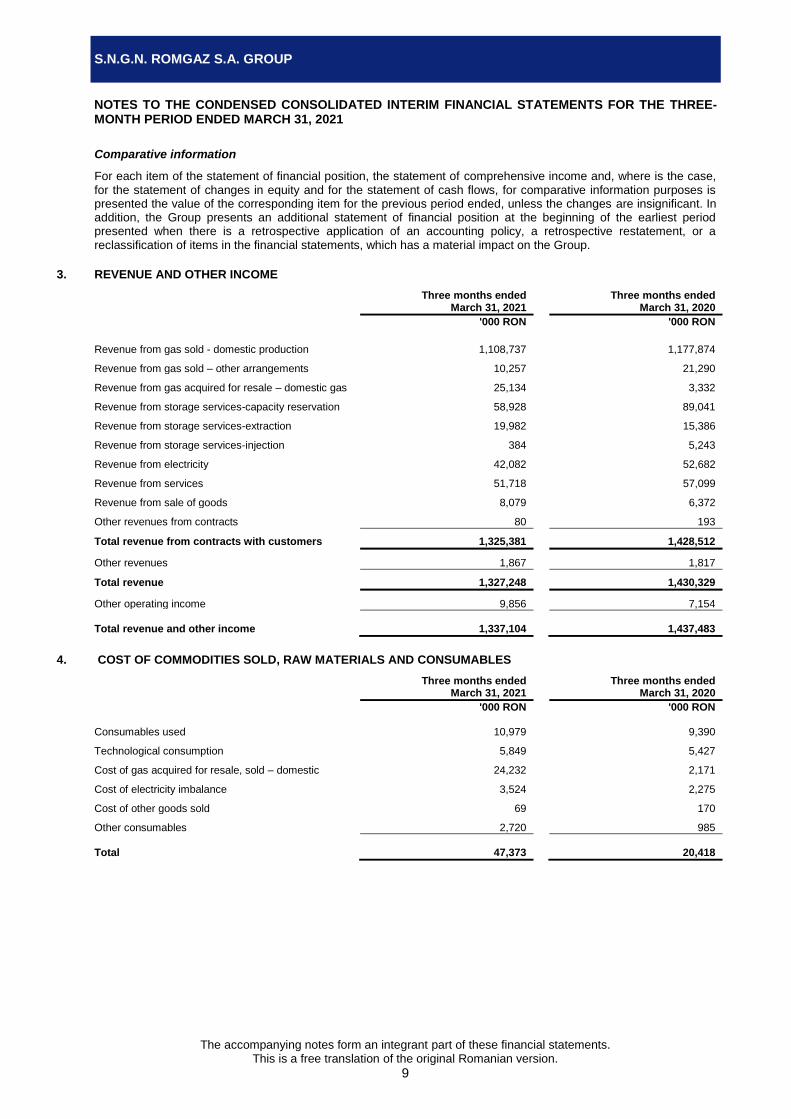
3. REVENUE AND OTHER INCOME
Three months ended March 31, 2021
Three months ended March 31, 2020
'000 RON '000 RON
Revenue from gas sold - domestic production 1,108,737 1,177,874
Revenue from gas sold – other arrangements 10,257 21,290
Revenue from gas acquired for resale – domestic gas 25,134 3,332
Revenue from storage services-capacity reservation 58,928 89,041
Revenue from storage services-extraction 19,982 15,386
Revenue from storage services-injection 384 5,243
Revenue from electricity 42,082 52,682
Revenue from services 51,718 57,099
Revenue from sale of goods 8,079 6,372
Other revenues from contracts 80 193
Total revenue from contracts with customers 1,325,381 1,428,512
Other revenues 1,867 1,817
Total revenue 1,327,248 1,430,329
Other operating income 9,856 7,154
Total revenue and other income 1,337,104 1,437,483
4. COST OF COMMODITIES SOLD, RAW MATERIALS AND CONSUMABLES
Three months ended March 31, 2021
Three months ended March 31, 2020
'000 RON '000 RON
Consumables used 10,979 9,390
Technological consumption 5,849 5,427
Cost of gas acquired for resale, sold – domestic 24,232 2,171
Cost of electricity imbalance 3,524 2,275
Cost of other goods sold 69 170
Other consumables 2,720 985
Total 47,373 20,418
S.N.G.N. ROMGAZ S.A. GROUP
NOTES TO THE CONDENSED CONSOLIDATED INTERIM FINANCIAL STATEMENTS FOR THE THREE-MONTH PERIOD ENDED MARCH 31, 2021
The accompanying notes form an integrant part of these financial statements. This is a free translation of the original Romanian version.
10
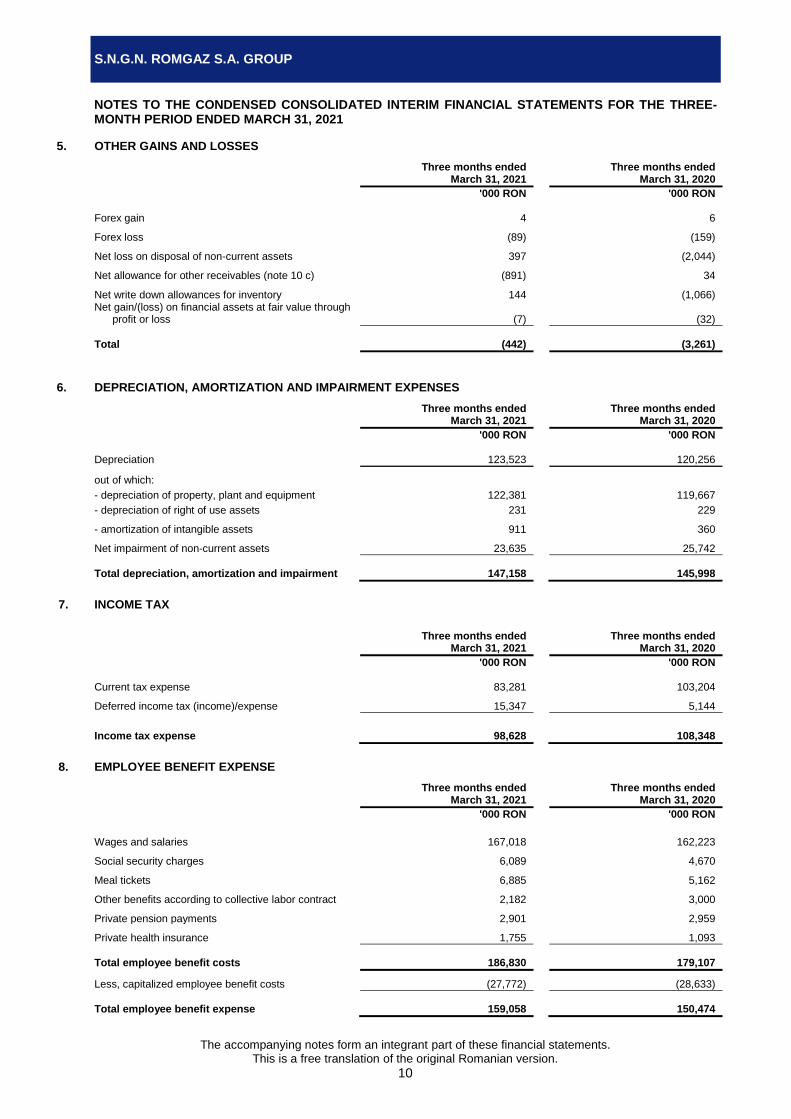
5. OTHER GAINS AND LOSSES
Three months ended March 31, 2021
Three months ended March 31, 2020
'000 RON '000 RON
Forex gain 4 6
Forex loss (89) (159)
Net loss on disposal of non-current assets 397 (2,044)
Net allowance for other receivables (note 10 c) (891) 34
Net write down allowances for inventory 144 (1,066) Net gain/(loss) on financial assets at fair value through
profit or loss (7) (32)
Total (442) (3,261)
6. DEPRECIATION, AMORTIZATION AND IMPAIRMENT EXPENSES
Three months ended March 31, 2021
Three months ended March 31, 2020
'000 RON '000 RON
Depreciation 123,523 120,256
out of which:
- depreciation of property, plant and equipment 122,381 119,667
- depreciation of right of use assets 231 229
- amortization of intangible assets 911 360
Net impairment of non-current assets 23,635 25,742
Total depreciation, amortization and impairment 147,158 145,998
7. INCOME TAX
Three months ended March 31, 2021
Three months ended March 31, 2020
'000 RON '000 RON
Current tax expense 83,281 103,204
Deferred income tax (income)/expense 15,347 5,144
Income tax expense 98,628 108,348
8. EMPLOYEE BENEFIT EXPENSE
Three months ended March 31, 2021
Three months ended March 31, 2020
'000 RON '000 RON
Wages and salaries 167,018 162,223
Social security charges 6,089 4,670
Meal tickets 6,885 5,162
Other benefits according to collective labor contract 2,182 3,000
Private pension payments 2,901 2,959
Private health insurance 1,755 1,093
Total employee benefit costs 186,830 179,107
Less, capitalized employee benefit costs (27,772) (28,633)
Total employee benefit expense 159,058 150,474
S.N.G.N. ROMGAZ S.A. GROUP
NOTES TO THE CONDENSED CONSOLIDATED INTERIM FINANCIAL STATEMENTS FOR THE THREE-MONTH PERIOD ENDED MARCH 31, 2021
The accompanying notes form an integrant part of these financial statements. This is a free translation of the original Romanian version.
11
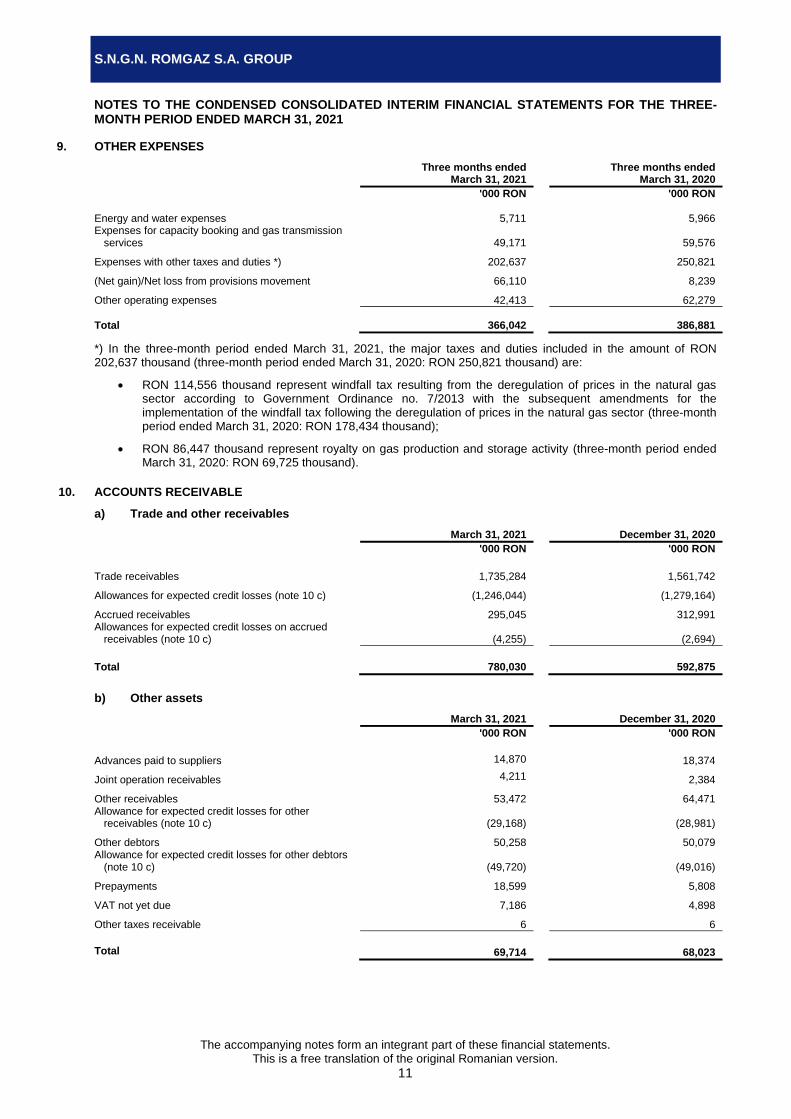
9. OTHER EXPENSES
Three months ended March 31, 2021
Three months ended March 31, 2020
'000 RON '000 RON
Energy and water expenses 5,711 5,966 Expenses for capacity booking and gas transmission
services 49,171 59,576
Expenses with other taxes and duties *) 202,637 250,821
(Net gain)/Net loss from provisions movement 66,110 8,239
Other operating expenses 42,413 62,279
Total 366,042 386,881
*) In the three-month period ended March 31, 2021, the major taxes and duties included in the amount of RON 202,637 thousand (three-month period ended March 31, 2020: RON 250,821 thousand) are:
RON 114,556 thousand represent windfall tax resulting from the deregulation of prices in the natural gas sector according to Government Ordinance no. 7/2013 with the subsequent amendments for the implementation of the windfall tax following the deregulation of prices in the natural gas sector (three-month period ended March 31, 2020: RON 178,434 thousand);
RON 86,447 thousand represent royalty on gas production and storage activity (three-month period ended March 31, 2020: RON 69,725 thousand).
10. ACCOUNTS RECEIVABLE
a) Trade and other receivables
March 31, 2021 December 31, 2020
'000 RON '000 RON
Trade receivables 1,735,284 1,561,742
Allowances for expected credit losses (note 10 c) (1,246,044) (1,279,164)
Accrued receivables 295,045 312,991 Allowances for expected credit losses on accrued
receivables (note 10 c) (4,255) (2,694)
Total 780,030 592,875
b) Other assets
March 31, 2021 December 31, 2020
'000 RON '000 RON
Advances paid to suppliers 14,870 18,374
Joint operation receivables 4,211 2,384
Other receivables 53,472 64,471 Allowance for expected credit losses for other
receivables (note 10 c) (29,168) (28,981)
Other debtors 50,258 50,079 Allowance for expected credit losses for other debtors
(note 10 c) (49,720) (49,016)
Prepayments 18,599 5,808
VAT not yet due 7,186 4,898
Other taxes receivable 6 6
Total 69,714 68,023
S.N.G.N. ROMGAZ S.A. GROUP
NOTES TO THE CONDENSED CONSOLIDATED INTERIM FINANCIAL STATEMENTS FOR THE THREE-MONTH PERIOD ENDED MARCH 31, 2021
The accompanying notes form an integrant part of these financial statements. This is a free translation of the original Romanian version.
12
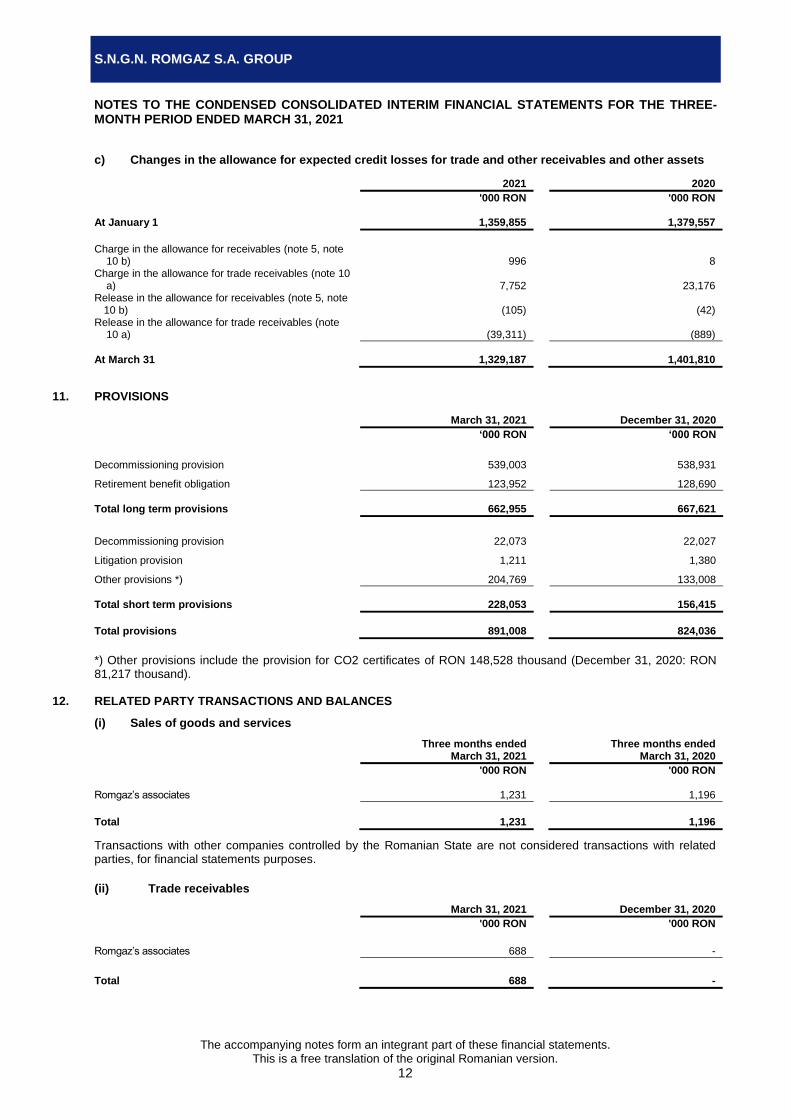
c) Changes in the allowance for expected credit losses for trade and other receivables and other assets
2021 2020
'000 RON '000 RON
At January 1 1,359,855 1,379,557
Charge in the allowance for receivables (note 5, note
10 b) 996 8 Charge in the allowance for trade receivables (note 10
a) 7,752 23,176 Release in the allowance for receivables (note 5, note
10 b) (105) (42) Release in the allowance for trade receivables (note
10 a) (39,311) (889)
At March 31 1,329,187 1,401,810
11. PROVISIONS
March 31, 2021 December 31, 2020
‘000 RON ‘000 RON
Decommissioning provision 539,003 538,931
Retirement benefit obligation 123,952 128,690
Total long term provisions 662,955 667,621
Decommissioning provision 22,073 22,027
Litigation provision 1,211 1,380
Other provisions *) 204,769 133,008
Total short term provisions 228,053 156,415
Total provisions 891,008 824,036
*) Other provisions include the provision for CO2 certificates of RON 148,528 thousand (December 31, 2020: RON 81,217 thousand).
12. RELATED PARTY TRANSACTIONS AND BALANCES
(i) Sales of goods and services
Three months ended March 31, 2021
Three months ended March 31, 2020
'000 RON '000 RON
Romgaz’s associates 1,231 1,196
Total 1,231 1,196
Transactions with other companies controlled by the Romanian State are not considered transactions with related parties, for financial statements purposes.
(ii) Trade receivables
March 31, 2021 December 31, 2020
'000 RON '000 RON
Romgaz’s associates 688 -
Total 688 -
S.N.G.N. ROMGAZ S.A. GROUP
NOTES TO THE CONDENSED CONSOLIDATED INTERIM FINANCIAL STATEMENTS FOR THE THREE-MONTH PERIOD ENDED MARCH 31, 2021
The accompanying notes form an integrant part of these financial statements. This is a free translation of the original Romanian version.
13
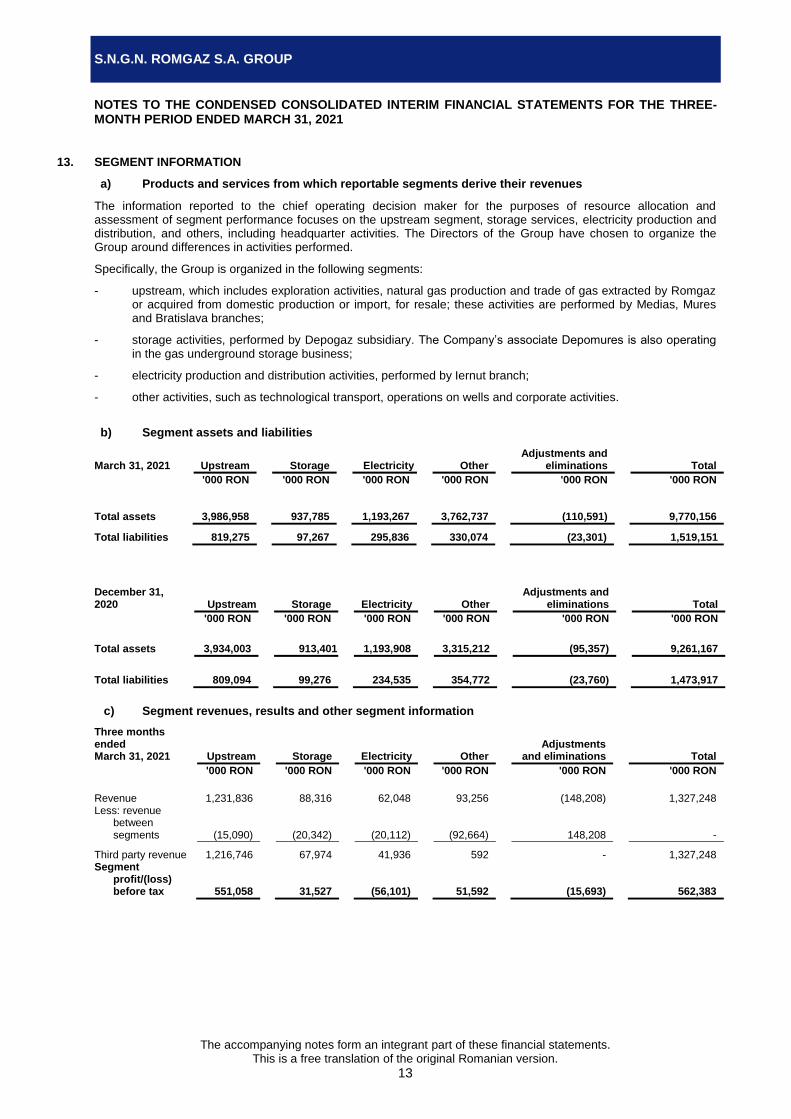
13. SEGMENT INFORMATION
a) Products and services from which reportable segments derive their revenues
The information reported to the chief operating decision maker for the purposes of resource allocation and assessment of segment performance focuses on the upstream segment, storage services, electricity production and distribution, and others, including headquarter activities. The Directors of the Group have chosen to organize the Group around differences in activities performed.
Specifically, the Group is organized in the following segments:
- upstream, which includes exploration activities, natural gas production and trade of gas extracted by Romgaz or acquired from domestic production or import, for resale; these activities are performed by Medias, Mures and Bratislava branches;
- storage activities, performed by Depogaz subsidiary. The Company’s associate Depomures is also operating in the gas underground storage business;
- electricity production and distribution activities, performed by Iernut branch;
- other activities, such as technological transport, operations on wells and corporate activities.
b) Segment assets and liabilities
March 31, 2021 Upstream
Storage Electricity
Other Adjustments and
eliminations Total
'000 RON
'000 RON '000 RON
'000 RON '000 RON '000 RON
Total assets 3,986,958 937,785 1,193,267 3,762,737 (110,591) 9,770,156
Total liabilities 819,275 97,267 295,836 330,074 (23,301) 1,519,151
December 31, 2020 Upstream
Storage Electricity
Other
Adjustments and eliminations Total
'000 RON
'000 RON '000 RON
'000 RON '000 RON '000 RON
Total assets 3,934,003
913,401 1,193,908
3,315,212 (95,357) 9,261,167
Total liabilities 809,094 99,276 234,535 354,772 (23,760) 1,473,917
c) Segment revenues, results and other segment information
Three months ended March 31, 2021 Upstream
Storage Electricity
Other
Adjustments and eliminations
Total
'000 RON
'000 RON '000 RON
'000 RON
'000 RON
'000 RON
Revenue 1,231,836 88,316 62,048 93,256 (148,208) 1,327,248 Less: revenue
between segments (15,090) (20,342) (20,112) (92,664) 148,208 -
Third party revenue 1,216,746 67,974 41,936 592 - 1,327,248 Segment
profit/(loss) before tax 551,058 31,527 (56,101) 51,592 (15,693) 562,383
S.N.G.N. ROMGAZ S.A. GROUP
NOTES TO THE CONDENSED CONSOLIDATED INTERIM FINANCIAL STATEMENTS FOR THE THREE-MONTH PERIOD ENDED MARCH 31, 2021
The accompanying notes form an integrant part of these financial statements. This is a free translation of the original Romanian version.
14
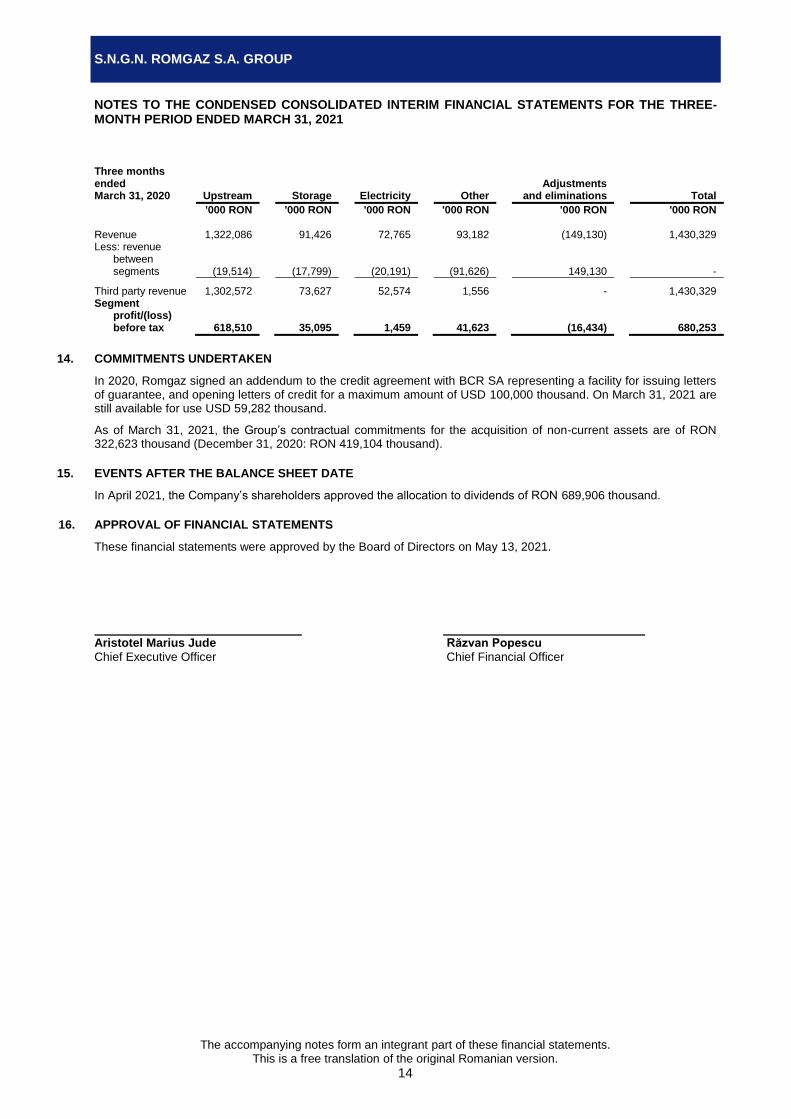
Three months ended March 31, 2020 Upstream
Storage Electricity
Other
Adjustments and eliminations
Total
'000 RON
'000 RON '000 RON
'000 RON
'000 RON
'000 RON
Revenue 1,322,086 91,426 72,765 93,182 (149,130) 1,430,329 Less: revenue
between segments (19,514) (17,799) (20,191) (91,626) 149,130 -
Third party revenue 1,302,572 73,627 52,574 1,556 - 1,430,329 Segment
profit/(loss) before tax 618,510 35,095 1,459 41,623 (16,434) 680,253
14. COMMITMENTS UNDERTAKEN
In 2020, Romgaz signed an addendum to the credit agreement with BCR SA representing a facility for issuing letters of guarantee, and opening letters of credit for a maximum amount of USD 100,000 thousand. On March 31, 2021 are still available for use USD 59,282 thousand.
As of March 31, 2021, the Group’s contractual commitments for the acquisition of non-current assets are of RON 322,623 thousand (December 31, 2020: RON 419,104 thousand).
15. EVENTS AFTER THE BALANCE SHEET DATE
In April 2021, the Company’s shareholders approved the allocation to dividends of RON 689,906 thousand.
16. APPROVAL OF FINANCIAL STATEMENTS
These financial statements were approved by the Board of Directors on May 13, 2021. Aristotel Marius Jude Răzvan Popescu
Chief Executive Officer Chief Financial Officer