Quarterly Report filed with the Japanese government ... · Panasonic Group's actual results,...
44
[English summary with full translation of consolidated financial information] Quarterly Report filed with the Japanese government pursuant to the Financial Instruments and Exchange Law of Japan For the nine months ended December 31, 2014 Panasonic Corporation Osaka, Japan
Transcript of Quarterly Report filed with the Japanese government ... · Panasonic Group's actual results,...

[English summary with full translation of consolidated financial information]
Quarterly Report filed with the Japanese government pursuant to the Financial Instruments and Exchange
Law of Japan
For the nine months ended
December 31, 2014
Panasonic Corporation
Osaka, Japan

CONTENTS
Page
Disclaimer Regarding Forward-Looking Statements ------------------------------------------------------------------------------------------
Ⅰ Corporate Information -----------------------------------------------------------------------------------------------------------------------
(1) Consolidated Financial Summary -----------------------------------------------------------------------------------------------------
(2) Principal Businesses -------------------------------------------------------------------------------------------------------------------
Ⅱ The Business Overview ----------------------------------------------------------------------------------------------------------------------
(1) Operating Results -----------------------------------------------------------------------------------------------------------------------
(2) Operating Results by Segment --------------------------------------------------------------------------------------------------------
(3) Assets, Liabilities and Equity ---------------------------------------------------------------------------------------------------------
(4) Cash Flows ------------------------------------------------------------------------------------------------------------------------------
(5) Research and Development -----------------------------------------------------------------------------------------------------------
(6) Capital Investment ---------------------------------------------------------------------------------------------------------------------
(7) Depreciation ----------------------------------------------------------------------------------------------------------------------------
(8) Number of Employees ----------------------------------------------------------------------------------------------------------------
(9) New Accounting Pronouncements --------------------------------------------------------------------------------------------------
(10) Risk Factors ----------------------------------------------------------------------------------------------------------------------------
(11) Others -----------------------------------------------------------------------------------------------------------------------------------
Ⅲ Shares and Shareholders ---------------------------------------------------------------------------------------------------------------------
(1) Shares of Common Stock Issued ----------------------------------------------------------------------------------------------------
(2) Amount of Common Stock (Stated Capital) ----------------------------------------------------------------------------------------
Ⅳ Financial Statements -------------------------------------------------------------------------------------------------------------------------
1
2
2
3
4
4
5
6
6
7
7
7
7
7
7
7
8
8
8
9
Disclaimer Regarding Forward-Looking Statements
This quarterly report includes forward-looking statements (that include those within the meaning of Section 21E of the U.S. Securities
Exchange Act of 1934) about Panasonic and its Group companies (the Panasonic Group). To the extent that statements in this
quarterly report do not relate to historical or current facts, they constitute forward-looking statements. These forward-looking
statements are based on the current assumptions and beliefs of the Panasonic Group in light of the information currently available to it,
and involve known and unknown risks, uncertainties and other factors. Such risks, uncertainties and other factors may cause the
Panasonic Group's actual results, performance, achievements or financial position to be materially different from any future results,
performance, achievements or financial position expressed or implied by these forward-looking statements. Panasonic undertakes no
obligation to publicly update any forward-looking statements after the date of this this quarterly report. Investors are advised to
consult any further disclosures by Panasonic in its subsequent filings under the Financial Instrument and Exchange Act of Japan (the
FIEA) and other publicly disclosed documents.
The risks, uncertainties and other factors referred to above include, but are not limited to, economic conditions, particularly consumer
spending and corporate capital expenditures in the Americas, Europe, Japan, China and other Asian countries; volatility in demand for
electronic equipment and components from business and industrial customers, as well as consumers in many product and geographical
markets; the possibility that excessive currency rate fluctuations of the U.S. dollar, the Euro, the Chinese yuan and other currencies
against the yen may adversely affect costs and prices of Panasonic’s products and services and certain other transactions that are
denominated in these foreign currencies; the possibility of the Panasonic Group incurring additional costs of raising funds, because of
changes in the fund raising environment; the possibility of the Panasonic Group not being able to respond to rapid technological
changes and changing consumer preferences with timely and cost-effective introductions of new products in markets that are highly
competitive in terms of both price and technology; the possibility of not achieving expected results on the alliances or mergers and
acquisitions; the possibility of not being able to achieve its business objectives through joint ventures and other collaborative
agreements with other companies, including due to the pressure of price reduction exceeding that which can be achieved by its effort
and decrease in demand for products from business partners which Panasonic highly depends on in BtoB business areas; the
possibility of the Panasonic Group not being able to maintain competitive strength in many product and geographical areas; the
possibility of incurring expenses resulting from any defects in products or services of the Panasonic Group; the possibility that the
Panasonic Group may face intellectual property infringement claims by third parties; current and potential, direct and indirect
restrictions imposed by other countries over trade, manufacturing, labor and operations; fluctuations in market prices of securities and
other assets in which the Panasonic Group has holdings or changes in valuation of long-lived assets, including property, plant and
equipment and goodwill, deferred tax assets and uncertain tax positions; future changes or revisions to accounting policies or
accounting rules; as well as natural disasters including earthquakes, prevalence of infectious diseases throughout the world, disruption
of supply chain and other events that may negatively impact business activities of the Panasonic Group. The factors listed above are
not all-inclusive and further information is contained in the most recent English translated version of Panasonic’s securities reports
under the FIEA and any other documents which are disclosed on its website.
- 1 -

I Corporate Information
(1) Consolidated Financial Summary
Yen (millions), except per share amounts
Nine months ended December 31, 2014
Nine months ended December 31, 2013
Year ended March 31, 2014
Net sales 5,719,333 5,679,811 7,736,541
Income before income taxes 208,063 307,037 206,225
Net income attributable to Panasonic Corporation 140,420 243,014 120,442 Comprehensive income attributable to Panasonic Corporation 387,877 385,083 296,972
Total Panasonic Corporation shareholders' equity 1,775,005 1,636,642 1,548,152
Total equity 1,945,594 1,684,934 1,586,438
Total assets 5,617,543 5,476,647 5,212,994
Net income per share attributable to Panasonic Corporation common shareholders, basic (yen) 60.75 105.13
52.10
Net income per share attributable to Panasonic Corporation common shareholders, diluted (yen) 60.74 -
-
Panasonic Corporation shareholders' equity / total assets (%) 31.6 29.9 29.7 Net cash provided by operating activities 369,008 355,155 581,950 Net cash provided by (used in) investing activities (107,637) (76,964) 12,128 Net cash used in financing activities (122,798) (302,624) (532,315)
Cash and cash equivalents at end of period 815,604 520,151 592,467
Three months ended December 31, 2014
Three months ended December 31, 2013
Net sales 1,996,450
1,973,491
Net income attributable to Panasonic Corporation 59,487
73,680
Net income per share attributable to Panasonic Corporation common shareholders, Basic (yen)
25.74
31.87
Notes: 1. The Company's consolidated financial statements are prepared in conformity with U.S. generally accepted accounting
principles (U.S. GAAP).
2. Diluted net income per share attributable to Panasonic Corporation common shareholders for nine months ended
December 31, 2013 and for year ended March 31, 2014 have been omitted because the Company did not have
potential dilutive common shares that were outstanding for fiscal 2014.
- 2 -

(2) Principal Businesses
The Panasonic Group is comprised primarily of the parent Panasonic Corporation and 472 consolidated subsidiaries in and
outside of Japan, operating in close cooperation with each other. As a comprehensive electronics manufacturer, Panasonic is
engaged in production, sales and service activities in a broad array of business areas.
Panasonic supplies a spectrum of electric/electronic equipment and related products, which are categorized into the following
five segments: Appliances, Eco Solutions, AVC Networks, Automotive & Industrial Systems, and Other.
During the nine months ended December 31, 2014, there were changes in principal businesses and major affiliated companies as
follows.
Appliances:
As of April 1, 2014, certain businesses such as flat panel TVs, home audio equipment and video equipment were transferred to
Appliances from AVC Networks. As of July 1, 2014, Panasonic Cycle Technology Co., Ltd. was transferred to Appliances from
Automotive & Industrial Systems.
Automotive & Industrial Systems:
As of April 1, 2014, Panasonic transferred its business relating to semiconductor wafer manufacturing process to TowerJazz
Panasonic Semiconductor Co., Ltd. ("TPSC") which was a wholly-owned subsidiary of the Company, and transferred the 51% of
shares in TPSC to Tower Semiconductor Ltd. in Israel.
As of June 1, 2014, Panasonic transferred its business relating to the development, manufacture and sales of semiconductor, etc.
to Panasonic Semiconductor Solutions Co., Ltd. ("PSCS") which is a consolidated subsidiary of the Company. Also, PSCS
absorbed Panasonic Industrial Devices Discrete Semiconductor Co., Ltd. and Panasonic Industrial Devices Optical
Semiconductor Co., Ltd., both of which were consolidated subsidiaries of the Company.
As of June 2, 2014, Panasonic transferred all shares in three consolidated subsidiaries of the Company whose factories operate
semiconductor assembly lines in Singapore, Indonesia and Malaysia to UTAC Manufacturing Services Ltd., a subsidiary of
UTAC Holdings Ltd. in Singapore.
As of July 1, 2014, Panasonic Liquid Crystal Display Co., Ltd. was transferred to Automotive & Industrial Systems from AVC
Networks.
The Company's consolidated financial statements have been prepared in conformity with U.S. GAAP, and the scope of affiliates
are disclosed based on the definition of those accounting principles. The same applies to “Ⅱ The Business Overview.”
- 3 -
Ⅱ The Business Overview
(1) Operating Results
During the nine months ended December 31, 2014 under review, the economy slowed down in China and some ASEAN
countries and was stagnant in most European countries. Meantime, U.S. employment statistics and consumer spending were
stable and the signs of improvement from recent weak economy were seen in Japan.
Under such business circumstances, in fiscal 2015, the second year of the mid-term management plan “Cross-Value Innovation
2015 (CV2015),” Panasonic has been promoting the initiatives to consolidate a foundation to achieve CV2015 and to set growth
strategy for a ‘New Panasonic’ in fiscal 2019.
As one of the initiatives during the third quarter, regarding the automotive battery business, the Company established Panasonic
Energy Corporation of North America, a new manufacturing company of cylindrical lithium-ion battery cells at the Tesla
Gigafactory of Tesla Motors (U.S.) Regarding the consumer electronics business, the company launched ‘J Concept’ series
products in late October 2014, which have been received well. These products are specifically developed emphasizing on
functions and design to propose high-quality living in harmony with the Japanese lifestyle, targeting at people in their 50’s and
60’s in Japan.
Consolidated group sales for nine months ended December 31, 2014 increased by 1% to 5,719.3 billion yen from 5,679.8 billion
yen in the same period of fiscal 2014. Demand in Japan overall decreased in housing-related and consumer electronic businesses
following the surge before the consumption tax hike in April 2014. Meantime, this negative effect was offset due to some effect
of demand surge before the tax hike carried over in the first quarter. Sales of solar panels for homes continued to be stable in
Japan, and demand of automotive-related business steadily increased in its global market. Yen depreciation also contributed the
overseas sales increase.
The Company’s operating profit* for the nine months increased by 10% to 290.3 billion yen, from 263.2 billion yen a year ago,
due to fixed cost reduction including the business restructuring effect despite sales decrease in real terms, which exclude the
effect of foreign exchange. Pre-tax income and net income attributable to Panasonic Corporation decreased by 32% to 208.1
billion yen from 307.0 billion yen, and decreased by 42% to 140.4 billion yen from 243.0 billion yen respectively due mainly to
one-off gain from pension scheme change and some one-time capital gains in other income a year ago, and the expense relating
to prevent further accident of residential water heating systems included in other deductions in the nine months ended December
31, 2014.
* In order to be consistent with generally accepted financial reporting practices in Japan, operating profit, a non-GAAP measure, is presented as net sales
less cost of sales and selling, general and administrative expenses. The Company believes that this is useful to investors in comparing the Company's
financial results with those of other Japanese companies.
- 4 -

(2) Operating Results by Segment
Certain businesses were transferred among segments on April 1, 2014 and July 1, 2014. Accordingly, the figures for segment
information in fiscal 2014 have been reclassified to conform to the presentation for July 1, 2014.
The Company’s nine-month consolidated sales and profits by segment comparing with previous year’s are summarized as
follows:
Appliances
Sales increased by 1% to 1,380.7 billion yen, compared with 1,361.3 billion yen a year ago due mainly to favorable sales in
home appliances, cold chain equipment and device businesses including motors, despite sales decrease in TVs.
Segment profit increased by 68% to 44.6 billion yen, compared with 26.6 billion yen a year ago due mainly to improved
profitability by streamlining in air conditioner business and profit increase in motors.
Eco Solutions
Sales increased by 2% to 1,224.3 billion yen from 1,202.9 billion yen a year ago. In Japan, sales in housing systems decreased
due to weakening demand in housing market after the consumption tax hike. Meantime, sales in housing solar panels and LED
lighting increased. Overseas sales increased due to newly-consolidated VIKO, a Turkish company, as well as sales growth in
strategic regions such as India.
Segment profit increased by 7% to 75.7 billion yen from 70.7 billion yen a year ago due mainly to sales increase in solar
business and streamlining initiatives.
AVC Networks
Sales decreased by 1% to 827.8 billion yen from 832.9 billion yen a year ago. Sales decreased due mainly to exit from
unprofitable businesses and business contraction including plasma display panels and DSCs, though sales in three month ended
December 31, 2014 increased due mainly to positive effect from yen depreciation.
Segment profit significantly increased by 134% to 21.6 billion yen from 9.2 billion yen a year ago due mainly to sales increase
of stable BtoB business and benefits from restructuring of challenging business.
Automotive & Industrial Systems
Sales increased by 2% to 2,079.1 billion yen from 2,039.4 billion yen a year ago due mainly to favorable sales for automotive-
related business in Automotive Infotainment Systems Business Division and electronic component mounting equipment,
offsetting sales decreases from business termination and transfers. The positive effect from yen depreciation also contributed to
increase in sales.
Segment profit increased by 11% to 80.3 billion yen from 72.4 billion yen a year ago due mainly to streamlining initiatives and
benefit from the restructuring of challenging businesses.
Other
Sales decreased by 18% to 447.2 billion yen from 548.0 billion yen a year ago due mainly to the transfer of the healthcare
business at the end of fiscal 2014.
Segment profit significantly decreased by 85% to 1.5 billion yen compared with 10.3 billion yen a year ago.
- 5 -

(3) Assets, Liabilities and Equity
The Company’s consolidated total assets as of December 31, 2014 increased by 404.5 billion yen to 5,617.5 billion yen from the
end of fiscal 2014 due mainly to an increase in cash and cash equivalents and inventories as well as yen depreciation.
The Company’s consolidated total liabilities as of December 31, 2014 increased by 45.4 billion yen to 3,671.9 billion yen from
the end of fiscal 2014. In real terms excluding the effect of foreign exchanges, the Company’s consolidated total liabilities
decreased due mainly to repayments of unsecured straight bonds.
Panasonic Corporation shareholders’ equity increased by 226.9 billion yen to 1,775.0 billion yen from March 31, 2014 due
mainly to recording of net income attributable to Panasonic Corporation and an improvement in accumulated other
comprehensive income (loss) from yen depreciation, despite a decrease in capital surplus accompanied by the acquisition of
additional interests of its subsidiaries. Adding noncontrolling interests to Panasonic Corporation shareholders’ equity, total
equity was 1,945.6 billion yen.
(4) Cash Flows
Cash flows from operating activities
Net cash provided by operating activities for nine months ended December 31, 2014 amounted to 369.0 billion yen increased by
13.9 billion yen from a year ago due mainly to an improvement in working capital including a decrease in trade receivables.
Cash flows from investing activities
Net cash used in investing activities amounted to 107.6 billion yen increased by 30.7 billion yen from a year ago due mainly to
decrease in proceeds from disposals of investments in equity and increase in capital expenditures.
Free cash flow (net cash from operating activities plus net cash from investing activities) amounted to 261.4 billion yen
decreased by 16.8 billion yen from a year ago.
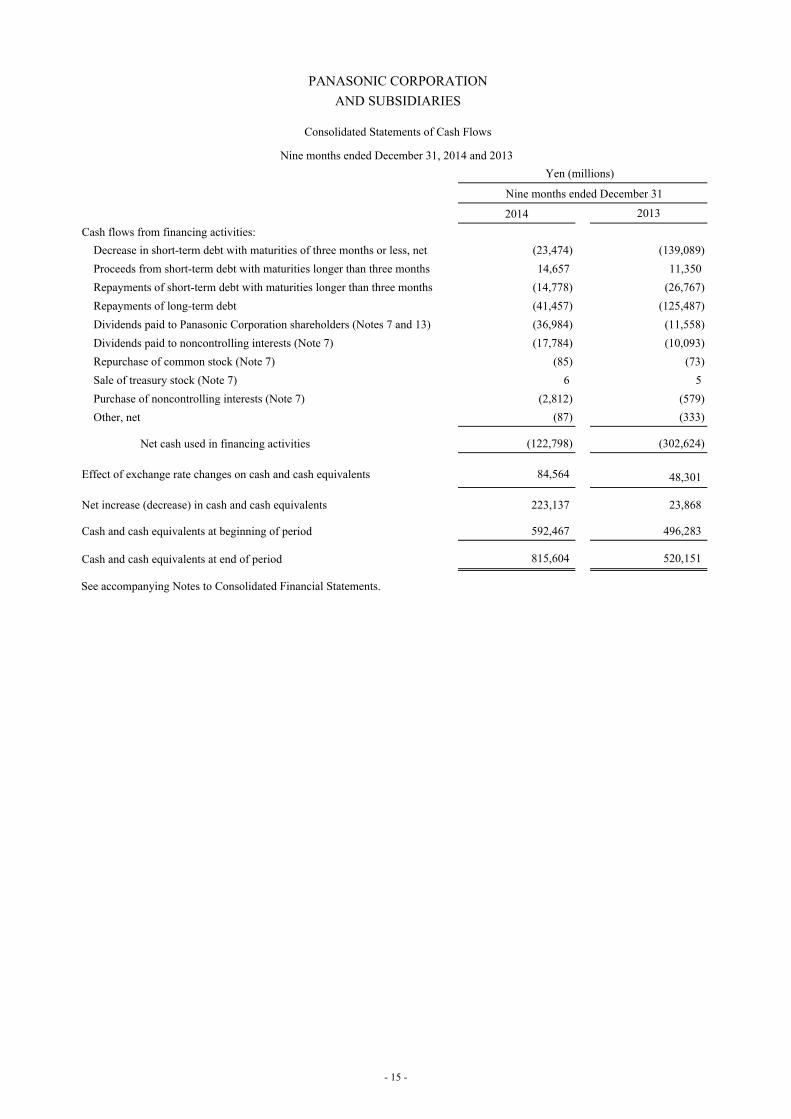
Cash flows from financing activities
Net cash used in financing activities amounted to 122.8 billion yen decreased by 179.8 billion yen from a year ago due mainly to
a decrease in repayment of the interest-bearing debt despite an increase in dividend payment.
Taking into consideration exchange rate fluctuations, cash and cash equivalents totaled 815.6 billion yen as of December 31,
2014 increasing 223.1 billion yen compared with the end of the last fiscal year.
- 6 -

(5) Research and Development
Panasonic's R&D expenditures for the nine months ended December 31, 2014 totaled 344.6 billion yen, down 1% from a year
ago. There were no significant changes in R&D activities for the period.
(6) Capital Investment
Panasonic's capital investment (tangible assets) for the nine months ended December 31, 2014 totaled 150.7 billion yen, up 5%
from a year ago.
(7) Depreciation
Panasonic's depreciation (tangible assets) for the nine months ended December 31, 2014 totaled 176.0 billion yen, down 16%
from a year ago.
(8) Number of Employees
Number of employees at the end of the third quarter of fiscal 2015 was 260,911, a decrease of 10,878, compared with the end of
the fiscal 2014.
(9) New Accounting Pronouncements
In May 2014, the FASB issued Accounting Standards Update (ASU) No. 2014-09, “Revenue from Contracts with Customers,”
which requires an entity to recognize the amount of revenue to which it expects to be entitled for the transfer of promised goods
or services to customers. The ASU will replace most existing revenue recognition guidance in U.S. GAAP when it becomes
effective. The new standard is effective for the Company on April, 2017. Early application is not permitted. The standard
permits the use of either the retrospective or cumulative effect transition method. The Company is evaluating the effect that ASU
2014-09 will have on its consolidated financial statements and related disclosures. The Company has not yet selected a transition
method nor has it determined the effect of the standard on its ongoing financial reporting.
(10) Risk Factors
There were no risks newly identified during the nine months ended December 31, 2014.
During the nine months ended December 31, 2014, there were no significant changes with regard to the "Risk Factors" stated in
the annual securities report of the prior fiscal year.
(11) Other
The Company resolved, at the Board of Directors meeting held on February 3, 2015, to make Panasonic a wholly-owning parent
company and Panasonic Information Systems Co., Ltd. (PISC) a wholly-owned subsidiary by the way of share exchange. On the
same date, the share exchange agreement was concluded between both companies. The share exchange is scheduled to be
implemented after the approval at ordinary general meeting of PISC, which is planned to be held in June 2015. Shares of PISC
are scheduled to be delisted as of July 29, 2015, which is prior to the effective date (August 1, 2015 (scheduled)) of the share
exchange.
- 7 -

Ⅲ Shares and Shareholders
(1) Shares of Common Stock Issued as of December 31, 2014: 2,453,053,497 shares
The common stock of the Company is listed on the Tokyo and Nagoya stock exchanges in Japan.
(2) Amount of Common Stock (Stated Capital) as of December 31, 2014: 258,740 million yen
- 8 -

CONTENTS
Ⅳ Financial Statements
Index of Consolidated Financial Statements of Panasonic Corporation and Subsidiaries:
Page
Consolidated Balance Sheets as of December 31 and March 31, 2014 ……………………………………………………… 10
Consolidated Statements of Income and Consolidated Statements of Comprehensive Income
for the nine and three months ended December 31, 2014 and 2013…………………………………………………………
12
Consolidated Statements of Cash Flows for the nine months ended December 31, 2014 and 2013………………………… 14
Notes to Consolidated Financial Statements ………………………………………………………………………………… 16
- 9 -

PANASONIC CORPORATION
AND SUBSIDIARIES
Consolidated Balance Sheets
December 31 and March 31, 2014
Yen (millions)
Assets December 31, 2014 March 31, 2014 Current assets:
Cash and cash equivalents 815,604 592,467
Time deposits 8,631 -
Trade receivables:
Notes 90,501 73,458
Accounts 966,164 958,451
Allowance for doubtful receivables (26,582) (24,476)
Net trade receivables 1,030,083 1,007,433
Inventories (Note 2) 844,941 750,681
Other current assets 373,495 303,411
Total current assets 3,072,754 2,653,992 Investments and advances (Note 3) 295,641 271,804 Property, plant and equipment (Note 5):
Land 276,283 283,305
Buildings 1,428,910 1,453,550
Machinery and equipment 2,828,735 2,728,925
Construction in progress 41,851 44,220
4,575,779 4,510,000
Less accumulated depreciation 3,177,476 3,084,551
Net property, plant and equipment 1,398,303 1,425,449 Other assets (Note 1):
Goodwill 474,933 473,377
Intangible assets (Note 5) 191,984 203,591
Other assets 183,928 184,781
Total other assets 850,845 861,749
5,617,543 5,212,994
See accompanying Notes to Consolidated Financial Statements.
- 10 -

PANASONIC CORPORATION
AND SUBSIDIARIES
Consolidated Balance Sheets
December 31 and March 31, 2014
Yen (millions)
Liabilities and Equity December 31, 2014 March 31, 2014 Current liabilities:
Short-term debt, including current portion of long-term debt
67,479 84,738
Trade payables:
Notes 239,762 200,363
Accounts 753,603 736,652
Total trade payables 993,365 937,015
Accrued income taxes 46,627 40,454
Accrued payroll 156,297 217,246
Other accrued expenses 880,789 799,959
Deposits and advances from customers 95,727 75,520
Employees’ deposits 4,985 5,146
Other current liabilities 327,483 277,781
Total current liabilities 2,572,752 2,437,859 Noncurrent liabilities:
Long-term debt 515,157 557,374
Retirement and severance benefits 387,606 430,701
Other liabilities 196,434 200,622
Total noncurrent liabilities 1,099,197 1,188,697 Equity (Note 7):
Panasonic Corporation shareholders’ equity:
Common stock : Authorized - 4,950,000,000 shares Issued - 2,453,053,497 shares
258,740
258,740 Capital surplus 985,540 1,109,501
Retained earnings (Note 13) 982,177 878,742
Accumulated other comprehensive income (loss) (Note 8):
Cumulative translation adjustments 53,103 (167,219) Unrealized holding gains of available-for-sale
securities (Note 3)
14,262
6,027 Unrealized gains (losses) of derivative instruments 1,128 (237)
Pension liability adjustments (272,735) (290,270)
(204,242) (451,699) Treasury stock, at cost:
141,557,544 shares (141,496,296 shares as of March 31, 2014) (247,210) (247,132)
Total Panasonic Corporation shareholders’ equity 1,775,005 1,548,152
Noncontrolling interests 170,589 38,286
Total equity 1,945,594 1,586,438 Commitments and contingent liabilities (Notes 4 and 11)
5,617,543 5,212,994
See accompanying Notes to Consolidated Financial Statements.
- 11 -

PANASONIC CORPORATION
AND SUBSIDIARIES
Consolidated Statements of Income and Consolidated Statements of Comprehensive Income
Nine months ended December 31, 2014 and 2013
Consolidated Statements of Income
Yen (millions)
Nine months ended December 31
2014
2013
Revenues, costs and expenses:
Net sales 5,719,333 5,679,811
Cost of sales (Note 8) (4,112,807) (4,135,250)
Selling, general and administrative expenses (1,316,253) (1,281,385)
Interest income 10,190 7,492
Dividends received 1,411 1,948
Other income (Notes 8 and 9) 33,245 133,518
Interest expense (13,741) (16,374)
Impairment losses of long-lived assets (Note 5) (7,248) (32,176)
Other deductions (Notes 8 and 9) (106,067) (50,547)
Income before income taxes (Note 9) 208,063 307,037 Provision for income taxes 60,388 61,704 Equity in earnings of associated companies 7,988 5,300
Net income 155,663 250,633
Less net income attributable to noncontrolling interests 15,243 7,619
Net income attributable to Panasonic Corporation (Note 7) 140,420 243,014
Yen Net income per share attributable to Panasonic Corporation common shareholders :
Basic 60.75 105.13
Diluted 60.74 -
Consolidated Statements of Comprehensive Income
Yen (millions)
Nine months ended December 31
2014
2013
Net income 155,663 250,633
Other comprehensive income (loss), net of tax (Note 8)
Translation adjustments 234,665 172,967
Unrealized holding gains of available-for-sale securities 8,255 3,500
Unrealized holding gains of derivative instruments 1,346 3,057
Pension liability adjustments 17,357 (27,131)
261,623 152,393
Comprehensive income (Note 7) 417,286 403,026
Comprehensive income attributable to noncontrolling interests 29,409 17,943
Comprehensive income attributable to Panasonic Corporation 387,877 385,083 See accompanying Notes to Consolidated Financial Statements.
- 12 -

PANASONIC CORPORATION
AND SUBSIDIARIES
Consolidated Statements of Income and Consolidated Statements of Comprehensive Income
Three months ended December 31, 2014 and 2013
Consolidated Statements of Income
Yen (millions)
Three months ended December 31
2014
2013
Revenues, costs and expenses:
Net sales 1,996,450 1,973,491
Cost of sales (Note 8) (1,429,487) (1,415,814)
Selling, general and administrative expenses (453,669) (441,090)
Interest income 3,960 2,661
Dividends received 175 438
Other income (Notes 8 and 9) 15,620 25,443
Interest expense (4,320) (4,490)
Impairment losses of long-lived assets(Note 5) (3,643) (26,011)
Other deductions (Notes 8 and 9) (38,925) (14,996)
Income before income taxes 86,161 99,632 Provision for income taxes 23,477 24,378 Equity in earnings of associated companies 2,850 2,204
Net income 65,534 77,458
Less net income attributable to noncontrolling interests 6,047 3,778
Net income attributable to Panasonic Corporation 59,487 73,680
Yen Net income per share attributable to Panasonic Corporation common shareholders :
Basic 25.74 31.87
Diluted 25.73 -
Consolidated Statements of Comprehensive Income
Yen (millions)
Three months ended December 31
2014
2013
Net income 65,534 77,458
Other comprehensive income (loss), net of tax (Note 8)
Translation adjustments 149,262 117,962
Unrealized holding gains (losses) of available-for-sale securities 674 (9,021)
Unrealized holding gains (losses) of derivative instruments (104) 1,025
Pension liability adjustments 4,159 3,943
153,991 113,909
Comprehensive income 219,525 191,367
Comprehensive income attributable to noncontrolling interests 15,323 10,075
Comprehensive income attributable to Panasonic Corporation 204,202 181,292 See accompanying Notes to Consolidated Financial Statements.
- 13 -

PANASONIC CORPORATION
AND SUBSIDIARIES
Consolidated Statements of Cash Flows
Nine months ended December 31, 2014 and 2013
Yen (millions)
Nine months ended December 31
2014 2013
Cash flows from operating activities:
Net income 155,663 250,633
Adjustments to reconcile net income to net cash provided by operating activities:
Depreciation and amortization 209,748 249,724
Net gain on sale of investments (7,420) (25,559)
Provision for doubtful receivables 2,403 4,131
Deferred income taxes (9,029) (2,553)
Write-down of investment securities (Note 9) 36 45
Impairment losses on long-lived assets (Note 5) 7,248 32,176
Cash effects of changes in:
Trade receivables 45,802 (17,346)
Inventories (60,441) (20,146)
Other current assets 2,171 14,204
Trade payables 22,581 15,908
Accrued income taxes 285 10,995
Accrued expenses and other current liabilities 12,129 (46,724)
Retirement and severance benefits (28,694) (124,628)
Deposits and advances from customers 18,501 15,934
Other, net (1,975) (1,639)
Net cash provided by operating activities 369,008 355,155
Cash flows from investing activities:
Proceeds from disposition of investments and advances 41,390 57,207
Increase in investments and advances (6,363) (6,431)
Capital expenditures (156,049) (141,911)
Proceeds from disposals of property, plant and equipment 25,796 27,660
Increase (decrease) in time deposits, net (8,631) 1,674
Proceeds from sales of consolidated subsidiaries 21,589 -
Other, net (25,369) (15,163)
Net cash used in investing activities (107,637) (76,964)
(Continued)
- 14 -
PANASONIC CORPORATION
AND SUBSIDIARIES
Consolidated Statements of Cash Flows
Nine months ended December 31, 2014 and 2013
Yen (millions)
Nine months ended December 31
2014 2013
Cash flows from financing activities:
Decrease in short-term debt with maturities of three months or less, net (23,474) (139,089)
Proceeds from short-term debt with maturities longer than three months 14,657 11,350
Repayments of short-term debt with maturities longer than three months (14,778) (26,767)
Repayments of long-term debt (41,457) (125,487)
Dividends paid to Panasonic Corporation shareholders (Notes 7 and 13) (36,984) (11,558)
Dividends paid to noncontrolling interests (Note 7) (17,784) (10,093)
Repurchase of common stock (Note 7) (85) (73)
Sale of treasury stock (Note 7) 6 5
Purchase of noncontrolling interests (Note 7) (2,812) (579)
Other, net (87) (333)
Net cash used in financing activities (122,798) (302,624)
Effect of exchange rate changes on cash and cash equivalents 84,564
48,301
Net increase (decrease) in cash and cash equivalents 223,137 23,868 Cash and cash equivalents at beginning of period 592,467 496,283 Cash and cash equivalents at end of period 815,604 520,151 See accompanying Notes to Consolidated Financial Statements.
- 15 -

PANASONIC CORPORATION
AND SUBSIDIARIES
Notes to Consolidated Financial Statements
(1) Summary of Significant Accounting Policies
(a) Basis of Presentation of Consolidated Financial Statements
The Company and its domestic subsidiaries maintain their books of account in conformity with financial accounting
standards of Japan, and its foreign subsidiaries in conformity with those of the countries of their domicile.
The consolidated financial statements presented herein have been prepared in a manner that reflects adjustments which are
necessary to conform with U.S. generally accepted accounting principles (U.S. GAAP).
(b) Principles of Consolidation
The consolidated financial statements include the accounts of the Company and its majority-owned, controlled subsidiaries.
The Company also consolidates entities in which controlling interest exists through variable interests in accordance with the
provisions of Financial Accounting Standards Board (FASB) Accounting Standards Codification (ASC) 810,
“Consolidation.” All significant intercompany balances and transactions have been eliminated on consolidation.
The equity method is used to account for investments in associated companies in which the Company exerts significant
influence, generally having a 20% to 50% voting interest, and corporate joint ventures. These investments are included in
“Investments and advances” in the consolidated balance sheets.
The Company has 472 consolidated subsidiaries and 92 associated companies under equity method as of December 31,
2014.
As the fair value of the consideration paid and the noncontrolling interests were settled and the evaluation of the fair values
of the assets acquired and liabilities assumed was completed during the period ended June 30, 2014, the Company adjusted
the provisional amounts at the acquisition date in accordance with the provisions of ASC 805, “Business Combinations.”
and discloses the revised amounts in Note 14. Furthermore, significant revision was reflected to the prior year’s financial
statement and as a result, “Goodwill” increased by 12,186 million yen and “Intangible assets” and “Other assets” decreased
by 10,287 million yen and 1,899 million yen, respectively, on the consolidated balance sheet as of March 31, 2014.
The Company accounts for the benefit pension plans and the lump-sum payment plans in accordance with the provisions of
ASC 715, “Compensation-Retirement Benefits.” In accordance with the provisions, funded status of benefit pension plans
(that is the balance of plan assets and benefit obligations) are recognized on the consolidated balance sheets and pension
liability adjustments, net of tax, are recorded in the “Accumulated Other Comprehensive Income (Loss).” Actuarial net
gains and losses in excess of the corridor (10% of benefit obligations or fair value of plan assets, whichever is greater) are
amortized over the average remaining service period of employees, except the plan described as follows.
The Company and certain domestic subsidiaries made a transition from the defined benefit pension plan to the defined
contribution pension plan, effective from July 1, 2013. Net actuarial gains and losses to the defined benefit pension plan in
excess of the corridor are amortized over the average remaining life expectancy of plan participants. The effect of this
decision for the nine months ended December 31, 2013 is described in Note 9.
- 16 -

(c) Description of Business
Panasonic Corporation (hereinafter, the “Company,” including consolidated subsidiaries, unless the context otherwise
requires) is one of the world’s leading producers of electronic and electric products. The Company currently offers a
comprehensive range of products, systems and components for consumer, business and industrial use based on
sophisticated electronics and precision technology, expanding to building materials and equipments, and housing business.
Sales by segment for the nine months ended December 31, 2014 were as follows: Appliances—23%, Eco Solutions—
21%, AVC Networks—14%, Automotive & Industrial Systems—35% and Other—7%. A sales breakdown by geographical
market was as follows: Japan—47%, North and South America—16%, Europe—9%, and Asia and Others—28%.
Sales by segment for the three months ended December 31, 2014 were as follows: Appliances—23%, Eco Solutions—
21%, AVC Networks—15%, Automotive & Industrial Systems—34% and Other—7%. A sales breakdown by geographical
market was as follows: Japan—47%, North and South America—17%, Europe—10%, and Asia and Others—26%.
The Company is not dependent on a single supplier and has no significant difficulty in obtaining raw materials from
suppliers.
(d) Use of Estimates
The preparation of consolidated financial statements requires management to make estimates and assumptions that affect
the reported amounts of assets and liabilities and disclosure of contingent assets and liabilities at the date of the
consolidated financial statements, and the reported amounts of revenues and expenses during the reporting period. Actual
results could differ from those estimates. Significant estimates and assumptions are reflected in valuation and disclosure of
revenue recognition, allowance for doubtful receivables, valuation of inventories, impairment of long-lived assets,
impairment of goodwill, environmental liabilities, valuation of deferred tax assets, uncertain tax positions, employee
retirement and severance benefit plans and assets acquired and liabilities assumed in business combinations.
Management evaluated the subsequent events through February 12, 2015, the issue date of the Company's consolidated
financial statements.
(e) Adoption of New Accounting Pronouncements
On April 1, 2014, the Company adopted Accounting Standards Update (ASU) 2013-05, “Parent’s Accounting for the
Cumulative Translation Adjustment upon Derecognition of Certain Subsidiaries or Groups of Assets within a Foreign
Entity or of an Investment in a Foreign Entity.” ASU 2013-05, which amends ASC830, “Foreign Currency Matters,”
requires a cumulative translation adjustment, to be released into net income when an entity ceases to have a controlling
financial interest in a subsidiary or group of assets within a consolidated foreign entity and the sale or transfer results in the
complete or substantially completely liquidation of the foreign entity. This adoption of ASU 2013-05 is not expected to
have a material effect on the Company’s consolidated financial statements.
On April 1, 2014, the Company adopted ASU 2013-11, “Presentation of an Unrecognized Tax Benefit When a Net
Operating Loss Carryforward, a Similar Tax Loss, or a Tax Credit Carryforward Exists.” ASU 2013-11 requires an
unrecognized tax benefit, to be presented in the financial statements as a reduction to a deferred tax asset for a net operating
loss carryforward for tax purposes, a similar tax loss, or a tax credit carryforward. This adoption of ASU 2013-11 is not
expected to have a material effect on the Company’s consolidated financial statements.
(f) Reclassifications
Certain reclassifications have been made to the prior years’ consolidated financial statements in order to conform with the
presentation used for fiscal 2015.
- 17 -

(2) Inventories
Inventories at December 31 and March 31, 2014 are summarized as follows:
Yen (millions)
December 31, 2014 March 31, 2014 Finished goods 510,463 449,820
Work in process 150,856 128,323
Raw materials 183,622 172,538 844,941 750,681
(3) Investments in Securities
In accordance with ASC 320, “Investments—Debt and Equity Securities,” the Company classifies its existing marketable equity
securities other than investments in associated companies and all debt securities as available-for-sale.
The cost, fair value and net unrealized holding gains (losses) of available-for-sale securities included in investments and
advances at December 31 and March 31, 2014 are as follows:
Yen (millions)
December 31, 2014
Cost Fair value Net unrealized holding gains
Investments and advances:
Equity securities 21,167 78,902 57,735
Corporate and government bonds 1,655 1,675 20
Other debt securities 17 17 - 22,839 80,594 57,755
Yen (millions)
March 31, 2014
Cost Fair value Net unrealized holding gains
Investments and advances:
Equity securities 18,825 63,101 44,276
Corporate and government bonds 1,674 1,694 20
Other debt securities 16 16 - 20,515 64,811 44,296
The carrying amounts of the Company’s cost method investments totaled 20,625 million yen and 20,677 million yen at
December 31 and March 31, 2014, respectively.
- 18 -

(4) Leases
The Company has operating leases for certain land, buildings, machinery and equipment, and finite-lived intangible assets. Future minimum lease payments under operating leases at December 31, 2014 are as follows:
Yen (millions) Due within 1 year 28,693
Due after 1 year within 2 years 14,187
Due after 2 years within 3 years 6,734
Due after 3 years within 4 years 5,445
Due after 4 years within 5 years 4,422
Thereafter 13,254 Total minimum lease payments 72,735
(5) Long-Lived Assets
The Company periodically reviews the recorded value of its long-lived assets to determine if the future cash flows to be derived
from these assets will be sufficient to recover the remaining recorded asset values. Impairment losses are not charged to segment
profit. The disclosure below has been modified to reflect the revised segments.
The Company recognized impairment losses in the aggregate of 7,248 million yen of long-lived assets for the nine months ended
December 31, 2014. 2,036 million yen, 3,505 million yen and 897 million yen of impairment losses for the nine months ended
December 31, 2014 were related to “AVC Networks,” “Automotive & Industrial Systems,” and “Other” segment, respectively.
The Company recognized impairment losses in the aggregate of 3,643 million yen of long-lived assets for the three months
ended December 31, 2014. 2,668 million yen of impairment losses for the three months ended December 31, 2014 was related to
“Automotive & Industrial Systems” segment.
The Company recognized impairment losses in the aggregate of 32,176 million yen of long-lived assets for the nine months
ended December 31, 2013. 5,849 million yen, 1,346 million yen and 22,845 million yen of impairment losses for the nine months
ended December 31, 2013 were related to “Eco Solutions,” “AVC Networks” and “Automotive & Industrial Systems” segment,
respectively. The Company recognized impairment losses in the aggregate of 26,011 million yen of long-lived assets for the
three months ended December 31, 2013. 2,233 million yen and 22,172 million yen of impairment losses for the three months
ended December 31, 2013 were related to “Eco Solutions” and “Automotive & Industrial Systems” segment, respectively.
The Company recorded impairment losses for certain machinery of domestic and foreign manufacturing facilities related to resin
-based multi-layer printed circuit board business, and thin and high density interposer business among the printed circuit board
business in “Automotive & Industrial Systems” segment for the three months ended December 31, 2013. As a result of the
decision to discontinue these businesses, the Company estimated that the carrying amounts would not be recoverable through
future cash flows. The fair value of machinery was mainly determined through an appraisal based on the repurchase cost.
- 19 -

(6) Per Share Information
Panasonic Corporation Shareholders’ Equity per Share
Panasonic Corporation shareholders’ equity per share as of December 31 and March 31, 2014 are as follows:
Yen
December 31, 2014 March 31, 2014
Panasonic Corporation shareholders’ equity per share
767.90
669.74
Net Income Attributable to Panasonic Corporation Common Shareholders per Share
A reconciliation of the numerators and denominators of the basic and diluted net income attributable to Panasonic Corporation
common shareholders per share computation for the nine months ended December 31, 2014 and 2013 are as follows:
Yen (millions)
Nine months ended December 31
2014 2013 Net income attributable to Panasonic Corporation common shareholders 140,420 243,014
Number of shares
Nine months ended December 31
2014 2013 Average common shares outstanding 2,311,530,788 2,311,634,016 Dilutive effect: Stock options 115,915 -
Diluted common shares outstanding 2,311,646,703 2,311,634,016
Yen
Nine months ended December 31
2014 2013 Net income attributable to Panasonic Corporation common shareholders per share:
Basic 60.75 105.13
Diluted 60.74 -
Diluted net income attributable to Panasonic Corporation common shareholders per share for the nine months ended December
31, 2013 has been omitted because the Company did not have potentially dilutive common shares that were outstanding for the
period.
- 20 -

A reconciliation of the numerators and denominators of the basic and diluted net income attributable to Panasonic Corporation
common shareholders per share computation for the three months ended December 31, 2014 and 2013 are as follows:
Yen (millions)
Three months ended December 31
2014 2013 Net income attributable to Panasonic Corporation common shareholders
59,487 73,680
Number of shares
Three months ended December 31
2014 2013 Average common shares outstanding 2,311,510,677 2,311,615,720 Dilutive effect: Stock options 208,653 -
Diluted common shares outstanding 2,311,719,330 2,311,615,720
Yen
Three months ended December 31
2014 2013 Net income attributable to Panasonic Corporation common shareholders per share:
Basic 25.74 31.87
Diluted 25.73 -
Diluted net income attributable to Panasonic Corporation common shareholders per share for the three months ended December
31, 2013 has been omitted because the Company did not have potentially dilutive common shares that were outstanding for the
period.
- 21 -
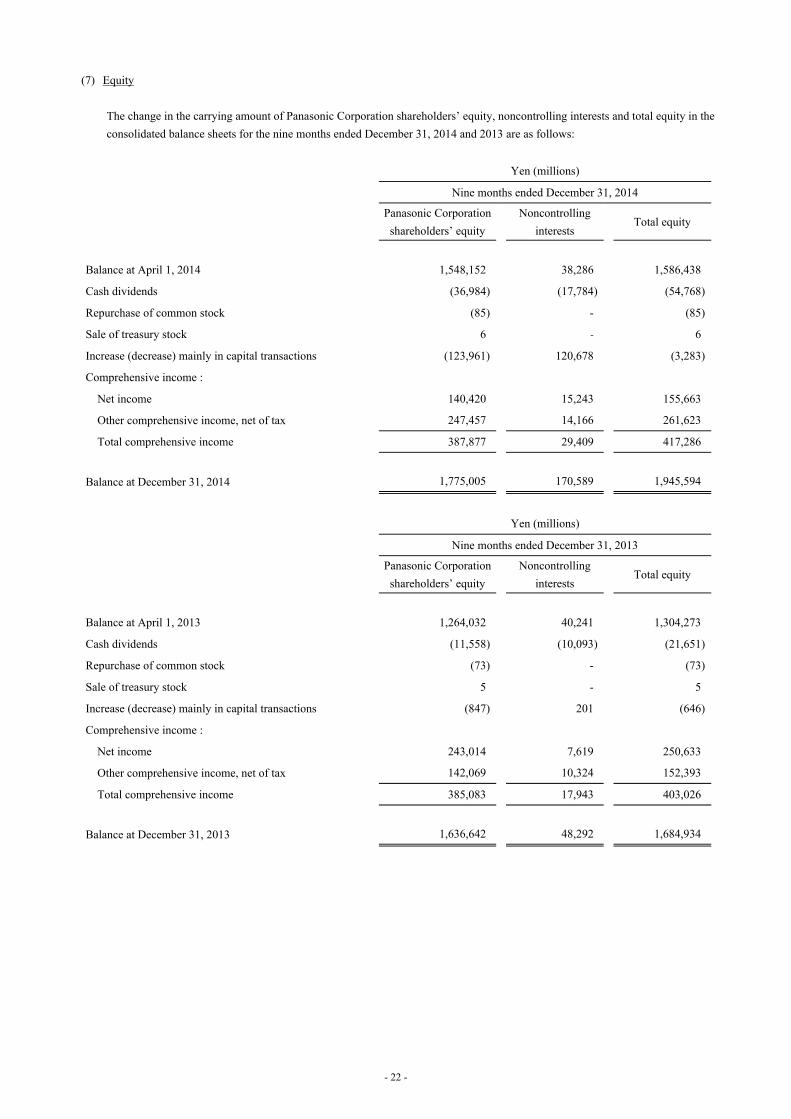
(7) Equity
The change in the carrying amount of Panasonic Corporation shareholders’ equity, noncontrolling interests and total equity in the
consolidated balance sheets for the nine months ended December 31, 2014 and 2013 are as follows:
Yen (millions)
Nine months ended December 31, 2014
Panasonic Corporation
shareholders’ equity
Noncontrolling
interests Total equity
Balance at April 1, 2014 1,548,152 38,286 1,586,438
Cash dividends (36,984) (17,784) (54,768)
Repurchase of common stock (85) - (85)
Sale of treasury stock 6 - 6
Increase (decrease) mainly in capital transactions (123,961) 120,678 (3,283)
Comprehensive income :
Net income 140,420 15,243 155,663
Other comprehensive income, net of tax 247,457 14,166 261,623
Total comprehensive income 387,877 29,409 417,286
Balance at December 31, 2014 1,775,005 170,589 1,945,594
Yen (millions)
Nine months ended December 31, 2013
Panasonic Corporation
shareholders’ equity
Noncontrolling
interests Total equity
Balance at April 1, 2013 1,264,032 40,241 1,304,273
Cash dividends (11,558) (10,093) (21,651)
Repurchase of common stock (73) - (73)
Sale of treasury stock 5 - 5
Increase (decrease) mainly in capital transactions (847) 201 (646)
Comprehensive income :
Net income 243,014 7,619 250,633
Other comprehensive income, net of tax 142,069 10,324 152,393
Total comprehensive income 385,083 17,943 403,026
Balance at December 31, 2013 1,636,642 48,292 1,684,934
- 22 -

Net income attributable to Panasonic Corporation and transfers to the noncontrolling interests for the nine months ended
December 31, 2014 and 2013 are as follows:
Yen (millions)
Nine months ended December 31
2014 2013
Net income attributable to Panasonic Corporation 140,420 243,014
Transfers to the noncontrolling interests:
Decrease in capital surplus for purchase of additional shares in consolidated
subsidiaries (124,181) (847)
Total (124,181) (847)
Change from net income attributable to Panasonic Corporation and
transfers to the noncontrolling interests
16,239
242,167
The company purchased additional shares of Panasonic Plasma Display Co., Ltd etc. for the nine months ended December 31,
2014.
Amount of transfers to the noncontrolling interests for the three months ended December 31, 2014 and 2013 are a decrease of
920 million yen and an increase of 3 million yen.
- 23 -

(8) Other Comprehensive Income (Loss)
Components of other comprehensive income (loss) for the nine months ended December 31, 2014 are as follows:
Yen (millions)
Translation
adjustments
Unrealized
holding gains
(losses) of
available-for-
sale
securities
Unrealized
holding gains
(losses) of
derivative
instruments
Pension
liability
adjustments
Total
Accumulated other comprehensive income (loss) - Balance at April 1, 2014 (167,219 ) 6,027 (237 ) (290,270 ) (451,699 )
Arising during the period:
Pre-tax amount 230,115 13,869 1,533 5,770 251,287
Tax expense - (5,084 ) (155 ) 1,128 (4,111 )
Net-of-tax amount 230,115 8,785 1,378 6,898 247,176
Reclassification adjustment for (gains) losses included in net income:
Pre-tax amount 4,550 (820 ) (22 ) 10,067 13,775
Tax expense - 290 (10 ) 392 672
Net-of-tax amount 4,550 (530 ) (32 ) 10,459 14,447
Other comprehensive income (loss), net of tax: 234,665 8,255 1,346 17,357 261,623
Other comprehensive income (loss) attributable to noncontrolling interests, net-of-tax amount 14,343 20 (19 ) (178 ) 14,166
Accumulated other comprehensive income (loss) - Balance at December 31, 2014 53,103 14,262 1,128 (272,735 ) (204,242 )
Pre-tax amount of reclassification adjustment for (gains) losses included in net income (loss) on the table above is included in the
following in the consolidated statements of income.
Translation adjustments - Other income (deductions)
Unrealized holding gains (losses) of available-for-sale securities - Other income (deductions)
Unrealized holding gains (losses) of derivative instruments
Foreign exchange contract 316million yen - Other income (deductions)
Commodity derivatives (294)million yen - Cost of sales
Pension liability adjustments - Net periodic pension cost
- 24 -
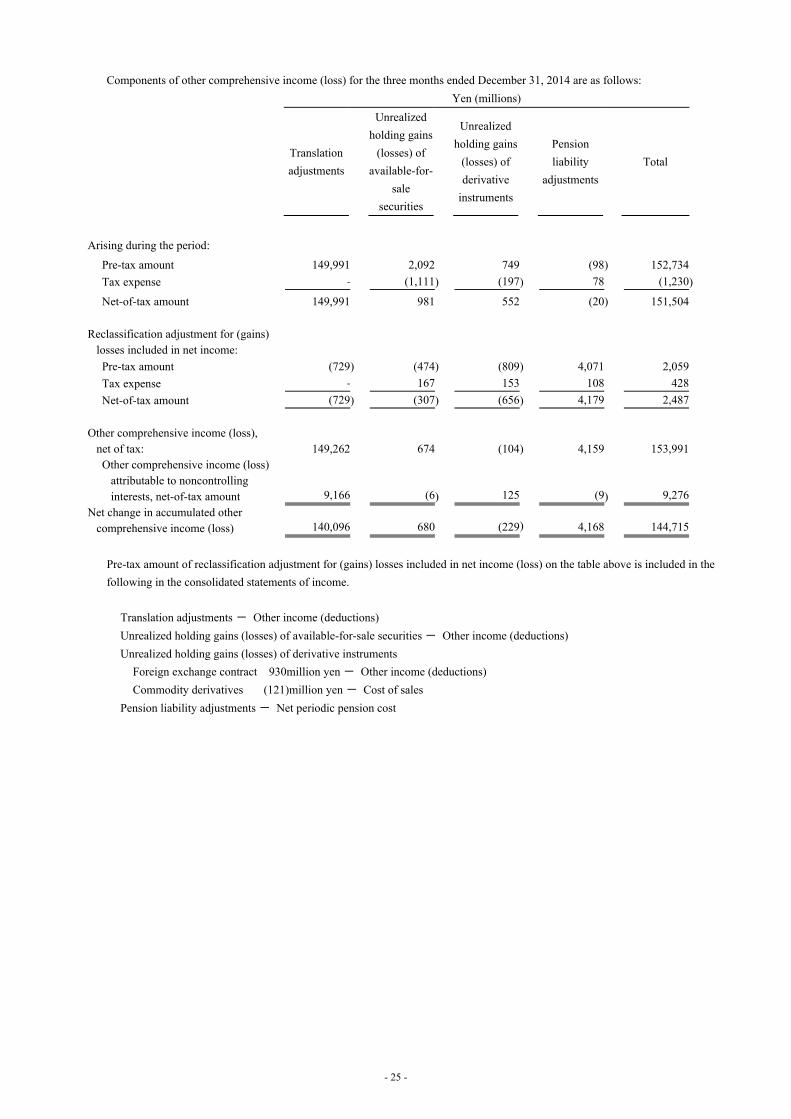
Components of other comprehensive income (loss) for the three months ended December 31, 2014 are as follows:
Yen (millions)
Translation
adjustments
Unrealized
holding gains
(losses) of
available-for-
sale
securities
Unrealized
holding gains
(losses) of
derivative
instruments
Pension
liability
adjustments
Total
Arising during the period:
Pre-tax amount 149,991 2,092 749 (98 ) 152,734
Tax expense - (1,111 ) (197 ) 78 (1,230 )
Net-of-tax amount 149,991 981 552 (20 ) 151,504
Reclassification adjustment for (gains) losses included in net income:
Pre-tax amount (729 ) (474 ) (809 ) 4,071 2,059
Tax expense - 167 153 108 428
Net-of-tax amount (729 ) (307 ) (656 ) 4,179 2,487
Other comprehensive income (loss), net of tax: 149,262 674 (104 ) 4,159 153,991
Other comprehensive income (loss) attributable to noncontrolling interests, net-of-tax amount 9,166 (6 ) 125 (9 ) 9,276
Net change in accumulated other comprehensive income (loss) 140,096 680 (229 ) 4,168 144,715
Pre-tax amount of reclassification adjustment for (gains) losses included in net income (loss) on the table above is included in the
following in the consolidated statements of income.
Translation adjustments - Other income (deductions)
Unrealized holding gains (losses) of available-for-sale securities - Other income (deductions)
Unrealized holding gains (losses) of derivative instruments
Foreign exchange contract 930million yen - Other income (deductions)
Commodity derivatives (121)million yen - Cost of sales
Pension liability adjustments - Net periodic pension cost
- 25 -

Components of other comprehensive income (loss) for the nine months ended December 31, 2013 are as follows:
Yen (millions)
Translation
adjustments
Unrealized
holding gains
(losses) of
available-for-
sale
securities
Unrealized
holding gains
(losses) of
derivative
instruments
Pension
liability
adjustments
Total
Accumulated other comprehensive income (loss) - Balance at April 1, 2013 (297,015 ) (218 ) (4,573 ) (326,423 ) (628,229 )
Arising during the period:
Pre-tax amount 178,136 39,218 (8,922 ) 37,884 246,316
Tax expense - (14,506 ) 508 (1,992 ) (15,990 )
Net-of-tax amount 178,136 24,712 (8,414 ) 35,892 230,326
Reclassification adjustment for (gains) losses included in net income:
Pre-tax amount (5,169 ) (34,102 ) 12,029 (65,777 ) (93,019 )
Tax expense - 12,890 (558 ) 2,754 15,086
Net-of-tax amount (5,169 ) (21,212 ) 11,471 (63,023 ) (77,933 )
Other comprehensive income (loss), net of tax: 172,967 3,500 3,057 (27,131 ) 152,393
Other comprehensive income (loss) attributable to noncontrolling interests, net-of-tax amount 9,096 15 - 1,213 10,324
Accumulated other comprehensive income (loss) - Balance at December 31, 2013 (133,144 ) 3,267 (1,516 ) (354,767 ) (486,160 )
Pre-tax amount of reclassification adjustment for (gains) losses included in net income (loss) on the table above is included in the
following in the consolidated statements of income.
Translation adjustments - Other income (deductions)
Unrealized holding gains (losses) of available-for-sale securities - Other income (deductions)
Unrealized holding gains (losses) of derivative instruments
Foreign exchange contract (9,603)million yen - Other income (deductions)
Commodity derivatives (2,426)million yen - Cost of sales
Pension liability adjustments - Net periodic pension cost
- 26 -

Components of other comprehensive income (loss) for the three months ended December 31, 2013 are as follows:
Yen (millions)
Translation
adjustments
Unrealized
holding gains
(losses) of
available-for-
sale
securities
Unrealized
holding gains
(losses) of
derivative
instruments
Pension
liability
adjustments
Total
Arising during the period:
Pre-tax amount 120,723 (752 ) (480 ) (107 ) 119,384
Tax expense - (53 ) (98 ) 29 (122 )
Net-of-tax amount 120,723 (805 ) (578 ) (78 ) 119,262
Reclassification adjustment for (gains) losses included in net income:
Pre-tax amount (2,761 ) (13,208 ) 1,527 4,074 (10,368 )
Tax expense - 4,992 76 (53 ) 5,015
Net-of-tax amount (2,761 ) (8,216 ) 1,603 4,021 (5,353 )
Other comprehensive income (loss), net of tax: 117,962 (9,021 ) 1,025 3,943 113,909
Other comprehensive income (loss) attributable to noncontrolling interests, net-of-tax amount 6,257 30 - 10 6,297
Net change in accumulated other comprehensive income (loss) 111,705 (9,051 ) 1,025 3,933 107,612
Pre-tax amount of reclassification adjustment for (gains) losses included in net income (loss) on the table above is included in the
following in the consolidated statements of income.
Translation adjustments - Other income (deductions)
Unrealized holding gains (losses) of available-for-sale securities - Other income (deductions)
Unrealized holding gains (losses) of derivative instruments
Foreign exchange contract (339)million yen - Other income (deductions)
Commodity derivatives (1,188)million yen - Cost of sales
Pension liability adjustments - Net periodic pension cost
- 27 -

(9) Supplementary Information
Included in other deductions for the nine months and three months ended December 31, 2014 and 2013 are as follows:
Yen (millions)
Nine months ended December 31
2014 2013
Expenses associated with the implementation of the early retirement
programs in the domestic and overseas subsidiaries 8,423 8,450
Write-down of investment securities 36 45
Foreign exchange losses - 4,352
Yen (millions)
Three months ended December 31
2014 2013
Expenses associated with the implementation of the early retirement
programs in the domestic and overseas subsidiaries 3,329 6,637
Write-down of investment securities - -
Foreign exchange losses (gains) - (768)
Foreign exchange gains included in other income for the nine and three months ended December 31, 2014 are 8,085 million yen
and 4,697 million yen, respectively.
Net periodic benefit costs of the defined benefit pension plan for the nine months ended December 31, 2014 and 2013 are a loss
of 18,950 million yen and a gain of 49,035 million yen, respectively. Net periodic benefit costs of the defined benefit pension
plan for the three months ended December 31, 2014 and 2013 are a loss of 4,868 million yen and a loss of 6,132 million yen,
respectively. In the first quarter of fiscal 2014, the Company and certain domestic subsidiaries decided to make a transition
from the defined benefit pension plan to the defined contribution pension plan, effective after July 1, 2013. Under the U.S.
GAAP, upon this decision, any decrease in projected benefit obligations (PBO) due to a plan amendment in the past is required
to be immediately recognized in the profit and loss. Accordingly, the Company recognized a gain of 79,762 million yen in
“Other income” in the consolidated statement of income for the nine months ended December 31, 2013.
In the first quarter of fiscal 2014, the Company's management and labor unions agreed to reduce the employee's bonuses in
accordance with the Group extraordinary management measures. As a result of the agreements, the Company and certain
domestic subsidiaries reversed accrued employee's bonus expenses, included in the consolidated balance sheet as of March 31,
2013. This revision was regarded as a change in accounting estimate under the U.S. GAAP. This revision caused an increase in
income before income taxes by 20,133 million yen on the consolidated statement of income for the nine months ended
December 31, 2013.
Gains included in other income due to stocks contribution to an employee retirement benefit trust for the nine and three months
ended December 31, 2013 amounted to 12,199 million yen.
The expense to prevent further accident included in other deductions for the nine and three months ended December 31, 2014
are 23,036 million yen and 5,859 million yen, respectively.
- 28 -
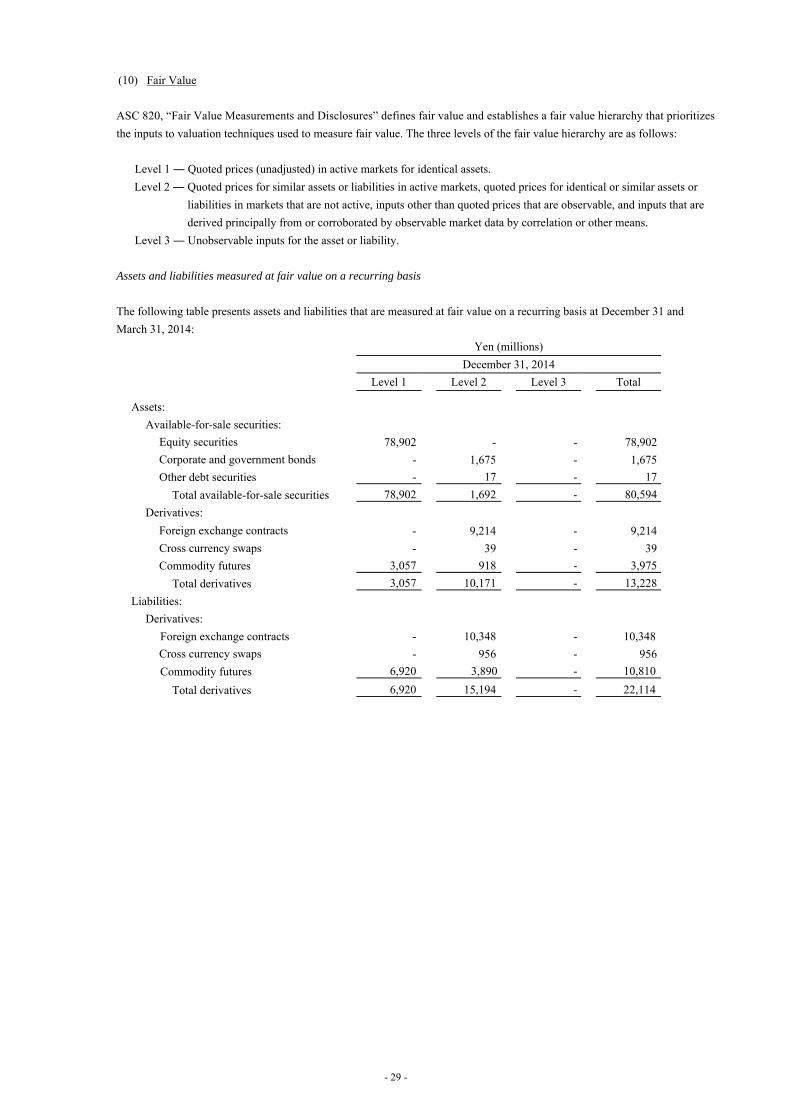
(10) Fair Value
ASC 820, “Fair Value Measurements and Disclosures” defines fair value and establishes a fair value hierarchy that prioritizes
the inputs to valuation techniques used to measure fair value. The three levels of the fair value hierarchy are as follows:
Level 1 ― Quoted prices (unadjusted) in active markets for identical assets.
Level 2 ― Quoted prices for similar assets or liabilities in active markets, quoted prices for identical or similar assets or
liabilities in markets that are not active, inputs other than quoted prices that are observable, and inputs that are
derived principally from or corroborated by observable market data by correlation or other means.
Level 3 ― Unobservable inputs for the asset or liability.
Assets and liabilities measured at fair value on a recurring basis
The following table presents assets and liabilities that are measured at fair value on a recurring basis at December 31 and
March 31, 2014: Yen (millions)
December 31, 2014
Level 1 Level 2 Level 3 Total Assets:
Available-for-sale securities:
Equity securities 78,902 - - 78,902
Corporate and government bonds - 1,675 - 1,675
Other debt securities - 17 - 17
Total available-for-sale securities 78,902 1,692 - 80,594
Derivatives:
Foreign exchange contracts - 9,214 - 9,214
Cross currency swaps - 39 - 39
Commodity futures 3,057 918 - 3,975
Total derivatives 3,057 10,171 - 13,228
Liabilities:
Derivatives:
Foreign exchange contracts - 10,348 - 10,348
Cross currency swaps - 956 - 956
Commodity futures 6,920 3,890 - 10,810
Total derivatives 6,920 15,194 - 22,114
- 29 -
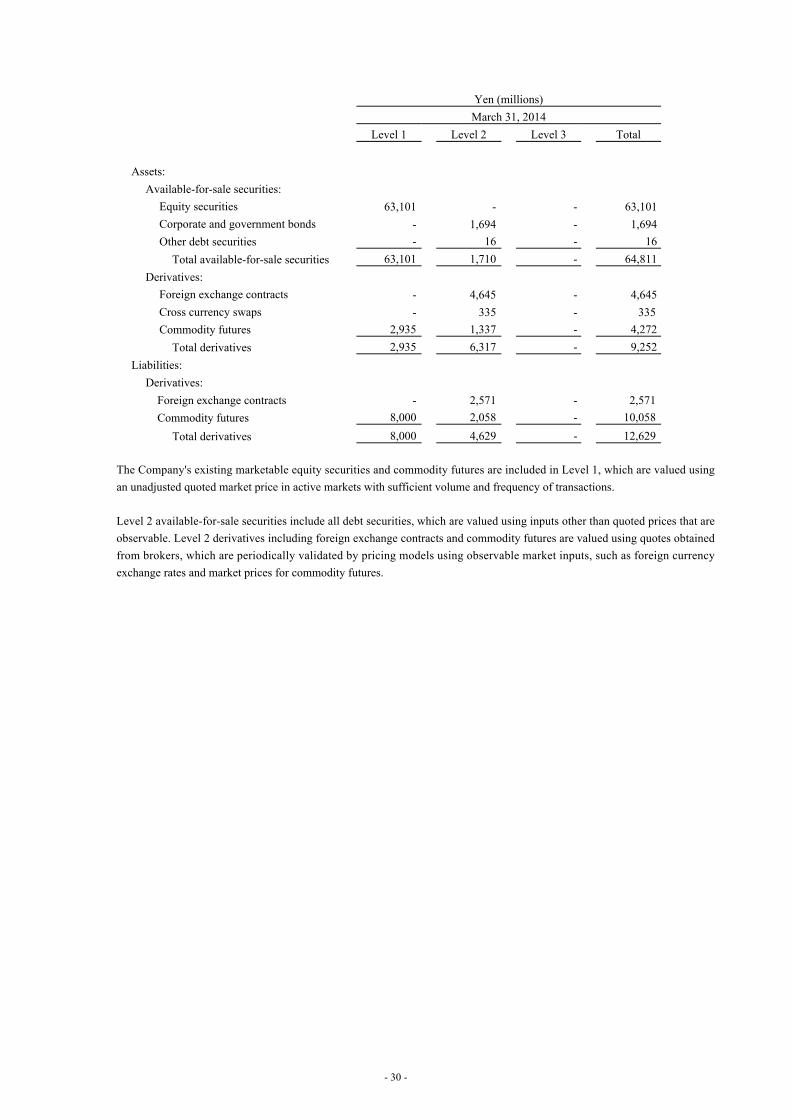
Yen (millions)
March 31, 2014
Level 1 Level 2 Level 3 Total
Assets:
Available-for-sale securities:
Equity securities 63,101 - - 63,101
Corporate and government bonds - 1,694 - 1,694
Other debt securities - 16 - 16
Total available-for-sale securities 63,101 1,710 - 64,811
Derivatives:
Foreign exchange contracts - 4,645 - 4,645
Cross currency swaps - 335 - 335
Commodity futures 2,935 1,337 - 4,272
Total derivatives 2,935 6,317 - 9,252
Liabilities:
Derivatives:
Foreign exchange contracts - 2,571 - 2,571
Commodity futures 8,000 2,058 - 10,058
Total derivatives 8,000 4,629 - 12,629
The Company's existing marketable equity securities and commodity futures are included in Level 1, which are valued using
an unadjusted quoted market price in active markets with sufficient volume and frequency of transactions.
Level 2 available-for-sale securities include all debt securities, which are valued using inputs other than quoted prices that are
observable. Level 2 derivatives including foreign exchange contracts and commodity futures are valued using quotes obtained
from brokers, which are periodically validated by pricing models using observable market inputs, such as foreign currency
exchange rates and market prices for commodity futures.
- 30 -

The fair value of financial instruments
The following methods and assumptions were used to estimate the fair value of each class of financial instruments for which it
is practicable to estimate that value:
Available-for-sale securities
The carrying amount is equal to the fair value which is estimated based on quoted market prices. The fair value is also
described in Note 3.
Long-term debt, including current portion
The fair value of long-term debt is estimated based on quoted market prices or the present value of future cash flows using
appropriate current discount rates. The Company classified long-term debt in Level 2. The carrying amount and fair value at
December 31, 2014 are 565,670 million yen and 581,430 million yen, respectively. The carrying amount and fair value at
March 31, 2014 are 598,955 million yen and 615,816 million yen, respectively.
Derivative financial instruments
The fair value of derivative financial instruments is estimated based on unadjusted market prices or quotes obtained from
brokers, which are periodically validated by pricing models using observable inactive market inputs.
Advances
The fair value of advances is estimated based on the present value of future cash flows using appropriate current discount rates.
The Company classified advances in Level 2. The carrying amount approximates fair value.
Financial instruments other than those listed above (such as Cash and cash equivalents, Time deposits, Trade receivables,
Short-term debt, Trade payables, Accrued expenses)
The carrying amount approximates fair value because of the short maturity of these instruments.
Limitations
Fair value estimates are made at a specific point in time, based on relevant market information and information about the
financial instruments. These estimates are subjective in nature and involve uncertainties and matters of significant judgments
and therefore cannot be determined with precision. Changes in assumptions could significantly affect the estimates.
- 31 -

Assets and liabilities measured at fair value on a nonrecurring basis
For the nine months and three months ended December 31, 2014, there were no circumstances that required any significant
assets and liabilities that are not measured at fair value on an ongoing basis to be measured and recognized at fair value.
The following table presents significant assets and liabilities that are measured at fair value on a nonrecurring basis for the nine
months and three months ended December 31, 2013:
Yen (millions)
Nine months ended December 31, 2013
Total gains (losses)
Fair value
Level 1 Level 2 Level 3 Total Assets:
Long-lived assets (32,176) - - 2,339 2,339
Yen (millions)
Three months ended December 31, 2013
Total gains (losses)
Fair value
Level 1 Level 2 Level 3 Total Assets:
Long-lived assets (26,011) - - 1,471 1,471
The Company classified most of assets and liabilities described above in Level 3 as the Company used unobservable inputs to
value these assets when recognizing impairment losses related to the assets. The fair value for the major assets was measured
through repurchase cost method.
The following table presents assets that are measured at fair value on a nonrecurring basis in Level 3 for the nine months and
three months ended December 31, 2013:
Yen (millions)
For the nine months ended December 31, 2013
Fair value at
December 31, 2013
Valuation
technique
Unobservable
inputs
Range
Assets:
Long-lived assets 2,339
Repurchase cost
method
Residual value
ratio
0.0%-9.3%
Yen (millions)
For the three months ended December 31, 2013
Fair value at
December 31, 2013
Valuation
technique
Unobservable
inputs
Range
Assets:
Long-lived assets 1,471
Repurchase cost
method
Residual value
ratio
0.0%-9.3%
- 32 -

(11) Commitments and Contingent Liabilities
The Company provides guarantees to third parties mainly on bank loans provided to associated companies and customers. The
guarantees are made to enhance their credit. For each guarantee provided, the Company is required to perform under the
guarantee if the guaranteed party defaults on a payment. Also, the Company sold certain trade receivables to independent third
parties, some of which are with recourse. If the collectibility of those receivables with recourse becomes doubtful, the
Company is obligated to assume the liabilities. At December 31, 2014, the maximum amount of undiscounted payments the
Company would have to make in the event of default was 27,217 million yen. The carrying amount of the liabilities recognized
for the Company’s obligations as a guarantor under those guarantees at December 31, 2014 was immaterial.
In connection with the sale and lease back of certain machinery and equipment, the Company guarantees a specific value of the
leased assets. For each guarantee provided, the Company is required to perform under the guarantee if certain conditions are
met during or at the end of the lease term. At December 31, 2014, the maximum amount of undiscounted payments the
Company would have to make in the event that these conditions were met was 3,327 million yen. The carrying amount of the
liabilities recognized for the Company’s obligations as guarantors under those guarantees at December 31, 2014 was
immaterial.
The Company and certain subsidiaries are under the term of leasehold interest contracts for land of domestic factories and have
obligations for restitution on their leaving. The asset retirement obligations cannot be reasonably estimated because the
durations of use of the leased assets are not specified and there are no plans to undertake relocation in the future. Therefore, the
Company did not recognize asset retirement obligations.
The Company and certain of its subsidiaries are subject to a number of legal proceedings including civil litigations related to
trade, tax, products or intellectual properties, or governmental investigations. The Company has been dealing with the various
litigations and investigations. Depending upon the outcome of these different proceedings, the Company and certain of its
subsidiaries may be subject to an uncertain amount of fines, and accordingly the Company has accrued for certain probable and
reasonable estimated amounts for the fines.
Since November 2007, the Company and MT Picture Display Co., Ltd. (MTPD), a subsidiary of the Company, have been
subjected to investigations by government authorities, including the Japan Fair Trade Commission, the U.S. Department of
Justice and the European Commission, in respect of alleged antitrust violations relating to cathode ray tubes (CRTs).
Subsequent to these actions by the authorities, a number of class action lawsuits, etc. has been filed in the U.S. and Canada
against the Company and certain of its subsidiaries. In fiscal 2010, the Japan Fair Trade Commission issued a cease and desist
order against MTPD and assessed a fine against its three subsidiaries in South East Asia, but each named company filed for a
hearing to challenge the orders which is currently subject to proceedings. Other than the above, there are a number of other
legal actions and investigations against the Company and certain subsidiaries. Management is of the opinion that damages, if
any, resulting from these actions, will not have a material effect on the Company’s consolidated financial statements.
The ability to predict the outcome of these actions and proceedings is difficult to assess given that certain of the investigations
and legal proceedings are still at an early stage, present novel legal theories, involve a large number of parties or taking place in
jurisdictions outside of Japan where the laws are complex or unclear. Accordingly, the Company is unable to estimate the losses
or range of losses for the actions and proceedings where there is only a reasonable possibility that a loss exceeding amounts
already recognized may have been incurred.
- 33 -

(12) Segment Information
In accordance with the provisions of ASC 280, “Segment Reporting,” the segments reported below are the components of the
Company for which separate financial information is available that is evaluated regularly by the chief operating decision maker
of the Company in deciding how to allocate resources and in assessing performance.
“Appliances” is comprised of development, manufacture and sales of consumer electronics (flat panel TVs, home audio
equipment, video equipment, refrigerators, microwave ovens, rice cookers, washing machines, vacuum cleaners, personal-care
products, etc.), air-conditioners (room air-conditioners, large-sized air-conditioners, etc.), cold chain (showcases, etc.), devices
(compressors, electric motors, fuel cells, etc.) and bicycle related products.
“Eco Solutions” is comprised of development, manufacture and sales of lighting fixtures, electric lamps (including LED
lighting), wiring devices, solar photovoltaic systems, interior furnishing materials, water-related products, ventilation and air-
conditioning equipment, air purifiers, etc.
“AVC Networks” is comprised of visual and imaging business (surveillance cameras, projectors, digital cameras, etc.), mobility
business (PCs, etc.), communication business (IP-related equipment, etc.) and vertical solution business (aircraft in-flight
entertainment systems, social infrastructure systems equipment, etc.).
“Automotive & Industrial Systems” is comprised of development, manufacture and sales of automotive related products (car-
use-multimedia-related equipment, electrical components, etc.), industrial related devices (electronic components, electronic
materials, automation controls, semiconductors, optical devices, dry batteries, lithium-ion batteries, storage batteries, etc.) and
manufacturing related systems (electronic-component-mounting machines, welding equipment, etc.).
“Other” consists of PanaHome Corporation and others.
- 34 -

By Segment:
Certain businesses were transferred among segments on April 1, 2014 and July 1, 2014. Accordingly, segment information for
the nine months ended December 31, 2013 has been reclassified to conform to the presentation for the nine months ended
December 31, 2014. Information by segment for the nine months ended December 31, 2014 and 2013 is shown in the tables
below:
Yen (millions)
Nine months ended December 31
2014 2013
Sales: Appliances:
Customers 1,168,130 1,152,788
Intersegment 212,541 208,514
Total 1,380,671 1,361,302
Eco Solutions:
Customers 1,026,366 1,004,440
Intersegment 197,976 198,469
Total 1,224,342 1,202,909
AVC Networks:
Customers 786,115 746,496
Intersegment 41,653 86,428
Total 827,768 832,924
Automotive & Industrial Systems:
Customers 1,953,758 1,917,562
Intersegment 125,314 121,852
Total 2,079,072 2,039,414
Other:
Customers 410,164 462,390
Intersegment 37,049 85,642
Total 447,213 548,032
Eliminations and Adjustments:
Customers 374,800 396,135
Intersegment (614,533) (700,905)
Total (239,733) (304,770)
Consolidated total 5,719,333 5,679,811
- 35 -

Yen (millions)
Nine months ended December 31
2014 2013
Segment profit (loss):
Appliances 44,577 26,567
Eco Solutions 75,676 70,732
AVC Networks 21,583 9,215
Automotive & Industrial Systems 80,291 72,420
Other 1,528 10,330
Eliminations and Adjustments 66,618 73,912 Total segment profit 290,273 263,176
Interest income 10,190 7,492
Dividends received 1,411 1,948
Other income 33,245 133,518
Interest expense (13,741) (16,374)
Impairment losses of long-lived assets (7,248) (32,176)
Other deductions (106,067) (50,547) Consolidated income before income taxes 208,063 307,037
The figures in "Eliminations and Adjustments" include revenues and expenses which are not attributable to any reportable
segments for the purpose of evaluating operating results of each segment, consolidation adjustments, and eliminations of
intersegment transactions.
Adjustments to segment sales to Customers for the nine months ended December 31, 2014 and 2013 mainly include price
differences of 472,986 million yen and 487,200 million yen, respectively, between sales prices to external customers and the
internal sales prices adopted for performance measurement purposes for the sales through sales department of consumer
products. Adjustments also include the sales of certain associated companies under the equity method, amounted to a deduction
of 75,243 million yen and a deduction of 78,604 million yen, respectively, solely for the purpose of assessing segment
performance.
Adjustments of profit for the nine months ended December 31, 2014 and 2013 mainly include 54,111 million yen and 61,231
million yen of profit and loss of corporate headquarters and sales departments of consumer products which are not allocated to
any reportable segments, respectively. The adjustments also include 12,507 million yen and 12,681 million yen of consolidation
adjustments, respectively, mainly related to amortization of finite-lived intangible assets generated by business combinations
and other differences in accounting standards.
Transfers between business segments are made at arms-length prices. There is no material concentration of sales to a single
external major customer for the nine months ended December 31, 2014 and 2013.
- 36 -
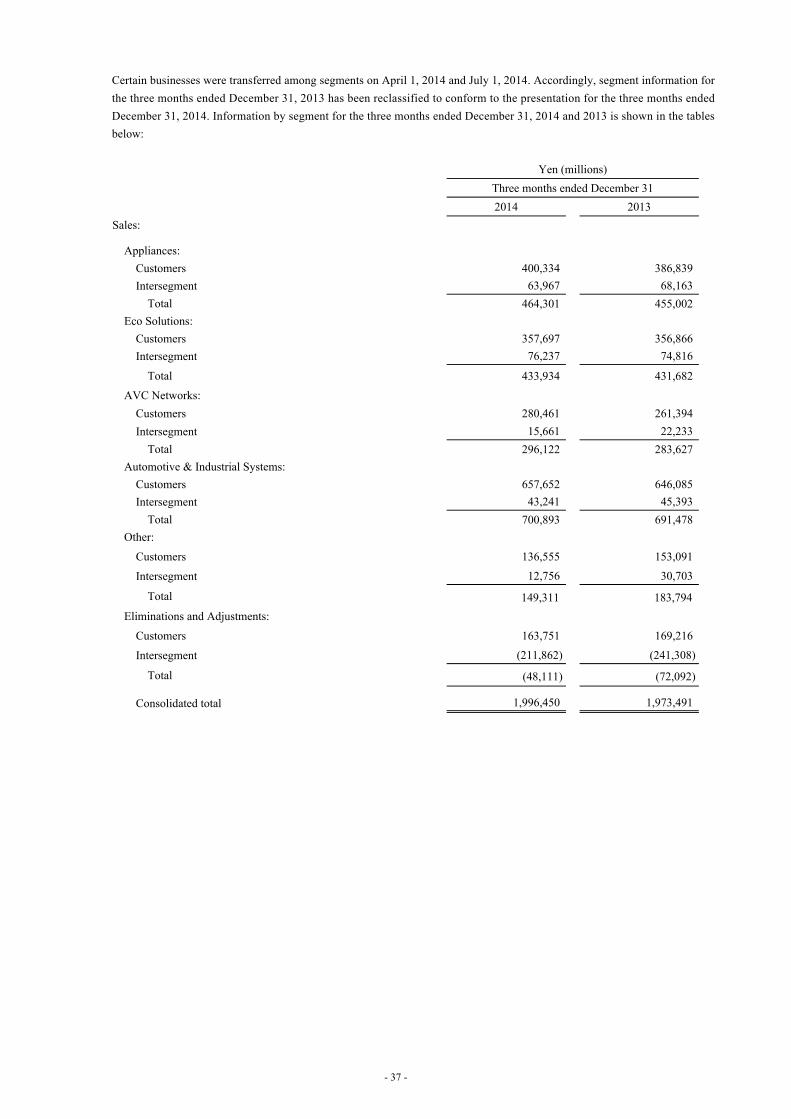
Certain businesses were transferred among segments on April 1, 2014 and July 1, 2014. Accordingly, segment information for
the three months ended December 31, 2013 has been reclassified to conform to the presentation for the three months ended
December 31, 2014. Information by segment for the three months ended December 31, 2014 and 2013 is shown in the tables
below:
Yen (millions)
Three months ended December 31
2014 2013
Sales: Appliances:
Customers 400,334 386,839
Intersegment 63,967 68,163
Total 464,301 455,002
Eco Solutions:
Customers 357,697 356,866
Intersegment 76,237 74,816
Total 433,934 431,682
AVC Networks:
Customers 280,461 261,394
Intersegment 15,661 22,233
Total 296,122 283,627
Automotive & Industrial Systems:
Customers 657,652 646,085
Intersegment 43,241 45,393
Total 700,893 691,478
Other:
Customers 136,555 153,091
Intersegment 12,756 30,703
Total 149,311 183,794
Eliminations and Adjustments:
Customers 163,751 169,216
Intersegment (211,862) (241,308)
Total (48,111) (72,092)
Consolidated total 1,996,450 1,973,491
- 37 -

Yen (millions)
Three months ended December 31
2014 2013
Segment profit (loss):
Appliances 12,193 13,117
Eco Solutions 33,833 31,155
AVC Networks 17,641 11,566
Automotive & Industrial Systems 28,054 24,371
Other (415) 3,725
Eliminations and Adjustments 21,988 32,653 Total segment profit 113,294 116,587
Interest income 3,960 2,661
Dividends received 175 438
Other income 15,620 25,443
Interest expense (4,320) (4,490)
Impairment losses of long-lived assets (3,643) (26,011)
Other deductions (38,925) (14,996) Consolidated income before income taxes 86,161 99,632
The figures in "Eliminations and Adjustments" include revenues and expenses which are not attributable to any reportable
segments for the purpose of evaluating operating results of each segment, consolidation adjustments, and eliminations of
intersegment transactions.
Adjustments to segment sales to Customers for the three months ended December 31, 2014 and 2013 mainly include price
differences of 199,182 million yen and 203,480 million yen, respectively, between sales prices to external customers and the
internal sales prices adopted for performance measurement purposes for the sales through sales department of consumer
products. Adjustments also include the sales of certain associated companies under the equity method, amounted to a deduction
of 25,688 million yen and a deduction of 28,086 million yen, respectively, solely for the purpose of assessing segment
performance.
Adjustments of profit for the three months ended December 31, 2014 and 2013 mainly include 16,496 million yen and 28,558
million yen of profit and loss of corporate headquarters and sales departments of consumer products which are not allocated to
any reportable segments, respectively. The adjustments also include 5,492 million yen and 4,095 million yen of consolidation
adjustments, respectively, mainly related to amortization of finite-lived intangible assets generated by business combinations
and other differences in accounting standards.
Transfers between business segments are made at arms-length prices. There is no material concentration of sales to a single
external major customer for the three months ended December 31, 2014 and 2013.
- 38 -

By Geographical Area:
Sales attributed to countries based upon the customer’s location for the nine months ended December 31, 2014 and 2013 are as
follows:
Yen (millions)
Nine months ended December 31
2014 2013
Sales:
Japan 2,677,611 2,757,603
North and South America 905,260 853,731
Europe 551,105 568,734
Asia and Others 1,585,357 1,499,743
Consolidated total 5,719,333 5,679,811
United States included in North and South America 777,161 724,755
China included in Asia and Others 789,712 767,703
Sales attributed to countries based upon the customer’s location for the three months ended December 31, 2014 and 2013 are as
follows:
Yen (millions)
Three months ended December 31
2014 2013
Sales:
Japan 927,673 970,271
North and South America 344,014 299,822
Europe 207,241 214,479
Asia and Others 517,522 488,919
Consolidated total 1,996,450 1,973,491
United States included in North and South America 293,601 252,924
China included in Asia and Others 252,792 257,057
There are no individually material countries of which should be separately disclosed in North and South America, Europe, and
Asia and Others, except for the United States of America and China on sales.
- 39 -

(13) Cash Dividends
On April 28, 2014, the board of directors approved a year-end dividend of 8.0 yen per share, totaling 18,492 million yen on
outstanding common stock as of March 31, 2014. The dividends, which became effective on June 5, 2014, were sourced out of
retained earnings.
On October 31, 2014, the board of directors approved an interim dividend of 8.0 yen per share, totaling 18,492 million yen on
outstanding common stock as of September 30, 2014. The dividends, which became effective on December 4, 2014, were
sourced out of retained earnings.
- 40 -

(14) Acquisition
On February 28, 2014, the Company acquired 90% of outstanding shares of Viko Electric Co., Ltd. (VIKO) and accordingly, had
a controlling interest of VIKO from the acquisition date.
VIKO is in the business of manufacturing and sales of electrical and materials, such as wiring devices, low voltage switchgears,
smart meters and building automation system. As a result of this acquisition, by utilizing VIKO’s management resources, such as
its strong brand awareness, sales channels, and “C-Type” wiring devices and technologies, using Turkey as the base, the
Company expects expansion in the sales of wiring devices and other product ranges as well as electrical equipment and materials
produced by the Company, such as lighting devices and fans, not only in Turkey, but in the Middle East, CIS and African
markets. In addition, by introducing new products by making use of the Company’s product competitiveness and development
capabilities, and by making improvements in productivity through sharing manufacturing know-how with VIKO, the Company
will create synergies with VIKO and is aiming for further expansion of the business.
The fair value of noncontrolling interests was measured based on the acquired cost deducting control premium. The fair value of
the consideration paid for the controlling interests of VIKO and the noncontrolling interests as of the acquisition date is as
follows:
Yen (millions) Fair value of consideration:
Cash
47,510 Fair value of noncontrolling interests 3,771
Total 51,281
Acquisition-related cost was not material and included in other deductions in the consolidated statements of operations for the
year ended March 31, 2014.
Assets acquired and liabilities assumed as of the acquisition date were as follows:
Yen (millions) Cash and cash equivalents 131
Goodwill 23,145
Intangible assets 30,295
Other assets 11,701
Total assets acquired 65,272
Deferred tax liabilities 5,963
Other liabilities 8,028
Total liabilities assumed 13,991
Total net assets acquired 51,281
Intangible assets of 20,188 million yen are subject to amortization, which include dealer network of 17,629 million yen with a 13
-year weighted-average useful life. Intangible assets of 10,107 million yen are not subject to amortization, all of which relates to
trademark.
The total amount of goodwill is included in “Eco Solutions” segment, and is not deductible for tax purpose.
Pro forma information has been omitted as the amounts are not material.
- 41 -

(15) Subsequent Events
Based on the board of directors meeting held on February 3, 2015, the Company resolved to issue unsecured straight bonds up to
400 billion yen in or after February 2015 in order to secure funds necessary for expanding its business. The Company plans to
issue the bonds through public offering in Japan and the purpose of funding is for capital expenditures, investments and loans,
and redemption of bonds.
- 42 -