QUARTERLY REPORT - BBVA · QUARTERLY REPORT Results 2006 2 BBVA ... Efficiency ratio including...
56
-
Upload
hoangkhanh -
Category
Documents
-
view
217 -
download
1
Transcript of QUARTERLY REPORT - BBVA · QUARTERLY REPORT Results 2006 2 BBVA ... Efficiency ratio including...


QUARTERLY REPORT
Results 2006
2 BBVA GROUP HIGHLIGHTS
3 GROUP FINANCIAL INFORMATION
3 • Relevant events6 • Earnings
13 • Business activity17 • Risk management20 • Capital base22 • The BBVA share
24 BUSINESS AREAS
26 • Retail Banking in Spain and Portugal30 • Wholesale and Investment Banking34 • Mexico and USA39 • South America43 • Corporate Activities
45 CORPORATE RESPONSIBILITY
46 FINANCIAL STATEMENTS

2
BBVA GROUP HIGHLIGHTS
BBVA GROUP HIGHLIGHTS(Consolidated figures)
31-12-05∆% (2)31-12-06excluding one-offs (1)31-12-06
BALANCE SHEET (million euros)Total assetsTotal lending (gross)On-balance sheet customer fundsOther customer fundsTotal customer funds EquityShareholders' funds
INCOME STATEMENT (million euros)Net interest incomeCore revenuesOrdinary revenuesOperating profitPre-tax profitNet attributable profit
DATA PER SHARE AND MARKET CAPITALIZATIONShare priceMarket capitalization (million euros)Net attributable profitBook valuePER (Price/earnings ratio; times)P/BV (Price/book value; times)
SIGNIFICANT RATIOS (%)Operating profit/ATAROE (Net attributable profit/Average equity)ROA (Net profit/ATA)RORWA (Net profit/Risk weighted average assets)Efficiency ratioEfficiency ratio including depreciation and amortizationNPL ratioNPL coverage ratio
CAPITAL ADEQUACY RATIOS (BIS Regulation) (%)TotalCore capitalTIER I
OTHER INFORMATIONNumber of shares (million)Number of shareholdersNumber of employees
• Spain• America (3)
• Rest of the worldNumber of branches
• Spain• America (3)
• Rest of the worldN.B.: Non-audited figures. Consolidated quarterly accounts for the Bank and the Group's companies follow International Financial Reporting Standards accepted by the European Union, alsoconsidering the Bank of Spain Circular 4/2004.(1) Capital gains on BNL, Repsol and Andorra and non-recurrent charges for early retirements and corporate income tax booked in the second and fourth quarters of 2006.(2) Percentage changes in the profit and loss and earnings per share excluding the one-off operations in 2006.(3) Includes those related to the BBVA Group's banking, pension fund managers and insurance companies in all the American countries in which it is present.
411,916 5.0 392,389262,969 18.2 222,413283,645 9.4 259,200142,064 (0.5) 142,707425,709 5.9 401,90722,318 29.0 17,30218,210 39.7 13,036
8,374 8,374 16.2 7,20813,667 13,667 16.3 11,75615,701 15,178 16.5 13,0248,883 8,360 22.5 6,8237,030 6,533 16.8 5,5924,736 4,580 20.3 3,806
18.24 21.0 15.0864,788 26.7 51,134
1.39 1.34 19.8 1.125.13 33.4 3.8413.7 13.43.6 3.9
2.24 2.11 1.8737.6 36.4 37.01.26 1.22 1.122.12 2.05 1.9139.6 40.9 43.242.6 44.0 46.70.83 0.94
272.8 252.5
12.0 12.06.2 5.67.8 7.5
3,552 3,391864,226 984,89198,553 94,68130,582 31,15466,146 61,6041,825 1,9237,585 7,4103,635 3,5783,797 3,658
153 174

The BBVA Group has just completed its best year ever.
Vigorous performance by all business areas resulted in
significant growth in the volume of business, boosting
recurrent revenues, which are the basis of the increase in
profit. At the same time, the Group improved its
efficiency, profitability and risk quality. It is one of the
top European banks in terms of these indicators. The
highlights of the Group's performance and strategy in the
fourth quarter and the full year are summarised below:
The acquisition of Texas Regional Bancshares was
concluded in November. More recently (January
2007), State National Bank also became part of the
BBVA Group.
The Group took a decisive step in its Asia Plan with
a strategic partnership with Citic Group. This entails
an initial investment of €989m that will open the
mainland Chinese markets (through a 5% stake in
China Citic Bank) and the Hong Kong market (via a
15% stake in Citic International Financial Holdings).
The Group has also opened a representative office in
Sydney and obtained approval to open another in
Mumbai.
In the fourth quarter of 2006, the Group generated
operating profit of €2,274m, with a year-on-year
increase of 21.1% (26.0% at constant exchange
rates). Net attributable profit came to €279m,
affected by non-recurrent provisions of €777m for
early retirements (€544m after tax) and an
additional tax charge of €457m due to new rules
that will reduce the effective tax rate in future years.
Excluding these charges, net attributable profit for
the fourth quarter comes to €1,280m, an increase of
18.7% compared to the same period in 2005 (an
increase of 23.2% at constant exchange rates).
For the full year, net attributable profit was
€4,736m. However, excluding 156m of
non-recurrent items (those mentioned above in the
fourth quarter and €1,157m of capital gains
associated with BNL, Repsol and Andorra in the
second quarter), net attributable profit in 2006 comes
to €4,580m, rising 20.3% over the €3,806m
obtained in 2005. This means earnings per share
were €1.34 (up 19.8% from €1.12 in 2005) and
ROE stands at 36.4% (37.0% in 2005).
The growth in profit stems from the increase in
operating profit. This rose 22.5% year-on-year to
€8,360m (without the Repsol capital gains). At
constant exchange rates the increase is 23.2% and
the trend is upwards in recent quarters.
The strong performance of operating profit can be
traced to growth in all revenue streams. Net interest
income rose 16.2% on higher business volumes and
the improvement in spreads. Net income from fees
and insurance was up 12.6% and net trading income
rose 19.2%.
Because of the above, ordinary revenues without
non-recurrent items grew 16.5%, which was much
higher than the 9.5% increase in operating expenses
(including depreciation). This produced a further
improvement in the cost/income ratio, which now
stands at 44.0% (without Repsol capital gains),
compared to 46.7% a year earlier.
The substantial growth in lending to customers did
not affect the high quality of the loan portfolio (the
NPL ratio improved to 0.83% at year-end, compared
to 0.94% at 31-Dec-05). However, it led to hefty
generic loan-loss provisions, which increased
coverage to 272.8% (252.5% a year earlier). The
total amount of generic provisions now stands at
€4,952m, compared to €3,967m at 31-Dec-05.
In a move to strengthen shareholders' funds and
finance the Group's growth while maintaining
appropriate levels of capital adequacy, BBVA
increased its capital by €3 billion on 27th November
by means of an accelerated bookbuilding procedure
with institutional investors at €18.62 per share. As a
result, at year-end the Group's core capital stands at
6.2% (6.0% at 30-Sep-06 and 5.6% at 31-Dec-05),
Tier I capital is 7.8% and the BIS ratio 12.0%.
3
GROUP FINANCIAL INFORMATION
Relevant events

spreads also contributed. After adding net income
from fees and insurance (up 18.8%) and deducting
expenses (which rose at a slower pace), operating
profit grew 41.7%. This was sufficient to offset
higher provisions required by the increase in lending
and therefore net attributable profit came to
€1,775m (up 30.8% at constant exchange rates and
29.6% at current rates).
South America maintained the trend of previous
quarters with strong year-on-year growth in all the
main revenue streams. At constant exchange rates,
net interest income rose 28.4% (boosted by a 28.8%
increase in lending and 21.0% in customer funds).
Net income from fees and insurance rose 17.2% and
net trading income jumped 85.5%. Operating profit
increased 37.4% and net attributable profit grew
37.0% to €509m (34.4% at current exchange rates).
In December, the Group adopted a new management
structure designed to foster growth and the current
profound process of transformation and innovation,
moving towards the creation of a large global entity.
� ECONOMIC ENVIRONMENT
With world growth at about 5%, 2006 became an
extension of the economic boom that started in 2003.
Despite the risks (oil prices, adjustments in asset prices
such as the US housing market, increased disparity of
trade balances, etc), the world's economy encountered
significant support in technical innovation and the
emerging economies. This facilitated substantial growth
and low inflation. China and India played important
On 10th January the group paid a third interim
dividend of €0.132 per share against 2006 results.
This was the same amount as the July and October
dividends and 15% higher than the dividend paid a
year earlier.
All the Group's business areas reported record profits
in 2006, based on the growth of recurrent earnings.
In all cases, this exceeded the increase in expenses
and thus generated widespread improvements in
efficiency and substantial rises in operating profit.
In Retail Banking in Spain and Portugal, lending was
up 18.3% (with contributions from all main types)
and customer funds rose 9.3%. These increases,
together with the improvement in spreads, helped net
interest income to grow 9.2%. Net income from fees
and insurance was up 11.2% and costs remained
under control. Therefore, operating profit grew
14.4% and net attributable profit rose 13.8% to
€1,498m.
The Wholesale Businesses area demonstrated its
ability to generate recurrent earnings. Ordinary
revenues grew progressively during the year,
accumulating an increase of 26.1% by year-end. This
carried over to operating profit (up 30.0%) and led
to net attributable profit of €1,282m (up 47.0%).
In Mexico and the United States, the dominant factor
behind the increase in revenues was net interest
income. At constant exchange rates, this grew
33.3%, helped by sharp increases in lending and
customer funds (up 40.6% and 24.5%, respectively,
in local currencies). The improvement in customer
4
GROUP FINANCIAL INFORMATIONRelevant events
INTEREST RATES(Quarterly averages)
20054Q 3Q 2Q 1Q
20064Q 3Q 2Q 1Q
Official ECB rate
Euribor 3 months
Euribor 1 year
Spain 10 year bond
USA 10 year bond
USA Federal rates
TIIE (Mexico)
3.30 2.91 2.57 2.33 2.08 2.00 2.00 2.00
3.59 3.22 2.90 2.61 2.34 2.13 2.12 2.14
3.86 3.62 3.32 2.95 2.63 2.20 2.19 2.33
3.80 3.89 3.98 3.51 3.38 3.23 3.36 3.64
4.62 4.89 5.06 4.56 4.48 4.20 4.15 4.29
5.25 5.25 4.90 4.44 3.97 3.43 2.92 2.45
7.32 7.31 7.38 8.02 9.10 9.88 10.05 9.40

In Latin America, 2006 was also favourable. Growth
was around 5% and the economic cycles of the different
countries were largely in step. Country risk premiums
fell in a context of institutional stability, capital flowed
into the region and inflation moderated. The Mexican
economy exceeded expectations with growth of 4.6% in
2006. This was supported by domestic demand and
foreign trade and inflation was kept under control
despite a slight rebound at year-end. As a result, the
local central bank held rates steady at 7% after a series
of declines that ended in April.
In the fourth quarter, the US dollar depreciated 3.9%
against the euro, dragging most Latin-American
currencies with it. This added to the cumulative
depreciation in 2006 of currencies that have the greatest
impact on the BBVA Group's financial statements. The
Mexican peso fell 11.8%, the Chilean peso 13.8%, the
Argentine peso 11.7%, the US dollar 10.4% and the
Venezuelan bolivar 10.4%. This had a negative effect on
year-on-year comparisons on the Group's balance sheet
at 31-Dec-06. However the impact on the income
statement, which is determined by the variation in
average exchange rates between 2005 and 2006, is only
slightly negative (unlike the previous quarters of 2006).
This shows depreciations against the euro of 1.0% for
the Mexican peso, 6.2% for the Argentine peso, 2.9%
for the bolivar, 2.3% for the Colombian peso and 0.9%
for the US dollar. The Chilean peso appreciated 4.6%
against the euro.
roles but practically all regions contributed. This
generated a considerable increase in world trade. With
long-term interest rates at relatively low levels and
buoyant company earnings, share prices enjoyed an
excellent year and recovered levels not seen since the
recession in 2001.
In the USA, with the economy slowing gradually in the
second quarter, the Federal Reserve halted the upward
cycle in interest rates at 5.25% in June. From that
moment, long-term rates started a decline that led to a
negative slope on the yield curve. The 10-year US bond
fell below the Fed's benchmark rate.
The European Union enjoyed solid growth in 2006;
domestic demand recovered and exceeded expectations.
The Spanish economy benefited from these conditions
and exceeded the forecasts made at the beginning of
the year. Growth was around 3.7%, helped by a
smaller gap between the positive contributions of
domestic demand and the negative effect of the trade
balance. As soon as the momentum in activity was
confirmed, the ECB raised interest rates faster, in the
second half of 2006, bringing them to 3.5% at
year-end. This increase was reflected in short-term
market rates (one-year euribor moved up to 4% by
year-end). However, after gaining ground in the first
half, long-term rates declined in the second (although
not as fast as the US bond). This resulted in a flat yield
curve at the end of the year.
5
GROUP FINANCIAL INFORMATIONRelevant events
Year-end Exchange Rates Average Exchange Rates
EXCHANGE RATES (1)
∆% on2006 2005
∆% on ∆% on31-12-06 31-12-05 30-09-06
Mexican peso
Argentine peso
Chilean peso
Colombian peso
Peruvian new sol
Venezuelan bolivar
U.S. dollar
(1) Expressed in currency/euro.
14.3230 (11.8) (2.3) 13.6923 (1.0)
4.0679 (11.7) (2.9) 3.8806 (6.2)
703.73 (13.8) (3.2) 666.22 4.6
2,941.18 (8.4) 3.0 2,958.58 (2.3)
4.2098 (4.0) (2.2) 4.1111 (0.3)
2,824.86 (10.4) (3.8) 2,695.42 (2.9)
1.3170 (10.4) (3.9) 1.2556 (0.9)

6
In the fourth quarter of 2006, the BBVA Group's operating
profit came to €2,274m, increasing 21.1% year-on-year.
After adjusting for changes in exchange rates, which had a
negative effect in the quarter, the increase becomes 26.0%.
Net attributable profit came to €279m and the difference is
due to a series of
non-recurrent items booked during the period. The first of
these is provisions of €777m for the early retirement
programme associated with the restructuring of branch
networks in Spain and those derived from the new
organisational structure announced in December (€544m
after tax). A further €457m is required for additional
Earnings
Net attributable profit (1)
(Million euros)
(1) Excluding results of one-off transactions in 2006.(2) At constant exchange rates: +21.0%.
20062005
3,806
2Q1Q 2Q 3Q 4Q
815
9981,079
914
1Q
4,580+20.3% (2)
3Q
1,0201,159 1,121
4Q
1,280
CONSOLIDATED INCOME STATEMENT(Million euros)
Memorandum item:∆% at constant exchangerates excluding one-offs(1)2006 2006
excluding one-offs (1)∆%
excluding one-offs (1) 2005
Core net interest income
Dividends
NET INTEREST INCOMEIncome by the equity method
Net fee income
Income from insurance activities
CORE REVENUESNet trading income
ORDINARY REVENUESNet revenues from non-financial activities
Personnel costs
General expenses
Depreciation and amortization
Other operating income and expenses
OPERATING PROFITImpairment losses on financial assets
• Loan loss provisions
• Other
Provisions
Other income/losses
• From disposal of equity holdings
• Other
PRE-TAX PROFITCorporate income tax
NET PROFITMinority interests
NET ATTRIBUTABLE PROFIT(1) Capital gains on BNL, Repsol and Andorra and non-recurrent charges for early retirements and corporate income tax booked in the second and fourth quarters of 2006.
7,995 7,995 15.6 6,915 16.4
379 379 29.7 292 29.8
8,374 8,374 16.2 7,208 16.9308 308 153.2 121 153.3
4,335 4,335 10.0 3,940 10.5
650 650 33.6 487 35.6
13,667 13,667 16.3 11,756 16.92,034 1,511 19.2 1,267 19.8
15,701 15,178 16.5 13,024 17.2131 131 4.4 126 4.9
(3,989) (3,989) 10.7 (3,602) 11.3
(2,342) (2,342) 8.4 (2,160) 9.2
(472) (472) 5.2 (449) 5.7
(146) (146) 27.4 (115) 29.7
8,883 8,360 22.5 6,823 23.2(1,504) (1,504) 76.0 (854) 76.4
(1,477) (1,477) 81.6 (813) 82.0
(27) (27) (34.8) (41) (34.6)
(1,338) (561) 23.6 (454) 24.4
989 238 208.0 77 207.4
934 183 n.m. 29 n.m.
55 55 12.4 49 12.0
7,030 6,533 16.8 5,592 17.5(2,059) (1,718) 13.0 (1,521) 13.6
4,971 4,815 18.3 4,071 19.0(235) (235) (11.0) (264) (10.3)
4,736 4,580 20.3 3,806 21.0

7
GROUP FINANCIAL INFORMATIONEarnings
CONSOLIDATED INCOME STATEMENT: QUARTERLY EVOLUTION(Million euros)
20054Q 3Q 2Q 1Q
20064Q (1) 3Q 2Q (1) 1Q
Core net interest income
Dividends
NET INTEREST INCOMEIncome by the equity method
Net fee income
Income from insurance activities
CORE REVENUESNet trading income
ORDINARY REVENUESNet revenues from non-financial activities
Personnel costs
General expenses
Depreciation and amortization
Other operating income and expenses
OPERATING PROFITImpairment losses on financial assets
• Loan loss provisions
• Other
Provisions
Other income/losses
• From disposal of equity holdings
• Other
PRE-TAX PROFITCorporate income tax
NET PROFITMinority interests
NET ATTRIBUTABLE PROFIT(1) Excluding the one-off operations.
2,134 1,999 1,928 1,933 1,890 1,785 1,701 1,539
156 35 172 17 109 41 121 22
2,290 2,033 2,100 1,950 1,999 1,826 1,822 1,561 86 152 29 41 43 28 28 23
1,137 1,048 1,042 1,108 1,065 1,022 954 899
167 186 148 149 138 130 123 96
3,681 3,420 3,320 3,248 3,245 3,006 2,926 2,579 358 319 422 412 372 255 341 299
4,038 3,739 3,741 3,659 3,617 3,261 3,267 2,878 44 12 56 19 15 43 40 28
(1,043) (993) (963) (989) (982) (910) (872) (838)
(610) (570) (574) (588) (599) (551) (532) (479)
(125) (115) (104) (128) (125) (117) (105) (102)
(30) (38) (41) (38) (49) (27) (9) (31)
2,274 2,035 2,116 1,936 1,878 1,699 1,789 1,457 (441) (408) (358) (297) (296) (234) (202) (123)
(432) (395) (357) (293) (282) (227) (187) (118)
(9) (13) (1) (4) (14) (7) (15) (5)
(80) (139) (207) (135) (125) (75) (123) (131)
22 69 124 22 5 15 57 (1)
(4) 50 118 20 10 3 13 4
27 19 6 2 (5) 13 45 (4)
1,775 1,557 1,676 1,526 1,461 1,406 1,522 1,203 (452) (377) (461) (429) (315) (418) (451) (337)
1,323 1,180 1,215 1,097 1,147 988 1,070 866 (43) (59) (55) (77) (68) (73) (72) (50)
1,280 1,121 1,159 1,020 1,079 914 998 815
provisions related to company tax. New tax rules will
reduce the effective rate in future years but they require the
Group to write off its existing tax credits in 2006. Excluding
these charges, net attributable profit for the quarter would
be €1,280m, an increase of 18.7% compared to the fourth
quarter of 2005 (23.2% at constant exchange rates).
Net attributable profit for the whole year is €4,736m, an
increase of 24.4% compared to 2005 (€3,806m). Of this
amount, €156m is the net result of non-recurrent events:
the two charges mentioned above (totalling €1,001m)
and €1,157m of additional profit obtained in the second
quarter (capital gains associated with BNL, Repsol and
Andorra and the related tax charge). Excluding these, net
attributable profit would be €4,580m with an increase of
20.3%. At constant exchange rates, the increase is
slightly greater (21.0%) because –unlike previous
quarters– the impact of exchange rates on the Group's
income statement for the year is slightly negative. This
can be seen in the customary additional column on the
statement, which shows variations at constant rates.
Once again, the main factor behind profit was recurrent
earnings. Excluding capital gains related to Repsol,

8
GROUP FINANCIAL INFORMATIONEarnings
ordinary revenues grew 16.5%, whereas expenses and
depreciation grew 9.5%. This meant the cost/income
ratio improved and cumulative operating profit came to
€8,360m, climbing 22.5% over the €6,823m obtained
in 2005 (up 23.2% at constant exchange rates). This
item has been growing faster in recent quarters. After
incorporating the Repsol capital gains, operating profit
grew 30.2% to €8,883m.
The substantial operating profit offset the 81.6%
increase in generic loan-loss provisions, which were
due to the sharp increase in lending to customers. The
non-performing loan ratio in fact improved during the
year.
� NET INTEREST INCOME
Net interest income in the fourth quarter (€2,290m) set
a new record for the Group, rising 14.6% year-on-year
(19.5% at constant exchange rates). For the full year, it
came to €8,374m, an increase of 16.2% over the
€7,208m obtained in 2005 (16.9% at constant
exchange rates). Of this amount, dividends accounted
for €379m (up 29.7%) and thus net interest income
without dividends was €7,995m (up 15.6%). This
increase was due to the growth in lending and customer
funds in Spain and the Americas, as well as customer
spreads.
Spreads in the Spanish private sector maintained an
upward trend throughout the year. They rose from 2.56
percentage points in the fourth quarter of 2005, to 2.78
points in the third quarter of 2006, and to 2.88 points in
the fourth quarter. This is because increases in market
rates are largely transferred to loan yields (4.53% in the
fourth quarter, compared to 4.22% in the third quarter
or 3.69% in the fourth quarter of 2005) whereas the
cost of deposits rose more gradually to 1.64%
(compared to 1.45% in the third quarter and 1.13% in
the last quarter of 2005). For the entire year, customer
spreads were 2.75 points (12 basis points higher than a
year earlier).
In Mexico, interest rates in the fourth quarter remained
at the same level as the two previous quarters (the TIIE
has been 7.3% since the end of April). The average TIIE
in 2006 was 7.5%, compared to 9.6% in 2005. Despite
this decline in interest rates, BBVA Bancomer improved
customer spreads, which rose from 11.87 points in the
fourth quarter of 2005, to 12.59 points in the third
quarter of 2006 and to 12.50 points in the fourth
quarter. This was because the cost of funds fell to 2.43%
in the fourth quarter of 2006 (from 3.64% a year
earlier). This decrease was greater than the decline in
loan yields (14.92% in the last quarter of 2006,
compared to 15.51% a year earlier). Furthermore, these
yields benefited from strong growth in more profitable
forms of lending. These improvements in spreads and
the increase in business volume, especially lending,
boosted net interest income 33.7% year-on-year in
pesos. The South America Area also recorded strong
growth in net interest income (up 28.4% at constant
exchange rates) supported by the higher volume of
lending and deposits.
Customer spread (Domestic)(Percentage)
Yield on totalnet lending
Customerspread
Cost ofdeposits
20054Q
20063Q1Q 2Q
1.13
3.69
1.23
2.56 2.63
3.86
1.33
2.70
4.03
1.45
2.78
4.22
4Q
1.64
2.88
4.53
Net interest income(Million euros)
(1) At constant exchange rates: +16.9%.
20062005
7,208
2Q
2,033
1Q 2Q 3Q 4Q
1,5611,822
1,9991,826
1Q
1,950
8,374+16.2% (1)
3Q
2,100
4Q
2,290

9
GROUP FINANCIAL INFORMATIONEarnings
Fee income + Insurance(Million euros)
(1) At constant exchange rates: +13.2%.
20062005
4,427
3Q
1,235
1Q 2Q 3Q 4Q
9951,077
1,2031,152
1Q
1,2574,985
+12.6% (1)
2Q
1,190
4Q
1,304
Core revenues(Million euros)
(1) At constant exchange rates: +16.9%.
20062005
11,756
4Q
3,681
1Q 2Q 3Q 4Q
2,5792,926
3,2453,006
1Q
3,248
13,667+16.3% (1)
2Q
3,320
3Q
3,420
� ORDINARY REVENUES
Net fee income contributed €4,335m in 2006 (up
10.0% year-on-year). Insurance business added €650m
(up 33.6%) and this brought the total to €4,985m. This
figure is 12.6% higher than the €4,427m obtained in
2005 (13.2% higher at constant exchange rates). All the
Group's business areas recorded year-on-year increases
of two-figures. Ordinary revenues in Retail Banking in
Spain and Portugal increased 11.2%, in Wholesale
Businesses the increase was 15.7%, in Mexico and the
United States 17.6% and in South America, 15.6%.
Net income from companies carried by the equity
method came to €308m for the year, compared to
€121m in 2005. The main contributor was Corporación
IBV (€251m), boosted by the sale of part of its
investment in Gamesa. The sale of shares in BNL in May
reduced its contribution to €25m, compared to €73m in
2005.
Core revenues, which are the sum of net interest income,
net fee income, insurance and income by the equity
method, came to €3,681m in the fourth quarter
–another new record. This figure was 13.4% higher than
the same period of 2005. For the full year, core revenues
came to €13,667m, an increase of 16.3% over the
€11,756m obtained in 2005 (16.9% at constant
exchange rates).
Ordinary revenues (1)
(Million euros)
(1) Excluding Repsol capital gains in the second quarter 2006.(2) At constant exchange rates: +17.2%.
20062005
13,024
3Q
3,739
1Q 2Q 3Q 4Q
2,8783,267
3,6173,261
1Q
3,659
15,178+16.5% (2)
2Q
3,741
4Q
4,038
Net trading income in 2006 contributed €2,034m. Of
this figure, €523m were capital gains booked in the
second quarter following the sale of the Group's interest
in Repsol YPF. Excluding these, net trading income came
to €1,511m, some 19.2% higher than the €1,267m
obtained in 2005. The increase was mainly due to the
wholesale business area (market operations and the sale
of derivatives to customers) and to South America
(especially Argentina).
As a result, ordinary revenues came to €4,038m in the
fourth quarter and to €15,701m for the full year. After
discounting the Repsol capital gains, ordinary revenues
were €15,178m, up 16.5% compared to €13,024m in
2005. Adding €131m of net gains on non-financial
activities (up 4.4% from €126m in 2005), which is mainly
real estate business managed by Anida, the Group's total
operating revenues in 2006 came to €15,309m without
non-recurrent items. The year-on-year increase was 16.4%
(20.4% with the Repsol capital gains).

10
GROUP FINANCIAL INFORMATIONEarnings
� OPERATING PROFIT
Once again, operating expenses increased more slowly
than revenues. Personnel costs were up 10.7%, general
expenses 8.4% and depreciation increased 5.2%. As a
result, total expenses for 2006 came to €6,803m
including depreciation, a rise of 9.5% year-on-year
despite the significant increase in business volume and
intense marketing activity. In Spain the increase was
6.1% and in the Americas 13.5% (14.9% at constant
exchange rates and 11.2% if the impact of the additions
of Granahorrar, Laredo, Forum and Texas State Bank is
excluded).
The Group ended 2006 with 98,553 employees,
including 2,009 from Texas State Bank. During the year,
numbers fell slightly in Spain and increased in the
Americas (affected by the purchase of Forum in Chile).
The Group expanded the sales force for pension fund
managers in various countries owing to stiffer
competition. In other areas, the number of employees
declined because the sale of Andorra easily offset the
expansion in Asia. At 31-Dec-06, there were 7,585
branches, including 73 from Texas State Bank. Other
notable items include the expansion of Dinero Express in
Spain and the extension of the network in Chile and
Mexico.
The Group also improved its long-established leadership
in operating efficiency. Excluding the Repsol capital
gains, the cost/income ratio including depreciation
stands at 44.0% for 2006, an improvement of 2.7
percentage points compared to 2005 (46.7%). As
mentioned above, this is explained by the fact that
operating revenues (ordinary revenues plus net gains on
non-financial services) grew 16.4%, but administrative
expenses, net of recovered costs plus depreciation rose
only 9.8%. All business areas improved their
cost/income ratio. In Retail Banking in Spain and
Portugal it was 45.4%, in Wholesale Businesses 25.2%,
Efficiency (1)
(Percentages)
Change in revenues 2006/2005
Change in operating costs 2006/2005
Change in general expensesand depreciation 2006/2005
2004 20062005
Efficiency ratio
Efficiency ratio including depreciation
16.4
10.2 9.8
48.6
46.7
44.044.643.2
40.9
(1) Excluding Repsol capital gains in the second quarter 2006.
3,635
3,950
7,585
Number of branches
Spain
America andrest of the world
December2004
3,385
3,483
6,868
December2005
3,578
3,832
7,410
December2006
General administrative expenses +depreciation & amortization (Million euros)
(1) At constant exchange rates: +10.1%.
20062005
6,211
3Q
1,678
1Q 2Q 3Q 4Q
1,4191,509
1,7061,578
1Q
1,7056,803
+9.5% (1)
2Q
1,640
4Q
1,779
30,582
67,971
98,553
Number of employees
Spain
America andrest of the world
December2004
31,056
56,056
87,112
December2005
31,154
63,527
94,681
December2006

11
GROUP FINANCIAL INFORMATIONEarnings
EFFICIENCY(Million euros)
2005∆% excluding one-offs (1)
2006excluding one-offs (1)2006
Ordinary revenues
Net revenues from non-financial activities
TOTAL REVENUES
Personnel costs
General expenses
Recovered expenses
GENERAL ADMINISTRATIVE EXPENSES (NET)
EFFICIENCY RATIO (Costs/revenues, %)
Depreciation and amortization
GENERAL ADMINISTRATIVE EXPENSES (NET) + DEPRECIATION AND AMORTIZATION
EFFICIENCY INCLUDING DEPRECIATION AND AMORTIZATION(1) Repsol capital gains in the second quarter of 2006.
15,701 15,178 16.5 13,024
131 131 4.4 126
15,832 15,309 16.4 13,149
(3,989) (3,989) 10.7 (3,602)
(2,342) (2,342) 8.4 (2,160)
65 65 (14.1) 76
(6,265) (6,265) 10.2 (5,687)
39.6 40.9 43.2
(472) (472) 5.2 (449)
(6,737) (6,737) 9.8 (6,135)
42.6 44.0 46.7
in Mexico and the United States 38.2% and in South
America 49.7%.
The good performance of revenues and expenses led to
stronger operating profit, which rose 21.1% in the
fourth quarter to €2,274m (€1,878m in the same period
of 2005 and up 26.0% at constant exchange rates). For
the entire year, the figure is €8,360m without the Repsol
capital gains. This amount is 22.5% higher than the
€6,823m obtained in 2005 (23.2% higher at constant
rates). This growth is one percentage point higher than
the corresponding figure for the first nine months. After
adding Repsol capital gains, operating profit rose 30.2%
year-on-year to €8,883m (30.9% at constant rates). All
business areas contributed significantly with increases of
14.4% in Retail Banking in Spain and Portugal, 30.0%
in Wholesale Businesses, 40.3% in Mexico and the
United States (41.7% at constant exchange rates) and
35.0% in South America (37.4% at constant rates).
� PROVISIONS AND OTHERS
In 2006, the Group set aside €1,477m for loan-loss
provisions. This was 81.6% more than the €813m
provided in the previous year. The increase is linked to
the sharp rise in lending to customers rather than
impairment of loan quality (the NPL ratio in fact
improved during the year). Transfers to generic reserves
were €1,051m, compared to €646m in 2005.
Furthermore, other provisions made in 2006 came to
€1,338m, compared to €454m in 2005. The biggest
item is the provision of €1,054m for early retirements
(€288m in 2005). This is because the costs associated
with the network transformation plan in Spain were
booked in the fourth quarter. This plan was announced
in July and implemented in October, and together with
other related to the new organizational structure
announced in December came to €777m.
Operating profit (1)
(Million euros)
(1) Excluding Repsol capital gains in the second quarter 2006.(2) At constant exchange rates: +23.2%.
20062005
6,823
3Q
2,035
1Q 2Q 3Q 4Q
1,457
1,789 1,8781,699
1Q
1,936
8,360+22.5% (2)
2Q
2,116
4Q
2,274

12
GROUP FINANCIAL INFORMATIONEarnings
Other gains and losses include capital gains on the sale
of investments in other companies. In 2005 there were
no significant divestments and this item came to €29m.
However, in 2006 there were €934m in capital gains,
the most important of which were the sale of Banca
Nazionale del Lavoro (€568m) and Banc Internacional
de Andorra (€183m).
� ATTRIBUTABLE PROFIT
Pre-tax profit for 2006 came to €7,030m. Excluding
non-recurrent items the figure is €6,533m, compared to
€5,592m in 2005. Of the €2,059m provided for
corporate income tax, €341m are non-recurrent. New
rules will lower tax rates in future years (32.5% in 2007
and 30% from 2008 onwards, compared to 35% at
present). This will have a positive effect from 2007
onwards but the Group is obliged to write off certain tax
credits in 2006. Thus the non-recurrent provision is
made up of €379m related to the new tax rules less the
net result of tax charges and adjustments associated with
the Repsol, BNL and Andorra capital gains, together
with provisions for non-recurrent early retirements.
Excluding non-recurrent items, net profit would be
€4,815m and the year-on-year increase 18.3%. After
deducting €235m for minority interests, the net
attributable profit of the Group for 2006 is €4,580m,
an increase of 20.3% compared to the €3,806m
obtained in 2005 (21.0% at constant exchange rates).
The trend has been upwards each quarter. Including the
€156m of non-recurrent items in the second and fourth
quarters, net attributable profit rose 24.4% to €4,736m.
By business area, Retail Banking in Spain and Portugal
contributed €1,498m (up 13.8%), Wholesale Businesses
contributed €1,282m (up 47.0%), Mexico and the
United States €1,775m (up 29.6% in euros terms and
30.8% at constant exchange rates) and South America
€509m (up 34.4% at current rates and 37.0% at
constant rates). Corporate Activities's contribution was
negative €329m ( €132m in 2005).
Earnings per share in 2006 were €1.34 without
non-recurrent items, rising 19.8% over the €1.12
generated in 2005. The increase is less than the rise in
net attributable profit owing to the capital increase in
November. If non-recurrent items were included,
earnings per share would be €1.39. Return on equity
(ROE) without non-recurrent items stands at 36.4%
(37.0% in 2005) and the return on total assets (ROA) is
1.22% (1.12% in 2005).
ROE(Percentage)
33.2
37.0 36.4 (1)
2004 2005 2006
(1) Excluding results of one-off transactions.
ROA(Percentage)
0.97
1.12
1.22 (1)
2004 2005 2006
(1) Excluding results of one-off transactions.
Earnings per share(Euros)
0.87
2004 2005 2006
1.12
1.39 +23.9%
(1) Excluding results of one-off transactions.
+19.8% (1)
0.05
1.34 (1)

13
Total lending (gross)(Billion euros)
177
December2004
December2005
December2006
222
263
+18.2% (1)
(1) At constant exchange rates: +20.9%.
TOTAL LENDING(Million euros)
30-09-0631-12-05∆%31-12-06
Public sector
Other domestic sectors
• Secured loans
• Commercial loans
• Other term loans
• Credit card debtors
• Other
• Financial leases
Non-domestic sector
• Secured loans
• Other loans
Non-performing loans
• Public sector
• Other domestic sectors
• Non-domestic sectors
TOTAL LENDING (GROSS)
Loan loss provisions
TOTAL NET LENDING
15,942 (0.9) 16,088 15,004
166,375 19.5 139,232 159,092
90,649 14.6 79,128 88,319
13,286 4.9 12,671 12,565
51,241 33.9 38,273 47,628
1,506 21.7 1,237 1,211
2,695 59.1 1,695 2,500
6,997 12.3 6,229 6,869
78,160 20.7 64,747 72,179
25,492 16.8 21,824 22,501
52,669 22.7 42,923 49,678
2,492 6.2 2,346 2,331
127 4.9 121 129
953 19.9 795 893
1,411 (1.3) 1,430 1,309
262,969 18.2 222,413 248,606
(6,404) 15.1 (5,563) (6,041)
256,565 18.3 216,850 242,565
In 2006 the volume of the BBVA Group's business
with customers grew significantly. Growth in lending
was particularly intense. In Spain, it was reasonably
balanced across all the main types of loans (residential
mortgages, consumer finance, SMEs and small
businesses). It also grew in most countries in the
Americas, especially in lending to private individuals
and SMEs. Deposits reported on the balance sheet
(term deposits, current accounts and savings accounts)
grew strongly in Spain and, in the Americas, current
accounts, savings accounts and pension funds also
recorded significant growth. American currencies lost
ground against the euro during the year. The Mexican
peso fell 11.8%, the Chilean peso 13.8%, the
Argentine peso 11.7%, the US dollar 10.4%, the
Venezuelan bolivar 10.4%, the Colombian peso 8.4%
and Peruvian sol 4.0%. This distorts year-on-year
comparisons, therefore percentages for the main
figures are also stated at constant exchange rates so
readers can analyse local management performance in
each case.
� LENDING TO CUSTOMERS
At the end of 2006, lending to customers came to €263
billion, rising 18.2% compared to €222 billion at
31-Dec-05. At constant exchange rates, the increase was
20.9%.
Of this amount, lending to the domestic private sector
accounted for €166 billion, increasing 19.5% over the
figure at 31-Dec-05 (€139 billion). In previous years,
growth was mainly associated with secured loans but in
Business activity

14
GROUP FINANCIAL INFORMATIONBusiness activity
more than 20% in Argentina, Chile, Colombia, Peru and
Venezuela). International wholesale banking also
contributed.
Finally, non-performing loans (NPLs) rose 6.2%
year-on-year to €2.5 billion. Total lending rose faster,
therefore the Group's NPL ratio improved once again.
This is examined in greater detail in the section on risk
management.
� CUSTOMER FUNDS
Total customer funds, on and off the balance sheet, came
to €426 billion at 31-Dec-06, an increase of 5.9% over
the €402 billion a year earlier (9.6% at constant
exchange rates).
In 2006, most of the growth occurred in customer funds
on the balance sheet, which rose 9.4% to €284 billion,
compared to €259 billion at 31-Dec-05 (up 12.5% at
constant rates). Of this figure, customer deposits
accounted for €192 billion (up 5.3%, or 9.5% at
constant rates), marketable debt securities accounted for
€78 billion (up 23.6%) and subordinate liabilities
(subordinate debt and preference shares) represented
€14 billion (down 0.9%).
Customer funds off the balance sheet consist of mutual
funds, pension funds and customers' portfolios. At
31-Dec-06 they came to €142 billion, which was slightly
lower than a year earlier (€143 billion) although at
constant exchange rates they increased 4.3%. Of this
sum, Spain accounts for €76 billion, up 2.0% owing to
customers' preference for time deposits in 2006, rather
Total lending to other domestic sectors(gross) (Billion euros)
118
December2004
December2005
December2006
139
166
+19.5%
Detail of total lending to otherdomestic sectors (gross) (Percentage)
Secured loans
Other loans
December2004
54.6
45.4
December2005
56.8
43.2
December2006
54.5
45.5
Customer funds(Billion euros)
Off-balance-sheet customerfunds
On-balance-sheet customerfunds
122
208
143
259
December2004
December2005
December2006
142
284
+5.9% (1)
329
402 426
(1) At constant exchange rates: +9.6%.
2006, it was more evenly spread. In fact, secured loans
grew to nearly €91 billion at 31-Dec-06, a year-on-year
increase of 14.6% (18.6% in the case of residential
mortgages). However, growth has slowed in recent
quarters and these loans have become a smaller
percentage of total lending to the domestic private sector
although they still account for 54.5%. Nonetheless,
lending to small and medium enterprises and to small
businesses is as buoyant as it was in 2005. Furthermore,
other types of lending to private individuals (consumer
finance and credit cards) are booming. All this is
reported under 'Other term loans' (consumer finance
and a major part of SME finance) which rose 33.9%,
and under credit cards (up 21.7%). Lending in the
domestic sector is complemented by public sector loans,
whose balance is similar to a year earlier (€16 billion).
Lending to non-resident customers rose 20.7% to €78
billion (€65 billion at 31-Dec-05). The increase was
30.3% at constant exchange rates. This was the result of
strong lending growth in most countries in the Americas
(in local currencies the increase was 30% in Mexico and

15
GROUP FINANCIAL INFORMATIONBusiness activity
Of the above amount, current and savings accounts
represent €48 billion (up 15.8%) and more stable funds
(time deposits, pension funds and mutual funds)
accounted for the remaining €89 billion (up 9.3%). As
mentioned above, in 2006, customers were more
interested in time deposits than mutual funds and this
was reflected in the corresponding figures. Time deposits
increased 35.5% to nearly €28 billion whereas mutual
funds fell 1.8% to €45 billion. Pension funds grew
8.0% to €16 billion, especially individual plans, which
increased 10.2%.
Domestic public-sector debits came to €7 billion at
31-Dec-06, affected negatively by the amounts allocated
in the Treasury's liquidity auctions. Excluding these
amounts, the level is similar to a year earlier.
than mutual funds. The other countries in which the
Group operates accounted for the remaining €66
billion. The year-on-year decline of 3.1% (up 7.1% at
constant exchange rates) is explained by the sale of Banc
Internacional in Andorra. At 31-Dec-05, this bank
contributed €7,382m to these funds. On a like-for-like
basis the amount actually increased 8.7% (21.7% at
constant rates).
In Spain, the figure that best represents customer funds
is the aggregate of domestic private-sector deposits
(excluding repurchase agreements and other such
accounts) plus mutual and pension funds. By the end of
2006, this figure had risen 11.5% year-on-year to €137
billion (especially deposits, which climbed 22.3% to
€75 billion).
CUSTOMER FUNDS(Million euros)
30-09-0631-12-05∆%31-12-06
ON-BALANCE-SHEET CUSTOMER FUNDS
DEPOSITSPublic sector
Other domestic sectors
• Current and savings accounts
• Time deposits
• Assets sold under repurchase agreement
• Other
Non-domestic sector
• Current and savings accounts
• Time deposits
• Assets sold under repurchase agreement
and other accounts
MARKETABLE DEBT SECURITIESMortgage bonds
Other marketable securities
SUBORDINATED DEBT
OTHER CUSTOMER FUNDSMutual funds
Pension funds
Customer portfolios
TOTAL CUSTOMER FUNDS
283,645 9.4 259,200 272,072
192,374 5.3 182,635 184,8887,124 (27.0) 9,753 13,370
94,393 18.4 79,755 85,259
47,806 15.8 41,273 47,519
27,682 35.5 20,435 23,592
9,081 (24.5) 12,030 7,294
9,824 63.3 6,017 6,854
90,857 (2.4) 93,127 86,259
37,699 7.3 35,118 33,070
42,910 (10.3) 47,814 44,148
10,249 0.5 10,195 9,041
77,674 23.6 62,842 74,44936,029 33.8 26,927 33,074
41,645 16.0 35,915 41,375
13,597 (0.9) 13,723 12,735
142,064 (0.5) 142,707 136,35158,452 (0.9) 59,002 58,545
57,147 5.9 53,959 53,500
26,465 (11.0) 29,746 24,306
425,709 5.9 401,907 408,423

16
GROUP FINANCIAL INFORMATIONBusiness activity
In the case of non-resident customers, the aggregate
figure used above for the domestic sector (deposits
excluding repurchase agreements and other such
accounts, plus mutual and pension funds) came to €134
billion, which was similar to 31-Dec-05. At constant
exchange rates, the amount increased 9.4%. As in
recent quarters, cheaper deposits such as current and
savings accounts led the way, rising 7.3% to €38 billion
(up 18.0% at constant exchange rates).
Other, more stable funds fell 2.6% to €97 billion (up
6.4% at constant rates). Of these, pension funds
accounted for €41 billion (up 5.1% at current exchange
rates or 19.4% at constant rates) and mutual funds
represented €13 billion (up 2.4% and 11.9%). Time
deposits accounted for the remaining €43 billion, falling
10.3% (down 4.8% at constant exchange rates), affected
by the strategy followed in Mexico. This encourages a
shift to assets sold under repurchase agreements (which
are accounted elsewhere) and to mutual funds.
OTHER CUSTOMER FUNDS(Million euros)
30-09-0631-12-05∆%31-12-06
SPAIN
MUTUAL FUNDSMutual Funds (ex Real Estate)
• Monetary and short term fixed-income
• Long-term fixed income
• Balanced
• Equity
• Guaranteed
• Global
Real Estate investment trusts
PENSION FUNDSIndividual pension plans
Corporate pension funds
CUSTOMER PORTFOLIOS
REST OF THE WORLDMutual funds
Pension funds
Customer portfolios
OTHER CUSTOMER FUNDS
76,080 2.0 74,619 75,431
45,491 (1.8) 46,340 46,15443,273 (2.8) 44,507 44,047
15,496 (15.6) 18,353 15,567
1,783 (5.7) 1,891 1,985
1,577 (23.6) 2,064 1,714
4,182 15.3 3,626 3,942
17,094 (3.6) 17,725 17,273
3,142 270.6 848 3,566
2,218 21.0 1,833 2,107
16,291 8.0 15,091 15,4999,249 10.2 8,395 8,599
7,042 5.2 6,697 6,900
14,298 8.4 13,188 13,778
65,984 (3.1) 68,088 60,92012,961 2.4 12,662 12,391
40,856 5.1 38,867 38,001
12,167 (26.5) 16,558 10,528
142,064 (0.5) 142,707 136,351

Distribution of economic capital byrisk type (Data in attributable terms, 31-12-06)
Operational11.4%
Market27.5%
Credit58.0%
Others3.2%
17
� MAP OF ECONOMIC CAPITAL
At the end of December 2006, the BBVA Group's
economic capital at risk (ECR) was €17,308m and the
breakdown by risk type remained stable. Lending risk
accounts for 58%, market risk 27.5%, operational risk
11.4% and other risks 3.2%.
By business area, Retail Banking in Spain and Portugal
consumes 25.5% of ECR and Wholesales Businesses 24%.
Mexico and the United States increased its share of the
total to 24.2% following the important growth in business
volume in Mexico and the recent acquisition in Texas.
South America accounts for 9.7% and the rest of the
Group (mainly holdings in other companies and structural
risks related to the balance sheet) absorbs 16.7%.
Expected losses on performing loans, in attributable
terms and adjusted for the economic cycle, were
€2,030m. The exposures of Wholesale Businesses and
Retail Banking in Spain & Portugal are similar and
together they account for 74% of the Group's total. The
ratio of expected losses to exposure in each case is
0.16% and 0.35%, respectively. Mexico and the United
States accounts for 20% of exposure to lending risk and
the expected loss is 1.27%. South America's exposure in
this case is 5.7% of total and the expected loss is 1.64%.
� LENDING RISK
The sharp growth in lending to customers in 2006,
which is discussed in the section on business activity, did
not impair the overall quality of the loan portfolio,
which remains at excellent levels. It is emerging as one of
the BBVA Group's strong points compared to other large
European banking groups.
Total exposure with customers (including contingent
liabilities) came to €305 billion in 2006, an increase of
21.0% (€252 billion at 31-Dec-05). Furthermore,
lending growth during the year in Spain and the
Americas was particularly strong in products such as
consumer finance, credit cards and SME lending. These
are more profitable but entail a potentially higher level
of default than products such as mortgages which,
moreover, slowed slightly in Spain.
Despite this, the increase in non-performing assets (up
6.3% to €2,531m, compared to €2,382m a year earlier)
was much less than the rise in total risk.
In fact, non-performing assets as a percentage of total
risk at 31-Dec-06 fell to 0.83%, from 0.94% at the end
of 2005. However, it should be pointed out that this
improvement mainly occurred in the first half. In the
second half they increased at a similar rate as total
exposure. At the end of 2006, the non-performing loan
(NPL) ratio in Retail Banking in Spain and Portugal was
Risk management
Attributable expected lossesby business areas(Percentage over exposure, 31-12-06 )
Weight ofexposureover Grouptotal
Expectedloss
Retail BankingSpain and Portugal
Mexicoand USA
SouthAmerica
Wholesale andInvestment Banking
0.35%
1.27%
1.64%
0.16%
36.8%
20.2%
5.7%
37.3%
Distribution of economic capitalby business area (Data in attributable terms, 31-12-06)
Others16.7% Retail Banking
Spain and Portugal25.5%
Wholesale andInvestment Banking
24.0%
South America9.7%
Mexico and USA24.2%

18
GROUP FINANCIAL INFORMATIONRisk management
0.67%, similar to the level at 31-Dec-05 (0.65%) despite
the change in the structure of lending. Wholesale
Businesses improved to 0.22% (0.29% a year earlier)
and Mexico and the United States improved to 2.19%
(2.24%) despite sharp growth in consumer finance and
cards. South America also improved to 2.67% (3.67%).
Lending growth continues to require additional loan-loss
provisioning, with generic provisions up sharply. At the
end of 2006, the balance of coverage funds came to
€6,905m, rising 14.8% over the €6,015m level at
VARIATIONS IN NON-PERFORMING ASSETS(Million euros)
20054Q
20064Q 3Q 2Q 1Q
BEGINNING BALANCE (1)
Net variation Entries
Outflows
Write-offs
Exchange rate differences and other
PERIOD-END BALANCE (1)
MEMORANDUM ITEM:• Non-performing loans
• Non-performing contingent liabilities
(1) Including contingent liabilities.
2,361 2,240 2,325 2,382 2,299
170 121 (85) (57) 83821 715 607 598 622
(507) (433) (454) (436) (455)
(198) (191) (163) (156) (228)
54 30 (75) (63) 144
2,531 2,361 2,240 2,325 2,382
2,492 2,331 2,214 2,297 2,346
40 30 26 28 36
CREDIT RISK MANAGEMENT(Million euros)
30-09-0631-12-05∆%31-12-06
TOTAL RISK EXPOSURE (1)
Non-performing assets
Total risks
Provisions
NPL ratio (%)
NPL coverage ratio (%)
MEMORANDUM ITEM:Foreclosed assets
Foreclosed asset provisions
Coverage (%)
(1) Including contingent liabilities.
2,531 6.3 2,382 2,361
305,250 21.0 252,275 286,576
6,905 14.8 6,015 6,510
0.83 0.94 0.82
272.8 252.5 275.8
222 (38.8) 363 268
82 (51.9) 170 130
36.8 46.8 48.7
0.82
Non-performing loan ratio(Percentage)
0.94
December March SeptemberJune
1.13
0.90
2004 2006
0.82
December2005
December
0.83

19
GROUP FINANCIAL INFORMATIONRisk management
31-Dec-05. Cumulative generic provisions increased
24.8% during the year to €4,952m and now represent
71.7% of the total. Coverage (the ratio of coverage
funds to NPLs) stands at 272.8% (252.5% a year
earlier) and all business areas maintain high levels.
Coverage in Retail Banking in Spain and Portugal is
264.5% (275.6% at 31-Dec-05), in Wholesale
Businesses it is 707.9% (561.5%), in Mexico and the
United States 248.9% (251.3%) and in South America it
is 132.8% (109.3%).
� MARKET RISK
During the fourth quarter of 2006, market exposure of
the BBVA Group, measured by value-at-risk (VaR),
remained similar to the previous quarter with an average
of €18.9m and ended the year at €20.7m. The average
weighted consumption of limits at year-end stood at a
moderate level (39%).
By geographic area, Europe and the USA accounted for
72.7% of average market risk in the fourth quarter (an
increase compared to the previous quarter). The
remaining 27.3% corresponds to Latin-American banks,
mainly Mexico (17.9%) and Chile.
In terms of risk type, the predominant factor is interest
rate risk (27% of the total excluding the diversification
effect and 51% if spread-related risk is considered). This
is followed by stock-market exposure (21%), volatility
risk associated with optional positions (18%),
correlation risk (11%) and exchange-rate risk (3%).
MARKET RISK BY RISK FACTORS(Fourth Quarter 2006. Million euros)
Daily VaRAverage Maximum Minimum31-12-06
Interest (1)
Exchange rate (1)
Equity (1)
Vega and correlation
Diversification effect
TOTAL(1) Includes gamma risk of fixed-income, exchange rate and equity options respectively. Interest risk includes the spread.
12.1 11.0 13.3 8.9
0.7 1.3 3.6 0.5
5.8 4.7 5.8 3.8
5.2 5.1 7.0 4.5
(3.1) (3.2) - -
20.7 18.9 22.6 15.4
Trends in market risk(VaR, million euros)
30-12-05
0
10
20
30
31-3-06 30-6-06 29-9-06 29-12-06
Market risk by geographical areas(Average fourth quarter 2006)
Mexico
Banks in Europe and USA
Other LatinAmerica banks
9.4%
17.9%
72.7%
275.1
Coverage ratio(Percentage)
252.5
219.7
261.7
272.8
December March SeptemberJune2004 2006
December2005
December
275.8

20
According to the rules of the Bank for International
Settlements (BIS), the capital base of the BBVA Group at
the end of 2006 was €30,164m, an increase of 8.5%
compared to 30-Sep-06. Risk-weighted assets increased
4.3% in the fourth quarter to €252,373m. Therefore,
the capital base surplus, in excess of the 8% of
risk-weighted assets required by the rules, was €9,974m,
an increase of 18.2% since the end of the previous
quarter.
This means the BIS ratio stands at 12.0%, compared to
11.5% in September 2006 and 12.0% in December 2005.
The acquisition of Texas Regional Bancshares was
concluded in the fourth quarter and this generated
€1,257m in goodwill and an increase of €3,351m in
risk-weighted assets.
In November, the BBVA Group increased share capital
by €3,000m, which it placed entirely with institutional
investors. It issued 161,117,078 new shares at €18.62
per share. This capital has considerably increased the
bank's capital adequacy, particularly the core capital
ratio, which measures the high quality equity applicable
to banks.
Capital base
CAPITAL BASE (BIS REGULATION)(Million euros)
31-12-0530-09-0631-12-06
Called-up share capital
Reserves
Minority interests
Deductions
Net attributable profit
CORE CAPITAL
Preference shares
CAPITAL (TIER I)
Subordinated debt
Valuation adjustments and other
Deductions
OTHER ELIGIBLE CAPITAL (TIER II)
CAPITAL BASE
Minimum capital requirement (BIS Regulation)
CAPITAL SURPLUS
RISK-WEIGHTED ASSETS
BIS RATIO (%)
CORE CAPITAL (%)
TIER I (%)
TIER II (%)
1,740 1,662 1,662
13,694 10,913 9,517
705 698 889
(5,327) (3,146) (3,723)
4,736 4,457 3,806
15,549 14,584 12,151
4,025 4,025 4,128
19,574 18,609 16,279
8,783 7,534 7,996
1,842 1,697 2,563
(34) (36) (793)
10,591 9,195 9,766
30,164 27,804 26,045
20,190 19,364 17,351
9,974 8,440 8,694
252,373 242,045 216,890
12.0 11.5 12.0
6.2 6.0 5.6
7.8 7.7 7.5
4.2 3.8 4.5

21
GROUP FINANCIAL INFORMATIONCapital base
At 31-Dec-06, core capital stands at €15,549m, after
increasing 6.6% during the quarter. This is 6.2% of
risk-weighted assets, compared to 6.0% at 30-Sep-06 or
5.6% at 31-Dec-06.
After adding preference shares, Tier I capital came to
€19,574m at the end of 2006. This amount is 7.8% of
risk-weighted assets (7.7% at 31-Sep-06 and 7.5% at
31-Dec-05). The ratio of preference shares to core
equity, in accordance with the BIS rules, fell to 20.6%.
Other eligible capital, which mainly consists of
subordinate debt and revaluation reserves, amounted to
€10,591m. Thus, Tier II came to 4.2% (3.8% at
30-Sep-06 and 4.5% at 31-12-05).
During the fourth quarter, the bank issued €1,000m in
subordinate debt, aimed at institutional investors. This
issue matures in 2016 with an early redemption option
in 2011 and a coupon of 50-basis points if the issue is
not redeemed after the fifth year. A $200m issue of
subordinated debt matured in November.
� RATINGS
In December 2006, Standard & Poor´s changed its outlook
on BBVA from stable to positive, raising the possibility of
an upgrade if the bank continues to outperform in all
business lines, including sound profitability and healthy
asset quality. The agency also said the integration of the
recent acquisitions and prudent management of expansion
policy are other factors to be taken into account.
3.8
11.5
6.0
7.7
Capital base: BIS ratio(Percentage)
Tier II
Core capital
4.5
7.5
December2005
December2006
12.0
Tier I
5.6
September2006
4.2
12,0
6.2
7.8
Capital surplus(Million euros)
8,694
December2005
September2006
8,440
December2006
9,974
RATINGS
Financial strengthShort termLong term
Moody’s
Fitch - IBCA
Standard & Poor’s
Aa2 P-1 B+
AA- F-1+ A/B
AA- A-1+ –

22
The predominant international conditions in the fourth
quarter of 2006 were similar to previous quarters. Stock
markets were up thanks to the same factors that led to
their stability (moderate interest rates and strong corporate
earnings). However, the dollar remained under pressure
and doubts arose regarding asset quality cycle. The Ibex 35
continued to gain ground with an increase of 9.4% in the
quarter. It thus ends an exceptional year in which it
climbed 31.8%. During the quarter, the Stoxx 50 rose
4.1% and the S&P 500 put on 6.2%, closing the year with
increases of 10.4% and 13.6%, respectively.
In 2006, the European banking sector followed the
broader market, which was particularly favourable after
the summer. In fact, banks outperformed general indices
(Stoxx Banks was up 19.1% for the year). Against this
backdrop, BBVA's share price climbed 21.0% during the
year, outperforming the sector average.
Analysts viewed the Group's third quarter results positively,
pronouncing them generally in line with forecasts. Positive
factors include the consistency of the figures, the strength of
lending in retail banking and the developments in Mexico.
They also considered BBVA's acquisitions in China and
Hong Kong favourably, noting the strategic implications.
These additions will boost wholesale business in the region
and capitalise on the Group's leading position in trade
between Latin America and China. On 27th November,
BBVA announced a capital increase of €3,000m, which it
placed with institutional investors in Spain and abroad.
During the fourth quarter, BBVA's share price varied
between €17.91 and €20.26, closing at €18.24 on 31st
The BBVA share
Market capitalization(Million euros)
44,251
December2004
December2005
December2006
51,134
64,788
+26.7%
Share price index (30-12-05=100)
30-12-05 31-3-06 30-6-06 29-9-06 29-12-06
EuropeStoxx Banks
Stoxx 50
BBVA
90
95
100
105
110
115
120
125
130
23
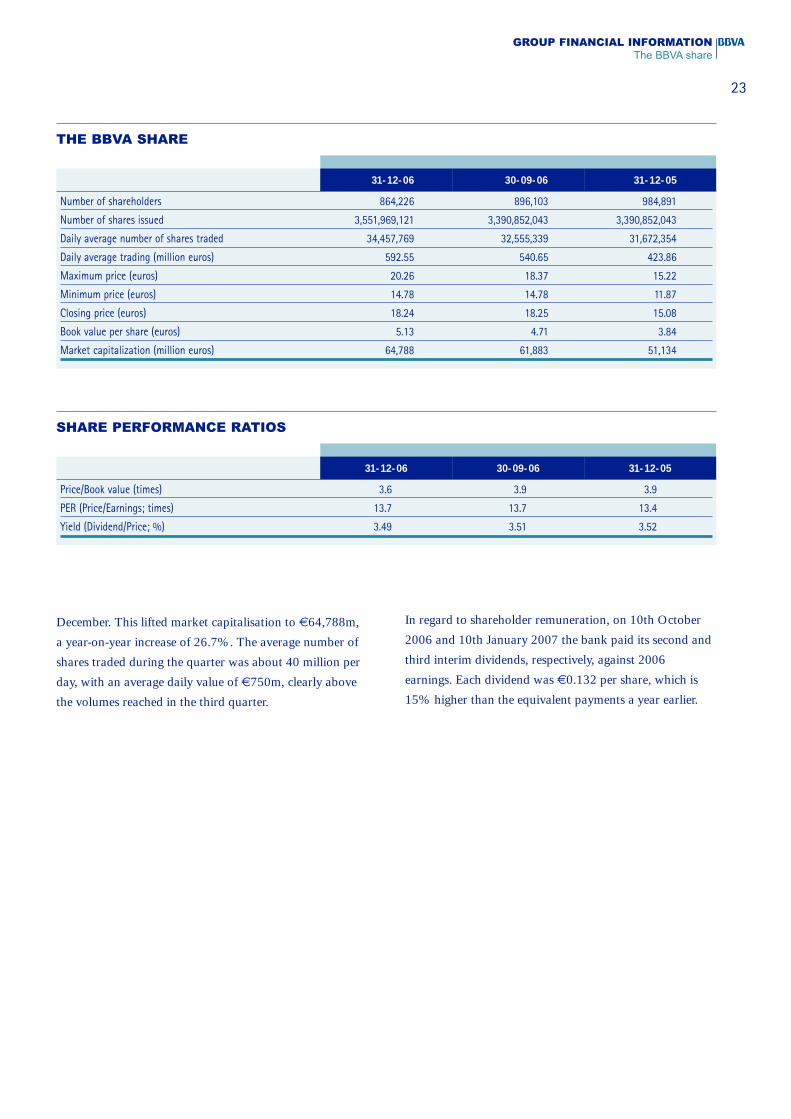
GROUP FINANCIAL INFORMATIONThe BBVA share
December. This lifted market capitalisation to €64,788m,
a year-on-year increase of 26.7%. The average number of
shares traded during the quarter was about 40 million per
day, with an average daily value of €750m, clearly above
the volumes reached in the third quarter.
In regard to shareholder remuneration, on 10th October
2006 and 10th January 2007 the bank paid its second and
third interim dividends, respectively, against 2006
earnings. Each dividend was €0.132 per share, which is
15% higher than the equivalent payments a year earlier.
THE BBVA SHARE
31-12-0530-09-0631-12-06
Number of shareholders
Number of shares issued
Daily average number of shares traded
Daily average trading (million euros)
Maximum price (euros)
Minimum price (euros)
Closing price (euros)
Book value per share (euros)
Market capitalization (million euros)
864,226 896,103 984,891
3,551,969,121 3,390,852,043 3,390,852,043
34,457,769 32,555,339 31,672,354
592.55 540.65 423.86
20.26 18.37 15.22
14.78 14.78 11.87
18.24 18.25 15.08
5.13 4.71 3.84
64,788 61,883 51,134
SHARE PERFORMANCE RATIOS
30-09-06 31-12-0531-12-06
Price/Book value (times)
PER (Price/Earnings; times)
Yield (Dividend/Price; %)
3.6 3.9 3.9
13.7 13.7 13.4
3.49 3.51 3.52
24
Information by area is a fundamental tool for monitoring and
controlling the Group’s various businesses. In this section we
report and discuss the more significant aspects of the business
activities and earnings of the Group’s different business areas,
together with those of their main units.
The breakdown by business area starts at the lowest level
where all the initial accounting data for the business in
question are kept. Management classifies and combines data
from these units in accordance with a defined structure by the
Group to arrive at the picture for the principal units and,
finally, for the entire area itself. Likewise, the Group’s
individual companies also belong to different business areas
according to their type of activity. If a company’s activities do
not match a single area, the Group assigns them and its
earnings to a number of relevant units.
Once management has defined the composition of each area,
it applies the necessary management adjustments inherent in
the model. The most relevant of these are:
Capital: the Group allocates economic capital commensurate
with the risks incurred by each business (CER). This is based
on the concept of unexpected loss at a certain level of
statistical confidence, depending on the Group’s targets in
terms of capital adequacy. These targets are applied at two
levels: the first is core equity, which determines the allocated
capital. The Bank uses this amount as a basis for calculating
the return generated on the equity in each business (ROE).
The second level is total capital, which determines the
additional allocation in terms of subordinate debt and
preference shares. The CER calculation combines lending
risk, market risk (including structural risk associated with the
balance sheet and equity positions), operational risk and fixed
asset and technical risks in the case of insurance companies.
Shareholders’ equity, as calculated under BIS rules, is an
extremely important reference to the entire Group.
However, for the purpose of allocating capital to business
areas the Bank prefers CER. It is risk-sensitive and thus
linked to the management policies for the individual
businesses and the business portfolio. This procedure
anticipates the approach likely to be adopted by the future
Basel II rules on capital. These provide an equitable basis
for assigning capital to businesses according to the risks
incurred and make it easier to compare returns.
In this report the above method of allocating capital is
applied to all business units without exception (in previous
years, capital was assigned to most units in the Americas
based on book value).
Internal transfer prices: management uses rates adjusted for
maturity to calculate the margins for each business. It also
revises the interest rates for the different assets and
liabilities that make up each unit’s balance sheet.
Assignment of operating expenses: the Bank assigns direct and
indirect costs to the business areas except for those where
there is no close and defined relationship, ie, when they are of
a clearly corporate or institutional nature for the entire Group.
Cross-business register: in some cases, and for the correct
assignment of results, consolidation adjustments are done
to eliminate double accounting produced by the incentives
given to boost cross-business between units.
In the breakdown of information, the top level comprises the
business areas. They are broken down into their main
operating units and information is provided for these as well.
The arrangement of the areas is different to that in 2005 and
reflects the structure adopted for 2006.
– Retail Banking in Spain and Portugal:
• Financial services
• Asset management and private banking
– Wholesale Businesses:
• SMEs and corporations
• Global businesses
– Businesses in Mexico and the United States:
• Banking businesses
• Pensions and insurance
– Businesses in South America:
• Banking businesses
• Pensions and insurance
Apart from the above units, all areas contain an extra unit
(see information by segment in the section on financial
statements) composed by other businesses as well as
eliminations and unassigned items.
The Corporate Activities area handles the Group’s general
management functions. These mainly consist of structural
positions for interest and exchange rates, liquidity and
shareholders’ funds. It also includes the industrial portfolio
management unit and financial shareholdings. The Group’s
companies in Andorra have also been reported under this area
until their disposal.
BUSINESS AREAS

25
BUSINESS AREAS
Mexico and the United States: this area includes the
banking, insurance and pension businesses in Mexico and the
United States (including Puerto Rico).
South America: this consists of banking, insurance and
pension businesses in South America.
The information on each area and on the units it contains
consists of an income statement and balance sheet –with
details of the main items such as inter-area positions and the
allocation of economic capital. There is also a series of key
indicators including lending to customers, customer
deposits, off-balance sheet customer funds, ROE,
cost/income ratio, non-performing loans and coverage
ratios. We also provide the income statement and balance
sheet for Corporate Activities. This show the liquidity
assigned to the other areas and their capital allocations
(under assets) as well as the Group's funding and equity
accounts (under liabilities).
The figures for 2005 have been recalculated based on the
same criteria and area structure to provide a uniform
year-on-year comparison. As usual, in the case of units in
the Americas, we provide the year-on-year percentage
changes calculated at constant exchange rates as well as at
current rates.
The second level is geographic. The section on financial
statements gives information by country in the Americas in
which each contains banking, pensions and insurance
activities. Owing to its relevance, we show the complete
income statement for Mexico (which combines the statements
of Bancomer and of the pension and insurance activities in
that country). Lastly, to complete the geographic breakdown,
business in Europe comprises Retail Banking in Spain and
Portugal and Wholesale Businesses.
Thus the present composition of the Group’s main business
areas is as follows:
Retail Banking in Spain and Portugal: this includes
the financial services unit, ie, individual customers, small
companies and businesses in the domestic market, plus
consumer finance provided by Finanzia and Uno-e, mutual
and pension fund managers, private banking, the insurance
business and BBVA Portugal.
Wholesale Businesses: this area consists of the corporate
banking unit, including SMEs (previously reported under Retail
Banking), large companies and institutions in the domestic
market. Global Businesses covers the global customers unit,
investment banking, treasury management and distribution.
The area also takes care of business and real estate projects.
NET ATTRIBUTABLE PROFIT BY BUSINESS AREA(Million euros)
2005∆%2006
Retail Banking in Spain and Portugal
Wholesale and Investment Banking
Mexico and USA
South America
Corporate Activities
BBVA GROUP NET ATTRIBUTABLE PROFIT
1,498 13.8 1,317
1,282 47.0 873
1,775 29.6 1,370
509 34.4 379
(329) 149.0 (132)
4,736 24.4 3,806
ROE AND EFFICIENCY(Percentage)
Efficiency including depreciation and amortization2006 2005
ROE2006 2005
Retail Banking in Spain and Portugal
Wholesale and Investment Banking
Mexico and USA
South America
BBVA GROUP(1) Excluding the one-off operations in 2006.
35.6 34.6 45.4 47.4
31.8 24.4 25.2 28.6
46.7 44.2 38.2 43.8
31.8 30.1 49.7 52.6
36.4 (1) 37.0 44.0 (1) 46.7

26
Retail Banking in Spain and Portugal
Retail Banking in Spain and Portugal Memorandum item:
BALANCE SHEET(Million euros)
Financial Services31-12-06 ∆% 31-12-05
Asset Management and Private Banking31-12-06 ∆% 31-12-0531-12-06 ∆% 31-12-05
Cash and balances at Central BanksFinancial assetsLoans and receivables
• Due from banks• Loans to customers• Other
Inter-area positionsProperty, plant and equipmentOther assetsTOTAL ASSETS / LIABILITIES AND EQUITYDeposits by Central Banks
and banksDue to customersMarketable debt securitiesSubordinated debtInter-area positionsOther liabilitiesMinority interestsShareholders' funds
1,569 17.1 1,340 1,490 17.5 1,268 14 157.9 511,863 (9.8) 13,159 329 (35.7) 511 369 (20.9) 466
120,449 18.6 101,561 111,936 18.1 94,783 2,970 37.4 2,1622,586 8.5 2,384 153 (9.9) 170 1,318 26.5 1,042
117,218 18.3 99,095 111,617 18.0 94,602 1,456 30.1 1,119645 n.m. 81 166 n.m. 12 196 n.m. -
- - - - - - - - -1,218 8.4 1,123 1,083 9.3 991 13 (23.5) 171,462 (20.2) 1,831 864 32.8 651 76 (32.9) 113
136,561 14.7 119,014 115,702 17.8 98,204 3,442 24.5 2,764
7,117 25.4 5,677 3,612 15.7 3,122 337 (1.6) 34360,327 21.6 49,627 57,516 23.6 46,543 1,153 8.7 1,061
77 86.2 42 73 75.7 42 4 n.m. -2,563 17.3 2,186 2,056 14.6 1,794 117 10.4 106
44,502 5.4 42,209 42,854 4.4 41,048 1,301 65.2 78817,549 14.5 15,327 5,942 144.2 2,434 309 14.9 269
18 (68.3) 56 6 (87.7) 47 12 42.4 84,408 13.3 3,891 3,642 14.7 3,175 208 10.4 189
Retail Banking in Spain and Portugal Memorandum item:
INCOME STATEMENT(Million euros)
Financial Services2006 ∆% 2005
Asset Management and Private Banking2006 ∆% 20052006 ∆% 2005
NET INTEREST INCOMEIncome by the equity methodNet fee incomeIncome from insurance activities
CORE REVENUESNet trading income
ORDINARY REVENUESNet revenues from non-financial activitiesPersonnel and general administrative
expensesDepreciation and amortizationOther operating income and expenses
OPERATING PROFITImpairment losses on financial assets
• Loan loss provisions• Other
ProvisionsOther income/losses
PRE-TAX PROFITCorporate income tax
NET PROFITMinority interests
NET ATTRIBUTABLE PROFIT
2,865 9.2 2,623 2,813 9.0 2,579 29 15.5 251 (15.7) 1 1 n.m. - - (98.6) 1
1,589 9.1 1,456 1,477 10.2 1,340 271 12.8 241376 21.4 309 - - - - - -
4,830 10.0 4,390 4,290 9.5 3,919 301 12.6 26772 31.8 55 48 28.3 38 9 37.9 6
4,902 10.3 4,444 4,338 9.6 3,957 309 13.2 27332 25.5 26 28 15.2 25 - - -
(2,193) 4.9 (2,092) (1,966) 4.1 (1,888) (95) 4.1 (91)(102) (0.7) (103) (84) 0.7 (84) (5) (26.8) (7)
14 (68.4) 43 15 (66.5) 44 (1) 87.6 -
2,653 14.4 2,319 2,331 13.5 2,053 209 19.3 175(356) 8.3 (328) (337) 7.4 (314) (9) (11.3) (10)(357) 8.0 (330) (336) 7.0 (314) (9) (11.3) (10)
1 (43.5) 2 (1) n.m. - - (100.0) -(3) 14.7 (2) (2) n.m. 2 1 n.m. (3)16 (11.2) 18 19 (11.3) 21 (2) 121.0 (1)
2,311 15.1 2,007 2,011 14.1 1,763 199 23.1 162(808) 17.9 (686) (707) 16.2 (608) (66) 28.5 (51)
1,503 13.7 1,321 1,305 13.0 1,155 133 20.6 111(4) 4.3 (4) (3) (13.0) (3) (2) 48.2 (1)
1,498 13.8 1,317 1,302 13.0 1,152 132 20.3 110
27
BUSINESS AREASRetail Banking in Spain and Portugal
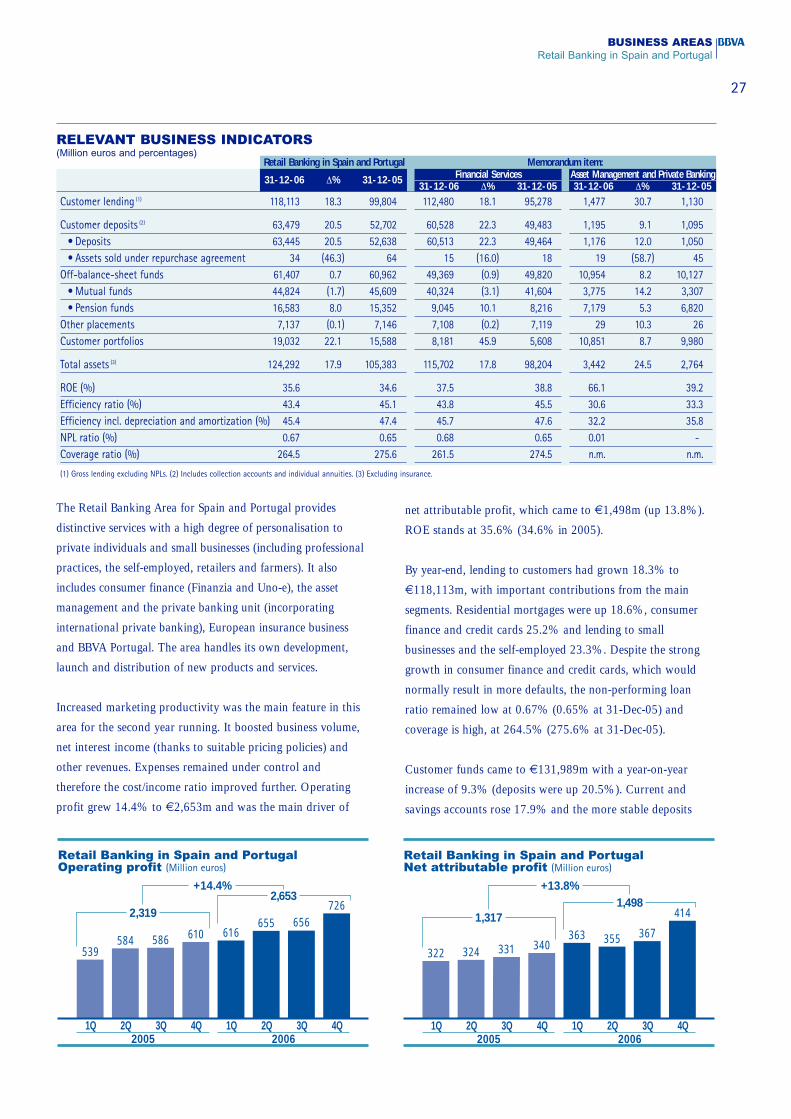
The Retail Banking Area for Spain and Portugal provides
distinctive services with a high degree of personalisation to
private individuals and small businesses (including professional
practices, the self-employed, retailers and farmers). It also
includes consumer finance (Finanzia and Uno-e), the asset
management and the private banking unit (incorporating
international private banking), European insurance business
and BBVA Portugal. The area handles its own development,
launch and distribution of new products and services.
Increased marketing productivity was the main feature in this
area for the second year running. It boosted business volume,
net interest income (thanks to suitable pricing policies) and
other revenues. Expenses remained under control and
therefore the cost/income ratio improved further. Operating
profit grew 14.4% to €2,653m and was the main driver of
Retail Banking in Spain and PortugalOperating profit (Million euros)
20062005
2,319
3Q
656
1Q 2Q 3Q 4Q
539584 610586
1Q
616
2,653+14.4%
2Q
655
4Q
726
Retail Banking in Spain and PortugalNet attributable profit (Million euros)
20062005
1,317
3Q
367
1Q 2Q 3Q 4Q
322 324 340331
1Q
363
1,498+13.8%
2Q
355
4Q
414
net attributable profit, which came to €1,498m (up 13.8%).
ROE stands at 35.6% (34.6% in 2005).
By year-end, lending to customers had grown 18.3% to
€118,113m, with important contributions from the main
segments. Residential mortgages were up 18.6%, consumer
finance and credit cards 25.2% and lending to small
businesses and the self-employed 23.3%. Despite the strong
growth in consumer finance and credit cards, which would
normally result in more defaults, the non-performing loan
ratio remained low at 0.67% (0.65% at 31-Dec-05) and
coverage is high, at 264.5% (275.6% at 31-Dec-05).
Customer funds came to €131,989m with a year-on-year
increase of 9.3% (deposits were up 20.5%). Current and
savings accounts rose 17.9% and the more stable deposits
Retail Banking in Spain and Portugal Memorandum item:
RELEVANT BUSINESS INDICATORS(Million euros and percentages)
Financial Services31-12-06 ∆% 31-12-05
Asset Management and Private Banking31-12-06 ∆% 31-12-0531-12-06 ∆% 31-12-05
Customer lending (1)
Customer deposits (2)
• Deposits • Assets sold under repurchase agreement
Off-balance-sheet funds• Mutual funds• Pension funds
Other placementsCustomer portfolios
Total assets (3)
ROE (%)Efficiency ratio (%)Efficiency incl. depreciation and amortization (%)NPL ratio (%)Coverage ratio (%)
(1) Gross lending excluding NPLs. (2) Includes collection accounts and individual annuities. (3) Excluding insurance.
118,113 18.3 99,804 112,480 18.1 95,278 1,477 30.7 1,130
63,479 20.5 52,702 60,528 22.3 49,483 1,195 9.1 1,09563,445 20.5 52,638 60,513 22.3 49,464 1,176 12.0 1,050
34 (46.3) 64 15 (16.0) 18 19 (58.7) 4561,407 0.7 60,962 49,369 (0.9) 49,820 10,954 8.2 10,12744,824 (1.7) 45,609 40,324 (3.1) 41,604 3,775 14.2 3,30716,583 8.0 15,352 9,045 10.1 8,216 7,179 5.3 6,8207,137 (0.1) 7,146 7,108 (0.2) 7,119 29 10.3 26
19,032 22.1 15,588 8,181 45.9 5,608 10,851 8.7 9,980
124,292 17.9 105,383 115,702 17.8 98,204 3,442 24.5 2,764
35.6 34.6 37.5 38.8 66.1 39.243.4 45.1 43.8 45.5 30.6 33.345.4 47.4 45.7 47.6 32.2 35.80.67 0.65 0.68 0.65 0.01 -
264.5 275.6 261.5 274.5 n.m. n.m.

28
BUSINESS AREASRetail Banking in Spain and Portugal
increased 7.3%. Time deposits were up 34.7% as customers
shifted their preference from mutual funds, whose assets under
management fell 1.7%.
The combination of these increases and an improvement in
customer spreads (which had grown successively narrower
since 2003) lifted net interest income to €2,865m (up 9.2%).
Other revenues rose 11.9%. Net fee income was up 9.1% to
€1,589m, insurance revenues increased 21.4% to €376m and
net trading income rose 31.8%. As a result, ordinary revenues
grew 10.3% to €4,902m.
The higher revenues helped the cost/income ratio to improve
to 45.4% (47.4% in 2005) because expenses rose at a slower
pace (4.6% including depreciation), despite adding 80 new
branches in areas of greater growth (and closing others with
less potential). Loan-loss provisions increased 8.0% and the
main component was generic provisions related to higher
lending.
� FINANCIAL SERVICES
Financial services cover business with private individuals and
small businesses, and the consumer finance unit. In 2006, this
unit increased lending 18.1% and funds under management by
9.9% (funds reported on the balance sheet were up 22.3%).
Together with the improvement in spreads and the new
improvement in the cost/income ratio, these increases boosted
operating profit 13.5% to €2,331m and net attributable
profit rose 13.0% to €1,302m.
Financial services for individualsBusiness with private individuals continues at a high level.
Constant innovation and diversification of the product range,
together with greater guidance for customers, were reflected in
marketing productivity, which rose 16.4% in the year to an
average of 33.2 products sold per month, per account
manager.
Customer fund gathering was aided in the fourth quarter by
the latest savings campaign, which lifted balances more than
€1,300m and entailed 500,000 promotional gifts. Together
with further marketing of Cuentas Claras, this increased
current and savings accounts balances by 18.6% (4.2% in
2005). The extensive range of time deposits helped to increase
the more stable types of funds by 35.7% and this product was
in great demand by customers during the year.
After becoming the first to launch an exchange-traded fund
(EFT) in the Spanish market (the Acción Ibex 35 in July),
BBVA rolled out the first EFT that tracks a pan-European
index in November. Other significant items include pension
funds, which captured €562m in the fourth quarter, and the
new range of home insurance policies (Vivienda Extra and
Seguro Vivienda Superior) whose premiums rose to €159m
for the year.
Consumer finance increased 25.9% following sales of
€5,366m, a year-on-year increase of 40.0%, supported by
new products (Crédito Nómina, Crédito Fácil and Préstamo
Inmediato PIDE). Residential mortgages total nearly
€72,500m (up 18.6% year-on-year). Operations closed during
the year came to €26,369m (up 5.8%). Marketing focused on
Hipoteca Fácil Plus, which incorporates the flexibility
customers require.
Financial services for small businessesLending to small companies, micro-firms, the self-employed
and the farming sector increased 19.0% to €18,769m thanks
to the excellent performance of discounted bills, factoring and
leasing plans. These were complemented by a wider product
range with new approaches such as the Préstamo Bienvenida
for new customers, the Diferencial 0% loan or overdraft, and
a business mortgage with a balloon payment.
The number of small companies and businesses that pay
employees via BBVA has increased 19.4%. Furthermore, the
bank continues to personalise the range of transactional
products, launching Pack Negocios in November for
professional practices, the self-employed and retailers.
Insurance sales were up 54% and the payment channels
business was also positive. The number of Solred
Mastercards, which are exclusively marketed by BBVA,
increased 377%.
Consumer FinanceThis unit manages online banking, consumer finance and
vehicle loans, credit card distribution and leasing plans
(including maintenance) that are conducted via Uno-e,
Finanzia, Finanzia Autorenting and Finanziamento Portugal.
Operating profit rose 21.0% to €117m, supported by
increased volumes. Net attributable profit came to €46m,
with the comparison affected by €11m obtained from the sale
of a subsidiary in 2005.

29
BUSINESS AREASRetail Banking in Spain and Portugal
At 31-Dec-06, the loan portfolio stood at €4,070m (up 19.7%)
on sales of €3,643m (up 17.2%). The vehicle prescription
business invoiced €1,130m and BBVA Finanzia became the
second largest Spanish company in terms of vehicle finance with a
balance of €2,016m (up 14.7%). Sales of vehicle leasing plans
(including maintenance) rose 14.1% to €291m and the fleet grew
to 35,799 vehicles (up 21.4%). Equipment finance came to
€550m (up 42.2%) on sales that rose 23.7% year-on-year and
lending in equipment leasing plans grew 22.3% to €524m (sales
were up 38.7%). Uno-e’s loan portfolio increased 31.2% to
€925m with a 40.4% rise in private card loans, boosted by a
new agreement signed with a leading operator in the food sector.
In Portugal, BBVA Finanziamento booked €193m in new finance
and the balance of vehicle finance rose 12.3% to €355m.
Customer funds under direct management or brokered came
to €1,510m, rising 7.3% (deposits fell 2.0% and mutual
funds increased 46.9%).
� ASSET MANAGEMENT AND PRIVATEBANKING
At 31-Dec-06, this unit managed total assets of €79,940m (up
3.9% year-on-year). Operating profit came to €209m (up
19.3%) and net attributable profit is €132m (up 20.3%).
In 2006, customers preferred to put their money in deposits and
the total assets of mutual funds managed by BBVA declined
1.8% to €45,491m at 31-Dec-06. Of this amount, mutual
funds accounted for €43,273m (down 2.8%). Their average
fees increased 2.3 basis points during the year (compared to a
fall of 1.8 bp for the sector as a whole). This put fees at
1.246%. Assets of the real estate fund rose 21.0% to €2,218m.
Managed portfolios of funds was launched in 2005 and it
ended 2006 with 59,281 portfolios and €3,311m in assets
under management. The increase during the year was 35,110
new portfolios and €1,933m in assets. The Group continued to
innovate in 2006, expanding the range of asset-management
products. In December, it obtained approval to launch the first
fund of private-equity funds, which will trade on the Spanish
exchange (BBVA Capital Privado). In addition, BBVA was the
first bank to receive CNMV approval to launch a hedge fund,
in the form of BBVA Codespa Microfinanzas FIL.
The assets under management in the Group’s pension business
in Spain increased 8.0% year-on-year to €16,291m. Of this
amount, individual plans account for €9,249m (up 10.2%)
and group schemes account for €7,042m (up 5.2%).
BBVA Patrimonios (a private banking unit) promoted the
added value of its services, which are based on global,
personalised guidance, as a key factor in servicing customers.
It had its best year since it was set up in 2003. Funds under
management rose 29.2% to €11,987m, with net capture in
the year of €1,087m (up 10%). In addition, international
private banking assets under management of €6,171m.
� EUROPEAN INSURANCE
This unit handles the insurance business in Spain and
Portugal. In 2006 it contributed earnings of €415m to the
area’s income statement. Of this amount, €376m came from
policies issued by the Group (up 21.4%) and €40m was
brokerage fees on the policies of other companies. Net
attributable profit came to €184m. The year-on-year increase
was 20.7%, confirming previous year’s figures, which were
also above 20%.
BBVA Seguros continues to lead the life insurance business in
Spain with a 16.6% market share at 30-Sep-06 (the latest
figure available). Premiums grew 18.6% and there are more
than 1.6 million policyholders. Premiums on household
multiple risk policies rose 13.8% year-on-year and there were
more than 890,000 customers at 31-Dec-06. The range of
policies has been extended to provide greater coverage and
service.
Premiums issued in the year came to €1,452m of which 42%
are risk premiums (life and non-life), generating underwriting
margins of 61% for the Group, and the rest are premiums on
private savings policies and group schemes.
� BBVA PORTUGAL
The 22.0% increase in lending (mortgages were up 31.5%)
was the main factor behind the increase of net interest income
(up 22.5%). This carried over to operating profit (up 21.0%)
and to net attributable profit (up 18.4%) to €10m.

30
Wholesale and Investment Banking
Wholesale and Investment Banking Memorandum item:
BALANCE SHEET(Million euros)
Corporate and Business Banking31-12-06 ∆% 31-12-05
Global Wholesale Banking and Markets31-12-06 ∆% 31-12-0531-12-06 ∆% 31-12-05
Cash and balances at Central BanksFinancial assetsLoans and receivables
• Due from banks• Loans to customers• Other
Inter-area positionsProperty, plant and equipmentOther assetsTOTAL ASSETS / LIABILITIES AND EQUITYDeposits by Central Banks
and banksDue to customersMarketable debt securitiesSubordinated debtInter-area positionsOther liabilitiesMinority interestsShareholders' funds
1,568 5.3 1,489 648 (5.4) 685 920 14.6 80241,148 14.7 35,889 2,833 (7.5) 3,064 37,176 16.8 31,841
150,280 14.0 131,830 66,275 10.2 60,153 83,612 17.1 71,38858,084 4.9 55,354 3,552 11.2 3,195 54,252 4.5 51,93689,559 18.0 75,885 62,545 9.8 56,952 27,015 42.7 18,9292,637 n.m. 591 177 n.m. 6 2,345 n.m. 523
- (100.0) 4,624 - - - 2,436 (91.8) 29,66091 (4.1) 95 70 (10.6) 79 11 5.5 10
1,963 (34.9) 3,013 247 (7.3) 266 1,232 (48.2) 2,379195,050 10.2 176,940 70,073 9.1 64,246 125,386 (7.9) 136,080
76,303 (2.1) 77,951 3,691 (8.2) 4,022 72,420 (1.9) 73,83755,168 (11.2) 62,130 20,147 2.6 19,632 35,012 (17.6) 42,4937,874 2.3 7,697 7,865 1.8 7,729 10 n.m. (32)2,357 14.1 2,065 1,202 (2.6) 1,234 872 39.6 625
29,937 n.m. - 32,012 31.7 24,307 - - -19,224 (17.8) 23,399 3,022 (41.1) 5,130 15,542 (13.8) 18,039
35 22.7 29 - 100.0 - 16 81.2 94,152 13.2 3,669 2,135 (2.6) 2,192 1,515 36.5 1,110
Wholesale and Investment Banking Memorandum item:
INCOME STATEMENT(Million euros)
Corporate and Business Banking2006 ∆% 2005
Global Wholesale Banking and Markets2006 ∆% 20052006 ∆% 2005
NET INTEREST INCOMEIncome by the equity methodNet fee incomeIncome from insurance activities
CORE REVENUESNet trading income
ORDINARY REVENUESNet revenues from non-financial activitiesPersonnel and general administrative
expensesDepreciation and amortizationOther operating income and expenses
OPERATING PROFITImpairment losses on financial assets
• Loan loss provisions• Other
ProvisionsOther income/losses
PRE-TAX PROFITCorporate income tax
NET PROFITMinority interests
NET ATTRIBUTABLE PROFIT
1,032 1.4 1,017 911 9.6 831 127 (25.9) 171283 n.m. 51 - (100.0) - - (100.0) -491 15.7 425 288 7.9 267 212 28.0 165
- - - - - - - - -
1,806 20.9 1,494 1,199 9.2 1,098 339 0.5 337642 43.4 448 152 47.1 103 554 42.8 388
2,448 26.1 1,941 1,351 12.4 1,201 893 23.1 725104 9.9 95 - - - 1 183.0 -
(644) 10.7 (582) (321) 6.2 (302) (302) 17.9 (256)(12) (2.4) (12) (7) (3.7) (7) (4) 14.5 (4)16 (45.2) 29 6 (19.2) 7 (1) (26.4) (1)
1,912 30.0 1,471 1,029 14.4 899 586 26.3 464(322) 19.8 (269) (206) 20.5 (171) (117) 18.7 (98)(322) 19.8 (269) (206) 20.5 (171) (117) 18.7 (98)
- (100.0) - - (100.0) - - - -(11) n.m. 5 - n.m. (1) (19) n.m. 3
159 n.m. 31 4 73.2 2 (1) n.m. 3
1,738 40.4 1,238 827 13.3 730 450 21.0 372(449) 24.4 (361) (290) 13.9 (255) (137) 31.2 (104)
1,288 47.0 876 538 13.0 476 313 17.0 268(6) 54.2 (4) - - - (5) 31.8 (3)
1,282 47.0 873 538 13.0 476 309 16.8 264

31
BUSINESS AREASWholesale and Investment Banking
The Wholesale Businesses Area comprises the corporate and
business banking unit (SME banking, Iberian corporate
banking, institutions banking, transaction services and product
management), the global businesses unit (global customers and
investment banking), global markets and distribution, and
Asia. It also handles the private equity business (which the
Group conducts under the Valanza brand) and the real estate
business (through its subsidiary, Anida).
In 2006 this area consolidated a business model that
successfully provides it with steadily growing revenues. These
helped to generate net attributable profit of €1,282m, an
increase of 47.0% year-on-year and ROE rose to 31.8%
(compared to 24.4% in 2005).
Lending grew 18.6% to €90,305m at 31-Dec-06 with solid
contributions from all units, especially global businesses.
Deposits stand at €46,832m, which is similar to 12 months
earlier owing to declines in the markets unit and in business
with international global customers.
Net interest income was up 1.4% (up 12.7% on purely
banking business). Core revenues increased 20.9% on higher
net fee income (up 15.7% year-on-year) aided by equity-
accounted results (which were boosted by capital gains from
the sale of shares in Gamesa via Corporación IBV). Net
trading income grew 43.4% on greater cross-selling of
products to customers. As a result, ordinary revenues rose
26.1% to €2,448m.
Operating profit grew faster than this, climbing 30.0% to
€1,912m, because operating expenses including depreciation
increased at a considerably lower pace (10.5%) than ordinary
Wholesale and Investment BankingOperating profit (Million euros)
1,471
200620053Q
463
1Q 2Q 3Q 4Q
316
384 385385
1Q
404
1,912+30.0%
2Q
503
4Q
542
Wholesale and Investment BankingNet attributable profit (Million euros)
873
200620053Q
330
1Q 2Q 3Q 4Q
193228
205246
1Q
258
1,282+47.0%
2Q
365329
4Q
Wholesale and Investment Banking Memorandum item:
RELEVANT BUSINESS INDICATORS(Million euros and percentages)
Corporate and Business Banking31-12-06 ∆% 31-12-05
Global Wholesale Banking and Markets31-12-06 ∆% 31-12-0531-12-06 ∆% 31-12-05
Customer lending (1)
Customer deposits (2)
• Deposits • Assets sold under repurchase agreement
Off-balance-sheet funds• Mutual funds• Pension funds
Customer portfolios
Total assets
ROE (%)Efficiency ratio (%)Efficiency incl. depreciation and amortization (%)NPL ratio (%)Coverage ratio (%)
(1) Gross lending excluding NPLs. (2) Includes collection accounts.
90,305 18.6 76,129 62,734 10.4 56,842 27,571 43.0 19,282
57,230 (10.3) 63,790 23,025 5.4 21,843 34,173 (18.5) 41,93446,832 - 46,839 22,977 5.4 21,791 23,823 (4.8) 25,03510,399 (38.7) 16,951 49 (7.7) 53 10,350 (38.8) 16,8992,249 4.4 2,155 2,024 (0.2) 2,029 224 78.8 1252,181 3.9 2,100 1,957 (0.9) 1,974 224 78.8 125
67 22.2 55 67 22.2 55 - - -491 (83.1) 2,909 - - - 491 (83.1) 2,909
195.050 10.2 176,940 70,073 9.1 64,246 125,386 (7.9) 136,080
31.8 24.4 24.8 23.1 22.0 22.824.8 28.0 22.9 24.2 33.8 35.325.2 28.6 23.4 24.7 34.3 35.80.22 0.29 0.34 0.36 0.05 0.18
707.9 561.5 499.5 466.8 n.m. 906.9

32
BUSINESS AREASWholesale and Investment Banking
revenues. This meant the cost/income ratio improved 3.4
percentage points to 25.2%. Although non-performing loans
have fallen from 0.29% at the end of 2005, to 0.22%,
loan-loss provisions increased €53m on higher generic
provisions related to increased lending. Coverage rose
146 points to 707.9%. Divestment of holdings, in accordance
with the area’s investment strategy, also helped to generate
pre-tax profit of €1,738m (up 40.4% compared to 2005).
� CORPORATE AND BUSINESS BANKING
This unit services small and medium enterprises, large
companies and institutions in the domestic market. Net
interest income was up 9.6%, aided by strict management of
spreads and higher volumes. By the year-end, lending was up
10.4% to €62,734m and customer deposits stood at
€22,977m (up 5.4%). Net fee income rose 7.9% and net
trading income 47.1%. Thus ordinary revenues came to
€1,351m (up 12.4%). Thanks to cost control, the cost/income
ratio fell 1.3 points to 23.4% and operating profit increased
14.4% to €1,029m. Finally, higher provisions (up 20.5%) due
to higher business volumes brought net attributable profit to
€538m (up 13.0%).
In November, the bank added 26 new wholesale branches in
Spain (20 for the institutions segment and 6 for corporate
banking). This was part of the Blue Net project announced in
July and completes the 2006 expansion plan with a total of
272 new branches. Of this number, the SME segment
accounted for 209, institutions banking for 52 (extending the
network to cover practically all Spanish provinces) and
11 branches were for corporate banking.
SME BankingAt the end of 2006 and after transferring customers to
corporate banking, this unit manages a loan portfolio of
€30,539m (up 14.0% on a uniform basis), customer deposits
of €7,243m (up 7.6%) and mutual funds of €1,109m.
The unit introduced some innovative campaigns in the fourth
quarter. They included leasing operations with a final
payment (balloon payment) and BBVA Ecology Car Leasing.
In particular, an agreement was signed with the European
Investment Bank that will allow BBVA to extend a €200m
line of preferential credit to Spanish SMEs. These funds are
earmarked for projects that increase the productivity and
competitive edge of small and medium Spanish enterprises.
Iberian Corporate BankingLending rose to €12,905m at 31-Dec-06 and deposits stood at
€4,266m. The year-on-year increases on a like-for-like basis
(ie, adjusted for the transfer of customers from SME banking)
were 19.2% and 18.0%, respectively.
Significant operations closed in the fourth quarter include the
unit’s role as senior lead arranger in refinancing of Holding
d'Infraestructures de Transport (owner of SANEF, a company
that operates tollways in France and in which Abertis
Infraestructuras has a 57.6% interest). It also structured and
acted as underwriter in the financing of the light metro line to
Pozuelo and Boadilla (Madrid), and financed the Mahou
Group's takeover of the Alhambra Group. Lastly, it financed
the acquisition of Inmobiliaria Asón (which owned Edificio
Windsor and other property) by El Corte Inglés.
Institutions BankingAt the end of 2006, this unit managed €19,008m in loans and
€11,726m of customer funds. These amounts were similar to
a year earlier.
During the quarter, the unit together with corporate banking
and structured finance, participated in the biggest ever
purchase of trains for the Madrid metro system. The
operation comprised two contracts for the manufacture,
supply, commissioning and guarantee of 145 trains, with two
different groups of suppliers, worth €1,094m in total.
Transaction Services and ProductManagementThe year ended with 73,828 users (businesses, institutions and
companies) of BBVA’s electronic banking services in Spain.
They executed more than 238 million collection and payment
operations. The service has another 3,168 users in Portugal.
BBVA Cash America, a system for countries on that continent,
has 7,570 customers which made more than 5.5 million
domestic and international transactions in the fourth quarter.
The volume of foreign trade payments and collections handled
by BBVA grew more than 12%. BBVA confirmed its leadership
in company cards in Spain with a 30% share of this market.
� GLOBAL BUSINESSES
The global businesses unit combines the products of
investment banking and the markets unit with services for
large international companies. It also co-ordinates corporate

33
BUSINESS AREASWholesale and Investment Banking
banking and market business in the Americas although these
earnings are recorded under the corresponding areas.
Lending jumped 43.0% to €27,571m, net fee income rose
28.0% year-on-year and net trading income was up 42.8% on
greater customer activity. As a result, ordinary revenues rose
23.1% and operating profit increased 26.3% to €586m. The
cost/income ratio improved 1.5 points to 34.3%. After
deduction of provisions linked to the above-mentioned rise in
lending, net attributable profit came to €309m, a rise of
16.8% compared to 2005.
Global Customers & Investment BankingThe 22.9% rise in ordinary revenues was due to higher
volumes (lending increased 39.3% to €24,177m) and to
defence of interest spreads. This led to a 23.8% rise in net
interest income and a 15.3% improvement in net fee income.
Furthermore, the 4.2% fall in expenses helped operating profit
to climb 37.1% to €297m. Higher provisions, associated with
the increase in business activity, limited the increase in net
attributable profit, which rose 10.4% to €100m.
Equity origination operations in the fourth quarter included
Vocento’s IPO in which BBVA acted as global co-ordinator
and underwriter, leading the Spanish retail and institutional
tranches, which accounted for 68.5% of overall volume (more
than €331m). In corporate finance, BBVA acted as financial
adviser to Corporación IBV in the sale of the Landata Group
to Amper for €75m. The operation was designed by BBVA,
which also co-ordinated the sale and advised the seller.
Structured finance operations included the acquisition of APRR,
a company that operates tollways in France, by a consortium
comprising Macquarie (Australia) and Eiffage (a French
contractor). They chose BBVA to structure the world’s biggest
project finance operation so far. BBVA is also establishing itself
as one of the world’s leaders in finance for regasification plants
financing a Canadian terminal that is 75% –owned by Repsol.
Lastly, BBVA participated as mandated lead arranger and
financial advisor for the consortium HAG (participated by
Cintra and ACS-Dragados with a 33.3% interest each as well as
other local companies). This consortium will build the Ionia
Odos Motorway, one of the first toll motorways in Greece.
Global Markets and DistributionNet attributable profit rose 32.2% to €234m. Ordinary
revenues is the figure that best represents this unit's income
because of differences in booking market positions for net
interest income and net trading income. These revenues rose
27.3% as a result of increased operations with customers and
other units under the cross-marketing plan. Operating profit
came to €309m (up 25.2%).
In the fourth quarter, BBVA strengthened its hold on the new
market for exchange-traded funds (EFTs) in Spain. These
products are halfway between a share and a fund, and they
trade in real time. Apart from managing the most active EFT
linked to the IBEX 35, the bank has launched a new one
linked to the DJ Euro Stoxx 50 and has obtained the only
licence granted for an EFT that tracks the Latibex index.
Syndicated loans included one of $9,000 for Cemex España,
which was led by BBVA and entailed 25 international financial
institutions.
AsiaBBVA has taken a decisive step in its Asian strategy through
its partnership with Citic Group. In the first phase, it will
purchase 5% of China Citic Bank (CNCB), with its head
office in Beijing, for €501m. It will also acquire a 15% stake
in Citic International Financial Holdings (CIFH), with its head
office in Hong Kong, for €488m. The combined assets of
CNCB and CIFH come to €71,507m. Together they have
more than 15,000 staff and 454 branches. The partnership
signals the simultaneous entry of BBVA in the banking
markets of mainland China and Hong Kong. It will be the
strategic investor, with an important programme of
co-operation in different fast-growing banking areas.
The Group has made further progress in its international
expansion opening a representative office in Sydney and
obtained approval to open another in Mumbai.
� VALANZA
This unit manages a portfolio of 51 holdings, with assets
totalling €1,663m and latent capital gains of more than
€700m. Thanks to the buoyant stock market, these are higher
despite considerable capital gains realized during the year. Net
attributable profit comes to €385m, some €318m more than
in 2005. Corporación IBV and the IPO of Técnicas Reunidas
were the two main contributors.
� ANIDA
It has a portfolio of land in development valued at around €1.3
billion (a 30% increase on 2005) and latent capital gains of
€389m. Net attributable profit came to €94m (up 25.9%).

34
Mexico and USA
INCOME STATEMENT(Million euros)
2006 ∆% ∆% at constant exchange rate 2005
NET INTEREST INCOMEIncome by the equity methodNet fee incomeIncome from insurance activities
CORE REVENUESNet trading income
ORDINARY REVENUESNet revenues from non-financial activitiesPersonnel and general administrative
expensesDepreciation and amortizationOther operating income and expenses
OPERATING PROFITImpairment losses on financial assets
• Loan loss provisions• Other
ProvisionsOther income/losses
PRE-TAX PROFITCorporate income tax
NET PROFITMinority interests
NET ATTRIBUTABLE PROFIT
3,535 32.0 33.3 2,678(2) n.m. n.m. -
1,390 14.7 15.8 1,212305 33.3 34.6 229
5,227 26.9 28.2 4,119196 16.9 18.0 168
5,423 26.5 27.8 4,287(4) 61.0 62.6 (3)
(1,946) 12.0 13.1 (1,737)(126) (8.9) (8.0) (138)(117) 10.8 11.9 (106)
3,231 40.3 41.7 2,303(685) 117.6 119.7 (315)(672) 132.9 135.2 (289)(13) (50.1) (49.6) (26)(73) 43.5 44.9 (51)43 n.m. n.m. (8)
2,515 30.4 31.7 1,929(739) 32.8 34.1 (556)
1,777 29.4 30.7 1,373(2) (43.3) (42.8) (4)
1,775 29.6 30.8 1,370
BALANCE SHEET(Million euros)
31-12-06
Cash and balances at Central BanksFinancial assetsLoans and receivables
• Due from banks• Loans to customers• Other
Inter-area positionsProperty, plant and equipmentOther assetsTOTAL ASSETS / LIABILITIES AND EQUITYDeposits by Central Banks
and banksDue to customersMarketable debt securitiesSubordinated debtInter-area positionsOther liabilitiesMinority interestsShareholders' funds
5,955 (6.7) 5.8 6,38023,465 15.0 30.1 20,40735,901 (0.5) 12.5 36,0922,146 (64.5) (59.9) 6,048
33,136 21.5 37.3 27,277619 (77.6) (74.6) 2,767
- - - -1,121 1.8 15.1 1,1005,388 4.3 17.9 5,168
71,830 3.9 17.5 69,147
8,445 (23.1) (13.1) 10,98545,832 9.1 23.5 42,001
1,074 55.0 73.0 6932,298 15.7 31.0 1,987
16 (33.0) (24.1) 259,975 3.1 16.6 9,678
8 (21.3) (10.9) 104,181 10.9 25.5 3,769
∆% ∆% at constant exchange rate 31-12-05

35
BUSINESS AREASMexico and USA
This area covers the banking, pension and insurance businesses
in Mexico and the United States (including Puerto Rico).
In 2006 the Mexican peso and the US dollar weakened against
the euro. This had a negative impact on the year-on-year
comparatives for the area’s balance sheet. However, average
exchange rates over the year depreciated less, and thus the final
impact on the income statements in euros was lower. The charts
below show year-on-year change at constant exchange rates. All
comments refer to these rates, as they are most significant when
analysing the business performance.
High year-on-year growth in the area’s lending and customer
funds (40.6% and 24.50% respectively) are reflected in the net
interest income, which rose 33.3%. Along with fee and insurance
income (18.8%), it was the main driver of the 2006 ordinary
revenues at €5,423m (+27.8%). Despite higher activity, expenses
grew slower than revenues (up 11.6% including depreciation).
Thus the cost-income ratio improved to 38.2% (from 43.8% in
2005) and operating profit rose 41.7% to €3,231m. The ratio
for non-performing loans stood at 2.19% on 31-Dec-06 (2.24%
a year earlier) with 248.9% coverage. However, the increase in
lending required a significant increase in loan-loss provisions
(generic). All in all, the area generated an attributable profit of
€1,775m in 2006, 30.8% up on the previous year, and a return
on equity of 46.7% (as against 44.2% ROE in 2005).
� BANKING BUSINESSES
The banking businesses generated €1,625m in attributable
profit during 2006, 32.9% up on the previous year. Below, we
highlight key aspects of BBVA Bancomer and BBVA USA’s
performance.
RELEVANT BUSINESS INDICATORS(Million euros and percentages)
31-12-06
Customer lending (1)
Customer deposits (2)
• Deposits • Assets sold under repurchase agreement
Off-balance-sheet funds• Mutual funds• Pension funds
Other placementsCustomer portfolios
Total assets (3)
ROE (%)Efficiency ratio (%)Efficiency incl. depreciation and amortization (%)NPL ratio (%)
Coverage ratio (%)
(1) Gross lending excluding NPLs and Bancomer's old mortgage portfolio. (2) Excluding deposits and repos issued by Bancomer's Markets unit. (3) Excluding insurance.
31,329 24.4 40.6 25,185
43,307 5.7 19.5 40,97036,791 5.4 19.1 34,9106,516 7.5 21.8 6,059
18,478 8.8 23.4 16,9779,853 21.4 37.6 8,1158,625 (2.7) 10.3 8,8623,294 47.4 67.0 2,2356,941 21.5 37.7 5,713
69,289 3.4 17.0 66,984
46.7 44.235.9 40.538.2 43.82.19 2.24
248.9 251.3
∆% ∆% at constant exchange rate 31-12-05
Mexico and USAOperating profit (Million euros)
(1) At constant exchange rates: +41.7%.
2,303
200620053Q
854
1Q 2Q 3Q 4Q
423
566628
686
1Q
764
3,231+40.3% (1)
2Q
767845
4Q
Mexico and USANet attributable profit (Million euros)
(1) At constant exchange rates: +30.8%.
1,370
200620053Q
535
1Q 2Q 3Q 4Q
231
344400394
1Q
434
1,775
+29.6% (1)
2Q
391
4Q
415

36
BUSINESS AREASMexico and USA
BBVA BancomerIn 4Q06, Mexico’s economic growth slowed down slightly,
rising 4.0% as compared with an average of 4.9% over the
previous three quarters. Strong domestic demand was the main
driver, helped along by foreign demand slowing less than
predicted. Year-end inflation was just over 4%, mainly impacted
by one-off events (eg, supply-side anomalies in food). However,
with inflationary pressure expected to ease off over 2007, the
Bank of Mexico kept the borrowing rate at 7%.
Revenues from remittances and tourism financed an already
low current-account deficit, further stabilising the exchange
rate against the dollar. Meanwhile, the Mexican peso fell
11.8% against the euro over the year, closing at 14.3 pesos on
31-Dec-06. However, 2006 average exchange rates on
aggregate weakened 1% over 2005, having appreciated over
the previous quarters.
In this scenario, BBVA Bancomer’s loan book reached €23.48
billion at the end of December, having grown 30.6% over the
year. Lending to companies increased 15.5%, driven by SMEs’
borrowing which rose 33.2%. Highest growth was reported in
loans to individuals: credit cards were up 44.6%, consumer
loans 44.3% and mortgages 55.7% (excluding the old
mortgage portfolio).
Customer funds, including deposits, mutual funds and other
intermediated products, stood at €45,741m, up 14.6% on
December 2005. Current and savings accounts reached
€17,198m, having grown 13,2%, while term deposits went
down 13.6% year on year, as customers shifted to repos (up
23%) and mutual funds (up 37.6%).
Growth in business volumes and better spreads (12.5% in 4Q06
compared to 11.9% in the equivalent period of 2005) pushed
net interest income up to €3,259m during 2006, with a
year-on-year rise of 33.7%. Fee income reached €1,196m,
growing 20.8%, driven by credit-card issuance and mutual funds.
Net trading income was €166m (rising 4.3%). This brought
ordinary revenues up to €4,619m, 28.8% higher than in 2005.
The 9.5% increase in operating expenses including
depreciation (€1,666m) was lower than the increase in
revenues, generating a cost-income ratio of 36.1% in 2006.
This was 6.3 percentage points better than the 42.4% ratio
from the previous year. Operating profit grew 44.4% to
€2,880m. Strong growth in lending, especially loans to
individuals, did not penalise the non-performing loans ratio,
which improved to 2.21% at 31-Dec-06 from 2.34% twelve
months earlier, despite the higher risk adhered to consumer
loans and cards. However, it did mean 152.3% more loan-loss
provisions (which reached €633m) since the Group has been
provisioning its consumer and mortgage lending on the basis
of expected loss since July 2005. Coverage rose to 287.7%
(as against 269.0% on 31-Dec-05).
Finally, year-end attributable profit was €1,552m in 2006,
31.6% above the previous year, bringing ROE up to 48.5% as
compared with 46.0% in 2005.
A special draw was held amongst retail-banking customers to
celebrate 10 years of the Libretón passbook. This raised over
1.6 billion pesos in two weeks, with 78% customer-fund
retention and 25,000 new accounts opened. A prepaid card
for young people was launched (Tarjeta 40) with one of the
biggest radio broadcasters in the country. This led to the
activation of nearly 8,000 cards. In a drive to encourage
product bundling, the campaign to offer special terms on
lending against pay-rolls domiciled to BBVA Bancomer
accounts ended the quarter with a 14.8% increase in loans
placed with eligible customers, compared to the same period
in 2005. Meanwhile, car finance grew 59.4% year on year,
giving BBVA Bancomer 41.1% of the total market. By the end
of 2006 it not only became market leader amongst banks but
also bigger than the two main car-finance firms.
During the last three months of the year, 24 new branches
were opened, and a further 24 were completely refitted and
provided with new technology infrastructure.
To promote business with companies, a cooperation agreement
was signed with Fonatur (the Mexican tourist board) to
finance the construction and sale of property developments in
tourist areas. 34 branches are now implementing the plan to
improve service levels to SMEs. Cutting down account
executives’ workload in back-office tasks has boosted their
selling capacity by 50%. The branches have also increased the
business-loan customer base by 35.5%.
Bancomer BBVA’s mortgage-banking arm has recorded 26%
year-on-year growth in originating personal mortgages,
granting over 63,000 mortgage loans in 2006. This was over
46,000 more than our closest peer bank and nearly 26,000
more than the Sofoles (specialised mortgage lenders).

37
BUSINESS AREASMexico and USA
Memorandum item:
INCOME STATEMENT(Million euros)
Of which: BBVA Bancomer2006 ∆% ∆% (1) 2005
Pensions and Insurance2006 ∆% ∆% (1) 2005
Banking businesses2006 ∆% ∆% (1) 2005
NET INTEREST INCOMEIncome by the equity methodNet fee incomeIncome from insurance activities
CORE REVENUESNet trading income
ORDINARY REVENUESNet revenues from non-financial activitiesPersonnel and general administrative
expensesDepreciation and amortizationOther operating income and expenses
OPERATING PROFITImpairment losses on financial assets
• Loan loss provisions• Other
ProvisionsOther income/losses
PRE-TAX PROFITCorporate income tax
NET PROFITMinority interests
NET ATTRIBUTABLE PROFIT
3,542 32.2 33.5 2,679 3,259 32.3 33.7 2,463 2 (53.0) (52.5) 4(2) n.m. n.m. - (2) n.m. n.m. - - - - -
1,306 18.2 19.4 1,105 1,196 19.6 20.8 1,000 165 (12.2) (11.3) 188- - - - - - - - 245 40.5 41.9 174
4,846 28.1 29.4 3,783 4,453 28.6 29.9 3,462 412 12.4 13.5 366180 14.7 15.8 157 166 3.2 4.3 161 16 49.0 50.4 11
5,026 27.6 28.8 3,941 4,619 27.5 28.8 3,624 428 13.4 14.6 377- - - - - - - - (4) n.m. n.m. 3
(1,807) 11.6 12.7 (1,619) (1,571) 10.5 11.6 (1,422) (202) 19.2 20.4 (170)(123) (9.9) (9.0) (137) (95) (16.9) (16.1) (114) (3) 73.6 75.4 (1)(73) 2.0 3.0 (72) (73) 1.5 2.5 (72) 25 32.1 33.4 19
3,023 43.1 44.5 2,113 2,880 42.9 44.4 2,015 245 7.2 8.2 228(685) 117.6 119.7 (315) (646) 131.1 133.4 (280) - - - -(672) 132.9 135.2 (289) (633) 149.8 152.3 (254) - - - -(13) (50.1) (49.6) (26) (13) (50.4) (49.9) (26) - - - -(73) 43.5 44.9 (51) (70) 46.5 47.9 (48) - n.m. n.m. -40 n.m. n.m. (8) 34 n.m. n.m. (10) 3 n.m. n.m. -
2,305 32.5 33.8 1,740 2,198 31.0 32.3 1,678 247 8.6 9.7 228(679) 34.8 36.1 (504) (645) 32.7 34.1 (486) (72) 10.2 11.3 (65)
1,626 31.5 32.8 1,236 1,552 30.2 31.5 1,192 176 8.0 9.0 163(1) (36.7) (36.1) (1) (1) (37.7) (37.1) (1) (1) (46.7) (46.2) (2)
1,625 31.6 32.9 1,235 1,552 30.3 31.6 1,191 174 8.7 9.8 160
Memorandum item:
BALANCE SHEET(Million euros)
Of which: BBVA Bancomer31-12-06 ∆% ∆% (1) 31-12-05
Pensions and Insurance31-12-06 ∆% ∆% (1) 31-12-05
Banking businesses31-12-06 ∆% ∆% (1) 31-12-05
Cash and balances at Central BanksFinancial assetsLoans and receivables
• Due from banks• Loans to customers• Other
Inter-area positionsProperty, plant and equipmentOther assetsTOTAL ASSETS / LIABILITIES AND EQUITYDeposits by Central Banks
and banksDue to customersMarketable debt securitiesSubordinated debtInter-area positionsOther liabilitiesMinority interestsShareholders' funds
(1) At constant exchange rate.
5,955 (6.7) 5.8 6,380 5,853 (7.4) 5.0 6,321 - (9.2) 2.9 -21,422 14.8 29.8 18,659 17,538 11.1 25.9 15,787 2,529 16.3 31.9 2,17435,808 (0.8) 12.2 36,082 27,058 (10.6) 1.3 30,269 111 n.m. n.m. 152,143 (64.5) (59.9) 6,046 1,491 (71.4) (67.6) 5,216 20 212.1 252.7 6
33,136 21.5 37.3 27,276 25,225 12.6 27.7 22,398 - (98.0) (97.8) 1529 (80.8) (78.3) 2,760 343 (87.1) (85.4) 2,655 91 n.m. n.m. 7
8 n.m. n.m. 1 8 n.m. n.m. 1 - - - -1,113 1.8 15.1 1,093 823 (10.4) 1.6 918 7 3.5 17.3 63,866 (8.1) 3.9 4,206 1,888 (46.4) (39.2) 3,522 70 (58.1) (52.5) 167
68,172 2.6 16.1 66,422 53,170 (6.4) 6.1 56,819 2,717 15.0 30.4 2,362
8,445 (23.1) (13.1) 10,979 7,294 (17.7) (6.8) 8,868 - (69.8) (65.7) -45,851 9.2 23.5 42,006 36,127 (1.6) 11.6 36,705 - - - -
1,074 55.0 73.0 693 190 n.m. n.m. - - - - -820 (29.4) (20.1) 1,162 561 (47.8) (40.9) 1,076 - - - -
- - - - - - - - - - - -8,037 0.5 13.7 7,994 5,626 (19.3) (8.5) 6,972 2,471 13.9 29.1 2,170
2 (71.6) (67.8) 8 2 (68.8) (64.6) 8 6 217.3 259.6 23,941 10.1 24.6 3,579 3,369 5.6 19.7 3,190 240 26.4 43.2 190

38
BUSINESS AREASMexico and USA
Bancomer has consolidated its leadership, with 39% of the
market in loans to home buyers. Its share is not only greater
than the total share of the six biggest banks but also than all
the Sofoles together. In 2006, loans for nearly 88,000 new
homes were granted to developers, 27% up on 2005.
Wholesale Banking has maintained a high profile on the
financial markets, with the placement of seven debt issues. It
acted as bookrunner for a $850m syndicated loan to the Carso
group (a retail conglomerate) and two placements of warrants
for Cemex (cement company) worth a total of MXN 5 billion.
United StatesThe purchase of Texas Regional Bancshares was completed in
November brought the incorporation of Texas State Bank; this
added €3,115m in lending and €4,651m in deposits to the
Group’s accounts, plus a further 73 branches and 2,009
employees. Since then it has contributed an operating profit of
€20m and an attributable profit of €10m.
BBVA USA thus closed the year with €7,849m in lending and
€10,712m in deposits. Excluding the Texas State Bank figures,
this reflects year-on-year growth of 9.9% and 11.7%
respectively. Operating profit rose to €129m, 52.0% higher
than in 2005, while attributable profit reached €64m (up
81.7%).
State National Bank was consolidated in January 2007.
� PENSIONS AND INSURANCE
In 2006 the pension and insurance business contributed €245
to the operating profit (up 8.2% on the previous year) and
€174m to the attributable profit.
It was a complicated year for business in employment-related
benefits, as indicators on the labour market recorded low
growth and new, aggressive competitors moved into this
sector. The most direct consequences were an increase in the
size of the sales force and a significant squeeze on fees
throughout the industry. Bancomer Afore is the second
biggest Mexican retirement fund administrator in assets under
management and membership. It had to completely overhaul
its charges, reducing both fee income and attributable profit,
which went down 21% against the previous year, to €65m.
The insurance business in Mexico, however, was buoyant.
Reflecting the general tendencies, Seguros Bancomer
recorded an increase of 64.6% in premiums over the year, with
significant progress in bancassurance and other product lines. The
joint attributable profit of the Group’s three Mexican companies
(Seguros Bancomer, Pensiones Bancomer and Preventis) in 2006
was €109m, with a year-on-year increase of 43.2%.
Memorandum item:
RELEVANT BUSINESS INDICATORS(Million euros and percentages)
Of which: BBVA Bancomer31-12-06 ∆% ∆% (1) 31-12-05
Pensions and Insurance31-12-06 ∆% ∆% (1) 31-12-05
Banking businesses31-12-06 ∆% ∆% (1) 31-12-05
Customer lending (2)
Customer deposits (3)
• Deposits • Assets sold under repurchase agreement
Off-balance-sheet funds• Mutual funds• Pension funds
Other placementsCustomer portfolios
Total assets
ROE (%)Efficiency ratio (%)Efficiency incl. depreciation and amortization (%)NPL ratio (%)Coverage ratio (%)
(1) At constant exchange rate. (2) Gross lending excluding NPLs and Bancomer's old mortgage portfolio. (3) Excluding deposits and repos issued by Bancomer's Markets unit.
31,329 24.4 40.6 25,185 23,480 15.2 30.6 20,378 - - - -
43,307 5.7 19.5 40,970 32,595 (6.6) 5.8 34,909 - - - -36,791 5.4 19.1 34,910 26,165 (9.7) 2.3 28,985 - - - -6,516 7.5 21.8 6,059 6,430 8.5 23.0 5,924 - - - -9,853 21.4 37.6 8,115 9,853 21.4 37.6 8,115 8,625 (2.7) 10.3 8,8629,853 21.4 37.6 8,115 9,853 21.4 37.6 8,115 - - - -
- - - - - - - - 8,625 (2.7) 10.3 8,8623,294 47.4 67.0 2,235 3,294 47.4 67.0 2,2356,941 21.5 37.7 5,713 6,941 21.5 37.7 5,713 - - - -
68,172 2.6 16.1 66,422 53,170 (6.4) 6.1 56,819 - - - -
45.1 42.8 48.5 46.0 88.6 75.535.9 41.1 34.0 39.2 47.7 44.638.4 44.5 36.1 42.4 48.3 45.02.19 2.24 2.21 2.34 - -
248.9 251.3 287.7 269.0 - -

39
South America
South America Memorandum item:
INCOME STATEMENT(Million euros)
Banking businesses2006 ∆% ∆% (1) 2005
Pensions and Insurance2006 ∆% ∆% (1) 20052006 ∆% ∆% (1) 2005
NET INTEREST INCOMEIncome by the equity methodNet fee incomeIncome from insurance activities
CORE REVENUESNet trading income
ORDINARY REVENUESNet revenues from non-financial activitiesPersonnel and general administrative
expensesDepreciation and amortizationOther operating income and expenses
OPERATING PROFITImpairment losses on financial assets
• Loan loss provisions• Other
ProvisionsOther income/losses
PRE-TAX PROFITCorporate income tax
NET PROFITMinority interests
NET ATTRIBUTABLE PROFIT
1,310 26.1 28.4 1,039 1,301 26.2 28.4 1,031 11 15.3 21.3 93 n.m. n.m. (1) 4 n.m. n.m. - (1) 0.6 (3.6) (1)
815 17.3 18.1 695 434 17.2 19.7 371 259 8.4 7.5 239(6) n.m. n.m. 5 - - - - 121 27.3 33.7 95
2,122 22.1 24.1 1,738 1,739 24.1 26.4 1,402 389 13.9 14.9 342282 80.3 85.5 157 238 87.5 94.6 127 45 50.1 48.8 30
2,405 26.9 29.1 1,895 1,977 29.4 31.9 1,528 434 16.8 17.7 372- (99.0) (99.0) 9 - - - - - (99.0) (99.0) 9
(1,103) 18.3 20.4 (933) (870) 20.5 22.8 (722) (210) 11.5 13.2 (188)(93) 34.9 36.2 (69) (82) 48.6 50.4 (55) (11) (19.0) (19.1) (14)(46) 14.2 17.3 (40) (45) 17.8 20.7 (38) 2 162.5 113.2 1
1,163 35.0 37.4 861 980 37.5 40.4 713 216 20.3 20.4 179(149) 87.6 85.4 (80) (149) 73.6 71.8 (86) (1) n.m. n.m. -(151) 114.1 111.5 (71) (151) 96.1 94.0 (77) - n.m. n.m. -
2 n.m. n.m. (9) 2 n.m. n.m. (9) - (50.8) (48.5) -(59) (24.7) (22.1) (78) (51) (33.8) (31.5) (77) (8) n.m. n.m. (1)
- (97.8) (97.8) 14 - (96.6) (96.9) 9 (1) n.m. n.m. 6
955 33.1 35.5 718 781 39.6 42.7 559 207 12.5 13.1 184(229) 38.4 41.6 (166) (179) 42.5 46.0 (125) (62) 21.3 23.0 (51)
726 31.4 33.7 552 602 38.7 41.7 434 145 9.2 9.4 133(217) 25.1 26.5 (173) (180) 28.9 31.2 (140) (36) 9.1 7.3 (33)
509 34.4 37.0 379 422 43.4 46.7 294 109 9.2 10.1 99
South America Memorandum item:
BALANCE SHEET(Million euros)
Banking businesses31-12-06 ∆% ∆% (1) 31-12-05
Pensions and Insurance31-12-06 ∆% ∆% (1) 31-12-0531-12-06 ∆% ∆% (1) 31-12-05
Cash and balances at Central BanksFinancial assetsLoans and receivables
• Due from banks• Loans to customers• Other
Inter-area positionsProperty, plant and equipmentOther assetsTOTAL ASSETS / LIABILITIES AND EQUITYDeposits by Central Banks
and banksDue to customersMarketable debt securitiesSubordinated debtInter-area positionsOther liabilitiesMinority interestsShareholders' funds
(1) At constant exchange rate.
2,889 7.1 16.2 2,698 2,889 7.1 16.2 2,698 1 61.4 84.8 -4,218 (16.7) (8.2) 5,061 3,491 (24.2) (16.9) 4,608 962 29.4 46.1 744
21,058 17.9 31.4 17,866 20,629 18.7 32.3 17,378 547 (5.3) 7.9 5783,583 26.0 40.8 2,844 3,364 34.1 49.4 2,508 290 (28.0) (17.8) 403
17,014 15.5 28.8 14,726 16,861 15.7 28.9 14,578 174 1.7 15.2 171461 55.9 75.6 296 404 38.4 55.9 292 83 n.m. n.m. 4
- - - - 3 8.3 20.0 3 - - - -488 (5.4) 5.4 516 417 (4.2) 6.4 435 71 (12.3) - 81
1,842 (12.6) (5.6) 2,107 1,034 9.8 23.6 941 169 (32.6) (23.4) 25130,496 8.0 19.5 28,248 28,463 9.2 21.1 26,063 1,750 5.8 20.0 1,654
2,650 34.0 47.9 1,978 2,632 34.0 47.9 1,964 39 (3.8) 11.5 4121,252 4.4 15.7 20,357 21,356 4.6 16.0 20,420 - (100.0) (100.0) -
468 22.2 38.7 383 475 23.9 40.6 383 - - - -1,112 32.6 36.7 839 441 142.3 181.1 182 - - - -
30 2.5 1.6 29 - - - - - - - -2,604 4.0 16.7 2,503 1,529 19.4 32.2 1,281 1,363 5.9 20.2 1,286
695 4.0 14.5 669 621 5.6 15.7 588 74 (7.9) 5.9 811,684 12.9 25.4 1,491 1,410 13.2 25.4 1,246 274 11.5 25.5 246

40
BUSINESS AREASSouth America
The South America area handles the banking, pension and
insurance business conducted by the Group in Argentina,
Bolivia, Chile, Colombia, Ecuador Panama, Paraguay, Peru,
Dominican Republic, Uruguay and Venezuela. The
incorporation of Granahorrar in Colombia (December 2005)
and Forum in Chile (May 2006) affects the year-on-year
comparisons on the area’s financial statements.
In 2006, Latin America continued to enjoy its greatest economic
boom in recent decades. Over the last three years GDP
expanded at an average rate of 5% per year, average inflation
was 6% and the total government deficit is now less than 1%
of GDP. This macroeconomic stability is the result of balanced
government policies, the greater independence of central banks
and tighter fiscal discipline. High commodity prices and the
relative abundance of global liquidity have a positive effect and
important amounts of capital are flowing into the region.
Despite turbulence in the second quarter, interest rates were
generally stable although there was a slight upward trend in
most countries. This paved the way for a positive year on stock
markets, favouring results in the financial sector.
In 2006, Latin-American currencies fell against the euro and
this has a negative impact on the area’s balance sheet.
However, average exchange rates fell less compared to 2005
and therefore their impact on the income statement is less
relevant. The attached tables contain columns with
year-on-year changes for different items at constant exchange
rates. Unless otherwise indicated, the following remarks refer
to these figures.
South AmericaOperating profit (Million euros)
(1) At constant exchange rates: +37.4%.
861
3Q
286
1Q 2Q 3Q 4Q
171221 238232
1Q
3191,163
+35.0% (1)
2Q
272
4Q
286
20062005
South AmericaNet attributable profit (Million euros)
(1) At constant exchange rates: +37.0%.
379
200620053Q
136
1Q 2Q 3Q 4Q
82
123
7599
1Q
151509
+34.4% (1)
2Q
130
4Q
92
South America Memorandum item:
RELEVANT BUSINESS INDICATORS (Million euros and percentages)
Banking businesses31-12-06 ∆% ∆% (1) 31-12-05
Pensions and Insurance31-12-06 ∆% ∆% (1) 31-12-0531-12-06 ∆% ∆% (1) 31-12-05
Customer lending (2)
Customer deposits (3)
• Deposits • Assets sold under repurchase agreement
Off-balance-sheet funds• Mutual funds• Pension funds
Customer portfolios
Total assets (4)
ROE (%)Efficiency ratio (%)Efficiency incl. depreciation and amortization (%)NPL ratio (%)Coverage ratio (%)
(1) At constant exchange rate. (2) Gross lending excluding NPLs. (3) Including marketable debt securities. (4) Excluding insurance.
17,366 15.6 28.8 15,018 17,366 15.6 28.8 15,018 - - - -
22,773 8.3 20.2 21,023 22,773 8.3 20.2 21,023 - - - -21,667 9.1 20.9 19,864 21,667 9.1 20.9 19,864 - - - -1,106 (4.6) 6.8 1,159 1,106 (4.6) 6.8 1,159 - - - -
33,447 8.0 22.7 30,978 1,575 21.2 33.5 1,299 31,872 7.4 22.2 29,6791,575 21.2 33.5 1,299 1,575 21.2 33.5 1,299 - - - -
31,872 7.4 22.2 29,679 - - - - 31,872 7.4 22.2 29,679- - - - - - - - - - - -
29,391 7.5 19.4 27,350 28,463 9.2 21.1 26,063 - - - -
31.8 30.1 31.8 28.9 40.0 41.445.9 49.0 44.0 47.3 48.3 49.549.7 52.6 48.1 50.9 50.9 53.12.67 3.67 2.69 3.71 - -
132.8 109.3 132.8 109.3 - -

In the positive economic context commented above, the South
America Area had its best year so far with significant advances
in business volumes and earnings. Net attributable profit came
to €509m, rising 37.0% compared to the previous year
(34.4% at current exchange rates). As a result, ROE (return
on equity) now stands at 31.8% (30.1% at the end of 2005).
Business conducted with customers was the main factor
responsible for the sharp rise in earnings and this activity
gained importance on the balance sheets of all units in the area.
Lending was particularly positive and 2006 ended with total
loans of €17,366m, a rise of 28.8% year-on-year. Unlike
previous years, this time it was buoyant demand from private
individuals (in mortgages, consumer finance and credit cards)
and from small businesses that was the decisive factor driving
growth. In fact, year-on-year, the combined growth of these
segments was 35%. Total customer funds (deposits plus mutual
funds) also performed well, rising 21.0% to €24,348m. Efforts
by all units to maintain spreads by boosting the volume of
lower cost customer funds were largely successful.
The higher level of business had an extremely positive effect
on volumes. This was the key factor driving the sharp growth
in recurrent earnings, although the slight rise in interest rates
did not offer particularly favourable conditions. Thus in 2006,
net interest income increased 28.4% to €1,310m. Moreover,
the faster pace of business also boosted net fee income and
revenues from insurance activities. Together, they rose 17.2%
year-on-year to €809m. The stability in the financial markets
had a positive impact on net trading income, which jumped
85.5% to €282m. Because of this strong performance,
ordinary revenues rose to €2,405m (up 29.1%).
Operating expenses grew 21.5% during the year owing to the
sharp increase in business at all units and an increase in the
pensions sales force. The relatively high inflation in two main
countries (Argentina and Venezuela) and the addition of
Granahorrar and Forum also contributed to the rise in costs.
Despite this, expenses grew less than revenues and so the
cost/income ratio improved to 49.7% (52.6% a year earlier).
As a result, operating profit surged 37.4% to €1,163m.
The favourable economic environment and prudent risk
management helped to prevent the buoyant activity in lending
from impairing loan quality. In fact, the area’s non-performing
loan ratio improved substantially to 2.67%, compared to
3.67% a year earlier. Therefore the increase in loan-loss
41
BUSINESS AREASSouth America
provisions (€151m and more than double the 2005 figure)
was the result of generic provisions caused by the sharp rise in
business volumes. As a result, coverage of non-performing
loans rose to 132.8% at 31-Dec-06 (109.3% a year earlier).
� BANKING BUSINESS
In 2006, net attributable profit generated by the banks in this
area surged 46.7% year-on-year to €422m. Significant events
at the different banks are detailed below.
Following its best year in recent times, BBVA Banco
Francés in Argentina contributed net attributable profit of
€136m (up 62.5%). Lending was extremely strong (up
23.0%), especially retail lending (up 45.8%). Customer funds
increased 17.4% with significant improvements in the
lower-cost funds. The increase in private-sector lending and
the reduced importance of public-sector assets (due to
divestments earlier in the year) improved the bank’s business
mix. This boosted net interest income and net fee income. Net
trading income benefited from capital gains on the sale of
public-sector assets. These positive developments in revenues
helped operating profit to rise 45.5% to €288m.
BBVA Chile faced a complicated environment in 2006. The
negative impact of continuously rising interest rates at the
beginning of the year was aggravated by fierce competition in
the local market. Despite this, intense business activity helped
lending to grow 21.4% and customer funds to increase
21.3%. As a result, net interest income rose 8.7% to €168m.
The higher level of activity and the expansion of the BBVA
Express branch network had an effect on expenses, which rose
13.3% year-on-year including depreciation. Thus operating
profit came to €90m, similar to 2005. Higher loan-loss
provisioning linked to the growth in business and the historic
portfolio brought net attributable profit to €7m.
The prominent factor this year for BBVA Colombia was
the merger with Granahorrar, which was concluded in record
time. This bank has also developed considerable marketing
skills and this led to strong increases in lending (28.3%) and
customer funds (16.3%). This was achieved despite the
competitive scenario, which has been more complex than in
previous years. The increase in business volumes offset the
negative effect of tighter spreads, especially in lending (due to
strong competition and changes in local legislation). This
resulted in higher net interest income and net fee income.

42
BUSINESS AREASSouth America
Moreover, these improvements were aided by costs savings
following the purchase of Granahorrar and sound risk
management, which helped the NPL ratio to improve to
5.11% (7.84% at 31-Dec-05). BBVA Colombia reported
operating profit of €135m (up 49.2%) and net attributable
profit of €96m (twice the figure last year).
It was also a highly positive year at BBVA Banco
Continental in Peru, which generated net attributable profit
of €56m (up 20.9%). A rise in interest rates at the beginning
of the year had a negative impact but this was progressively
offset by the increase in business activity, especially lending,
which grew 35.1%. Consequently, net interest income rose
19.7% to €213m and net fee income advanced 15.4% with
improvements in all areas. The higher revenues carried over to
operating profit, which increased 17.9% to €197m.
BBVA Banco Provincial in Venezuela experienced a year
fraught with political and regulatory uncertainty. But this did
not prevent it from achieving an outstanding year, in which it
generated net attributable profit of €82m (up 54.2%). Net
interest income was the driving factor behind this important
improvement. It rose 48.0% thanks to a 51.2% jump in
lending (with retail loans leading the way) and a rise of 48.0%
in customer funds (current accounts were particularly active).
Other sources of revenue also put in a strong performance: net
fee income was up 32.6% and net trading income rose 86.1%
to €37m. These revenues meant that operating profit surged
92.6% to €215m.
Other banks in the area also reported favourable results in
2006. BBVA Panamá contributed net attributable profit of
€22m (up 16.3%), BBVA Paraguay €14m (up 26.7%)
and BBVA Uruguay, with €8m in profit, enjoyed its best
year so far.
� PENSIONS AND INSURANCE
The pensions and insurance unit for South America generated
net attributable profit of €109m (up 10.1%). Of this
amount, insurance contributed €41m (up 16.3%) on intense
activity in bancassurance. It was a moderate year for pension
business, which generated profit of €67m (up 6.6%). Brief
comments on the performance of the main companies are
given below.
It was a highly positive year for AFP Provida in Chile, with
net attributable profit rising 34.6% to €43m. Higher volumes,
with increases of 14.5% in contributions and 22.6% in assets
under management, helped ordinary revenues to grow 17.0%.
In Argentina, intensive marketing at Consolidar AFJP led
to an increase of 27.8% in contributions and 30.6% in assets
under management. This boosted ordinary revenues 18.8%.
The Consolidar insurance companies reported a 41.2% rise in
premiums. These improvements brought net attributable profit
contributed by the Consolidar Group (AFJP plus the
insurance companies) to €26m.
Other companies with good results in 2006 include AFP
Horizonte Colombia, whose net attributable profit jumped
48.3% to €14m despite market volatility. AFP Horizonte
Perú, in an extraordinarily complex environment, generated
net attributable profit of €6m.

43
Corporate Activities
INCOME STATEMENT(Million euros)
2005∆%2006
NET INTEREST INCOMEIncome by the equity method
Net fee income
Income from insurance activities
CORE REVENUESNet trading income
ORDINARY REVENUESNet revenues from non-financial activities
Personnel and general administrative expenses
Depreciation and amortization
Other operating income and expenses
OPERATING PROFITImpairment losses on financial assets
• Loan loss provisions
• Other
Provisions
Other income/losses
PRE-TAX PROFITCorporate income tax
NET PROFITMinority interests
NET ATTRIBUTABLE PROFIT
(368) 145.5 (150)23 (67.2) 71
50 (67.0) 152
(24) (57.0) (56)
(319) n.m. 16841 90.9 441
522 14.3 457(1) 36.4 (1)
(444) 5.9 (419)
(139) 10.1 (127)
(12) (69.4) (41)
(75) (42.5) (131)9 (93.3) 138
26 (82.2) 146
(17) 114.2 (8)
(1,193) 263.2 (328)
771 n.m. 22
(488) 62.8 (300)166 (33.0) 247
(323) n.m. (53)(6) (92.1) (79)
(329) 149.0 (132)
BALANCE SHEET(Million euros)
31-12-05∆%31-12-06
Financial assets
Loans to customers
Liquidity transferred to the business areas
Property, plant and equipment
Other assets
Capital transferred to the business areas
TOTAL ASSETS / LIABILITIES AND EQUITYDue to customers
Marketable debt securities
Subordinated debt
Other liabilities
Equity
• Minority interests
• Valuation adjustments
• Shareholders' funds
21,179 (41.8) 36,383
(361) 172.3 (133)
74,486 97.9 37,639
1,610 3.9 1,549
4,901 (2.5) 5,026
14,424 12.5 12,819
116,239 24.6 93,2849,831 15.4 8,520
68,180 26.2 54,027
5,266 (20.8) 6,646
14,772 44.9 10,192
18,189 30.9 13,899
12 (94.2) 208
3,341 1.4 3,295
14,836 42.7 10,396

44
BUSINESS AREASCorporate Activities
This area includes the results of two units: Financial
Management and Planning and Holdings in Industrial and
Financial Companies. It also books the costs from headquarter
units that have a strictly corporate function and makes
allocations to corporate and miscellaneous provisions, eg, for
early retirement.
Earnings from the Group’s companies in Andorra were
reported under this area until April, when the Group divested
its holding there. This had a negative impact on the
year-on-year comparison of items that used to include their
revenues and earnings. The capital gains from the divestment
are dealt with below.
Year-on-year changes in the area's net interest income
continued to reflect the narrower spread on the portfolios due
to higher interest rates. The sale of the stake in Banca
Nazionale de Lavoro in May lowered the total figure booked
under the equity method. Net trading income (€841m)
notably includes the €523m capital gains from disposal of the
Repsol YPF holding. All this led to a negative operating profit
of –€75m in 2006 as against the –€131 from 2005.
Below the operating-profit line, allocations to provisions were
raised by higher charges for early retirements, which includes
a special charge of €777m booked in the fourth quarter for a
plan to transform the branch network in Spain and those
derived from the changes in the organization announced in
December. This brought total allocations up to €1,054m over
the year, as against €288m in 2005. Also significant was the
rise in Other income/losses. These included earnings from the
sale of holdings in Banca Nazionale del Lavoro (€568m) and
Banc Internacional de Andorra (€183m) in 2Q06, whereas in
2005 no significant disposals were booked to this item.
Apart from the tax impact of these disposals, an extraordinary
€457m charge reflected the adjustment of the Group's tax
shield to the lower corporation-tax rates applicable as of 2007
under new tax regulations. (Their positive impact will be felt
as of 2007, when rates drop to 32.5% in 2007 and 2008
when they will reach 30%). The area’s net attributable profit
in 2006 thus came down to negative –€329m, as against
–€132m in 2005
� FINANCIAL MANAGEMENT ANDPLANNING
The Financial Management an Planning unit through the
Assets and Liabilities Committee (ALCO) administers the
Group’s interest and exchange rate structure as well as its
overall liquidity and shareholders’ funds.
Actively managing exchange-rate exposure on its long-term
investments (basically stemming from its franchise in the
Americas) helps BBVA to preserve its capital ratios and
reserves, thus bringing stability to the income statement whilst
controlling the cost of this risk management. At the end of
September 2006, the Group was pursuing an active policy to
hedge its investments in Mexico, Chile, Peru and the dollar
area. Apart from corporate-level hedging, some subsidiary
banks hold long dollar positions at local level. The exchange-rate
exposure on expected 2006 and 2007 earnings from the
Group’s franchise in America is managed in the same way. The
results of this policy contributed €27m to 2006 earnings.
The Financial Management and Planning unit also actively
manages structural interest-rate exposure of the Group’s
balance sheet using both hedging derivatives and
balance-sheet instruments. The fixed-income asset portfolio
denominated in euros, Mexican pesos and US dollars was
above €11 bn on 31st December 2006.
� HOLDINGS IN INDUSTRIAL ANDFINANCIAL COMPANIES
This unit manages the Group’s portfolio of holdings in the
telecommunications, media, electricity, oil and gas industries,
as well as in the financial-services sector.
The portfolio acts as a repository of capital for future growth
within the banking business. It follows strict criteria for
risk-control, economic capital consumption and return on
investment, with diversification over different industries. The
unit also applies dynamic monetisation and coverage
management strategies to holdings.
At 31st December 2006, the market value of the industrial
and financial holdings portfolio stood at €7,387m, with
unrealised capital gains of €3,389m before tax.
Apart from the divestments in Repsol YPF and BNL, BBVA
made net investments of €912m and divestments €831m as
part of its portfolio turnaround policy.

CORPORATE RESPONSIBILITY
The following is a review of the most significant events related
to the BBVA Group’s corporate responsibility in the fourth
quarter of 2006.
Recognition. In November, BBVA’s annual report on corporate
responsibility received its most important accolade so far when it
was added to the prestigious list of the top 50 reports, published
by the British organisation, SustainAbility. BBVA appears in 34th
place and is the first Spanish entry. Moreover, in December it
received the Publifestival Prize for the company that best
integrates social action and marketing strategy.
Employees. During the quarter, there were several events
associated with employees. The bank awarded prizes in an
international drawing competition for employees’ children and
it launched an international photography competition. BBVA
Banco Provincial organised holidays for 600 children of
employees in Venezuela and BBVA Chile opened the Banca
Gente line with special financial products for employees.
Responsible business. The bank launched new products
and services in this area. They included the first Spanish
mutual fund specialising in microfinance organisations (BBVA
Codespa Microfinanzas) and a special account to encourage
young children to save (Miniblue). It also set up an IT
workshop for local government to develop solutions based on
new technology. In a move to mitigate the effect of higher
interest rates on SMEs, BBVA rolled out the Stockpyme line
and introduced a finance package to facilitate the installation
of photovoltaic panels for small businesses. In Portugal, it
helped to finance Europe's biggest wind farm. And in
Argentina it launched a new mortgage (Línea Inquilinos) to
facilitate the purchase of homes by their current tenants.
Master plan for social action in Latin America. This
is an ambitious plan to co-ordinate the Group's social action
policies in Latin America. The idea is to spend at least 0.7% of
the previous year’s profit in the region. In 2007, this would come
to nearly 15m and would exceed €20m after adding the
resources that the Spanish part of the Group earmarks for social
action in Latin America. Priority is given to education in poor
sectors of the population. One scheme (BBVA Becas Integración)
will generate more than 16,000 scholarships in 2007.
Community support. There were numerous activities
during the quarter. They included the Spanish launch of a new
type of free family loan (Préstamo Joven) and a humanitarian
campaign in Argentina (food collections for the Food Bank
Foundation). In Mexico, a Christmas bazaar was set up to
collect funds for the BBVA Bancomer Foundation’s training
centres and in Chile the bank organised a Christmas fund
campaign. In Puerto Rico it ran another campaign (Fondos
Unidos) to support 155 humanitarian organisations with help
from employees’ voluntary salary contributions.
Education. This area included several events such as the
announcement of the BBVA Ruta Quetzal expedition for
2007 and the launch of a second education project for
Colombia under the Euro Solidarity programme (donations
from employees and BBVA). There were several other
activities in the Americas such as a campaign to encourage
reading habits in Peru and the sponsorship of a painting
competition for schoolchildren in Panama. The bank
distributed study grants to university students in Texas and
there were new agreements with Venezuelan universities on
training for micro-firms.
Social science, health and the environment. There
were numerous activities of the BBVA Foundation during the
quarter. They included a forum on companies and the law, a
conference on the impact of global warming on polar
ecosystems, an exhibition in Burgos on the environment (Félix,
25 años de conciencia ecológica) and a study of Spanish
graduates and undergraduates. Anida and the Spanish Red Cross
launched a project (CON sumo cuidado) to raise environmental
awareness among students in various cities in Spain and the
bank obtained an ISO 14001 certificate for the environmental
management of its building at Gran Vía 1 in Bilbao.
Culture. The cultural activity programme took centre stage
in the artistic arena, presenting the restoration of an important
retable in Seville and various exhibitions. The latter included
Spanish still-life from the Naseiro collection (Madrid), the
19th audiovisual exhibition (Bilbao), paintings of Joan Miró
1956-1983 (Barcelona), 20th-century art from BBVA’s
collection (A Coruña) and four centuries of European works
from the bank’s collection (Bogotá).
45

46
FINANCIAL STATEMENTS
CONSOLIDATED BALANCE SHEET(Million euros)
30-09-0631-12-05∆%31-12-06
Cash and balances at Central Banks
Financial assets held for trading
Other financial assets at fair value
Financial assets available for sale
Loans and receivables
• Due from banks
• Loans to customers
• Other
Held to maturity investments
Investments in associates
Property, plant and equipment
Intangible assets
Other assets
TOTAL ASSETS
Financial liabilities held for trading
Other financial liabilities at fair value
Financial liabilities at amortised cost
• Deposits by Central Banks and banks
• Due to customers
• Marketable debt securities
• Subordinated debt
• Other
Liabilities under insurance contracts
Other liabilities
TOTAL LIABILITIES
Minority interests
Valuation adjustments
Shareholders' funds
EQUITY
TOTAL LIABILITIES AND EQUITY
MEMORANDUM ITEM:Contingent liabilities
12,515 1.4 12,341 9,811
51,835 17.8 44,012 45,505
977 (31.2) 1,421 1,004
42,267 (29.6) 60,034 42,950
279,855 12.2 249,397 279,685
17,050 (37.9) 27,470 31,847
256,565 18.3 216,850 242,565
6,240 22.9 5,076 5,273
5,906 49.2 3,959 5,872
889 (39.6) 1,473 1,026
4,527 3.3 4,383 4,262
3,269 57.9 2,070 1,906
9,876 (25.7) 13,299 11,163
411,916 5.0 392,389 403,184
14,924 (8.3) 16,271 13,953
583 (21.3) 740 654
348,445 5.7 329,505 343,739
57,804 (12.8) 66,315 65,774
192,374 5.3 182,635 184,888
77,674 23.6 62,842 74,449
13,597 (0.9) 13,723 12,735
6,995 75.3 3,990 5,893
10,121 (3.6) 10,501 10,134
15,527 (14.1) 18,071 15,433
389,598 3.9 375,087 383,913
768 (20.9) 971 777
3,341 1.4 3,295 2,527
18,210 39.7 13,036 15,967
22,318 29.0 17,302 19,271
411,916 5.0 392,389 403,184
42,281 41.6 29,862 37,969

47
FINANCIAL STATEMENTS
CONSOLIDATED INCOME STATEMENT(Million euros)
2005∆%2006
Core net interest income
Dividends
NET INTEREST INCOMEIncome by the equity method
Net fee income
Income from insurance activities
CORE REVENUESNet trading income
ORDINARY REVENUES
Net revenues from non-financial activities
Personnel costs
General expenses
Depreciation and amortization
Other operating income and expenses
OPERATING PROFIT
Impairment losses on financial assets
• Loan loss provisions
• Other
Provisions
Other income/losses
• From disposal of equity holdings
• Other
PRE-TAX PROFITCorporate income tax
NET PROFITMinority interests
NET ATTRIBUTABLE PROFIT
EARNINGS PER SHARE CALCULATIONAverage ordinary shares in circulation (million)
Basic earnings per share (euros)
Diluted earnings per share (euros)
7,995 15.6 6,915
379 29.7 292
8,374 16.2 7,208308 153.2 121
4,335 10.0 3,940
650 33.6 487
13,667 16.3 11,7562,034 60.5 1,267
15,701 20.6 13,024
131 4.4 126
(3,989) 10.7 (3,602)
(2,342) 8.4 (2,160)
(472) 5.2 (449)
(146) 27.4 (115)
8,883 30.2 6,823
(1,504) 76.0 (854)
(1,477) 81.6 (813)
(27) (34.8) (41)
(1,338) 194.6 (454)
989 n.m. 77
934 n.m. 29
55 12.4 49
7,030 25.7 5,592(2,059) 35.4 (1,521)
4,971 22.1 4,071(235) (11.0) (264)
4,736 24.4 3,806
3,406 0.4 3,391
1.39 23.9 1.12
1.39 23.9 1.12

48
FINANCIAL STATEMENTS
BREAKDOWN OF YIELDS AND COSTS
4th Quarter 06% of ATA % Yield/Cost
3rd Quarter 06% of ATA % Yield/Cost
2nd Quarter 06% of ATA % Yield/Cost
1st Quarter 06% of ATA % Yield/Cost
Cash and balances at Central Banks
Financial assets and derivatives
• Fixed-income securities
- Euros
- Foreign currencies
• Equity securities
Due from banks
• Euros
• Foreign currencies
Loans to customers
• Euros
- Domestic
- Other
• Foreign currencies
Other assets
TOTAL ASSETS
Deposits by Central Banks and banks
• Euros
• Foreign currencies
Due to customers
• Euros
- Domestic
- Other
• Foreign currencies
Marketable debt securities and subordinated debt
• Euros
• Foreign currencies
Other liabilities
Equity
TOTAL LIABILITIES AND EQUITY
NET INTEREST INCOME/ATA
3.0 3.50 2.6 4.23 2.9 3.84 3.6 3.48
24.0 4.13 25.4 3.75 27.4 4.52 27.7 3.68
18.7 4.50 20.6 4.47 22.5 4.70 23.1 4.34
11.3 2.43 13.7 2.44 15.3 2.51 15.1 2.31
7.4 7.66 6.8 8.57 7.2 9.34 8.1 8.15
5.3 2.84 4.9 0.72 4.9 3.65 4.6 0.37
6.7 4.24 6.2 4.07 4.8 4.48 6.1 4.03
4.3 3.25 3.8 3.17 2.6 3.38 3.5 3.06
2.4 6.05 2.4 5.47 2.2 5.79 2.7 5.27
60.8 6.21 59.9 5.98 58.4 5.78 56.0 5.69
45.9 4.54 45.8 4.18 44.8 4.00 42.5 3.85
42.8 4.53 42.9 4.22 42.0 4.03 39.7 3.86
3.1 4.68 2.9 3.47 2.8 3.55 2.8 3.71
14.9 11.40 14.1 11.85 13.5 11.68 13.5 11.49
5.5 1.07 5.9 1.34 6.5 0.42 6.5 0.64
100.0 5.22 100.0 4.97 100.0 4.97 100.0 4.62
14.7 4.24 16.6 3.83 16.9 3.78 16.2 3.35
7.0 3.24 9.6 2.88 9.5 2.79 8.9 2.53
7.7 5.16 7.0 5.13 7.4 5.03 7.3 4.35
46.3 3.07 44.5 3.07 43.7 2.98 45.0 3.00
26.3 2.12 25.2 1.79 24.2 1.51 24.1 1.54
18.3 1.64 18.5 1.45 17.9 1.33 16.7 1.23
8.0 3.21 6.7 2.73 6.3 2.02 7.4 2.23
20.0 4.33 19.3 4.75 19.5 4.82 20.9 4.69
22.3 3.91 22.4 3.56 22.6 3.29 21.0 3.01
19.5 3.73 19.6 3.30 19.9 3.08 19.3 2.79
2.8 5.12 2.8 5.38 2.7 4.88 1.8 5.41
11.5 0.80 11.7 1.06 12.3 0.75 13.2 0.60
5.1 - 4.8 - 4.5 - 4.6 -
100.0 3.01 100.0 2.92 100.0 2.78 100.0 2.61
2.20 2.05 2.19 2.02

49
FINANCIAL STATEMENTS
STATEMENT OF CHANGES IN EQUITY(Million euros)
Capital Reserves Profit for the year
Treasuryshares
Valuationadjustments
Minority interests
Paid dividends
TOTAL EQUITY
BALANCE AT 31-12-04
Valuation adjustments
Profit retained
Dividends
Shares issued
Results of treasury shares traded
Profit for the year
Other
BALANCE AT 31-12-05
BALANCE AT 31-12-05
Valuation adjustments
Profit retained
Dividends
Shares issued
Results of treasury shares traded
Profit for the year
Other
BALANCE AT 31-12-06
1,662 7,428 2,923 (36) 2,107 738 (1,015) 13,805
1,188 45 1,233
1,427 (1,427) -
(1,495) (64) (151) (1,711)
-
34 (60) (1) (27)
3,806 264 4,071
(58) (11) (69)
1,662 8,831 3,806 (96) 3,295 971 (1,167) 17,302
1,662 8,831 3,806 (96) 3,295 971 (1,167) 17,302
46 (3) 43
2,006 (2,006) -
(1,801) (104) (196) (2,100)
79 2,921 3,000
(51) (51)
4,736 235 4,971
(549) 35 (332) (846)
1,740 13,208 4,736 (112) 3,341 768 (1,363) 22,318

50
FINANCIAL STATEMENTS
INFORMATION BY SEGMENTS. 2006(Million euros)
Retail Banking inSpain and PortugalIncome Statements Wholesale and
Investment Banking Mexico and USA South America CorporateActivities
TOTAL BBVA GROUP
Net interest incomeOrdinary revenuesOperating profitPre-tax profitNet attributable profit
2,865 1,032 3,535 1,310 (368) 8,3744,902 2,448 5,423 2,405 522 15,7012,653 1,912 3,231 1,163 (75) 8,8832,311 1,738 2,515 955 (488) 7,0301,498 1,282 1,775 509 (329) 4,736
Financial ServicesRetail Banking in Spain and Portugal Asset Mgt
and Private Bkg Other TOTAL AREA
Net interest incomeOrdinary revenuesOperating profitPre-tax profitNet attributable profit
2,813 29 23 2,8654,338 309 254 4,9022,331 209 113 2,6532,011 199 101 2,3111,302 132 65 1,498
Corporate andBusiness BankingWholesale and Investment Banking Global Wholesale
Bkg and Markets Other TOTAL AREA
Net interest incomeOrdinary revenuesOperating profitPre-tax profitNet attributable profit
911 127 (6) 1,0321,351 893 205 2,4481,029 586 297 1,912
827 450 460 1,738538 309 436 1,282
Banking businessesMexico and USA Pensions
and Insurance Other TOTAL AREA
Net interest incomeOrdinary revenuesOperating profitPre-tax profitNet attributable profit
3,542 2 (9) 3,5355,026 428 (31) 5,4233,023 245 (37) 3,2312,305 247 (37) 2,5151,625 174 (24) 1,775
Banking businessesSouth America Pensions
and Insurance Other TOTAL AREA
Net interest incomeOrdinary revenuesOperating profitPre-tax profitNet attributable profit
1,301 11 (1) 1,3101,977 434 (6) 2,405
980 216 (33) 1,163781 207 (33) 955422 109 (21) 509

51
FINANCIAL STATEMENTS
INFORMATION BY SEGMENTS. 2005(Million euros)
Retail Banking inSpain and PortugalIncome Statements Wholesale and
Investment Banking Mexico and USA South America CorporateActivities
TOTAL BBVA GROUP
Net interest incomeOrdinary revenuesOperating profitPre-tax profitNet attributable profit
2,623 1,017 2,678 1,039 (150) 7,2084,444 1,941 4,287 1,895 457 13,0242,319 1,471 2,303 861 (131) 6,8232,007 1,238 1,929 718 (300) 5,5921,317 873 1,370 379 (132) 3,806
Financial ServicesRetail Banking in Spain and Portugal Asset Mgt
and Private Bkg Other TOTAL AREA
Net interest incomeOrdinary revenuesOperating profitPre-tax profitNet attributable profit
2,579 25 19 2,6233,957 273 214 4,4442,053 175 90 2,3191,763 162 82 2,0071,152 110 56 1,317
Corporate andBusiness BankingWholesale and Investment Banking Global Wholesale
Bkg and Markets Other TOTAL AREA
Net interest incomeOrdinary revenuesOperating profitPre-tax profitNet attributable profit
831 171 15 1,0171,201 725 15 1,941
899 464 107 1,471730 372 136 1,238476 264 133 873
Banking businessesMexico and USA Pensions
and Insurance Other TOTAL AREA
Net interest incomeOrdinary revenuesOperating profitPre-tax profitNet attributable profit
2,679 4 (5) 2,6783,941 377 (31) 4,2872,113 228 (38) 2,3031,740 228 (38) 1,9291,235 160 (25) 1,370
Banking businessesSouth America Pensions
and Insurance Other TOTAL AREA
Net interest incomeOrdinary revenuesOperating profitPre-tax profitNet attributable profit
1,031 9 (1) 1,0391,528 372 (5) 1,895
713 179 (31) 861559 184 (25) 718294 99 (15) 379

Operating Income Net attributable profit
THE AMERICAS. DATA PER COUNTRY (BANKING BUSINESS, PENSIONS AND INSURANCE)(Million euros)
2006 ∆% 2005∆% at constant exchange rate
2006 ∆% 2005∆% at constant exchange rate
Argentina
Chile
Colombia
United States (1)
Mexico
Panama
Paraguay
Peru
Uruguay
Venezuela
Other countries (2)
TOTAL(1) Includes Puerto Rico.(2) Bolivia, Ecuador and Dominican Republic. Additionally, it includes eliminations and other charges allocated from South America.
353 41.2 50.6 250 163 36.3 45.4 119
186 17.8 12.6 158 56 (9.3) (13.3) 62
165 29.5 32.5 128 117 77.4 81.6 66
129 50.7 52.0 85 64 80.1 81.7 36
3,102 39.9 41.3 2,218 1,711 28.2 29.5 1,334
33 16.8 17.9 28 22 15.3 16.3 19
15 33.6 23.2 11 14 37.4 26.7 10
209 7.9 8.3 194 62 5.3 5.7 59
7 n.m. n.m. - 8 n.m. n.m. (2)
222 84.8 90.3 120 85 48.7 53.1 57
(27) (0.7) (0.8) (27) (17) 56.9 55.6 (11)
4,393 38.8 40.5 3,164 2,284 30.6 32.2 1,749
MEXICO (BANKING BUSINESS, PENSIONS AND INSURANCE). INCOME STATEMENT(Million euros)
2006 ∆% ∆% at constant exchange rate 2005
NET INTEREST INCOMEIncome by the equity method
Net fee income
Income from insurance activities
CORE REVENUESNet trading income
ORDINARY REVENUESNet revenues from non-financial activities
Personnel and general administrative
expenses
Depreciation and amortization
Other operating income and expenses
OPERATING PROFITImpairment losses on financial assets
• Loan loss provisions
• Other
Provisions
Other income/losses
PRE-TAX PROFITCorporate income tax
NET PROFITMinority interests
NET ATTRIBUTABLE PROFIT
3,252 32.1 33.4 2,462(2) n.m. n.m. -
1,277 15.7 16.8 1,104
305 33.3 34.6 229
4,832 27.3 28.6 3,795182 6.1 7.1 172
5,014 26.4 27.7 3,966(4) 61.0 62.6 (3)
(1,694) 11.1 12.2 (1,525)
(98) (15.7) (14.9) (116)
(117) 10.5 11.6 (106)
3,102 39.9 41.3 2,218(646) 131.1 133.4 (280)
(633) 149.8 152.3 (254)
(13) (50.4) (49.9) (26)
(70) 46.4 47.9 (48)
36 n.m. n.m. (10)
2,422 28.8 30.1 1,880(710) 30.8 32.1 (542)
1,713 28.0 29.3 1,338(2) (43.8) (43.2) (3)
1,711 28.2 29.5 1,334
FINANCIAL STATEMENTS
52

INVESTOR RELATIONS
• MADRID 28046 - Pº Castellana, 81 - 19th floorTel: 34-91 374 62 01 Fax: 34-91 537 85 12e-mail: [email protected]
• NEW YORK - 1345 Av. of the Americas, 45th floor, NY 10105Tel: 1-212-728 16 60 - Fax: 1-212-333 29 05e-mail: [email protected]
INTERNET INFO (http://www.bbva.com)